Brocade Advanced Performance Monitor - Oracle Advanced Performance Monitor User’s Guide vii ......
40
Publication Number: 53-0000514-02 Publication Date: 04/25/03 Brocade Advanced Performance Monitor User’s Guide Version 3.1.0/4.1.0
Transcript of Brocade Advanced Performance Monitor - Oracle Advanced Performance Monitor User’s Guide vii ......

Publication Number: 53-0000514-02Publication Date: 04/25/03
Brocade AdvancedPerformance Monitor
User’s Guide Version 3.1.0/4.1.0

Copyright © 2003, Brocade Communications Systems, Incorporated.
ALL RIGHTS RESERVED. Publication Number: 53-0000514-02
BROCADE, the Brocade B weave logo, Brocade: the Intelligent Platform for Networking Storage, SilkWorm, and SilkWorm Express, are trademarks or registered trademarks of Brocade Communications Systems, Inc. or its subsidiaries in the United States and/or in other countries. All other brands, products, or service names are or may be trademarks or service marks of, and are used to identify, products or services of their respective owners.
FICON® is a registered trademark of IBM Corporation in the US and other countries.
Notice: The information in this document is provided “AS IS,” without warranty of any kind, including, without limitation, any implied warranty of merchantability, noninfringement or fitness for a particular purpose. Disclosure of information in this material in no way grants a recipient any rights under Brocade's patents, copyrights, trade secrets or other intellectual property rights. Brocade reserves the right to make changes to this document at any time, without notice, and assumes no responsibility for its use.
The authors and Brocade Communications Systems, Inc. shall have no liability or responsibility to any person or entity with respect to any loss, cost, liability, or damages arising from the information contained in this book or the computer programs that accompany it.
Notice: The product described by this document may contain “open source” software covered by the GNU General Public License or other open source license agreements. To find-out which open source software is included in Brocade products, view the licensing terms applicable to the open source software, and obtain a copy of the programming source code, please visit http://www.brocade.com/support/oscd.
Export of technical data contained in this document may require an export license from the United States Government.
Brocade Communications Systems, Incorporated
Corporate Headquarters1745 Technology DriveSan Jose, CA 95110T: (408) 487-8000F: (408) 487-8101Email: [email protected]
Asia-Pacific HeadquartersShiroyama JT Trust Tower 36th Floor4-3-1 Toranomon, Minato-kuTokyo, Japan 105-6036T: +81 35402 5300F: +81 35402 5399Email: [email protected]
European Headquarters29, route de l’AeroportCase Postale 105CH-1211 Geneva 15,SwitzerlandT: +41 22 799 56 40F: +41 22 799 56 41Email: [email protected]
Latin America Headquarters5201 Blue Lagoon DriveMiami, FL 33126T: (305) 716-4165Email: [email protected]

Document HistoryThe table below lists all versions of the Brocade Advanced Performance Monitor User’s Guide.
Document Title Publication Number Publication Date
Brocade Performance Monitor v3.0 53-0000138-03 July 2002
Brocade Advanced Performance Monitor v3.1/4.1 53-0000514-01 March 2003
Brocade Advanced Performance Monitor v3.1/4.1 53-0000514-02 April 2003
Contents
Preface
About This Manual . . . . . . . . . . . . . . . . . . . . . . . . . . . . . . . . . . . . . . . . . . . . . vii
What’s New in This Book. . . . . . . . . . . . . . . . . . . . . . . . . . . . . . . . . . . . . . . . vii
Intended Audience . . . . . . . . . . . . . . . . . . . . . . . . . . . . . . . . . . . . . . . . . . . . . vii
Manual Conventions . . . . . . . . . . . . . . . . . . . . . . . . . . . . . . . . . . . . . . . . . . . . viii
Formatting. . . . . . . . . . . . . . . . . . . . . . . . . . . . . . . . . . . . . . . . . . . . . . . . . viii
Notes, Cautions, and Warnings. . . . . . . . . . . . . . . . . . . . . . . . . . . . . . . . . viii
Related Publications . . . . . . . . . . . . . . . . . . . . . . . . . . . . . . . . . . . . . . . . . . . . ix
Brocade Documentation . . . . . . . . . . . . . . . . . . . . . . . . . . . . . . . . . . . . . . ix
Additional Resource Information . . . . . . . . . . . . . . . . . . . . . . . . . . . . . . . ix
How to Get Technical Support . . . . . . . . . . . . . . . . . . . . . . . . . . . . . . . . . . . . x
Chapter 1 Introducing Brocade Advanced Performance Monitoring
Features . . . . . . . . . . . . . . . . . . . . . . . . . . . . . . . . . . . . . . . . . . . . . . . . . . . . . . 1-1
License Activation . . . . . . . . . . . . . . . . . . . . . . . . . . . . . . . . . . . . . . . . . . . . . 1-1
License Activation Using Telnet. . . . . . . . . . . . . . . . . . . . . . . . . . . . . . . . 1-2
License Activation Using Web Tools . . . . . . . . . . . . . . . . . . . . . . . . . . . . 1-2
Chapter 2 Using Advanced Performance Monitoring
Managing Performance Monitoring with Web Tools . . . . . . . . . . . . . . . . . . . 2-1
Accessing Performance Monitoring Using Web Tools . . . . . . . . . . . . . . . . . . . . . . . . . . . . . . . . . . . . . . . . . . . . . . . . . 2-1
Using Performance Graphs . . . . . . . . . . . . . . . . . . . . . . . . . . . . . . . . . . . . 2-4
User-defined Graphs . . . . . . . . . . . . . . . . . . . . . . . . . . . . . . . . . . . . . . . . . 2-6
Configuring a Performance Graph Canvas. . . . . . . . . . . . . . . . . . . . . . . . 2-8
Brocade Advanced Performance Monitor User’s Guide v
Managing Performance Monitoring with Telnet Commands . . . . . . . . . . . . . 2-10
AL_PA Monitoring . . . . . . . . . . . . . . . . . . . . . . . . . . . . . . . . . . . . . . . . . . 2-10
End-to-End Monitoring. . . . . . . . . . . . . . . . . . . . . . . . . . . . . . . . . . . . . . . 2-10
Filter-based Monitoring . . . . . . . . . . . . . . . . . . . . . . . . . . . . . . . . . . . . . . 2-10
Telnet Commands . . . . . . . . . . . . . . . . . . . . . . . . . . . . . . . . . . . . . . . . . . . . . . 2-11
Using AL_PA Performance Monitoring . . . . . . . . . . . . . . . . . . . . . . . . . . 2-11
Using End-to-End Performance Monitoring. . . . . . . . . . . . . . . . . . . . . . . 2-12
Using Filter-based Performance Monitoring . . . . . . . . . . . . . . . . . . . . . . 2-18
Saving and Restoring Monitor Configuration . . . . . . . . . . . . . . . . . . . . . 2-22
Index
vi Brocade Advanced Performance Monitor User’s Guide

Preface
About This ManualThis manual provides comprehensive information to help you administer your SilkWorm switch and storage area network (SAN). This manual was developed to help technical experts operate, maintain, and troubleshoot SAN products. A list of additional SAN resource reference materials is also included. The sections that follow provide:
• A summary of updates to this document.
• The intended audience for this document.
• Information to help you use Brocade documentation.
• Information on additional SAN resources.
• How to get Technical Support.
What’s New in This BookThe following changes have been made since this book was last released (part number 53-0000514-01):
• Information that was added:
- Managing Performance Monitor with Telnet Commands - Chapter 2
• Information that was modified:
- The preface is new boilerplate.
- The book has been reorganized
- Chapter 1 includes a section called License Activation.
• Information that was removed:
- The glossary has been removed and will be replaced by a master glossary.
Intended AudienceThis document is intended for use by systems administrators and technicians experienced with networking, Fibre Channel, and SAN technologies.
Brocade Advanced Performance Monitor User’s Guide vii
Manual ConventionsThis section lists text formatting conventions and important notices formats used in this document.
Formatting
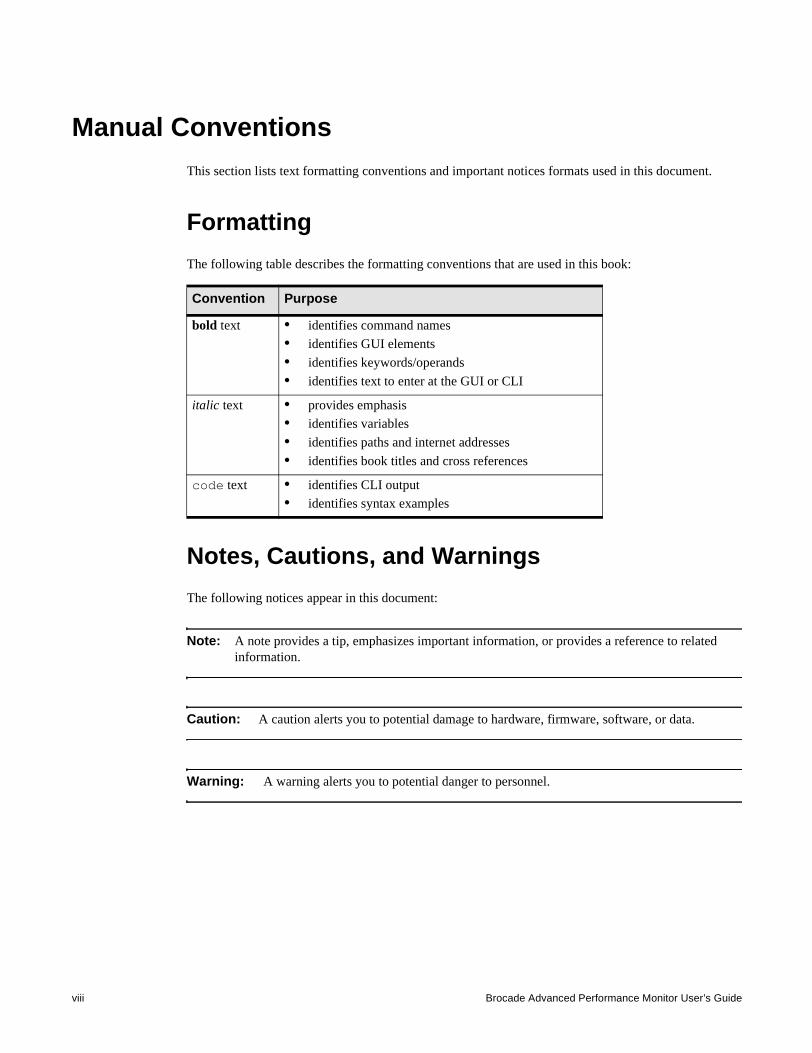
The following table describes the formatting conventions that are used in this book:
Notes, Cautions, and Warnings
The following notices appear in this document:
Note: A note provides a tip, emphasizes important information, or provides a reference to related information.
Caution: A caution alerts you to potential damage to hardware, firmware, software, or data.
Warning: A warning alerts you to potential danger to personnel.
Convention Purpose
bold text • identifies command names
• identifies GUI elements
• identifies keywords/operands
• identifies text to enter at the GUI or CLI
italic text • provides emphasis
• identifies variables
• identifies paths and internet addresses
• identifies book titles and cross references
code text • identifies CLI output
• identifies syntax examples
viii Brocade Advanced Performance Monitor User’s Guide
Related PublicationsThis section lists additional documentation that you may find helpful.
Brocade DocumentationThe following related publications are provided on the Brocade Documentation CD-ROM and on the Brocade Partner Web site:
• Brocade Fabric OS documentation- Brocade Diagnostic and System Error Message Reference
- Brocade Fabric OS Procedures Guide
- Brocade Fabric OS Reference
• Brocade Fabric OS optional features documentation- Brocade Advanced Web Tools User's Guide
- Brocade Advanced Zoning User's Guide
- Brocade Distributed Fabrics User's Guide
- Brocade Fabric Watch User’s Guide
- Brocade ISL Trunking User's Guide
- Brocade QuickLoop User's Guide (v 3.1 only)
- Brocade Secure Fabric OS User's Guide
- Secure Fabric OS QuickStart Guide
• Brocade Hardware documentation- Brocade SilkWorm 12000 Hardware Reference (for v.4.1 software)
- Brocade SilkWorm 12000 QuickStart Guide (for v4.1 software)
- Brocade SilkWorm 3900 Hardware Reference (for v.4.1 software)
- Brocade SilkWorm 3800 Hardware Reference (for v.3.1 software)
- Brocade SilkWorm 3200 Hardware Reference (for v.3.1 software)
Release notes are available on the Brocade Partner Web site and are also bundled with the Fabric OS.
Additional Resource InformationFor practical discussions about SAN design, implementation, and maintenance, Building SANs with Brocade Fabric Switches is available through:
http://www.amazon.com
For additional Brocade documentation, visit the Brocade SAN Info Center and click on the Resource Library location:
http://www.brocade.com
For additional resource information, visit the Technical Committee T11 Web site. This Web site provides interface standards for high-performance and mass storage applications for fibre channel, storage management, as well as other applications:
http://www.t11.org
For information about the Fibre Channel industry, visit the Fibre Channel Industry Association Web site:
http://www.fibrechannel.org
Brocade Advanced Performance Monitor User’s Guide ix

How to Get Technical SupportContact your switch support supplier for hardware, firmware, and software support, including product repairs and part ordering. To assist your support representative and to expedite your call, have the following three sets of information immediately available when you call:
1. General Information
• Technical Support contract number, if applicable
• switch model
• switch operating system version
• error messages received
• supportshow command output
• detailed description of the problem and specific questions
• description of any troubleshooting steps already performed and results
2. Switch Serial Number
The switch serial number and corresponding bar code are provided on the serial number label, as shown below.:
The serial number label is located as follows:
• SilkWorm 2000 series switches: Bottom of chassis
• SilkWorm 3200 and 3800 switches: Back of chassis
• SilkWorm 3900 switches: Bottom of chassis
• SilkWorm 6400 and 12000 switches: Inside front of chassis, on wall to left of ports
3. Worldwide Name (WWN)
• SilkWorm 3900 and 12000 switches: Provide the license ID. Use the licenseidshow command to display the license ID.
• All other SilkWorm switches: Provide the switch WWN. Use the wwn command to display the switch WWN.
*FT00X0054E9
FT00X0054E9
x Brocade Advanced Performance Monitor User’s Guide
Brocade Advanced Performance Monitor User’s Guide
Chapter
1
Introducing Brocade Advanced Performance MonitoringPerformance Monitoring is a tool used for monitoring the performance of networked storage resources. This tool helps reduce over-provisioning while enabling SAN performance tuning and increasing administrator productivity.
Performance Monitoring provides SAN performance monitoring through an end-to-end monitoring system provides
• Increased end-to-end visibility into the fabric.
• More accurate reporting for service level agreements and charged access applications.
• Shortened troubleshooting time.
• Better capacity planning.
• Increased productivity with preformatted and customized screens and reports.
Performance Monitoring is administered through either telnet commands or Web Tools. To use Web Tools, a Web Tools license must be activated on the switch.
FeaturesThe Performance Monitoring product
• Measures the bandwidth consumed by individual routes (host-target pairs).
• Provides device performance measurements by port, AL_PA, and LUN.
• Reports CRC error measurement statistics.
• Compares IP versus SCSI traffic on each port.
• Includes a wide range of predefined reports.
• Allows you to create customized user-defined reports.
License ActivationIt is good practice to verify that the license is activated when initially using a feature. Use the licenseShow command to view a list of all licenses activated on your switch, as shown in the following example. If the license is not included in the list, continue with License Activation Using Telnet on page 1-2 or License Activation Using Web Tools on page 1-2.
To verify that your license is activated follow these steps:
1. Log onto the switch by telnet using an account that has administrative privileges.
1-1
Introducing Brocade Advanced Performance Monitoring1
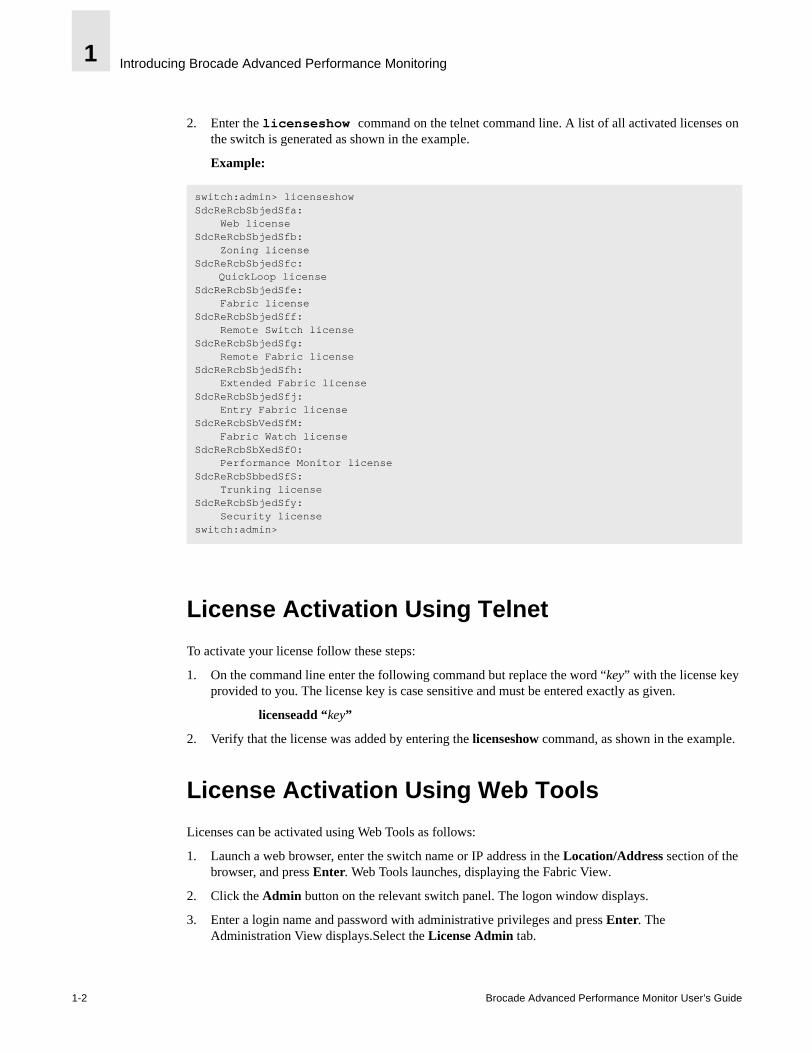
2. Enter the licenseshow command on the telnet command line. A list of all activated licenses on the switch is generated as shown in the example.
Example:
License Activation Using Telnet
To activate your license follow these steps:
1. On the command line enter the following command but replace the word “key” with the license key provided to you. The license key is case sensitive and must be entered exactly as given.
licenseadd “key”
2. Verify that the license was added by entering the licenseshow command, as shown in the example.
License Activation Using Web Tools
Licenses can be activated using Web Tools as follows:
1. Launch a web browser, enter the switch name or IP address in the Location/Address section of the browser, and press Enter. Web Tools launches, displaying the Fabric View.
2. Click the Admin button on the relevant switch panel. The logon window displays.
3. Enter a login name and password with administrative privileges and press Enter. The Administration View displays.Select the License Admin tab.
switch:admin> licenseshowSdcReRcbSbjedSfa: Web licenseSdcReRcbSbjedSfb: Zoning licenseSdcReRcbSbjedSfc:
QuickLoop licenseSdcReRcbSbjedSfe: Fabric licenseSdcReRcbSbjedSff: Remote Switch licenseSdcReRcbSbjedSfg: Remote Fabric licenseSdcReRcbSbjedSfh: Extended Fabric licenseSdcReRcbSbjedSfj: Entry Fabric licenseSdcReRcbSbVedSfM: Fabric Watch licenseSdcReRcbSbXedSfO: Performance Monitor licenseSdcReRcbSbbedSfS: Trunking licenseSdcReRcbSbjedSfy: Security licenseswitch:admin>
1-2 Brocade Advanced Performance Monitor User’s Guide

Introducing Brocade Advanced Performance Monitoring 1
4. Enter the license key in the License Key field and click the Add button. The features are now available.
Brocade Advanced Performance Monitor User’s Guide 1-3

Introducing Brocade Advanced Performance Monitoring1
1-4 Brocade Advanced Performance Monitor User’s Guide
Brocade Advanced Performance Monitor User’s Guide
Chapter
2
Using Advanced Performance MonitoringThis chapter describes how to manage Performance Monitoring using either Web Tools or telnet commands.
Managing Performance Monitoring with Web ToolsUse Web Tools to view, customize, or monitor performance by
• Viewing predefined reports for AL_PA, end-to-end, and filter-based performance monitoring.
• Creating user-definable reports.
• Viewing performance canvas for application level or fabric level views.
• Accessing configuration editor (save, copy, edit, and remove multiple configurations).
• Saving persistent graphs across reboots (saves parameter data across reboots).
Accessing Performance Monitoring Using Web Tools
Switch performance can be monitored from the Switch View of Web Tools. To access Performance Monitor through Web Tools, perform the following steps:
1. Launch Web Tools to display the Fabric view.
2-1
Using Advanced Performance Monitoring2
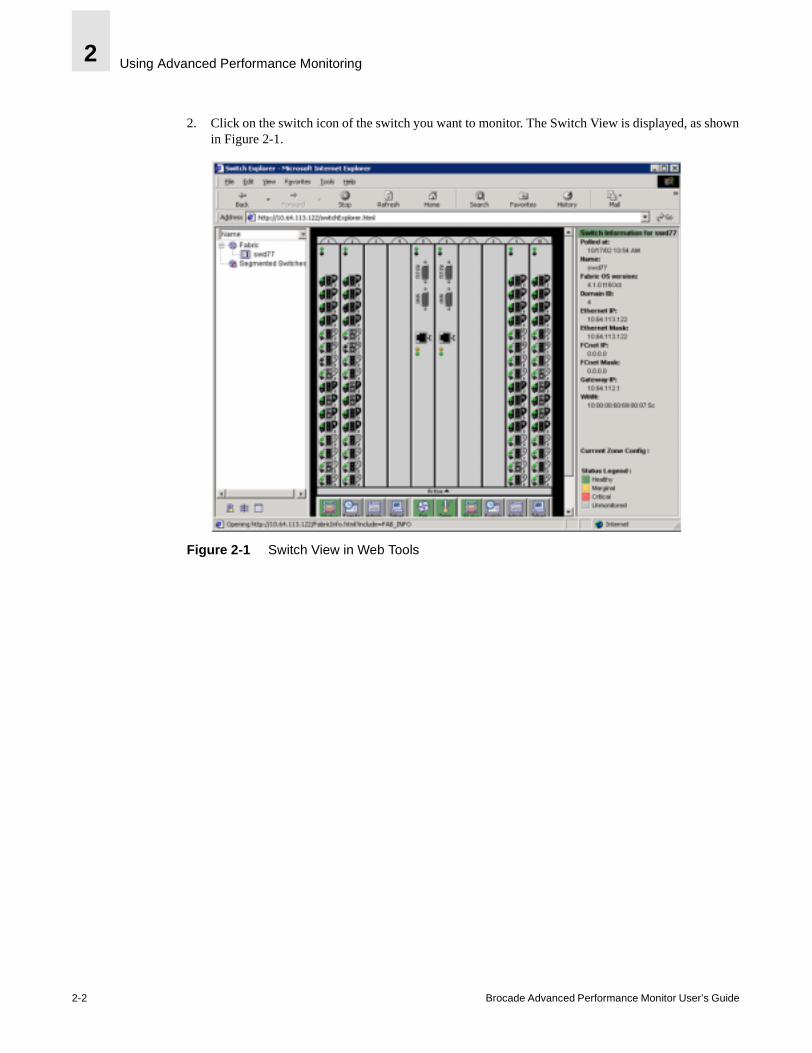
2. Click on the switch icon of the switch you want to monitor. The Switch View is displayed, as shown in Figure 2-1.
Figure 2-1 Switch View in Web Tools
2-2 Brocade Advanced Performance Monitor User’s Guide
Using Advanced Performance Monitoring 2
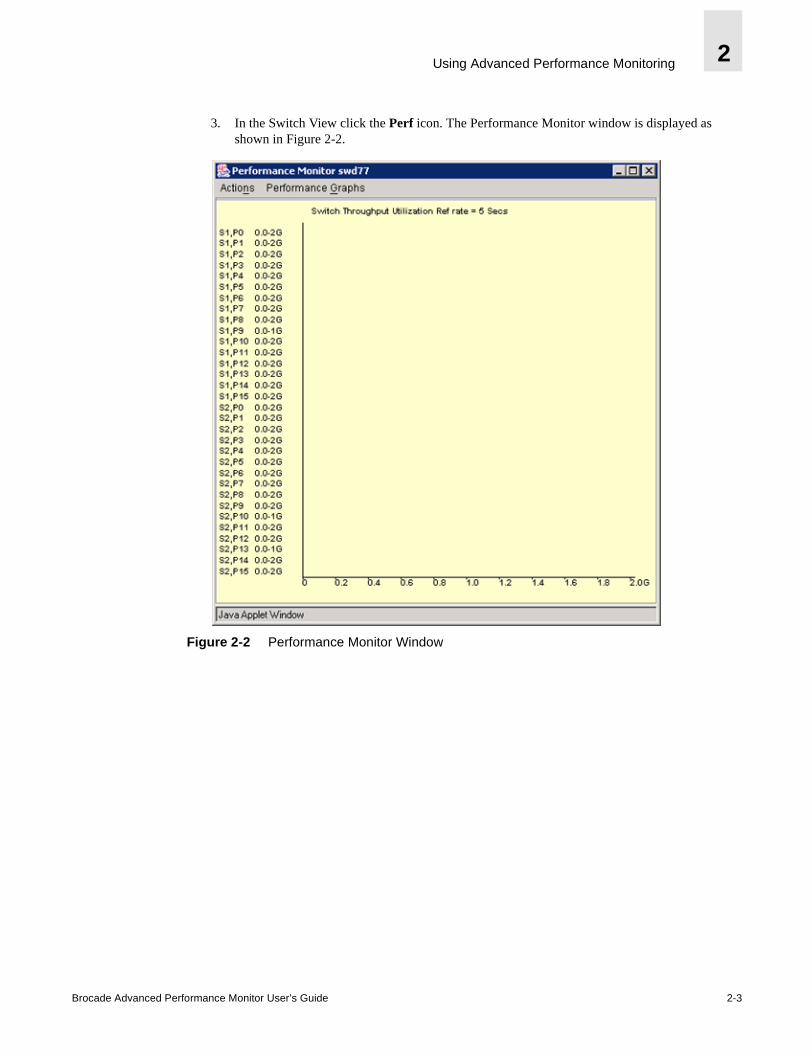
3. In the Switch View click the Perf icon. The Performance Monitor window is displayed as shown in Figure 2-2.
Figure 2-2 Performance Monitor Window
Brocade Advanced Performance Monitor User’s Guide 2-3
Using Advanced Performance Monitoring2
Using Performance Graphs
Graphs are provided to simplify performance monitoring. A wide range of end-to-end fabric, LUN, device, and port metrics graphs are included. Table 2-1 lists the performance graphs available. Basic Monitoring graphs are accessible on switches that do not have a Performance Monitoring license activated. The Advanced Monitoring graphs give more detailed performance information to aid with fabric management.
To access Performance Graphs, follow these steps:
1. On the Performance Monitoring window, click Performance Graphs.
2. Select either Basic Monitoring or Advanced Monitoring, and choose the specific graphs from the submenus, as shown in Figure 2-3 on page 2-5.
Table 2-1 Predefined Performance Graphs
Basic Monitoring Description
Port Throughput Displays the performance of a port in bytes/second for frames received and transmitted
Switch Aggregate Throughput
Displays the aggregate performance of all ports on a switch.
Switch Throughput Utilization
Displays the port throughput at the time the sample is taken.
Port Error Displays a line of CRC errors for a given port.
Switch Percent Utilization Displays the percentage of usage of a chosen switch at the time the sample is taken.
Port Snapshot Error Displays the CRC error count between sampling periods for all the ports on a switch.
Advanced Monitoring Description
SID/DID Performance Displays the traffic between SID and DID pair on the switch being managed.
SCSI vs. IP Traffic Displays percentage of SCSI versus IP frame traffic on each individual port.
AL_PA Errors Displays CRC errors for a given port and a given AL_PA.
SCSI Commands by port and LUN (R, W, R/W)
Displays the total number of Read/Write commands on a given port and Read/Write commands to a specific LUN.
2-4 Brocade Advanced Performance Monitor User’s Guide
Using Advanced Performance Monitoring 2
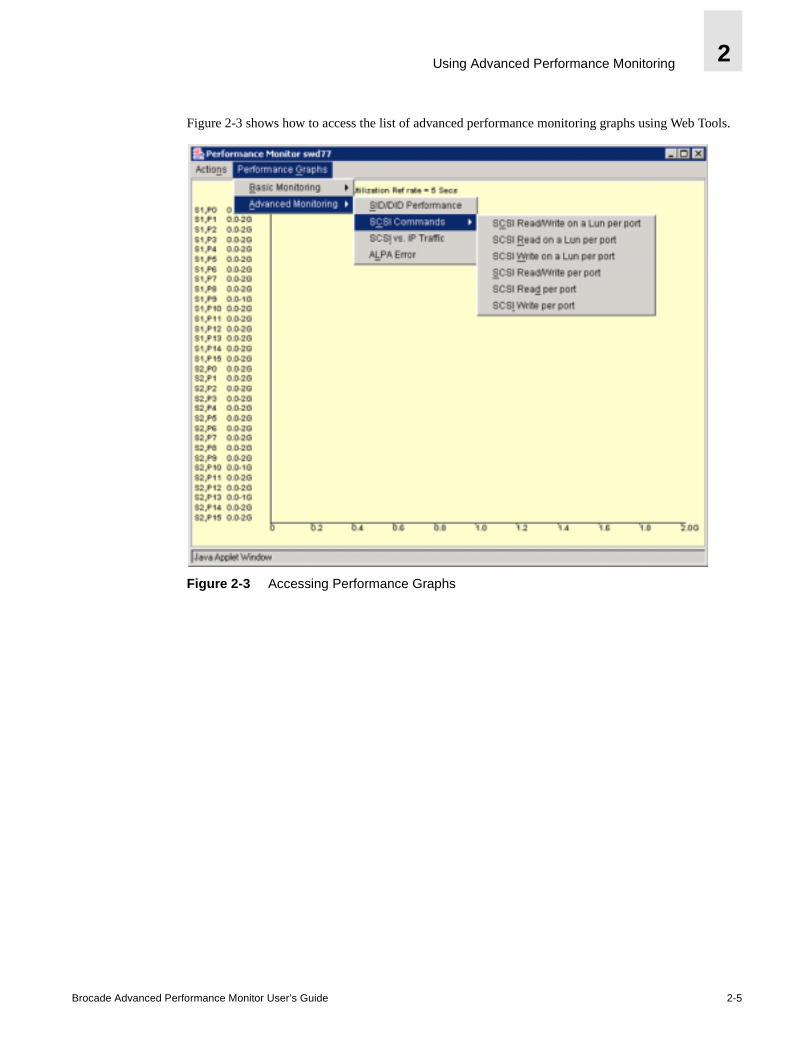
Figure 2-3 shows how to access the list of advanced performance monitoring graphs using Web Tools.
Figure 2-3 Accessing Performance Graphs
Brocade Advanced Performance Monitor User’s Guide 2-5
Using Advanced Performance Monitoring2
User-defined Graphs
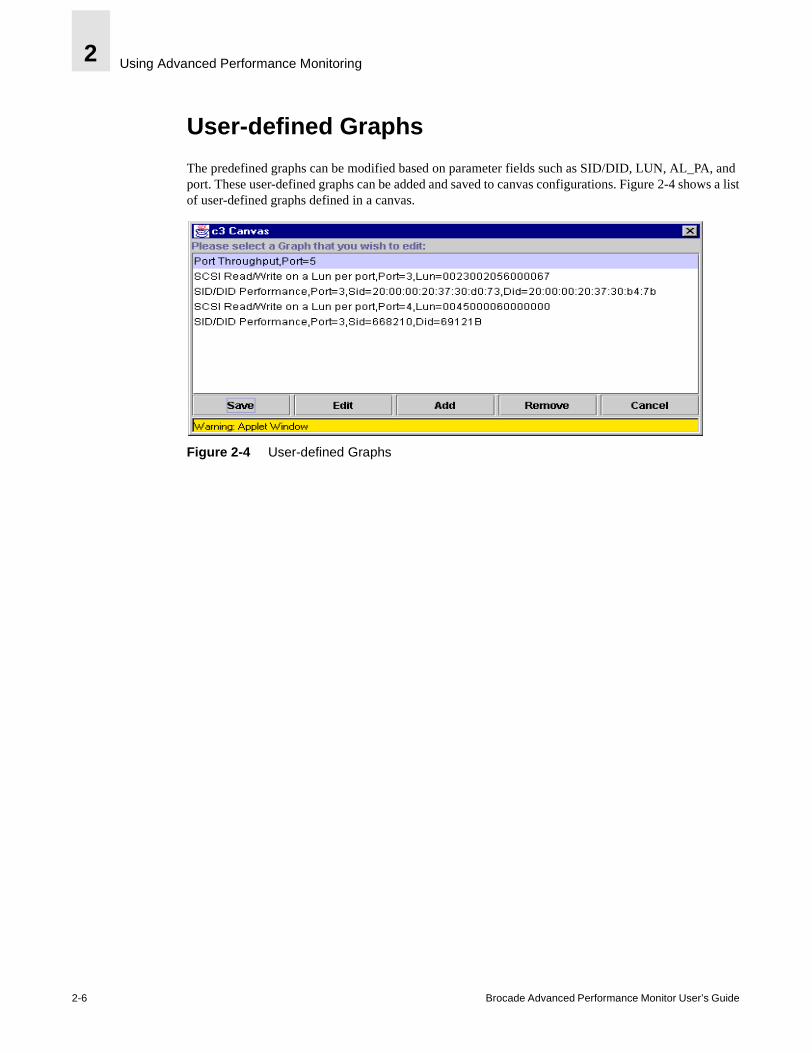
The predefined graphs can be modified based on parameter fields such as SID/DID, LUN, AL_PA, and port. These user-defined graphs can be added and saved to canvas configurations. Figure 2-4 shows a list of user-defined graphs defined in a canvas.
Figure 2-4 User-defined Graphs
2-6 Brocade Advanced Performance Monitor User’s Guide
Using Advanced Performance Monitoring 2
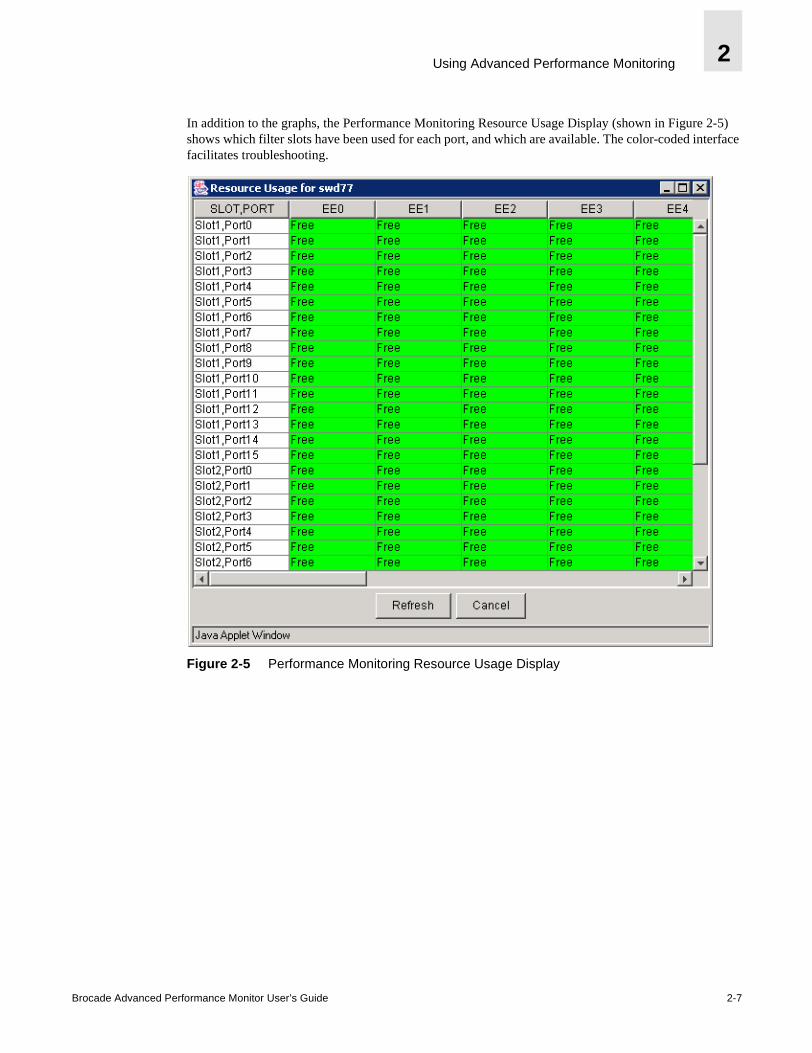
In addition to the graphs, the Performance Monitoring Resource Usage Display (shown in Figure 2-5) shows which filter slots have been used for each port, and which are available. The color-coded interface facilitates troubleshooting.
Figure 2-5 Performance Monitoring Resource Usage Display
Brocade Advanced Performance Monitor User’s Guide 2-7
Using Advanced Performance Monitoring2
Configuring a Performance Graph Canvas
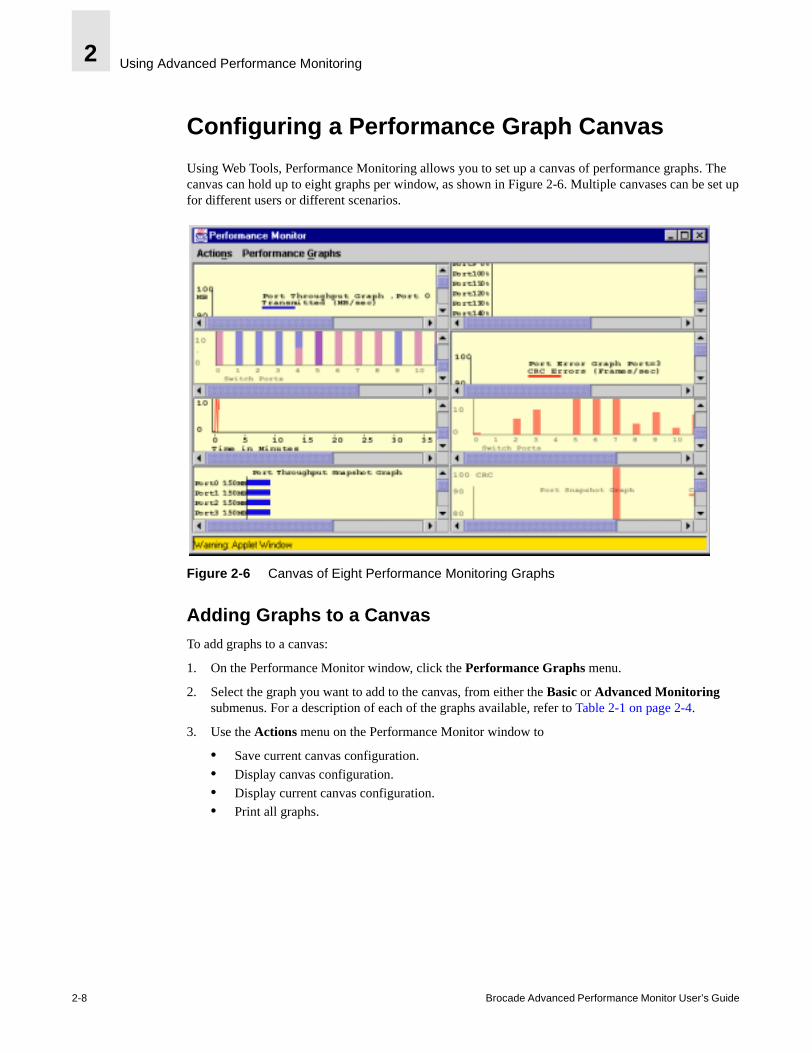
Using Web Tools, Performance Monitoring allows you to set up a canvas of performance graphs. The canvas can hold up to eight graphs per window, as shown in Figure 2-6. Multiple canvases can be set up for different users or different scenarios.
Figure 2-6 Canvas of Eight Performance Monitoring Graphs
Adding Graphs to a CanvasTo add graphs to a canvas:
1. On the Performance Monitor window, click the Performance Graphs menu.
2. Select the graph you want to add to the canvas, from either the Basic or Advanced Monitoring submenus. For a description of each of the graphs available, refer to Table 2-1 on page 2-4.
3. Use the Actions menu on the Performance Monitor window to
• Save current canvas configuration.
• Display canvas configuration.
• Display current canvas configuration.
• Print all graphs.
2-8 Brocade Advanced Performance Monitor User’s Guide
Using Advanced Performance Monitoring 2
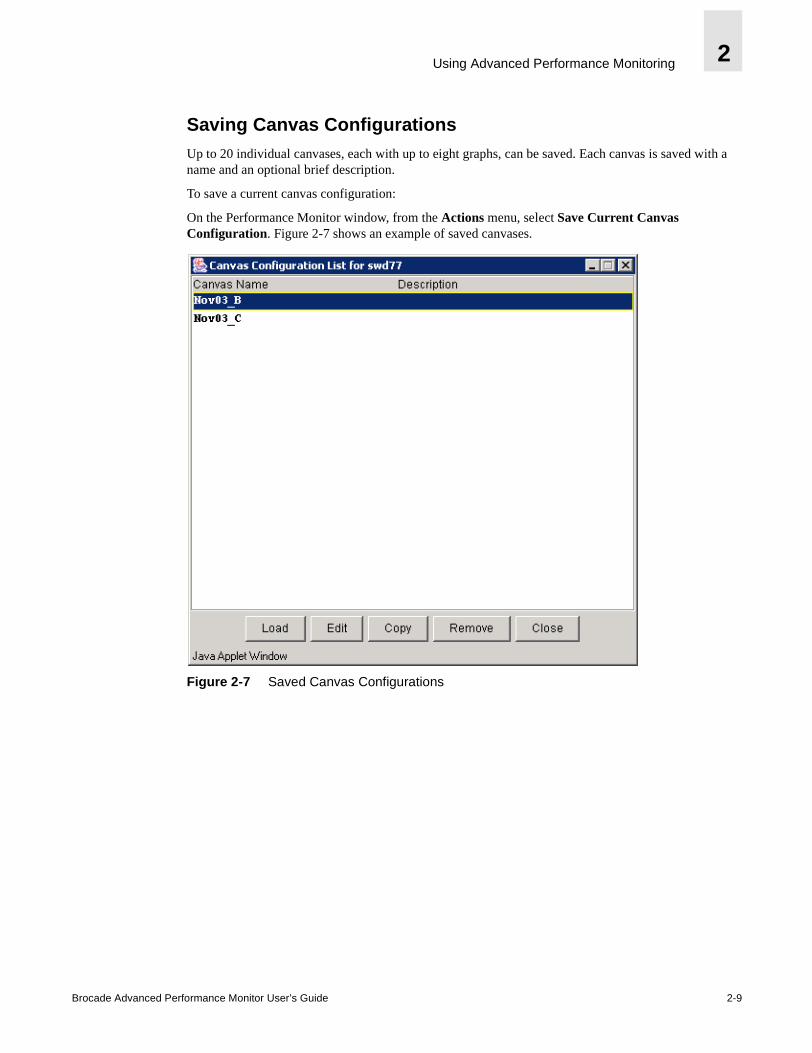
Saving Canvas ConfigurationsUp to 20 individual canvases, each with up to eight graphs, can be saved. Each canvas is saved with a name and an optional brief description.
To save a current canvas configuration:
On the Performance Monitor window, from the Actions menu, select Save Current Canvas Configuration. Figure 2-7 shows an example of saved canvases.
Figure 2-7 Saved Canvas Configurations
Brocade Advanced Performance Monitor User’s Guide 2-9
Using Advanced Performance Monitoring2
Managing Performance Monitoring with Telnet Commands
Telnet commands provide access to three different types of performance monitoring:
• AL_PA monitoring
• End-to-End monitoring
• Filter-based monitoring
AL_PA Monitoring
AL_PA monitoring provides information regarding the number of CRC errors in a loop configuration. AL_PA monitoring collects CRC error counts for each AL_PA attached to a specific port.
End-to-End Monitoring
End-to-End monitoring provides information regarding performance between the source (SID) and destination (DID) on a fabric or a loop. Up to eight SID-DID pairs can be specified per port. For each of the SID-DID pairs, the following information is available:
• Frames with CRC errors received at the port for the SID-DID pair
• Fibre Channel words that have been transmitted through the port for the SID-DID pair
• Fibre Channel words that have been received by the port for the SID-DID pair
Note: In 4.x the implementation of End-to-End (or Filter-based) monitors dictates the hardware counters to be probed at an interval that is a multiple of 5 seconds. For 4.x it is recommended the probing interval be at least 10 seconds. This restriction does not exist in 3.x.
Filter-based Monitoring
Filter-based monitoring provides information about the filter hit count. All user-defined filters are matched against all Fibre Channel frames being transmitted from a port.
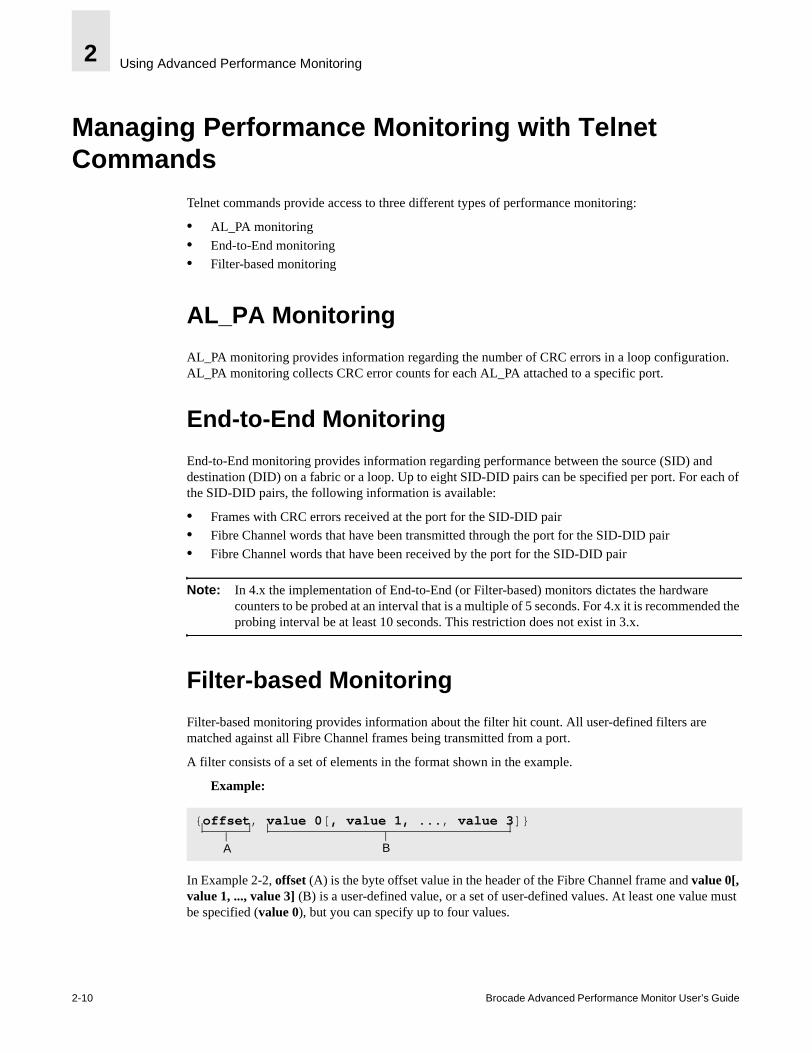
A filter consists of a set of elements in the format shown in the example.
Example:
In Example 2-2, offset (A) is the byte offset value in the header of the Fibre Channel frame and value 0[, value 1, ..., value 3] (B) is a user-defined value, or a set of user-defined values. At least one value must be specified (value 0), but you can specify up to four values.
{offset, value 0[, value 1, ..., value 3]}
A B
2-10 Brocade Advanced Performance Monitor User’s Guide
Using Advanced Performance Monitoring 2
For a filter to be matched, each element specified in the filter must match at least one of the user-defined values. The range of offsets that can be matched using filters is 0 to 63. Examples of Fibre Channel frame statistics that can be measured using filters are:
• SCSI Read, Write, or Read/Write commands
• IP versus SCSI traffic comparison
Note: In 4.x the implementation of End-to-End (or Filter-based) monitors dictates the hardware counters to be probed at an interval that is a multiple of 5 seconds. For 4.x it is recommended the probing interval be at least 10 seconds. This restriction does not exist in 3.x.
Telnet CommandsUsing telnet commands, you can track the following:
• Number of CRC errors for AL_PA devices
• Number of words received and transmitted in Fibre Channel frames with a defined SID/DID pair
• Number of frames with CRC errors received at the port with a defined SID/DID pair
• Number of times a particular filter pattern in a frame is transmitted by a port
Using AL_PA Performance Monitoring
AL_PA performance monitoring tracks and displays the number of CRC errors that have occurred on frames sent from each AL_PA on a specific port. AL_PA-based performance monitoring does not require explicit configuration. The switch hardware and firmware automatically monitors CRC errors for all valid AL_PAs.
Note: A system with blade slot/port syntax is used and on a system without blades, port number is used instead. All examples in this document use slot/port syntax.
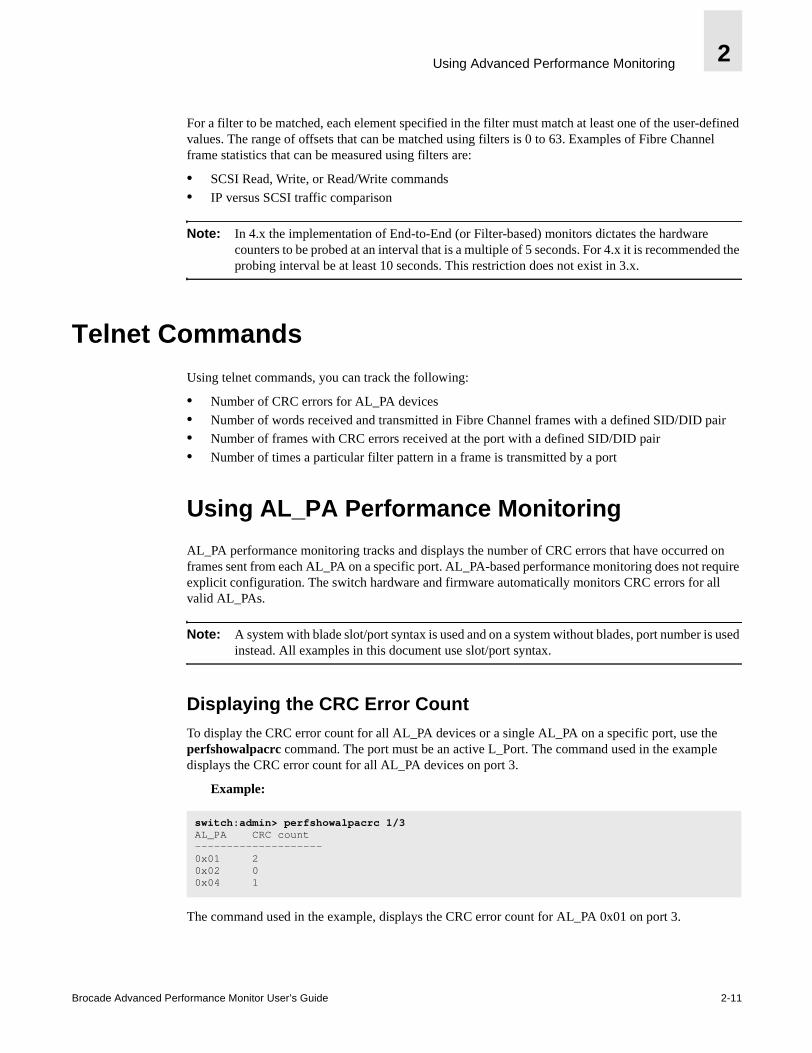
Displaying the CRC Error CountTo display the CRC error count for all AL_PA devices or a single AL_PA on a specific port, use the perfshowalpacrc command. The port must be an active L_Port. The command used in the example displays the CRC error count for all AL_PA devices on port 3.
Example:
The command used in the example, displays the CRC error count for AL_PA 0x01 on port 3.
switch:admin> perfshowalpacrc 1/3AL_PA CRC count--------------------0x01 2 0x02 00x04 1
Brocade Advanced Performance Monitor User’s Guide 2-11
Using Advanced Performance Monitoring2
Example:
Clearing the CRC Error CountTo clear the CRC error count for AL_PA devices on a specific port, use the perfclralpacrc command. Using this command you can either clear the error counts for a specific AL_PA or clear the error counts on all AL_PA devices on a port. The command used in the first example below, clears the CRC error count for all AL_PA devices on port 3. The command used in the second example below, clears the CRC error count for AL_PA 0x01 on port 3.
Note: In 3.1 and 4.1 issuing portStatsClear command on a port will also result in all AL_pa based CRC error counters being cleared for all the ports in the same quad.
Example:
Example:
Using End-to-End Performance Monitoring
End-to-End performance monitoring counts the number of words and CRC errors in Fibre Channel frames for a specified Source ID (SID) and Destination ID (DID) pair. An end-to-end performance monitor counts the number of
• Words in frames received at the port (RX_COUNT).
• Words in frames transmitted from the port (TX_COUNT).
• Frames received at or transmitted from the port with CRC errors (CRC_COUNT).
To enable end-to-end performance monitoring, you must configure an end-to-end monitor on a port, specifying the SID-DID pair. The monitor counts only those frames with matching SID and DID. Each SID or DID has three fields, listed in the following order:
• Domain ID (DD)
• Area ID (AA)
• AL_PA (PP)
The SID 0x118a0f has Domain ID 0x11, Area ID 0x8a, and AL_PA 0x0f. (The prefix “0x” denotes a hexadecimal number.)
switch:admin> perfshowalpacrc 1/3, 0x01The CRC count at ALPA 0x1 on port 3 is 0x000000002.
switch:admin> perfclralpacrc 1/3No ALPA value is specified. This will clear all ALPA CRCcounts on port 3. Do you want to continue? (yes, y, no, n): [no]Please wait ...All alpa CRC counts are cleared on port 3.
switch:admin> perfclralpacrc 1/3, 0x01CRC error count at ALPA 0x1 on port 3 is cleared.
2-12 Brocade Advanced Performance Monitor User’s Guide
Using Advanced Performance Monitoring 2
Adding End-to-End MonitorsUse this command to add an End-to-End monitor to a port. The monitor counts the number of words received, number of words transmitted, and number of CRC errors detected in frames qualified using either of following two conditions:
1. For frames received at the port (with End-to-End monitor installed) the frame SID is the same as “SourceID” and frame DID is the same as “DestID”. Both RX_COUNT and CRC_COUNT will be updated accordingly.
2. For frames transmitted from the port (with End-to-End monitor installed) the frame DID is the same as “SourceID” and frame SID is the same as “DestID”, TX_COUNT, and CRC_COUNT will be updated accordingly.
Depending on the application, any port along the routing path can be selected for such monitoring.
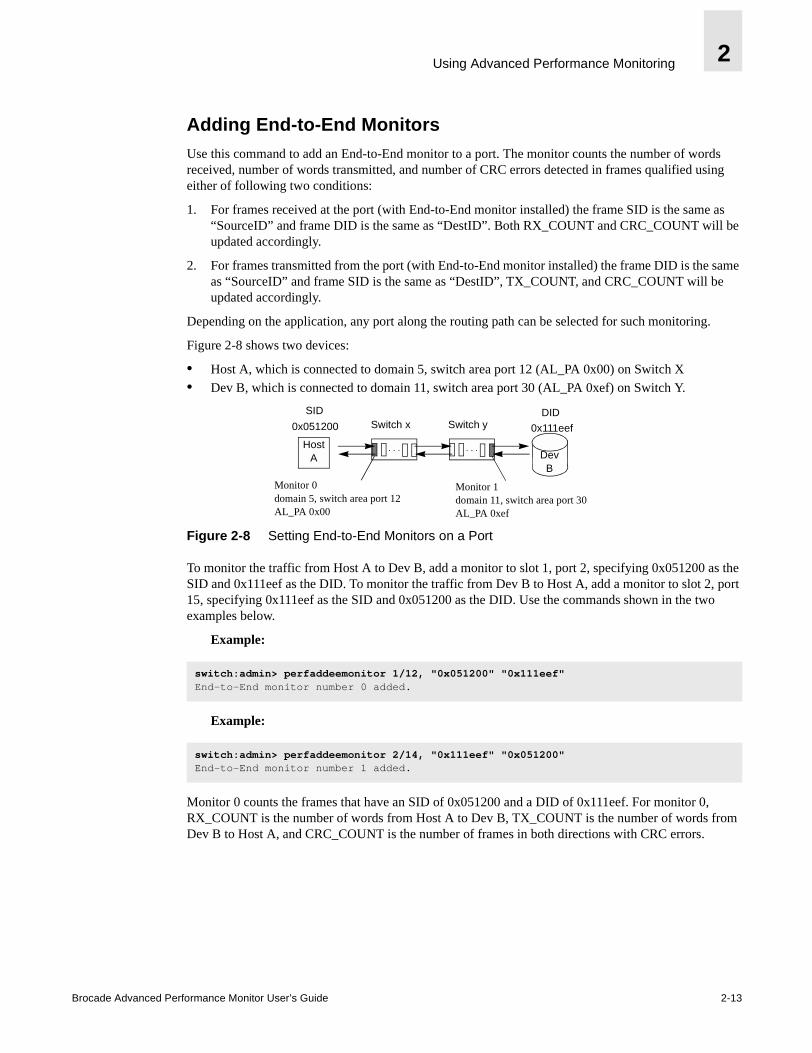
Figure 2-8 shows two devices:
• Host A, which is connected to domain 5, switch area port 12 (AL_PA 0x00) on Switch X
• Dev B, which is connected to domain 11, switch area port 30 (AL_PA 0xef) on Switch Y.
Figure 2-8 Setting End-to-End Monitors on a Port
To monitor the traffic from Host A to Dev B, add a monitor to slot 1, port 2, specifying 0x051200 as the SID and 0x111eef as the DID. To monitor the traffic from Dev B to Host A, add a monitor to slot 2, port 15, specifying 0x111eef as the SID and 0x051200 as the DID. Use the commands shown in the two examples below.
Example:
Example:
Monitor 0 counts the frames that have an SID of 0x051200 and a DID of 0x111eef. For monitor 0, RX_COUNT is the number of words from Host A to Dev B, TX_COUNT is the number of words from Dev B to Host A, and CRC_COUNT is the number of frames in both directions with CRC errors.
switch:admin> perfaddeemonitor 1/12, "0x051200" "0x111eef"End-to-End monitor number 0 added.
switch:admin> perfaddeemonitor 2/14, "0x111eef" "0x051200"End-to-End monitor number 1 added.
. . .
0x051200 0x111eef
HostA
DIDSID
. . .Dev
B
Switch x Switch y
Monitor 0domain 5, switch area port 12AL_PA 0x00
Monitor 1domain 11, switch area port 30AL_PA 0xef
Brocade Advanced Performance Monitor User’s Guide 2-13
Using Advanced Performance Monitoring2
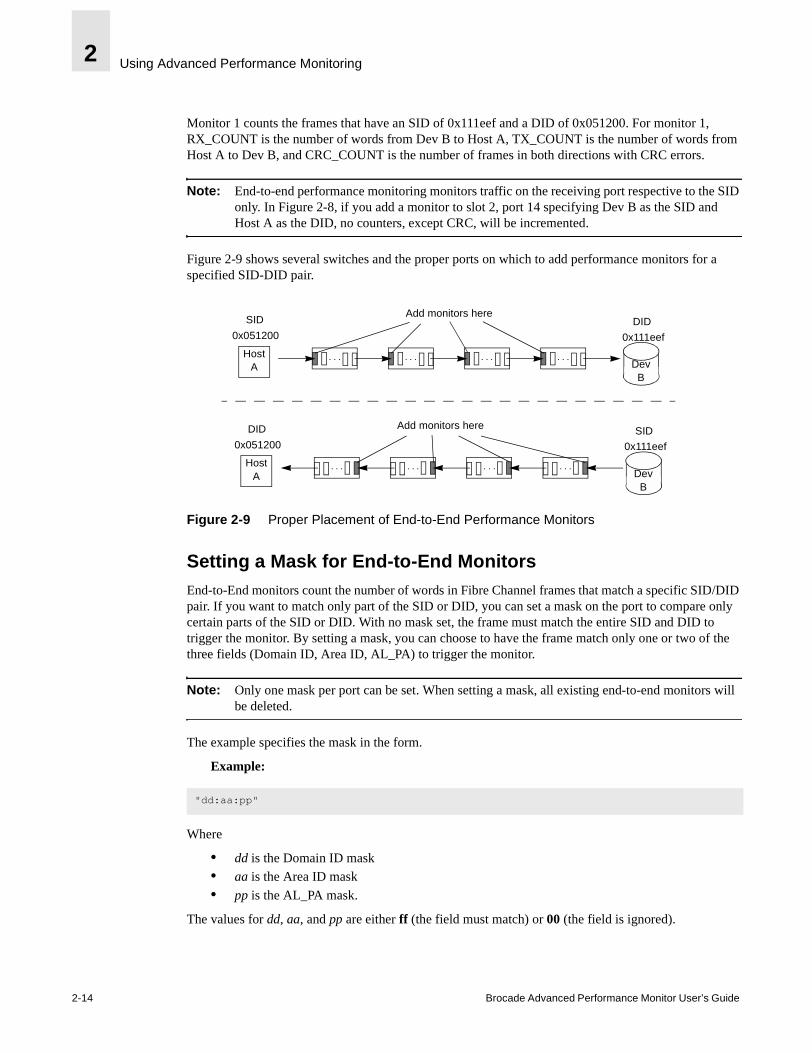
Monitor 1 counts the frames that have an SID of 0x111eef and a DID of 0x051200. For monitor 1, RX_COUNT is the number of words from Dev B to Host A, TX_COUNT is the number of words from Host A to Dev B, and CRC_COUNT is the number of frames in both directions with CRC errors.
Note: End-to-end performance monitoring monitors traffic on the receiving port respective to the SID only. In Figure 2-8, if you add a monitor to slot 2, port 14 specifying Dev B as the SID andHost A as the DID, no counters, except CRC, will be incremented.
Figure 2-9 shows several switches and the proper ports on which to add performance monitors for a specified SID-DID pair.
Figure 2-9 Proper Placement of End-to-End Performance Monitors
Setting a Mask for End-to-End MonitorsEnd-to-End monitors count the number of words in Fibre Channel frames that match a specific SID/DID pair. If you want to match only part of the SID or DID, you can set a mask on the port to compare only certain parts of the SID or DID. With no mask set, the frame must match the entire SID and DID to trigger the monitor. By setting a mask, you can choose to have the frame match only one or two of the three fields (Domain ID, Area ID, AL_PA) to trigger the monitor.
Note: Only one mask per port can be set. When setting a mask, all existing end-to-end monitors will be deleted.
The example specifies the mask in the form.
Example:
Where
• dd is the Domain ID mask
• aa is the Area ID mask
• pp is the AL_PA mask.
The values for dd, aa, and pp are either ff (the field must match) or 00 (the field is ignored).
"dd:aa:pp"
. . .
0x051200 0x111eef
HostA
DIDSID
. . .. . . . . .
. . .
0x051200 0x111eef
HostA Dev
B
SIDDID
. . . . . .. . .
Add monitors here
Add monitors here
DevB
2-14 Brocade Advanced Performance Monitor User’s Guide
Using Advanced Performance Monitoring 2
To set a mask for end-to-end monitors use the perfsetporteemask command. The command sets the mask for all end-to-end monitors of a port. If any End-to-End monitors are programmed on a port when the perfsetporteemask command is issued, you will see the message displayed as in the example.
Example:
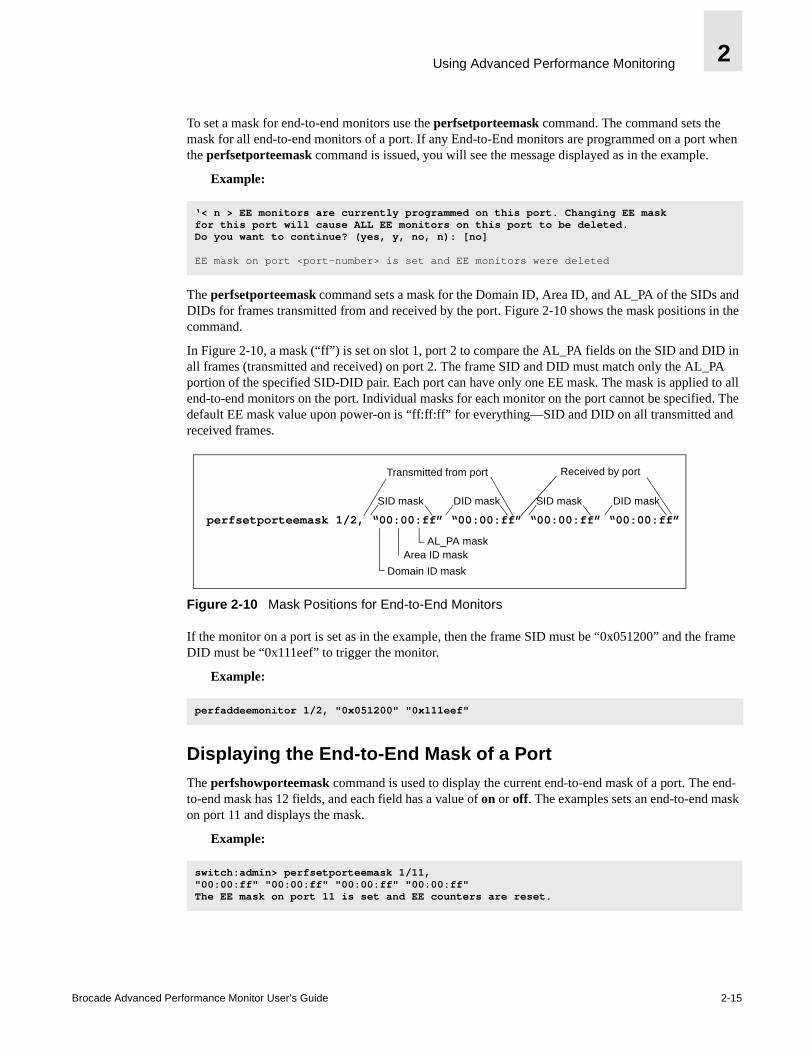
The perfsetporteemask command sets a mask for the Domain ID, Area ID, and AL_PA of the SIDs and DIDs for frames transmitted from and received by the port. Figure 2-10 shows the mask positions in the command.
In Figure 2-10, a mask (“ff”) is set on slot 1, port 2 to compare the AL_PA fields on the SID and DID in all frames (transmitted and received) on port 2. The frame SID and DID must match only the AL_PA portion of the specified SID-DID pair. Each port can have only one EE mask. The mask is applied to all end-to-end monitors on the port. Individual masks for each monitor on the port cannot be specified. The default EE mask value upon power-on is “ff:ff:ff” for everything—SID and DID on all transmitted and received frames.
Figure 2-10 Mask Positions for End-to-End Monitors
If the monitor on a port is set as in the example, then the frame SID must be “0x051200” and the frame DID must be “0x111eef” to trigger the monitor.
Example:
Displaying the End-to-End Mask of a PortThe perfshowporteemask command is used to display the current end-to-end mask of a port. The end-to-end mask has 12 fields, and each field has a value of on or off. The examples sets an end-to-end mask on port 11 and displays the mask.
Example:
‘< n > EE monitors are currently programmed on this port. Changing EE maskfor this port will cause ALL EE monitors on this port to be deleted.Do you want to continue? (yes, y, no, n): [no]
EE mask on port <port-number> is set and EE monitors were deleted
perfaddeemonitor 1/2, "0x051200" "0x111eef"
switch:admin> perfsetporteemask 1/11, "00:00:ff" "00:00:ff" "00:00:ff" "00:00:ff"The EE mask on port 11 is set and EE counters are reset.
perfsetporteemask 1/2, “00:00:ff” “00:00:ff” “00:00:ff” “00:00:ff”
SID mask DID mask
Transmitted from port Received by port
AL_PA maskArea ID mask
Domain ID mask
SID mask DID mask
Brocade Advanced Performance Monitor User’s Guide 2-15
Using Advanced Performance Monitoring2
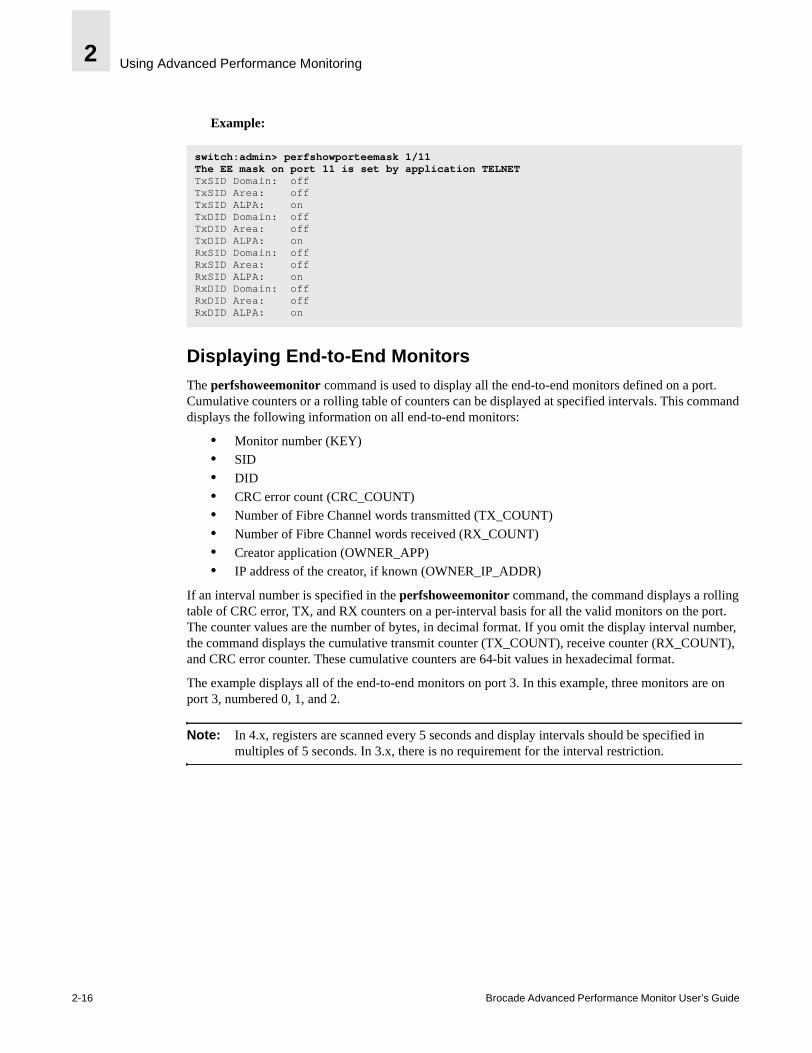
Example:
Displaying End-to-End MonitorsThe perfshoweemonitor command is used to display all the end-to-end monitors defined on a port. Cumulative counters or a rolling table of counters can be displayed at specified intervals. This command displays the following information on all end-to-end monitors:
• Monitor number (KEY)
• SID
• DID
• CRC error count (CRC_COUNT)
• Number of Fibre Channel words transmitted (TX_COUNT)
• Number of Fibre Channel words received (RX_COUNT)
• Creator application (OWNER_APP)
• IP address of the creator, if known (OWNER_IP_ADDR)
If an interval number is specified in the perfshoweemonitor command, the command displays a rolling table of CRC error, TX, and RX counters on a per-interval basis for all the valid monitors on the port. The counter values are the number of bytes, in decimal format. If you omit the display interval number, the command displays the cumulative transmit counter (TX_COUNT), receive counter (RX_COUNT), and CRC error counter. These cumulative counters are 64-bit values in hexadecimal format.
The example displays all of the end-to-end monitors on port 3. In this example, three monitors are on port 3, numbered 0, 1, and 2.
Note: In 4.x, registers are scanned every 5 seconds and display intervals should be specified in multiples of 5 seconds. In 3.x, there is no requirement for the interval restriction.
switch:admin> perfshowporteemask 1/11The EE mask on port 11 is set by application TELNETTxSID Domain: offTxSID Area: offTxSID ALPA: onTxDID Domain: offTxDID Area: offTxDID ALPA: onRxSID Domain: offRxSID Area: offRxSID ALPA: onRxDID Domain: offRxDID Area: offRxDID ALPA: on
2-16 Brocade Advanced Performance Monitor User’s Guide
Using Advanced Performance Monitoring 2
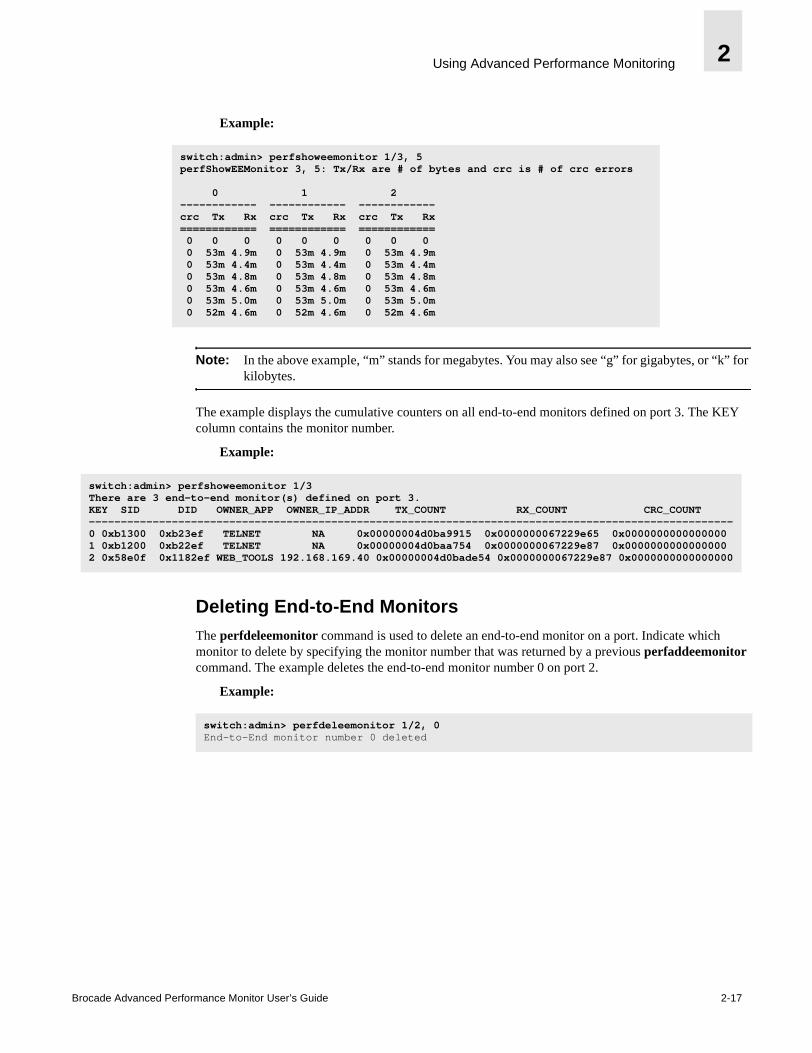
Example:
Note: In the above example, “m” stands for megabytes. You may also see “g” for gigabytes, or “k” for kilobytes.
The example displays the cumulative counters on all end-to-end monitors defined on port 3. The KEY column contains the monitor number.
Example:
Deleting End-to-End MonitorsThe perfdeleemonitor command is used to delete an end-to-end monitor on a port. Indicate which monitor to delete by specifying the monitor number that was returned by a previous perfaddeemonitor command. The example deletes the end-to-end monitor number 0 on port 2.
Example:
switch:admin> perfshoweemonitor 1/3, 5perfShowEEMonitor 3, 5: Tx/Rx are # of bytes and crc is # of crc errors
0 1 2------------ ------------ ------------crc Tx Rx crc Tx Rx crc Tx Rx============ ============ ============0 0 0 0 0 0 0 0 00 53m 4.9m 0 53m 4.9m 0 53m 4.9m0 53m 4.4m 0 53m 4.4m 0 53m 4.4m0 53m 4.8m 0 53m 4.8m 0 53m 4.8m0 53m 4.6m 0 53m 4.6m 0 53m 4.6m0 53m 5.0m 0 53m 5.0m 0 53m 5.0m0 52m 4.6m 0 52m 4.6m 0 52m 4.6m
switch:admin> perfshoweemonitor 1/3There are 3 end-to-end monitor(s) defined on port 3.KEY SID DID OWNER_APP OWNER_IP_ADDR TX_COUNT RX_COUNT CRC_COUNT-----------------------------------------------------------------------------------------------------0 0xb1300 0xb23ef TELNET NA 0x00000004d0ba9915 0x0000000067229e65 0x0000000000000000 1 0xb1200 0xb22ef TELNET NA 0x00000004d0baa754 0x0000000067229e87 0x00000000000000002 0x58e0f 0x1182ef WEB_TOOLS 192.168.169.40 0x00000004d0bade54 0x0000000067229e87 0x0000000000000000
switch:admin> perfdeleemonitor 1/2, 0End-to-End monitor number 0 deleted
Brocade Advanced Performance Monitor User’s Guide 2-17
Using Advanced Performance Monitoring2
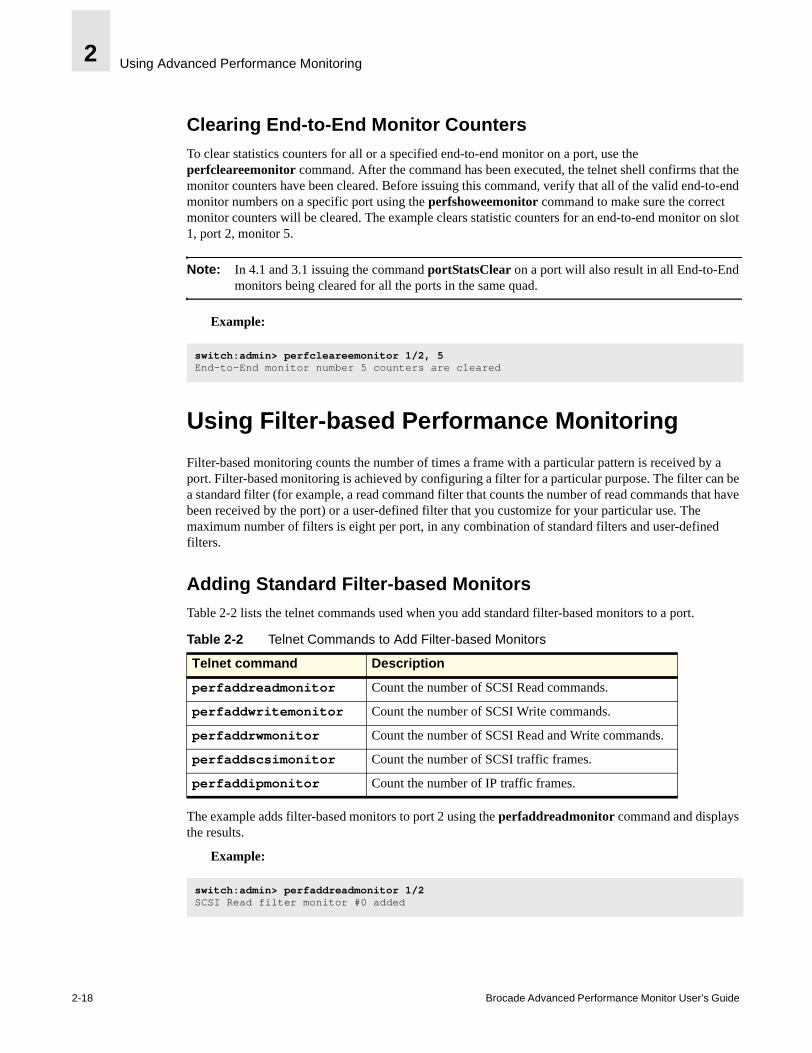
Clearing End-to-End Monitor CountersTo clear statistics counters for all or a specified end-to-end monitor on a port, use the perfcleareemonitor command. After the command has been executed, the telnet shell confirms that the monitor counters have been cleared. Before issuing this command, verify that all of the valid end-to-end monitor numbers on a specific port using the perfshoweemonitor command to make sure the correct monitor counters will be cleared. The example clears statistic counters for an end-to-end monitor on slot 1, port 2, monitor 5.
Note: In 4.1 and 3.1 issuing the command portStatsClear on a port will also result in all End-to-End monitors being cleared for all the ports in the same quad.
Example:
Using Filter-based Performance Monitoring
Filter-based monitoring counts the number of times a frame with a particular pattern is received by a port. Filter-based monitoring is achieved by configuring a filter for a particular purpose. The filter can be a standard filter (for example, a read command filter that counts the number of read commands that have been received by the port) or a user-defined filter that you customize for your particular use. The maximum number of filters is eight per port, in any combination of standard filters and user-defined filters.
Adding Standard Filter-based MonitorsTable 2-2 lists the telnet commands used when you add standard filter-based monitors to a port.
The example adds filter-based monitors to port 2 using the perfaddreadmonitor command and displays the results.
Example:
switch:admin> perfcleareemonitor 1/2, 5End-to-End monitor number 5 counters are cleared
Table 2-2 Telnet Commands to Add Filter-based Monitors
Telnet command Description
perfaddreadmonitor Count the number of SCSI Read commands.
perfaddwritemonitor Count the number of SCSI Write commands.
perfaddrwmonitor Count the number of SCSI Read and Write commands.
perfaddscsimonitor Count the number of SCSI traffic frames.
perfaddipmonitor Count the number of IP traffic frames.
switch:admin> perfaddreadmonitor 1/2SCSI Read filter monitor #0 added
2-18 Brocade Advanced Performance Monitor User’s Guide
Using Advanced Performance Monitoring 2
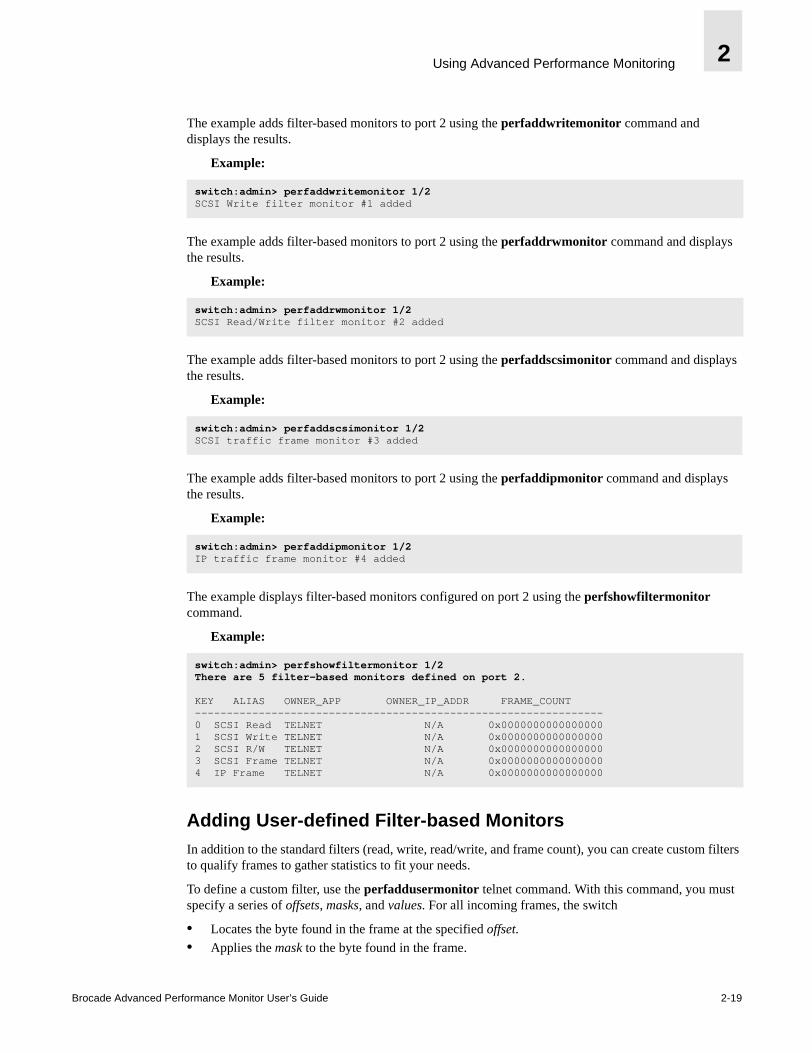
The example adds filter-based monitors to port 2 using the perfaddwritemonitor command and displays the results.
Example:
The example adds filter-based monitors to port 2 using the perfaddrwmonitor command and displays the results.
Example:
The example adds filter-based monitors to port 2 using the perfaddscsimonitor command and displays the results.
Example:
The example adds filter-based monitors to port 2 using the perfaddipmonitor command and displays the results.
Example:
The example displays filter-based monitors configured on port 2 using the perfshowfiltermonitor command.
Example:
Adding User-defined Filter-based MonitorsIn addition to the standard filters (read, write, read/write, and frame count), you can create custom filters to qualify frames to gather statistics to fit your needs.
To define a custom filter, use the perfaddusermonitor telnet command. With this command, you must specify a series of offsets, masks, and values. For all incoming frames, the switch
• Locates the byte found in the frame at the specified offset.
• Applies the mask to the byte found in the frame.
switch:admin> perfaddwritemonitor 1/2SCSI Write filter monitor #1 added
switch:admin> perfaddrwmonitor 1/2SCSI Read/Write filter monitor #2 added
switch:admin> perfaddscsimonitor 1/2SCSI traffic frame monitor #3 added
switch:admin> perfaddipmonitor 1/2IP traffic frame monitor #4 added
switch:admin> perfshowfiltermonitor 1/2There are 5 filter-based monitors defined on port 2.
KEY ALIAS OWNER_APP OWNER_IP_ADDR FRAME_COUNT----------------------------------------------------------------0 SCSI Read TELNET N/A 0x00000000000000001 SCSI Write TELNET N/A 0x00000000000000002 SCSI R/W TELNET N/A 0x00000000000000003 SCSI Frame TELNET N/A 0x00000000000000004 IP Frame TELNET N/A 0x0000000000000000
Brocade Advanced Performance Monitor User’s Guide 2-19
Using Advanced Performance Monitoring2
• Compares the value with the given values in the perfaddusermonitor command.
• Increments the filter counter if a match is found.
Up to six different offsets for each port and up to four values to compare against each offset can be specified. If more than one offset is required to properly define a filter, the bytes found at each offset must match one of the given values for the filter to increment its counter. If one or more of the given offsets does not match any of the given values, the counter does not increment.
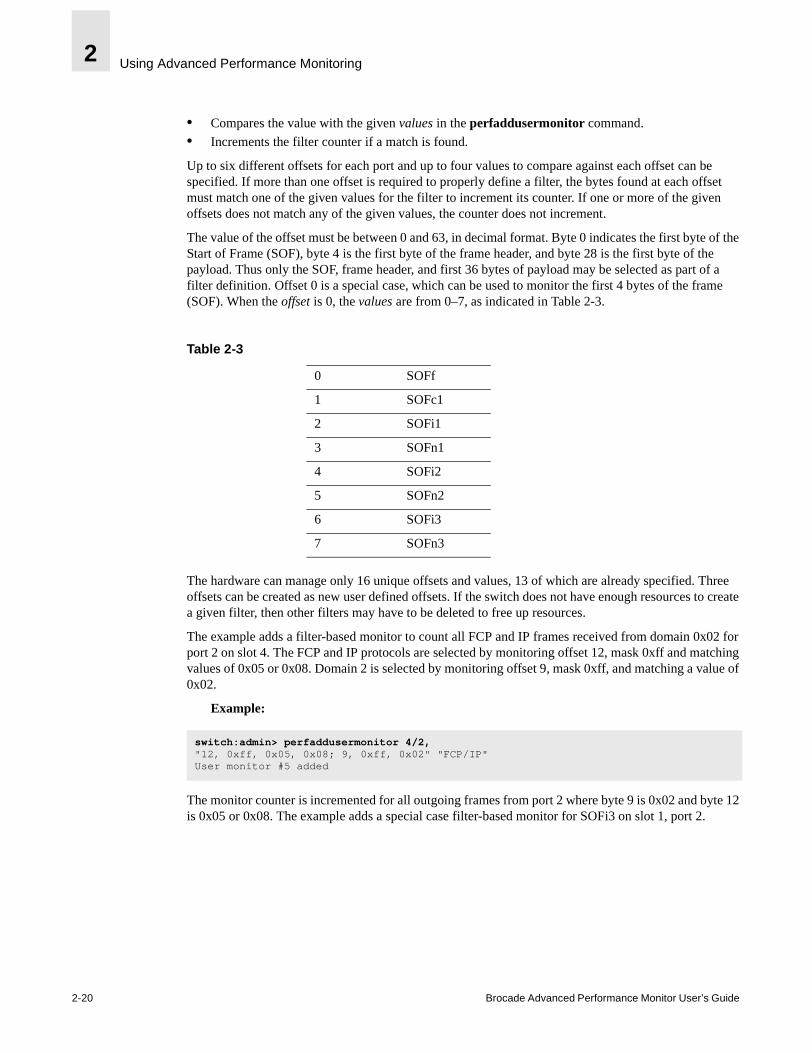
The value of the offset must be between 0 and 63, in decimal format. Byte 0 indicates the first byte of the Start of Frame (SOF), byte 4 is the first byte of the frame header, and byte 28 is the first byte of the payload. Thus only the SOF, frame header, and first 36 bytes of payload may be selected as part of a filter definition. Offset 0 is a special case, which can be used to monitor the first 4 bytes of the frame (SOF). When the offset is 0, the values are from 0–7, as indicated in Table 2-3.
Table 2-3
The hardware can manage only 16 unique offsets and values, 13 of which are already specified. Three offsets can be created as new user defined offsets. If the switch does not have enough resources to create a given filter, then other filters may have to be deleted to free up resources.
The example adds a filter-based monitor to count all FCP and IP frames received from domain 0x02 for port 2 on slot 4. The FCP and IP protocols are selected by monitoring offset 12, mask 0xff and matching values of 0x05 or 0x08. Domain 2 is selected by monitoring offset 9, mask 0xff, and matching a value of 0x02.
Example:
The monitor counter is incremented for all outgoing frames from port 2 where byte 9 is 0x02 and byte 12 is 0x05 or 0x08. The example adds a special case filter-based monitor for SOFi3 on slot 1, port 2.
0 SOFf
1 SOFc1
2 SOFi1
3 SOFn1
4 SOFi2
5 SOFn2
6 SOFi3
7 SOFn3
switch:admin> perfaddusermonitor 4/2, "12, 0xff, 0x05, 0x08; 9, 0xff, 0x02" "FCP/IP"User monitor #5 added
2-20 Brocade Advanced Performance Monitor User’s Guide
Using Advanced Performance Monitoring 2
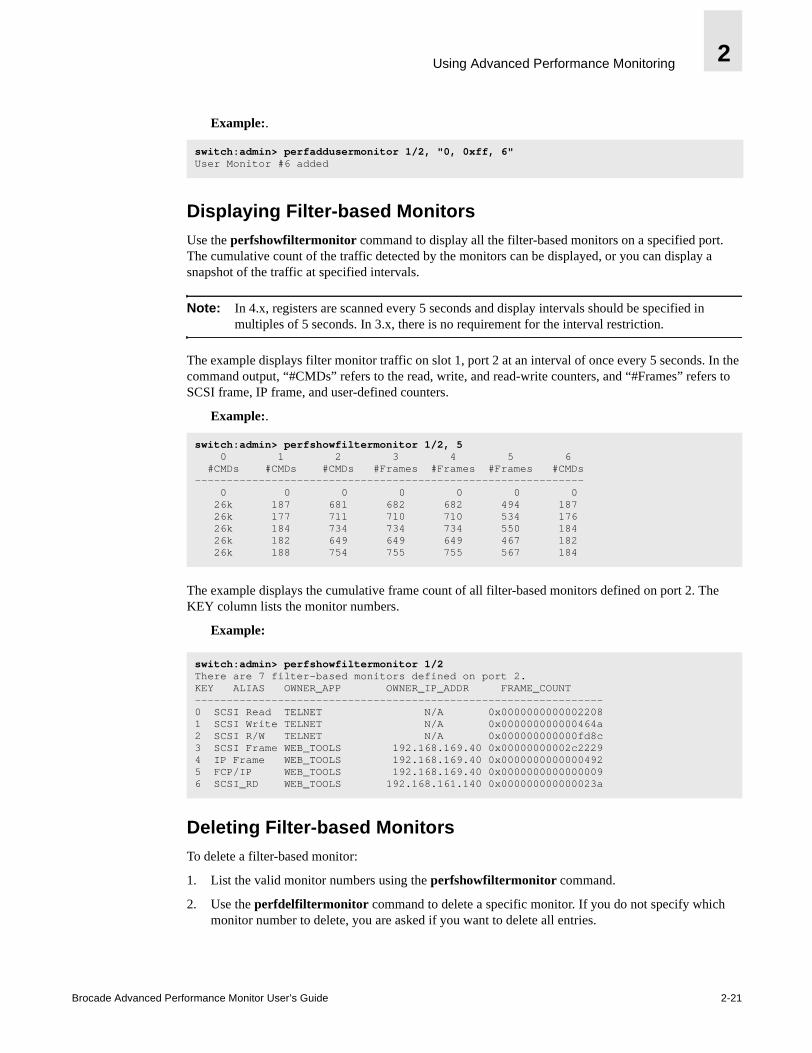
Example:.
Displaying Filter-based MonitorsUse the perfshowfiltermonitor command to display all the filter-based monitors on a specified port. The cumulative count of the traffic detected by the monitors can be displayed, or you can display a snapshot of the traffic at specified intervals.
Note: In 4.x, registers are scanned every 5 seconds and display intervals should be specified in multiples of 5 seconds. In 3.x, there is no requirement for the interval restriction.
The example displays filter monitor traffic on slot 1, port 2 at an interval of once every 5 seconds. In the command output, “#CMDs” refers to the read, write, and read-write counters, and “#Frames” refers to SCSI frame, IP frame, and user-defined counters.
Example:.
The example displays the cumulative frame count of all filter-based monitors defined on port 2. The KEY column lists the monitor numbers.
Example:
Deleting Filter-based MonitorsTo delete a filter-based monitor:
1. List the valid monitor numbers using the perfshowfiltermonitor command.
2. Use the perfdelfiltermonitor command to delete a specific monitor. If you do not specify which monitor number to delete, you are asked if you want to delete all entries.
switch:admin> perfaddusermonitor 1/2, "0, 0xff, 6"User Monitor #6 added
switch:admin> perfshowfiltermonitor 1/2, 50 1 2 3 4 5 6
#CMDs #CMDs #CMDs #Frames #Frames #Frames #CMDs-------------------------------------------------------------
0 0 0 0 0 0 026k 187 681 682 682 494 18726k 177 711 710 710 534 17626k 184 734 734 734 550 18426k 182 649 649 649 467 18226k 188 754 755 755 567 184
switch:admin> perfshowfiltermonitor 1/2There are 7 filter-based monitors defined on port 2.KEY ALIAS OWNER_APP OWNER_IP_ADDR FRAME_COUNT----------------------------------------------------------------0 SCSI Read TELNET N/A 0x00000000000022081 SCSI Write TELNET N/A 0x000000000000464a2 SCSI R/W TELNET N/A 0x000000000000fd8c3 SCSI Frame WEB_TOOLS 192.168.169.40 0x00000000002c22294 IP Frame WEB_TOOLS 192.168.169.40 0x00000000000004925 FCP/IP WEB_TOOLS 192.168.169.40 0x00000000000000096 SCSI_RD WEB_TOOLS 192.168.161.140 0x000000000000023a
Brocade Advanced Performance Monitor User’s Guide 2-21
Using Advanced Performance Monitoring2
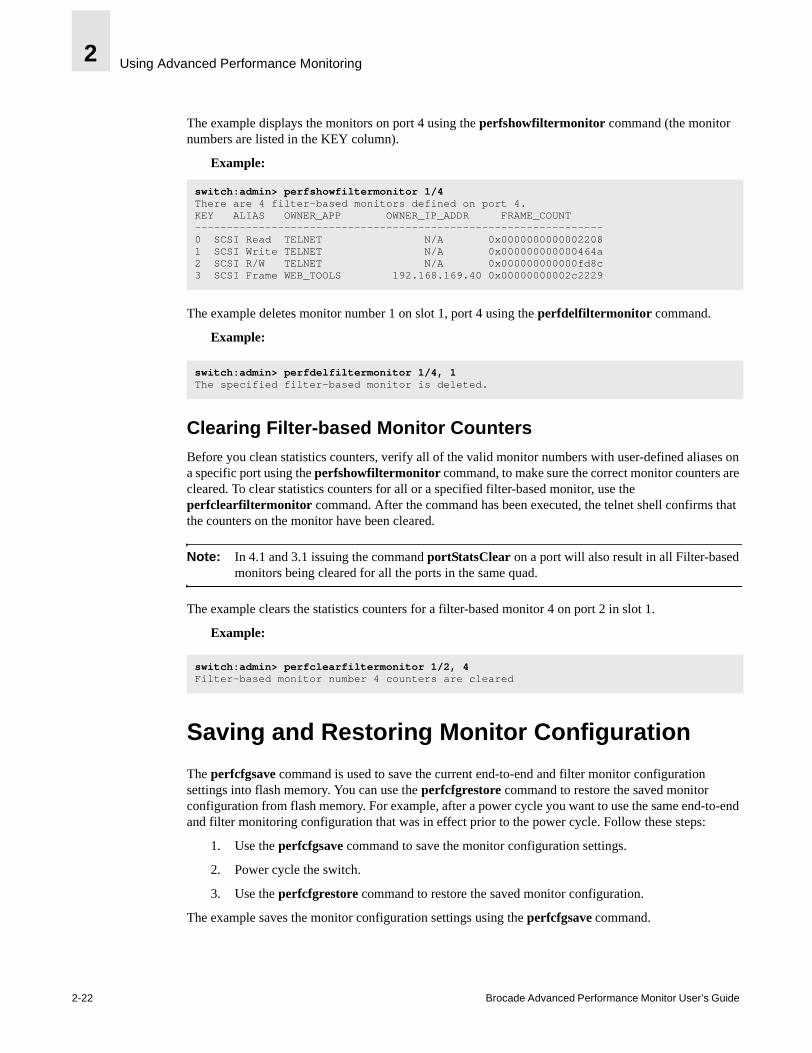
The example displays the monitors on port 4 using the perfshowfiltermonitor command (the monitor numbers are listed in the KEY column).
Example:
The example deletes monitor number 1 on slot 1, port 4 using the perfdelfiltermonitor command.
Example:
Clearing Filter-based Monitor CountersBefore you clean statistics counters, verify all of the valid monitor numbers with user-defined aliases on a specific port using the perfshowfiltermonitor command, to make sure the correct monitor counters are cleared. To clear statistics counters for all or a specified filter-based monitor, use the perfclearfiltermonitor command. After the command has been executed, the telnet shell confirms that the counters on the monitor have been cleared.
Note: In 4.1 and 3.1 issuing the command portStatsClear on a port will also result in all Filter-based monitors being cleared for all the ports in the same quad.
The example clears the statistics counters for a filter-based monitor 4 on port 2 in slot 1.
Example:
Saving and Restoring Monitor Configuration
The perfcfgsave command is used to save the current end-to-end and filter monitor configuration settings into flash memory. You can use the perfcfgrestore command to restore the saved monitor configuration from flash memory. For example, after a power cycle you want to use the same end-to-end and filter monitoring configuration that was in effect prior to the power cycle. Follow these steps:
1. Use the perfcfgsave command to save the monitor configuration settings.
2. Power cycle the switch.
3. Use the perfcfgrestore command to restore the saved monitor configuration.
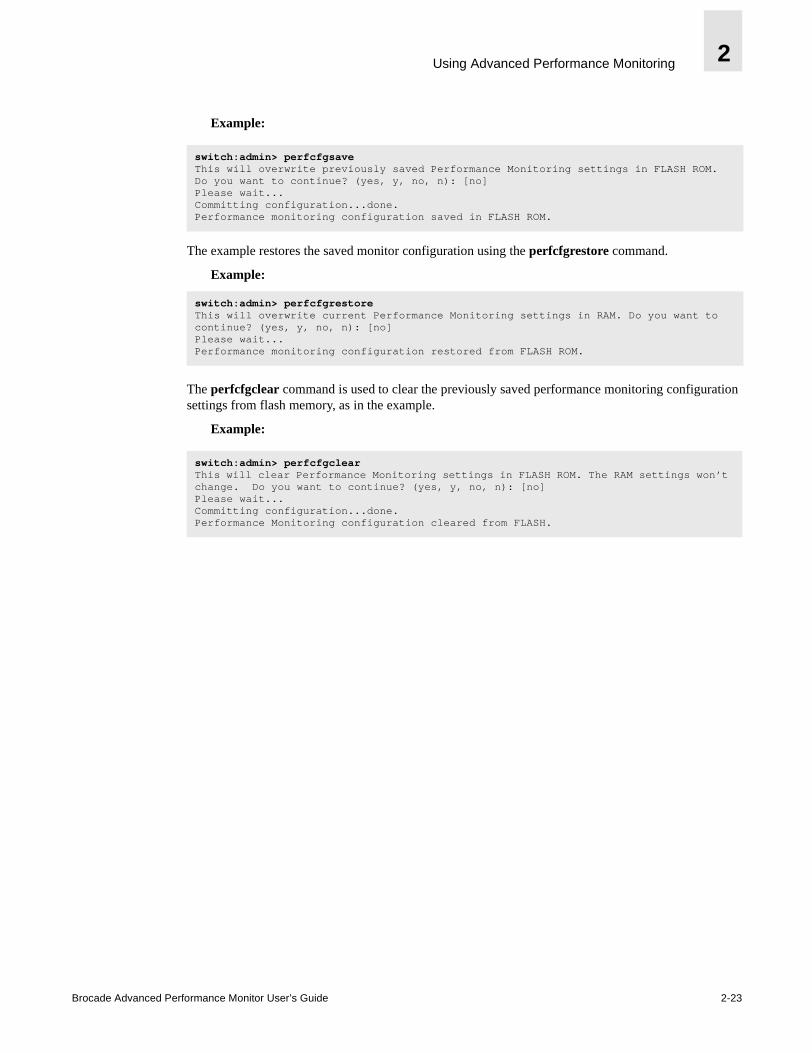
The example saves the monitor configuration settings using the perfcfgsave command.
switch:admin> perfshowfiltermonitor 1/4There are 4 filter-based monitors defined on port 4.KEY ALIAS OWNER_APP OWNER_IP_ADDR FRAME_COUNT----------------------------------------------------------------0 SCSI Read TELNET N/A 0x00000000000022081 SCSI Write TELNET N/A 0x000000000000464a2 SCSI R/W TELNET N/A 0x000000000000fd8c3 SCSI Frame WEB_TOOLS 192.168.169.40 0x00000000002c2229
switch:admin> perfdelfiltermonitor 1/4, 1The specified filter-based monitor is deleted.
switch:admin> perfclearfiltermonitor 1/2, 4Filter-based monitor number 4 counters are cleared
2-22 Brocade Advanced Performance Monitor User’s Guide
Using Advanced Performance Monitoring 2
Example:
The example restores the saved monitor configuration using the perfcfgrestore command.
Example:
The perfcfgclear command is used to clear the previously saved performance monitoring configuration settings from flash memory, as in the example.
Example:
switch:admin> perfcfgsaveThis will overwrite previously saved Performance Monitoring settings in FLASH ROM. Do you want to continue? (yes, y, no, n): [no]Please wait...Committing configuration...done.Performance monitoring configuration saved in FLASH ROM.
switch:admin> perfcfgrestoreThis will overwrite current Performance Monitoring settings in RAM. Do you want to continue? (yes, y, no, n): [no]Please wait...Performance monitoring configuration restored from FLASH ROM.
switch:admin> perfcfgclearThis will clear Performance Monitoring settings in FLASH ROM. The RAM settings won’t change. Do you want to continue? (yes, y, no, n): [no]Please wait...Committing configuration...done.Performance Monitoring configuration cleared from FLASH.
Brocade Advanced Performance Monitor User’s Guide 2-23

Using Advanced Performance Monitoring2
2-24 Brocade Advanced Performance Monitor User’s Guide

Index
Aadding
end-to-end monitors 2-13filter-based monitors 2-18
AL_PA monitoring 2-10, 2-11
BBrocade Web Tools 2-1
Fabric Assist 1-2QuickLoop 1-2
Cclearing
CRC error count 2-12end-to-end monitor counters 2-18filter-based monitor counters 2-22
CRC errors, displaying 2-11
Ddeleting
end-to-end monitors 2-17filter-based monitors 2-21
displaying
CRC error count 2-11end-to-end mask 2-15end-to-end monitors 2-16filter-based monitors 2-21
Eend-to-end monitoring 2-10, 2-12
end-to-end monitors
adding 2-13clearing counters 2-18deleting 2-17displaying 2-16displaying the mask 2-15restoring configuration 2-22saving configuration 2-22setting a mask 2-14
Ffilter-based monitoring 2-10, 2-18filter-based monitors
adding 2-18clearing counters 2-22deleting 2-21displaying 2-21restoring configuration 2-22saving configuration 2-22
Ggraphs 2-4
Mmask for end-to-end monitors
displaying 2-15setting 2-14
PperfAddEEMonitor command 2-13perfAddIPMonitor command 2-18perfAddReadMonitor command 2-18perfAddRWMonitor command 2-18
Brocade Advanced Performance Monitor User’s Guide Index-1

perfAddSCSIMonitor command 2-18perfAddUserMonitor command 2-19perfAddWriteMonitor command 2-18perfCfgRestore command 2-22perfCfgSave command 2-22perfClrAlpaCrc command 2-12perfDelEEMonitor command 2-17perfDelFilterMonitor command 2-21performance graphs 2-4perfSetPortEEMask command 2-14perfShowAlpaCRC command 2-11perfShowEEMonitor command 2-16perfShowFilterMonitor command 2-21perfShowPortEEMask command 2-15
Rremoving
end-to-end monitors 2-17filter-based monitors 2-21
restoring monitor configuration 2-22
Ssaving monitor configuration 2-22setting mask for end-to-end monitors 2-14standard filter-based monitors 2-18
Uuser-defined filter-based monitors 2-19
Index-2 Brocade Advanced Performance Monitor User’s Guide


![Performance Monitor RedPaper[1]](https://static.fdocuments.in/doc/165x107/5520172a4a79595e718b4621/performance-monitor-redpaper1.jpg)