System Monitor - Performance Monitoring Services …€¦ · 1 Chapter 1 Functions 1.1 Function...
171
User's Guide System Monitor - Performance Monitoring Services 5.0
Transcript of System Monitor - Performance Monitoring Services …€¦ · 1 Chapter 1 Functions 1.1 Function...

User's Guide
System Monitor - Performance Monitoring Services 5.0
Preface
System Monitor - Performance Monitoring Services (hereafter referred to as "System Monitor - Performance
Monitoring Services") is a software program that provides a simple means of monitoring the performance of
multiple machines. This manual explains how to use System Monitor - Performance Monitoring Services.
This manual is organized as follows. Chapter Title Content
1 Function Overview The functions and features of System Monitor - Performance Monitoring Services
2 Configuration setting How to make configuration settings 3 Basic Operations Startup methods and basic GUI operations
4 Collecting Performance Data
How to make settings relating to collecting performance data
5 Displaying Performance Status
How to make settings relating to displaying performance status
6 Threshold Monitoring and the Notification Function
How to monitor thresholds for performance data and make settings for the notification function
7 Management of Performance Data
How to manage performance data
8 Command-Line Interface How to use command-line interface 9 Troubleshooting Errors and how to handle them 10 Notes Various notes and issues
First edition, January 2004
16th edition, January 2012
Notes
(1) No part of this document may be reproduced in any form without the prior written permission of NEC
Corporation.
(2) The contents of this document may be revised without prior notice.
(3) All efforts have been made to ensure the accuracy of all information in this document. If you notice any part
unclear, incorrect, or omitted in the document, contact your authorized NEC sales representative.
(4) NEC assumes no liability for damages arising from the use of this product, nor any liability for incidental or
consequential damages arising from the use of this document regardless of (3)
Trademarks • "Windows", "Hyper-V", "Microsoft SQL Server" and "Microsoft SQL Server 2008 R2 Express Edition" are
registered trademarks or trademarks of Microsoft Corporation, U.S. in the United States and other
countries.
• "Linux" is a registered trademark or trademark of Linus Torvalds in the United States and other countries.
• "Red Hat" is a registered trademark or trademark of Red Hat, Inc. in the United States and other countries.
• "SUSE" is a trademark of Novel, Inc.
• "VMware" is a registered trademark or trademark of VMware, Inc.
• Citrix XenServer is a registered trademark or trademark of Citrix Systems, Inc.

• Other product names that appear in this document may be registered trademarks or trademarks of their
respective owners.
This product includes icons from the Silk Icons set version 1.3 by Mark James licensed under a Creative
Commons Attribution 2.5 License.
http://www.famfamfam.com/
This product includes Granados provided by Routrek Networks, Inc under the following license:
Copyright (c) 2003 Routrek Networks, Inc. All Rights Reserved.
Copyright (c) 2002 Chew Keong TAN
Redistribution and use in source and binary forms, with or without modification, are permitted provided
that the following conditions are met:
1. Redistributions of source code must retain the above copyright notice, this list of conditions and the
following disclaimer.
2. Redistributions in binary form must reproduce the above copyright notice, this list of conditions and the
following disclaimer in the documentation and/or other materials provided with the distribution.
3. The end-user documentation included with the redistribution, if any, must include the following
acknowledgment:
"This product includes software developed by Routrek Networks, Inc."
Alternately, this acknowledgment may appear in the software itself,
if and wherever such third-party acknowledgments normally appear.
4. The names "Routrek Networks" or "Routrek" must not be used to endorse or promote products derived
from this software without prior written permission. For written permission, please contact
5. Products derived from this software may not be called "Granados", appear in their name, without prior
written permission of the Routrek Networks, Inc.
THIS SOFTWARE IS PROVIDED ``AS IS'' AND ANY EXPRESSED OR IMPLIED WARRANTIES,
INCLUDING, BUT NOT LIMITED TO, THE IMPLIED WARRANTIES OF MERCHANTABILITY AND
FITNESS FOR A PARTICULAR PURPOSE ARE DISCLAIMED. IN NO EVENT SHALL ROUTREK
NETWORKS, INC. OR ITS CONTRIBUTORS BE LIABLE FOR ANY DIRECT, INDIRECT,
INCIDENTAL, SPECIAL, EXEMPLARY, OR CONSEQUENTIAL DAMAGES (INCLUDING, BUT NOT
LIMITED TO, PROCUREMENT OF SUBSTITUTE GOODS OR SERVICES; LOSS OF USE, DATA, OR

PROFITS; OR BUSINESS INTERRUPTION) HOWEVER CAUSED AND ON ANY THEORY OF
LIABILITY, WHETHER IN CONTRACT, STRICT LIABILITY, OR TORT (INCLUDING NEGLIGENCE
OR OTHERWISE) ARISING IN ANY WAY OUT OF THE USE OF THIS SOFTWARE, EVEN IF
ADVISED OF THE POSSIBILITY OF SUCH DAMAGE.
Copyright (c)NEC Corporation 2004,2012
This document cannot be changed or copied without permission from NEC.

Table of Contents
CHAPTER 1 FUNCTIONS ..................................................................................................................... 1
1.1 FUNCTION OVERVIEW OF SYSTEM MONITOR - PERFORMANCE MONITORING SERVICES ................... 1 1.2 BASIC CONFIGURATION OF SYSTEM MONITOR - PERFORMANCE MONITORING SERVICES ................. 1 1.3 COLLECTED PERFORMANCE DATA ..................................................................................................... 6 1.4 SUMMARY DATA ............................................................................................................................... 12 1.5 DATA MANAGEMENT ........................................................................................................................ 13 1.6 GROUPS ............................................................................................................................................ 14 1.7 CONNECTING TO MONITORED MACHINES ....................................................................................... 15 1.8 DISPLAYING PERFORMANCE STATUS AND CSV FILE OUTPUT ......................................................... 21 1.9 THRESHOLD MONITORING AND THE NOTIFICATION FUNCTION ....................................................... 29 1.10 THE SYSTEMPROVISIONING LINKAGE FUNCTION ........................................................................ 33 1.11 COMMAND-LINE INTERFACE......................................................................................................... 42
CHAPTER 2 CONFIGURATION SETTINGS....................................................................................... 44
2.1 STARTING THE PERFORMANCE MONITORING SERVICE .................................................................... 44 2.2 REGISTERING THE MANAGEMENT SERVER ...................................................................................... 46 2.3 CONNECTION SETTINGS TO MONITORED MACHINES ....................................................................... 47 2.4 CONNECTION SETTINGS TO THE MANAGEMENT CONSOLE .............................................................. 49 2.5 THE EXECUTION ACCOUNT FOR THE PERFORMANCE MONITORING SERVICE .................................. 53 2.6 SYSTEMPROVISIONING CONNECTION SETTINGS.............................................................................. 57 2.7 LOG SETTINGS ................................................................................................................................. 59
CHAPTER 3 BASIC OPERATIONS ..................................................................................................... 60
3.1 STARTING THE MANAGEMENT CONSOLE AND CONNECTING TO THE MANAGEMENT SERVER .......... 60 3.2 THE MAIN WINDOW ......................................................................................................................... 65
CHAPTER 4 COLLECTING PERFORMANCE DATA ......................................................................... 71
4.1 SPECIFICATIONS FOR MONITORED MACHINES ................................................................................. 71 4.2 SPECIFICATIONS FOR THE PERFORMANCE DATA TO BE COLLECTED ................................................ 83 4.3 PAUSING AND RESTARTING THE COLLECTING OF PERFORMANCE DATA .......................................... 92 4.4 CHECKING THE COLLECTING STATUS FOR PERFORMANCE DATA .................................................... 92
CHAPTER 5 PERFORMANCE STATUS DISPLAY AND FILE OUTPUT ........................................... 95
5.1 DISPLAYING PERFORMANCE GRAPHS .............................................................................................. 95 5.2 SAVING PERFORMANCE STATUS DISPLAY SPECIFICATIONS ........................................................... 108 5.3 FILE OUTPUT ................................................................................................................................. 109
CHAPTER 6 THRESHOLD MONITORING AND NOTIFICATION .................................................. 111
6.1 CONFIGURING THRESHOLD MONITORING ..................................................................................... 111

CHAPTER 7 MANAGEMENT OF PERFORMANCE DATA .............................................................. 121
7.1 DATA MANAGEMENT TOOL ............................................................................................................ 121 7.2 DATABASE SIZE MONITORING ........................................................................................................ 125
CHAPTER 8 COMMAND-LINE INTERFACE ................................................................................... 127
8.1 SSC-PERF COMMAND ...................................................................................................................... 127
CHAPTER 9 TROUBLESHOOTING .................................................................................................. 130
9.1 THE EVENT LOG ............................................................................................................................ 130 9.2 WHAT TO DO IF THE PERFORMANCE MONITORING SERVICE DOES NOT START .............................. 136 9.3 WHAT TO DO IF THE CONNECTION FROM MANAGEMENT CONSOLE TO SERVER FAILS ................... 140 9.4 WHAT TO DO IF PERFORMANCE DATA COLLECTING FAILS ............................................................. 142 9.5 WHAT TO DO IF PERFORMANCE DATA COLLECTING IS DELAYED ................................................... 147 9.6 WHAT TO DO IF THERE ARE SYSTEMPROVISIONING CONFIGURATION APPLYING ERRORS ............. 148 9.7 WHAT TO DO IF THERE ARE ERRORS WHEN PERFORMANCE ABNORMALITIES ARE REPORTED TO
SYSTEMPROVISIONING ............................................................................................................................ 149 9.8 PROBLEMS RELATING TO THE DATABASE....................................................................................... 150 9.9 OTHER............................................................................................................................................ 156
CHAPTER 10 NOTES ......................................................................................................................... 157
10.1 THE NUMBER OF MONITORED MACHINES .................................................................................. 157 10.2 NOTES ON DATABASE .................................................................................................................. 158 10.3 NOTES ON GRAPH DISPLAYS ....................................................................................................... 159 10.4 NOTES ON LINKING TO SYSTEMPROVISIONING .......................................................................... 160 10.5 RELEASE OF RESOURCES ............................................................................................................ 164 10.6 NOTES ON UPGRADING/UPDATING ............................................................................................. 164
APPENDIX .......................................................................................................................................... 165
A. HOW PERFORMANCE VALUES FOR GROUPS ARE CALCULATED ........................................................ 165

1
Chapter 1 Functions
1.1 Function Overview of System Monitor - Performance Monitoring Services
System Monitor - Performance Monitoring Services is a software program that supports monitoring the
performance status of systems.
System Monitor - Performance Monitoring Services makes it easy to keep track of the performance status of
the system by periodically collecting performance data from the system and displaying this data graphically.
For systems with large-scale configurations, the performance status of the entire system can be followed at a
glance by using the function that groups machines and graphs the performance status of each group.
Performance problems (such as high load) can be discovered quickly by graphically displaying and monitoring
the performance status of the system in real time.
It is also possible to display performance data that has been collected in the past again. This enables the
operational status of the system in the past to be checked.
1.2 Basic Configuration of System Monitor - Performance Monitoring Services
System Monitor - Performance Monitoring Services consists of a "Performance Monitoring Service function"
that collects performance data and a "management console function" that is the user interface for using the
Performance Monitoring Service.
(1) The Performance Monitoring Service
This function resides on the server, and acquires performance data by accessing the monitored machines.
The performance data is collected and stored in a database. The machine where the Performance
Monitoring Service runs is called the "management server" and the machine whose performance is
monitored should be called the "monitored machine".
The Performance Monitoring Service runs in the background as a Windows service and starts
automatically when the OS starts.

2
(2) The Management Console
This is the user interface for using the Performance Monitoring Service. Settings for the Performance
Monitoring Service, such as which machines are monitored and which performance information is
collected, are performed from the management console. The management console can also graphically
display performance data.
The management console is installed on the management server along with the Performance Monitoring
Service. Users connect to the Performance Monitoring Service by starting the management console on the
management server. More than one management console can connect to the same Performance Monitoring
Service at the same time.
Monitored machines
Management server
System Monitor - Performance Monitoring Services
Management console
Database for storing
performance data
Acquiring performance data
Saving data
System Monitor - Performance Monitoring Services
Performance Monitoring Service
Displaying graphs
Settings
3
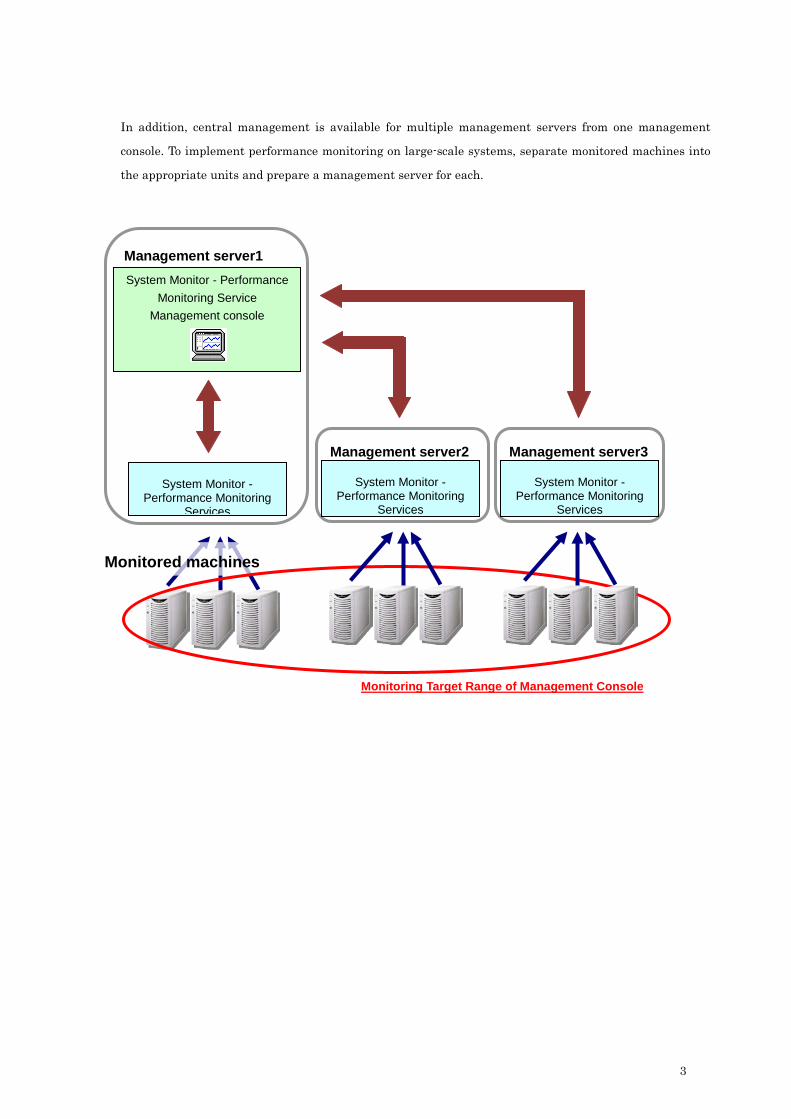
In addition, central management is available for multiple management servers from one management
console. To implement performance monitoring on large-scale systems, separate monitored machines into
the appropriate units and prepare a management server for each.
Monitoring Target Range of Management Console
Management server1
System Monitor - Performance Monitoring
Services
Monitored machines
System Monitor - Performance Monitoring Service
Management console
Management server2
System Monitor - Performance Monitoring
Services
Management server3
System Monitor - Performance Monitoring
Services

4
Operating Systems
Supported operating systems for the management server and monitored machines are as follows:
Supported operating systems
Management server Windows 2000 Server (SP4 or later) Windows 2000 Advanced Server (SP4 or later)
Windows Server 2003, Standard Edition (including SP1, SP2/R2)
Windows Server 2003, Enterprise Edition (including SP1, SP2/R2)
Windows Server 2008 Standard Edition (including SP2)
Windows Server 2008 Enterprise Edition (including SP2)
Windows Server 2008 R2 Standard Edition (including SP1)
Windows Server 2008 R2 Enterprise Edition (including SP1)
Monitored machines Windows 2000 Server (SP4 or later) Windows 2000 Advanced Server (SP4 or later)
Windows Server 2003, Standard Edition (including SP1, SP2/R2)
Windows Server 2003, Enterprise Edition (including SP1, SP2/R2)
Windows Server 2003, Standard x64 Edition (including SP1, SP2/R2)
Windows Server 2003, Enterprise x64 Edition (including SP1, SP2/R2)
Windows Server 2003, Enterprise Edition for Itanium-based Systems (including SP1, SP2)
Windows Server 2008 Standard Edition (including SP2)
Windows Server 2008 Enterprise Edition (including SP2)
Windows Server 2008 Standard x64 Edition (including SP2)
Windows Server 2008 Enterprise x64 Edition (including SP2)
Windows Server 2008 R2 Standard Edition
Windows Server 2008 R2 Enterprise Edition
Windows Server 2008 for Itanium-based Systems
Windows XP Professional (including SP1, SP2, SP3)
Windows XP Home Edition (including SP1, SP2, SP3)
Windows Vista Business Edition (including SP1, SP2)
Windows Vista Enterprise Edition (including SP1, SP2)
Windows 7 Business Edition (including SP1)
Windows 7 Enterprise Edition (including SP1)
Red Hat Enterprise Linux ES/AS 2.1, 3, 4 (including x64)
Red Hat Enterprise Linux 5, 6 Server (including x64)
SUSE Linux Enterprise Server 9 (SP3), 10 (SP1, SP2)
VMware ESX 3.5, 4.0, 4.1
VMware ESXi 3.5, 4.0, 4.1, 5.0
Citrix XenServer 5.0, 5.5, 5.6
Windows Server 2008 Standard x64 Hyper-V (SP2)
Windows Server 2008 Enterprise x64 Hyper-V (SP2)

5
An internal operation of Windows may let the data collecting operation take
too long time when the OS of the monitored machine is Windows Vista or
Windows Server 2008 R1. For detail, see "9.5 What to do if Performance
Data Collecting is Delayed".
The version 4.8 and earlier is evaluated for Red Hat Enterprise Linux ES/AS
4 as a monitored machine. The version 5.4 and earlier is evaluated for Red
Hat Enterprise Linux 5 Server as a monitored machine. The version 6.1 and
earlier is evaluated for Red Hat Enterprise Linux 6 Server as a monitored
machine. For the later version, please confirm our latest evaluation status.
SP2 is necessary for collecting performance data from Windows Server 2008
Standard/Enterprise x64 Hyper-V.
Windows Server 2008 R2 Standard Hyper-V (including SP1)
Windows Server 2008 R2 Enterprise Hyper-V (including SP1)
Guest OSes on VMware ESX/ESXi
Guest OSes on Citrix XenServer
Guest OSes on Hyper-V
Guest OSes on KVM
Note
Note
Note

6
1.3 Collected Performance Data
System Monitor - Performance Monitoring Services periodically collects performance data from the monitored
machines. Collected Performance Indicators can be specified for each management server, for each group or for
each machine. If they are specified for a management server, they are shared with all monitored machines
that are monitoring targets of the management server.
1.3.1 Types of Performance Indicators and Collecting Intervals
The Performance Indicators consist of "Resource", "Performance index" and "Instance". "Resource" is the target
resource of the Performance Indicators, and includes CPU, physical disk and memory. "Performance index" is
the type of data collected, and indicates CPU usage and disk transfer rates. "Instance" identifies a particular
measurement object in situations where a resource contains multiple measurement objects. "Instance" is
unique to "Performance index". The settings for "Instance" cannot be changed. Up to 256 items of Performance
Indicators can be specified.
Performance data is collected from monitored machines at regular intervals. These intervals are called
"collecting intervals", and can be specified individually for each Performance Indicator item or collectively for
all Performance Indicator items.
Performance Indicators that have been configured to collect data, begin collecting from monitored machines
automatically when the Performance Monitoring Service starts.
7
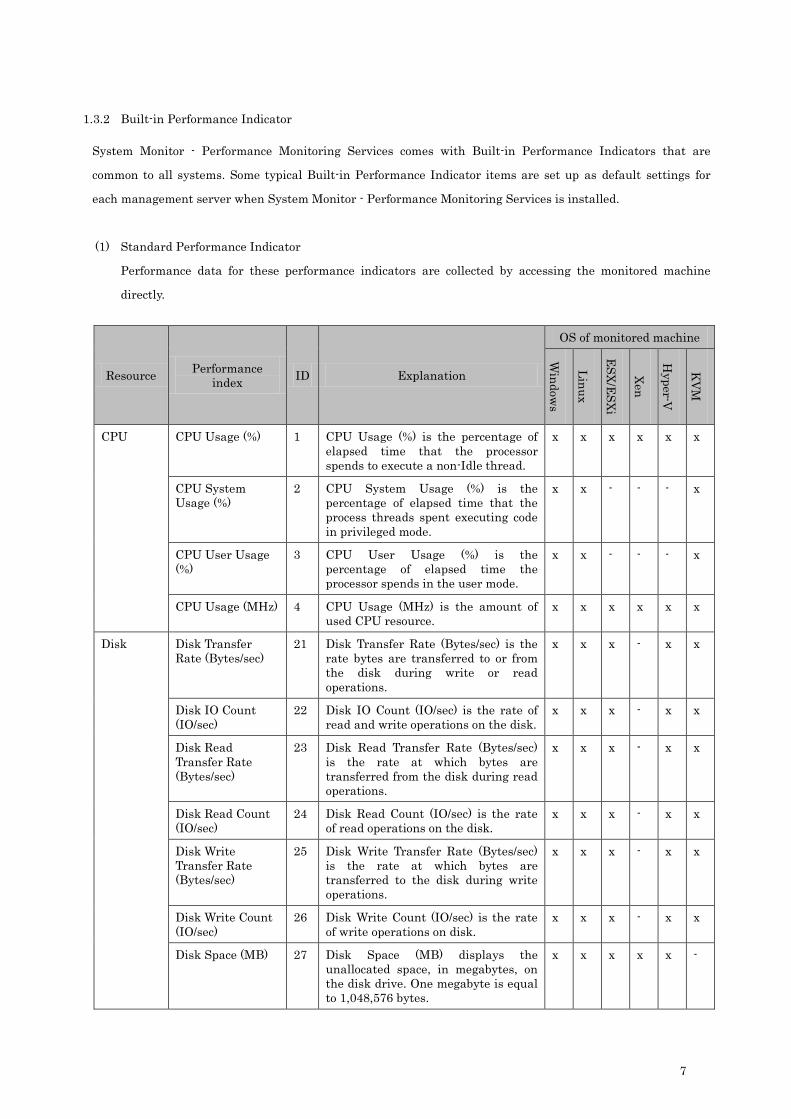
1.3.2 Built-in Performance Indicator
System Monitor - Performance Monitoring Services comes with Built-in Performance Indicators that are
common to all systems. Some typical Built-in Performance Indicator items are set up as default settings for
each management server when System Monitor - Performance Monitoring Services is installed.
(1) Standard Performance Indicator
Performance data for these performance indicators are collected by accessing the monitored machine
directly.
Resource Performance index ID Explanation
OS of monitored machine
Window
s
Linux
ESX/ESXi
Xen
Hyper-V
KVM
CPU CPU Usage (%) 1 CPU Usage (%) is the percentage of elapsed time that the processor spends to execute a non-Idle thread.
x x x x x x
CPU System Usage (%)
2 CPU System Usage (%) is the percentage of elapsed time that the process threads spent executing code in privileged mode.
x x - - - x
CPU User Usage (%)
3 CPU User Usage (%) is the percentage of elapsed time the processor spends in the user mode.
x x - - - x
CPU Usage (MHz) 4 CPU Usage (MHz) is the amount of used CPU resource.
x x x x x x
Disk Disk Transfer Rate (Bytes/sec)
21 Disk Transfer Rate (Bytes/sec) is the rate bytes are transferred to or from the disk during write or read operations.
x x x - x x
Disk IO Count (IO/sec)
22 Disk IO Count (IO/sec) is the rate of read and write operations on the disk.
x x x - x x
Disk Read Transfer Rate (Bytes/sec)
23 Disk Read Transfer Rate (Bytes/sec) is the rate at which bytes are transferred from the disk during read operations.
x x x - x x
Disk Read Count (IO/sec)
24 Disk Read Count (IO/sec) is the rate of read operations on the disk.
x x x - x x
Disk Write Transfer Rate (Bytes/sec)
25 Disk Write Transfer Rate (Bytes/sec) is the rate at which bytes are transferred to the disk during write operations.
x x x - x x
Disk Write Count (IO/sec)
26 Disk Write Count (IO/sec) is the rate of write operations on disk.
x x x - x x
Disk Space (MB) 27 Disk Space (MB) displays the unallocated space, in megabytes, on the disk drive. One megabyte is equal to 1,048,576 bytes.
x x x x x -

8
If the OS for the monitored machine is Windows 2000, users must activate
the "LogicalDisk" counters manually to collect this performance data. Enter
"diskperf -y" on the monitored machine and restart the monitored machine
after executing the command. Also, stop and restart the Performance
Monitoring Service.
CPU Usage (MHz) is available only for the physical machine whose
configuration information is applied from SystemProvisioning.
The performance data for disk resource of Hyper-V is not including the
performance data of CSV (Cluster Shared Volume).
When the "Dynamic Memory" feature of the monitored virtual machines on
Hyper-V is enabled, the amount of Physical Memory Space Ratio (%) for
these virtual machines may be incorrect.
Disk Space Ratio (%)
28 Disk Space Ratio (%) is the percentage of total usable space on the whole disk drive that was free.
x x x x x -
Network Network Packet Transfer Rate (Bytes/sec)
41 Network Packet Transfer Rate (Bytes/sec) is the rate at which data is transmitted and received across the all NICs.
x x x x x -
Network Packet Reception Rate (Bytes/sec)
42 Network Packet Reception Rate (Bytes/sec) is the rate at which data is received across the all NICs.
x x x x x -
Network Packet Transmission Rate (Bytes/sec)
43 Network Packet Transmission Rate (Bytes/sec) is the rate at which data is transmitted across the all NICs.
x x x x x -
Memory Physical Memory Space (MB)
61 Physical Memory Space (MB) is the amount of physical memory, in Megabytes, immediately available for allocation to a process or for system use.
x x x x x x
Physical Memory Space Ratio (%)
62 Physical Memory Space Ratio (%) is the percentage of the available memory size to the installed physical memory size.
x x x x x x
Note
Note
Note
Note
9
Physical Memory Space Ratio (%) for a monitored Windows/Hyper-V
machine is available only for the machine whose configuration information
is applied from SystemProvisioning.
The performance data collected from Citrix XenServer consists of data
obtained for several seconds immediately before the performance data is
collected.
(2) Performance Indicator for Virtual Machine
These are performance indicators only for a virtual machine.
If the monitored machine is a virtual machine running on a VMware ESX/ESXi, performance data for
these performance indicators are collected by accessing to the VMware ESX/ESXi on which the monitored
virtual machine is running. It is necessary that the virtual machine and the VMware ESX/ESXi are
monitored by the same management server. And it is also necessary that their configuration information
is applied from SystemProvisioning.
If the monitored machine is a virtual machine running on a Citrix XenServer, Hyper-V or KVM,
performance data for these performance indicators are collected by accessing to SystemProvisioning on
which the monitored virtual machine is managed. It is necessary that the configuration information of the
monitored virtual machines is applied from SystemProvisioning.
Resource Performance index ID Explanation
Virtualization Platform
ESX/ESXi
Xen
Hyper-V
KVM
CPU Guest CPU Usage (%)
11 Guest CPU Usage (%) is the percentage of the total CPU resource that actively used by the VM to the available CPU resource for the VM.
x x x x
Guest CPU Usage (MHz)
12 Guest CPU Usage (MHz) is the total CPU resource that actively used by the VM.
x x x -
Host CPU Usage (%)
13 Host CPU Usage (%) is the percentage of the VM server CPU resource that actively used by the VM to the total CPU resource of the VM server.
x - x -
Host CPU Usage (MHz)
14 Host CPU Usage (MHz) is the VM server CPU resource that actively used by the VM.
x - x -
Disk Guest Disk Transfer Rate (Bytes/sec)
31 Guest Disk Transfer Rate (Bytes/sec) is the rate at which data is transferred to or from the virtual disk on the VM during write or read operations.
x - x -
Note
Note

10
When the monitord machine is a virtual machine running on a VMware
ESX/ESXi and performance data for these performance indicators are
collected, it is necessary that the configuration information of the virtual
machine and the virtual machine server is applied from SystemProvisioning.
When the monitord machine is a virtual machine running on a VMware
ESX/ESXi and performance data for Guest Disk Usage (%) or Guest Disk
Usage (MB) is collected, it is necessary that VMware Tools is running on the
monitored virtual machine.
For collecting performance data for Guest Memory Usage (%) or Guest
Memory Usage (MB) from a virtual machine running on Hyper-V, it is
necessary to enable "Dynamic Memory" feature for the virtual machines.
Guest Disk Usage (MB)
37 Guest Disk Usage (MB) is the datastore size consumed by the VM. If the target VM is running on VMware ESX, this is the used space of the virtual disk allocated to the VM.
x x x x
Guest Disk Usage (%)
38 Guest Disk Usage (%) is the percentage of the datastore size consumed by the VM to the size of the allocated virtual disk. If the target VM is running on VMware ESX, this is the percentage of the used space of the virtual disk allocated to the VM.
x x x x
Network Guest Network Transfer Rate (Bytes/sec)
51 Guest Network Transfer Rate (Bytes/sec) is the rate at which data is transmitted and received across the all virtual NICs on the VM.
x - x -
Memory Guest Memory Usage (%)
71 Guest Memory Usage (%) is the percentage of the memory size used by the VM to the memory size allocated to the VM. If the target VM is running on VMware ESX, this is the percentage of the size of the VM server memory used actively by the VM.
x x x -
Guest Memory Usage (MB)
72 Guest Memory Usage (MB) is the memory size used by the VM. If the target VM is running on VMware ESX, this is the size of the VM server memory actively used by the VM.
x x x -
Host Memory Usage (%)
73 Host Memory Usage (%) is the percentage of the size of the VM server memory consumed for the VM to the total memory size of the VM server.
x x x -
Host Memory Usage (MB)
74 Host Memory Usage (MB) is the size of the VM server memory consumed for the VM.
x x x -
Note
Note
Note

11
The performance data for a virtual machine collected from Citrix XenServer,
Hyper-V or KVM consists of data obtained for several seconds immediately
before the performance data is collected.
(3) Performance Indicator for Physical Machine
These are performance indicators only for a physical machine.
It is necessary for collecting performance data for this indicator that the configuration information of the
monitored physical machine is applied from SystemProvisioning. And it is also necessary that the settings
for IPMI information about this machine are set on SystemProvisioning.
Resource Performance index ID Explanation
Power Supply Current Power (W) 101 Current Power (W) is the current power consumption of a physical machine.
1.3.3 Custom Performance Indicator
When an OS of the monitored machine is Windows, a performance indicator can be specified using "Category",
"Counter" and "Instance" like Windows Performance Console. Custom performance indicator can be specified
not only for Windows but also for other OSes. Custom performance indicator enables different settings to be
made depending on monitored machine's OS. The specifications for collecting the Performance Indicators set by
custom performance indicator are only valid for monitored machines where the appropriate OS information has
been specified.
1.3.4 Storing Data that has been Collected
System Monitor - Performance Monitoring Services automatically delete performance data after a certain
amount of time has passed. The storage period can be set between one day and 30000 days. The default value is
3 days.
Note
12
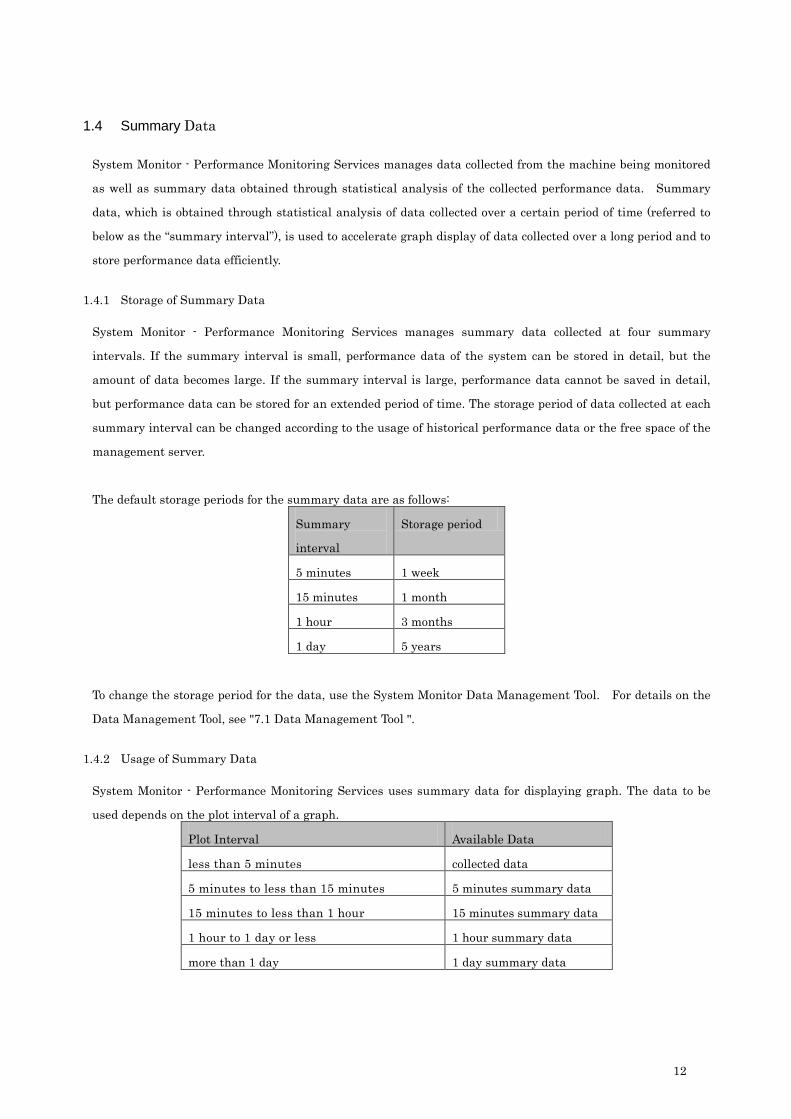
1.4 Summary Data
System Monitor - Performance Monitoring Services manages data collected from the machine being monitored
as well as summary data obtained through statistical analysis of the collected performance data. Summary
data, which is obtained through statistical analysis of data collected over a certain period of time (referred to
below as the “summary interval”), is used to accelerate graph display of data collected over a long period and to
store performance data efficiently.
1.4.1 Storage of Summary Data
System Monitor - Performance Monitoring Services manages summary data collected at four summary
intervals. If the summary interval is small, performance data of the system can be stored in detail, but the
amount of data becomes large. If the summary interval is large, performance data cannot be saved in detail,
but performance data can be stored for an extended period of time. The storage period of data collected at each
summary interval can be changed according to the usage of historical performance data or the free space of the
management server.
The default storage periods for the summary data are as follows:
Summary
interval
Storage period
5 minutes 1 week
15 minutes 1 month
1 hour 3 months
1 day 5 years
To change the storage period for the data, use the System Monitor Data Management Tool. For details on the
Data Management Tool, see "7.1 Data Management Tool ".
1.4.2 Usage of Summary Data
System Monitor - Performance Monitoring Services uses summary data for displaying graph. The data to be
used depends on the plot interval of a graph.
Plot Interval Available Data
less than 5 minutes collected data
5 minutes to less than 15 minutes 5 minutes summary data
15 minutes to less than 1 hour 15 minutes summary data
1 hour to 1 day or less 1 hour summary data
more than 1 day 1 day summary data

13
1.5 Data Management
1.5.1 Data Management Tool
Data Management Tool can be used to change the storage period for the performance data and summary data
or to summarize the data. The Data Management Tool can be used when:
• The storage period is to be extended to store performance data over a longer period.
• The storage period is to be reduced to save data storage space.
• Data summarization is performed to utilize the data used in the previous version as summary
data.
For details on the Data Management Tool, see "7.1 Data Management Tool ".
1.5.2 Database Size Monitoring Function
System Monitor - Performance Monitoring Services saves the performance data collected from the machine to
be monitored, as well as summary data that is obtained through summarization of the performance data in a
database. The database size monitoring function outputs a warning log to notify the user when the database
size exceeds the specified warning value. This function allows the user to be aware of the database engine
exceeding a given size, or the lack of free disk space on the management server.

14
1.6 Groups
System Monitor - Performance Monitoring Services can organize machines into groups and then monitor and
graph the performance status of each group. This makes it possible to track the performance status trends for
each group (for example, a group of machines with the same task) and for the entire system. When a
performance problem (such as high load) occurs, it is possible to work out which machine is the cause of the
problem by switching from group-level view to machine-level view.
System Monitor - Performance Monitoring Services expresses grouping units as nodes. There are three types of
nodes: the management server node (management server), group nodes (groups), and machine nodes
(machines). Machine nodes represent individual machines that have not been grouped.
Groups can be created out of any combination of machines, except that each machine can only belong to one
group. If configuration is to be synchronized with SystemProvisioning, then the approach to grouping machines
depends on SystemProvisioning. See "1.10 The SystemProvisioning Linkage Function" for information on
applying SystemProvisioning configuration information.

15
Specify IPv4 address as an IP address when you specify the IP address for
the monitored machine. When you specify a machine name, IP address has
to be resolved as an IPv4 address.
Take care especially if the OS of the management server is Windows Server
2008 because IPv6 is enabled defaultly.
1.7 Connecting to Monitored Machines
The following section provides general notes about the connection settings for the monitored machines.
To collect performance data for "Standard Performance Indicator", specify IP address, machine name and
access account of the monitored machine on System Monitor - Performance Monitoring Services because the
monitored machine is directly accessed for collecting performance data. For collecting performance data only
for "Performance Indicator for Virtual Machine" or "Performance Indicator for Physical Machine", the note
shown below is not necessary to be considered because these settings need to be applied from
SystemProvisioning and the monitored machine is not directly accessed for collecting performance data. For
the type of performance indicator, see "1.3 Collected Performance Data".
1.7.1 Specifications for Monitored Machines
Specify the IP Address (Optional) and the Machine Name (required) of the monitored machine. These are used
according to the following rules.
(1) When the IP address is set, System Monitor - Performance Monitoring Services accesses the monitored
machines using the specified IP address.
(2) When the IP address is not set, System Monitor - Performance Monitoring Services accesses the monitored
machines using the machine name.
When an IP address of the monitored machines is not specified using the System Monitor - Performance
Monitoring Services Management Console, the machine name is used to access the monitored machine. The
machine name is resolved to an IP address by the Management Server automatically. An access error results
when it cannot be converted to an IP address. To enable name resolution, you must register the machine name
in DNS or the management server hosts file. Specifically, when the monitored machine OS is Linux, VMware
ESX/ESXi, Citrix XenServer or KVM, the machine name is not resolved by default.
See “Adding Machines” and “Adding Groups” in “4.1.1 Specifications in the Navigation Tree Window” for
specifying machine names and IP addresses with System Monitor - Performance Monitoring Services.
Note
16
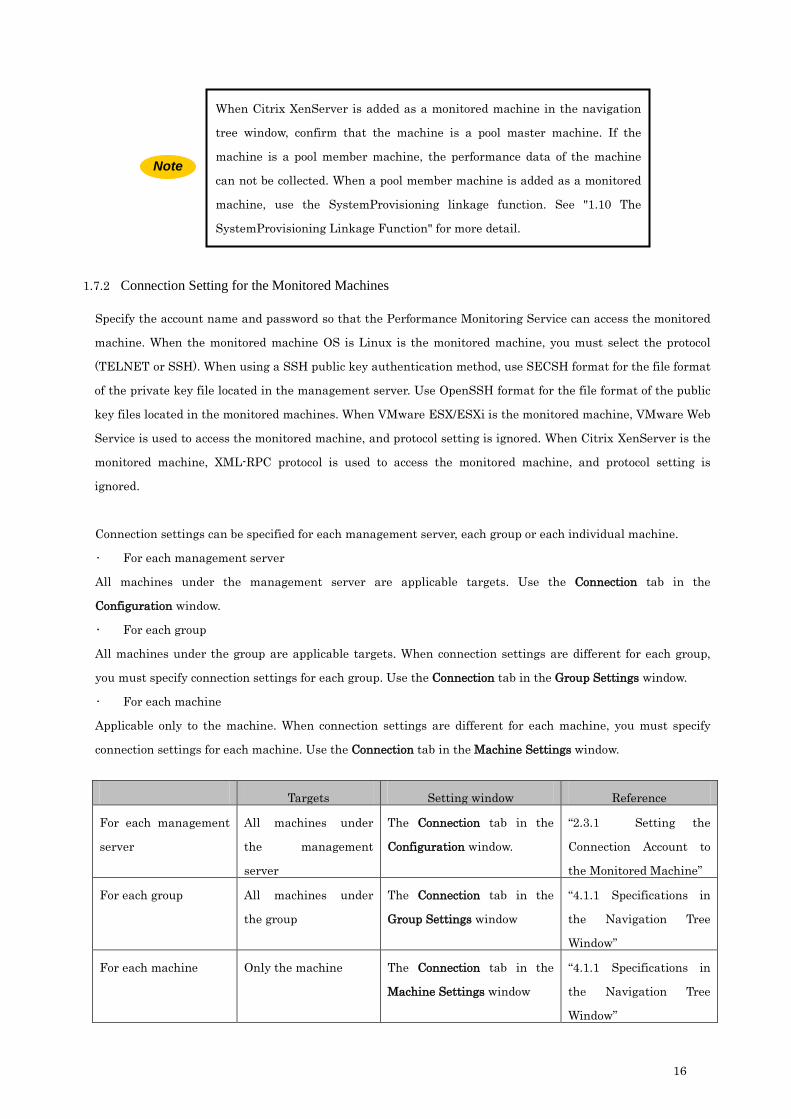
When Citrix XenServer is added as a monitored machine in the navigation
tree window, confirm that the machine is a pool master machine. If the
machine is a pool member machine, the performance data of the machine
can not be collected. When a pool member machine is added as a monitored
machine, use the SystemProvisioning linkage function. See "1.10 The
SystemProvisioning Linkage Function" for more detail.
1.7.2 Connection Setting for the Monitored Machines
Specify the account name and password so that the Performance Monitoring Service can access the monitored
machine. When the monitored machine OS is Linux is the monitored machine, you must select the protocol
(TELNET or SSH). When using a SSH public key authentication method, use SECSH format for the file format
of the private key file located in the management server. Use OpenSSH format for the file format of the public
key files located in the monitored machines. When VMware ESX/ESXi is the monitored machine, VMware Web
Service is used to access the monitored machine, and protocol setting is ignored. When Citrix XenServer is the
monitored machine, XML-RPC protocol is used to access the monitored machine, and protocol setting is
ignored.
Connection settings can be specified for each management server, each group or each individual machine.
• For each management server
All machines under the management server are applicable targets. Use the Connection tab in the
Configuration window.
• For each group
All machines under the group are applicable targets. When connection settings are different for each group,
you must specify connection settings for each group. Use the Connection tab in the Group Settings window.
• For each machine
Applicable only to the machine. When connection settings are different for each machine, you must specify
connection settings for each machine. Use the Connection tab in the Machine Settings window.
Targets Setting window Reference
For each management
server
All machines under
the management
server
The Connection tab in the
Configuration window.
“2.3.1 Setting the
Connection Account to
the Monitored Machine”
For each group All machines under
the group
The Connection tab in the
Group Settings window
“4.1.1 Specifications in
the Navigation Tree
Window”
For each machine Only the machine The Connection tab in the
Machine Settings window
“4.1.1 Specifications in
the Navigation Tree
Window”
Note
17
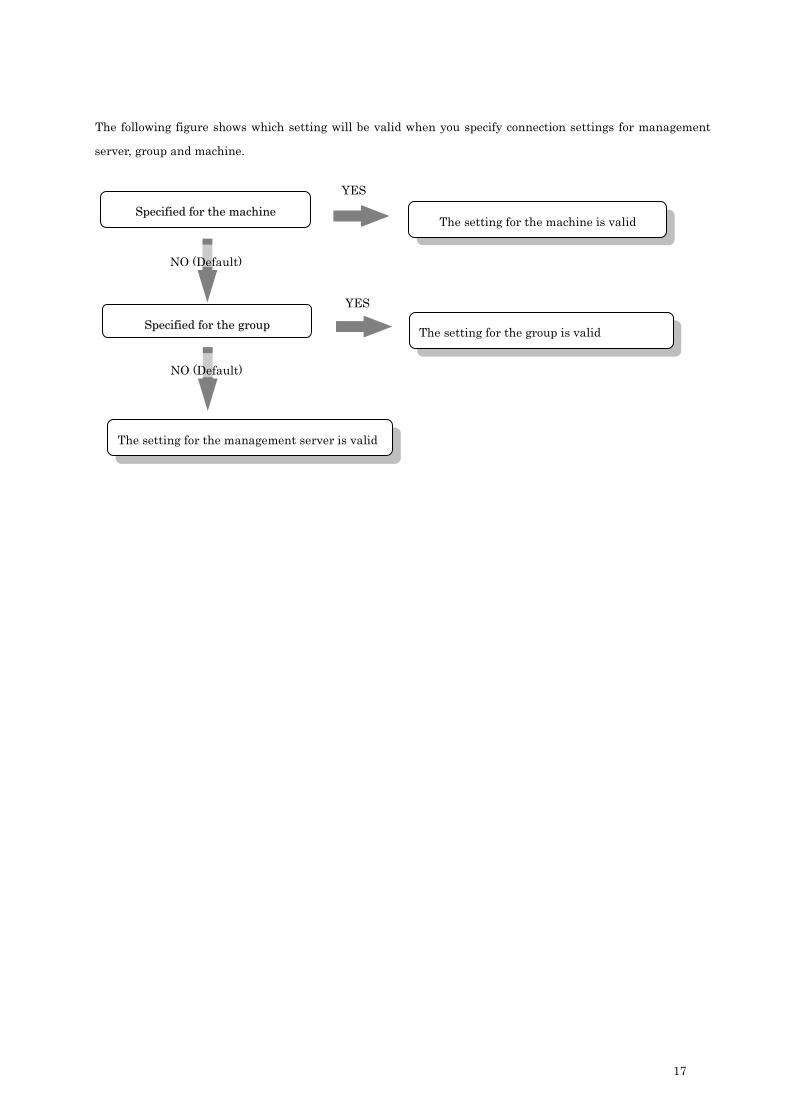
The following figure shows which setting will be valid when you specify connection settings for management
server, group and machine.
The setting for the management server is valid
The setting for the machine is valid
The setting for the group is valid
SSppeecciiffiieedd ffoorr tthhee mmaacchhiinnee
SSppeecciiffiieedd ffoorr tthhee ggrroouupp
YES
YES
NO (Default)
NO (Default)

18
To collect performance data using the Performance Monitor Users group
account, install .NET Framework 2.0 SP1 or later on the management
server.
1.7.3 Settings on the Monitored Machine
You must make the following settings on the monitored machine for System Monitor - Performance Monitoring
Services to connect to the monitored machines.
Windows
• For monitored machines running Windows, the following settings must be made on the monitored machines:
♦ Set the account name and password as specified with connection settings. The connection account must
belong to the Administrators group or Performance Monitor Users group of the monitored machine.
User privilege
Administrators
Group
Performance
Monitor
Users Group
Target OS Type Windows Xp x -
Windows Vista x x
Windows 7 x x
Windows 2000 Server x -
Windows Server 2003 x x
Windows Server 2008 x x
♦ Local Security Policy: When the monitored machine OS is Windows Vista, Windows 7 or Windows Server
2008 and an Administrators group account is used for the access account for a target machine, perform the
following steps. This setting is not necessary if a domain user is used.
1. Start the Local Security Policy using the Administrative Tools in Control Panel
2. The Local Security Settings are appeared. Select Security Options of Local Policies from the tree on
the left side.
3. When the built-in Administrator is used;
Display the properties by double-clicking User Account Control: Admin Approval Mode for the Built-
in Administrator account.
When an Administrators group account other than the built-in Administrator is used;
Display the properties by double-clicking User Account Control: Run all administrators in Admin
Approval Mode.
4. Select Disabled and then Click OK.
Note

19
♦ Local Security Policy: When the monitored machine OS is Windows XP, perform the following steps.
1. Start the Local Security Policy using the Administrative Tools in Control Panel
2. The Local Security Settings are appeared. Select Security Options of Local Policies from the tree on
the left side.
3. Display the properties by double-clicking Network access: Sharing and security model for local
accounts.
4. Select Classic – local users authenticate as themselves and then Click OK.
♦ Service: Start the following services on the monitored machines.
• Remote Registry
• Server
Perform the following steps.
1. Start Services using Administrative Tools in the Control Panel.
2. A list of the services is appeared. Select the service display name described above and then double-
click to open.
3. Set Startup type in General tab to Automatic.
♦ Firewall: When the Windows Firewall on the monitored machine is enabled, set the exceptions for
Windows Firewall using the following steps.
1. Start Windows Firewall in the Control Panel.
2. Select the Exceptions tab in the Windows Firewall window.
3. Check File and Printer Sharing.
If Windows 7 or Windows Server 2008 is the monitored machine, enable the rules shown below on Windows
Firewall settings.
• File and Printer Sharing (NB-Name-In)
• File and Printer Sharing (NB-Session-In)
• File and Printer Sharing (SMB-In)
♦ Power Options: Set not to go to sleep mode or standby mode automatically. If a monitored machine goes to
these modes, the performance data from this machine may not be collected.
Linux/KVM
• For monitored machines that are running Linux or KVM is the monitored machine, the following settings
must be made on the monitored machines:
♦ Set the account name and password as specified with connection settings.
♦ The following settings must be made according to the connection method used.
• When using TELNET to connect, install a TELNET server on each monitored machine and then enable
the service. When a firewall has been setup, exempt TELNET communications from firewall blocking.
• When using SSH to connect, enable SSH on each monitored machine. When a firewall has been setup,
exempt SSH communications from firewall blocking. If a public key authentification is used, then
prepare the public key on the monitored machine.

20
VMware ESX/ESXi
• If VMware ESX/ESXi is the monitored machine, the following settings must be made on the monitored
machines:
♦ Set the account name and password as specified with connection settings.
♦ Assign a role other than "No Access" to the connection account using Virtual Infrastructure Client.
♦ VMware Web Service is used to access the monitored machine. When a firewall has been set up, exempt
SSL communications from firewall blocking.
♦ VMware Web Service is used to access the monitored machine, and protocol setting is ignored.
Citrix XenServer
• If Citrix XenServer is the monitored machine, the following settings must be made on the monitored
machines:
♦ Set the account name and password as specified with connection settings.
♦ When a firewall has been set up, exempt SSL communications from firewall blocking.
♦ XML-RPC protocol is used to access the monitored machine, and protocol setting is ignored.
1.7.4 Ports Used between Management Servers and Monitored Machines
The following ports are used for communications between the management server and monitored machines.
Management Servers Protocol Monitored Machines Explanation
assigned
automatically
TCP NetBIOS over TCP/IP
(139)
Direct Hosting SMB
Service (445)
Used when Windows performance
data is collected.
UDP NetBIOS over TCP/IP
(137)
assigned
automatically
TCP TELNET (23) Used when Linux/KVM performance
data is collected using TELNET.
assigned
automatically
TCP SSH (22) Used when Linux/KVM performance
data is collected using SSH.
assigned
automatically
TCP SSL (443) Used when Citrix XenServer/VMware
ESX/ESXi performance data is
collected.

21
1.8 Displaying Performance Status and CSV File Output
System Monitor - Performance Monitoring Services displays performance data for the system graphically.
Displaying performance data graphically enables trends to be identified intuitively, and makes it easier to
analyze the operational status of the system.
Graphs of performance status information can be displayed for each group or for each individual machine.
Performance data is displayed as statistically calculated values. You can also output performance data in the
graph display on the management console to a CSV file or a TEXT file.
In addition to the feature of the management console shown above, there is a command line feature to output
performance data.
1.8.1 Statistics
"Statistics" are the statistical methods that are used to calculate the performance data collected during the
plot interval when performance data is graphed.
• Maximum value: shows the maximum value.
• Average value + standard deviation:shows the relationship between the average value and the degree of
scattering for all data.
• Average value: shows the average value.
• Average value - standard deviation: shows the relationship between the average value and the degree of
scattering for all data.
• Minimum value: shows the minimum value.
• Weighted average value: shows the average value when weights that have been set up for
monitored machines are applied to the data that has been collected.
This method is effective when checking the performance status of
groups that are made up of machines with different specifications.
Weights can be specified for each monitored machine, from 0.0 to 10000.0. For example, suppose there is a
group that includes machines with different numbers of CPUs. If these machines are compared using the same
performance index, machines with more CPUs are displayed as having lower usage rates even if the work load
is the same. In this kind of situation, the processing ability of the group can be expressed more accurately by
weighting machines according to the number of CPUs that they have. See Appendix A, "How performance
values for groups are calculated" for guidelines on weightings.

22
1.8.2 Displaying Formats for Performance Status Graphs
System Monitor - Performance Monitoring Services displays Performance Indicators using three different
graph formats, as described below.
(1) Node Comparison Display
In this format, the performance status for a particular Performance Indicator item and a particular
statistic are displayed for each node. This format is valid for situations such as comparing groups or
checking whether there is anything unusual about the performance status of a particular machine in a
certain group, in terms of, for example, the average values for CPU usage.
Figure 1-1: Displaying the Performance Status of Each Group

23
Figure 1-2: Displaying the Performance Status of a Group and a Particular Machine within the Group
24
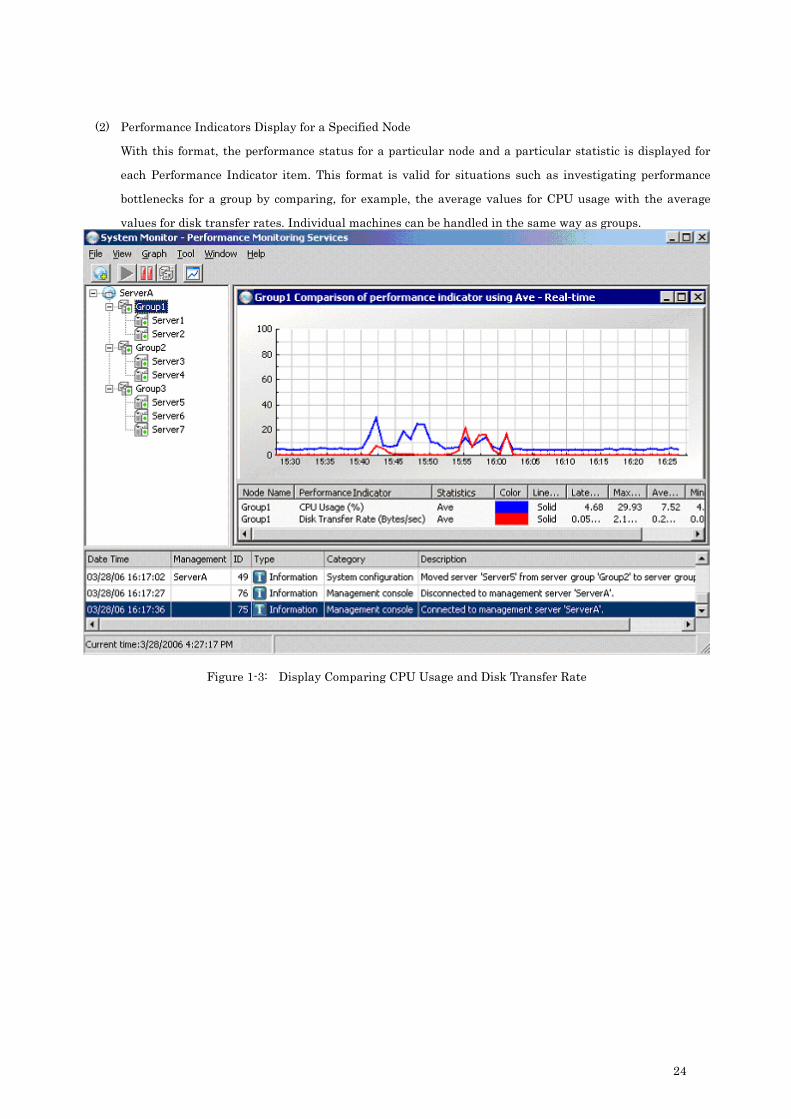
(2) Performance Indicators Display for a Specified Node
With this format, the performance status for a particular node and a particular statistic is displayed for
each Performance Indicator item. This format is valid for situations such as investigating performance
bottlenecks for a group by comparing, for example, the average values for CPU usage with the average
values for disk transfer rates. Individual machines can be handled in the same way as groups.
Figure 1-3: Display Comparing CPU Usage and Disk Transfer Rate
25
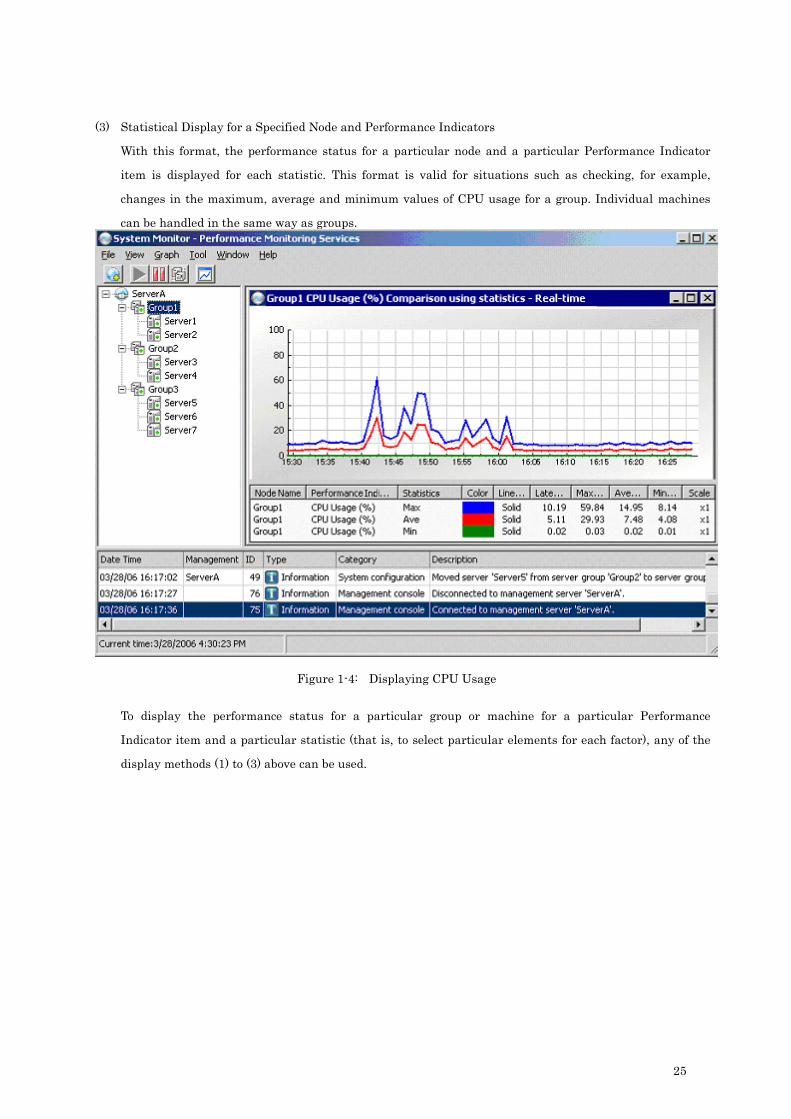
(3) Statistical Display for a Specified Node and Performance Indicators
With this format, the performance status for a particular node and a particular Performance Indicator
item is displayed for each statistic. This format is valid for situations such as checking, for example,
changes in the maximum, average and minimum values of CPU usage for a group. Individual machines
can be handled in the same way as groups.
Figure 1-4: Displaying CPU Usage
To display the performance status for a particular group or machine for a particular Performance
Indicator item and a particular statistic (that is, to select particular elements for each factor), any of the
display methods (1) to (3) above can be used.
26
With real-time displays, if performance data for the server being displayed
cannot be collected within the collecting interval, data will not be displayed
on the graph for the section where data has not been collected. The same
applies if the performance status is displayed for a management server or a
server group that includes a server for which performance data could not be
collected.
If performance data cannot be collected within the collecting interval three
times in a row, the server is regarded as having error status, and the graph
will not be displayed until the error status is recovered. For graphs of server
groups that include a server with error status, the performance status for
the remaining normal servers is displayed.
1.8.3 Graph Display Periods
System Monitor - Performance Monitoring Services graphical displays can display performance status
information in real time or historical information for data that has been collected in the past.
(1) Realtime Display
Display the latest performance status information for a specified display period from the present time.
The graph is updated according to specified update interval. This kind of display is suitable for situations
where the current performance status needs to be checked in real time.
(2) Historical Display
Display the performance status for a specified period from a specified starting time. The graph is not
updated periodically. This kind of display is suitable for situations where the past performance status
needs to be checked.
Note
Note
27
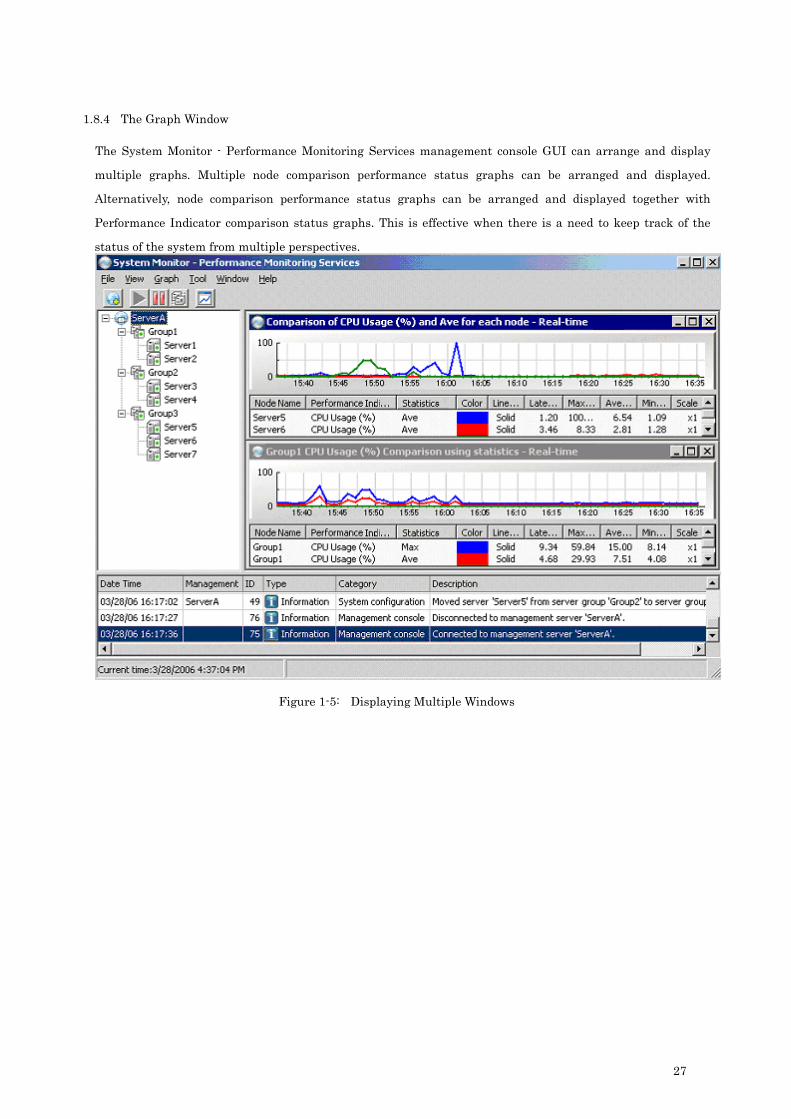
1.8.4 The Graph Window
The System Monitor - Performance Monitoring Services management console GUI can arrange and display
multiple graphs. Multiple node comparison performance status graphs can be arranged and displayed.
Alternatively, node comparison performance status graphs can be arranged and displayed together with
Performance Indicator comparison status graphs. This is effective when there is a need to keep track of the
status of the system from multiple perspectives.
Figure 1-5: Displaying Multiple Windows

28
For Windows XP and Windows Server 2003, set with Language of non-
Unicode programs in Advanced tab of Regional and Language Options from
Control Panel. Normally, ANSI is used for English and Shift-JIS is used for
Japanese.
1.8.5 Output Graph Data to File
You can output performance data displayed in the graph window to an external file such as CSV with System
Monitor - Performance Monitoring Services.
Files are output in the following formats.
Line 1 Summary
Line 2 “Time” Column Name Column Name …
Line 3 Time Data Value Data Value …
… Time Data Value Data Value …
… … … … …
File summary is output to Line 1, performance data explanatory headings are output to Line 2, and time
(Column 1) and performance data (from Column 2 onwards) are output from Line 3 onwards. Data start time,
data end time, data time period, target node name, performance indicator title and statistical method name
are output for summaries. For column names, type names of a comparative perspective are output according
to the graph type specified from among node names, performance data names and statistical method names as
names identifying performance data of identical rows from Row 3 onwards. For time, time axis values of each
point plotted on the graph are output. Vertical axis values of points plotted on the displayed graph are output
for data values.
The column separator and encode format of output characters are as shown below according to the file type
specified at file output.
Specified File Type Column Separator Encode Format of Output
Characters
CSV (Separated by Comma) Comma System default (current) encode
Text (Separated by Tab) Tab System default (current) encode
UTF-8 Text (Separated by
Tab)
Tab UTF-8
1.8.6 Output Data Using Command Line Tool
The ssc-perf command can display the performance data collected by System Monitor - Performance Monitoring
Services on the command prompt. See "8.1 ssc-perf Command" about the ssc-perf command.
Note

29
1.9 Threshold Monitoring and the Notification Function
System Monitor - Performance Monitoring Services can detect and report load status errors with monitored
machines by monitoring thresholds for the performance data that is collected. Performance fault events can
also be notified to SystemProvisioning 5.
Thresholds can be set up for Performance Indicators that are currently being collected, both for groups and for
individual machines.
1.9.1 Types of Thresholds
The following four types of thresholds can be set up for a single item of Performance Indicator that is subject to
threshold monitoring. More than one type of threshold can be selected.
• Upper-limit critical value: the status is regarded as "critical" if the target performance data
exceeds this value.
• Upper-limit warning value: the status is regarded as "warning" if the target performance data
exceeds this value.
• Lower-limit critical value: the status is regarded as "critical" if the target performance data drops
below this value.
• Lower-limit warning value: the status is regarded as "warning" if the target performance data
drops below this value.
These values must meet the following relationship:
(Lower-limit critical value) < (Lower-limit warning value) < (Upper-limit warning value) < (Upper-limit critical
value)
1.9.2 Units of Threshold Monitoring
Thresholds can be set up for the following units.
Monitoring unit Explanation
Machine Threshold monitoring is performed for the specified machine.
Group Threshold monitoring is performed for the specified group. Performance data for the group (produced by statistically processing the performance data for all of the machines in the group) is used as the monitoring target.
All machines in group
Threshold monitoring is performed for each machine in the specified group. The Performance Indicator that is subject to threshold monitoring is the same for all machines in the group, but the threshold monitor monitors the performance data for each machine separately.
1.9.3 Performance Indicators Subject to Threshold Monitoring
Performance Indicators that are currently being collected can be set to be subject to threshold monitoring. If
the monitoring unit is "group", the statistic must also be specified.

30
1.9.4 Notification Actions at Over-Threshold
The following actions can be performed at over-threshold:
Write an event to the event log: This is the default behavior. This cannot be changed.
Display in the navigation tree: Uses an icon to display the status of the machine or group in the over-
threshold status. This is the default behavior. This cannot be changed.
Display in the Log window: This is the default behavior. This cannot be changed.
Notify SystemProvisioning: SystemProvisioning can be notified at over-threshold and at recovery. For
notification, set customized notification category to notice. Set actions for
customized notification category using the SystemProvisioning policy. See
"1.10.5 Notifying Performance Abnormalities" for information on
customized notification categories.
In order to distinguish between temporary load states and ongoing load states, it is also possible to configure
the extent or number of over-threshold alert until the load state is considered "critical". The parameters specify
the number of times the load state is checked. You can configure the parameters to define how many instances
of over-thresholds before an abnormality is reported. By default, an abnormality is reported if over-threshold is
found ten times out of ten checks. The check interval is the same as the data collecting interval.
You can also configure the amount of time before another report is made if the over-threshold status has not
improved. By default, another report is made every 30 checks.

31
Example 1: Judging Over-Threshold Status
This example shows how over-threshold status is judged when over-threshold status has been set as four
threshold crossings out of five checks for upper-limit threshold monitoring. Data is ordered in time from left to
right, so that the most recent data is at the far right. In this example, at the point when the data at the far
right is collected, threshold crossings have been verified for four of the last five checks, and so the status is
judged to be "over-threshold" and the action that has been set up by the user is executed.
4/5
Status judged as "over-threshold"
Threshold Data over the threshold Data under the threshold
1/5 1/5 1/5 1/5 2/5 3/5 2/5 2/5 Count:

32
Example 2: Judging Recovery from Over-Threshold Status
This example shows how recovery from over-threshold status is judged when over-threshold status has been
set as four threshold crossings out of five checks for upper-limit threshold monitoring. In the same way as for
when over-threshold status is judged, at the point when the data at the far right is acquired, performance data
has been verified as being under the threshold for four of the last five checks, and so the status is judged to
have recovered from over-threshold status. Threshold checks for determining recovery from over-threshold
status start counting from the next performance data after the data for which over-threshold status was
decided.
4/5
Status judged as having recovered from over-threshold status
0/5 0/5 1/5 1/5 2/5 3/5 2/5 3/5
Threshold Data over the threshold Data under the threshold
Count:
Example 3: Judging that Over-Threshold Status Continues
The specified notification action can be executed again if recovery from over-threshold status cannot be
recognized within the specified period (number of checks) from when the over-threshold status was first
verified.
Monitoring for over-threshold status
Monitoring for recovery from over-threshold status
Notification Repeat notification
If recovery is not recognized within the specified number of checks since the last notification, a notification with the same content will be made again.
Data over the threshold Data under the threshold

33
1.10 The SystemProvisioning Linkage Function
System Monitor - Performance Monitoring Services has functions that link to SystemProvisioning by applying
system configuration information from SystemProvisioning and notifying performance abnormalities to
SystemProvisioning.
1.10.1 System Configuration
The system configuration for System Monitor - Performance Monitoring Services and SystemProvisioning is as
follows. During the applying process for system configuration information, the System Monitor - Performance
Monitoring Services performance monitoring service acquires configuration information from
SystemProvisioning and applies this to the configuration information for System Monitor - Performance
Monitoring Services. When performance abnormalities occur, an event is notified to SystemProvisioning. The
Performance Monitoring Service and SystemProvisioning do not have to be on the same management server.
1.10.2 Necessary Settings for Applying System Configuration Information and Applied Settings
SystemProvisioning configuration information can be applied to System Monitor - Performance Monitoring
Services. For applying SystemProvisioning configuration information to System Monitor - Performance
Monitoring Services, it is necessary to set mapping settings of their configuration information. There are two
Management server
System Monitor - Performance
Monitoring Services Management
console
Collecting performance data
Saving performance data
System Monitor - Performance Monitoring Services Performance Monitoring Service
Displaying graphs
Making settings
Monitored machines
SystemProvisioning
Notifying performance abnormalities
Applying system configurations

34
ways to set mapping settings.
(1) Setting on Group Settings with System Monitor - Performance Monitoring Services
Specify the corresponding SystemProvisioning configuration full path to the group/model on the group
settings of System Monitor - Performance Monitoring Services. At the timing of applying configuration
information of SystemProvisioning, the configuration information of the managed machines in the specified
SystemProvisioning group or model shown below is applied to the configuration information of System
Monitor - Performance Monitoring Services.
・ Machine name
・ IP address
・ OS information
・ Machine status (normal or error status)
Account settings and collecting data settings have to be specified on System Monitor - Performance
Monitoring Services. Because the collecting data settings are specified on the Collecting Data Setting List
dialog box of System Monitor Management Console, finer settings for each node are possible. For the
Collecting Data Setting List dialog box, see "4.2.2 How to Specify Collecting Data Settings".
(2) Setting on Performance Monitor Settings with SystemProvisioning
Specify the performance monitoring settings on the group/model property of SystemProvisioning. At the
timing of applying configuration information of SystemProvisioning, the corresponding group, whose
"Performance Data Collection Settings" has been enabled on the property of SystemProvisioning
group/model settings, is added automatically on System Monitor - Performance Monitoring Services and the
configuration information of the managed machines in the specified SystemProvisioning group or model
shown below is applied to the configuration information of System Monitor - Performance Monitoring
Services.
・ Machine name
・ IP address
・ OS information
・ Machine status (normal or error status)
・ Account information
・ Collecting Data settings (Monitoring Profile)
System Monitor - Performance Monitoring Services acquires the account settings and the monitoring profile
settings (collecting data settings) from the Performance Monitor settings of the group or model property of
SystemProvisioning and applies automatically to its own group settings. The collecting data settings
applied from SystemProvisioning cannot be specified flexibly because the monitoring profile is not editable
with System Monitor - Performance Monitoring Services. But collecting performance data on System
Monitor - Performance Monitoring Services can be started more easily and automatically without using
System Monitor Management Console when SystemProvisioning and System Monitor - Performance
Monitoring Services are configured on the same management server. For the default settings of the
35
Specify IPv4 address as an IP address when you specify the IP address for
the monitored machine. When you specify a machine name, IP address has
to be resolved as an IPv4 address.
Take care especially if the OS of the management server is Windows Server
2008 because IPv6 is enabled defaultly.
monitoring profile, see "Appendix" of SigmaSystemCenter Configuration Guide. A collecting data setting
specified in a monitoring profile is not editable via the System Monitor Management Console. But via ssc
command, it can be done. See SigmaSystemCenter SSC Command Reference for details on ssc command. It
is possible to configure collecting data settings other than the settings specified in the monitoring profile
with the Collecting Data Setting List dialog box of System Monitor Management Console.
An access account can be configured on the Performance Monitor settings of SystemProvisioning and on the
Connection settings of System Monitor - Performance Monitoring Service. You can select which account is
used as an access account via the System Monitor Management Console. See "4.1 Specifications for
Monitored Machines" for details on how to configure this setting.
System Monitor - Performance Monitoring Services uses the Management IP address already set up using
SystemProvisioning to connect to the target machines. Specify the Management IP address in the Host Setting
window with the SigmaSystemCenter Web Console. When the Management IP address is not specified, System
Monitor - Performance Monitoring Services uses the machine name to connect to the target machines. Make
settings so that monitored machines can be accessed with their machine names.
1.10.3 Timing of Applying of Configuration Information
The system configuration information of SystemProvisioning can be applied manually or automatically. Using
the automatic applying function, System Monitor - Performance Monitoring Services communicates with
SystemProvisioning at regular intervals, and automatically updates any changes to the configuration
information. By default, communication with SystemProvisioning is performed every 10 minutes to
automatically apply the configuration information.
Note

36
1.10.4 Rules for Applying Configuration Information
If the specified group/model exists in the SystemProvisioning configuration information, changes such as
machine additions and changes to the operational states of machines are applied. If the specified group/model
does not exist, an error will be noticed and configuration information of this group will not be applied.
Configuration information comparison
(whether machines exist) Content applied to System Monitor -
Performance Monitoring Services Notes
SystemProvisioning group/model
Operational state
System Monitor - Performance Monitoring
Services group
Machine added or machine deleted
Performance data
collecting operation
Exists Normal Does not exist Machine added Started Servers that only exist in the configuration information for SystemProvisioning
Error Stopped
Exists Normal Exists No change Started Servers in the configuration information for both products Error Stopped
Does not exist - Exists Machine deleted Stopped Machines that only exist in the configuration information for System Monitor - Performance Monitoring Services
The operational states for machines with SystemProvisioning are as follows: Normal The state of machines that meet all of the following conditions for display in SigmaSystemCenter
Web Console:
Power Status: "On"
OS Status: "On"
Executing Status: Excluding "Executing"
Error All other states
In applying configuration information of SystemProvisioning, a performance data collecting operation for the machine
which is in a normal state will be still pausing when the collecting status for the machine has already been
changed to paused status manually.
The information of machine status, hardware status and machine type applied from SystemProvisioning
configuration is shown in the Summary tab on the Machine Settings window.
See "10.4 Notes on Linking to SystemProvisioning" for information on the
SystemProvisioning configuration information applying function. Note

37
1.10.5 Notifying Performance Abnormalities
Load status abnormalities with monitored machines that are detected by System Monitor - Performance
Monitoring Services's threshold monitoring can be notified to SystemProvisioning. SystemProvisioning
receives these notifications and executes actions (such as adding machines) according to its policies.
Notifications can be made at over-threshold and at recovery. For notification, set customized notification
category to notice. As actions according to policy cannot be set for SystemProvisioning category groups, when
category groups are assigned to System Monitor - Performance Monitoring Services, they are disabled even
when threshold definitions are set for groups. To link the recovery process to threshold monitoring, assign the
SystemProvisioning groups or subgroups to groups of System Monitor - Performance Monitoring Services.
(1) Customized Notification Categories
"Customized notification categories" are the different classifications for associating the System Monitor -
Performance Monitoring Services events that are sent when over-threshold conditions occur with the
SystemProvisioning recovery processes that are triggered by these events. There are two customized
notification categories, depending on the nature of the SystemProvisioning recovery process: a notification
category for machines, and a notification category for groups. With the "machine" notification category,
recovery processes for individual machines can be set up, such as "shut down", "reboot", "replace" and so
on. With the "group" notification category, recovery processes for groups can be set up, such as "add
machine" or "delete machine" and so on.
When the threshold method is used with target nodes, the threshold method for which the "group"
customized notification category has been set cannot be associated with machine nodes. Similarly, the
threshold method for which the "machine" customized notification category has been set cannot be
associated with group nodes.
Note also that customized notification categories can also be used from other components, and so uses may
overlap if SystemProvisioning receives notifications from more than one component.
As actions according to policy cannot be set for SystemProvisioning category groups, when category group
is allocated to System Monitor - Performance Monitoring Services group, they are invalid even if threshold
definitions are set for groups. To set the recovery process linked to threshold monitoring, assign
SystemProvisioning groups or subgroups as groups of System Monitor - Performance Monitoring Services.
38
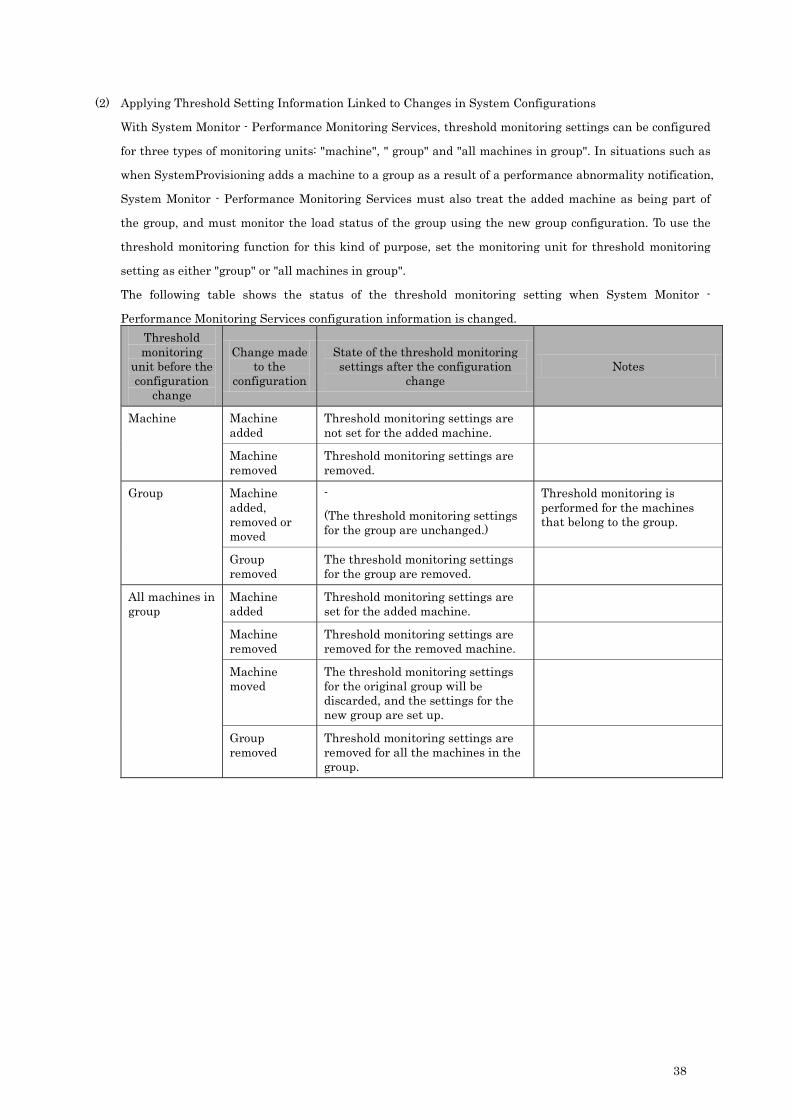
(2) Applying Threshold Setting Information Linked to Changes in System Configurations
With System Monitor - Performance Monitoring Services, threshold monitoring settings can be configured
for three types of monitoring units: "machine", " group" and "all machines in group". In situations such as
when SystemProvisioning adds a machine to a group as a result of a performance abnormality notification,
System Monitor - Performance Monitoring Services must also treat the added machine as being part of
the group, and must monitor the load status of the group using the new group configuration. To use the
threshold monitoring function for this kind of purpose, set the monitoring unit for threshold monitoring
setting as either "group" or "all machines in group".
The following table shows the status of the threshold monitoring setting when System Monitor -
Performance Monitoring Services configuration information is changed. Threshold monitoring
unit before the configuration
change
Change made to the
configuration
State of the threshold monitoring settings after the configuration
change Notes
Machine Machine added
Threshold monitoring settings are not set for the added machine.
Machine removed
Threshold monitoring settings are removed.
Group
Machine added, removed or moved
-
(The threshold monitoring settings for the group are unchanged.)
Threshold monitoring is performed for the machines that belong to the group.
Group removed
The threshold monitoring settings for the group are removed.
All machines in group
Machine added
Threshold monitoring settings are set for the added machine.
Machine removed
Threshold monitoring settings are removed for the removed machine.
Machine moved
The threshold monitoring settings for the original group will be discarded, and the settings for the new group are set up.
Group removed
Threshold monitoring settings are removed for all the machines in the group.
39
(3) Operational Notes
Warnings and abnormalities may occur at the same time if the values set for abnormality and warning
thresholds are very close, or if the load status changes suddenly. With SystemProvisioning, configurations
can change automatically due to such processes as fault recovery, and during the configuration change,
the performance status may change to an unexpected high load. A high load may also be detected again
before the machine addition is completed. Conduct thorough operational planning before linking to
SystemProvisioning configuration change processing.
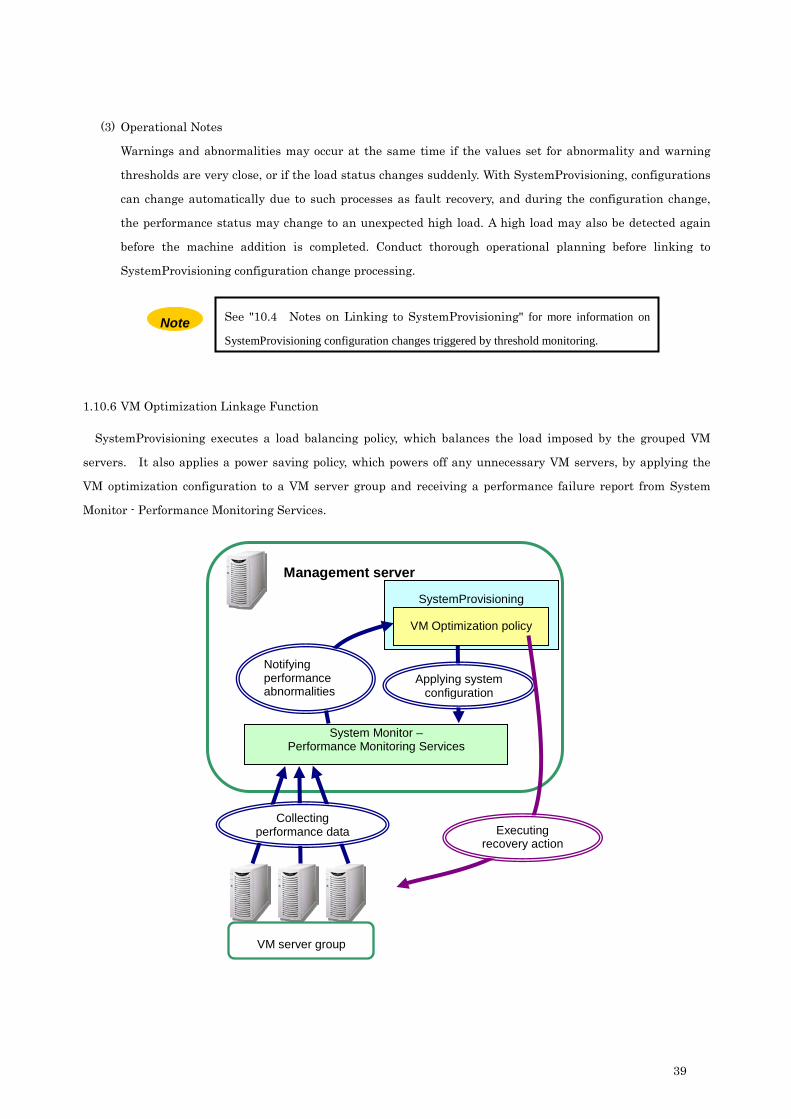
1.10.6 VM Optimization Linkage Function
SystemProvisioning executes a load balancing policy, which balances the load imposed by the grouped VM
servers. It also applies a power saving policy, which powers off any unnecessary VM servers, by applying the
VM optimization configuration to a VM server group and receiving a performance failure report from System
Monitor - Performance Monitoring Services.
See "10.4 Notes on Linking to SystemProvisioning" for more information on
SystemProvisioning configuration changes triggered by threshold monitoring. Note
Management server
Collecting performance data
System Monitor – Performance Monitoring Services
SystemProvisioning
Notifying performance abnormalities
Applying system configuration
VM Optimization policy
Executing recovery action
VM server group

40
When the configuration information for a VM server model to which the VM optimization configuration has
been applied in SystemProvisioning is reflected on System Monitor - Performance Monitoring Services, threshold
settings that are tailored to the VM optimization configuration set in SystemProvisioning are automatically
created as the configuration information is reflected. The threshold monitor settings are registered for all the
servers in the group for which reflection was performed.
The threshold settings to be registered automatically are as listed below.
<Threshold Method for VM Server high load>
Item Setting Remark
Threshold method name “[VMServer] <SystemProvisioning path> CPU
Usage (%) High Load threshold definition”
Unchangeable
Performance indicator CPU Usage (%) Unchangeable
Statistics Average value Unchangeable
Upper limit critical value High load bound value for the VM optimization
configuration specified by the model setting in
SystemProvisioning.
The notification category during excess is "VM
Server high load".
Changeable only from
SystemProvisioning
Upper limit warning value Not set. Unchangeable
Lower limit warning value Not set. Unchangeable
Lower limit critical value Not set. Unchangeable
Notification settings Default value
(A notification is issued if the threshold is
exceeded ten times in 10 checks. Another
notification is issued every 10 checks.)
Changeable
<Threshold Method for VM Server low load>
Item Setting Remark
Threshold method name “[VMServer] <SystemProvisioning path> CPU
Usage (%) Low Load threshold definition”
Unchangeable
Performance indicator CPU Usage (%) Unchangeable
Statistics Average value Unchangeable
Upper limit critical value Not set. Unchangeable
Upper limit warning value Not set. Unchangeable
Lower limit warning value Not set. Unchangeable
Lower limit critical value Low load bound value for the VM optimization
configuration specified by the model setting in
SystemProvisioning.
The notification category during excess is "VM
Server low load".
Changeable only from
SystemProvisioning

41
Notification settings Default value
(A notification is issued if the threshold is
exceeded 30 times in 30 checks. Another
notification is issued every 30 checks.)
Changeable
Notification categories "VM Server high load" and "VM Server low load",
which are used by the threshold method obtained from SystemProvisioning
and then registered, cannot be used when the threshold method is registered
manually.
Note
The SystemProvisioning path to be set in the server group of System
Monitor - Performance Monitoring Services must be a full path to the model
to enable the VM Optimization Function.
Note

42
1.11 Command-Line Interface
The performance data collected by System Monitor - Performance Monitoring Services can be displayed on the
command prompt by using the command-line tool (ssc-perf.exe). This makes it possible to track the
performance trends without starting the management console.
1.11.1 System Configuration
This tool is installed on the management server. This tool is executable on the management server.
An administrator privilege is needed to run this tool.
Management server
Collecting performance data
Saving performance data
System Monitor - Performance Monitoring Services Performance Monitoring Service
Exporting Performance
data
Monitored machines
Command-Line Tool (ssc-perf)
Querying performance
data
If the User Account Control, UAC, is valid, you need to execute with the
Administrator mode. For example, right-click Command Prompt and click
Run as administrator to launch the ssc-perf commands.
Note

43
1.11.2 Data Format and Target
The data format is same as the format shown in "1.8.5 Output Graph Data to File". The data is queried by the
specified parameters (node, performance indicator, statistical method, period and so on). Node, performance
indicator and statistical method are required parameters. You can specify multiple values for only one of the
three required parameters.
For the detail of the usage of the tool, see "8.1 ssc-perf Command".

44
Chapter 2 Configuration Settings
2.1 Starting the Performance Monitoring Service
2.1.1 About the Performance Monitoring Service
In order to use System Monitor - Performance Monitoring Services functions, the Performance Monitoring
Service must have started on the management server. The Performance Monitoring Service resides in the
background as a Windows service. The Performance Monitoring Service startup type is "Automatic" by default,
so it runs automatically when the OS starts.
2.1.2 How to Start the Performance Monitoring Service Manually
The Performance Monitoring Service can be started and stopped manually. The procedure is as follows.
1. On the Start menu, point to the Control Panel and then double click Administrative Tools.
The Administrative Tools window appears.
2. Double-click "System Monitor Performance Monitoring Service" from the services list.
The System Monitor Performance Monitoring Service Properties window appears.
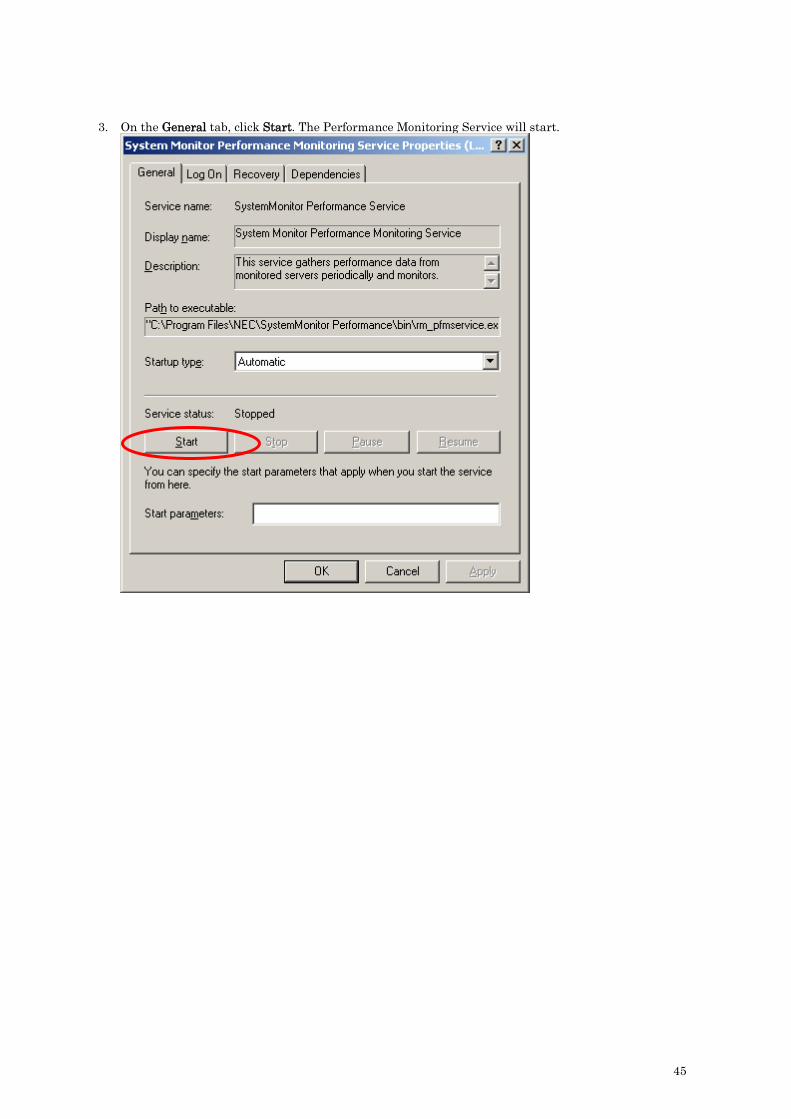
45
3. On the General tab, click Start. The Performance Monitoring Service will start.

46
2.2 Registering the Management Server
To register the management servers in the management console, complete the following steps:
1. Start the management console.
2. Select Add Management Server from the Tools menu. See “3.1.2 Starting the Management Console” for
more information about starting the management console. The Management Server window appears.
Enter the required items, and then click OK.
3. Enter the hostname or IP address of the connection destination management server from the keyboard
for the Host name. The User name and Password specified at management console startup are displayed
for User name and Password. Change these when using a connection account that differs for each
management server. The default value for Port Number (26200) is already set, so no input is required.
See “2.4.1 Port Number” for more information on port numbers.
4. Click OK to add the management server to the management console. The management server name is
displayed in the navigation tree window. Connection to the management server is also performed.
You can delete registered management servers from the navigation tree window. The connection from the
management console to the management server is lost when the management server registration is deleted.
However, Performance Monitoring Service operations are unaffected at disconnection. The Performance
Monitoring Service continues to monitor according to its settings. For information on how to delete registered
management servers, see “3.1.4 Specifying from the Navigation Tree Window”.
The '\' character cannot be use in the Host name text box. Note

47
2.3 Connection Settings to Monitored Machines
The connection settings between the management server (Performance Monitoring Service) and monitored
machines are explained below.
2.3.1 Setting the Connection Account to the Monitored Machine
Set the account name and password so that the Performance Monitoring Service can access the monitored
machine. To register, complete the following steps:
1. Start the management console.
2. Connect to the management server. See “3.1.2 Starting the Management Console” for information about
starting the management console.
3. Right-click the management server name from the navigation tree window in the main window of the
management console and click Set Configuration.
A Configuration window with the name of the server appears.
4. In the Connection tab, specify a new account and password, and then click OK.
5. If the OS on the monitored machine is Linux is the monitored machine, then select the correct connecting
options in the Protocol and Authentication Protocol boxes. The Protocol and Authentication Protocol
settings are ignored if the monitored machine is Citrix XenServer or VMware ESX/ESXi.
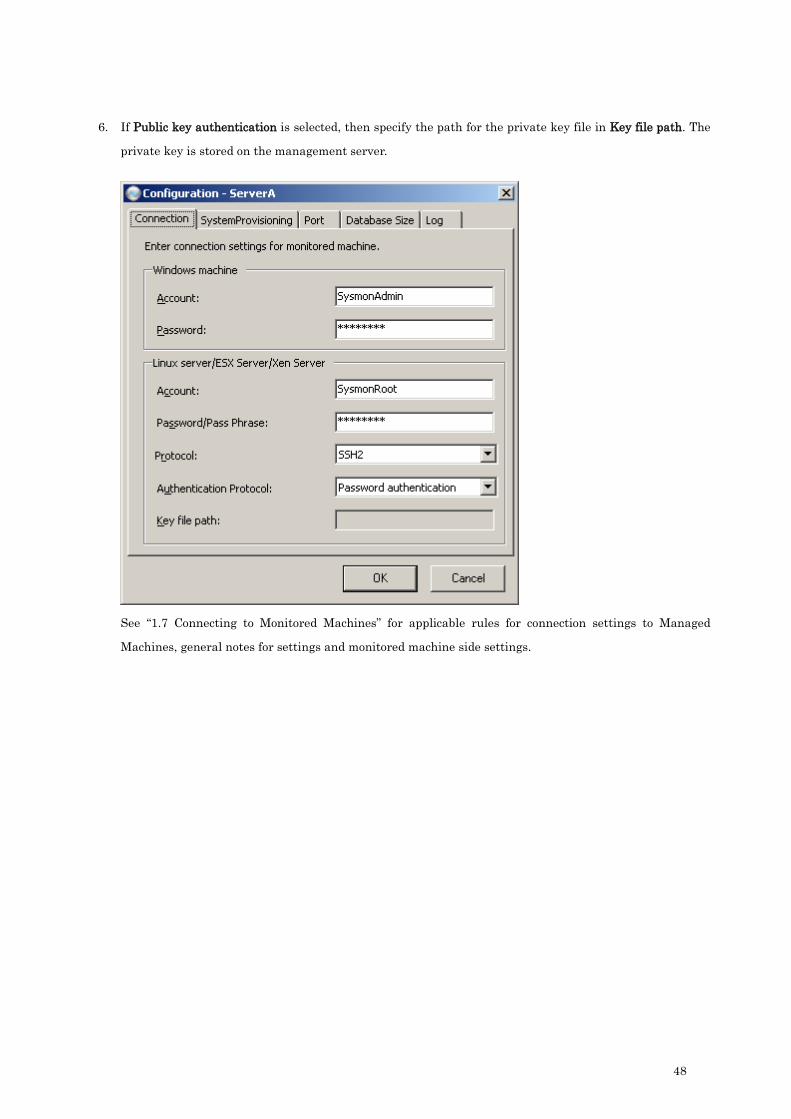
48
6. If Public key authentication is selected, then specify the path for the private key file in Key file path. The
private key is stored on the management server.
See “1.7 Connecting to Monitored Machines” for applicable rules for connection settings to Managed
Machines, general notes for settings and monitored machine side settings.

49
2.4 Connection Settings to the Management Console
The connection settings between the management server (Performance Monitoring Service) and management
console are explained below.
2.4.1 Port Number
System Monitor - Performance Monitoring Services uses port number 26200 for communications from the
management console to the Performance Monitoring Service, and port number 26202 for communicating from
the Performance Monitoring Service to the management console.
Performance Monitoring Service protocol Management console
26200 TCP assigned automatically
assigned automatically TCP 26202
If this port number is already being used by another product, this port number must be changed.
The procedure for changing the port number is as follows:
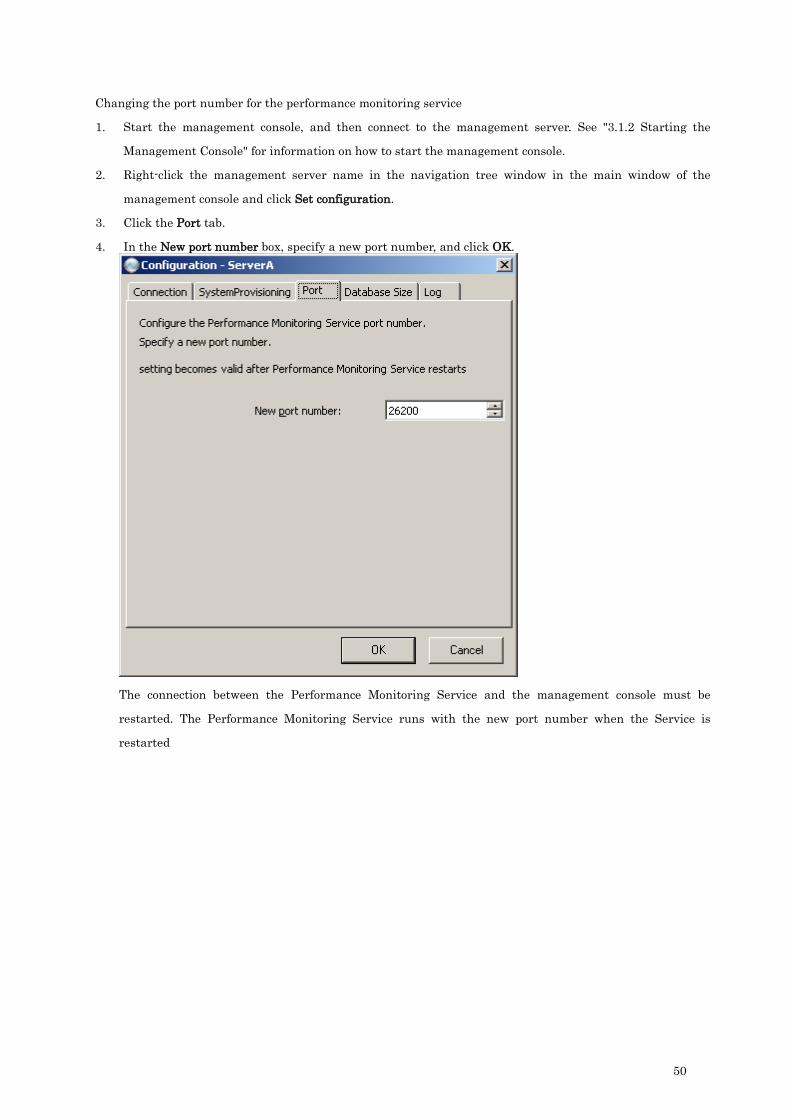
50
Changing the port number for the performance monitoring service
1. Start the management console, and then connect to the management server. See "3.1.2 Starting the
Management Console" for information on how to start the management console.
2. Right-click the management server name in the navigation tree window in the main window of the
management console and click Set configuration.
3. Click the Port tab.
4. In the New port number box, specify a new port number, and click OK.
The connection between the Performance Monitoring Service and the management console must be
restarted. The Performance Monitoring Service runs with the new port number when the Service is
restarted

51
Reconnect to the Performance Monitoring Service from the management console using the following procedure:
1. Right-click the management server name.
A popup menu appears.
2. Click Connection.
3. Click Set.
The Management Server window appears.
4. Specify the changed port number in the Port Number field and click OK to reconnect.
Changing the port number for the management console
1. Start the management console.
2. Click Set Management Console from the Tools menu.
The Management Console window appears.
3. In the Port number box, specify a new port number, and then click OK.
Note: When you click OK, the management console reconnects using the specified port number.

52
2.4.2 Firewall
If the management console is to be run on a machine other than the management server, the management
console and the Performance Monitoring Service will connect using the network.
If a firewall has been set up on the management server, then unblock the Performance Monitor Service.
Unblock settings can be made when System Monitor - Performance Monitoring Services is installed. If
unblock settings were not made when this product was installed, use the following procedure to do so: 1. On the Start menu, point to Control Panel, and then click Windows Firewall.
The Windows Firewall window appears. 2. Click the Exceptions tab. 3. Click Add Program.
The Add a Program window appears. 4. Add settings for the following program:
<installation directory>\bin\rm_pfmservice.exe
If a firewall has been set up on the management console machine, then unblock the management console
by using the following procedure: 1. On the Start menu, point to the Control Panel, and then click Windows Firewall.
The Windows Firewall window appears. 2. Click the Exceptions tab 3. Click Add Program.
The Add a Program window appears. 4. Add settings for the following program:
<installation directory>\bin\RM_PFMCONSOLE.exe
If Windows is blocking the program, the following window may appear when a user logs on. Unblock settings
can also be made using this window.

53
2.5 The Execution Account for the Performance Monitoring Service
2.5.1 Setting up the Performance Monitoring Service Execution Account
The Performance Monitoring Service runs as the local system account. This is the default setting. You can
change the execution account for the Performance Monitoring Service from the local system account and
configure it to use a specific account for the Performance Monitoring Service. If the OS for the monitored
machine is Windows 2000, the execution account must be changed from the local system account. See “2.5.2
How to Change the Performance Monitoring Service Execution Account” for changing the execution account.
The execution account must satisfy the following conditions.
♦ The execution account for the Performance Monitoring Service must possess management server OS
administrator rights. There are also rights required for settings in order to start the Performance
Monitoring Service. See “2.5.3 Rights for the Performance Monitoring Service Execution Account” for
rights required and settings for the Performance Monitoring Service execution account.
♦ If the OS for the management server is Windows Server 2003, use an account that does not have a blank
password. If an account with a blank password is specified as the execution account for the Performance
Monitoring Service, the Performance Monitoring Service may not be able to start, depending on the
security settings for OS
If the following conditions are satisfied, the Performance Monitoring Service accesses the monitored machine
using the execution account:
♦ The OS for the monitored machine is Windows.
♦ The execution account is changed from the local system account.
♦ The connection account for the monitored machines is not specified (account field is blank).

54
2.5.2 How to Change the Performance Monitoring Service Execution Account
The procedure for changing the execution account is as follows:
1. Start Services from the Administrative Tools control panel.
2. Double-click "System Monitor Performance Monitoring Service" from the list of services.
3. In the Log On tab, set up the account and password.
In the example above, the "administrator" account for the management server is specified as the execution
account.
4. The new execution account will take affect when the Performance Monitoring Service is restarted.
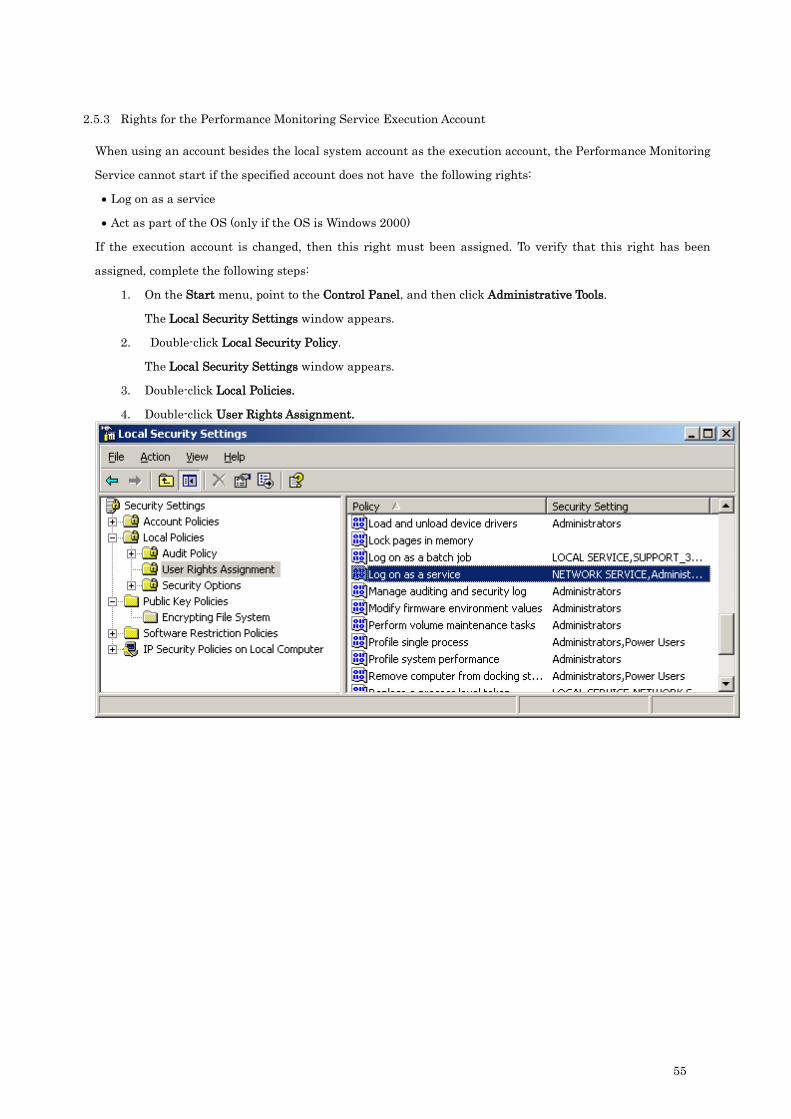
55
2.5.3 Rights for the Performance Monitoring Service Execution Account
When using an account besides the local system account as the execution account, the Performance Monitoring
Service cannot start if the specified account does not have the following rights:
• Log on as a service
• Act as part of the OS (only if the OS is Windows 2000)
If the execution account is changed, then this right must been assigned. To verify that this right has been
assigned, complete the following steps:
1. On the Start menu, point to the Control Panel, and then click Administrative Tools.
The Local Security Settings window appears.
2. Double-click Local Security Policy.
The Local Security Settings window appears.
3. Double-click Local Policies.
4. Double-click User Rights Assignment.
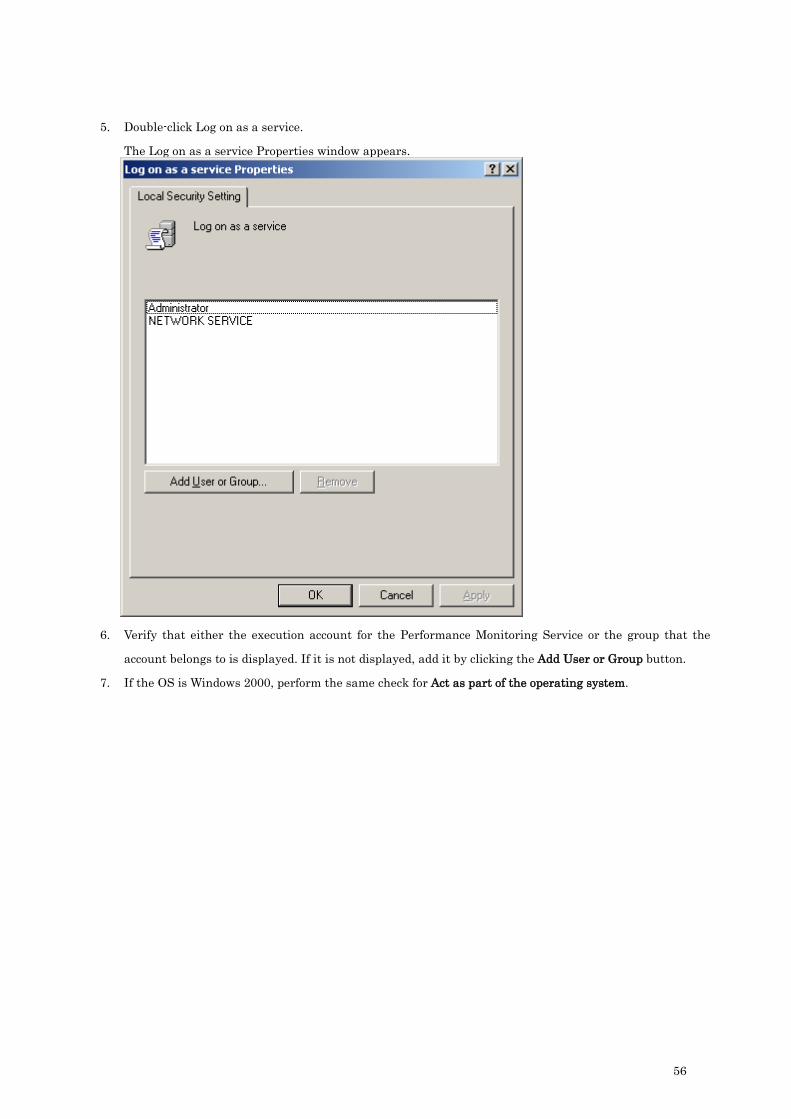
56
5. Double-click Log on as a service.
The Log on as a service Properties window appears.
6. Verify that either the execution account for the Performance Monitoring Service or the group that the
account belongs to is displayed. If it is not displayed, add it by clicking the Add User or Group button.
7. If the OS is Windows 2000, perform the same check for Act as part of the operating system.

57
2.6 SystemProvisioning Connection Settings
SystemProvisioning information must be set in order to use the SystemProvisioning configuration applying
function or the performance abnormality notification function. You must configure these settings.
The procedure for configuring these settings is as follows:
1. Start the management console and connect to the management server. See "3.1.2 Starting the
Management Console" for information on how to start the management console.
2. Right-click the management server name from the navigation tree window in the main window of the
management console. A popup menu appears.
3. Click Set configuration.
The Configuration window appears.
4. Specify the Server name on which SystemProvisioning is installed from the SystemProvisioning tab. The
default value is a server name of the management server.
5. To automatically apply SystemProvisioning configuration information, check the Apply
SystemProvisioning Configuration automatically box, and set a polling interval between one and 1000
minutes. The default status for this check box is checked. The default polling interval is 10 minutes.
6. To set up a polling start time, check the Specify polling start time box, and then set the polling start time.
7. Click OK.

58
If the Performance Monitoring Service and SystemProvisioning are not on the same management server,
following settings are necessary:
• Windows Firewall setting
If the Windows firewall has been enabled, make exception settings by using the following procedure:
1. On the Start menu, point to the Control Panel, and then click Windows Firewall.
The Windows Firewall window appears.
2. Click the Exceptions tab.
3. Click Add Port.
4. Add the settings for the following port. Specify any name for the Name field. Function added Protocol Port number SystemProvisioning Universal Connector TCP 26102
• Service execution account setting
The OS administrator account of the SystemProvisioning management server must be set as the execution
account of System Monitor Performance Monitoring Service. See "2.5 The Execution Account for the
Performance Monitoring Service" for information on how to set the service execution account.
When SystemProvisioning is clustered with ExpressCluster, the virtual computer name cannot be used as
SystemProvisioning Management Server name. Using the virtual computer name can cause a failure to
connect SystemProvisioning.

59
2.7 Log Settings
The output settings of the debug log can be changed using the System Monitor - Performance Monitoring
Services management console. A log level and a maximum size of the log file can be changed.
A log level can be specified between '0' and '4'. The higher a log level becomes, the more detailed the log
becomes. When '0' is set as a log level, no log is output. The default value of log level is '3'.
A debug log file is backed up if the file size exceeds the specified value. A log file size can be specified between 1
and 1024MB. The default value of log file size is 10MB.
The procedure for configuring these settings is as follows:
1. Start the management console and connect to the management server. See "3.1.2 Starting the
Management Console" for information on how to start the management console.
2. Right-click the management server name from the navigation tree window in the main window of the
management console. A popup menu appears.
3. Click Set configuration.
The Configuration window appears.
4. Specify the debug log level and the file size on the Log tab.
5. Click OK.

60
Chapter 3 Basic Operations
3.1 Starting the Management Console and Connecting to the Management Server
3.1.1 About the Management Console
The management console is the user interface for the Performance Monitoring Service. Start the management
console and connect to the management server to configure the Performance Monitoring settings. The
management console can also graphically display performance data.
You can connect to multiple management servers from one management console. This allows for central
management of multiple management servers. Also, more than one management console can connect to the
same Performance Monitoring Service at the same time. See "3.1.5 Notes on Operating with More than One
Management Console" for more information.
3.1.2 Starting the Management Console
Start the management console to initiate the connection between the management console and the
management servers. The execution account of the management console must possess OS administrator
authority of the Monitoring terminal. The procedure for starting the management console is as follows:
1. Point to SigmaSystemCenter under the All Programs section of the Start menu, and then click System
Monitor Management Console.
2. When no management server is registered in the management console, enter the necessary items into the
Management Server window.
Enter the hostname/IP address of the management server into Host name, the port number used for
connecting to the management server into Port number, the connection account to the management server
into User Name and the password into Password.

61
If the management console program is blocked by Windows Firewall,
Windows Security Alert window may appear. See "2.4.2 Firewall" and
unblock the management console program.
When a management server is already registered in the management console, enter the necessary items
into the Logon window. The account is used for connecting all management server registered in the
management console.
Enter the connection account to the management server into User Name and the password into Password.
3. Click OK to start the connection to the management server.
3.1.3 Connecting to the Management Server
Start the management console to begin a connection between the management servers and the management
console. The management servers that are already registered in the management console are now connected.
The user name and password specified at management console startup are used for connecting to the
management server. Only users that have OS administrator authority for the management server can log on to
the management server. To connect, the Performance Monitoring Service must be started on the management
server. See "2.1 Starting the Performance Monitoring Service" for information on how to start the Performance
Monitoring Service.
If no management server is registered in the management console, the Management Server window appears
when the management console loads. In the Management Server window, add a management server. See "2.2
Registering the Management Server" for information on how to add management server.
Note

62
3.1.4 Specifying from the Navigation Tree Window
From the navigation tree window, the following actions are possible: • Connecting to/Disconnecting from the management server • Changing connection settings • Deleting management server registration
To connect to or disconnect from the management server, complete the following steps:
1. Right-click the management server name and then click Connection.
A popup menu appears.
2. Click Disconnect.
To reconnect, complete the following steps:
1. Right-click the management server name, and then click Connection.
A popup menu appears.
2. Click Connect.
To change the connection settings to the management server, complete the following steps:
1. Right-click the management server name, and then click Connection.
A popup menu appears.
2. Click Set.
A Management Server window appears.
3. Change the settings, and then click OK.
To delete management server registration, complete the following steps:
1. Right-click the management server name, and click Delete management server.
A confirmation window appears.
2. Click Yes.
Verify that the management server was deleted from the navigation tree window.

63
3.1.5 Notes on Operating with More than One Management Console
With System Monitor - Performance Monitoring Services, more than one management console can connect to
the same Performance Monitoring Service at the same time.
The following settings are unique for each Performance Monitoring Service:
• Specifications for monitored machines
• Specifications for the Performance Indicators to be collected
• Specifications for threshold monitoring information
• Pausing and restarting the collecting of performance data
• Configuration settings
Caution: If these settings are changed on one management console, the changes are reflected on all
management consoles. The displayed performance status information will also change.
Performance Monitoring Service
Management console
Management console
Displaying performance
status
Applying
Applying
Displaying performance
status
Changing settings
Applying
Management console
Displaying performance
status
Displaying performance
status
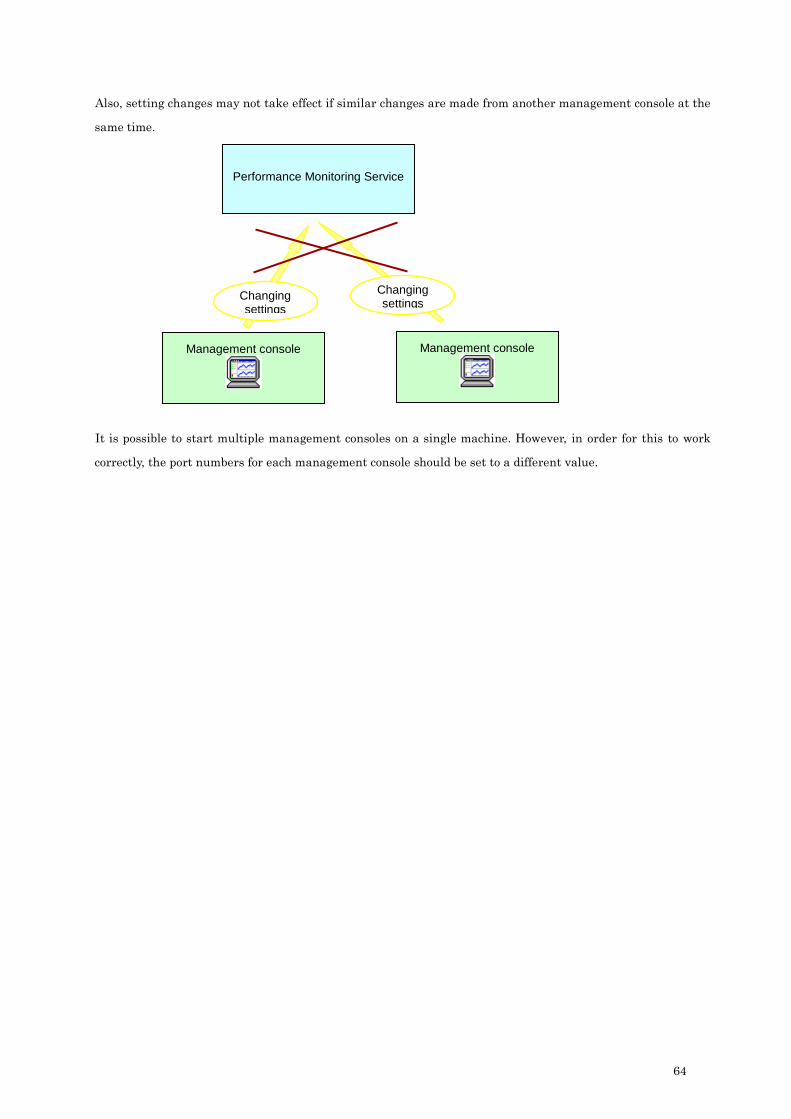
64
Also, setting changes may not take effect if similar changes are made from another management console at the
same time.
It is possible to start multiple management consoles on a single machine. However, in order for this to work
correctly, the port numbers for each management console should be set to a different value.
Performance Monitoring Service
Management console
Changing settings
Management console
Changing settings
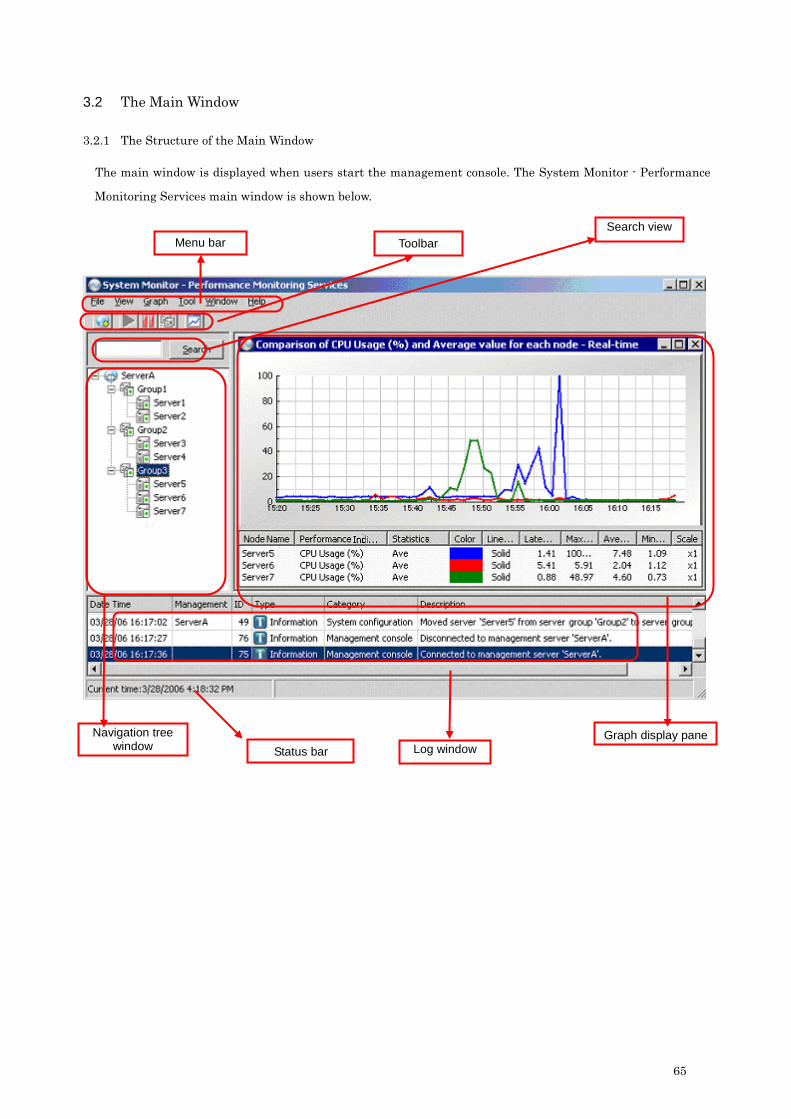
65
3.2 The Main Window
3.2.1 The Structure of the Main Window
The main window is displayed when users start the management console. The System Monitor - Performance
Monitoring Services main window is shown below.
Menu bar Toolbar
Navigation tree window Status bar
Graph display pane
Search view
Log window
66
3.2.2 Menu Bar
Each menu in the main window and its options are explained below.
File menu
Exit
Closes the management console.
View menu
Tree Window
Shows or hides the navigation tree window.
Tree Window Search View
Shows or hides the Tree Window Search View.
Toolbar
Shows or hides the toolbar.
Status bar
Shows or hides the status bar.
Log Window
Shows or hides the Log window.
Graph menu
New
Displays the Graph Setting window. Select this menu item to create a new graph. See "Chapter 5
Performance Status Display and File Output" for more information on the Graph Setting window.
Set Display
Displays the Graph Setting window for the active performance graph window in the current graph display
pane. Select this menu item to change the settings for a graph that is being displayed. See "Chapter 5
Performance Status Display and File Output" for more information on the Graph Settings window.
Output File
Displays the Output Settings window. Select this menu item to output performance data displayed in the
graph window. See "5.3 File Output" for more information on the Output Settings window.
Option
Displays the Edit Performance Indicator window. Specify the Performance Indicator title to be displayed
in graphs. See "5.1.4 Defining a Performance Indicator Title" for more information on the Edit
Performance Indicator window.
Tool menu
Add Management Server
Displays the Management Server window. Select this option when adding a management server. See "2.2
Registering the Management Server" for more information on the Management Server window.
Change Connection Status of Management Servers

67
You can select Connect to all or Connect to Management Servers with error status. Select Connect to all to
connect to all management servers with error status or those that are disconnected. Select Connect to
Management Servers with error status to connect to all management servers with error status.
Change Data Collecting Status
You can select Restart All or Pause All. Specify restart/pause Performance Monitoring Service for all
connected management servers.
Apply SystemProvisioning Configuration to All
Configuration information on SystemProvisioning is applied to all connected management servers. Select
this menu item to apply configuration information immediately, regardless of periodic application
performed by the automatic applying function.
Set Management Console
Displays the Management Console window. See "2.4 Connection Settings to the Management Console" for
more information on the Management Console window.
Window menu
Cascade
Arranges the performance graphs so they overlap.
Tile Horizontally
Arranges the performance graphs horizontally.
Tile Vertically
Arranges the performance graphs vertically.
A list of performance graphs that are being displayed
Performance graphs that are being displayed are listed. The selected performance graph is activated.
Help menu
Version Information
Displays version information for System Monitor - Performance Monitoring Services.

68
3.2.3 The Toolbar
Each tool button in the main window is explained below.
Add Management Server tool button
Displays the Management Server window. Select when adding a management server. See "2.2 Registering
the Management Server" for more information on the Management Server window.
Restart Collecting Performance Data tool button
Restarts the Performance Monitoring Service for all connected management servers.
Pause Collecting Performance Data tool button
Pauses the Performance Monitoring Service for all connected management servers.
Apply SystemProvisioning Configuration to All tool button
Applies configuration information from SystemProvisioning to all the connecting management servers.
Select this tool button to apply configuration information immediately, regardless of periodic application
performed by the automatic applying function.
Create a Graph tool button
Displays the Graph Setting window. Select this tool button to create a new graph. See "Chapter 5
Performance Status Display and File Output" for more information on the Graph Setting window.
3.2.4 The Navigation Tree Window
Management servers and monitored machines are displayed in the navigation tree window. Operations for
management servers such as collecting data settings and adding monitored machines are performed from the
navigation tree window. See “3.2.5 Popup Menu for Management Server” for navigation tree window
operations for each management server.
3.2.5 Popup Menu for Management Server
Connection
Specifies connect to/disconnect from the management server. Set menu displays Management Server
window. See "2.2 Registering the Management Server" for more information on the Management Server
window.
Delete Management Server
Deletes management server registration.
Collecting Data
Select the Set Performance Indicator Settings menu or the Set Collecting Data Settings menu.
If the Set Performance Indicator Settings menu is selected, the Performance Indicator List window
appears. Custom performance indicator setting can be added or modified on the Performance Indicator
List window.
If the Set Collecting Data Settings menu is selected, the Collecting Data Setting List window appears. You
69
can specify which node and performance indicator should be monitored on the Collecting Data Setting List
window.
See "4.2 Specifications for the Performance Data to be Collected" for more information about each window.
Set Threshold Monitor
Displays the Set Threshold Monitor window. See "6.1 Configuring Threshold Monitoring" for more
information on the Set Threshold Monitor window.
Change Data Collecting Status
Specifies restart/pause Performance Monitoring Service for the management servers. You can select
Restart or Pause.
Apply SystemProvisioning Configuration
Applies configuration information from SystemProvisioning to the management server. Select this menu to
Apply configuration information immediately, regardless of periodic application performed by the
automatic applying function.
Set Configuration
Displays the Configuration window. See "Chapter 2 Configuration Settings" for more information on the
Configuration window.
Add Group
Displays the Group Settings window. See "4.1.1 Specifications in the Navigation Tree Window" for more
information on the Group Settings window.
Display Graph
Creates a real-time graph using the simple graph display function. See "5.1.3 Simple Graph Display
Function" for more information on the Simple graph display function.
3.2.6 Search View
Select Tree Window Search View from the View menu to display search view. Enter search character strings to
the text box then click Search. When there is a node name partially matching to the search character string in
the navigation tree window, the corresponding node switches to select status. Click Search again to switch the
next corresponding node to select status. The search sequence is performed from the top of the navigation tree
to the bottom of the navigation tree. When there are no corresponding nodes, the select status on the
navigation tree window is not changed.
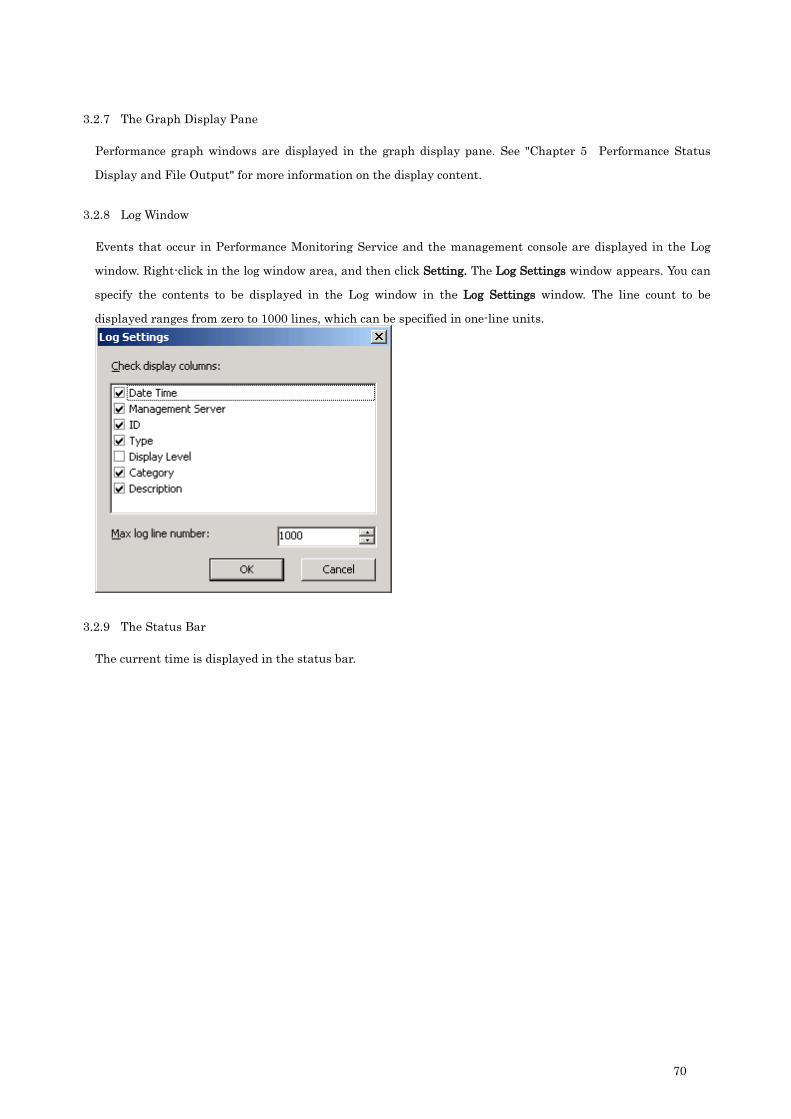
70
3.2.7 The Graph Display Pane
Performance graph windows are displayed in the graph display pane. See "Chapter 5 Performance Status
Display and File Output" for more information on the display content.
3.2.8 Log Window
Events that occur in Performance Monitoring Service and the management console are displayed in the Log
window. Right-click in the log window area, and then click Setting. The Log Settings window appears. You can
specify the contents to be displayed in the Log window in the Log Settings window. The line count to be
displayed ranges from zero to 1000 lines, which can be specified in one-line units.
3.2.9 The Status Bar
The current time is displayed in the status bar.

71
Chapter 4 Collecting Performance Data
You can manage multiple management servers with System Monitor - Performance Monitoring Services. To do
this, you must first connect to the management server to start collecting performance data. See “3.1.3 Connecting
to the Management Server” for more information about connecting to the management server. Monitored
machines and performance data to be collected are specified for each node from the navigation tree window. See
“4.1 Specifications for Monitored Machines” for more information about specifying a monitored machine, and see
“4.2 Specifications for the Performance Data to be Collected” for more information about specifying performance
data.
4.1 Specifications for Monitored Machines
4.1.1 Specifications in the Navigation Tree Window
Additions, deletions and changes to monitored machines are performed from the navigation tree window of the
main window. Monitored machines are configured for each management server.
System Monitor - Performance Monitoring Services manages monitored machines in groups called "groups".
Performance status information can be displayed for the entire group, so you must register groups of machines
whose performances need to be monitored collectively as groups.
The following section explains how to register machines and groups.
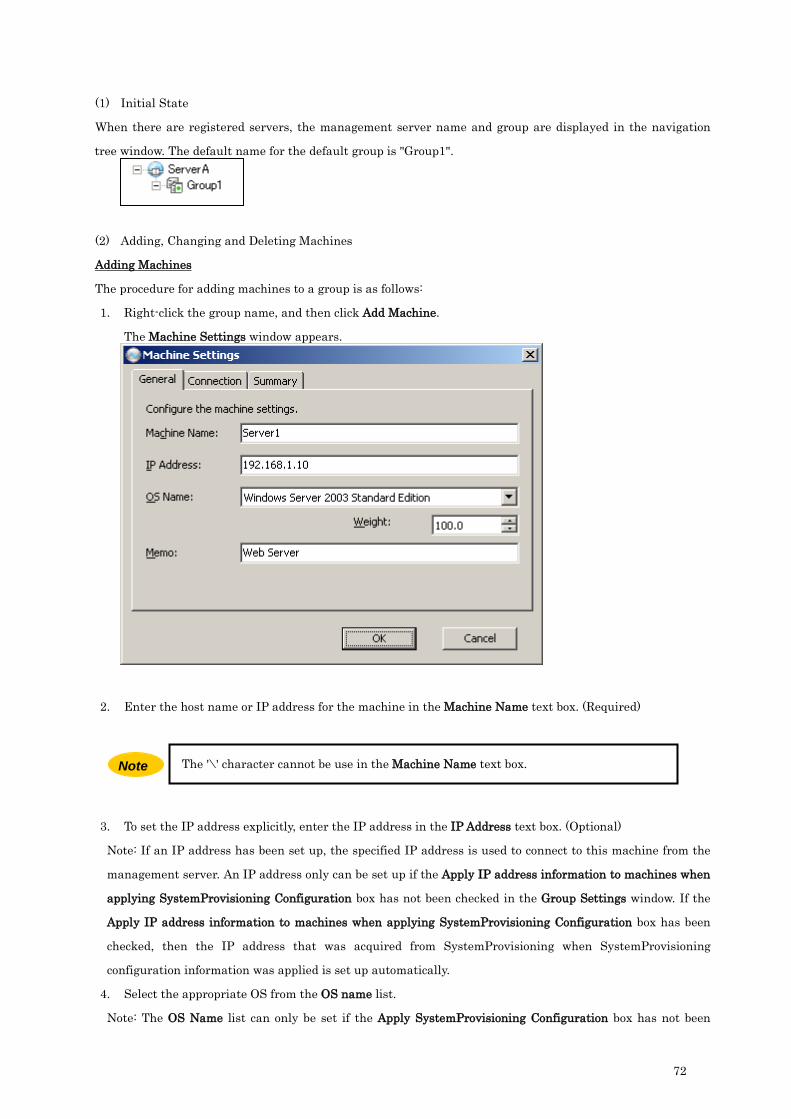
72
(1) Initial State
When there are registered servers, the management server name and group are displayed in the navigation
tree window. The default name for the default group is "Group1".
(2) Adding, Changing and Deleting Machines
Adding Machines
The procedure for adding machines to a group is as follows:
1. Right-click the group name, and then click Add Machine.
The Machine Settings window appears.
2. Enter the host name or IP address for the machine in the Machine Name text box. (Required)
3. To set the IP address explicitly, enter the IP address in the IP Address text box. (Optional)
Note: If an IP address has been set up, the specified IP address is used to connect to this machine from the
management server. An IP address only can be set up if the Apply IP address information to machines when
applying SystemProvisioning Configuration box has not been checked in the Group Settings window. If the
Apply IP address information to machines when applying SystemProvisioning Configuration box has been
checked, then the IP address that was acquired from SystemProvisioning when SystemProvisioning
configuration information was applied is set up automatically.
4. Select the appropriate OS from the OS name list.
Note: The OS Name list can only be set if the Apply SystemProvisioning Configuration box has not been
The '\' character cannot be use in the Machine Name text box. Note
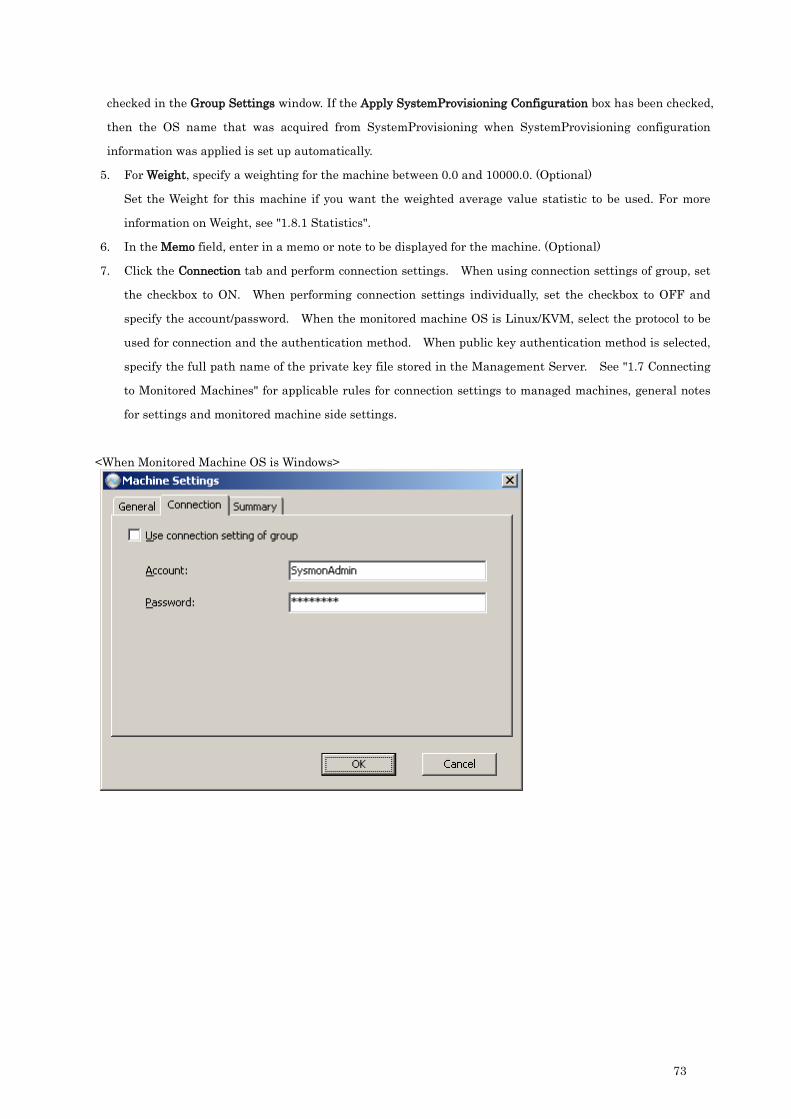
73
checked in the Group Settings window. If the Apply SystemProvisioning Configuration box has been checked,
then the OS name that was acquired from SystemProvisioning when SystemProvisioning configuration
information was applied is set up automatically.
5. For Weight, specify a weighting for the machine between 0.0 and 10000.0. (Optional)
Set the Weight for this machine if you want the weighted average value statistic to be used. For more
information on Weight, see "1.8.1 Statistics".
6. In the Memo field, enter in a memo or note to be displayed for the machine. (Optional)
7. Click the Connection tab and perform connection settings. When using connection settings of group, set
the checkbox to ON. When performing connection settings individually, set the checkbox to OFF and
specify the account/password. When the monitored machine OS is Linux/KVM, select the protocol to be
used for connection and the authentication method. When public key authentication method is selected,
specify the full path name of the private key file stored in the Management Server. See "1.7 Connecting
to Monitored Machines" for applicable rules for connection settings to managed machines, general notes
for settings and monitored machine side settings.
<When Monitored Machine OS is Windows>

74
<When Monitored Machine OS is Linux, VMware ESX/ESXi, Citrix XenServer or KVM>
8. Click the OK button when settings are completed.
9. Verify that the machine has been added to navigation tree window.
Deleting Machines
The procedure for deleting machines is as follows:
1. Right-click the machine name and click Delete Machine.
A window appears to confirm that you want to delete the machine.
2. Click Yes.
3. Verify that the machine has been deleted from the navigation tree window.
The machine is deleted from the navigation tree window, but information will still be stored in the database
(for a storage period of one month). If a machine with the same machine name is added, the configuration will
revert to the former state (the data stored in the database will become valid).
Confirming or Modifying Machine Settings
The procedure for confirming or modifying machine settings is as follows:
1. Right-click the machine name and click Machine Settings.
The Machine Settings window appears.
2. Confirm the machine settings. Enter the new machine settings if necessary. The information on Summary
tab in the Set server window is displayed based on SystemProvisioning configuration information. See
"1.10.2 Necessary Settings for Applying System Configuration Information and Applied Settings" for

75
information on applying SystemProvisioning configuration information.
3. Click OK.
4. Verify that the new settings were applied if they were modified.
Moving Machines
The procedure for changing which group a machine belongs to is as follows:
1. Right-click the machine name and click Move machine.
The Move Machine window appears. It contains a list of groups.
2. Select the new group from the window.
3. Click OK.
4. Verify that the machine has been moved to the new group in the navigation tree window.
You can also drag and drop the machine name to a different group, but you cannot move a machine to the
group of another management server.
The settings applied from SystemProvisioning are grayed out on this window. These
settings can not be modified. The settings on SystemProvisioning should be modified if
necessary.
Note

76
(3) Adding, Changing and Deleting Groups
Adding Groups
The procedure for adding groups is as follows:
1. Right-click the management server and click Add Group.
The Group Settings window appears.
2. Enter the name for the group in the Group Name field . (Required)
Note: The '\' character cannot be use in the Group Name field.
3. To apply configuration information for SystemProvisioning on to the group that is being set up, check the
Apply SystemProvisioning Configuration box and specify the path for the appropriate
SystemProvisioning group/model in the Path text box. To apply IP address information to subordinate
machines when configurations are applied, check the Apply IP address information to machines when
applying SystemProvisioning Configuration box. (Optional)
4. In the Memo field, enter in a memo or note to be displayed for the group

77
5. Click the Connection tab and perform connection settings. When using connection settings of the
Configuration window, set the checkbox to ON. When performing connection settings individually, set
the checkbox to OFF and specify the account/password. When the monitored machine OS is Linux is set
to monitored machines, select the protocol to be used for connection and the authentication method.
When public key authentication method is selected, specify the path name of the private key file stored in
the management server. See “1.7 Connecting to Monitored Machines” for applicable rules for connection
settings to managed machines, general notes for settings and monitored machine side settings.
6. Click the OK button when settings are completed.
7. Verify that the group has been added to the navigation tree window.
78
Deleting Groups
The procedure for deleting groups is as follows:
1. Right-click the group and click Delete Group.
A window appears to confirm that you want to delete the group.
2. Click Yes.
3. Verify that the group has been deleted from the navigation tree window.
Confirming or Modifying Group Settings
The procedure for confirming or modifying group settings is as follows:
1. Right-click the group name and click Group Settings.
The Group Settings window appears.
2. Confirm the group settings.
If the performance data collecting setting is enabled on the Performance Monitor settings about the
corresponding group/model on SystemProvisioning, an access account can be configured there. An access
account can be configured on the Connection settings for each node on System Monitor - Performance
Monitoring Service as well. You can select which account is used as an access account for this group.
Performance data for groups that have been deleted becomes unusable. The performance status from before the deletion will not be displayed even if a group with the same name is added.
Note
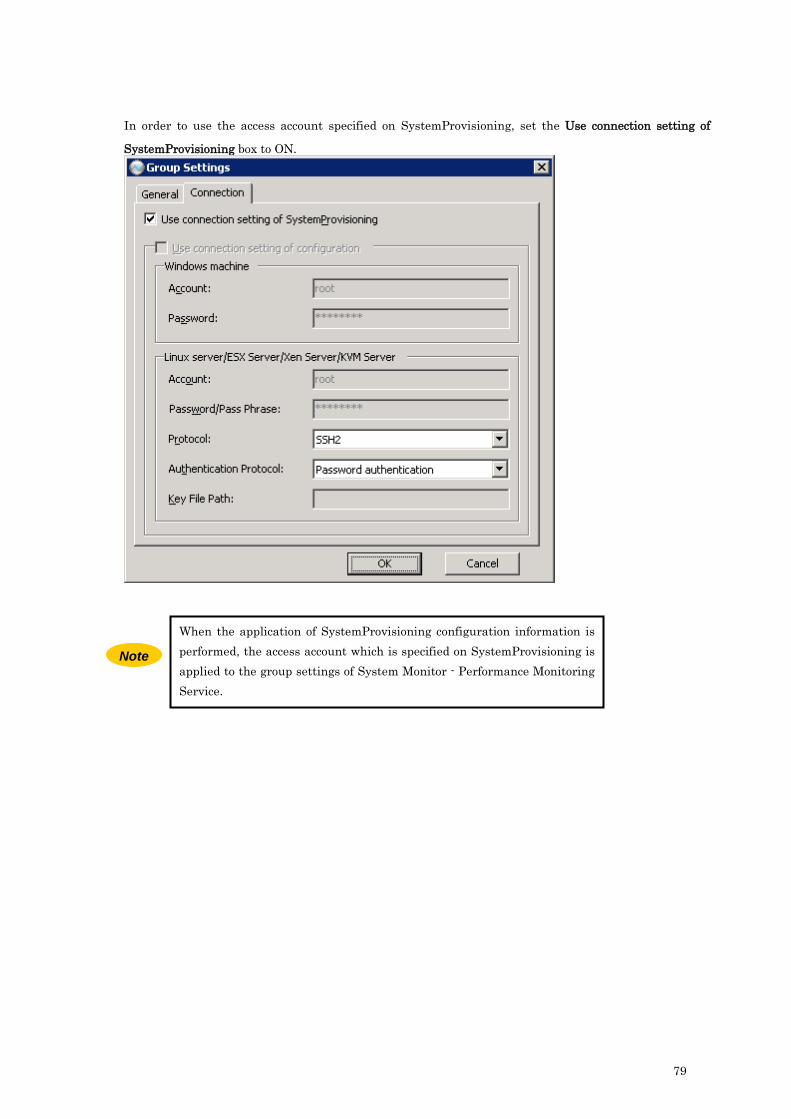
79
In order to use the access account specified on SystemProvisioning, set the Use connection setting of
SystemProvisioning box to ON.
When the application of SystemProvisioning configuration information is performed, the access account which is specified on SystemProvisioning is applied to the group settings of System Monitor - Performance Monitoring Service.
Note
80
In order to use the access account specified on System Monitor - Performance Monitoring Service, set the
Use connection setting of SystemProvisioning box to OFF and set the connection settings.
Enter the other new group settings if necessary.
3. Click OK.
4. Verify that the new group settings were applied if they were modified.
4.1.2 How to Apply SystemProvisioning Configuration Information
SystemProvisioning configuration information can be applied to System Monitor - Performance Monitoring
Services. Information can be applied manually or automatically. With the automatic applying function, System
Monitor - Performance Monitoring Services communicates with SystemProvisioning at regular intervals, and
The settings applied from SystemProvisioning are grayed out on this window. These
settings can not be modified. The settings on SystemProvisioning should be modified if
necessary.
Note
The '\' character cannot be use in the Group Name text box. Note

81
automatically applies any changes to its configuration information.
Set the following attributes beforehand for System Monitor - Performance Monitoring Services groups for
which SystemProvisioning configuration information is applied (these settings can be made from the Group
Settings window):
1) Whether or not to apply SystemProvisioning configurations
2) The corresponding SystemProvisioning full path to the group/model
3) Whether or not to acquire IP address information
Configuration information, such as machine names and machine states (normal or error), is applied to the
machines in the specified SystemProvisioning group/model.
82
For some system configurations, there are cases where it is not possible to
connect to monitored machines using the IP addresses acquired from
SystemProvisioning configuration information. If a monitored server
produces an error, disable Apply the IP address information function and set
the IP address manually using the Set server window, DNS or the "hosts"
file.
(1) Applying SystemProvisioning Configurations Manually
The procedure for applying SystemProvisioning configurations is as follows:
1. Select Apply SystemProvisioning Configuration to All from the Tools menu, or click on the Apply
SystemProvisioning Configuration to All tool button.
A window appears to confirm whether the SystemProvisioning configuration should be applied.
2. Click Yes.
3. Verify that the configuration has changed in the navigation tree window.
(2) Applying SystemProvisioning Configurations Automatically
The setup procedure to apply SystemProvisioning configurations automatically is as follows:
1. Right-click the management server in the navigation tree window and click Set Configuration.
The Configuration window appears.
2. In the SystemProvisioning tab, set the required items. See “2.6 SystemProvisioning Connection
Settings” for more information.
3. Click OK.
Every time SystemProvisioning is polled, any configuration changes that have been made are applied in
the navigation tree.
Note
83
4.2 Specifications for the Performance Data to be Collected
4.2.1 How to Specify Performance Indicator Settings
System Monitor - Performance Monitoring Services can collect performance data for the custom performance
indicator as well as the builtin performance indicator.
To specify performance indicator, complete the following steps:
1. Right-click the management server.
2. Select Collecting Data menu.
3. Click Set Performance Indicator Settings menu.
The Performance Indicator List window appears.
The performance indicators written in "1.3.2 Built-in Performance Indicator" are registered as default settings.
To collect performance data for other performance indicator from a monitored Windows machine, it is necessary
to be added a new custom performance indicator.

84
Adding Performance Indicators
The procedure for adding new Custom Performance Indicators is as follows:
1. Display the Performance Indicator List window.
2. Click Add.
3. The Performance Indicator Settings window appears.
4. Specify performance indicator for each OS of monitored machines.
・ Check the Windows box or the Linux/ESX/Xen/KVM box, and then select the appropriate item.
Items for both OSes can be configured at the same time. (Required)
Counter name and Performance Index name are automatically set to the performance indicator
title when Counter and Performance Index are changed.
・ To change the title, input a title. (Optional)
Set titles after setting Counter or Performance Index, because Counter name and Performance
Index name are automatically set to the performance indicator title when Counter and
Performance Index are changed.
5. Confirm that the specified performance indicator is added to the performance indicator list.
6. Multiple performance indicators can be configured by repeating the actions in step 4. When you are
finished configuring the settings, click Close.
7. Click Apply All in the Performance Indicator List window to apply these settings to all the connected
management servers.
85
Deleting Performance Indicators
The procedure for deleting Performance Indicators is as follows:
1. Display the Performance Indicator List window.
2. Select the Performance Indicator item to be deleted from the Performance Indicator list.
3. Click Remove.
4. Verify that the Performance Indicator item was deleted from the Performance Indicator list.
Performance data that has been deleted becomes unusable. The performance
status from before the deletion will not be displayed even if the same settings are
made again.
Note
Collecting performance data is not started only by adding the performance
indicator settings to the performance indicator list. For data collection settings, see
"4.2.2 How to Specify Collecting Data Settings".
Note
If Apply All is executed, the settings which had been already specified on other
management servers connecting with the management console will be overwritten. Note
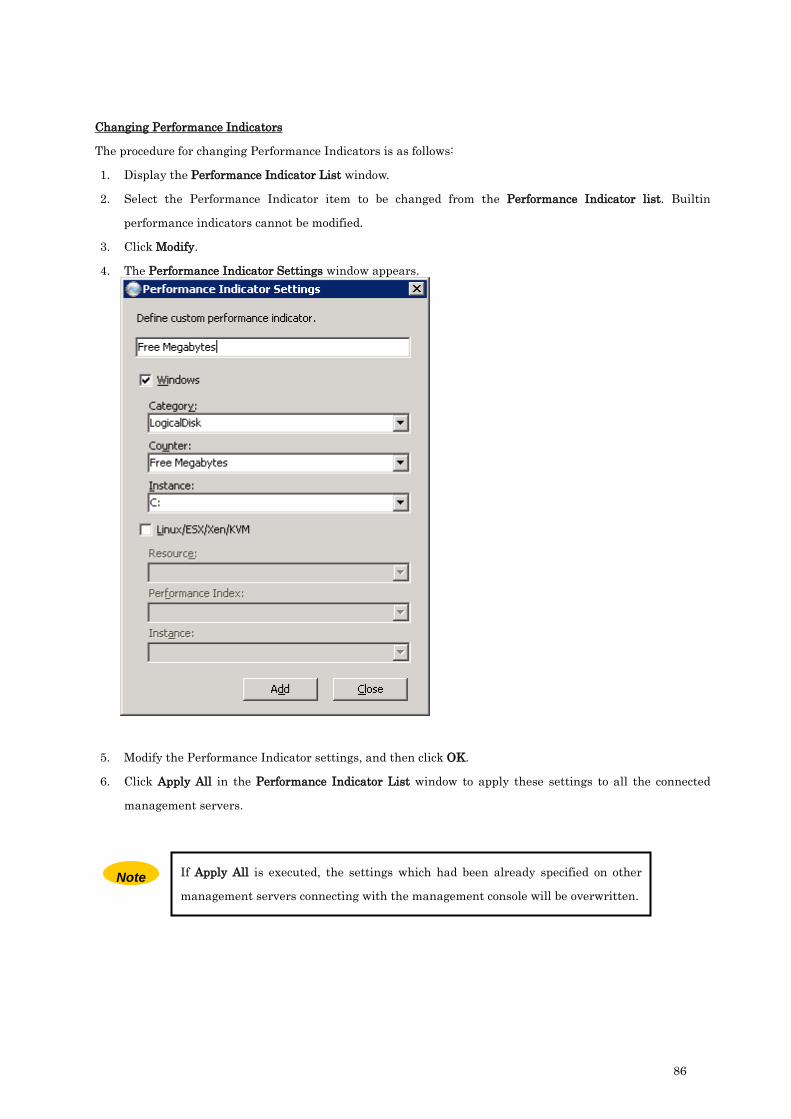
86
Changing Performance Indicators
The procedure for changing Performance Indicators is as follows:
1. Display the Performance Indicator List window.
2. Select the Performance Indicator item to be changed from the Performance Indicator list. Builtin
performance indicators cannot be modified.
3. Click Modify.
4. The Performance Indicator Settings window appears.
5. Modify the Performance Indicator settings, and then click OK.
6. Click Apply All in the Performance Indicator List window to apply these settings to all the connected
management servers.
If Apply All is executed, the settings which had been already specified on other
management servers connecting with the management console will be overwritten. Note

87
4.2.2 How to Specify Collecting Data Settings
System Monitor - Performance Monitoring Services periodically collects performance data for monitored
machines. The Performance Indicators that are collected can be specified for each management server, for each
group or for each machine. The settings for collecting performance data from the monitored machine can be
specified on the Collecting Data Setting List window by assigning the collecting data settings to the object
node.
The procedure for specifying settings for collecting performance data is as follows:
1. In the navigation tree window, right-click the management server, group or monitored machine that you
want to configure the settings, and select Collecting Data.
2. Click Set Collecting Data Settings menu.
The Collecting Data Setting List window appears.
3. Select a node in the Object node list and the current settings for the selected node can be seen in the
Collecting data setting list. It is set as inheriting from the parent node's settings by default.

88
4. To modify the settings for the selected node, clear the Inherit from parent settings box.
5. To add a collecting data setting to the list for the selected node, click Add. To remove a collecting data
setting from the list for the selected node, select the setting to be removed and click Remove. To modify a
collecting data setting, select the setting to be modified and click Modify.
If the collecting data setting which is target of threshold monitoring is deleted, the
threshold monitoring is stopped. But the corresponding performance monitor
settings are not deleted automatically. If necessary, delete these performance
monitor settings manually on the Set Threshold Monitor window.
See "6.1.1 How to set up threshold monitoring" for details on the Set Threshold
Monitor window.
Note
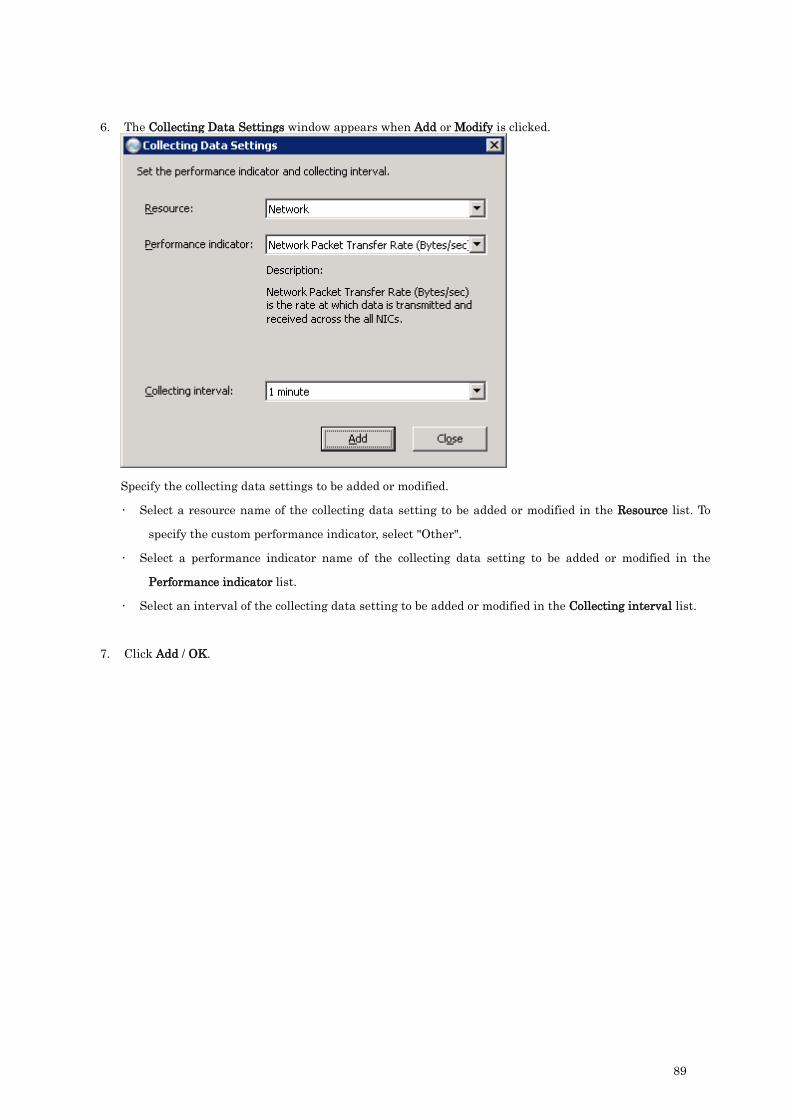
89
6. The Collecting Data Settings window appears when Add or Modify is clicked.
Specify the collecting data settings to be added or modified.
• Select a resource name of the collecting data setting to be added or modified in the Resource list. To
specify the custom performance indicator, select "Other".
• Select a performance indicator name of the collecting data setting to be added or modified in the
Performance indicator list.
• Select an interval of the collecting data setting to be added or modified in the Collecting interval list.
7. Click Add / OK.
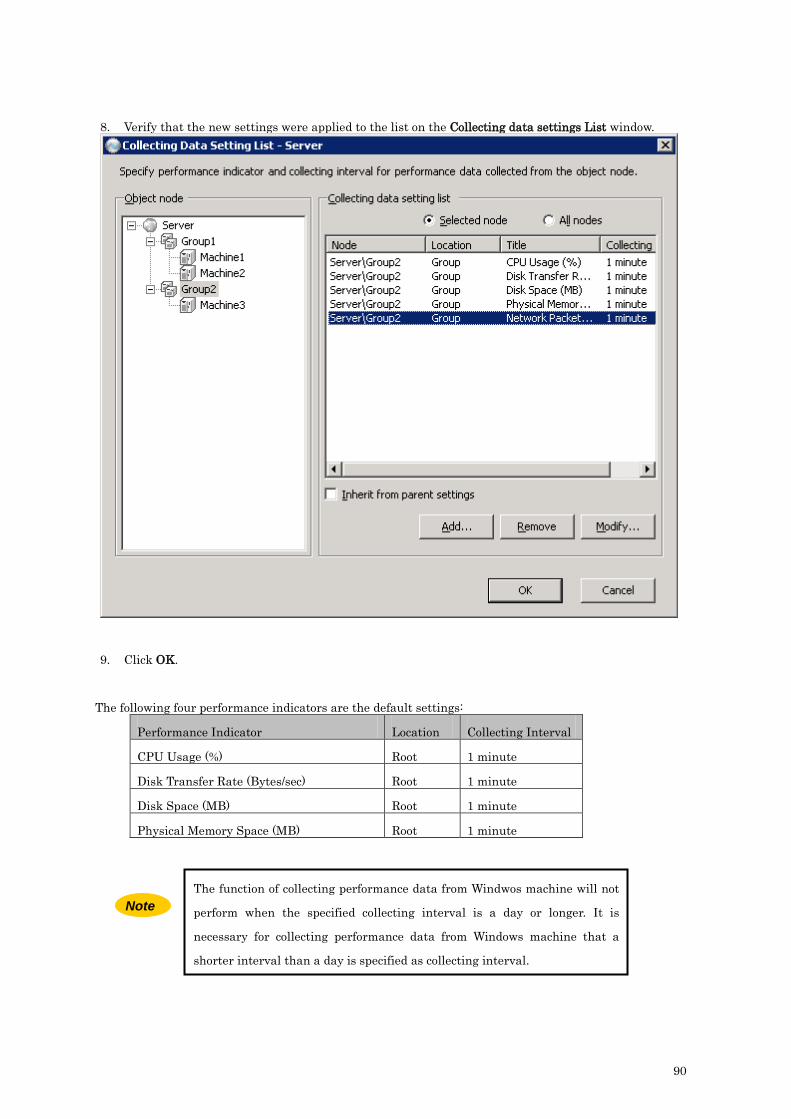
90
The function of collecting performance data from Windwos machine will not
perform when the specified collecting interval is a day or longer. It is
necessary for collecting performance data from Windows machine that a
shorter interval than a day is specified as collecting interval.
8. Verify that the new settings were applied to the list on the Collecting data settings List window.
9. Click OK.
The following four performance indicators are the default settings:
Performance Indicator Location Collecting Interval
CPU Usage (%) Root 1 minute
Disk Transfer Rate (Bytes/sec) Root 1 minute
Disk Space (MB) Root 1 minute
Physical Memory Space (MB) Root 1 minute
Note

91
4.2.3 Collecting Data Settings Automatically Applied by SystemProvisioning Linkage
The system configuration information and collecting data settings (Monitoring Profile) specified on
SystemProvisioning can be applied automatically to System Monitor - Performance Monitoring Services. For
applying the settings on SystemProvisioning to System Monitor - Performance Monitoring Services, it is
necessary to specify the monitoring profile and enable the performance data collection settings on the
group/model property.
Applied collecting data settings from SystemProvisioning to System Monitor - Performance Monitoring
Services are listed in blue in the Collecting Data Setting List window.
It is impossible to delete or modify the applied collecting data settings, but it is possible to add other collecting
data settings to the list for the automatically applied node.
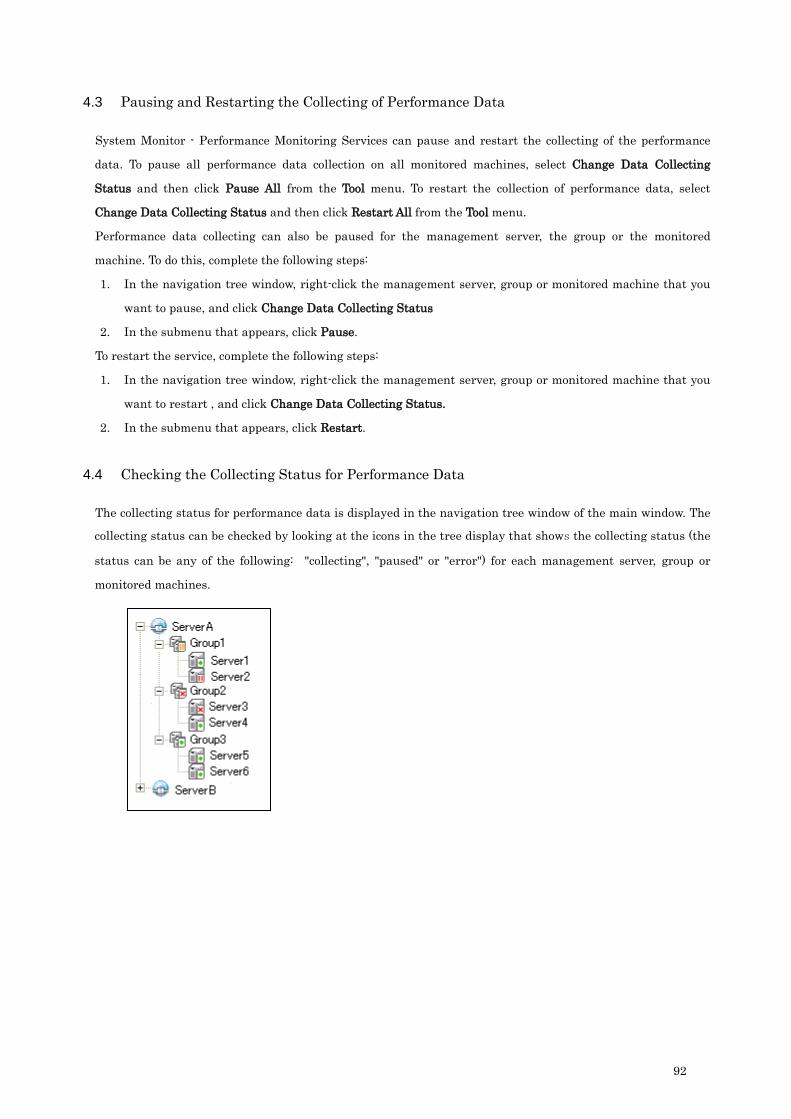
92
4.3 Pausing and Restarting the Collecting of Performance Data
System Monitor - Performance Monitoring Services can pause and restart the collecting of the performance
data. To pause all performance data collection on all monitored machines, select Change Data Collecting
Status and then click Pause All from the Tool menu. To restart the collection of performance data, select
Change Data Collecting Status and then click Restart All from the Tool menu.
Performance data collecting can also be paused for the management server, the group or the monitored
machine. To do this, complete the following steps:
1. In the navigation tree window, right-click the management server, group or monitored machine that you
want to pause, and click Change Data Collecting Status
2. In the submenu that appears, click Pause.
To restart the service, complete the following steps:
1. In the navigation tree window, right-click the management server, group or monitored machine that you
want to restart , and click Change Data Collecting Status.
2. In the submenu that appears, click Restart.
4.4 Checking the Collecting Status for Performance Data
The collecting status for performance data is displayed in the navigation tree window of the main window. The
collecting status can be checked by looking at the icons in the tree display that shows the collecting status (the
status can be any of the following: "collecting", "paused" or "error") for each management server, group or
monitored machines.

93
The meaning of each icon is as follows:
(1) Management Servers
Connected to the management server, data is being collected normally for all
machines under the management server
Disconnected from the management server
Connection Error
Connected to the management server, data collecting for all machines under
the management server has been paused
Connected to the management server, data collecting for a machine or
machines under the management server has been paused
Connected to the management server, data collecting failed for a machine or
machines under the management server
Connected to the management server, data is being collected normally for all
machines under the management server and an over-threshold status has
occurred
Connected to the management server, data collecting for a machine or
machines under the management server has been paused and an over-
threshold status has occurred
Connected to the management server, data collecting failed for a machine or
machines under the management server and an over-threshold status has
occurred
(2) Monitored Machines
Data is being collected
Data collecting has been paused
Collecting failed for some Performance Indicator items
(performance indicator error status)
The machine cannot be accessed or collecting failed for all Performance
Indicator items (access error status)
Data is being collected, and an over-threshold status (warning) has occurred
Data is being collected, and an over-threshold status (critical) has occurred
Collecting failed for some Performance Indicator items, and an over-threshold
status (warning) has occurred
Collecting failed for some Performance Indicator items, and an over-threshold
status (critical) has occurred

94
(3) Groups
Data is being collected normally for all machine in the group
Data collecting for the group has been paused
Data collecting for a machine or machines in the group has been paused
Collecting failed for some Performance Indicator items for a machine or machines
in the group
A machine in the group cannot be accessed or collecting failed for all Performance
Indicator for a machine or machines in the group
Data is being collected normally for all machines in the group and an over-
threshold status (warning) has occurred
Data is being collected normally for all machines in the group and an over-
threshold status (critical) has occurred
Data collecting for a machine or machines in the group has been paused and an
over-threshold status (warning) has occurred
Data collecting for a machine or machines in the group has been paused and an
over-threshold status (critical) has occurred
Collecting failed for some Performance Indicator items for a machine or machines
in the group and an over-threshold status (warning) has occurred
Collecting failed for some Performance Indicator items for a machine or machines
in the group and an over-threshold status (critical) has occurred
One or more machines in the group cannot be accessed or collecting failed for all
Performance Indicators for a machine in the group, and an over-threshold status
(warning) has occurred
One or more machines in the group cannot be accessed or collecting failed for all
Performance Indicators for a machine in the group, and an over-threshold status
(critical) has occurred

95
Chapter 5 Performance Status Display and File Output
5.1 Displaying Performance Graphs
System Monitor - Performance Monitoring Services displays performance data for the system graphically.
Displaying performance data graphically enables trends to be identified intuitively, and makes it easier to
analyze the operational status of the system.
Graphs of Performance Indicators that are currently being collected can be displayed for each management
server, for each group or for each individual machine. See “5.1.1 How to Display Performance Graphs” for more
information about displaying the Performance Indicator graphs. Also, see “5.1.3 Simple Graph Display
Function” for information on the use of the simple graph display, which uses default values.
See “5.3 File Output” for methods to output performance data displayed in a graph to CSV or other files.
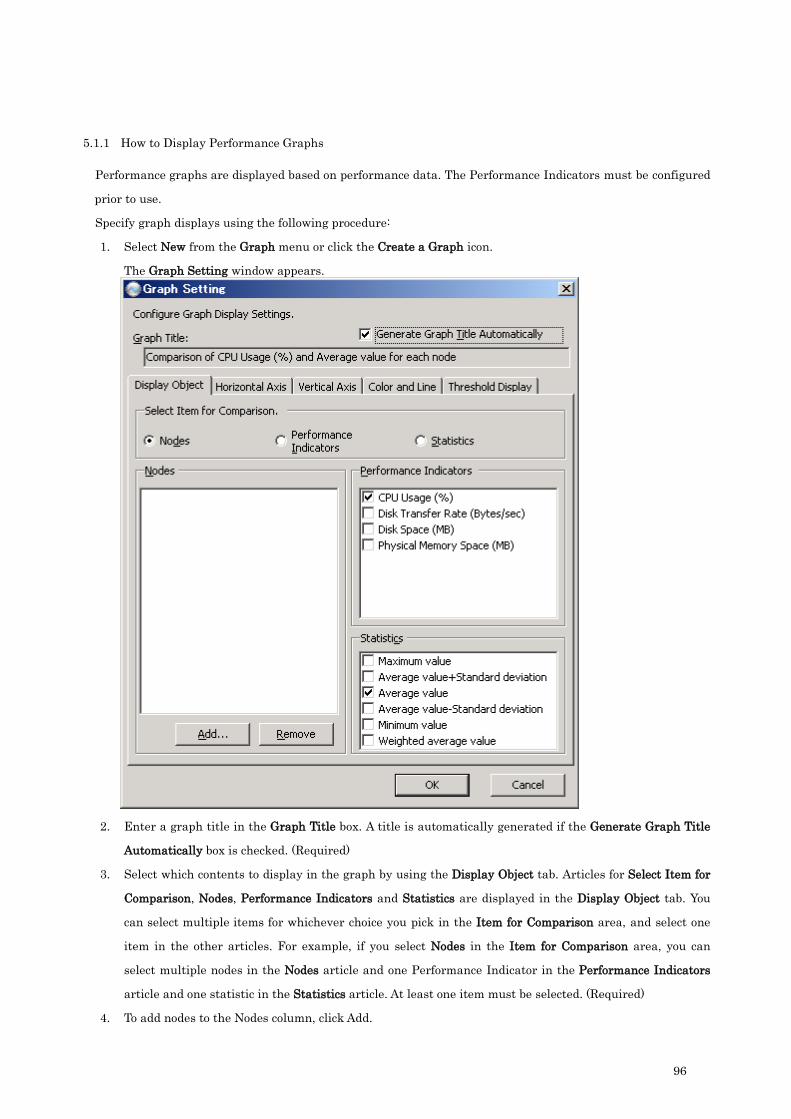
96
5.1.1 How to Display Performance Graphs
Performance graphs are displayed based on performance data. The Performance Indicators must be configured
prior to use.
Specify graph displays using the following procedure:
1. Select New from the Graph menu or click the Create a Graph icon.
The Graph Setting window appears.
2. Enter a graph title in the Graph Title box. A title is automatically generated if the Generate Graph Title
Automatically box is checked. (Required)
3. Select which contents to display in the graph by using the Display Object tab. Articles for Select Item for
Comparison, Nodes, Performance Indicators and Statistics are displayed in the Display Object tab. You
can select multiple items for whichever choice you pick in the Item for Comparison area, and select one
item in the other articles. For example, if you select Nodes in the Item for Comparison area, you can
select multiple nodes in the Nodes article and one Performance Indicator in the Performance Indicators
article and one statistic in the Statistics article. At least one item must be selected. (Required)
4. To add nodes to the Nodes column, click Add.

97
A Browse nodes window appears.
5. Select the nodes you want to add, and click OK.
6. If the Performance Indicator title for the management server doesn't appear in the Performance
Indicators column, click Cancel in the Graph Setting window. You must define a Performance Indicator
titles in the management console beforehand. See “5.1.4 Defining a Performance Indicator Title” for
information on how to add a Performance Indicator title.
7. Click the Horizontal Axis tab, and make specifications relating to the time axis.
The settings that are made here depend on which display period was specified (Historical or Realtime).

98
For Historical graphs, make the following specifications:
• Display period
Specify the Start time and Period. Start time specifies when the graph will start displaying data, and
Period specifies the period of time of which the data is displayed in the graph.
Period can be specified between one and 1000 and in the following units:.minutes, hours, days, weeks,
months, or years. You can specify Start time to start before the current time by checking the Start time
is specified period before current time box.
• Plotting interval
Specify individual settings or automatic settings. For individual settings, the following time periods can
be specified: 1 minute, 5 minutes, 30 minutes, 1 hour, 4 hours, 1 day, 1 week, or 1 month.
• Gridlines
Select automatic settings or individual settings for the gridline interval. For individual settings, the
Major and Minor gridline intervals can be specified between one and 1000 and in the following units:
minutes, hours, days, weeks, months, or years.
For Realtime graphs, make the following specifications:
• Display period: The display period can be specified between 1 and 1000. You can specify "minutes",
"hours", "days", "weeks", "months", or "years" for the units.
• Polling interval for updating data: You can specify "1 second", “5 seconds”, “20 seconds”, “1 minute”, “5
minutes”, “20 minutes”, “1 hour”, “4 hours”, or “1 day” for the graph update interval
• Plotting interval
Specify individual settings or automatic settings. For individual settings, the following time periods can
be specified: 1 minute, 5 minutes, 30 minutes, 1 hour, 4 hours, 1 day, 1 week, or 1 month.
• Gridlines: Select either automatic settings or individual settings for the gridline interval. For individual
settings, the Major and Minor gridline intervals can be specified between 1 and 1000. You can specify
"minutes", "hours", "days", "weeks", "months", or "years" as the unit for the gridline interval.

99
8. Use the Vertical Axis tab on the Graph Setting window to change graph vertical axis values from their
default setting.
The following specifications can be made:
• Display range
Specify the upper- and lower-bounds between zero and 1000. The default upper-bound is 100, and the
default lower-bound is zero.
• Gridlines
Select either automatic settings or individual settings for the graduation interval. For individual
settings, uncheck the Automatically set gridlines display interval box and then specify the Major and
Minor gridline intervals. The gridline intervals can be specified between one and 1000.
• Scale
Select either automatic settings or individual settings for the Performance Indicator in the list box. The
default behavior is for the scale to be set automatically. For individual settings, check the Set the scale
box and select a scale for each Performance Indicator item as 10 to the nth power (where n is an integer
between -10 and 10). The data values are multiplied by the specified scale. The scale should be set so
that the data values fit within the vertical axis of the graph.
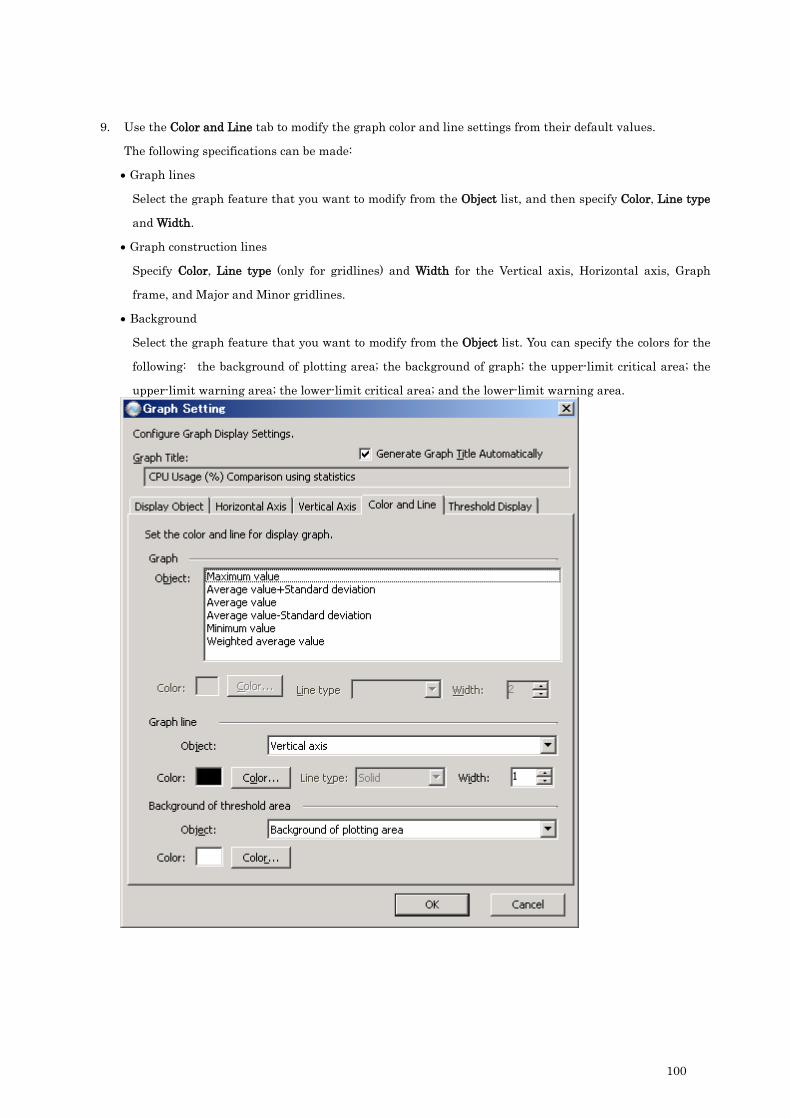
100
9. Use the Color and Line tab to modify the graph color and line settings from their default values.
The following specifications can be made:
• Graph lines
Select the graph feature that you want to modify from the Object list, and then specify Color, Line type
and Width.
• Graph construction lines
Specify Color, Line type (only for gridlines) and Width for the Vertical axis, Horizontal axis, Graph
frame, and Major and Minor gridlines.
• Background
Select the graph feature that you want to modify from the Object list. You can specify the colors for the
following: the background of plotting area; the background of graph; the upper-limit critical area; the
upper-limit warning area; the lower-limit critical area; and the lower-limit warning area.

101
10. Use the Threshold Display tab to specify graph thresholds.
11. Check the Display threshold area box.

102
12. Click Browse.
The Browse threshold definition window appears.
13. Select a threshold definition from the Threshold definition list, and then click OK to apply the threshold
contents to the Threshold Display tab. You can also manually specify each value for displaying threshold
areas. To do so, you need to specify Performance Indicator title for using scale too.
14. After making these specifications, click OK.
15. Verify that your changes are reflected in the performance graph that is displayed in the graph display
pane.

103
5.1.2 Graph Window
Graph Window displayed on Graph Display Pane is explained below.
Graph
• Line Graph
Target data is displayed in line graph.
• Vertical Axis
The vertical axis range of the graph is configured in Vertical Axis tab on Graph Setting Window.
• Horizontal Axis
The horizontal axis range of the graph is configured in Horizontal Axis tab on Graph Setting Window.
• Threshold area
The threshold areas on the graph are configured in the Threshold Display tab on Graph Setting Window and
the colors of them are configured in Color and Line tab on Graph Setting Window.
Graph Summary List
• Node Name / Performance Indicator / Statistics
Target object names displaying as a graph are displayed. The settings in Display Object tab on Graph Setting
Window are displayed.
• Color / Line Type
Colors and line types used for displaying a graph are displayed. The settings in Color and Line tab on Graph
Setting Window are displayed.
• Latest Value / Maximum Value / Average Value / Minimum Value
Graph Summary List
Graph

104
Scale is updated in real time when automatic scale setting is enabled. Shape
of the graph will be changed when the scale is updated automatically.
Latest value, maximum value, average value and minimum value of the graph line currently shown on Graph
Window are displayed.
• Scale
Scale used to display the graph. Raw data values multiplied by the value of the scale are displayed in the
graph. The specified setting is displayed when the scale is specified manually in Vertical Axis tab on Graph
Setting Window. When automatical scale setting is enabled, an adjusted scale to display a whole graph within
a default vertical display range of 0 to 100 is displayed.
5.1.3 Simple Graph Display Function
You can easily display real time graphs with default values. The following graph types use default values to
quickly display graphs without having to configure specific information. The graph types and their default
values are listed below.
(1) Graph Display from Management Server Node
1. Right-click the management server name from the navigation tree window, and then click Display Graph.
2. Click Groups, Performance Indicators, or Statistics to display the corresponding graph. The following
default values are used.
Menu Node Performance Indicator Statistics Threshold
Groups All groups Top Performance
Indicator from Edit
Performance Indicator
window
Average None
Performance
Indicators
Management
server
All Performance
Indicators applied on
Collecting Data Setting
List window
Average None
Statistics Management
server
Top Performance
Indicator from Edit
Performance Indicator
window
All
statistics
None
Note

105
(2) Graph Display from Group Node
1. Right-click the group name from the navigation tree window, and then click Display Graph.
2. Click Machines, Performance Indicators, or Statistics to display the corresponding graph. The following
default values are used.
Menu Node Performance Indicator Statistics Threshold
Machines All machines
belonging to the
group
Top Performance
Indicator from Edit
Performance Indicator
window
Average None
Performance
Indicators
Group All Performance
Indicators applied on
Collecting Data Setting
List window
Average None
Statistics Group Top Performance
Indicator from Edit
Performance Indicator
window
All
statistics
None
(3) Graph Display from Machine Node
1. Right-click the machine name from the navigation tree window, and then click Display Graph.
2. Click Performance Indicators or VMServer Load Condition to display the corresponding graph. The
following default values are used.
Menu Node Performance Indicator Statistics Threshold
Performance
Indicators
Machine All Performance
Indicators applied on
Collecting Data Setting
List window
Average None
VMServer
Load
Condition
Virtual machine
server and
virtual machines
running on it
Top Performance
Indicator from Edit
Performance Indicator
window
Average Bound value of the VM
Optimized Placement
settings on
SystemProvisioning
The VMServer Load Condition menu is available in the following conditions:
• The selected machine is applied from SystemProvisioning configuration information.
• The selected machine is a virtual machine server or a virtual machine.

106
5.1.4 Defining a Performance Indicator Title
Performance Indicator titles must be defined in the management console beforehand to be displayed in a graph.
Performance Indicator titles are defined from the Edit Performance Indicator window. You can also add
Performance Indicator titles by clicking Apply All from the Collecting Data Settings window.
The following procedure is the method for defining Performance Indicator titles from the Edit Performance
Indicator window.
(1) To display the Edit Performance Indicator window, select Options from the Graph menu and then click
Performance Indicator.
The Edit Performance Indicator window appears.
(2) Initial state
The following four types of Performance Indicators are listed by default.
• CPU Usage (%)
• Disk Transfer Rate (Bytes/sec)
• Disk Space (MB)
• Physical Memory Space (MB)
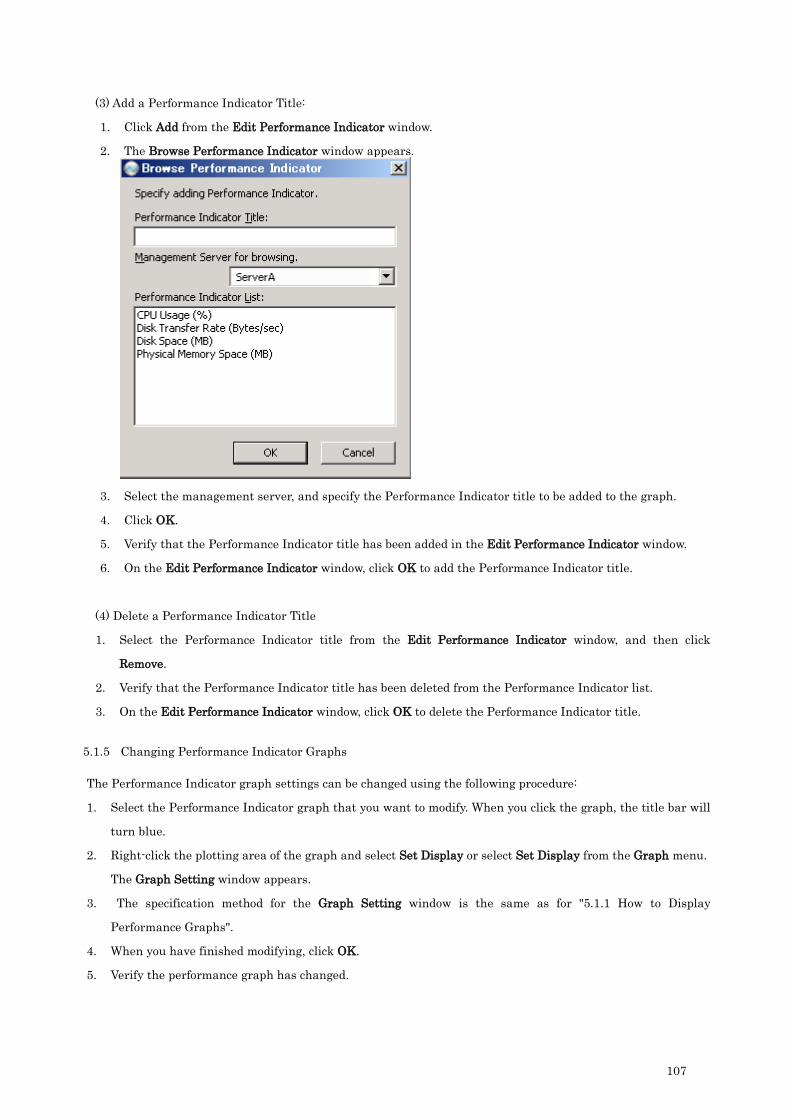
107
(3) Add a Performance Indicator Title:
1. Click Add from the Edit Performance Indicator window.
2. The Browse Performance Indicator window appears.
3. Select the management server, and specify the Performance Indicator title to be added to the graph.
4. Click OK.
5. Verify that the Performance Indicator title has been added in the Edit Performance Indicator window.
6. On the Edit Performance Indicator window, click OK to add the Performance Indicator title.
(4) Delete a Performance Indicator Title
1. Select the Performance Indicator title from the Edit Performance Indicator window, and then click
Remove.
2. Verify that the Performance Indicator title has been deleted from the Performance Indicator list.
3. On the Edit Performance Indicator window, click OK to delete the Performance Indicator title.
5.1.5 Changing Performance Indicator Graphs
The Performance Indicator graph settings can be changed using the following procedure:
1. Select the Performance Indicator graph that you want to modify. When you click the graph, the title bar will
turn blue.
2. Right-click the plotting area of the graph and select Set Display or select Set Display from the Graph menu.
The Graph Setting window appears.
3. The specification method for the Graph Setting window is the same as for "5.1.1 How to Display
Performance Graphs".
4. When you have finished modifying, click OK.
5. Verify the performance graph has changed.
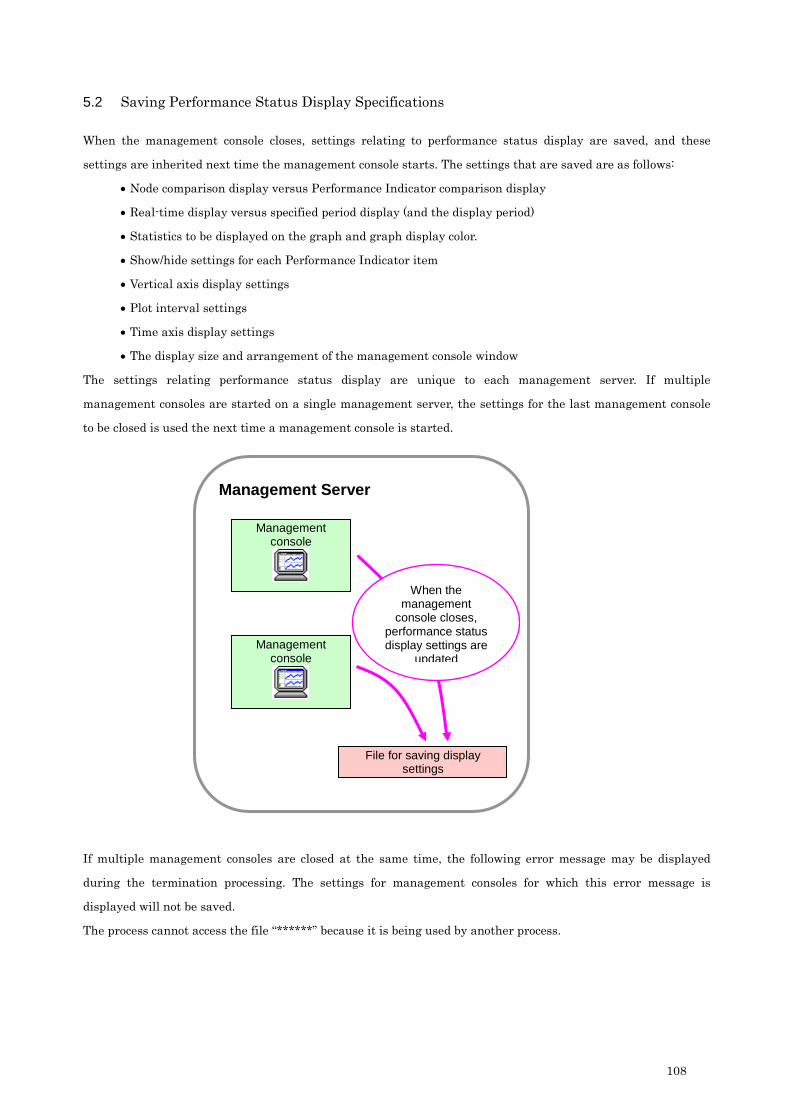
108
5.2 Saving Performance Status Display Specifications
When the management console closes, settings relating to performance status display are saved, and these
settings are inherited next time the management console starts. The settings that are saved are as follows:
• Node comparison display versus Performance Indicator comparison display
• Real-time display versus specified period display (and the display period)
• Statistics to be displayed on the graph and graph display color.
• Show/hide settings for each Performance Indicator item
• Vertical axis display settings
• Plot interval settings
• Time axis display settings
• The display size and arrangement of the management console window
The settings relating performance status display are unique to each management server. If multiple
management consoles are started on a single management server, the settings for the last management console
to be closed is used the next time a management console is started.
If multiple management consoles are closed at the same time, the following error message may be displayed
during the termination processing. The settings for management consoles for which this error message is
displayed will not be saved.
The process cannot access the file “******” because it is being used by another process.
Management Server
Management console
Management console
File for saving display settings
When the management
console closes, performance status display settings are
updated

109
5.3 File Output
Outputs performance graph data displayed. It can be used with Microsoft Excel, and so forth, as the output file
formats are CSV and tab delineated text files.
5.3.1 File Output Methods
You must display performance data of output target beforehand on the performance graph window before
outputting files. See “5.1.1 How to Display Performance Graphs” for displaying performance graphs.
Output files in the following steps.
1. Set the performance graph of output target to active then click Output File in the Graph menu or right-
click in the plot area of the target performance graph, and then select Output File to display the output
settings window.
2. Specify filename
Filename is automatically set when the output settings window is displayed. To change the filename, direct
key input to the filename field or click the Browse button to select the output destination on the output file
window.
When the filename is changed to the relative path, the file is output to the relative path from the desktop
path of the current user.
Filenames automatically set consist of the following two parts.
[Path] + [Filename]
Path: The desktop path of the current user is set when the output settings window is displayed for the
first time. The path specified last time is set from the second time onward.
Filename: Set in a format shown below;
sysmon[Start Time]_[Span].[File Extension]
[Start Time] is the graph start time, and [Span] is the specified value of the graph display time span.
For [File Extension], “csv” or “txt” is set according to the file type.

110
3. Set file type.
When file type is changed, filename file extension, column separator and character encode format of the file
to be output are changed. See “1.8.5 Output Graph Data to File” for file type, column separator and
character encode format compatibility.
4. Set [Output the data in same line if time is same] checkbox.
Setting the checkbox to ON to enable specification outputs to same line as same time data when there are
differences in seconds units in multiple performance data time. The time to output to the file is formatted
as shown below at this time.
When less than 30 seconds, round down seconds.
When more than 30 seconds, round up seconds.
To output at exact time where performance data is collected, set the checkbox to OFF.
Specification is enabled while the checkbox is ON at preset.
5. Click the OK button to output the file with the specified filename. When a file already exists, an
overwrite confirmation window is displayed. When no problems exist when overwriting an existing file,
click the OK button.

111
Chapter 6 Threshold Monitoring and Notification
6.1 Configuring Threshold Monitoring
System Monitor - Performance Monitoring Services can detect and report load status events on monitored
machines by monitoring specified Performance Indicator thresholds Performance fault events can also be
notified to SystemProvisioning.
Thresholds can be set up for active Performance Indicators for both groups and individual machines.
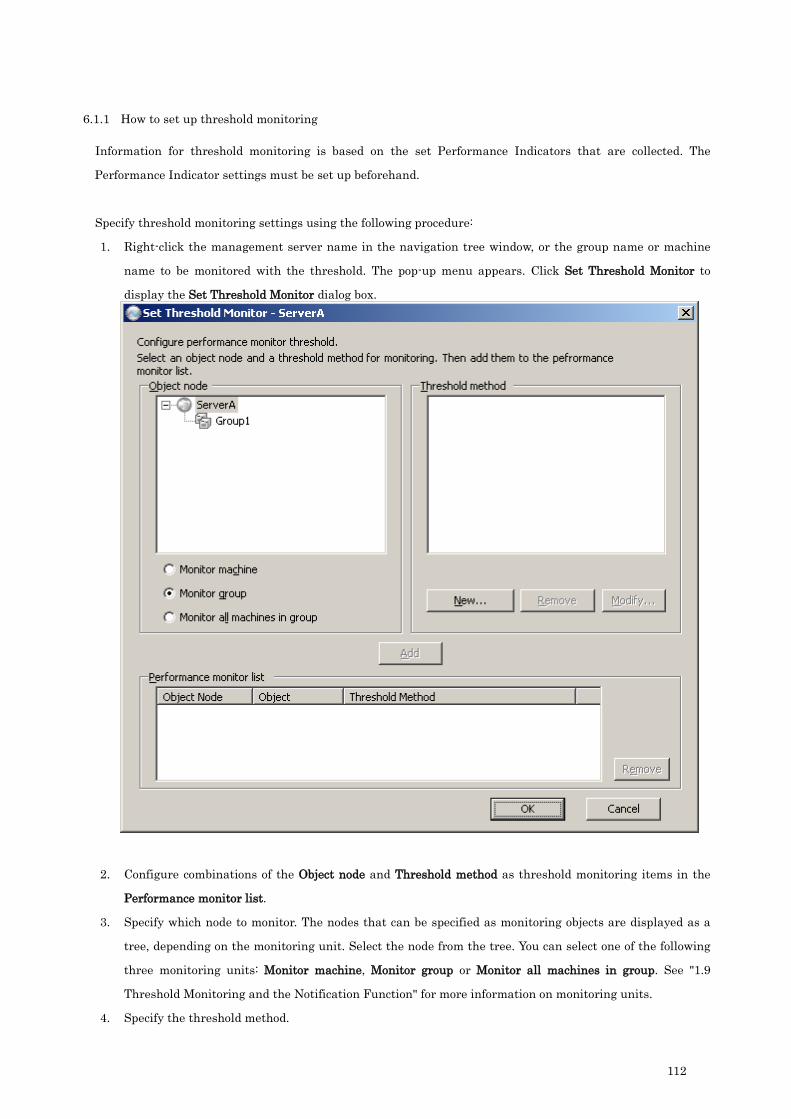
112
6.1.1 How to set up threshold monitoring
Information for threshold monitoring is based on the set Performance Indicators that are collected. The
Performance Indicator settings must be set up beforehand.
Specify threshold monitoring settings using the following procedure:
1. Right-click the management server name in the navigation tree window, or the group name or machine
name to be monitored with the threshold. The pop-up menu appears. Click Set Threshold Monitor to
display the Set Threshold Monitor dialog box.
2. Configure combinations of the Object node and Threshold method as threshold monitoring items in the
Performance monitor list.
3. Specify which node to monitor. The nodes that can be specified as monitoring objects are displayed as a
tree, depending on the monitoring unit. Select the node from the tree. You can select one of the following
three monitoring units: Monitor machine, Monitor group or Monitor all machines in group. See "1.9
Threshold Monitoring and the Notification Function" for more information on monitoring units.
4. Specify the threshold method.

113
5. To create a new threshold method, click New in the Threshold method section.
The Threshold Method Settings window appears. In the Threshold Method Settings window, configure
the threshold for one Performance Indicator item.
6. To modify an existing threshold method, select the threshold method from the list box, and then click
Modify.
The Threshold Method Settings window appears. In the Threshold Method Settings window, configure
the threshold for one Performance Indicator item.

114
7. To delete an existing threshold method, select the threshold method from the list box, and then click
Remove.
Specify the following items in the Threshold Method Settings window:
• Threshold method name
Enter the name of the threshold method in the Threshold method name text box. A threshold method
name can be generated automatically by clicking Generate Method Name. (Required)
• Performance Indicator and statistic
Select the Performance Indicator item and the statistics for the threshold to be defined from the
Performance Indicator and Statistics combo boxes. Statistics are only valid if the monitored object is a
group. (Required)
• Threshold and notification settings
Switch to the Upper Threshold, Lower Threshold and Notification Settings tabs and make further
settings.
The title of the threshold method obtained from SystemProvisioning and
then registered begins with [VMServer]. To make the names of the
threshold method unique, prevent the titles of manually registered
threshold method from beginning with [VMServer].
Note

115
8. When the Upper Threshold tab is selected, settings for upper-limit threshold values are displayed.
The following settings can be configured:
To specify upper-limit critical value monitoring, check the Enable upper-limit critical value monitor box.
When this box is checked, upper-limit critical value monitoring specifications can be made.
• Threshold: Specify the threshold for upper-limit abnormalities. Specify a value between 0 and
3.402823e+38.
• Notification to SystemProvisioning: Check this box to notify SystemProvisioning when the upper-limit
warning value has been exceeded. When notifying SystemProvisioning, select custom notification types
from the Over and At recovery boxes.
To specify upper-limit warning value monitoring, check the Enable upper-limit warning value monitor box.
When this box is checked, upper-limit warning value monitoring specifications can be made.
• Threshold: Specify the threshold for upper-limit warnings. Specify a value between 0 and 3.402823e+38.
• Notification to SystemProvisioning: Check this box to notify SystemProvisioning when the upper-limit
warning value has been exceeded. When notifying SystemProvisioning, select custom notification types
from the Over and At recovery boxes.

116
9. When the Lower Threshold tab is selected, settings items for lower limit threshold values are displayed.
Specify the following items here:
To specify lower-limit critical value monitoring, check the Enable lower-limit critical value monitor box. When
this box is checked, lower-limit critical value monitoring specifications can be made.
• Threshold: Specify the threshold for lower-limit abnormalities. Specify a value between 0 and 3.402823e+38.
• Notification to SystemProvisioning: Check this box to notify SystemProvisioning when the lower-limit
critical value has been exceeded. When notifying SystemProvisioning, select the custom notification types
from the Over and At recovery boxes.
To specify lower-limit warning value monitoring, check the Enable lower-limit warning value monitor box.
When this box is checked, lower-limit warning value monitoring specifications can be made.
• Threshold: Specify the threshold for lower-limit warnings. Specify a value between 0 and 3.402823e+38.
• Notification to SystemProvisioning: Check this box to notify SystemProvisioning when the lower-limit
warning value has been exceeded. When notifying SystemProvisioning, select the custom notification types
from the Over and At recovery boxes.

117
10. When the Notification Settings tab is selected, settings items relating to notification are displayed.
Specify the following items here:
• Notification conditions
Set up notification conditions in terms of the number of times that over-threshold is detected during a
sequence of performance data checks. The performance data check interval is the performance data
collecting interval that was specified in the collecting data setting. By default, a notification is made if over-
threshold is detected ten times out of ten checks. The number of checks and the number of over-threshold
times can be set between one and 1000.
• If you want to send another notification if the performance status does not recover from over-threshold
status, then check the in case of no recovery from the over-threshold status box. If this box is checked, then
repeat notifications are enabled. Specify the timing for repeat notifications in terms of the number of checks
since the previous notification. The number of checks can be specified between one and 1000.
11. After you make specifications for the threshold method settings, click OK, and then verify that the
settings have been applied in the Threshold method list box in the Set Threshold Monitor window.
12. Select the item you want to configure as a threshold monitoring setting from the Object node or the
Threshold method, and then click Add to add the threshold monitoring item to the Performance monitor
list. Multiple threshold monitoring settings can be configured.
118
13. To delete an existing threshold monitoring setting, select from the Performance monitor list, and then
click Remove to the right of the list.
6.1.2 How to display over-threshold areas on graphs
The configure threshold method information can be displayed in the background of graphs as over-threshold
areas. In the Threshold Display tab of the Graph Setting window, check the Display thresholds area box and
then select the threshold method information to be displayed. The background color for over-threshold areas is
configured in the Color and Line tab of the Graph Setting window using the Background of threshold area
option.
6.1.3 Threshold setting automatically applied by SystemProvisioning linkage
When the configuration information for the group for which the above VM Optimization is enabled is reflected
on System Monitor - Performance Monitoring Services of SystemProvisioning, threshold settings that are
tailored to the VM Optimization settings and which are specified in SystemProvisioning are automatically
created and applied to all the machines in the group. The automatically applied threshold setting can be
checked in the Set Threshold Monitor dialog box.
The performance indicator of the performance monitor setting to be added
must be set to collect from the target node. Note
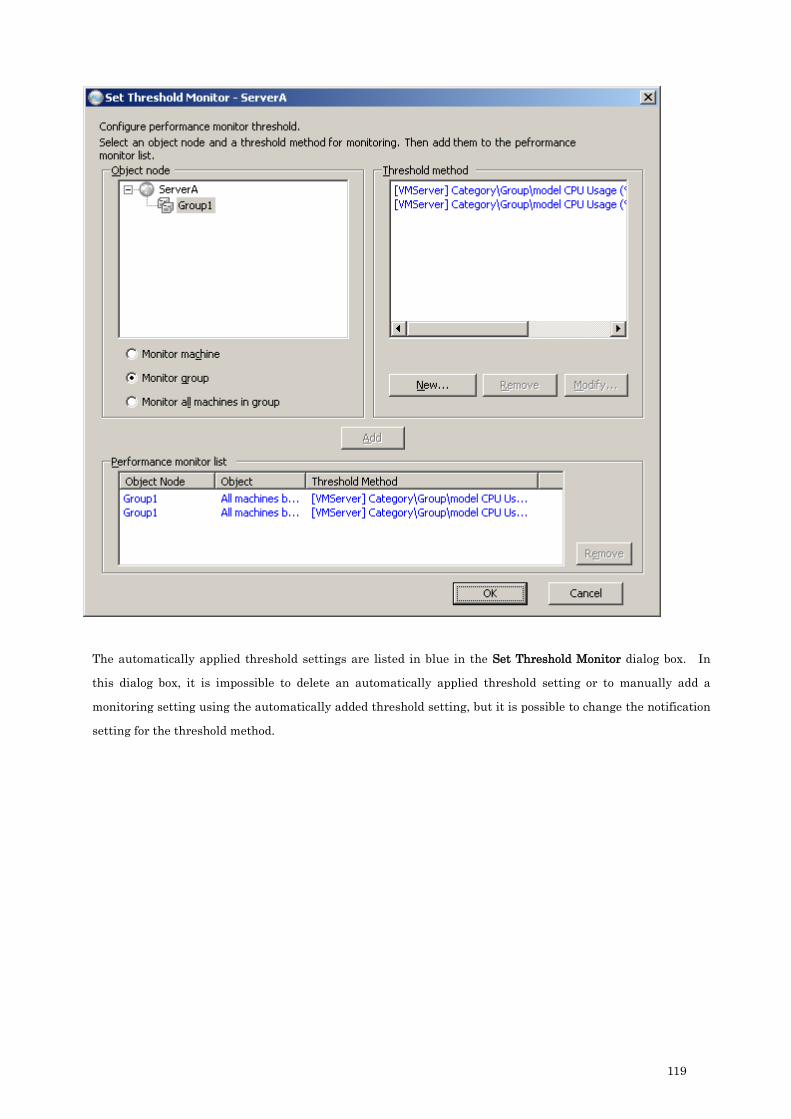
119
The automatically applied threshold settings are listed in blue in the Set Threshold Monitor dialog box. In
this dialog box, it is impossible to delete an automatically applied threshold setting or to manually add a
monitoring setting using the automatically added threshold setting, but it is possible to change the notification
setting for the threshold method.

120

121
Chapter 7 Management of Performance Data
7.1 Data Management Tool
This section describes how to change the data storage period and perform data summarization.
1. On the Start menu, point to SigmaSystemCenter - Tools and then click System Monitor Data Management
Tool to start the System Monitor Data Management Tool.

122
2. To change the storage period for the summary data, select the summary interval to be changed in the list
and then click Modify to display the Summary Setting dialog box. Change the storage period, and then click
OK.
3. To change the storage period for the collected data, change the collected data storage period setting for the
System Monitor Data Management Tool.
Note
Make these settings so that the storage periods for the summary data items
satisfy the following conditions.
Storage period for 5 minutes ≤ Storage period for 15 minutes ≤ Storage
period for 1 hour ≤ Storage period for 1 day
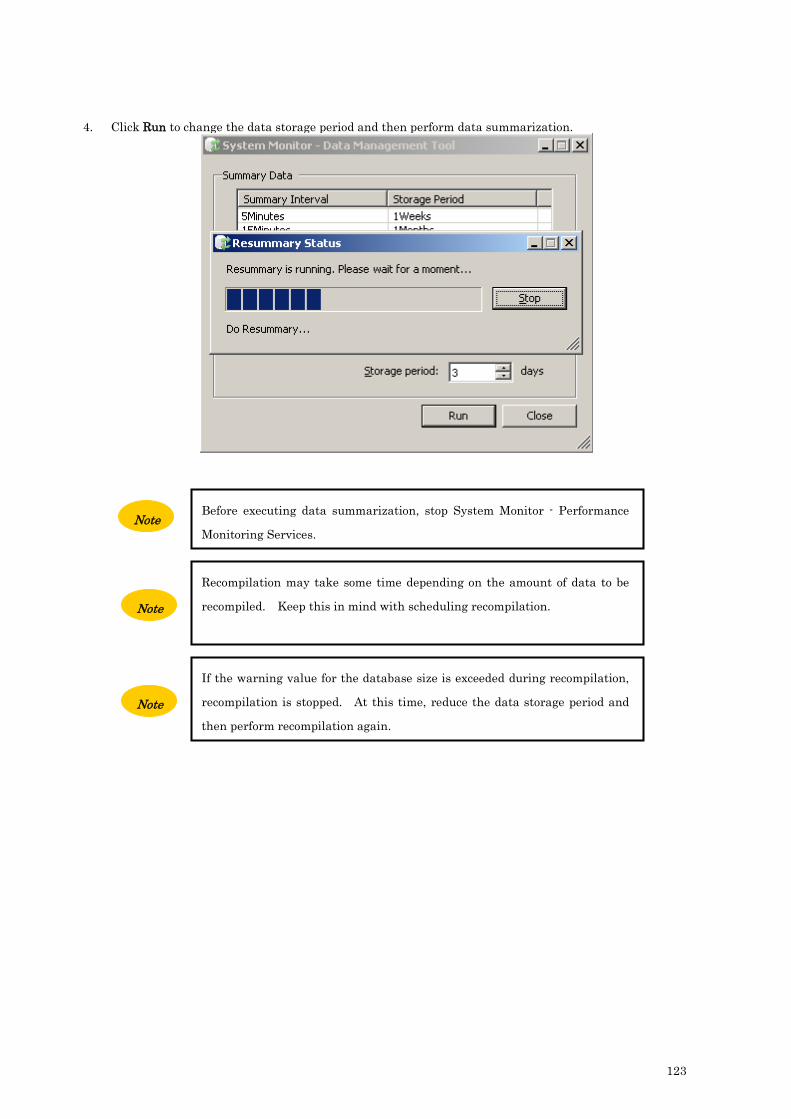
123
4. Click Run to change the data storage period and then perform data summarization.
Note
Before executing data summarization, stop System Monitor - Performance
Monitoring Services.
Note
Recompilation may take some time depending on the amount of data to be
recompiled. Keep this in mind with scheduling recompilation.
Note
If the warning value for the database size is exceeded during recompilation,
recompilation is stopped. At this time, reduce the data storage period and
then perform recompilation again.
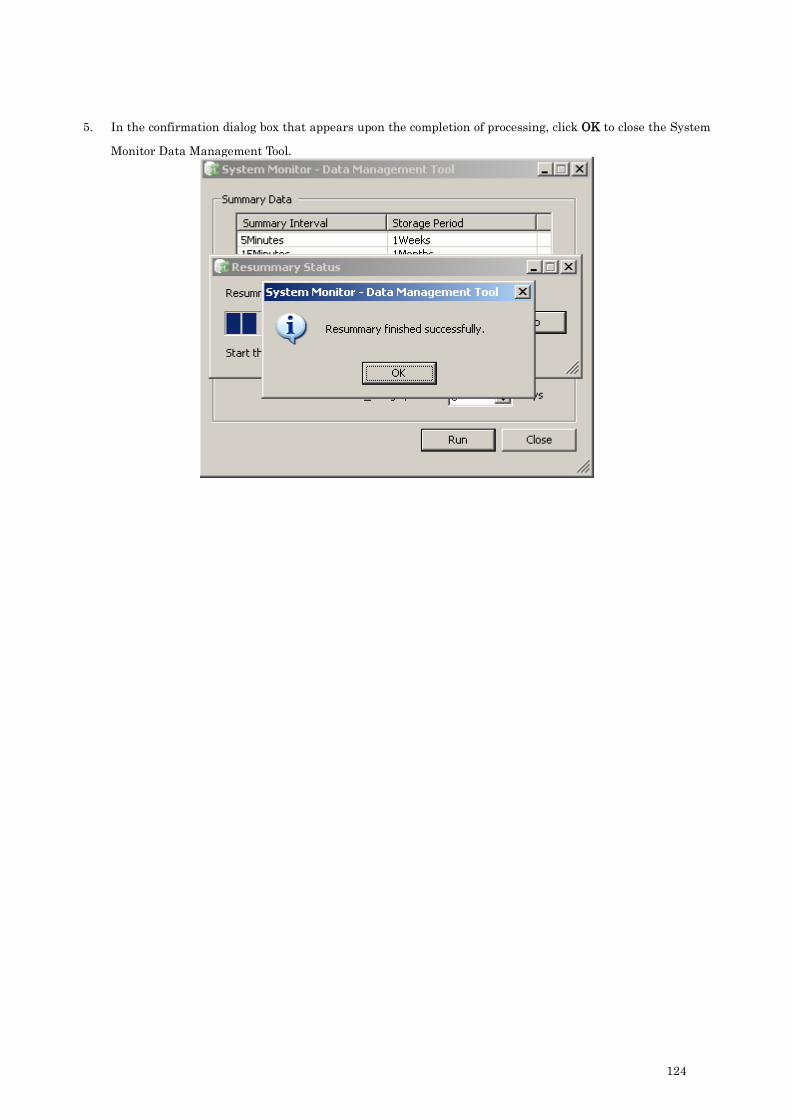
124
5. In the confirmation dialog box that appears upon the completion of processing, click OK to close the System
Monitor Data Management Tool.

125
7.2 Database Size Monitoring
7.2.1 Database size warning setting
The database size monitoring function checks the database size every hour while the Performance
Monitoring Service is active. If the database size exceeds the specified value, a warning is issued. The
default database size at which a warning is issued is 3.6 GB. This alarm value can be changed. Change
the alarm value as described below.
1. Start up the management console for System Monitor - Performance Monitoring Services.
2. Right-click the management server name in the navigation tree window of the management console main
window to display the pop-up menu.
3. Click Set Configuration.
4. Click the Database Size tab.
5. Change the warning value.
6. Click OK to close the Configuration dialog box.
126
7.2.2 Database size warning
If the database size exceeds the specified warning value, the following message appears in the log window of
the connected management console, and is also recorded in the event log.
- Type: Warning
- Event ID: 67
- Message:
The database size has exceeded warning value WarningSizeGB. The current size is CurrentSizeGB.
Note
The database monitoring function monitors the size of the database area
used by System Monitor - Performance Monitoring Services. The size of
other database areas in the same database instance is not included in the
target database size.

127
Chapter 8 Command-Line Interface
8.1 ssc-perf Command
The ssc-perf command can display the performance data collected by System Monitor - Performance
Monitoring Services on the command prompt. This makes it possible to track the performance trends without
starting the management console. The ssc-perf command module is installed in the directory shown below:
<Installation Directory>\bin (Default value:%ProgramFiles%\NEC\SystemMonitorPerformance\bin)
An administrator privilege is needed to run the ssc-perf command.
8.1.1 The Basic Syntax
This section explains the basic syntax of the ssc-perf command. Help is displayed if parameters are omitted.
<Syntax>
<Parameters>
The following values can be specified for the option:
Option Description
-h Display help.
-v Display version information.
ssc-perf option | command subcommand [parameter] …
If the User Account Control, UAC, is valid, you need to execute with the
Administrator mode. For example, right-click Command Prompt and click
Run as administrator to launch the ssc-perf commands.
Note

128
8.1.2 show performancedata Command
Display the performance data.
<Syntax>
<Parameters>
Parameter Required
/Optional
Description
-node Node
*2
Required
*1
Specify the path of the node on System Monitor -
Performance Monitoring Services.
Sample:
-node "GroupName\MachineName"
-path Path
*2
Required
*1
Specify the path of the node on SystemProvisioning.
Sample:
-path "CategoryName\GroupName\MachineName"
-indicator Indicator
*2
Required Specify the title of the performance indicator.
-statistic Statistic
*2
Required Specify the title of statistical method.
The following values can be specified:
Value Description
Ave Displays the average value.
Max Displays the maximum value.
Min Displays the minimum value.
WeightAve Displays the weighted average
value.
UpperRange Displays the average + standard
deviation value.
LowerRange Displays the average - standard
deviation value.
[-start StartTime] Optional Specify the start time. Format depends on the time
settings of the management server.
[-end EndTime] Optional Specify the end time. Format depends on the time
settings of the management server.
[-period Period] Optional Specify the period. Default is 01:00.
Format: d | [d.]hh:mm[:ss]
ssc-perf show performancedata {-node Node | -path Path} -indicator Indicator -
statistic Statistic [parameter]…

129
[-interval Interval] Optional Specify the interval of the data. Default is 00:01.
Format: d | [d.]hh:mm[:ss]
[-port PortNumber] Optional Specify the port number of the service to connect.
Default is 26200.
[-tab | -t] Optional Use a tab as a delimiter in displaying performance
data. If omitted, use a comma.
*1 Either -node or -path is required. These two parameters cannot be specified at the same
time.
*2 You can specify multiple values for only one of the three required parameters (-node (or -
path), -indicator and -statistic).
< Sample Output>
C:\Documents and Settings\Administrator>ssc-perf show performancedata -node
Group1\machine1 Group1\machine2 -indicator "CPU Usage (%)" -statistic Ave -
period 00:10
Period 1/1/2010 00:00:00 AM-1/1/2010 00:10:00 00:10:00 AM Indicator:CPU Usage
(%) StatisticalMethod:Average
DateTime , Group1\machine1, Group1\machine2
1/1/2010 00:01:00 AM, 3.459734 , 3.534981
1/1/2010 00:02:00 AM, 7.41076 , 1.907642
1/1/2010 00:03:00 AM, 12.47074 , 0.7593492
1/1/2010 00:04:00 AM, 23.86721 , 3.245667
1/1/2010 00:05:00 AM, 27.60608 , 1.271073
1/1/2010 00:06:00 AM, 24.14691 , 7.729072
1/1/2010 00:07:00 AM, 23.14114 , 10.35331
1/1/2010 00:08:00 AM, 9.133735 , 8.398178
1/1/2010 00:09:00 AM, 4.893562 , 1.193273
1/1/2010 00:10:00 AM, 4.379085 , 0.8400003
C:\Documents and Settings\Administrator>
130
Chapter 9 Troubleshooting
9.1 The Event Log
System Monitor - Performance Monitoring Services records errors and operation event information in the
event log on the management server under the event log name "System Monitor - Performance Monitoring
Services".
A list of event logs is shown below.
9.1.1 Event Logs for Performance Monitoring Service
source name: SystemMonitorPerformanceService ID Type category Description
1 Information Service Started Performance Monitoring Service. 2 Information Service Stopped Performance Monitoring Service. 3 Information Service Paused Performance Monitoring Service. 4 Information Service Restarted Performance Monitoring Service. 5 Error Service Error when starting Performance Monitoring Service. 6 Error Service Error when stopping Performance Monitoring Service. 7 Error Service Error when pausing Performance Monitoring Service. 8 Error Service Error when restarting Performance Monitoring Service. 9 Information Management
console
The user(account: domain\account) from the machine ‘machine’
logged out. 10 Error Data collecting The specified performance data (title: 'title', category
name: ’category’, instance name: ’instance’, counter name: ’counter’)
can not be collected on the monitored machine ‘Machine’. This type of
performance data is not available for machine ‘Machine’. 11 Error Data collecting Failed to collect performance data (title: 'title', category
name: ’category’, instance name: ’instance’, counter name: ’counter’)
on the monitored machine ‘Machine’. 12 Error Other Failed to connect to the database (Server: Server\Instance,
DataBase: DataBase). 13 Error Other Failed to update the database. 14 Error Other Failed to initialize the data. 15 Error Other Failed to reference the database. 16 Warning Service Failed to save the Performance Monitoring Service settings. Will
read the previous settings at the next activation.
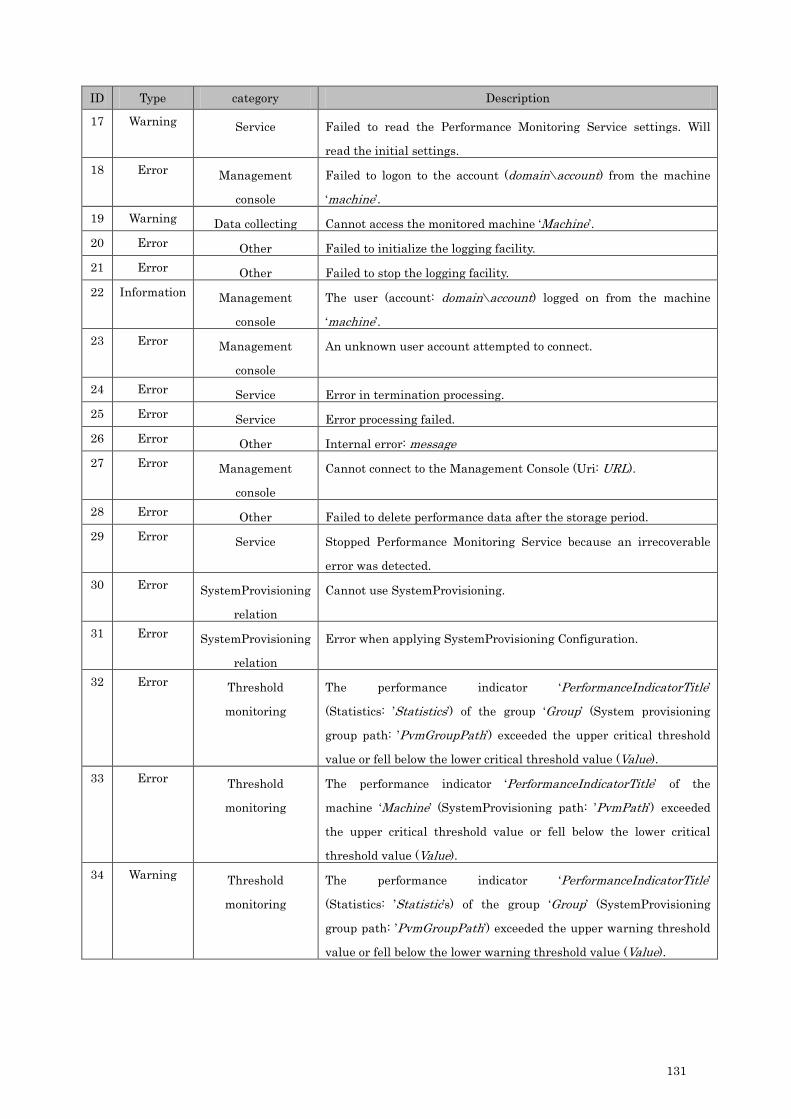
131
ID Type category Description
17 Warning Service Failed to read the Performance Monitoring Service settings. Will
read the initial settings. 18 Error Management
console
Failed to logon to the account (domain\account) from the machine
‘machine’. 19 Warning Data collecting Cannot access the monitored machine ‘Machine’. 20 Error Other Failed to initialize the logging facility. 21 Error Other Failed to stop the logging facility. 22 Information Management
console
The user (account: domain\account) logged on from the machine
‘machine’. 23 Error Management
console
An unknown user account attempted to connect.
24 Error Service Error in termination processing. 25 Error Service Error processing failed. 26 Error Other Internal error: message 27 Error Management
console
Cannot connect to the Management Console (Uri: URL).
28 Error Other Failed to delete performance data after the storage period. 29 Error Service Stopped Performance Monitoring Service because an irrecoverable
error was detected. 30 Error SystemProvisioning
relation
Cannot use SystemProvisioning.
31 Error SystemProvisioning
relation
Error when applying SystemProvisioning Configuration.
32 Error Threshold
monitoring
The performance indicator ‘PerformanceIndicatorTitle’
(Statistics: ’Statistics’) of the group ‘Group’ (System provisioning
group path: ’PvmGroupPath’) exceeded the upper critical threshold
value or fell below the lower critical threshold value (Value). 33 Error Threshold
monitoring
The performance indicator ‘PerformanceIndicatorTitle’ of the
machine ‘Machine’ (SystemProvisioning path: ’PvmPath’) exceeded
the upper critical threshold value or fell below the lower critical
threshold value (Value). 34 Warning Threshold
monitoring
The performance indicator ‘PerformanceIndicatorTitle’
(Statistics: ’Statistic’s) of the group ‘Group’ (SystemProvisioning
group path: ’PvmGroupPath’) exceeded the upper warning threshold
value or fell below the lower warning threshold value (Value).
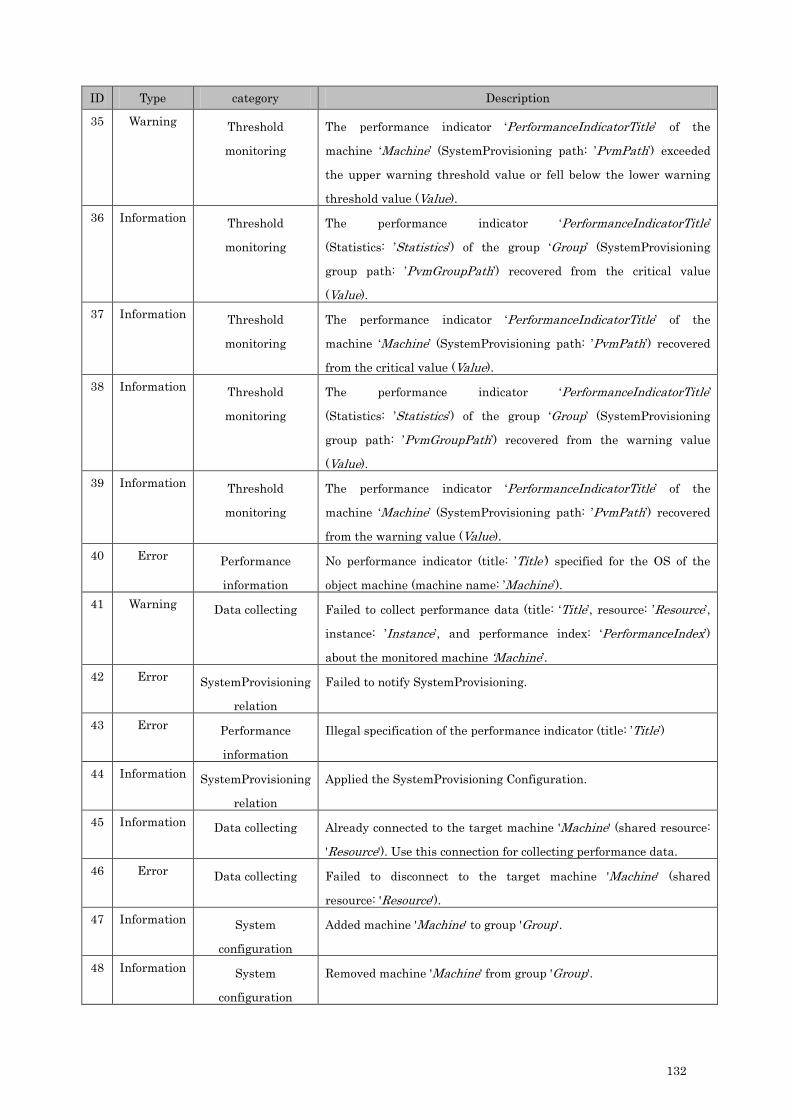
132
ID Type category Description
35 Warning Threshold
monitoring
The performance indicator ‘PerformanceIndicatorTitle’ of the
machine ‘Machine’ (SystemProvisioning path: ’PvmPath’) exceeded
the upper warning threshold value or fell below the lower warning
threshold value (Value). 36 Information Threshold
monitoring
The performance indicator ‘PerformanceIndicatorTitle’
(Statistics: ’Statistics’) of the group ‘Group’ (SystemProvisioning
group path: ’PvmGroupPath’) recovered from the critical value
(Value). 37 Information Threshold
monitoring
The performance indicator ‘PerformanceIndicatorTitle’ of the
machine ‘Machine’ (SystemProvisioning path: ’PvmPath’) recovered
from the critical value (Value). 38 Information Threshold
monitoring
The performance indicator ‘PerformanceIndicatorTitle’
(Statistics: ’Statistics’) of the group ‘Group’ (SystemProvisioning
group path: ’PvmGroupPath’) recovered from the warning value
(Value). 39 Information Threshold
monitoring
The performance indicator ‘PerformanceIndicatorTitle’ of the
machine ‘Machine’ (SystemProvisioning path: ’PvmPath’) recovered
from the warning value (Value). 40 Error Performance
information
No performance indicator (title: ’Title’) specified for the OS of the
object machine (machine name: ’Machine’). 41 Warning Data collecting Failed to collect performance data (title: ‘Title’, resource: ’Resource’,
instance: ’Instance’, and performance index: ‘PerformanceIndex’)
about the monitored machine ‘Machine’. 42 Error SystemProvisioning
relation
Failed to notify SystemProvisioning.
43 Error Performance
information
Illegal specification of the performance indicator (title: ’Title’)
44 Information SystemProvisioning
relation
Applied the SystemProvisioning Configuration.
45 Information Data collecting Already connected to the target machine 'Machine' (shared resource:
'Resource'). Use this connection for collecting performance data. 46 Error Data collecting Failed to disconnect to the target machine 'Machine' (shared
resource: 'Resource'). 47 Information System
configuration
Added machine 'Machine' to group 'Group'.
48 Information System
configuration
Removed machine 'Machine' from group 'Group'.

133
ID Type category Description
49 Information System
configuration
Moved machine 'Machine' from group 'Group' to group 'Group'.
50 Information System
configuration
Changed setting for machine 'Machine'.
51 Error Data collecting Machine 'Machine' had an access error. 52 Information Data collecting Machine 'Machine' recovered from an access error. 53 Information System
configuration
Added group 'Group'.
54 Information System
configuration
Removed group 'Group'.
55 Information System
configuration
Changed setting for group 'Group'.
56 Information Setting Changed settings for collecting performance data. 57 Information Setting Changed settings for threshold monitoring. 58 Information Setting Changed settings for configuration. 62 Warning Data collecting No performance data (title: 'Title') about machine 'Machine' existed.
Calculated performance data about group 'Group' at 'Time' without
performance data about machine 'Machine'. 63 Warning Data collecting Cannot finish collecting performance data (title: 'Title') about
machine 'Machine' in time (Time-Time) 64 Error Other Failed to output a debug log. 65 Warning SystemProvisioning
relation
Made a notification to SystemProvisioning on the node 'Node'.
SystemProvisioning Configuration Application is not enabled for the
node 'Node'. 66 Error Data collecting An error occurred in the connection to the target machine 'Machine'. 67 Warning Other The database size has exceeded warning value WarningSizeGB.
The current size is CurrentSizeGB. 69 Information Data collecting The collecting of the performance data (title: 'Title') is restarted on
the monitored machine 'Machine'. 70 Error Data collecting Failed to calculate performance data (machine: 'Machine', title:
'Title', resource: 'Resource', instance: 'Instance', performance index:
'Index'). 71 Information Data collecting Paused collecting performance data of machine 'Machine'. 72 Information Data collecting Restarted collecting performance data of machine 'Machine'. 73 Information Data collecting Paused collecting performance data of group 'Group'. 74 Information Data collecting Restarted collecting performance data of group 'Group'.

134
ID Type category Description
75 Warning Data collecting Failed to calculate performance data (machine: 'Machine', title:
'Title', Category: 'Category', Instance: 'Instance', Counter: 'Counter'). 76 Information Data collecting Data provider (server:Server, type:Type) recovered from an access
error. 77 Error Data collecting Data provider (server:Server, type:Type) had an access error.

135
9.1.2 Event logs for Management Console
source name: SystemMonitorPerformanceConsole
I Type category Description
75 Information Management
console
Connected to Management Server 'Server'.
76 Information Management
console
Disconnected to Management Server 'Server'.
77 Error Management
console
An error occurred in the connecting/disconnecting to the Management
Server 'Server'.
84 Error Management
console
Internal error: message
85 Information Management
console
Started management console.
86 Information Management
console
The Management Console is closed.
89 Error Management
console
Failed to initialize the connection. Change the settings of the
Management Console.
90 Error Management
console
The time difference between the management server Server and this
console machine is larger than Time minutes.
By default, previous logs are overwritten when the maximum log size is
reached. To change these default settings, configure the Event Viewer
settings. See "9.9. 3. Situations where logs are not recorded in the event
log" for information on how to change the Event Viewer settings.
Note

136
9.2 What to do if the Performance Monitoring Service does not Start
After System Monitor - Performance Monitoring Services is installed, the Performance Monitoring Service
(System Monitor Performance Monitoring Service) should start when the management server is restarted.
If the Performance Monitoring Service does not start, this could be due to one of the causes listed as (1) to (6)
below. Isolate the cause by checking the message that is output when the Performance Monitoring Service fails,
and then take the action listed below. Error messages are also displayed when the Performance Monitoring
Service is started manually. Refer to (3), (4), (5), and (6) if you changed the execution account from the local
system account.
When execution account is changed from a local system account, confirm the following.
• "User must change password at next logon" option has not been added.
• The password has not expired.
(1) The Database Settings are not correct
<Messages that are output>
• Event log Log Type Source ID Description Notes
Application Error SystemMonitor Performance Service
0 Service cannot be started.
System.Data.SqlClient.SqlException: Cannot open database requested in login 'RM_PerformanceDataBase2'. Login fails.
System Monitor - Performance Monitoring Services
Error SystemMonitorPerformanceService
5 Error when starting Performance Monitoring Service.
Details:
Cannot open database requested in login 'RM_PerformanceDataBase2'. Login fails.
System Monitor - Performance Monitoring Services
Error SystemMonitorPerformanceService
12 Failed to connect to the database (Server: Server\Instance , DataBase:DataBase:). Details:
Cannot open database requested in login 'RM_PerformanceDataBase2'. Login fails.
• Error messages Message Notes
Could not start the SystemMonitor Performance Service service on Local Computer.
The service did not return an error. This could be an internal Windows error or an internal service error. If the problem persists, contact your system administrator.
Windows 2000 only
The System Monitor Performance Monitoring Service service on Local Computer started and then stopped. Some services stop automatically if they have no work to do, for example, the Performance Logs and Alerts service.
Windows Server 2003 only
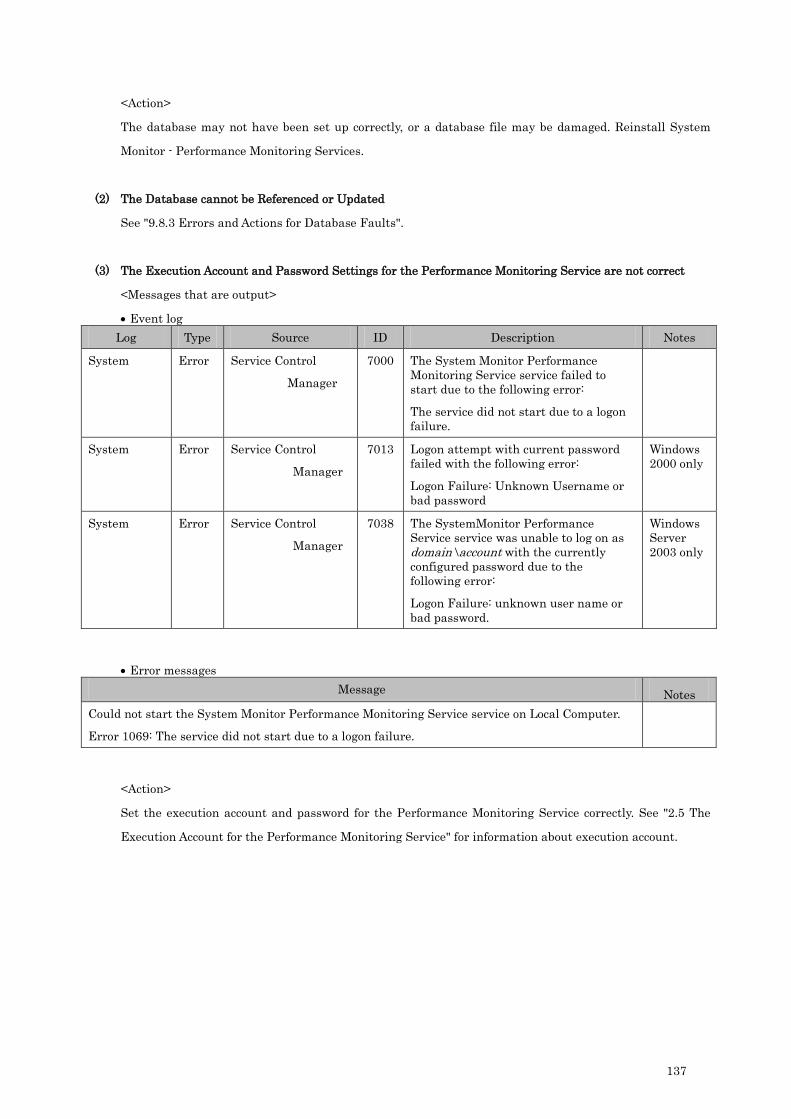
137
<Action>
The database may not have been set up correctly, or a database file may be damaged. Reinstall System
Monitor - Performance Monitoring Services.
(2) The Database cannot be Referenced or Updated
See "9.8.3 Errors and Actions for Database Faults".
(3) The Execution Account and Password Settings for the Performance Monitoring Service are not correct
<Messages that are output>
• Event log Log Type Source ID Description Notes
System Error Service Control
Manager
7000 The System Monitor Performance Monitoring Service service failed to start due to the following error:
The service did not start due to a logon failure.
System Error Service Control
Manager
7013 Logon attempt with current password failed with the following error:
Logon Failure: Unknown Username or bad password
Windows 2000 only
System Error Service Control
Manager
7038 The SystemMonitor Performance Service service was unable to log on as domain\account with the currently configured password due to the following error:
Logon Failure: unknown user name or bad password.
Windows Server 2003 only
• Error messages Message Notes
Could not start the System Monitor Performance Monitoring Service service on Local Computer.
Error 1069: The service did not start due to a logon failure.
<Action>
Set the execution account and password for the Performance Monitoring Service correctly. See "2.5 The
Execution Account for the Performance Monitoring Service" for information about execution account.

138
(4) The Execution Account for the Performance Monitoring Service does not have OS Administrator Authority
<Messages that are output>
• Event log Log Type Source ID Description Notes
Application Error SystemMonitor Performance Service
0 The service did not start.
System.Security.SecurityException:
Requested registry access is not allowed.
• Error messages Message Notes
Could not start the SystemMonitor Performance Service service on Local Computer.
The service did not return an error. This could be an internal Windows error or an internal service error. If the problem persists, contact your system administrator.
Windows 2000 only
The System Monitor Performance Monitoring Service service on Local Computer started and then stopped. Some service stop automatically if they have no work to do, for example, the Performance Logs and Alerts service.
Windows Server 2003 only
<Action>
The execution account for the Performance Monitoring Service must have OS administrator authority for
the management server. Specify an account that has OS administrator authority as the execution account
for the Performance Monitoring Service. See "2.5 The Execution Account for the Performance Monitoring
Service" for information about execution account.
(5) The Execution Account for the Performance Monitoring Service does not have "Log on as a Service" Rights
<Messages that are output>
• Event log Log Type Source ID Description Notes
System Error Service Control
Manager
7000 The System Monitor Performance Monitoring Service service failed to start due to the following error:
The service did not start due to a logon failure.
System Error Service Control
Manager
7013 Logon attempt with current password failed with the following error:
Logon failure: the user has not been granted the requested logon type at this computer.
Windows 2000 only
System Error Service Control
Manager
7038 The SystemMonitor Performance Service service was unable to log on as domain\account with the currently configured password due to the following error:
Logon failure: the user has not been granted the requested logon type at this computer.
Windows
2003 only
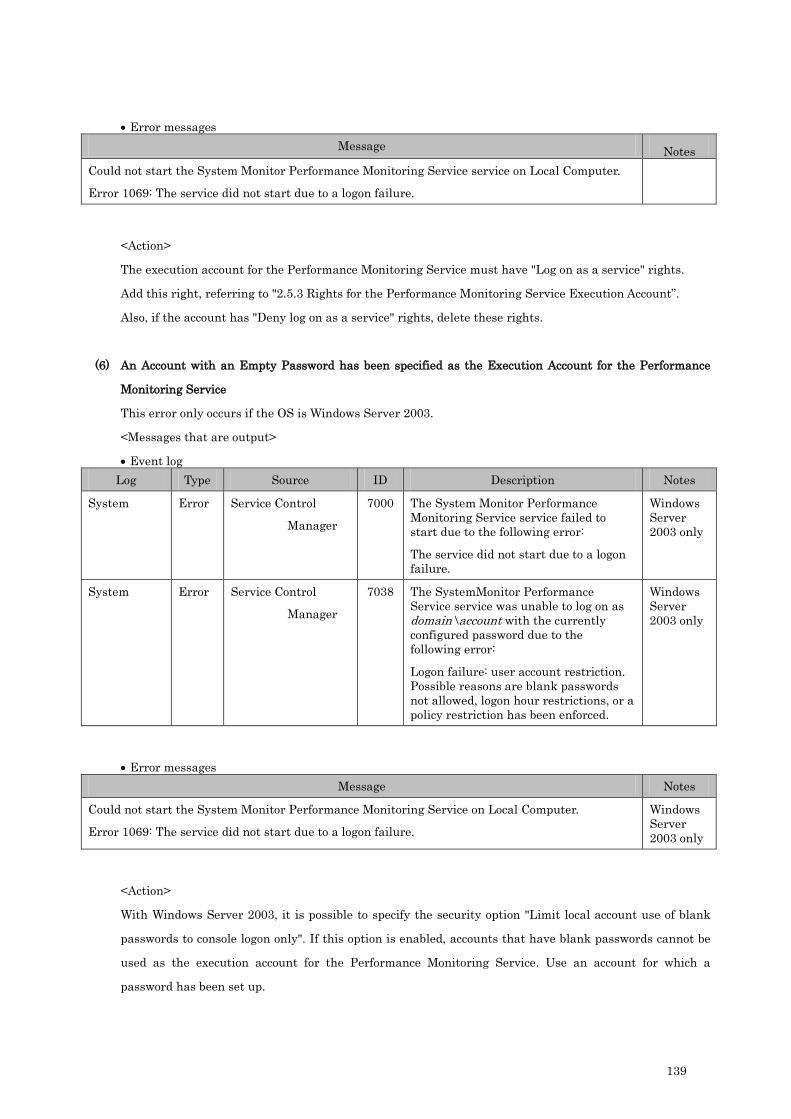
139
• Error messages Message Notes
Could not start the System Monitor Performance Monitoring Service service on Local Computer.
Error 1069: The service did not start due to a logon failure.
<Action>
The execution account for the Performance Monitoring Service must have "Log on as a service" rights.
Add this right, referring to "2.5.3 Rights for the Performance Monitoring Service Execution Account”.
Also, if the account has "Deny log on as a service" rights, delete these rights.
(6) An Account with an Empty Password has been specified as the Execution Account for the Performance
Monitoring Service
This error only occurs if the OS is Windows Server 2003.
<Messages that are output>
• Event log Log Type Source ID Description Notes
System Error Service Control
Manager
7000 The System Monitor Performance Monitoring Service service failed to start due to the following error:
The service did not start due to a logon failure.
Windows Server 2003 only
System Error Service Control
Manager
7038 The SystemMonitor Performance Service service was unable to log on as domain\account with the currently configured password due to the following error:
Logon failure: user account restriction. Possible reasons are blank passwords not allowed, logon hour restrictions, or a policy restriction has been enforced.
Windows Server 2003 only
• Error messages Message Notes
Could not start the System Monitor Performance Monitoring Service on Local Computer.
Error 1069: The service did not start due to a logon failure.
Windows Server 2003 only
<Action>
With Windows Server 2003, it is possible to specify the security option "Limit local account use of blank
passwords to console logon only". If this option is enabled, accounts that have blank passwords cannot be
used as the execution account for the Performance Monitoring Service. Use an account for which a
password has been set up.

140
9.3 What to do if the Connection from Management Console to Server Fails
The following lists error messages output when connection from the management console to the management
server failed, and actions to be taken. Log Type Source ID Description
System Monitor - Performance Monitoring Services
Error SystemMonitorPerformanceConsole
77 An error occurred in the connecting/disconnecting to the Management Server 'Server'.
Details:
No connection could be made because the target machine actively refused it.
Action
• Check whether the management server is running.
• Start the Performance Monitoring Service on the management server if it is not running already.
• Check whether there are any network problems between the management server and the management console machine.
• Check whether the port number for the Performance Monitoring Service has been changed. If so, specify the new port number.
Log Type Source ID Description
System Monitor - Performance Monitoring Services
Error SystemMonitorPerformanceConsole
77 An error occurred in the connecting/disconnecting to the Management Server 'Server'.
Details:
Logon failure.
Action
• Check the account and password specifications.
• Accounts that do not have OS administrator authority cannot log on. Check whether the account has OS administrator authority.
• Only if the OS for the management server is Windows 2000. If the execution account for the Performance Monitoring Service does not have the "Act as part of the operating system" right, add this right, referring to" 2.5.3 Rights for the Performance Monitoring Service Execution Account". After the Performance Monitoring Service has stopped, it is possible to log on.
• With Windows Server 2003, it is possible to specify the security option "Limit local account use of blank passwords to console logon only". If this option is enabled, accounts that have blank passwords cannot be used as the log on account. Use an account for which a password has been set up.
Log Type Source ID Description
System Monitor - Performance Monitoring Services
Error SystemMonitorPerformanceConsole
89 Failed to initialize the connection. Change the settings of the Management Console.
Details:
Only one usage of each socket address (protocol/network address/port) is normally permitted.
Action
• The port number used for communications from the Performance Monitoring Service to the management console is already being used by another product. Change the port number in management console information.
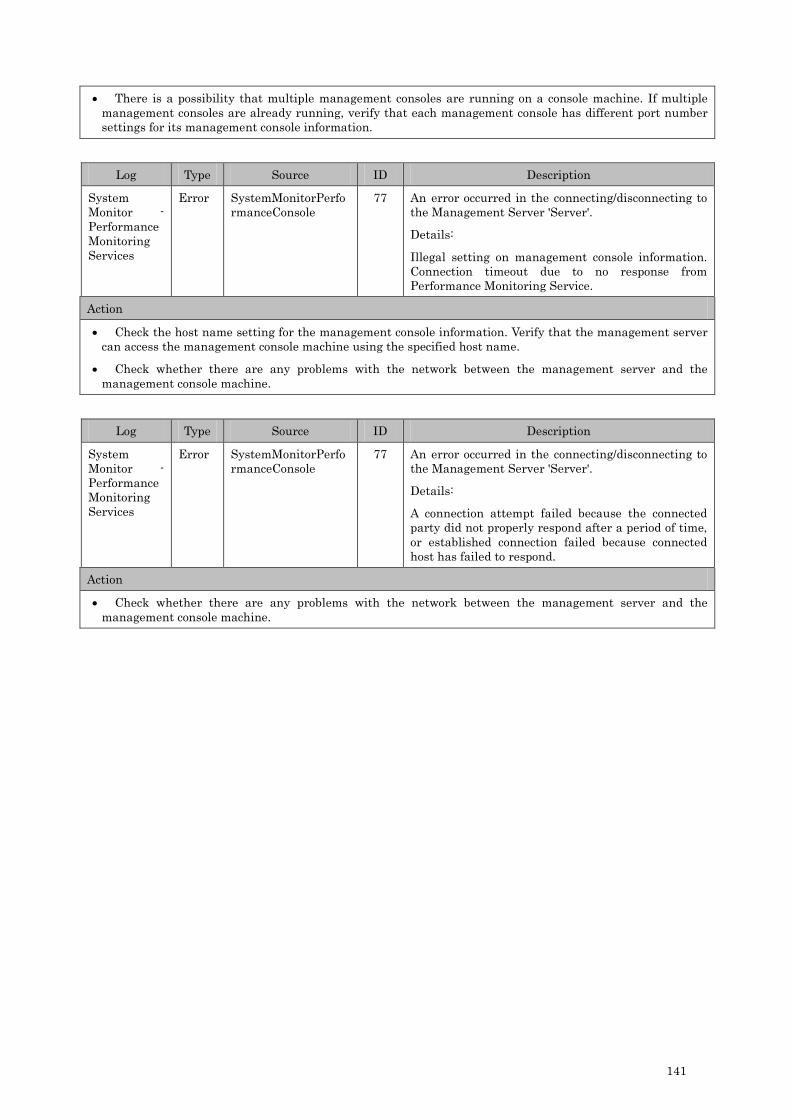
141
• There is a possibility that multiple management consoles are running on a console machine. If multiple management consoles are already running, verify that each management console has different port number settings for its management console information.
Log Type Source ID Description
System Monitor - Performance Monitoring Services
Error SystemMonitorPerformanceConsole
77 An error occurred in the connecting/disconnecting to the Management Server 'Server'.
Details:
Illegal setting on management console information. Connection timeout due to no response from Performance Monitoring Service.
Action
• Check the host name setting for the management console information. Verify that the management server can access the management console machine using the specified host name.
• Check whether there are any problems with the network between the management server and the management console machine.
Log Type Source ID Description
System Monitor - Performance Monitoring Services
Error SystemMonitorPerformanceConsole
77 An error occurred in the connecting/disconnecting to the Management Server 'Server'.
Details:
A connection attempt failed because the connected party did not properly respond after a period of time, or established connection failed because connected host has failed to respond.
Action
• Check whether there are any problems with the network between the management server and the management console machine.
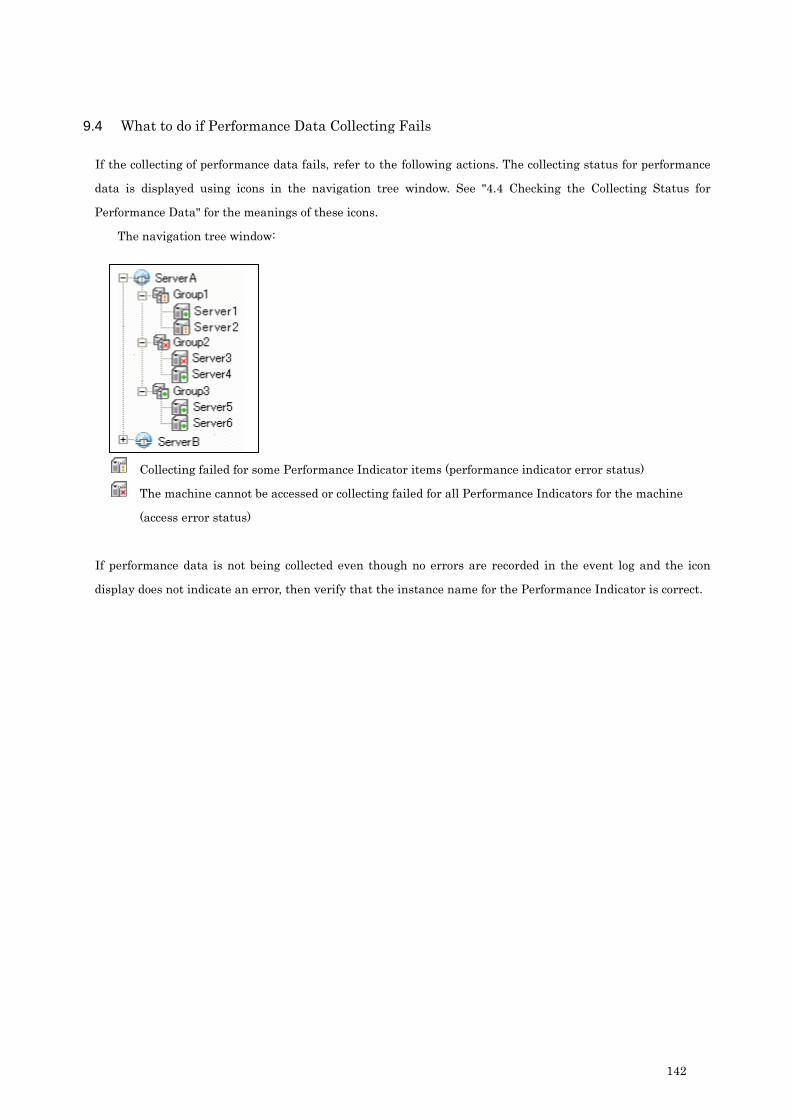
142
9.4 What to do if Performance Data Collecting Fails
If the collecting of performance data fails, refer to the following actions. The collecting status for performance
data is displayed using icons in the navigation tree window. See "4.4 Checking the Collecting Status for
Performance Data" for the meanings of these icons.
The navigation tree window:
Collecting failed for some Performance Indicator items (performance indicator error status)
The machine cannot be accessed or collecting failed for all Performance Indicators for the machine
(access error status)
If performance data is not being collected even though no errors are recorded in the event log and the icon
display does not indicate an error, then verify that the instance name for the Performance Indicator is correct.
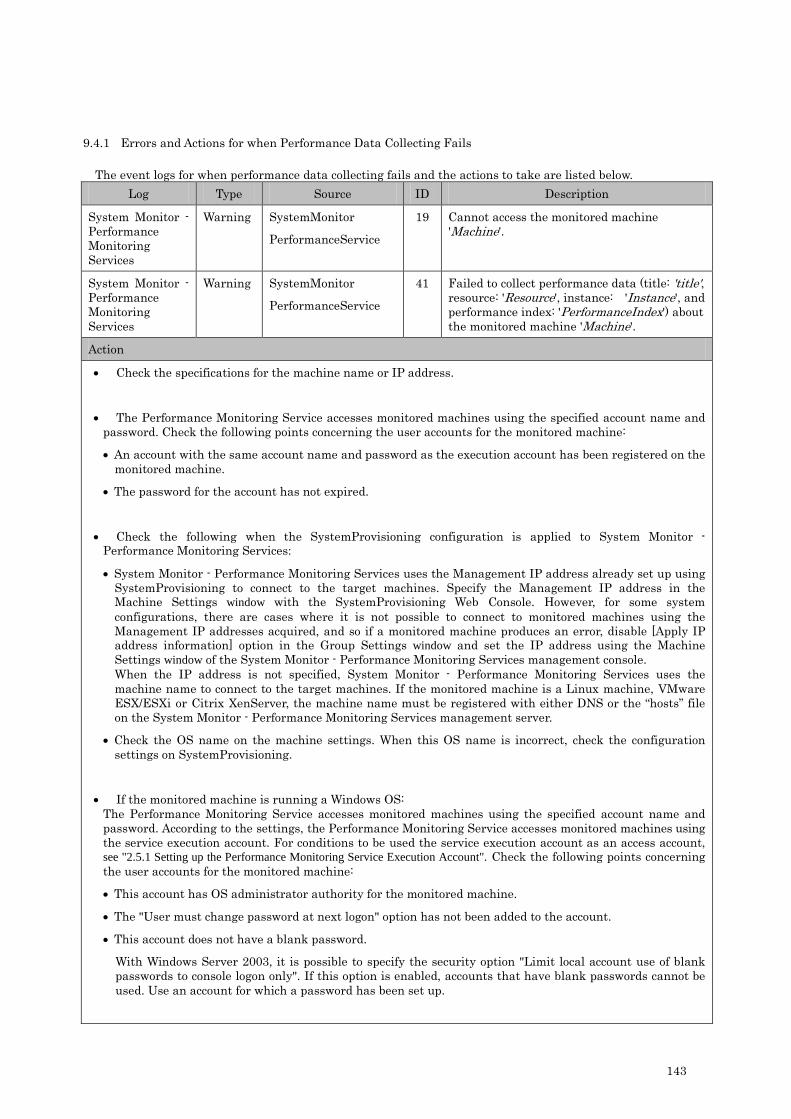
143
9.4.1 Errors and Actions for when Performance Data Collecting Fails
The event logs for when performance data collecting fails and the actions to take are listed below. Log Type Source ID Description
System Monitor - Performance Monitoring Services
Warning SystemMonitor
PerformanceService
19 Cannot access the monitored machine 'Machine'.
System Monitor - Performance Monitoring Services
Warning SystemMonitor
PerformanceService
41 Failed to collect performance data (title: 'title', resource: 'Resource', instance: 'Instance', and performance index: 'PerformanceIndex') about the monitored machine 'Machine'.
Action
• Check the specifications for the machine name or IP address.
• The Performance Monitoring Service accesses monitored machines using the specified account name and password. Check the following points concerning the user accounts for the monitored machine:
• An account with the same account name and password as the execution account has been registered on the monitored machine.
• The password for the account has not expired.
• Check the following when the SystemProvisioning configuration is applied to System Monitor - Performance Monitoring Services:
• System Monitor - Performance Monitoring Services uses the Management IP address already set up using SystemProvisioning to connect to the target machines. Specify the Management IP address in the Machine Settings window with the SystemProvisioning Web Console. However, for some system configurations, there are cases where it is not possible to connect to monitored machines using the Management IP addresses acquired, and so if a monitored machine produces an error, disable [Apply IP address information] option in the Group Settings window and set the IP address using the Machine Settings window of the System Monitor - Performance Monitoring Services management console. When the IP address is not specified, System Monitor - Performance Monitoring Services uses the machine name to connect to the target machines. If the monitored machine is a Linux machine, VMware ESX/ESXi or Citrix XenServer, the machine name must be registered with either DNS or the “hosts” file on the System Monitor - Performance Monitoring Services management server.
• Check the OS name on the machine settings. When this OS name is incorrect, check the configuration settings on SystemProvisioning.
• If the monitored machine is running a Windows OS: The Performance Monitoring Service accesses monitored machines using the specified account name and password. According to the settings, the Performance Monitoring Service accesses monitored machines using the service execution account. For conditions to be used the service execution account as an access account, see "2.5.1 Setting up the Performance Monitoring Service Execution Account". Check the following points concerning the user accounts for the monitored machine:
• This account has OS administrator authority for the monitored machine.
• The "User must change password at next logon" option has not been added to the account.
• This account does not have a blank password.
With Windows Server 2003, it is possible to specify the security option "Limit local account use of blank passwords to console logon only". If this option is enabled, accounts that have blank passwords cannot be used. Use an account for which a password has been set up.

144
Start the following service for monitored machines.
• Remote Registry
• Server
Check the following points concerning the connection to monitored machines:
• If the Windows firewall function for the monitored machine has been enabled, make exception settings for the Windows firewall by referring to "1.7.4 Ports Used between Management Servers and Monitored Machines".
If the monitored machine is running a Windows XP, change local security policy settings as follows:
1. Start the Local Security Policy using the Administrative Tools in Control Panel
2. The Local Security Settings are appeared. Select Security Options of Local Policies from the tree on the
left side.
3. Display the properties by double-clicking Network access: Sharing and security model for local accounts.
4. Select Classic – local users authenticate as themselves and then Click OK.
• If the monitored machine is running a Linux OS is a monitored machine:
When using TELNET to connect, check the following points:
• TELNET has been installed and the service has started.
• TELNET communications have been exempted from firewall blocking.
When using SSH to connect, check the following points:
• SSH service has started.
• Authentication protocol is set correctly.
• SSH communications have been exempted from firewall blocking.
Check that an IP address has been set up on the monitored machine settings, or the name of the monitored machine has been registered with DNS or the "hosts" file on the management server.
• If VMware ESX/ESXi is the monitored machine (VMware Web Service is used to connect):
Check the following points concerning the user accounts for the monitored machine:
• An account with the same account name and password as the specified account has been registered on the monitored machine.
• A role other than "No Access" is assigned to the connection account on the VMware ESX/ESXi.
Check the following points:
• An IP address has been set up on the monitored machine settings.
• VMware Web Service has started on the VMware ESX/ESXi.
• SSL communications have been exempted from firewall blocking.
• If the monitored machine is a virtual machine running on a VMware ESX/ESXi.

145
Check the following points:
• The virtual machine and the VMware ESX/ESXi are monitored by the same management server.
• Collecting performance data from the VMware ESX/ESXi is successfully performed.
• If Citrix XenServer is the monitored machine:
Check the following points:
• An IP address has been set up on the monitored machine settings.
• SSL communications have been exempted from firewall blocking.
• The monitored machine is a pool master machine or a target of the SystemProvisioning configuration application.
• Check whether the monitored machine is running.
• Check whether there are any network problems between the management server and the monitored machine.
• It may not be possible to access the monitored machine if it is under high load.
• Check whether the monitored machine's OS is supported by System Monitor – Performance Monitoring Services.
Log Type Source ID Description
System Monitor - Performance Monitoring Services
Error SystemMonitorPerformanceService
10 The specified performance data (title:'title', category name: 'category', instance name: 'instance', counter name: 'counter') can not be collected on the monitored machine 'Machine'. This type of performance data is not available for machine 'Machine'.
Details:
*************************************
System Monitor - Performance Monitoring Services
Error SystemMonitorPerformanceService
43 Illegal specification of performance indicator (title: 'title')
Action
Check the detailed information in the event log description (the section after "Details:").
• Fix any mistakes with the specification for Performance Indicators.
• If a Performance Indicator category is specified that is not supported by System Monitor - Performance Monitoring Services, it may not be possible to collect the performance data because the specified category does not exist on the monitored machine. The Performance Indicators that can be collected on a monitored machine depend on the type of OS and on the applications that are installed. Check whether the specified Performance Indicator can be collected. See "1.3 Collected Performance Data" for information on the categories that System Monitor - Performance Monitoring Services supports.
If the icon is displayed for a monitored machine, the machine is in a performance indicator error status. Change the Performance Indicator settings for the machine.

146
9.4.2 Error Status Recovery Processing
System Monitor - Performance Monitoring Services stops data collecting processing for monitored machines
that it has failed to access or for which all Performance Indicators failed to be collected. Machines where data
collecting processing has stopped are displayed using the icon. Machines where data collecting processing
has partially failed are displayed using the icon.
Remove the error cause to restart data collecting. To restart data collecting in arbitrary timing, perform error
status recovery. The procedure for error status recovery processing is as follows:
1. Right-click the machine name and click Change Data Collecting Status.
A window appears.
2. Click Recover from error status. When data collecting starts, the icon display for the machine will change
to .
When error status recovery processing is performed for a group, error status recovery processing is executed
for every machine in the group.
The procedure for error status recovery processing for groups is as follows:
1. Right-click the group name and select Change Data Collecting Status. A window appears.
2. Click Recover from error status. When data collecting starts, the icon display for the group will change to
and the icon display for machines in the group will change to .

147
9.5 What to do if Performance Data Collecting is Delayed
If the collecting of performance data is delayed, refer to the following actions. What we call "Data Collecting
Delay" is the situation that a performance data collecting could not be finished within the specified period.
When this delay occurs, a discontinued graph line may appear on the graph window and a notification of
monitoring threshold may be delayed.
A warning log on the event log can be seen when the performance data collecting is delayed.
9.5.1 Errors and Actions for when Performance Data Collecting is Delayed
The event logs for when performance data collecting is delayed and the actions to take are listed below. Log Type Source ID Description
System Monitor - Performance Monitoring Services
Warning SystemMonitor
PerformanceService
63 Cannot finish collecting performance data (title: 'Title') about machine 'Machine' in time (StartTime-EndTime).
Action
• The number of data to be collected within a specified period may be too much. Consider the following actions.
- Increasing the data collecting interval
- Reducing the number of Performance Indicator items that are collected
- Reducing the number of machines that are monitored
• The load of the management server may be too high. Check the reason of this high load and exclude this reason from your system.
• An internal operation of Windows may let the data collecting operation take too long time when the OS of the monitored machine is Windows Vista or Windows Server 2008 R1. If this entry is logged, consider to increase the data collecting interval.

148
9.6 What to do if there are SystemProvisioning Configuration Applying Errors
SystemProvisioning configuration information can be applied to System Monitor - Performance Monitoring
Services. If an error occurs during configuration applying process, identify the cause by checking the message
that has been output, and then take the appropriate action.
(1) Cannot access the SystemProvisioning management server
Log Type Source ID Description System Monitor -
Performance Monitoring
Services
Error SystemMonitorPerformanceService
30 Cannot use SystemProvisioning. Details: Cannot connect SystemProvisioning
Action
• Verify that the name of the SystemProvisioning management server is correct. Refer to Section, "2.6 SystemProvisioning Connection Settings" for information on how to make this setting.
• Verify that the SystemProvisioning management server is running correctly.
• Verify that each SystemProvisioning service is running correctly.
• If the Performance Monitoring Service and SystemProvisioning are not on the same management server and a Windows Firewall has been enabled on the SystemProvisioning management server, open the port for SystemProvisioning UniversalConnector. Refer to Section, "2.6 SystemProvisioning Connection Settings" for more information on firewall settings.
• If the Performance Monitoring Service and SystemProvisioning are not on the same management server, verify that the Performance Monitoring Service execution account is same as the OS administrator account of SystemProvisioning management server.
• When SystemProvisioning is clustered with ExpressCluster, the virtual computer name cannot be used as SystemProvisioning Management Server name.
(2) SystemProvisioning is not running correctly
Log Type Source ID Description System Monitor -
Performance Monitoring
Services
Error SystemMonitorPerformanceService
31 Error when applying SystemProvisioning Configuration. Details: Input data contains invalid character.
Action
• Verify that the version of SystemProvisioning being linked is supported by System Monitor - Performance Monitoring Services.
(3) Performance indicator does not exist
Log Type Source ID Description System Monitor -
Performance Monitoring
Services
Error SystemMonitorPerformanceService
31 Error when applying SystemProvisioning Configuration. Details: Specified performance indicator is not found.
Action
The monitoring profile is specified on SystemProvisioning, but a performance indicator which does not exist on System Monitor - Performance Monitoring Service is included in it.
• Verify whether the monitoring profile specified on SystemProvisioning is correct.
• Verify whether the performance indicator is defined correctly on System Monitor - Performance Monitoring Service.

149
9.7 What to do if there are Errors when Performance Abnormalities are Reported to SystemProvisioning
System Monitor - Performance Monitoring Services can use monitoring thresholds for Performance Indicators
that are collected to detect abnormalities in the load status of monitored machines and can report such
abnormalities to SystemProvisioning.
If an error occurs when an abnormality is reported, identify the cause by checking the message that has been
output, and then take the appropriate action.
(1) Cannot Access the SystemProvisioning Management Server
Log Type Source ID Description System Monitor -
Performance Monitoring
Services
Error SystemMonitorPerformanceService
42 Failed to notify SystemProvisioning. Details: System error: A connection attempt failed because the connected party did not properly respond after a period of time, or established connection failed because connected host has failed to respond.
Action
• Verify that the name of the SystemProvisioning management server is correct. Refer to Section, "2.6 SystemProvisioning Connection Settings" for more information.
• Verify that the SystemProvisioning management server is running correctly.
• Verify that the "System Monitor Service" has started on the SystemProvisioning management server.
• If the Performance Monitoring Service and SystemProvisioning are not on the same management server and a Windows Firewall has been enabled on the SystemProvisioning management server, open the port for System Monitor – Event Monitoring Services. Refer to Section, "2.6 SystemProvisioning Connection Settings" for more information on firewall settings.
• If the Performance Monitoring Service and SystemProvisioning are not on the same management server, verify that the Performance Monitoring Service execution account is same as the OS administrator account of SystemProvisioning management server.
• When SystemProvisioning is clustered with ExpressCluster, the virtual computer name cannot be used as SystemProvisioning Management Server name.
(2) SystemProvisioning is not running correctly
Log Type Source ID Description System Monitor -
Performance Monitoring
Services
Error SystemMonitorPerformanceService
42 Failed to notify SystemProvisioning. Details: Could not resolve a call to the correct method.
Action
• Verify that the SystemProvisioning management server is running correctly.
• Verify that each service on the SystemProvisioning management server is running correctly.
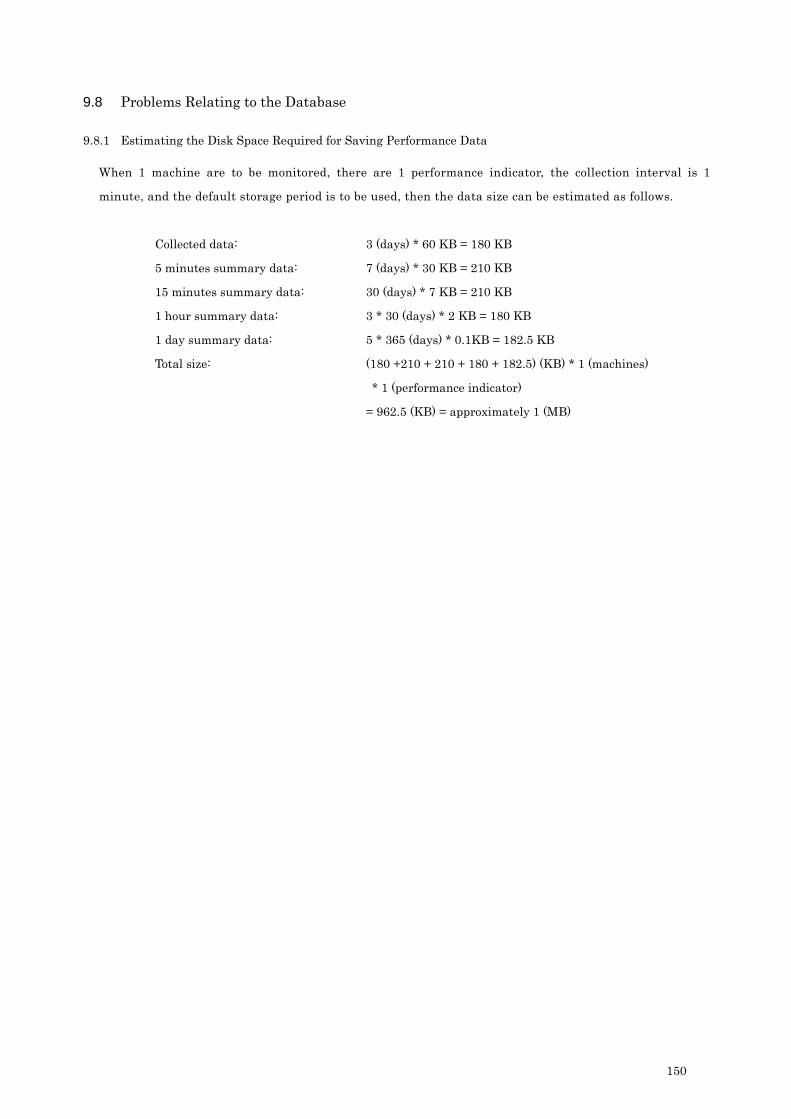
150
9.8 Problems Relating to the Database
9.8.1 Estimating the Disk Space Required for Saving Performance Data
When 1 machine are to be monitored, there are 1 performance indicator, the collection interval is 1
minute, and the default storage period is to be used, then the data size can be estimated as follows.
Collected data: 3 (days) * 60 KB = 180 KB
5 minutes summary data: 7 (days) * 30 KB = 210 KB
15 minutes summary data: 30 (days) * 7 KB = 210 KB
1 hour summary data: 3 * 30 (days) * 2 KB = 180 KB
1 day summary data: 5 * 365 (days) * 0.1KB = 182.5 KB
Total size: (180 +210 + 210 + 180 + 182.5) (KB) * 1 (machines)
* 1 (performance indicator)
= 962.5 (KB) = approximately 1 (MB)

151
9.8.2 Errors and Actions for when There is not Enough Disk Space
The event logs for when there is not enough disk space and the actions to take are listed below. Log Type Source ID Description
System Monitor - Performance Monitoring Services
Error SystemMonitorPerformanceService
13 Failed to update the database. Details:
Could not allocate space for object 'RM_PerformanceData' in database 'RM_PerformanceDataBase2' because the 'PRIMARY' filegroup is full.
System Monitor - Performance Monitoring Services
Error SystemMonitorPerformanceService
29 Stopped Performance Monitoring Service because an irrecoverable error was detected. Details:
Could not allocate space for object 'RM_PerformanceData' in database 'RM_PerformanceDataBase2' because the 'PRIMARY' filegroup is full.
Action
There is not enough disk space. Increase the amount of free space on the disk by deleting redundant files and so on. The amount of disk space can then be reduced by taking the following measures:
• Setting a shorter storage period for performance data
• Increasing the data collecting interval
• Reducing the number of Performance Indicator items that are collected
• Reducing the number of machines that are monitored
Log Type Source ID Description
System Monitor - Performance Monitoring Services
Error SystemMonitorPerformanceService
13 Failed to update the database. Details:
Could not allocate new page for database 'RM_PerformanceDataBase2'. There are no more pages available in filegroup PRIMARY. Space can be created by dropping objects, adding additional files, or allowing file growth.
System Monitor - Performance Monitoring Services
Error SystemMonitorPerformanceService
29 Stopped Performance Monitoring Service because an irrecoverable error was detected. Details:
Could not allocate new page for database 'RM_PerformanceDataBase2'. There are no more pages available in filegroup PRIMARY. Space can be created by dropping objects, adding additional files, or allowing file growth.
Action
The database size has reached 10 GB. System Monitor - Performance Monitoring Services uses SQL Server
2008 R2 Express as its database engine. The maximum size supported by SQL Server 2008 R2 Express is 10
GB.
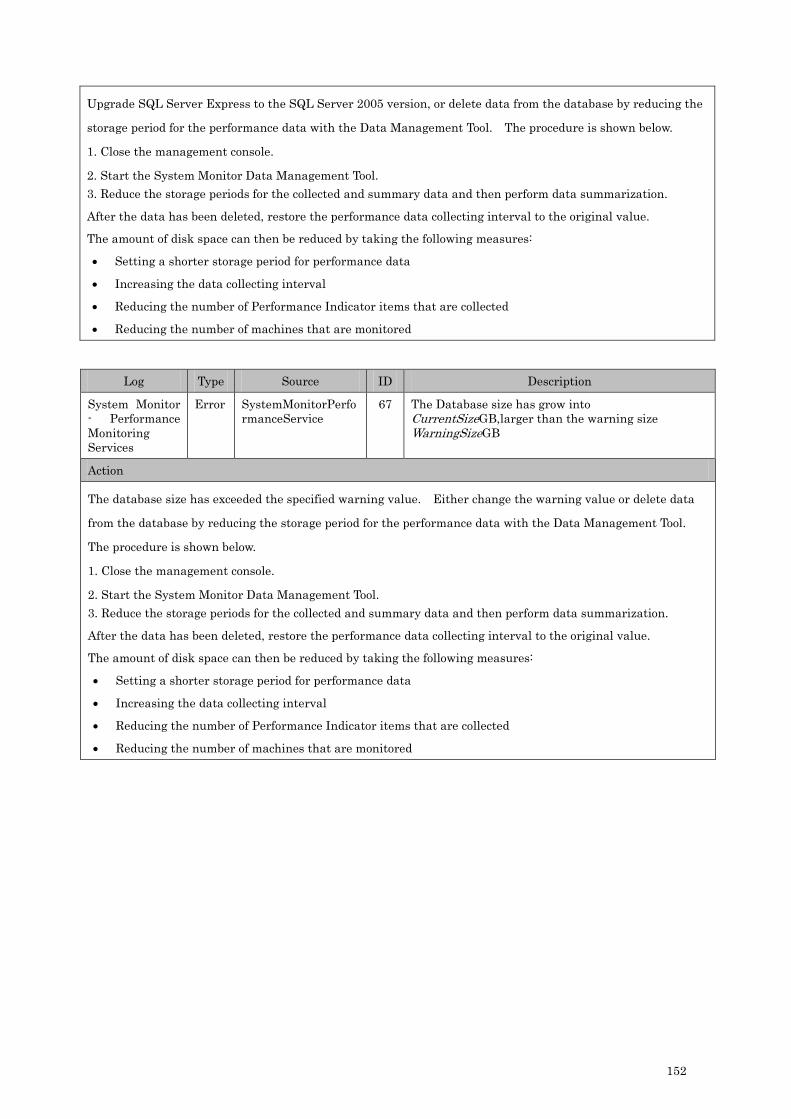
152
Upgrade SQL Server Express to the SQL Server 2005 version, or delete data from the database by reducing the
storage period for the performance data with the Data Management Tool. The procedure is shown below.
1. Close the management console.
2. Start the System Monitor Data Management Tool. 3. Reduce the storage periods for the collected and summary data and then perform data summarization.
After the data has been deleted, restore the performance data collecting interval to the original value.
The amount of disk space can then be reduced by taking the following measures:
• Setting a shorter storage period for performance data
• Increasing the data collecting interval
• Reducing the number of Performance Indicator items that are collected
• Reducing the number of machines that are monitored
Log Type Source ID Description
System Monitor - Performance Monitoring Services
Error SystemMonitorPerformanceService
67
The Database size has grow into CurrentSizeGB,larger than the warning size WarningSizeGB
Action
The database size has exceeded the specified warning value. Either change the warning value or delete data
from the database by reducing the storage period for the performance data with the Data Management Tool.
The procedure is shown below.
1. Close the management console.
2. Start the System Monitor Data Management Tool. 3. Reduce the storage periods for the collected and summary data and then perform data summarization.
After the data has been deleted, restore the performance data collecting interval to the original value.
The amount of disk space can then be reduced by taking the following measures:
• Setting a shorter storage period for performance data
• Increasing the data collecting interval
• Reducing the number of Performance Indicator items that are collected
• Reducing the number of machines that are monitored

153
9.8.3 Errors and Actions for Database Faults
The event logs relating to database references and updates, and the actions to take are listed below. Log Type Source ID Description
System Monitor - Performance Monitoring Services
Error SystemMonitorPerformanceService
13 Failed to update the database. Details:
General network error. Check your network documentation.
or
System Monitor - Performance Monitoring Services
Error SystemMonitorPerformanceService
15 Failed to reference the database. Details:
General network error. Check your network documentation.
System Monitor - Performance Monitoring Services
Error SystemMonitorPerformanceService
29 Stopped Performance Monitoring Service because an irrecoverable error was detected. Details:
General network error. Check your network documentation.
Action
• Start the database service "MSSQL$SSCCMDB" if it has not started already. The database service starts automatically when the Performance Monitoring Service starts. The procedure for starting the service manually is as follows. When the instance name is changed from the default value, select “MSSQL$InstanceName” service name.
1. Start Services from the Administrative Tools control panel.
2. Select the service with the name "MSSQL$SSCCMDB" from the list of services that is displayed, and double-click to open it.
3. Click Start in the General tab.
4. The database service will then start.
• Check whether there is a problem with the network connected to the management server.
Check these points and resolve any problems, and then restart the Performance Monitoring Service.
An error message may be output and the management console may terminate when the management console is started.
If so, start the management console again.
154
9.8.4 Procedure for Backing up and Restoring the Database
Backing up and restoring database is executed using sqlcmd command offered in SQL Server.
<To back up>
(1) Close the management console by selecting Exit from the File menu of the management console main
window.
(2) Stop the Performance Monitoring Service.
- Start Services from the Administrative Tools control panel.
- From the list of services that is displayed, double-click the "System Monitor Performance Monitoring Service".
- Stop the Performance Monitor Service by clicking Stop in the General tab.
(3) Copy the following files to the backup destination:
- In the installation directory for System Monitor - Performance Monitoring Services
(Default value:%ProgramFiles%\NEC\SystemMonitorPerformance)
>> bin\rm_client.xml
>> bin\rm_service_init.xml
(4) Execute the database backup command.
- Select All Programs from the Start menu, and then select Accessories and then Command Prompt.
- Specify the following command at the command line. In the example shown here, a backup file called
"sysmonbk.dat" is created in the \temp directory on the C drive.
> sqlcmd -E -S (local)\SSCCMDB -Q "backup database RM_PerformanceDatabase2 to disk =
'c:\temp\sysmonbk.dat' with init"
When the instance name is changed from the default value, specify “(local)\InstanceName”
<To restore>
(1) Close the management console by selecting Exit from the File menu of the management console main
window.
(2) Stop the Performance Monitoring Service.
- Start Services from the Administrative Tools control panel.
- From the list of services that is displayed, double-click the "System Monitor Performance Monitoring Service"
service.
- Stop the Performance Monitor Service by clicking Stop in the General tab.
(3) Restore the following files from the backup directory:
- In the installation directory for System Monitor - Performance Monitoring Services
(Default value:%ProgramFiles%\NEC\SystemMonitorPerformance)
>> bin\rm_client.xml
>> bin\rm_service_init.xml
(4) Execute the database restore command.
- Select All Programs from the Start menu, and then select Accessories and then Command Prompt.

155
- Specify the following command at the command line. In the example shown here, a backup file called
"sysmonbk.dat" in the \temp directory on the C drive is restored.
> sqlcmd -E -S (local)\SSCCMDB -Q "restore database RM_PerformanceDatabase2 from disk =
'c:\temp\sysmonbk.dat' with replace"
When the instance name is changed from the default value, specify “(local)\InstanceName”.

156
9.9 Other
1. Perflib-related events recorded in the application log
Resolve the problem with the performance counter by contacting the developer of the application that
owns the performance counter (recorded as "***.dll" in the log) for which the problem occurred.
See Microsoft support technical information for details on performance library errors.
2. Warning errors for MSSQL$SSCCMDB:ID19011 recorded in the application log
The following event may be displayed in the event viewer when the management server starts:
• Type: Warning
• Source: MSSQL$SSCCMDB
• Event ID: 19011
This warning message results from the specification for SQL Server, and does not indicate a problem with
the execution of System Monitor - Performance Monitoring Services. See Microsoft support technical
information (ID: 303411) for details.
When the instance name is changed from the default value (SSCCMDB), “MSSQL$InstanceName” is
displayed.
3. Situations where logs are not recorded in the event log
In default setting for System Monitor - Performance Monitoring Services, previous logs are overwritten
when maximum log size (16MB) is reached. If the settings for the event viewer is changed to system
default, new logs may not be recorded when maximum log size is reached.
In this case, change the settings for the event viewer as follows:
(1) Start the Event Viewer from the Administrative Tools control panel.
(2) Right-click System Monitor - Performance Monitoring Services and select Properties. The System
Monitor - Performance Monitoring Services Properties window appears.
(3) In the General tab, change the Log size items.
4. Time difference between the management server and the console machine
When the management server is different from the management console machine, a time difference may
arise between the machines. System Monitor - Performance Monitoring Services adjusts the time
difference between the machines for graph display. If the time difference is greater than one hour, a
warning message is displayed.

157
Chapter 10 Notes
10.1 The Number of Monitored Machines
The maximum number of physical machines that can be specified as monitored targets with the single System
Monitor - Performance Monitoring Services is 300 units. The actual maximum number of units can be controlled
by the quantity of collected performance data and collection intervals. When large-scale system configurations are
handled with SystemProvisioning and the quantity of collected performance data is large and the collection
intervals are short, it is recommended that the configuration is divided by group units and monitored using
multiple System Monitor - Performance Monitoring Services or that the collection interval is extended.
When the collection interval of performance data is 5 minutes, the maximum number of virtual machines that can
be specified as monitored targets with the single System Monitor - Performance Monitoring Services is 500 units.
158
10.2 Notes on Database
(1) Size of database
When 1 machine are to be monitored, there are 1 performance indicator, the collection interval is 1
minute, and the default storage period is to be used, then the data size can be estimated as follows.
Collected data: 3 (days) * 60 KB = 180 KB
5 minutes summary data: 7 (days) * 30 KB = 210 KB
15 minutes summary data: 30 (days) * 7 KB = 210 KB
1 hour summary data: 3 * 30 (days) * 2 KB = 180 KB
1 day summary data: 5 * 365 (days) * 0.1KB = 182.5 KB
Total size: (180 +210 + 210 + 180 + 182.5) (KB) * 1 (machines)
* 1 (performance indicator)
= 962.5 (KB) = approximately 1 (MB)
In SQL Server 2008 R2 Express, used by System Monitor - Performance Monitoring Services as the
database engine, the maximum database size is 10 GB. Although a database file of 10 GB or more can be
handled if SQL Server 2008 R2 Express is upgraded to SQL Server 2008 R2, the system must be designed
so that the size of the performance data is less than or equal to 10 GB whenever SQL Server Express is
being used. Determine the number of computers to be monitored by a performance monitoring service
based on the number of performance data items to be collected, the collection interval, and the data
storage period.
(2) Configuration of database
System Monitor Performance Monitoring Service cannot utilize the database installed on a remote server.
It is necessary to install the database on the System Monitor - Performance Monitoring Services
management server.

159
10.3 Notes on Graph Displays
(1) The period for historical displays
If the period for historical displays is too long for the plot interval, it may take some time for the graph to
be displayed in the management console. Reduce the display period, or increase the plot interval.
(2) Discontinued graph line
System Monitor - Performance Monitoring Services Management Console displays a graph as a "line"
when there is a plot data in the previous or next plot interval. When there is no plot data in both the
previous and next plot intervals, this plot data is displayed as only a "dot". The line of a displayed graph
may be discontinued when the data required to draw the graph is not partly present because the service is
restarted or a temporary access error occurs in a machine being monitored, or because the data collection
interval exceeds the specified plot interval.
(3) Graph display accuracy
If graph lines are made finer, the graph drawing precision may drop, and lines may become broken. If this
happens, make the lines thicker by modifying width in the Color and line tab of the Graph display setting
window.
(4) Data for graph display
System Monitor - Performance Monitoring Services determines the data used for graph display according
to the plot interval. If there is no data corresponding to the specified plot interval, the graph line for the
period containing no data is not displayed. See "1.4.2 Usage of Summary Data" for more details.

160
10.4 Notes on Linking to SystemProvisioning
The following three sections provide notes on using machines managed by SystemProvisioning as monitored
machines for System Monitor - Performance Monitoring Services.
(1) Applying changes in the system configuration information of SystemProvisioning to System Monitor -
Performance Monitoring Services
The SystemProvisioning configuration information can be manually or automatically applied to System
Monitor - Performance Monitoring Services. When this is automatic, System Monitor - Performance
Monitoring Services is transmitted to SystemProvisioning at fixed intervals and the changed
configuration information is automatically applied. Verify the following when enabling the application.
Verify the following if the application of system configuration information is failed.
• If the connection to SystemProvisioning is correct and communication fails between System Monitor -
Performance Monitoring Services and SystemProvisioning, confirm that the name of the
SystemProvisioning management server is correctly configured in the SystemProvisioning tab of the
Configuration window from the management console of System Monitor - Performance Monitoring
Services. When SystemProvisioning is clustered with ExpressCluster, the virtual computer name cannot
be used as SystemProvisioning Management Server name. Using the virtual computer name can cause a
failure to connect SystemProvisioning.
In addition, if the Windows firewall function of the SystemProvisioning management server is valid,
configure the Windows firewall to accept exceptions by referring to Section, "2.6 SystemProvisioning
Connection Settings". When the automatic applying function is configured, consecutive errors generated
after the second time are not recorded to the event log or displayed as a message on the GUI.
• If the PVM Service has started. Start the PVM Service on the SystemProvisioning management server.
If the PVM service has been restarted during operations, restart the service of System Monitor -
Performance Monitoring Services (System Monitor Performance Monitoring Service) as well.
• Whether the service execution account is proper.
If the Performance Monitoring Service is not running on the SystemProvisioning management server,
the execution account of Performance Monitoring Service must have OS administrator authority for the
SystemProvisioning management server. If a proper account has not been set, change the service
execution account. See "2.5.2 How to Change the Performance Monitoring Service Execution Account"
for information on how to change the service execution account.
Apply the configuration information when the machine status returns to normal.
Confirm the following point if the performance collecting status of a target machine is changed to a
paused status from a normal status automatically.
• Whether the target machine status in SystemProvisioning is a power off status, an os unknown status or
an executing status.
The automatic configuration applying function checks the configuration status at regular intervals, so
SystemProvisioning configuration changes may not be applied immediately. Apply the configuration

161
manually or adjust the polling interval for automatic configuration applying.
If a monitored machine is running Linux, VMware ESX/ESXi, Citrix XenServer or KVM, System Monitor
- Performance Monitoring Services uses an IP address to connect to the monitored machine. If the IP
address of a monitored machine is not specified using the System Monitor - Performance Monitoring
Services management console then the machine name must be registered with either DNS or the “hosts”
file on the System Monitor - Performance Monitoring Services management server. The IP address
settings for System Monitor - Performance Monitoring Services monitored machines can be acquired when
SystemProvisioning configuration information is applied. If a machine is added using SystemProvisioning,
IP address information can also be acquired as additional machine information at the same time, which
means that operations can be automated. However, for some system configurations, there are cases where
it is not possible to connect to monitored machines using the IP addresses acquired, and so if a monitored
machine produces an error, either set the IP address using the Machine Settings window of the System
Monitor - Performance Monitoring Services management console or register the IP address with DNS or
the “hosts” file. If an IP address has been set up by using the Machine Settings window or as a result of
applying SystemProvisioning configuration information, the information registered in DNS or the “hosts”
file will not be looked up.
Then IP address has to be resolved as an IPv4 address.
If Change Group operation for the monitored machine is performed on SystemProvisioning, the historical
performance data is not inherited on System Monitor - Performance Monitoring Service because the
monitored machine is managed as another machine.
When the performance data collecting is enabled on the Performance Monitor settings for the group/model
on SystemProvisioning and then the application of SystemProvisioning configuration information is
performed on System Monitor - Performance Monitoring Service, the corresponding groups and machines
are registed automatically on System Monitor - Performance Monitoring Service. When the performance
data collecting is disabled or "Do not Monitor" is selected as Profile Name on the Performance Monitor
settings for the group/model on SystemProvisioning and then the application of SystemProvisioning
configuration information is performed on System Monitor - Performance Monitoring Service, collecting
performance data for the corresponding groups and machines is paused on System Monitor - Performance
Monitoring Service. These group settings and machine settings are not deleted automatically from System
Monitor - Performance Monitoring Service. If necessary, delete manually via the System Monitor
Management Console.
(2) Configuration change of SystemProvisioning triggered by threshold monitoring
Load status abnormalities with monitored machines that are detected by threshold monitoring of System
Monitor - Performance Monitoring Services can be notified to SystemProvisioning. SystemProvisioning
receives these notifications and executes recovery process (such as adding machines) according to its
policies. Note the following points when configuring the notifications.
Conflicts with other products make notifications to SystemProvisioning.
Notifications to SystemProvisioning are made from multiple monitoring products. Care must be taken so

162
that these notifications do not duplicate System Monitor - Performance Monitoring Services notifications.
• Standard notifications (notifications from Server Management Manager)
Of all the events that can be used as SystemProvisioning standard notification events, do not set up
policies for events relating to performance status (such as “CPU load failure”) and policies for System
Monitor - Performance Monitoring Services's threshold monitoring notification for the same machine or
group. If both types of policies are set up, the recovery process specified in each policy may be executed
for the same machine at the same time.
If actions such as “Reboot machine” are set up for System Monitor - Performance Monitoring Services's
performance load abnormalities using SystemProvisioning policies, Server Management Manager may
raise a “Machine down” event while the machine is restarting. If a SystemProvisioning policy has been
set up for the “Machine down” event, a recovery process may be executed depending on the timing.
Check the SystemProvisioning log and restore the machine to an appropriate state.
• Custom notifications (notifications from optional products)
Monitoring products other than Server Management Manager make notifications to SystemProvisioning
using notification categories. Users can set up recovery processes for notification categories freely. For
these monitoring products, set up notification categories for the events that will trigger these recovery
processes. The same notification category can be assigned to more than one monitoring product, but the
roles for the notification categories should first be defined and then set up so that they do not conflict
when they are used.
As with the standard notifications setting, be careful when setting up policies so that recovery processes
actions are not duplicated.
Execution and timing of the configuration change action sequence
System Monitor - Performance Monitoring Services can be configured to detect abnormalities using the
frequency of threshold overruns with multiple checkpoints, to ensure that temporary load status is not
notified when notifying abnormalities of performance loads.
Similarly, if over-threshold status continues for an extended period of time, the timing for repeat
notifications can also be set up. Thresholds can be set in terms of upper-limits and lower-limits, for
“warning” or “critical”. Use these settings functions to design policies so that conflicts do not occur when
configuration changes are made. For example, appropriate settings are needed in the following kind of
situation.
• Settings were made for a group to add a machine when the threshold exceeds an upper-limit and to
delete a machine when the threshold exceeds a lower-limit, but machines were added and deleted
repeatedly.
Review the settings for the upper- and lower-limit threshold values.
• Settings were made for a group to add a machine when the threshold exceeds an upper-limit, but
machines were added twice.
The performance load status had not recovered or high load may have been detected again before the
first machine addition completed. For the second case, review the timing for repeat notifications.
• If a certain group has been configured to move the VM when the threshold exceeds an upper-limit, the
163
VM was moved repeatedly.
Check the status of the destination VM server. Review the settings for the upper-limit threshold value
and, if necessary, review the operating method (consider moving the VM manually, for example).
SystemProvisioning discards notifications about machines for which actions are being executed. Logs are
written for both discarded events and received events, so check the logs.
With SystemProvisioning, different actions for notifications can be set up for each group/model. As a result,
different actions for the same customized notification category can be set up for different groups/models.
Take care to avoid conflicts when setting up actions for notifications.
The policy specified in the model settings will be given priority when SystemProvisioning received a
notification about the group which is set the full path to the model as a SystemProvisioning path.
The policy specified in the model settings will be given priority when SystemProvisioning received a
notification about the machine. The policy specified in the group settings will be enabled when no policy is
set in model settings. No recovery action will be executed when no policy is set in both group and model.
The SystemProvisioning path to be set in the group of System Monitor - Performance Monitoring Services
must be a full path to the model to enable the VM Optimization Function.
(3) Possible impacts made to performance status when SystemProvisioning configurations are changed
The performance status of the machines and groups being monitored by System Monitor - Performance
Monitoring Services may be affected when any changes to the system configuration are made, including
automatic changes executed by SystemProvisioning. The following situations may arise.
• When a machine fault occurs, performance data for the machine cannot be acquired. The performance
status of the group of the failed machine changes. And unexpected load may appear on that group.
• When the machine is in maintenance, performance data for the machine cannot be acquired correctly,
and the performance data for the group that includes the machine will not be valid.
With SystemProvisioning, configurations can change automatically, so if an unexpected load appears in the
performance status, check the log information for SystemProvisioning.
Also, if threshold monitoring notification has been set up for the group that includes the machine, a recovery
process (such as adding a machine to the group) may be executed by SystemProvisioning as a result of a
notification for the abnormal load status that occurred temporarily. In order to prevent unwanted recovery
processes from being executed, cancel settings for actions triggered by threshold monitoring notification in
situations where load can be anticipated in advance, such as when maintenance is performed. In the case of
an unexpected situation, such as faults, configure the threshold with an allowance to ensure that an action is
not generated at the same time, and specify a single action for the same machine or group. If an unnecessary
recovery process has been generated, confirm the log information and return to the appropriate state.
164
10.5 Release of Resources
System Monitor - Performance Monitoring Services releases resources such as the libraries used to obtain
performance data, at AM 3:00 everyday. The release of such resources is normally completed after several
minutes. Note that the collection of performance data and the monitoring of the threshold are stopped
during the release.
10.6 Notes on Upgrading/Updating
10.6.1 Changing the Setting of SystemProvisioning Configuration Path
The path of SystemProvisioning configuration information must be a full path to the group/model. If a path
to a SystemProvisioning category, which is inherited from an earlier version, is specified in the group
settings of System Monitor - Performance Monitoring Services, change the setting to indicate the path to the
group/model.
10.6.2 Additional Setting for Monitoring Linux Machine with Multipath Configuration
An additional setting is necessary if a monitored linux machines has a multipath configuration using NEC
iStorage StoragePathSavior. Change the setting using the following procedure if the update module for
SigmaSystemCenter 2.1 (SSC0201-0006-update2 or SSC0201-0015-update3) was applied to your system in
past.
1. Stop the Management Console.
2. Stop the System Monitor Performance Monitoring Service.
3. Open the configuration file (\bin\rm_service_init.xml) on the installation directory with text editor after
backing up it. (Default installation directory: %ProgramFiles%\NEC\SystemMonitorPerformance)
4. Change the setting of the LinuxDiskDeviceNameRegex tag as shown below:
5. Over write the configuration file and start the System Monitor Performance Monitoring Service.
10.6.3 Changing the Performance Indicator Title
If a title of the builtin performance indicator had been modified from the default title in SigmaSystemCenter
2.1 or earlier, the title will be changed automatically to the default title during upgrading procedure.
Reconfigure the graph settings of the management console with a default performance indicator title.
<LinuxDiskDeviceNameRegex>(?:hd|sd|xvd|dd)[a-z]+</LinuxDiskDeviceNameRegex>

165
Appendix
A. How performance values for groups are calculated
Usage rates (group performance) for a group made up of multiple machines can be calculated as either the
absolute performance values of each machine or as the weighted average of the usage rate for each machine,
using performance ratios as coefficients. The following model formula is generally suitable for calculating
group usage rates.
For CPU usage rates, the group usage rate can generally be calculated by using the published benchmark
value for αi. Graphs that show the performance status of a group while taking into account the ability of the
machines that make up the group can be displayed by setting this αi value in the Weight field in the Machine
Settings window for the System Monitor - Performance Monitoring Services management console and selecting
Weighted average value as the statistic in the Graph display object settings window. However, care is required
if SMP or Hyper-Threading and so forth is being applied, as the trends are different to the benchmark values.
(Performance improves by 50 to 100% for SMP and by 0 to 60% for Hyper-Threading (30% on average).)
Further errors arise depending on the applications executing on the monitored machines. Pre-evaluations are
needed in order to measure usage rates accurately.
For disk usage rates, the trends are different to the benchmark values, and so αi must be derived accurately
using pre-evaluations. However, if disks are generally under medium to heavy load, the performance of each
disk can be regarded as almost the same (αi is constant), and the measurement error is about ±15% even the
simple average of the usage rate for each machine is taken as the usage rate of the group. Disk usage rates can
be specified using the Windows custom definitions of the Performance Indicator settings.
∑∑=
i i
ii i α
αρρ
The views expressed here regarding the model formula and CPU and disk usage rates have been derived
from test results using IIS/ASP. For actual operations, it is recommended that you set values based on pre-
evaluations taking into account such factors as the characteristics of the applications being used.
ρ: Group usage rate
ρi: Machine usage rate
αi: Performance value relative to other machines (performance ratio)


![Performance Monitor RedPaper[1]](https://static.fdocuments.in/doc/165x107/5520172a4a79595e718b4621/performance-monitor-redpaper1.jpg)