British Columbia’s Changing Demographics by Local Health Area
16
British Columbia’s Changing Demographics by Local Health Area For the Years 2007, 2017, 2027, 2037 August 2018
Transcript of British Columbia’s Changing Demographics by Local Health Area

British Columbia’s Changing Demographics by Local Health Area
For the Years 2007, 2017, 2027, 2037
August 2018
Page 2 of 16
Table of contents
Title page ...................................................................................................................................................1
Table of contents ......................................................................................................................................2
List of appendices ......................................................................................................................................3
Introduction ..............................................................................................................................................4
Methods ....................................................................................................................................................5
Aging Populations .....................................................................................................................................6
Population Growth and Urbanization .......................................................................................................7
Population Changes per Health Authority 2007-2017 ..............................................................................10
Population Changes per Health Authority 2017-2027 ..............................................................................11
Population Changes per Health Authority 2027-2037 ..............................................................................12
Changing Population Proportions 2007-2037 ...........................................................................................13
Local Health Area (LHA) Physician Workload Examples (2017-2027).......................................................14
Conclusions ...............................................................................................................................................15
References .................................................................................................................................................16
Page 3 of 16
List of Appendices
Appendix 1 - 2007, 2017, 2027, 2037 populations with changes between decades (in numbers and
percentages).
Table 1 - by Health Authority
Table 2 – by Health Service Delivery Area
Table 3 – by Local Health Area
Appendix 2 - 2007, 2017, 2027, 2037 populations by age group with proportions.
Table 1 - by Health Authority
Table 2 – by Health Service Delivery Area
Table 3 – by Local Health Area
Appendix 3 - 2017-2027 population changes by age group (absolute numbers).
Table 1 – by Health Authority
Table 2 – by Health Service Delivery Area
Table 3 – by Local Health Area
Appendix 4 - 2017-2027 population changes by age group (percent change).
Table 1 – by Health Authority
Table 2 – by Health Service Delivery Area
Table 3 – by Local Health Area
Appendix 5 - 2007-2037 population and change, by age group with population proportions.
Table 1 – by Health Authority
Table 2 – by Health Service Delivery Area
Table 3 – by Local Health Area
Appendix 6 - 2007-2037 – population growth and proportions (tables and charts).
Table 1.1 – Health Authorities (percentages)
Table 1.2 – Health Authorities (numbers)
Table 2.1 – Health Service Delivery Areas (percentages)
Table 2.2 – Health Service Delivery Areas (numbers)
Table 3.1 – Local Health Areas with positive growth (percentages)
Table 3.2 – Local Health Areas with positive growth (numbers)
Table 4.1 – Local Health Areas with negative growth (percentages)
Table 4.2 – Local Health Areas with negative growth (numbers)
Appendix 7 - BC’s Health Area structure.

Page 4 of 16
Introduction
In 2007, the College of Physicians and Surgeons of British Columbia (CPSBC) Medical Directory listed 1,719
“active” physicians in Rural Subsidiary Agreement Communities (RSAC’s). In 2017 there were 2,159 “active” RSAC
physicians. That was a 26% increase. In 2007, the total number of “active” physicians for the entire province was
9,749. In 2017, there were 12,481. That was a 28% increase. During the 2007-2017 period, BC’s total population
increased by 12%. The province’s physician supply appears to be growing much more rapidly than its population.
If that was indeed the case, then why is there still a physician shortage? Perhaps there are increasing numbers of
clinically inactive physicians who are listed as “active” in the Medical Directory. That would inflate physician
workforce numbers without increasing patient care capacity. Perhaps physician productivity is declining. Is an
increasing bureaucratic burden eroding physician productivity? One cannot hope to understand the healthcare
equation by examining only one side of it. The physician workforce is the supply side of the healthcare equation.
Patient need is the demand side of the healthcare equation.
This paper looks at BC’s estimated past, and projected future, populations for the years 2007, 2017, 2027 and
2037. It focuses on population both as a total number as well as on seniors as a specific group. These appear to be
the two main demographic factors that likely have the greatest impact on physician workloads.
In North America, annual per-person healthcare expenditures tend to be low until around age 50. They then begin
climbing rapidly. According to the Fraser Institute’s November 2017 Fraser Research Bulletin 1; after the first year
of life with government spending of $10,800; annual government health care spending declines sharply. Those
between 15 and 44 years of age cost $2,093 per year, while those between ages 65-74 cost $7,401 per year.
Spending rises to $13,797 for the 75-84 age group and $26,235 for the over 85 age group. According to
Brimacombe 2, per person healthcare spending for someone over 90 years of age was 8.3 times the average for
Canadians between ages 45-64.
It is clear that average per capita health care costs increase rapidly during a person’s senior years. Health care
costs may not be perfectly correlated with physician workload. However, it seems reasonable to assume that
physician workload increases with patient age. That is the reason those age 65 years and over “seniors” receive
focus in this paper.
BC’s population is growing by approximately 53,000 people per year 3. As a simple headcount, the 26% increases
in RSAC physicians and the 28% increase for physicians provincially should have been more than sufficient to cope
with the 12% increase in total population for the 2007-2017 period. This may lead some to believe the situation
greatly improved. However, when the population is examined in greater detail, it quickly becomes evident that a
simple head count is misleading (fig. 1 & 2).

Page 5 of 16
Fig. 1. 30 years of growth viewed as a head count. Fig. 2. Another way of viewing 30 years of growth.
Methods
Data for the 2007 and 2017 population estimates, and the 2027 and 2037 population projections, were obtained
from the BC Stats website. For simplicity, the demographics have not been separated by gender. The populations
have been grouped into non-seniors (<65 years of age) and seniors (>=65 years of age). Seniors were further split
into three groups: 65-74 years old, 75-84 years old and >=85 years old. These age groupings were chosen to match
those in the Fraser Institute’s November 2017 Fraser Research Bulletin.
Geographically, areas have been grouped into: Province (BC), Health Authority (HA), Health Service Delivery Area
(HSDA) and Local Health Area (LHA). Vancouver’s six LHA’s have been combined into one LHA (Vancouver
aggregate). For the purpose of this paper there are: 5 HA’s, 16 HSDA’s and 84 LHA’s. Municipality level
populations were not used because data was lacking for many smaller communities. Also, the population data for
more rural municipalities did not sum to the LHA populations. This is believed to result from the municipal
population data being restricted to people living within municipal boundaries. In metropolitan areas, communities
abut and there are no people living outside municipal boundaries. They either live in one municipality or another.
In rural areas, municipalities do not necessarily abut and people can live outside municipal boundaries.
4,333,3794,861,984
5,397,6815,941,962
528,605 535,697 544,281
BC's Population and Growth2007-2037
Population Growth
12% 11% 10%7%
4%6%
44%42%
23%
2007-2017 2017-2027 2027-2037
BC's Population Growth Rate(Total, Non-Seniors and Seniors)
% Growth % Growth <65 yrs % Growth >=65 yrs
Page 6 of 16
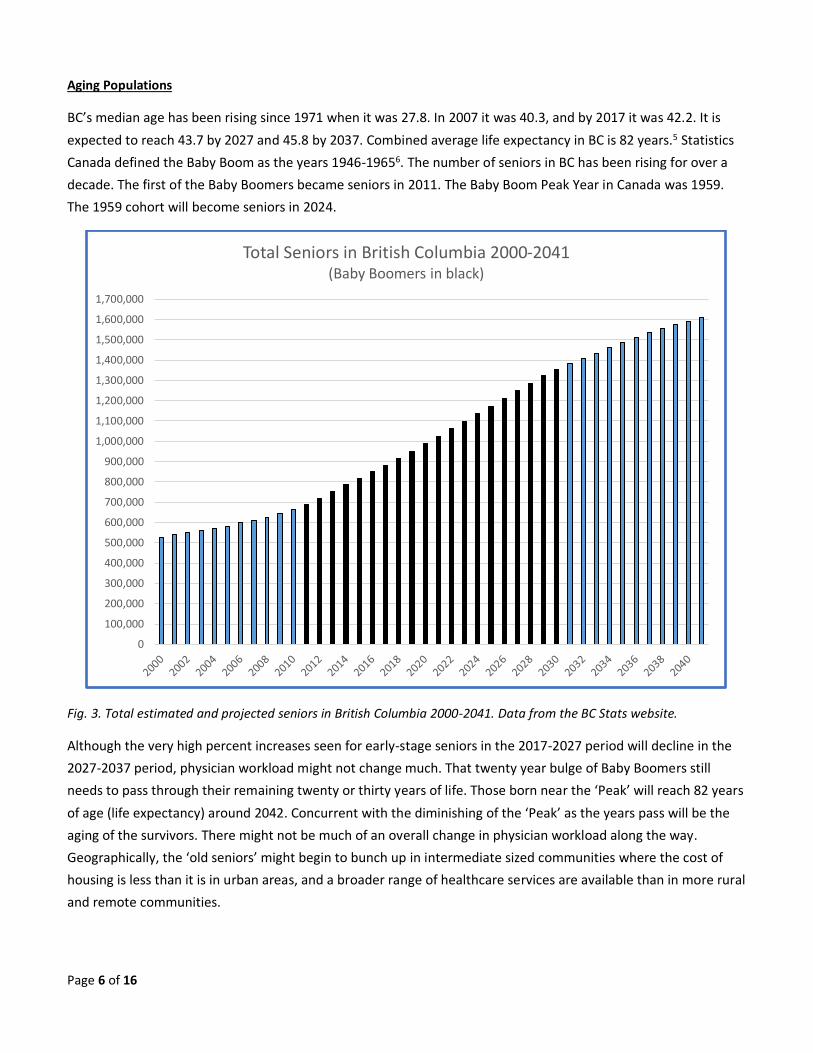
Aging Populations
BC’s median age has been rising since 1971 when it was 27.8. In 2007 it was 40.3, and by 2017 it was 42.2. It is
expected to reach 43.7 by 2027 and 45.8 by 2037. Combined average life expectancy in BC is 82 years.5 Statistics
Canada defined the Baby Boom as the years 1946-19656. The number of seniors in BC has been rising for over a
decade. The first of the Baby Boomers became seniors in 2011. The Baby Boom Peak Year in Canada was 1959.
The 1959 cohort will become seniors in 2024.
Fig. 3. Total estimated and projected seniors in British Columbia 2000-2041. Data from the BC Stats website.
Although the very high percent increases seen for early-stage seniors in the 2017-2027 period will decline in the
2027-2037 period, physician workload might not change much. That twenty year bulge of Baby Boomers still
needs to pass through their remaining twenty or thirty years of life. Those born near the ‘Peak’ will reach 82 years
of age (life expectancy) around 2042. Concurrent with the diminishing of the ‘Peak’ as the years pass will be the
aging of the survivors. There might not be much of an overall change in physician workload along the way.
Geographically, the ‘old seniors’ might begin to bunch up in intermediate sized communities where the cost of
housing is less than it is in urban areas, and a broader range of healthcare services are available than in more rural
and remote communities.
0
100,000
200,000
300,000
400,000
500,000
600,000
700,000
800,000
900,000
1,000,000
1,100,000
1,200,000
1,300,000
1,400,000
1,500,000
1,600,000
1,700,000
Total Seniors in British Columbia 2000-2041(Baby Boomers in black)

Page 7 of 16
Population Growth and Urbanization
A clear trend emerged when the LHA’s were sorted according to their 2007 population size and their percent
growth for 2007-2017 was plotted (fig. 4). Generally, the more populous the LHA, the higher the percent growth
for the period 2007-2017. This trend continues for 2017-2027 and 2027-2037. The less populous LHA’s not only
grow less in absolute terms, they also grow less as a percent of their total population. This trend mirrors the
percent changes in population <65 for LHA’s (fig. 5).
Fig. 4. More populous LHA’s tend to have higher growth rates.
Fig. 5. More populous LHA’s have higher <65 growth rates.
The North’s projected 30 year population changes are unusual (fig. 6). Provincially, there is a positive correlation
between an area’s total population and its expected growth rate. The larger the population the higher the growth
-30%
-20%
-10%
0%
10%
20%
30%
40%
2007 populations - largest on the left hand side, smallest on the right hand size.
Percent Change in Total Population for 2007-2017(LHA's sorted by 2007 population size)
-40%
-30%
-20%
-10%
0%
10%
20%
30%
40%
2007 populations - largest on left hand side, smallest on right hand side.
Percent Change <65 Population 2007-2017(LHA's sorted by 2007 population size)
Page 8 of 16
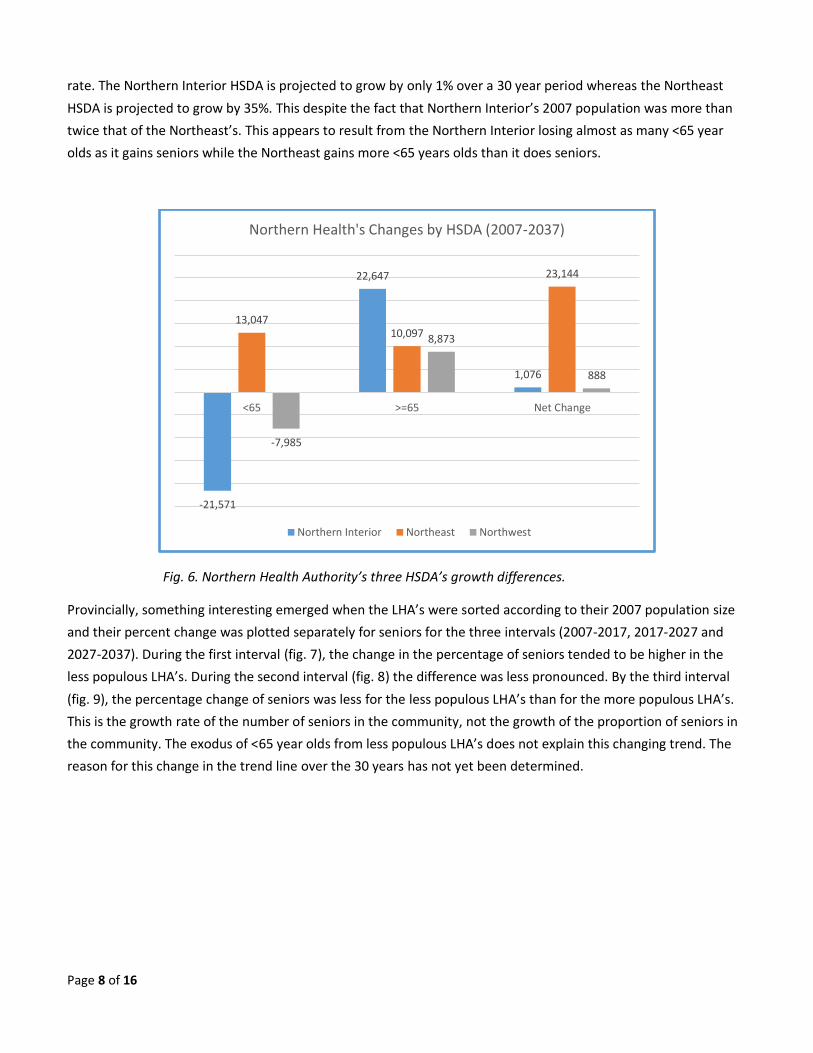
rate. The Northern Interior HSDA is projected to grow by only 1% over a 30 year period whereas the Northeast
HSDA is projected to grow by 35%. This despite the fact that Northern Interior’s 2007 population was more than
twice that of the Northeast’s. This appears to result from the Northern Interior losing almost as many <65 year
olds as it gains seniors while the Northeast gains more <65 years olds than it does seniors.
Fig. 6. Northern Health Authority’s three HSDA’s growth differences.
Provincially, something interesting emerged when the LHA’s were sorted according to their 2007 population size
and their percent change was plotted separately for seniors for the three intervals (2007-2017, 2017-2027 and
2027-2037). During the first interval (fig. 7), the change in the percentage of seniors tended to be higher in the
less populous LHA’s. During the second interval (fig. 8) the difference was less pronounced. By the third interval
(fig. 9), the percentage change of seniors was less for the less populous LHA’s than for the more populous LHA’s.
This is the growth rate of the number of seniors in the community, not the growth of the proportion of seniors in
the community. The exodus of <65 year olds from less populous LHA’s does not explain this changing trend. The
reason for this change in the trend line over the 30 years has not yet been determined.
-21,571
22,647
1,076
13,04710,097
23,144
-7,985
8,873
888
<65 >=65 Net Change
Northern Health's Changes by HSDA (2007-2037)
Northern Interior Northeast Northwest

Page 9 of 16
Fig. 7. The percentage of seniors grew fastest for less populous LHA’s for 2007-2017.
Fig. 8. The growth rate for seniors in less populous LHA’s is projected to slow for 2017-2027
Fig. 9. The growth rate for seniors is projected to be lower for less populous LHA’s for 2027-2037.
0%
20%
40%
60%
80%
100%
120%
140%
160%
180%
2007 populations - largest on left hand side, smallest on right hand side.
Percent Change >=65 Population 2007-2017(LHA 's sorted by 2007 population size)
0%
20%
40%
60%
80%
100%
120%
140%
2007 populations - largest on left hand side, smallest on right hand side.
Percent Change >=65 Population 2017-2027(LHA 's sorted by 2007 population size)
-20%
-10%
0%
10%
20%
30%
40%
50%
60%
2007 populations - largest on left hand side, smallest on right hand side.
Percent Change >=65 Population 2027-2037(LHA 's sorted by 2007 population size)

Page 10 of 16
Population Changes per Health Authority 2007-2017
Fig. 10. Rates of change for the province and health authorities by total population and age groups for 2007-2017.
Between 2007-2017, the population of every HA grew (by 121 people in the case of the NHA). Of the 16 HSDA’s,
only the Northwest had a negative overall growth (-2,914, -4%). At the LHA level, 23 of 84 had negative overall
growth. Growth rates for seniors always exceeded those of the total population at every level (HA, HSDA, LHA).
For the province as a whole the growth rate for seniors was 3.7 times higher than for the total population.
Fig. 11. Population change for the province and health authorities by age group for 2007-2017.
BC FHA VCHA IH IHA NHA
% Growth all yrs 12% 19% 10% 9% 8% 0%
% Growth <65 yrs 7% 15% 5% 2% 2% -5%
% Growth >=65 44% 51% 42% 42% 37% 46%
% Growth 65-74 yrs 57% 62% 54% 64% 46% 48%
% Growth 75-84 yrs 23% 32% 21% 15% 20% 30%
% Growth >=85 yrs 48% 56% 49% 34% 47% 85%
-10%0%
10%20%30%40%50%60%70%80%90%
Population Changes per HA 2007-2017
BC FHA VCHA IH IHA NHA
Growth <65 yrs 259,768 200,368 48,872 12,675 10,282 -12,429
Growth >=65 268,837 94,626 59,526 54,816 47,319 12,550
Growth 65-74 yrs 181,985 61,229 39,469 41,720 31,492 8,075
Growth 75-84 yrs 49,435 20,441 10,593 6,885 8,940 2,576
Growth >=85 yrs 37,417 12,956 9,464 6,211 6,887 1,899
-15,0005,000
25,00045,00065,00085,000
105,000125,000145,000165,000185,000205,000225,000245,000265,000285,000
Population Changes per HA 2007 -2017

Page 11 of 16
Population Changes per Health Authority 2017-2027
Fig. 12. Rates of change for the province and health authorities by total population and age groups for 2017-2027.
For the 2017-2027 period, growth is projected for every HA and every HSDA. Negative growth is projected for 21
of 84 LHA’s. Growth rate projections for seniors always exceed those of the general population at all levels. For
the province as a whole the growth rate for seniors is projected to be 3.8 times that of the total population. This is
the period during which the Baby Boomer Peak Year cohort (1959) will turn 65 years old (2024).
Fig. 13. Population change for the province and health authorities by age group for 2017-2027.
BC FHA VCHA IH IHA NHA
% Growth 11% 15% 9% 9% 7% 6%
% Growth <65 yrs 4% 9% 3% 0% -1% -1%
% Growth >=65 42% 50% 41% 37% 33% 52%
% Growth 65-74 yrs 31% 44% 33% 18% 20% 44%
% Growth 75-84 yrs 60% 62% 52% 72% 53% 68%
% Growth >=85 yrs 47% 50% 49% 41% 46% 55%
-10%
0%
10%
20%
30%
40%
50%
60%
70%
80%
Population Changes per HA 2017-2027
BC FHA VCHA IH IHA NHA
Growth <65 yrs 167,205 142,617 30,014 1,952 -4,043 -3,335
Growth >=65 368,492 139,789 82,875 67,252 57,850 20,726
Growth 65-74 yrs 156,935 69,967 37,427 18,892 19,778 10,871
Growth 75-84 yrs 157,277 51,767 31,417 38,408 28,117 7,568
Growth >=85 yrs 54,280 18,055 14,031 9,952 9,955 2,287
-15,00025,00065,000
105,000145,000185,000225,000265,000305,000345,000385,000425,000
Population Changes per HA 2017 -2027
Page 12 of 16
Population Changes per Health Authority 2027-2037
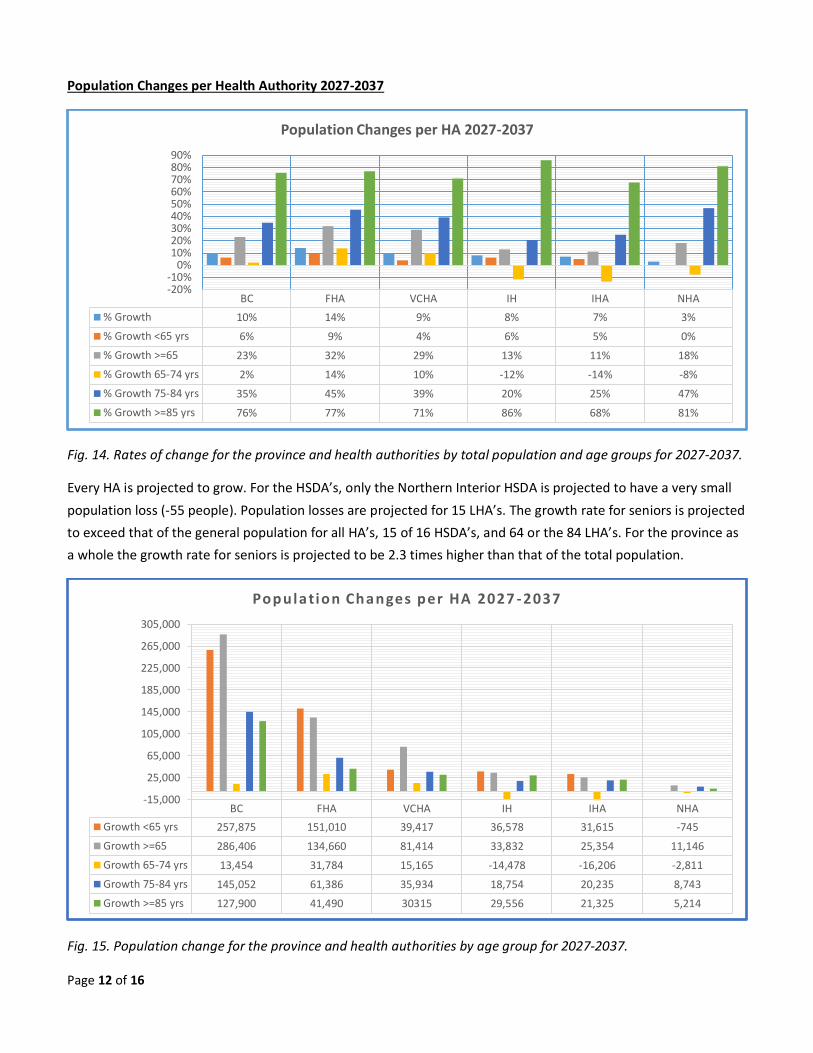
Fig. 14. Rates of change for the province and health authorities by total population and age groups for 2027-2037.
Every HA is projected to grow. For the HSDA’s, only the Northern Interior HSDA is projected to have a very small
population loss (-55 people). Population losses are projected for 15 LHA’s. The growth rate for seniors is projected
to exceed that of the general population for all HA’s, 15 of 16 HSDA’s, and 64 or the 84 LHA’s. For the province as
a whole the growth rate for seniors is projected to be 2.3 times higher than that of the total population.
Fig. 15. Population change for the province and health authorities by age group for 2027-2037.
BC FHA VCHA IH IHA NHA
% Growth 10% 14% 9% 8% 7% 3%
% Growth <65 yrs 6% 9% 4% 6% 5% 0%
% Growth >=65 23% 32% 29% 13% 11% 18%
% Growth 65-74 yrs 2% 14% 10% -12% -14% -8%
% Growth 75-84 yrs 35% 45% 39% 20% 25% 47%
% Growth >=85 yrs 76% 77% 71% 86% 68% 81%
-20%-10%
0%10%20%30%40%50%60%70%80%90%
Population Changes per HA 2027-2037
BC FHA VCHA IH IHA NHA
Growth <65 yrs 257,875 151,010 39,417 36,578 31,615 -745
Growth >=65 286,406 134,660 81,414 33,832 25,354 11,146
Growth 65-74 yrs 13,454 31,784 15,165 -14,478 -16,206 -2,811
Growth 75-84 yrs 145,052 61,386 35,934 18,754 20,235 8,743
Growth >=85 yrs 127,900 41,490 30315 29,556 21,325 5,214
-15,000
25,000
65,000
105,000
145,000
185,000
225,000
265,000
305,000
Population Changes per HA 2027 -2037

Page 13 of 16
Changing Population Proportions 2007-2037
Over 30 years (2007-2037) the population proportions will change for every Health Authority, Health Service
Delivery Area and Local Health Area. The change is consistent. The proportion of the population <65 decreases
while the proportion >=65 increases. At the provincial level the proportion of seniors continues to increase: 14%
in 2007, 18% in 2017, 23% in 2027 and 26% in 2037 (fig. 16).
For more populous LHA’s, these changing proportions result from a rapid increase in seniors. The <65 population
usually shows significant growth, which is eclipsed by the phenomenal growth of the seniors.
For the less populous LHA’s, these changing proportions usually result from a combination of a shrinking <65
population and an extreme increase in the number of seniors. An example is the Hope LHA, where the <65
population is expected to decline 37% from 6,338 in 2007 to 3,972 by 2037. The senior’s population is expected to
increase 82% from 1,608 to 2,924 during the same period. The combined effect is an increase in the proportion of
seniors in the Hope LHA from 20% to 42%. Other examples of this sort are the: Grand Forks, Kettle Valley,
Kootenay Lake, Lake Cowichan, Lillooet, North Thompson, Prince George and South Cariboo LHA’s.
For a few (a very few) of the less populous LHA’s, the proportion of seniors is increasing rapidly despite a
significant growth in the <65 population. Examples of this include Howe Sound and Peace River North. The
opposite can also be true. An LHA’s population of seniors may grow rapidly, while the proportion of seniors
remains comparatively stable. This results from simultaneous increases in both segments of the population.
Example: South Surrey/White Rock LHA.
Fig. 16. Changes in the proportions of non-seniors and seniors per health authority for the period 2007-2037.
88% 87%82% 82%
90%86%
77% 74%70% 70%
77% 74%
12% 13%18% 18%
10%14%
23% 26%30% 30%
23% 26%
Fraser Coastal Island Interior Northern BC Total
Population Proportions by Health Authority for non-Seniors and Seniors (2007 & 2037)
2007 <65 2037 <65 2007 >=65 2037 >=65
Page 14 of 16
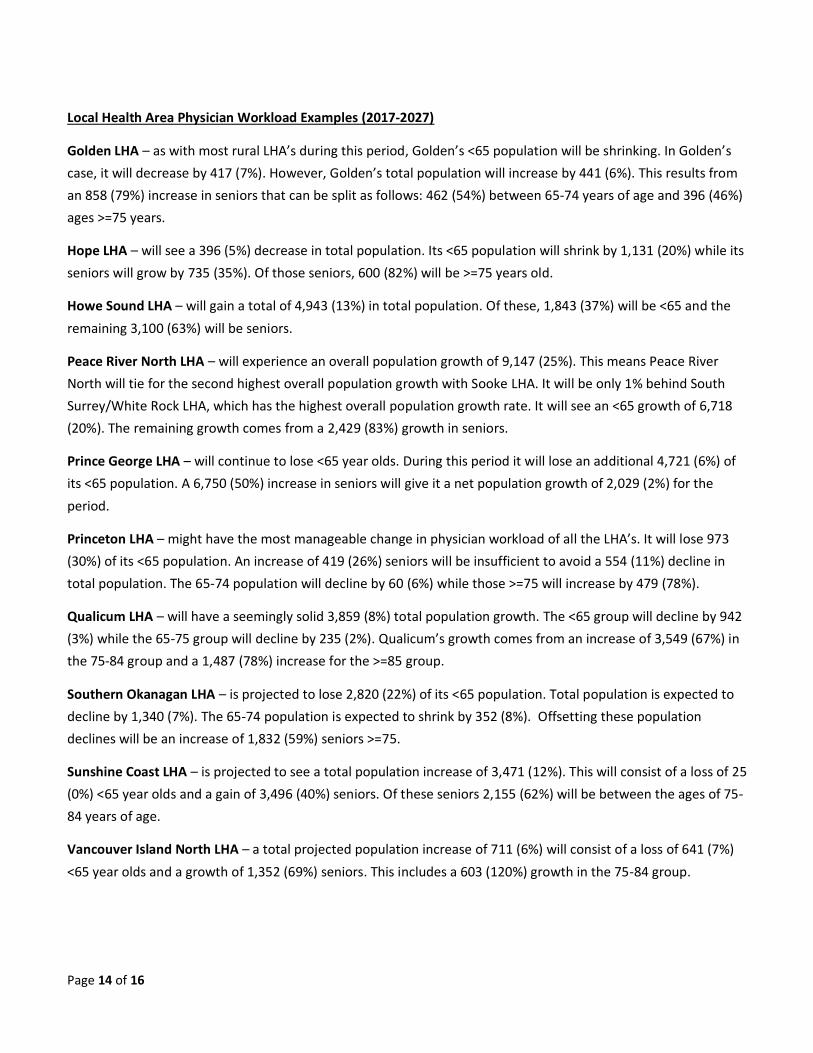
Local Health Area Physician Workload Examples (2017-2027)
Golden LHA – as with most rural LHA’s during this period, Golden’s <65 population will be shrinking. In Golden’s
case, it will decrease by 417 (7%). However, Golden’s total population will increase by 441 (6%). This results from
an 858 (79%) increase in seniors that can be split as follows: 462 (54%) between 65-74 years of age and 396 (46%)
ages >=75 years.
Hope LHA – will see a 396 (5%) decrease in total population. Its <65 population will shrink by 1,131 (20%) while its
seniors will grow by 735 (35%). Of those seniors, 600 (82%) will be >=75 years old.
Howe Sound LHA – will gain a total of 4,943 (13%) in total population. Of these, 1,843 (37%) will be <65 and the
remaining 3,100 (63%) will be seniors.
Peace River North LHA – will experience an overall population growth of 9,147 (25%). This means Peace River
North will tie for the second highest overall population growth with Sooke LHA. It will be only 1% behind South
Surrey/White Rock LHA, which has the highest overall population growth rate. It will see an <65 growth of 6,718
(20%). The remaining growth comes from a 2,429 (83%) growth in seniors.
Prince George LHA – will continue to lose <65 year olds. During this period it will lose an additional 4,721 (6%) of
its <65 population. A 6,750 (50%) increase in seniors will give it a net population growth of 2,029 (2%) for the
period.
Princeton LHA – might have the most manageable change in physician workload of all the LHA’s. It will lose 973
(30%) of its <65 population. An increase of 419 (26%) seniors will be insufficient to avoid a 554 (11%) decline in
total population. The 65-74 population will decline by 60 (6%) while those >=75 will increase by 479 (78%).
Qualicum LHA – will have a seemingly solid 3,859 (8%) total population growth. The <65 group will decline by 942
(3%) while the 65-75 group will decline by 235 (2%). Qualicum’s growth comes from an increase of 3,549 (67%) in
the 75-84 group and a 1,487 (78%) increase for the >=85 group.
Southern Okanagan LHA – is projected to lose 2,820 (22%) of its <65 population. Total population is expected to
decline by 1,340 (7%). The 65-74 population is expected to shrink by 352 (8%). Offsetting these population
declines will be an increase of 1,832 (59%) seniors >=75.
Sunshine Coast LHA – is projected to see a total population increase of 3,471 (12%). This will consist of a loss of 25
(0%) <65 year olds and a gain of 3,496 (40%) seniors. Of these seniors 2,155 (62%) will be between the ages of 75-
84 years of age.
Vancouver Island North LHA – a total projected population increase of 711 (6%) will consist of a loss of 641 (7%)
<65 year olds and a growth of 1,352 (69%) seniors. This includes a 603 (120%) growth in the 75-84 group.
Page 15 of 16
Conclusions
It is clear that BC’s demographic changes play a significant role in increasing physician workload. The provincial
population increases by over a half million people every ten years. That alone requires a significant increase in the
number of practicing physicians to maintain the per physician workload at 2007 levels.
In addition to the total increase in population is the increased workload resulting from a rapidly aging population.
BC’s median age has been rising since 1971 and is expected to continue to do so. The coming decade will see the
trailing end of the Baby Boomer generation become seniors. The leading edge of the Baby Boomers will move into
their 80’s. The number of seniors in BC is expected to increase by 368,492 (42%) in the coming ten years.
The decades long process of urbanization continues. Both in absolute numbers and percentages, the most
populous LHA’s tend to experience the highest growth rates. Conversely, the least populous LHA’s are
experiencing negative growth. Kettle Valley LHA will have a projected 27% total population decline between 2007
and 2037. The proportional decline of the rural population will see a corresponding decline in their political and
economic influence at the provincial level.

Page 16 of 16
References
1. Clemens J, Stedman A, Emes J. (2017). The Impact of Interprovincial Migration of Seniors on Provincial Health
Care Spending. Fraser Institute, Fraser Research Bulletin, November 2017.
2. Brimacombe GG, Antunes P, McIntyre J. (2001). The Future Cost of Health Care in Canada, 2000-2020:
Balancing Affordability and Sustainability. Conference Board of Canada.
3. British Columbia Population Projection 17/05 (Estimates – Statistics Canada. Projections – BC Stats July 2017).
4. BC Stats. (2018). Government of British Columbia.
https://www2.gov.bc.ca/gov/content/data/statistics/people-population-community/population
5. Statistics Canada (2012). CANSIM Table 102-0512 Life expectancy, at birth and at age 65, by sex, Canada,
provinces and territories. Government of Canada. http://www.statcan.gc.ca/tables-tableaux/sum-
som/l01/cst01/health72a-eng.htm
6. Statistics Canada – Catalogue no. 91-520X. Population Projections for Canada, Provinces and Territories.
Glossary. Page 244.