
British Columbia technology report card · the 2016 report: 1) scaling the growth of companies and...
48
November 2018 kpmg.ca British Columbia technology report card From growth to scale
Transcript of British Columbia technology report card · the 2016 report: 1) scaling the growth of companies and...

November 2018
kpmg.ca
British Columbia technology report cardFrom growth to scale

2British Columbia technology report card
© 2018 KPMG LLP, a Canadian limited liability partnership and a member firm of the KPMG network of independent member firms affiliated with KPMG International Cooperative (“KPMG International”), a Swiss entity. All rights reserved.
Contents5 Foreword
6 Executive summary
8 Sector profile and comparative analysis
08 Introduction
09 BC technology sector at a glance
10 Sector breakdown
12 Part A: Economic performance indicators
14 Revenues
15 Index of technology industry revenues
16 Gross domestic product
23 Employment and wages
28 Exports
31 Summary
32 Part B: Sector input indicators
32 Highlights
33 Talent availability
38 Access to capital
39 Industry insights on capital investment
40 Research and development
44 Intellectual property
46 Conclusion
47 Acknowledgements
© 2018 KPMG LLP, a Canadian limited liability partnership and a member firm of the KPMG network of independent member firms affiliated with KPMG International Cooperative (“KPMG International”), a Swiss entity. All rights reserved.

4British Columbia technology report card
© 2018 KPMG LLP, a Canadian limited liability partnership and a member firm of the KPMG network of independent member firms affiliated with KPMG International Cooperative (“KPMG International”), a Swiss entity. All rights reserved.

ForewordThe story of British Columbia’s tech industry continues to be a story of success and sky-high opportunity.
It’s no surprise that BC’s fast-growing tech sector is a leading economic driver of growth in our province; technology is a tool empowering businesses, people, and governments to tackle important problems and improve lives. Our ecosystem has matured and flourished in the last two years, building ever closer connections and meaningful partnerships through initiatives like the Digital Technology Supercluster and the Cascadia Innovation Corridor.
Since 2012, BC Tech has teamed up with KPMG in Canada to assess the impact of the technology sector in BC, and with this 4th report card BC’s tech economy takes its place as a clear Canadian leader. In 2018’s report card, the BC technology sector’s economic performance received an A compared to other BC industries and – for the first time – an A compared to other Canadian provinces. This is a tremendous achievement!
Yet challenges remain. Our letter grade on tech sector input indicators has not progressed from the B– we received in the 2016 report card. This means that overall, BC’s tech sector receives a B: a respectable grade but one that clearly indicates unrealized potential and must be addressed. Complacency about economic inputs will inevitably lead to an erosion of performance on economic outputs. This report card delivers a clear call to action in two key areas, also emphasized in the 2016 report: 1) scaling the growth of companies and 2) educating, attracting and retaining the best talent in the world.
Access to talent continues to be the biggest constraint BC tech companies of all sizes face in expanding their businesses. Every year technology businesses create many more job openings than they are able to fill. These jobs range from specialized technical skills to general business skills such as marketing, finance, legal, and sales. Concerningly, BC has a striking lack of experienced talent – those with a track record in growing companies from start-ups to scale-ups.
And while BC’s graduates are second to none, we are simply not keeping up with the quantity of people needed or the new skills and qualifications required by a fast-changing industry. We must invest more in people and grow BC’s skilled workforce by funding more educational opportunities – starting with K-12 and right through to post-secondary and lifelong learning.
But as important as access to talent is, it will not be enough on its own. Highlighted against BC’s many clear strengths, our
principal weakness stands out: BC’s lack of anchor technology companies that have achieved scale. Without a thriving, vibrant core of anchor tech companies at the heart of our ecosystem, enriching the talent pool, creating spinoffs with new
ideas, and providing proven pathways to scale, we’ll be unable to make BC the best place to grow a tech company.
At BC Tech we have made it our number one priority to understand the complex, multi-stranded causes of this shortage of anchor companies and take determined action to address it through our venture programs, our ecosystem collaboration, and our public policy recommendations. This 2018 BC Tech report card reminds us how critical that mission is and how essential it is that we succeed.
For the future to look different than the past requires more than audacious ambition. Success will demand stronger partnerships and collaboration among tech companies, business leaders, post-secondary institutions, ecosystem and government partners. And as always, visionary change will require a willingness to depart from the safe path of the status quo and take bold first steps in a new direction. The history of technology shows that time and time again, everything is difficult until it is easy, unthinkable until it is commonplace. The real heroes are those who decide, together, to act.
Jill Tipping President & CEO BC Tech Association
BC’s tech economy takes its place as a clear Canadian leader.
5British Columbia technology report card
© 2018 KPMG LLP, a Canadian limited liability partnership and a member firm of the KPMG network of independent member firms affiliated with KPMG International Cooperative (“KPMG International”), a Swiss entity. All rights reserved.
Executive summaryThe BC technology report card’s theme “From growth to scale” is a particularly fitting one for its latest release. We are in the midst of what has been called “Industry 4.0,” where digital technologies are enabling organizations to transform their business models and rethink how best to serve their customers and citizens at large. In KPMG’s most recent publication of the Canadian CEO Outlook, titled “Growing pains,” Canadian and BC CEOs are bullish about the opportunities to transform their organizations and take advantage of the leading innovation currently taking place here in BC.
BC’s strategic location as a gateway to Asia and its Cascadia Innovation Corridor partnerships provide BC technology companies with new growth markets and opportunities to compete and collaborate at the global scale. The BC technology sector has made incredible strides over the last few years by launching technology products and conducting world-leading research. However, it is clear that in order to scale, more investment is required to develop the talent that will sustain these companies in the future.
KPMG is proud to be a part of the BC technology ecosystem. From our discussions with senior leaders at the helm of BC-based technology firms, there is a clear need for even more anchor technology companies that call BC home. Companies that will form the backbone of a vibrant tech community. The BC tech ecosystem is a strong cluster of industry, academia, and government which, if successfully brought together, can unleash innovations that can be globally commercialized at scale. The opportunity is here, and it is our collective responsibility to come together to realize it and take our rapidly growing tech sector to the next level.
Several key themes emerge in this year’s report, many of which point to a sector in the midst of considerable and consistent growth but with opportunities to fill expanding companies and bridge the gap between its US peers. Ahead are some of the central observations.
The BC tech sector continues to exhibit consistent growth in revenues and GDP contribution.BC’s tech sector has benefited from consistent growth over the past ten years, whereas other sectors within the province have seen greater fluctuations in performance. However, there is more room to grow when compared to US jurisdictions.
Companies are maturing.There are a greater number of medium-sized companies compared to just two years ago. The same cannot be said of larger companies, which tend to generate higher profitability and play a more valuable role in the sector’s success. As such, both the BC government and tech community have roles to play in promoting the growth and scaling of BC’s tech players.
Access to talent remains a critical issue.BC’s post-secondary institutions are graduating fewer engineering and technology-related degrees on a per capita basis. Tech sector leaders indicated there is a challenge in recruiting experienced tech sector veterans within the province.
Jameel Ahamed Partner, Consulting and BC Lead Digital Transformation and Innovation KPMG
Kostya Polyakov Partner and Greater Vancouver Area Industry Leader for Technology, Media and Telecommunications KPMG
6British Columbia technology report card
© 2018 KPMG LLP, a Canadian limited liability partnership and a member firm of the KPMG network of independent member firms affiliated with KPMG International Cooperative (“KPMG International”), a Swiss entity. All rights reserved.
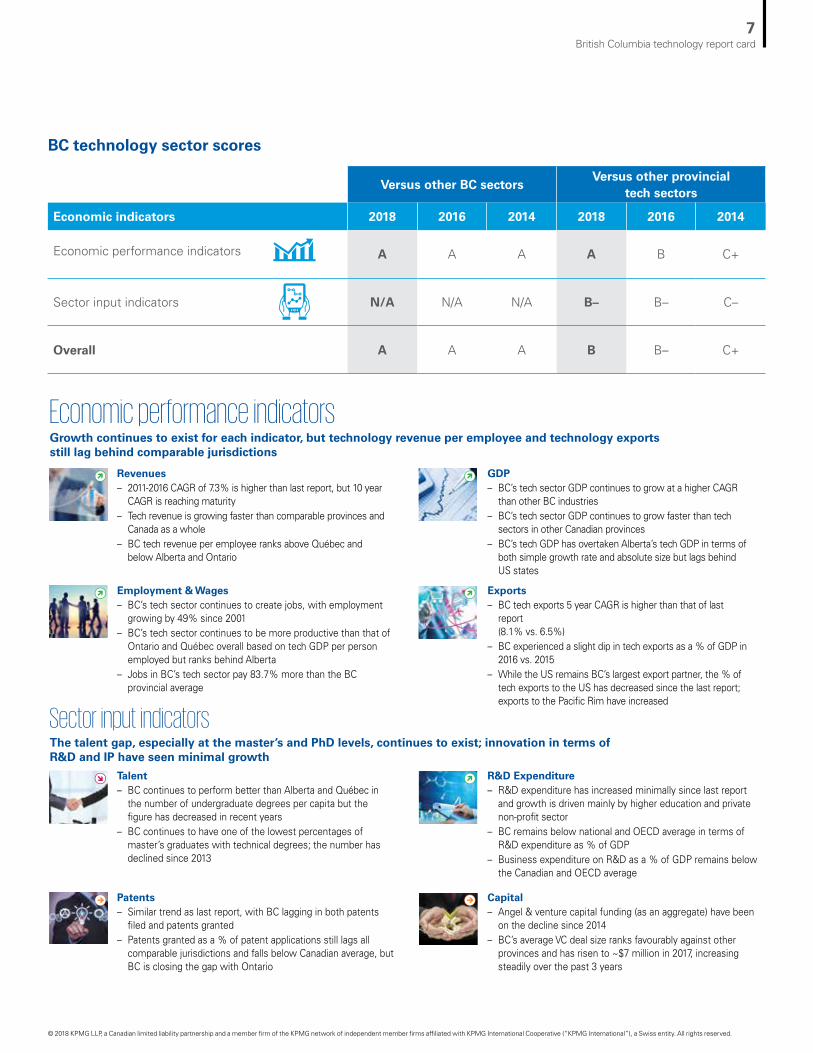
Versus other BC sectorsVersus other provincial
tech sectors
Economic indicators 2018 2016 2014 2018 2016 2014
Economic performance indicators A A A A B C+
Sector input indicators N/A N/A N/A B– B– C–
Overall A A A B B– C+
BC technology sector scores
Economic performance indicatorsGrowth continues to exist for each indicator, but technology revenue per employee and technology exportsstill lag behind comparable jurisdictions
Sector input indicators
Revenues– 2011-2016 CAGR of 7.3% is higher than last report, but 10 year
CAGR is reaching maturity– Tech revenue is growing faster than comparable provinces and
Canada as a whole– BC tech revenue per employee ranks above Québec and
below Alberta and Ontario
Employment & Wages– BC’s tech sector continues to create jobs, with employment
growing by 49% since 2001– BC’s tech sector continues to be more productive than that of
Ontario and Québec overall based on tech GDP per person employed but ranks behind Alberta
– Jobs in BC’s tech sector pay 83.7% more than the BC provincial average
GDP– BC’s tech sector GDP continues to grow at a higher CAGR
than other BC industries– BC’s tech sector GDP continues to grow faster than tech
sectors in other Canadian provinces– BC’s tech GDP has overtaken Alberta’s tech GDP in terms of
both simple growth rate and absolute size but lags behindUS states
Exports– BC tech exports 5 year CAGR is higher than that of last
report(8.1% vs. 6.5%)
– BC experienced a slight dip in tech exports as a % of GDP in 2016 vs. 2015
– While the US remains BC’s largest export partner, the % of tech exports to the US has decreased since the last report; exports to the Pacific Rim have increased
Talent– BC continues to perform better than Alberta and Québec in
the number of undergraduate degrees per capita but the figure has decreased in recent years
– BC continues to have one of the lowest percentages of master’s graduates with technical degrees; the number has declined since 2013
Patents– Similar trend as last report, with BC lagging in both patents
filed and patents granted– Patents granted as a % of patent applications still lags all
comparable jurisdictions and falls below Canadian average, but BC is closing the gap with Ontario
The talent gap, especially at the master’s and PhD levels, continues to exist; innovation in terms of R&D and IP have seen minimal growth
R&D Expenditure– R&D expenditure has increased minimally since last report
and growth is driven mainly by higher education and private non-profit sector
– BC remains below national and OECD average in terms of R&D expenditure as % of GDP
– Business expenditure on R&D as a % of GDP remains below the Canadian and OECD average
Capital– Angel & venture capital funding (as an aggregate) have been
on the decline since 2014– BC’s average VC deal size ranks favourably against other
provinces and has risen to ~$7 million in 2017, increasing steadily over the past 3 years
7British Columbia technology report card
© 2018 KPMG LLP, a Canadian limited liability partnership and a member firm of the KPMG network of independent member firms affiliated with KPMG International Cooperative (“KPMG International”), a Swiss entity. All rights reserved.

IntroductionAt over 10,000 companies strong, BC’s technology sector plays a significant role in the province’s growth. The sector is comprised of numerous sub-sectors, including interactive and digital media, clean technology, life sciences, information and communication technology, and IT and engineering services1. Combined, it facilitates more than 100,000 jobs for British Columbians and generates over $17 billion in GDP, nearly 90 percent of which is services.
In this 2018 report, we measure the shape and health of the BC tech sector across numerous performance indicators and benchmark the sector’s performance against other BC industries, provincial tech sectors, and global peers. We also rate the sector’s progress since our 2016 BC Tech Report Card and highlight themes for collective action going forward.
KPMG thanks BC Stats for developing a detailed collection of data and analysis for the high technology sector in BC, which greatly enabled our assessment.
Sector profile and comparative analysis
1 There is no universally adopted definition of what the technology (or “high technology”) sector should encompass. In any case, such a definition is likely to vary over time as technology evolves. For the purposes of this report, KPMG has used the definition adopted by BC Stats, which allows us to leverage the dataset published by the agency and ensures consistency with the definition used in previous versions of the BC Technology Report Card published by KPMG. The high technology sector, as defined by BC Stats, includes “industries that produce high technology goods and services as their ultimate outputs”, and is based on the North American Industry Classification System (NAICS). In 2017, a total of 39 standard industry categories have been included in the definition.
8British Columbia technology report card
© 2018 KPMG LLP, a Canadian limited liability partnership and a member firm of the KPMG network of independent member firms affiliated with KPMG International Cooperative (“KPMG International”), a Swiss entity. All rights reserved.

Labour Capital Intellectual property
106,430 Jobs
$343M VC investment
$3B R&D investment
$1,690 Average weekly earnings
$45M Angel investment
More small companies are transforming into medium-sized enterprises, compared to the 2016 report. Growth among companies with 50 employees or more, however, appears stagnant.
BC technology sector at a glance
Inputs
Outputs
Domestic business Exports
$17B GDP $6B
Exports$29B Revenues
89% Services
77% Services
11% Goods
23% Goods
Source: Profile of the British Columbia High Technology Sector, BC Stats, 2017 Edition
10–19 865
20–49 702
50+ 447
<10 8,222
Production
Distribution of Companies by Employee Size 2016
Growth in Tech Company Count by Employee Size 2014–2016
0%
5%
10%
15%
20%
1–9 10–19 20–49 50+
5%0%3%
19%
” Anchor companies like STEMCELL are crucial for the BC tech sector to scale up. Having companies like ours in the ecosystem makes it easier for other, smaller businesses to attract and retain better talent.”
Andrew Booth Chief Commercial Officer, STEMCELL Technologies
9British Columbia technology report card
© 2018 KPMG LLP, a Canadian limited liability partnership and a member firm of the KPMG network of independent member firms affiliated with KPMG International Cooperative (“KPMG International”), a Swiss entity. All rights reserved.
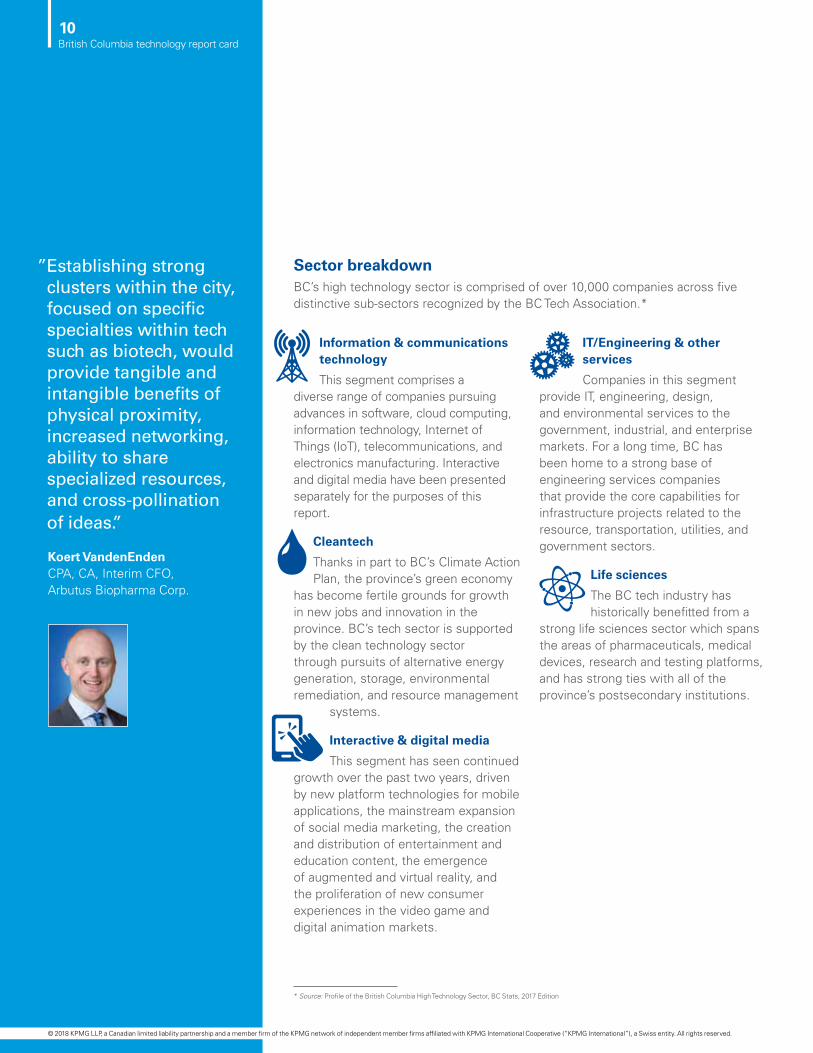
Information & communications technology
This segment comprises a diverse range of companies pursuing advances in software, cloud computing, information technology, Internet of Things (IoT), telecommunications, and electronics manufacturing. Interactive and digital media have been presented separately for the purposes of this report.
Cleantech
Thanks in part to BC’s Climate Action Plan, the province’s green economy
has become fertile grounds for growth in new jobs and innovation in the province. BC’s tech sector is supported by the clean technology sector through pursuits of alternative energy generation, storage, environmental remediation, and resource management
systems.
Interactive & digital media
This segment has seen continued growth over the past two years, driven by new platform technologies for mobile applications, the mainstream expansion of social media marketing, the creation and distribution of entertainment and education content, the emergence of augmented and virtual reality, and the proliferation of new consumer experiences in the video game and digital animation markets.
IT/Engineering & other services
Companies in this segment provide IT, engineering, design, and environmental services to the government, industrial, and enterprise markets. For a long time, BC has been home to a strong base of engineering services companies that provide the core capabilities for infrastructure projects related to the resource, transportation, utilities, and government sectors.
Life sciences
The BC tech industry has historically benefitted from a
strong life sciences sector which spans the areas of pharmaceuticals, medical devices, research and testing platforms, and has strong ties with all of the province’s postsecondary institutions.
Sector breakdownBC’s high technology sector is comprised of over 10,000 companies across five distinctive sub-sectors recognized by the BC Tech Association.*
” Establishing strong clusters within the city, focused on specific specialties within tech such as biotech, would provide tangible and intangible benefits of physical proximity, increased networking, ability to share specialized resources, and cross-pollination of ideas.”
Koert VandenEnden CPA, CA, Interim CFO, Arbutus Biopharma Corp.
* Source: Profile of the British Columbia High Technology Sector, BC Stats, 2017 Edition
10British Columbia technology report card
© 2018 KPMG LLP, a Canadian limited liability partnership and a member firm of the KPMG network of independent member firms affiliated with KPMG International Cooperative (“KPMG International”), a Swiss entity. All rights reserved.

Key sectorsInformation & communication technology
Interactive & digital media
IT/Engineering services
Life sciences
Cleantech
– Cloud computing – Semi-conductors – IT systems – E-commerce – Enterprise software – Communications – Wireless devices
– Mobile apps – Web & social media – Gaming – Online software
– IT services – Engineering services – Environmental services – Design/infrastructure
– Genetics – Biotechnology – Diagnostics – Medical devices – Healthcare technology
– Energy management – Environmental technology – Water technology – Energy storage – Alternative energy – Natural gas
11British Columbia technology report card
© 2018 KPMG LLP, a Canadian limited liability partnership and a member firm of the KPMG network of independent member firms affiliated with KPMG International Cooperative (“KPMG International”), a Swiss entity. All rights reserved.

Versus other BC sectors
Versus other provincial
tech sectors
Economic performance indicators
Revenues N/A ì
Technology GDP ì ì
Sector Employment è ì
Sector Wages ì ì
Exports N/A è
Grade A A
The BC technology sector is continuing to progress as a dynamic sector with growth across multiple economic indicators. This section of the report outlines how the sector is performing across revenues, technology GDP, employment, wages, and exports.
The BC technology sector continues to exhibit signs of growth across key economic indicators. In doing so, it has improved its ranking among other BC sectors and provincial tech sectors across Canada.
Part A: Economic performance indicators
BC technology sector – 2018 report card grades
12British Columbia technology report card
© 2018 KPMG LLP, a Canadian limited liability partnership and a member firm of the KPMG network of independent member firms affiliated with KPMG International Cooperative (“KPMG International”), a Swiss entity. All rights reserved.

Versus other BC sectors
The tech sector remains a “Top 5” sector, contributing more to the economy than traditional resource sectors (forestry, mining, oil & gas) with $17.2B GDP in 2016; and providing jobs that pay, on average, 84 percent more than the BC average per year.
Versus other provincial technology sectors
The BC tech sector exhibits one of the fastest GDP and revenue growth rates. It is catching up to larger provincial tech sectors in the GDP and revenue categories and has surpassed them in average wages. That said, the sector is underperforming in regards to its number of mid- to large-size firms. BC has an increasing number of mid-size companies, yet the number of mid- and large-size companies continues to trail more mature tech sectors in provinces like Ontario.*
” To drive key ingredients required for a vibrant tech ecosystem, such as a strong access to capital and a healthy talent pool, BC needs to foster a home-grown ‘platform business model.’ ‘Platform business models’ not only provide vital network effect benefits to multiple groups of stakeholders, but also serve as a highly valuable data pool, which can be collected, analyzed, and then monetized in our province.”
Jeff Booth Vancouver tech entrepreneur
* Source: Profile of the British Columbia High Technology Sector, BC Stats, 2017 Edition
13British Columbia technology report card
© 2018 KPMG LLP, a Canadian limited liability partnership and a member firm of the KPMG network of independent member firms affiliated with KPMG International Cooperative (“KPMG International”), a Swiss entity. All rights reserved.

Versus other provincial tech sectors
Versus Ontario
Revenues è î
Revenue growth ì ì
Summary ì N/A
BC technology sector revenues have grown
at 7.3% annually since 2011.
RevenuesThe BC technology sector generates a significant revenue base and is growing rapidly compared to its provincial counterparts. Its performance ranks third highest in the country behind Ontario and Québec and, when based on a five-year compound annual growth rate, surpasses all other provinces to rank first among its peers.
BC technology revenues and growth
Source: Profile of the British Columbia High Technology Sector, BC Stats, 2017 Edition
Comparison of sector revenues
Going deeperBC’s technology sector revenues continue to enjoy an upward trajectory, recording $28.9 billion in 2016 and an impressive 14.2 percent growth in revenues over the last two years. The sector also exhibits a five-year compound annual growth rate of 7.3 percent, up from the 6.3 percent shown from 2009–2014.2, 3
17.118.3 18.7 18.6 19.1
20.321.7
23.325.3
26.5
28.9
$ b
illio
n
0.0
5.0
10.0
15.0
20.0
25.0
30.0
35.0 CAGR 5.4%
2006 2007 2008 2009 2010 2011 2012 2013 2014 2015 2016
CAGR: 3.5%
CAGR: 7.3%
2 Revenue figures are not adjusted for inflation. For inflation-adjusted output values, please refer to the GDP section of this analysis.
3 Sector revenue figures for BC are based on establishments. That is, for firms headquartered in BC, only the revenues generated from their BC operations are included in the revenue figures.
14British Columbia technology report card
© 2018 KPMG LLP, a Canadian limited liability partnership and a member firm of the KPMG network of independent member firms affiliated with KPMG International Cooperative (“KPMG International”), a Swiss entity. All rights reserved.
Index of technology sector revenues (2006 = 100)
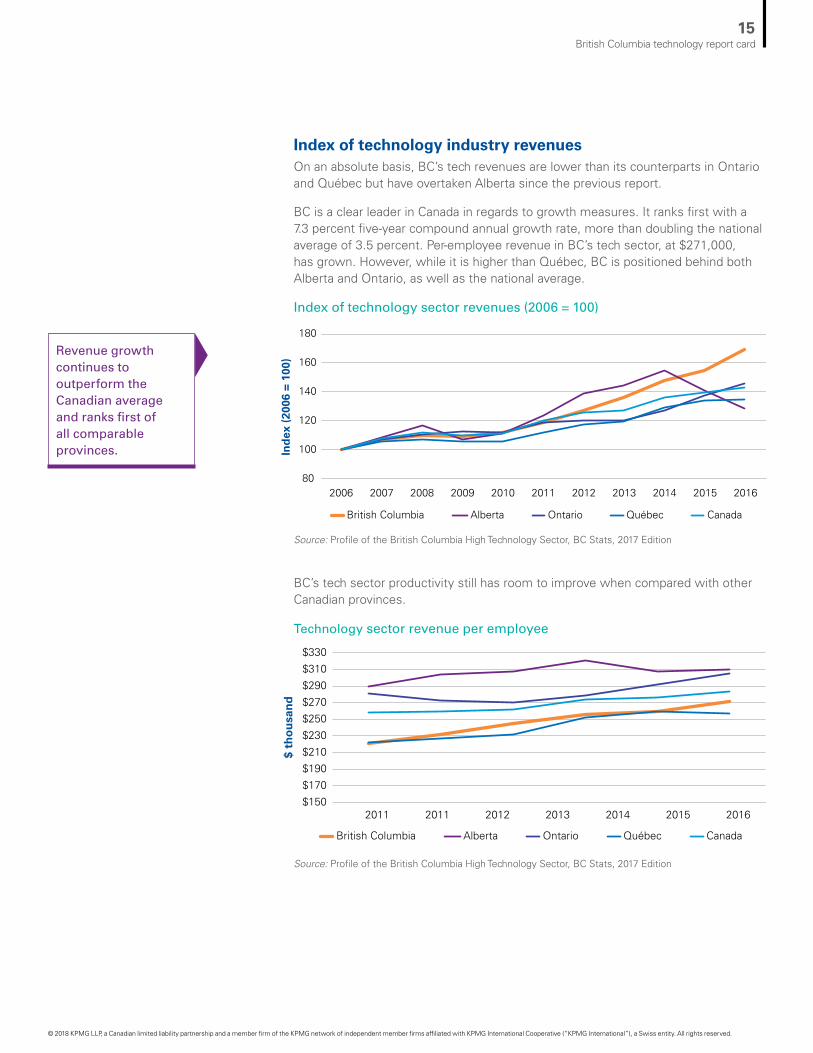
Index of technology industry revenuesOn an absolute basis, BC’s tech revenues are lower than its counterparts in Ontario and Québec but have overtaken Alberta since the previous report.
BC is a clear leader in Canada in regards to growth measures. It ranks first with a 7.3 percent five-year compound annual growth rate, more than doubling the national average of 3.5 percent. Per-employee revenue in BC’s tech sector, at $271,000, has grown. However, while it is higher than Québec, BC is positioned behind both Alberta and Ontario, as well as the national average.
Technology sector revenue per employee
BC’s tech sector productivity still has room to improve when compared with other Canadian provinces.
Source: Profile of the British Columbia High Technology Sector, BC Stats, 2017 Edition
Source: Profile of the British Columbia High Technology Sector, BC Stats, 2017 Edition
Revenue growth continues to outperform the Canadian average and ranks first of all comparable provinces.
80
100
120
140
160
180
2006 2007 2008 2009 2010 2011 2012 2013 2014 2015 2016
Ind
ex (
2006
= 1
00)
British Columbia Alberta Ontario Québec Canada
$150
$170
$190
$210
$230
$250
$270
$290
$310
$330
2011 2011 2012 2013 2014 2015 2016
British Columbia Alberta Ontario Québec Canada
$ th
ou
san
d
15British Columbia technology report card
© 2018 KPMG LLP, a Canadian limited liability partnership and a member firm of the KPMG network of independent member firms affiliated with KPMG International Cooperative (“KPMG International”), a Swiss entity. All rights reserved.

Despite the BC technology sector’s strong growth, its revenues still lag behind major tech centers in the US. This highlights both the magnitude of the US economy versus BC’s and the potential for continued growth and expansion.
Within the US, California jumps out as the clear leader in the tech space with over $758B in revenues from their enviable tech sector versus $26B for BC, $62B for Québec, and $108B for Ontario. In fact, California’s tech sector revenue is more than double that of all of Canada’s tech sector combined.*
Source: Profile of the British Columbia High Technology Sector, BC Stats, 2017 Edition
When compared with other major North American
technology sectors, BC’s technology
sector has substantial room to grow.
Gross domestic productThe technology sector is responsible for 7 percent of the BC industrial economy. Its GDP grew 13.7 percent over the last two years. The sector continues to be one of the most significant contributors to the provincial GDP at $17.2B in 2016.
While the BC tech sector is healthy and has exhibited positive growth, it has some ways to go before matching other provinces and US states.†
0 100,000 300,000200,000 400,000 500,000 600,000 700,000 800,000
California
Saskatchewan
Revenues ($ million)
ManitobaBritish Columbia
AlbertaMinnesota
MissouriQuébecArizona
MichiganIndiana
OhioColoradoMaryland
OntarioIllinois
GeorgiaNorth CarolinaPennsylvania
VirginiaFlorida
MassachusettsNew JerseyWashington
New YorkCanada
Texas
Technology sector revenues 2015
*† Source: Profile of the British Columbia High Technology Sector, BC Stats, 2017 Edition
16British Columbia technology report card
© 2018 KPMG LLP, a Canadian limited liability partnership and a member firm of the KPMG network of independent member firms affiliated with KPMG International Cooperative (“KPMG International”), a Swiss entity. All rights reserved.

This report highlights the current value GDP and the chained 2007 GDP value. Where available, we present chained dollar amounts to allow for comparisons across sectors and provinces as this format is used more widely by BC Statistics and Statistics Canada.
BC technology GDP, chained 2007 versus current
Comparison of GDP
Versus other
BC sectors
Versus other provincial
tech sectors
Versus Ontario
Technology GDP ì è î
Technology GDP growth (2 year)
è ì ì
Summary ì ì N/A
MetricBC technology
SectorBC industrial
aggregate
Current
2016 GDP $17.2B $243.9B
5-Year CAGR 5.9% 4.0%
Chained 2007
2016 GDP $14.6B $218.8B
5-Year CAGR 3.4% 3.0%
Source: Profile of the British Columbia High Technology Sector, BC Stats, 2017 Edition
17British Columbia technology report card
© 2018 KPMG LLP, a Canadian limited liability partnership and a member firm of the KPMG network of independent member firms affiliated with KPMG International Cooperative (“KPMG International”), a Swiss entity. All rights reserved.

Going deeperSimilar to our previous report’s findings, BC’s technology sector continues to be one of the top five contributors to the provincial economy. It outperforms traditional BC sectors such as forestry, mining, and oil & gas.
Index of GDP contribution (2010 = 100)
Source: Profile of the British Columbia High Technology Sector, BC Stats, 2017 Edition
BC Technology BC Industry Aggregate
80
100
120
140
160
2010 2011 2012 2013 2014 2015 2016
Ind
ex (
2010
= 1
00)
GDP growth by sector
Sector2016 Chained
GDP ($ million)5 year CAGR
Finance & insurance, real estate 52,771 3.9%
Construction 18,763 4.6%
Manufacturing 15,980 3.1%
Technology 14,566 3.4%
Retail trade 13,933 4.4%
Professional, scientific & technical services 13,043 4.8%
Transportation & warehousing 12,713 4.4%
Mining, oil and gas extraction 10,703 –0.8%
Wholesale trade 9,594 4.5%
Utilities 3,754 0.8%
Forestry 1,893 1.1%
CAGR = compound annual growth rate
Source: Profile of the British Columbia High Technology Sector, BC Stats, 2017 Edition
18British Columbia technology report card
© 2018 KPMG LLP, a Canadian limited liability partnership and a member firm of the KPMG network of independent member firms affiliated with KPMG International Cooperative (“KPMG International”), a Swiss entity. All rights reserved.

Alberta’s technology sector remains the most aligned to BC’s both in size and composition (services versus manufacturing). Since our last report card, the composition of BC’s technology sector has remained consistent while Alberta has experienced a slight uptick in services. In contrast, Ontario and Québec’s tech sectors are much larger and have a greater focus on manufacturing.
Utilities/transport/construction/wholesale/mining – goods producingOthers – services producingTechnology
Source: Profile of the British Columbia High Technology Sector, BC Stats, 2017 Edition
Source: Profile of the British Columbia High Technology Sector, BC Stats, 2017 Edition
Industry GDP growth 2001–2016
Technology GDP contribution and share of services and manufacturing sectors 2016
Construction
Professional, scientific andtechnology services
Technology
Retail trade
Finance & insurance, real estate
Wholesale trade
Transportation and warehousing
Manufacturing
Utilities
Forestry
Mining, oil and gas extraction
0% 10% 20% 30% 40% 50% 60% 70% 80% 90% 100%
British Columbia Alberta Ontario Québec
$ m
illio
n (
chai
ned
200
7)
Manufacturing Services
0
5,000
10,000
15,000
20,000
25,000
30,000
35,000
40,000
45,000
50,000
89% 96%
78%
69%
19British Columbia technology report card
© 2018 KPMG LLP, a Canadian limited liability partnership and a member firm of the KPMG network of independent member firms affiliated with KPMG International Cooperative (“KPMG International”), a Swiss entity. All rights reserved.

BC’s tech sector GDP has surpassed that of Alberta’s since the previous report but still ranks behind Ontario and Québec. Promisingly, its growth rate is consistently among the highest in the country, indicating BC is on track to matching leading tech provinces.
The GDP of BC’s tech sector is growing faster than Canada’s with a five-year compound annual growth rate of 5.9 percent. As of 2016, BC has overtaken Canada’s overall tech sector in terms of tech GDP as a percentage of total GDP. However, the BC tech sector still lags in comparison to the US, both in terms of growth rate and percent of the economy.
Technology sector GDP and GDP growth between 2006, 2011, 2016
Technology GDP CAGR and as percent of total GDP
Source: Profile of the British Columbia High Technology Sector, BC Stats, 2017 Edition
CAGR = compound annual growth rate
Source: Profile of the British Columbia High Technology Sector, BC Stats, 2017 Edition
GD
P (
$ m
illio
n)
2006 GDP 2011 GDP 2016 GDP
11.7%14.5%
5.3%
4.8%
18.2% -4.8%
5.9%
6.7%
0
5,000
10,000
15,000
20,000
25,000
30,000
35,000
40,000
45,000
50,000
55,000
British Columbia Alberta Québec Ontario
0.0%
2.0%
4.0%
6.0%
8.0%
10.0%
12.0%
CAGR in Tech GDP (2011-2016) Tech GDP as % of Total in 2016
British Columbia Canada United States
5.9%7.0%
3.3%
6.7%
10.2%10.8%
20British Columbia technology report card
© 2018 KPMG LLP, a Canadian limited liability partnership and a member firm of the KPMG network of independent member firms affiliated with KPMG International Cooperative (“KPMG International”), a Swiss entity. All rights reserved.
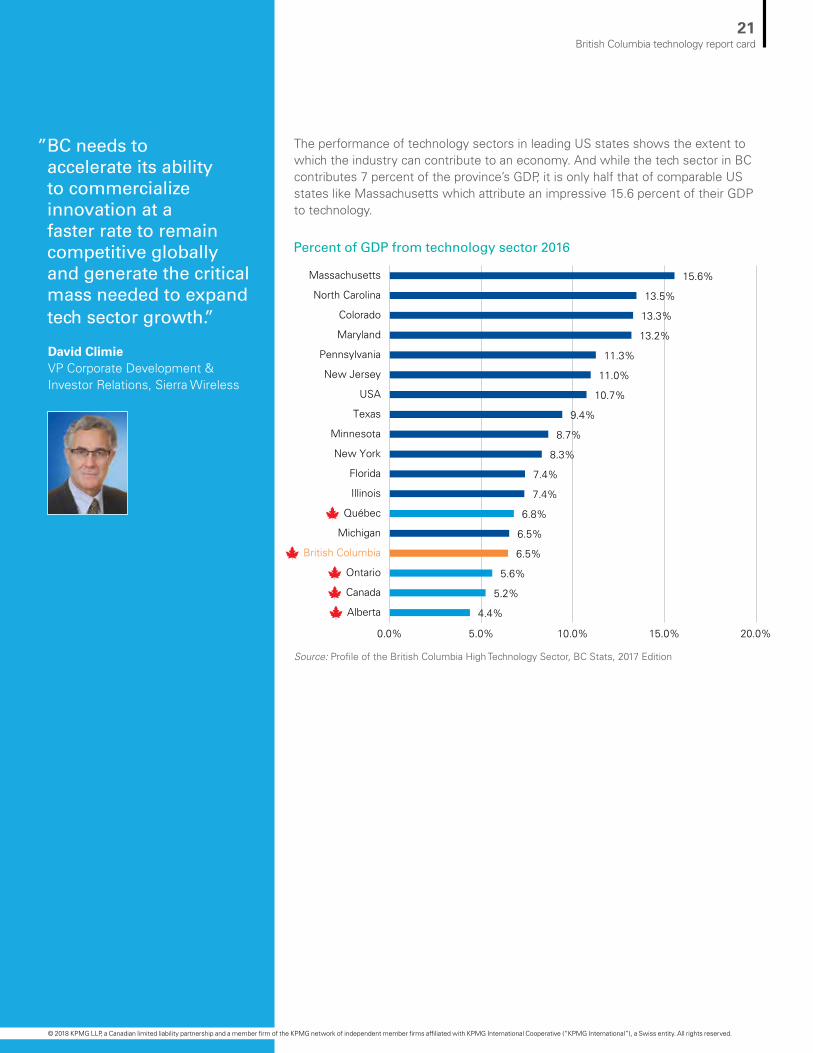
The performance of technology sectors in leading US states shows the extent to which the industry can contribute to an economy. And while the tech sector in BC contributes 7 percent of the province’s GDP, it is only half that of comparable US states like Massachusetts which attribute an impressive 15.6 percent of their GDP to technology.
Source: Profile of the British Columbia High Technology Sector, BC Stats, 2017 Edition
Percent of GDP from technology sector 2016
0.0% 5.0% 10.0% 15.0% 20.0%
4.4%
5.2%
5.6%
6.5%
6.5%
6.8%
7.4%
7.4%
8.3%
8.7%
9.4%
10.7%
11.0%
11.3%
13.2%
13.3%
13.5%
15.6%
Alberta
Canada
Ontario
British Columbia
Michigan
Québec
Illinois
Florida
New York
Minnesota
Texas
USA
New Jersey
Pennsylvania
Maryland
Colorado
North Carolina
Massachusetts
” BC needs to accelerate its ability to commercialize innovation at a faster rate to remain competitive globally and generate the critical mass needed to expand tech sector growth.”
David Climie VP Corporate Development & Investor Relations, Sierra Wireless
21British Columbia technology report card
© 2018 KPMG LLP, a Canadian limited liability partnership and a member firm of the KPMG network of independent member firms affiliated with KPMG International Cooperative (“KPMG International”), a Swiss entity. All rights reserved.

22British Columbia technology report card
© 2018 KPMG LLP, a Canadian limited liability partnership and a member firm of the KPMG network of independent member firms affiliated with KPMG International Cooperative (“KPMG International”), a Swiss entity. All rights reserved.
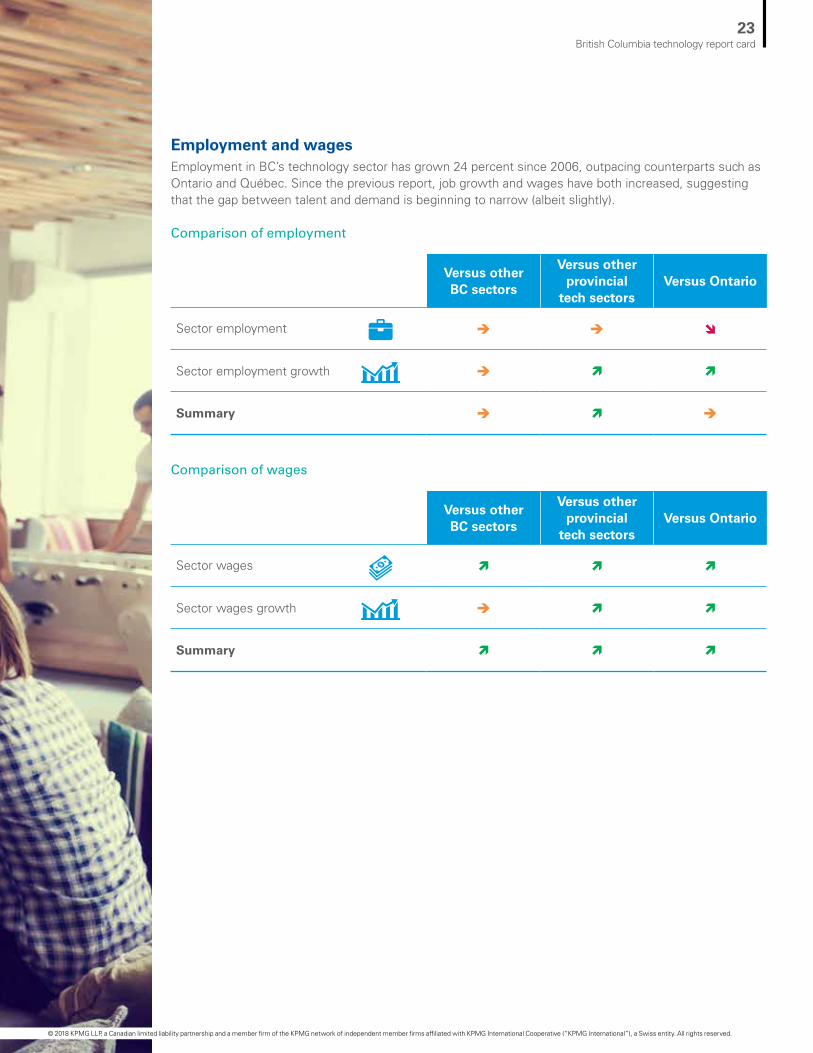
Employment and wagesEmployment in BC’s technology sector has grown 24 percent since 2006, outpacing counterparts such as Ontario and Québec. Since the previous report, job growth and wages have both increased, suggesting that the gap between talent and demand is beginning to narrow (albeit slightly).
Comparison of employment
Comparison of wages
Versus other BC sectors
Versus other provincial
tech sectorsVersus Ontario
Sector employment è è î
Sector employment growth è ì ì
Summary è ì è
Versus other BC sectors
Versus other provincial
tech sectorsVersus Ontario
Sector wages ì ì ì
Sector wages growth è ì ì
Summary ì ì ì
23British Columbia technology report card
© 2018 KPMG LLP, a Canadian limited liability partnership and a member firm of the KPMG network of independent member firms affiliated with KPMG International Cooperative (“KPMG International”), a Swiss entity. All rights reserved.
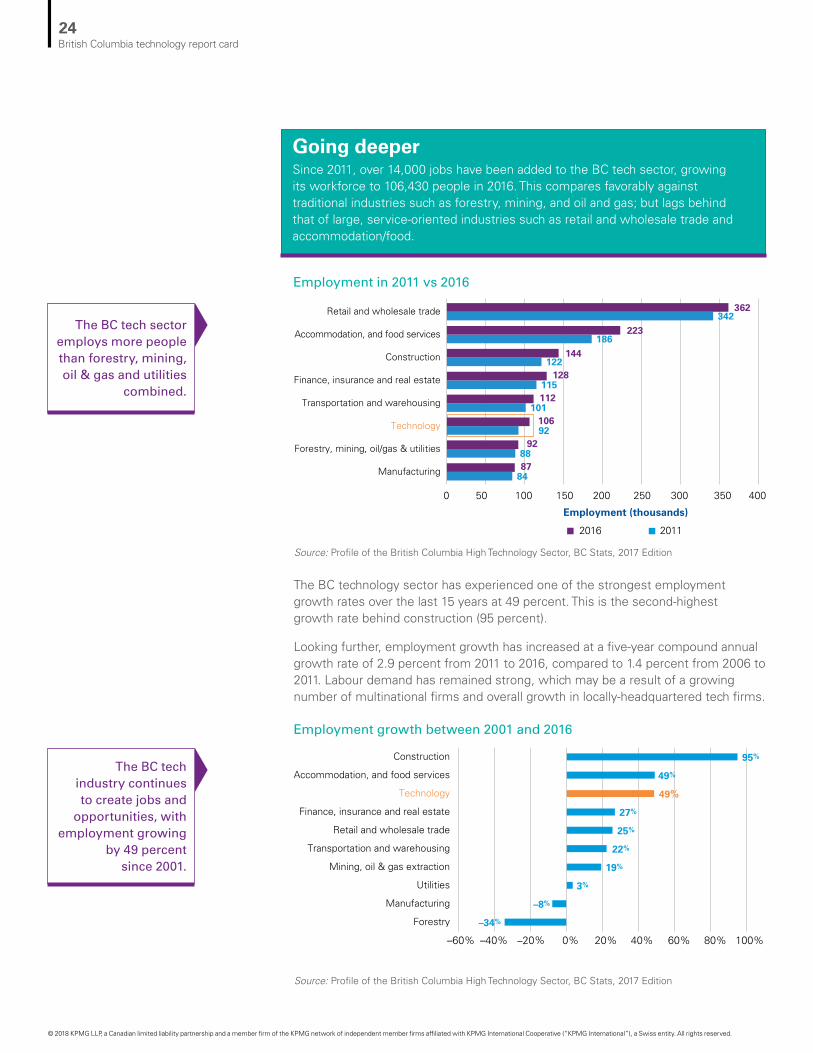
Going deeperSince 2011, over 14,000 jobs have been added to the BC tech sector, growing its workforce to 106,430 people in 2016. This compares favorably against traditional industries such as forestry, mining, and oil and gas; but lags behind that of large, service-oriented industries such as retail and wholesale trade and accommodation/food.
The BC technology sector has experienced one of the strongest employment growth rates over the last 15 years at 49 percent. This is the second-highest growth rate behind construction (95 percent).
Looking further, employment growth has increased at a five-year compound annual growth rate of 2.9 percent from 2011 to 2016, compared to 1.4 percent from 2006 to 2011. Labour demand has remained strong, which may be a result of a growing number of multinational firms and overall growth in locally-headquartered tech firms.
Employment in 2011 vs 2016
Employment growth between 2001 and 2016
Source: Profile of the British Columbia High Technology Sector, BC Stats, 2017 Edition
Source: Profile of the British Columbia High Technology Sector, BC Stats, 2017 Edition
The BC tech sector employs more people than forestry, mining, oil & gas and utilities
combined.
The BC tech industry continues to create jobs and
opportunities, with employment growing
by 49 percent since 2001.
Employment (thousands)
2016 2011
84
88
92
101
115
122
186
342
87
92
106
112
128
144
223
362
0 100 15050 200 250 300 350 400
Manufacturing
Forestry, mining, oil/gas & utilities
Technology
Transportation and warehousing
Finance, insurance and real estate
Construction
Accommodation, and food services
Retail and wholesale trade
–34%
–8%
3%
19%
22%
25%
27%
49%
49%
95%
–60% –40% –20% 0% 20% 40% 60% 80% 100%
Forestry
Manufacturing
Utilities
Mining, oil & gas extraction
Transportation and warehousing
Retail and wholesale trade
Finance, insurance and real estate
Technology
Accommodation, and food services
Construction
24British Columbia technology report card
© 2018 KPMG LLP, a Canadian limited liability partnership and a member firm of the KPMG network of independent member firms affiliated with KPMG International Cooperative (“KPMG International”), a Swiss entity. All rights reserved.

At 2,237 jobs per 100,000 people, BC’s technology sector employment per capita has increased by 9 percent since 2011. And while BC, Ontario, and Québec’s tech sectors have also managed to maintain a positive growth rate in 2016, Alberta’s industry growth rate has declined.
Source: Profile of the British Columbia High Technology Sector, BC Stats, 2017 Edition
Source: Profile of the British Columbia High Technology Sector, BC Stats, 2017 Edition
Technology jobs per 100,000 population
Technology industry GDP per person employed
BC tech employment per capita has been fairly steady since 2009.
BC’s tech sector is more productive than that of Ontario, Québec and Canada overall.
The productivity performance in BC’s technology sector decreased slightly in 2016 but remains higher than Ontario and Québec, as well as Canada overall.
British Columbia Alberta Ontario Québec Canada
2006 2007 2008 2009 2010 2011 2012 2013 2014 2015 2016
0
500
1,000
1,500
2,000
2,500
3,000
3,500
$100,000
$110,000
$120,000
$130,000
$140,000
$150,000
$160,000
$170,000
$180,000
British Columbia Alberta Ontario Québec Canada
2006 2007 2008 2009 2010 2011 2012 2013 2014 2015 2016
25British Columbia technology report card
© 2018 KPMG LLP, a Canadian limited liability partnership and a member firm of the KPMG network of independent member firms affiliated with KPMG International Cooperative (“KPMG International”), a Swiss entity. All rights reserved.

Sector wages
Technology jobs in BC pay significantly more than the BC industrial average. In 2016, the wage premium grew to a commanding 83.7 percent compared to 56.8 percent in 2006. BC tech sector’s weekly wages rose at a ten-year compound annual growth rate (CAGR) of 3.8 percent, higher than that of the BC industrial average.
The weekly wage in the BC technology sector has grown at over twice the pace of the Canadian average over the last three years. It is higher than Ontario and Québec’s weekly wages, and its upwards trajectory positions the BC tech sector to overtake Alberta in the near future.
Average yearly earnings – BC technology versus BC
Real weekly wages (in 2016 prices)
Source: Profile of the British Columbia High Technology Sector, BC Stats, 2017 Edition
Source: Profile of the British Columbia High Technology Sector, BC Stats, 2017 Edition
Jobs in the BC tech sector pay
83.7 percent more than the provincial
average.
Employees in the BC tech sector enjoy higher weekly wages
than both Ontario and Québec.
BC technology BC all industries
83.7%
CAGR: 3.8%
CAGR 2.2%
$0
$10,000
$20,000
$30,000
$40,000
$50,000
$60,000
$70,000
$80,000
$90,000
2006 2007 2008 2009 2010 2011 2012 2013 2014 2015 2016
56.8%
$0
$300
$600
$900
$1,200
$1,500
$1,800
$2,100
British Columbia Alberta Ontario Québec Canada
2006 2007 2008 2009 2010 2011 2012 2013 2014 2015 2016
26British Columbia technology report card
© 2018 KPMG LLP, a Canadian limited liability partnership and a member firm of the KPMG network of independent member firms affiliated with KPMG International Cooperative (“KPMG International”), a Swiss entity. All rights reserved.

Insights on availability of skilled personnel
Job growth has increased since the last report yet remains outpaced by the growth of wages. Assuming the demand for jobs has remained robust based on the continued growth of the sector, supply and demand would point to insufficient supply as a reason wages are increasing while the number of jobs has not grown at the same rate. This indicates that talent remains one of BC tech sector’s top issues.
Source: Profile of the British Columbia High Technology Sector, BC Stats, 2017 Edition CAGR = compound annual growth rate
Index of jobs and weekly earnings (2006 = 100) BC technology average weekly wages
BC technology employment
Technology employment Technology weekly earnings
90
100
110
120
130
140
150
2006 2007 2008 2009 2010 2011 2012 2013 2014 2015 2016
$0 $200 $400 $600 $800
$1,000 $1,200 $1,400 $1,600 $1,800
2006 2007 2008 2009 2010 2011 2012 2013 2014 2015 2016
0
20,000
40,000
60,000
80,000
100,000
120,000
2006 2007 2008 2009 2010 2011 2012 2013 2014 2015 2016
CAGR 2.9%
CAGR 4.8%
CAGR 1.4%CAGR 2.9%
Ind
ex (
2006
= 1
00)
” There needs to be a more conscious agenda around fostering experienced and executive talent in order to sustain growth in mid-size companies. More broadly, a multi-pronged and segmented approach is necessary to address the challenges faced by companies in different growth phases. This will allow BC’s tech sector to allocate its resources in a way that makes the most difference.”
Laurie Schultz CEO, ACL
27British Columbia technology report card
© 2018 KPMG LLP, a Canadian limited liability partnership and a member firm of the KPMG network of independent member firms affiliated with KPMG International Cooperative (“KPMG International”), a Swiss entity. All rights reserved.
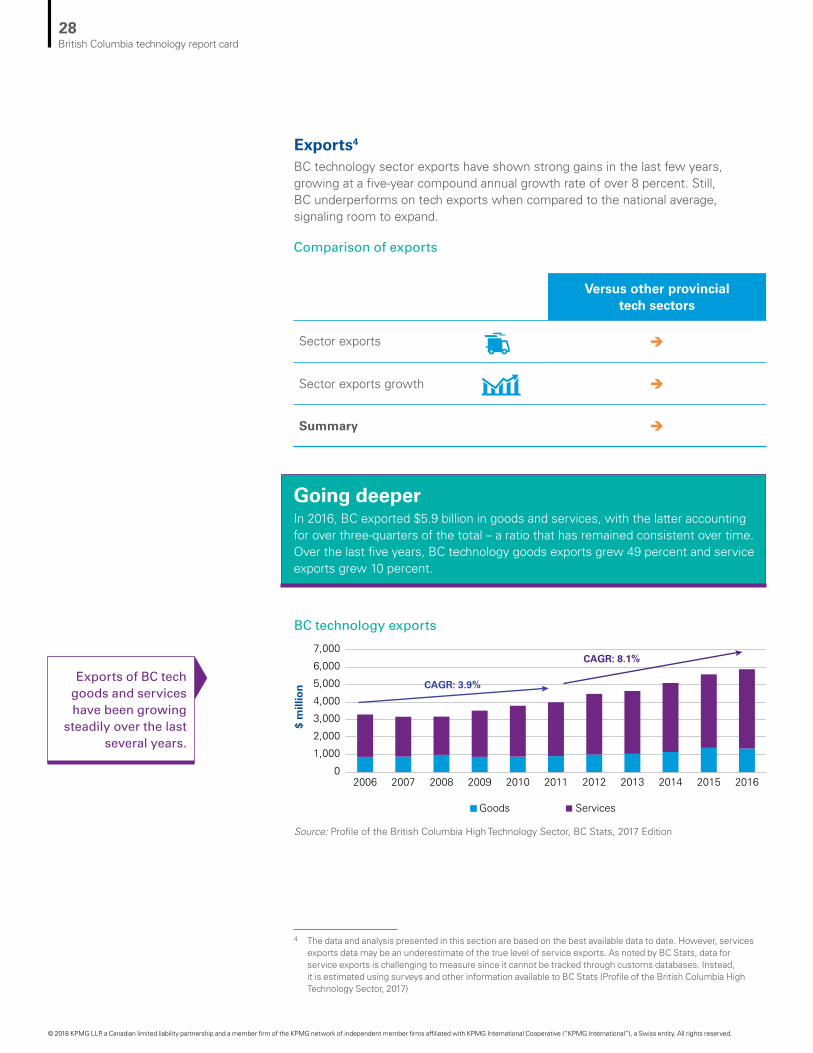
Exports4
BC technology sector exports have shown strong gains in the last few years, growing at a five-year compound annual growth rate of over 8 percent. Still, BC underperforms on tech exports when compared to the national average, signaling room to expand.
Going deeperIn 2016, BC exported $5.9 billion in goods and services, with the latter accounting for over three-quarters of the total – a ratio that has remained consistent over time. Over the last five years, BC technology goods exports grew 49 percent and service exports grew 10 percent.
4 The data and analysis presented in this section are based on the best available data to date. However, services exports data may be an underestimate of the true level of service exports. As noted by BC Stats, data for service exports is challenging to measure since it cannot be tracked through customs databases. Instead, it is estimated using surveys and other information available to BC Stats (Profile of the British Columbia High Technology Sector, 2017)
Comparison of exports
BC technology exports
Source: Profile of the British Columbia High Technology Sector, BC Stats, 2017 Edition
Exports of BC tech goods and services have been growing
steadily over the last several years.
Versus other provincial tech sectors
Sector exports è
Sector exports growth è
Summary è
0
1,000
2,000
3,000
4,000
5,000
6,000
7,000
2006 2007 2008 2009 2010 2011 2012 2013 2014 2015 2016
$ m
illio
n
Goods Services
CAGR: 3.9%
CAGR: 8.1%
28British Columbia technology report card
© 2018 KPMG LLP, a Canadian limited liability partnership and a member firm of the KPMG network of independent member firms affiliated with KPMG International Cooperative (“KPMG International”), a Swiss entity. All rights reserved.

Despite the province’s export growth, the technology sector accounts for only 6 percent of BC’s total exports. As such, there is significant potential for growth in technology exports within the province.
Source: Profile of the British Columbia High Technology Sector, BC Stats, 2017 Edition
Source: Profile of the British Columbia High Technology Sector, BC Stats, 2017 Edition
Computers and telecommunications make up the largest share of tech exports in BC, followed by aerospace, life sciences, and computer integrated manufacturing products. Tech goods exports decreased from 2015-2016 due to decreases in biotechnology, aerospace, and computers and telecommunications exports.
Comparison of export measures in BC and Canada
Technology goods export by commodity group
BC Canada
Tech goods exports $1.3B $29.2B
Tech services exports $4.5B $24.0B
Tech sector exports as % of total exports 5.8% 8.4%
Tech sector goods as % of goods exports 2.3% 5.6%
Tech sector services as % of services exports 10.4% 22.1%
0
200
400
600
800
1,000
1,400
1,200
Biotechnology Material design, weapons & nuclear
Electronics Computer integrated manufacturing
Life sciences Aerospace
Computers and telecommunications
20162015201420132012
$ m
illio
n
29British Columbia technology report card
© 2018 KPMG LLP, a Canadian limited liability partnership and a member firm of the KPMG network of independent member firms affiliated with KPMG International Cooperative (“KPMG International”), a Swiss entity. All rights reserved.
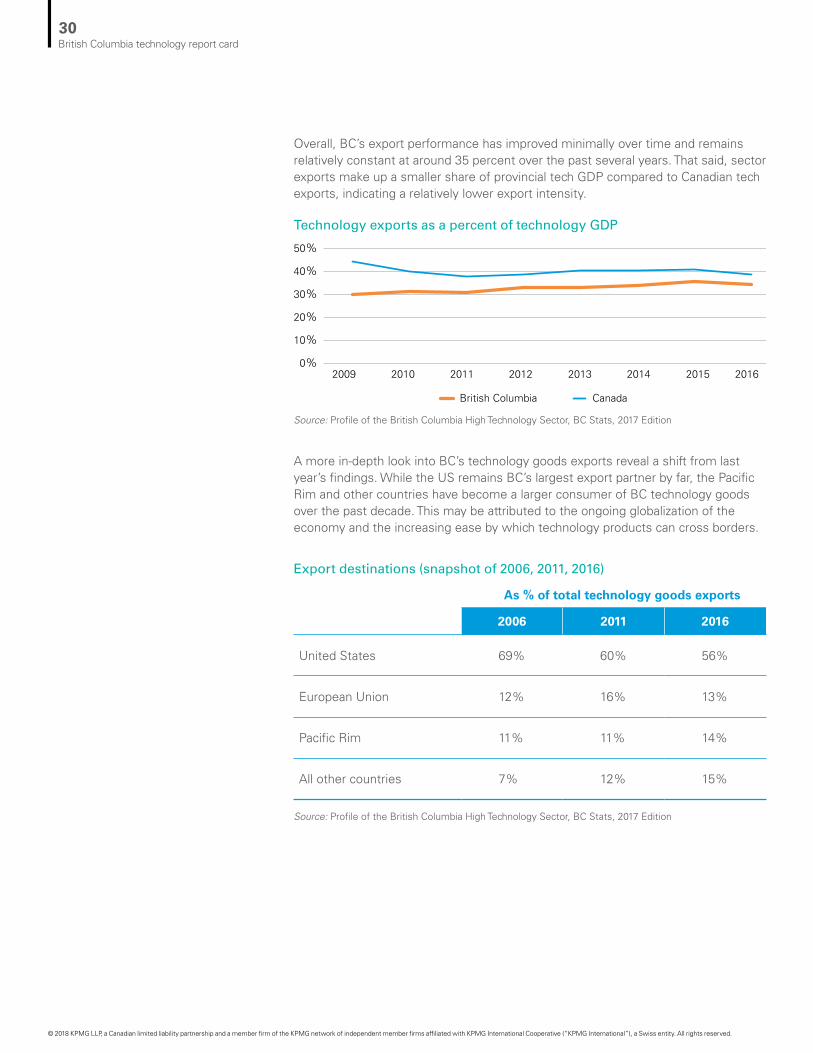
Overall, BC’s export performance has improved minimally over time and remains relatively constant at around 35 percent over the past several years. That said, sector exports make up a smaller share of provincial tech GDP compared to Canadian tech exports, indicating a relatively lower export intensity.
A more in-depth look into BC’s technology goods exports reveal a shift from last year’s findings. While the US remains BC’s largest export partner by far, the Pacific Rim and other countries have become a larger consumer of BC technology goods over the past decade. This may be attributed to the ongoing globalization of the economy and the increasing ease by which technology products can cross borders.
Technology exports as a percent of technology GDP
Source: Profile of the British Columbia High Technology Sector, BC Stats, 2017 Edition
Source: Profile of the British Columbia High Technology Sector, BC Stats, 2017 Edition
Export destinations (snapshot of 2006, 2011, 2016)
British Columbia Canada
0%
10%
20%
30%
40%
50%
2009 2010 2011 2012 2013 2014 2015 2016
As % of total technology goods exports
2006 2011 2016
United States 69% 60% 56%
European Union 12% 16% 13%
Pacific Rim 11% 11% 14%
All other countries 7% 12% 15%
30British Columbia technology report card
© 2018 KPMG LLP, a Canadian limited liability partnership and a member firm of the KPMG network of independent member firms affiliated with KPMG International Cooperative (“KPMG International”), a Swiss entity. All rights reserved.

BC continues to be a significant net importer of technology goods, with the value of imports being nearly five times that of exports. 35 percent of imports come from the United States and over 40 percent from the Pacific Rim.
Insights on exports and market access
Of the over 10,000 technology companies in BC, nearly 90 percent have fewer than 20 employees. This is likely limiting their capacity to expand into global markets. As the sector matures, we expect that an increasing number of BC firms will begin resembling the global sales patterns of large established firms. As export activity builds, we expect to see a continued diversification of markets beyond the US and Europe.
Source: Profile of the British Columbia High Technology Sector, BC Stats, 2017 Edition
BC technology goods exports and imports
Economic performance indicators – summaryConsistent with the findings of the 2016 Report Card, the BC technology sector continues to be one of the strongest and among the fastest growing sectors in the province. The BC tech sector has continued to narrow the gap between other jurisdictions. To gain more perspective on these results, the following section analyzes sector input indicators of the BC technology sector.
$ m
illio
n
Goods exports Goods imports
0
2,000
4,000
6,000
8,000
2006 2007 2008 2009 2010 2011 2012 2013 20162014 2015
” There is further opportunity for the BC tech industry to unite as one voice under the BC Tech Association in order to further educate the government on growth opportunities and challenges facing the sector, and to foster a more sustainable, collaborative ecosystem.”
Don Safnuk Founder, President, CEO, Corporate Recruiters
31British Columbia technology report card
© 2018 KPMG LLP, a Canadian limited liability partnership and a member firm of the KPMG network of independent member firms affiliated with KPMG International Cooperative (“KPMG International”), a Swiss entity. All rights reserved.

Although the BC technology sector continues to perform well relative to other provinces, growth in each of the input indicators has slowed since the previous report. In the global context, BC still lags behind the tech sectors of the countries in the Organization for Economic Co-operation and Development (OECD), particularly in the areas of talent and research and development (R&D).
Part B: Sector input indicators
A closer examination of BC’s technology sector inputs offers a glimpse into key issues and highlights areas where appropriate and targeted investment may serve to enable the sector’s future performance.
BC technology sector – 2018 report card
BC trails other jurisdictions in the number of degrees granted per capita and in the proportion of people that choose to attain technical degrees. It also remains below the OECD average in granting technical doctoral degrees. Furthermore, investments in R&D remain flat despite robust growth in the sector and the maturation of firms.
Highlights
Versus other provincial tech sectors
Sector input indicators
Talent availability: tech grad focus è
Access to capital è
Research & development è
Intellectual property è
Grade B–
32British Columbia technology report card
© 2018 KPMG LLP, a Canadian limited liability partnership and a member firm of the KPMG network of independent member firms affiliated with KPMG International Cooperative (“KPMG International”), a Swiss entity. All rights reserved.
Talent availabilityTalent is a critical resource for the technology sector. From IT to engineering, and software development to life sciences, the success of each tech sub-sector pivots on its ability to recruit from skill-specific talent pools to meet evolving demands, fuel growth, and pursue innovation.
Currently, BC technology firms source talent locally from new grads of BC tech programs, bring in talent through inter-provincial or international immigration, or retrain existing BC residents. Fostering the province’s recently-expanded Provincial Nominee Program (PNP) pilot program has also helped tech and innovation companies gain access to international talent by reducing the requirement to a one-year full-time job offer to be eligible for permanent residency.
Compared to other provinces, BC graduates the third highest number of students from technical programs. On a per capita basis, that graduation rate is lower than larger provinces such as Ontario, Québec, and Alberta. Furthermore, BC lags behind other OECD countries in terms of technical doctoral degrees granted per capita.
Talent availability: tech grad focus
Versus other provincial
tech sectors
Versus Ontario
Undergraduate degrees è î
Undergraduate technology degrees è î
Graduate technology degrees î î
Summary è N/A
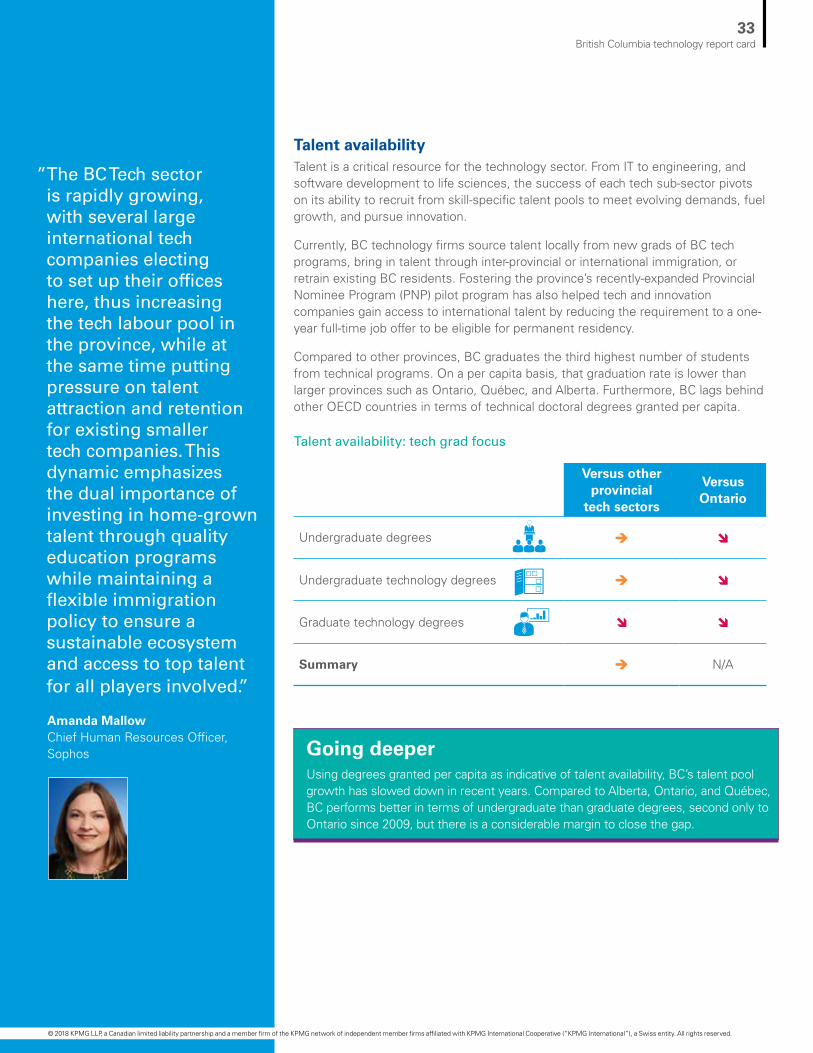
” The BC Tech sector is rapidly growing, with several large international tech companies electing to set up their offices here, thus increasing the tech labour pool in the province, while at the same time putting pressure on talent attraction and retention for existing smaller tech companies. This dynamic emphasizes the dual importance of investing in home-grown talent through quality education programs while maintaining a flexible immigration policy to ensure a sustainable ecosystem and access to top talent for all players involved.”
Amanda Mallow Chief Human Resources Officer, Sophos Going deeper
Using degrees granted per capita as indicative of talent availability, BC’s talent pool growth has slowed down in recent years. Compared to Alberta, Ontario, and Québec, BC performs better in terms of undergraduate than graduate degrees, second only to Ontario since 2009, but there is a considerable margin to close the gap.
33British Columbia technology report card
© 2018 KPMG LLP, a Canadian limited liability partnership and a member firm of the KPMG network of independent member firms affiliated with KPMG International Cooperative (“KPMG International”), a Swiss entity. All rights reserved.
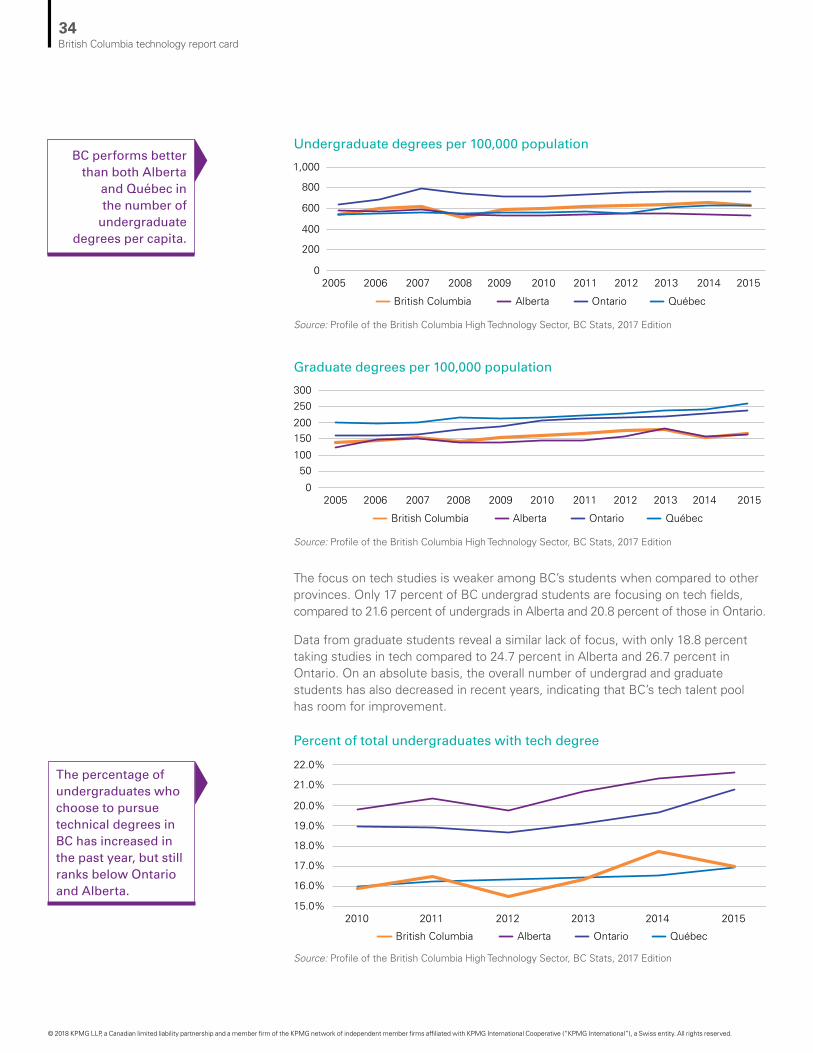
The focus on tech studies is weaker among BC’s students when compared to other provinces. Only 17 percent of BC undergrad students are focusing on tech fields, compared to 21.6 percent of undergrads in Alberta and 20.8 percent of those in Ontario.
Data from graduate students reveal a similar lack of focus, with only 18.8 percent taking studies in tech compared to 24.7 percent in Alberta and 26.7 percent in Ontario. On an absolute basis, the overall number of undergrad and graduate students has also decreased in recent years, indicating that BC’s tech talent pool has room for improvement.
Graduate degrees per 100,000 population
Source: Profile of the British Columbia High Technology Sector, BC Stats, 2017 Edition
Source: Profile of the British Columbia High Technology Sector, BC Stats, 2017 Edition
BC performs better than both Alberta
and Québec in the number of
undergraduate degrees per capita.
Percent of total undergraduates with tech degree
The percentage of undergraduates who choose to pursue technical degrees in BC has increased in the past year, but still ranks below Ontario and Alberta.
2005 2006 2007 2008 2009 2010 2011 2012 2013 201520140
150200
Québec OntarioAlbertaBritish Columbia
10050
300250
2010 2011 2012 2013 2014 201515.0%
18.0%
17.0%
16.0%
20.0%
21.0%
22.0%
19.0%
Québec OntarioAlbertaBritish Columbia
Undergraduate degrees per 100,000 population
Source: Profile of the British Columbia High Technology Sector, BC Stats, 2017 Edition
2005 2006 2007 2008 2009 2010 2011 2012 2013 201520140
600
800
400
200
1,000
Québec OntarioAlbertaBritish Columbia
34British Columbia technology report card
© 2018 KPMG LLP, a Canadian limited liability partnership and a member firm of the KPMG network of independent member firms affiliated with KPMG International Cooperative (“KPMG International”), a Swiss entity. All rights reserved.

In comparison to other provinces, BC has one of the lowest percentages of master’s graduates with technical degrees.
Source: Profile of the British Columbia High Technology Sector, BC Stats, 2017 Edition
Percent of total graduates with tech degree
2010 2011 2012 2013 2014 201515.0%
30.0%
25.0%
20.0%
35.0%
Québec OntarioAlbertaBritish Columbia
3,5733,858 3,768 4,119
4,6384,317
-
500
1,000
1,500
2,000
2,500
3,000
3,500
4,000
4,500
5,000
2010 2011 2012 2013 2014 2015
Math, Computer and Information Science Architecture and Engineering
Physical and Life Sciences
Source: Profile of the British Columbia High Technology Sector, BC Stats, 2017 Edition
Number of tech degrees awarded at the undergraduate level in BC
Number of tech degrees awarded at the graduate level in BC
Source: Profile of the British Columbia High Technology Sector, BC Stats, 2017 Edition
Math, Computer and Information Science Architecture and Engineering
Physical and Life Sciences
1,230 1,296
1,470 1,431
1,251 1,260
-
200
400
600
800
1,000
1,200
1,400
1,600
2010 2011 2012 2013 2014 2015
35British Columbia technology report card
© 2018 KPMG LLP, a Canadian limited liability partnership and a member firm of the KPMG network of independent member firms affiliated with KPMG International Cooperative (“KPMG International”), a Swiss entity. All rights reserved.
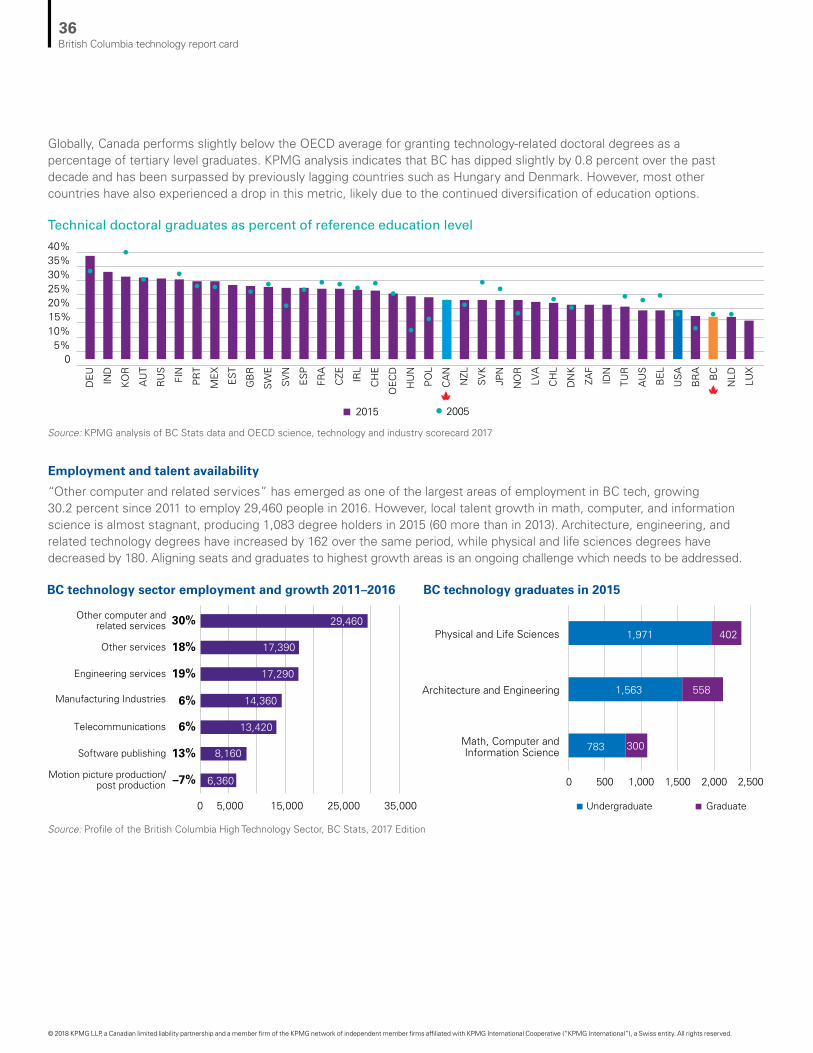
Globally, Canada performs slightly below the OECD average for granting technology-related doctoral degrees as a percentage of tertiary level graduates. KPMG analysis indicates that BC has dipped slightly by 0.8 percent over the past decade and has been surpassed by previously lagging countries such as Hungary and Denmark. However, most other countries have also experienced a drop in this metric, likely due to the continued diversification of education options.
Employment and talent availability
“Other computer and related services” has emerged as one of the largest areas of employment in BC tech, growing 30.2 percent since 2011 to employ 29,460 people in 2016. However, local talent growth in math, computer, and information science is almost stagnant, producing 1,083 degree holders in 2015 (60 more than in 2013). Architecture, engineering, and related technology degrees have increased by 162 over the same period, while physical and life sciences degrees have decreased by 180. Aligning seats and graduates to highest growth areas is an ongoing challenge which needs to be addressed.
Technical doctoral graduates as percent of reference education level
BC technology sector employment and growth 2011–2016
0 500 1,000 1,500 2,000 2,500
BC technology graduates in 2015
783
1,563
1,971
300
558
402
Math, Computer andInformation Science
Architecture and Engineering
Physical and Life Sciences
Undergraduate Graduate
6,360
8,160
13,420
14,360
17,290
17,390
29,460
5,0000 15,000 25,000 35,000
Motion picture production/post production
Software publishing
Telecommunications
Manufacturing Industries
Engineering services
Other services
Other computer andrelated services
–7%
13%
6%
6%
19%
18%
30%
Source: KPMG analysis of BC Stats data and OECD science, technology and industry scorecard 2017
Source: Profile of the British Columbia High Technology Sector, BC Stats, 2017 Edition
05%
10%15%20%25%30%35%40%
DE
U
IND
KO
R
AU
T
RU
S
FIN
PR
T
ME
X
ES
T
GB
R
SW
E
SV
N
ES
P
FRA
CZE IR
L
CH
E
OEC
D
HU
N
PO
L
CA
N
NZL
2015 2005
SV
K
JPN
NO
R
LVA
CH
L
DN
K
ZAF
IDN
TUR
AU
S
BEL
US
A
BR
A
BC
NLD
LUX
36British Columbia technology report card
© 2018 KPMG LLP, a Canadian limited liability partnership and a member firm of the KPMG network of independent member firms affiliated with KPMG International Cooperative (“KPMG International”), a Swiss entity. All rights reserved.
Insights on talent availability
Accessing the right talent is not a unique challenge for BC’s tech employers, yet it is one that stands to become more pronounced as competition for skilled talent intensifies. Certainly, BC has what today’s tech professionals want – growing opportunities, a highly-skilled network, family amenities, and a leading quality of life – but several factors stand in the way between making the connection to BC employers.
For one, leading companies indicate there is significant competition for talent among US firms. What’s more, the growth of the tech industry is outpacing the rate at which provincial schools and training organizations can provide new blood. Granted, BC’s education sector is well respected, but some employers cite disconnects between post-secondary programs and the real world skills in demand; as well as a need to embed tech-related skills earlier (e.g., incorporating in the K-12 curriculum critical thinking, user design, collaboration and problem solving as well as computational languages).
There are also barriers to using foreign talent to bridge domestic
gaps. In our consultations for this report, organizations sighted a high tax environment and a somewhat challenging immigration process as factors behind losing talent to other provinces/states. Moreover, even though hotspots like Toronto and Vancouver can be alluring talent destinations, it can be difficult for recruits to find (and afford) a place to set their roots.
With the number of tech companies within BC on the rise, the pressure on the local talent pool will only intensify – especially for smaller firms who will have to compete against their larger counterparts for attention. Herein, talent supply is a multi-pronged approach; one that many in the field believe can be met with more investments in education, talent clusters and incubators, more flexible immigration programs, and home-grown talent development programs via education and training, investments in education, and support for overcoming cost of living roadblocks. With a united approach, BC can replenish its talent pools and become an even more attractive place for tech-related professionals to ply their talents.
” There is the potential for a vibrant tech ecosystem in BC if we can empower the trinity of industry, academia, and government to work together better. The industry needs to be more open with its ideas and accepting of non-linear returns, academia needs to be more ambitious with their brilliant minds and push to bring their research to the world, and the government needs to facilitate innovation by providing incentives and enabling industry to lead where appropriate. If the nexus of these three can be strengthened, BC will foster a strong tech ecosystem.”
Ohad Arazi Chief Strategy Officer and Vice President, TELUS Health
37British Columbia technology report card
© 2018 KPMG LLP, a Canadian limited liability partnership and a member firm of the KPMG network of independent member firms affiliated with KPMG International Cooperative (“KPMG International”), a Swiss entity. All rights reserved.

Access to capitalWhile the last few years have seen improved capital access for BC both in terms of angel and venture capital funding, 2017 marked a decrease in that funding. However, the average deal size has increased. The presence of VC funding is essential to ensuring companies are able to continuously grow their business in the BC market.
5 Sources for access to capital data have changed. Data may vary from previous editions of the BC Technology Report Card.
Access to capital5
Capital by stage of investment
Source: BC Tech Association
Versus other provincial tech sectors
VC funding î
Average VC deal size ì
Summary è
While angel and VC funding remained at a similar level for 2015 and 2016, it decreased by 44 percent from 2016 to 2017. This decrease is mostly due to the lower level of VC funding, which was $343M in 2017.
$ m
illio
n
-
100
200
300
400
500
600
700
800
900
1,000
30
367
2013
73
787
2014
118
582
2015
47
630
2016
45
343
2017
Angel Investments Venture Capital Investments
38British Columbia technology report card
© 2018 KPMG LLP, a Canadian limited liability partnership and a member firm of the KPMG network of independent member firms affiliated with KPMG International Cooperative (“KPMG International”), a Swiss entity. All rights reserved.
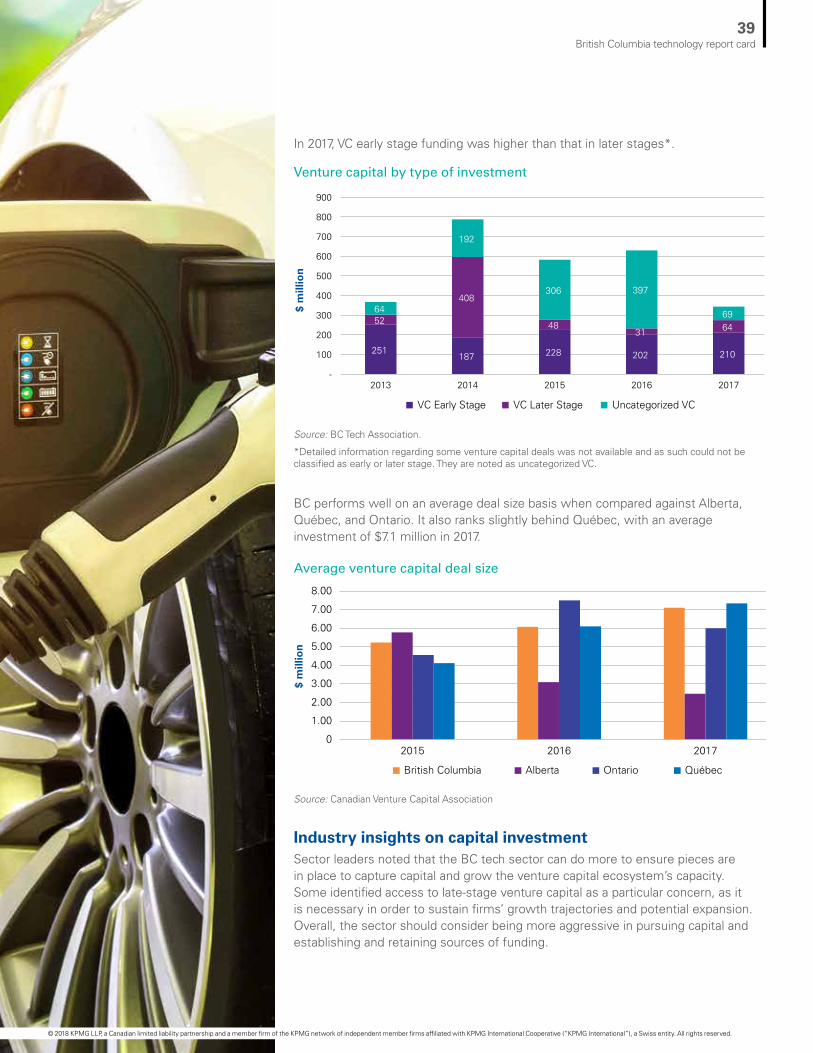
Industry insights on capital investmentSector leaders noted that the BC tech sector can do more to ensure pieces are in place to capture capital and grow the venture capital ecosystem’s capacity. Some identified access to late-stage venture capital as a particular concern, as it is necessary in order to sustain firms’ growth trajectories and potential expansion. Overall, the sector should consider being more aggressive in pursuing capital and establishing and retaining sources of funding.
In 2017, VC early stage funding was higher than that in later stages*.
BC performs well on an average deal size basis when compared against Alberta, Québec, and Ontario. It also ranks slightly behind Québec, with an average investment of $7.1 million in 2017.
Venture capital by type of investment
Average venture capital deal size
Source: Canadian Venture Capital Association
Source: BC Tech Association.
*Detailed information regarding some venture capital deals was not available and as such could not be classified as early or later stage. They are noted as uncategorized VC.
-
100
200
300
400
500
600
700
800
900
251
52 64
2013
187
408
192
2014
228
48
306
2015
202
31
397
2016
210
64 69
2017
VC Early Stage VC Later Stage Uncategorized VC
$ m
illio
n$
mill
ion
British Columbia Alberta Québec Ontario
2015 2016 20170
1.00
2.00
3.00
4.00
5.00
6.00
7.00
8.00
39British Columbia technology report card
© 2018 KPMG LLP, a Canadian limited liability partnership and a member firm of the KPMG network of independent member firms affiliated with KPMG International Cooperative (“KPMG International”), a Swiss entity. All rights reserved.

Research and developmentR&D expenditure is the long-term investment that supports the sector’s future economic performance. Since 2008, R&D expenditure in BC has remained stagnant at around $3 billion per year. As such, BC ranks lower than Ontario and Québec when comparing R&D as a share of GDP.
BC is not alone in this trend; the average Canadian R&D spend has also remained flat over the last five years. The mixed sources of R&D expenditures (business, higher education/non-profit, government) in BC has also remained relatively constant, with just over half originating from business enterprises, followed by higher education and private non-profit.
Going deeperSince 2008, total R&D expenditures in BC have hovered around $3 billion yearly with roughly the same composition of contributors. Since the previous report, business enterprise contribution to R&D has increased to 53.3 percent in 2014. Over the same period, the higher education and private non-profit share declined slightly to 42.8 percent. Federal government contribution and provincial government & research institutions contribution have remained stable at around 3 percent and 1 percent, respectively.
Research and development
Versus other provincial tech sectors
R&D as a percentage of GDP î
BERD as a percentage of GDP è
Summary è
” One of the BC tech sector’s key strengths is its flourishing and highly collaborative ecosystem, where individual players support and are invested in each other’s success. This is a powerful way for tech companies both large and small to learn from each other and innovate at a faster pace.”
Kirsten Sutton VP & Managing Director, SAP Labs Canada
40British Columbia technology report card
© 2018 KPMG LLP, a Canadian limited liability partnership and a member firm of the KPMG network of independent member firms affiliated with KPMG International Cooperative (“KPMG International”), a Swiss entity. All rights reserved.
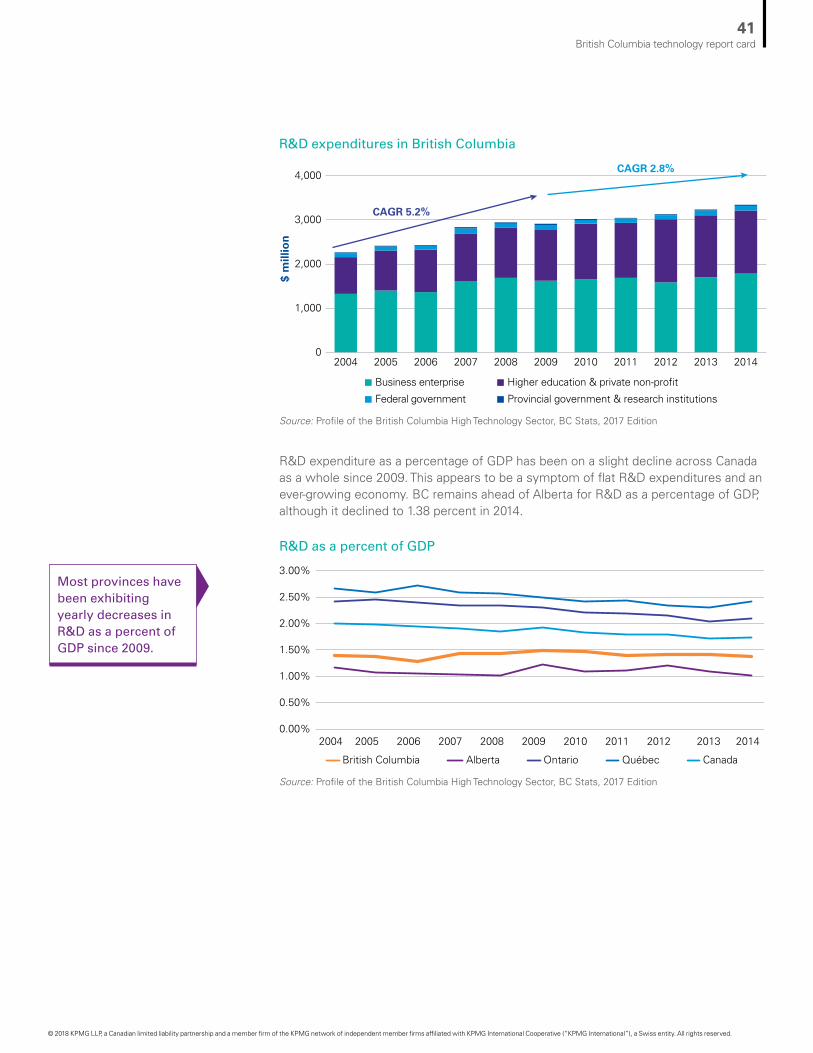
R&D expenditure as a percentage of GDP has been on a slight decline across Canada as a whole since 2009. This appears to be a symptom of flat R&D expenditures and an ever-growing economy. BC remains ahead of Alberta for R&D as a percentage of GDP, although it declined to 1.38 percent in 2014.
R&D expenditures in British Columbia
R&D as a percent of GDP
Source: Profile of the British Columbia High Technology Sector, BC Stats, 2017 Edition
Source: Profile of the British Columbia High Technology Sector, BC Stats, 2017 Edition
Most provinces have been exhibiting yearly decreases in R&D as a percent of GDP since 2009.
CAGR 5.2%
CAGR 2.8%
$ m
illio
n
Business enterprise Higher education & private non-profit
Federal government Provincial government & research institutions
0
1,000
2,000
3,000
4,000
2004 2005 2006 2007 2008 2009 2010 2011 2012 20142013
2004 2005 2006 2007 2008 2009 2010 2011 2012 201420130.00%
0.50%
1.00%
1.50%
2.00%
2.50%
3.00%
British Columbia Alberta Ontario Québec Canada
41British Columbia technology report card
© 2018 KPMG LLP, a Canadian limited liability partnership and a member firm of the KPMG network of independent member firms affiliated with KPMG International Cooperative (“KPMG International”), a Swiss entity. All rights reserved.

Top 2017 high tech R&D spenders in Canada by firm location
R&D expenditure as a percent of GDP
Source: Profile of the British Columbia High Technology Sector, BC Stats, 2017 Edition and OECD science, technology and industry scorecard 2015
Source: Adapted from Canada’s Top 100 Corporate R&D Spenders, Canada’s Innovation Leaders, 2017
As depicted above, a lack of large firms in BC reduces the level of R&D spend in BC relative to Ontario and Québec.
R&D expenditure
While BC has improved slightly, it continues to lag in R&D investment in comparison to OECD countries.
1st Bombardier Inc. 1,969
2nd Valeant Pharmaceuticals
International Inc. 558
3rd BCE Inc. 519
4th Pratt & Whitney
Canada Corp. 511
Québec14th
TELUS Corporation 184
20th MDA 126
22nd Sierra Wireless Inc. 98
26th Arbutus Biopharma
Corporation 81
34th Microsemi Storage
Solutions 54
British Columbia
5th Rogers Communications Inc. 481
Ontario
R&D spend($MM)
R&D spend($MM)
R&D spend($MM)
2015 2005
0.00% 0.50% 1.00% 1.50% 2.00% 2.50% 3.00% 3.50% 4.00% 4.50%
ISR
KO
RC
HE
JPN
SW
EA
UT
DN
KD
EU
FIN
US
AB
ELO
ECD
FRA
SV
NIS
LA
US
CH
NN
LDE
U28
CZE
NO
RC
AN
GB
RIR
LE
ST
BC
HU
NIT
ALU
XN
ZLP
RT
ES
PS
VK
RU
SP
OL
GR
CTU
RZA
FLV
AM
EX
CH
L
42British Columbia technology report card
© 2018 KPMG LLP, a Canadian limited liability partnership and a member firm of the KPMG network of independent member firms affiliated with KPMG International Cooperative (“KPMG International”), a Swiss entity. All rights reserved.

BC continues to trail other provinces when it comes to Business Expenditure on R&D (BERD) -- particularly when compared to Ontario, Québec, and Canada overall. From 2013 to 2014, BC’s BERD stayed constant at 0.7 percent of BC GDP.
Business expenditure on R&D as a percentage of GDP
Canada performed at near half of the OECD average on business expenditure on R&D as a percentage of GDP. The same can be said of BC, which trails directly behind the Canadian average.
Business expenditure on R&D as a percent of GDP
Business expenditure on R&D as a percent of GDP
Source: Profile of the British Columbia High Technology Sector, BC Stats, 2017 Edition
Source: Profile of the British Columbia High Technology Sector, BC Stats, 2017 Edition
2004 2005 2006 2007 2008 2009 2010 2011 2012 201420130.00%
0.20%
0.40%
0.60%
0.80%
1.00%
1.20%
1.40%
1.60%
1.80%
British Columbia Alberta Ontario Québec Canada
2015 2005
0.00%
0.50%
1.00%
1.50%
2.00%
2.50%
3.00%
3.50%
4.00%
ISR
KO
RJP
NC
HE
SW
EA
UT
DE
UU
SA
FIN
DN
KB
ELS
VN
OEC
DC
HN
FRA
ISL
EU
28A
US
GB
RN
LD IRL
CZE
NO
RH
UN
CA
NB
CIT
AE
ST
LUX
RU
SE
SP
NZL
PR
TP
OL
TUR
ZAF
SV
KG
RC
ME
XLV
AC
HL
43British Columbia technology report card
© 2018 KPMG LLP, a Canadian limited liability partnership and a member firm of the KPMG network of independent member firms affiliated with KPMG International Cooperative (“KPMG International”), a Swiss entity. All rights reserved.
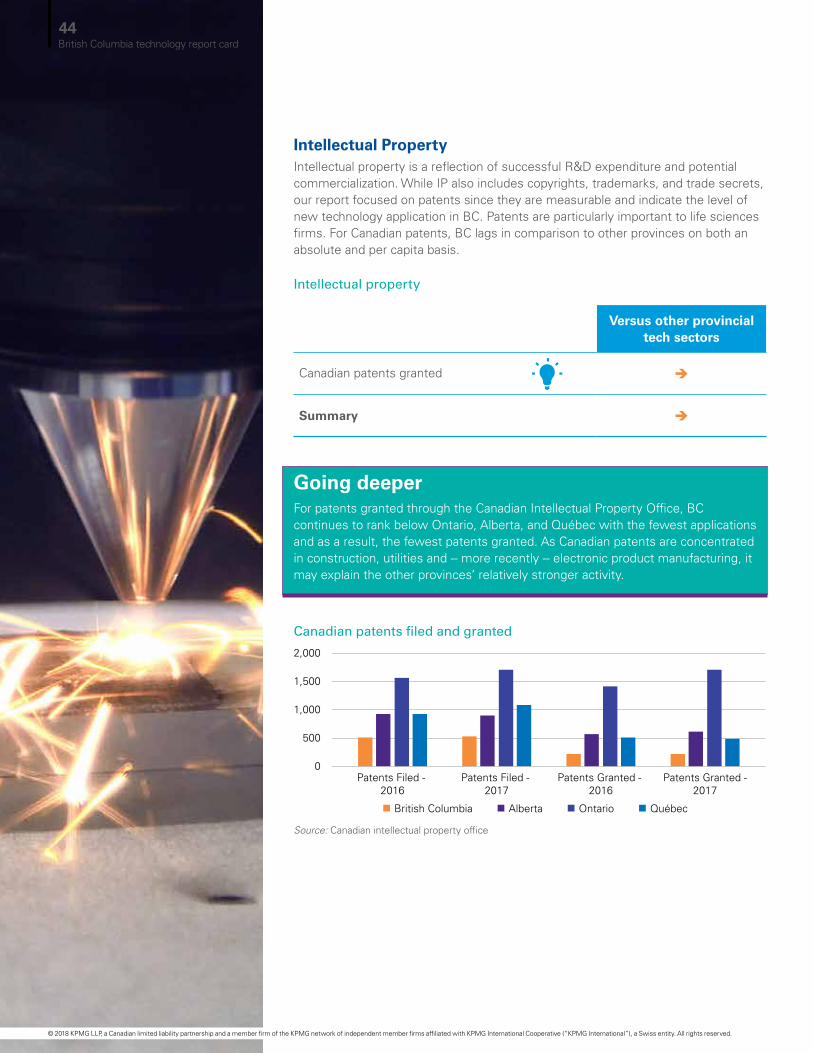
Intellectual PropertyIntellectual property is a reflection of successful R&D expenditure and potential commercialization. While IP also includes copyrights, trademarks, and trade secrets, our report focused on patents since they are measurable and indicate the level of new technology application in BC. Patents are particularly important to life sciences firms. For Canadian patents, BC lags in comparison to other provinces on both an absolute and per capita basis.
Going deeperFor patents granted through the Canadian Intellectual Property Office, BC continues to rank below Ontario, Alberta, and Québec with the fewest applications and as a result, the fewest patents granted. As Canadian patents are concentrated in construction, utilities and -- more recently -- electronic product manufacturing, it may explain the other provinces’ relatively stronger activity.
Intellectual property
Versus other provincial tech sectors
Canadian patents granted è
Summary è
Canadian patents filed and granted
Source: Canadian intellectual property office
QuébecBritish Columbia OntarioAlberta
0
500
1,000
1,500
2,000
Patents Filed - 2016
Patents Filed - 2017
Patents Granted - 2016
Patents Granted - 2017
44British Columbia technology report card
© 2018 KPMG LLP, a Canadian limited liability partnership and a member firm of the KPMG network of independent member firms affiliated with KPMG International Cooperative (“KPMG International”), a Swiss entity. All rights reserved.
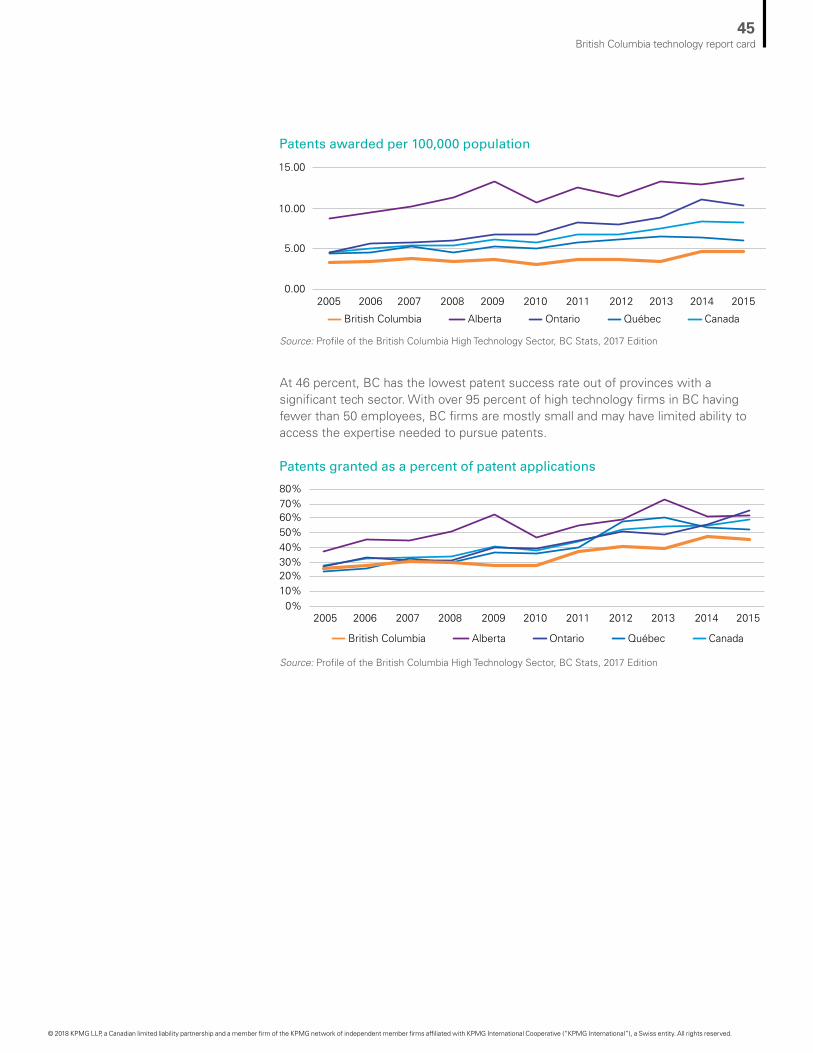
Patents awarded per 100,000 population
Patents granted as a percent of patent applications
Source: Profile of the British Columbia High Technology Sector, BC Stats, 2017 Edition
Source: Profile of the British Columbia High Technology Sector, BC Stats, 2017 Edition
At 46 percent, BC has the lowest patent success rate out of provinces with a significant tech sector. With over 95 percent of high technology firms in BC having fewer than 50 employees, BC firms are mostly small and may have limited ability to access the expertise needed to pursue patents.
2005 2006 2007 2008 2009 2010 2011 2012 2013 201520140.00
5.00
10.00
15.00
British Columbia Alberta Ontario Québec Canada
2005 2006 2007 2008 2009 2010 2011 2012 2013 201520140%
10%20%
80%70%60%50%40%30%
British Columbia Alberta Ontario Québec Canada
45British Columbia technology report card
© 2018 KPMG LLP, a Canadian limited liability partnership and a member firm of the KPMG network of independent member firms affiliated with KPMG International Cooperative (“KPMG International”), a Swiss entity. All rights reserved.

The forecast for BC’s tech sector is bright. Innovation is thriving, global leaders are emerging, and the statistics point to a community that’s ready and eager to embrace the next phase of its growth.
ConclusionRecent years have also seen the sector close the gap between comparable tech sectors in Ontario and Québec when it comes to industry revenues, GDP, and employment rates; and its ongoing growth put BC’s tech sector on a path to eclipse Canada’s national average in regards to productivity performance.
Nevertheless, sector challenges and shortcomings remain. For as much progress as BC’s tech sector has made (and continues to make), it also has ground to gain when it comes to fostering its talent, investing in R&D, and delivering more scaled up anchor companies.
The overall picture painted by the economic indicators suggests that our tech sector is promising. To maintain and accelerate this growth, continued support for critical ecosystem elements is required.
Acknowledgements
KPMG would like to gratefully acknowledge the support of BC Stats in the development of this report. Our detailed statistical analysis would not have been possible without its rich collection of data for the BC technology sector.
46British Columbia technology report card
© 2018 KPMG LLP, a Canadian limited liability partnership and a member firm of the KPMG network of independent member firms affiliated with KPMG International Cooperative (“KPMG International”), a Swiss entity. All rights reserved.

© 2018 KPMG LLP, a Canadian limited liability partnership and a member firm of the KPMG network of independent member firms affiliated with KPMG International Cooperative (“KPMG International”), a Swiss entity. All rights reserved.

kpmg.ca
The information contained herein is of a general nature and is not intended to address the circumstances of any particular individual or entity. Although we endeavor to provide accurate and timely information, there can be no guarantee that such information is accurate as of the date it is received or that it will continue to be accurate in the future. No one should act on such information without appropriate professional advice after a thorough examination of the particular situation.
© 2018 KPMG LLP, a Canadian limited liability partnership and a member firm of the KPMG network of independent member firms affiliated with KPMG International Cooperative (“KPMG International”), a Swiss entity. All rights reserved. 20595
The KPMG name and logo are registered trademarks or trademarks of KPMG International.
Contact usJameel AhamedPartner, Consulting and BC Lead Digital Transformation and Innovation KPMG 604-691-3501 [email protected]
Kostya PolyakovPartner and Greater Vancouver Area Industry Leader for Technology, Media and Telecommunications KPMG 604-691-3579 [email protected]