Office Building for Sale or Lease - 137 South Bristol Street, Sun Prairie, WI
Upload
nguyendieuCategory
view
217download
0
Real Estate for a changing world
R E S E A R C H
Take-up
Total supply
Prime yield
Investment volume
q38% on 2014
q41% on Dec 14 p131% on 2014
q35 bps on Dec 2014
783,199 sq ft
947,000 sq ft
4.95%
£385m
The Bristol office market underwent a year of consolidation during 2015 where the lack of product, particularly Grade A office buildings significantly impacted on the final take-up numbers for the year.
Take-up in 2015 in Bristol totalled 783,199 sq ft, well short of the 1.26m sq ft transacted just 12 months earlier and down 7% on the 5-year average (2011-15). This contraction can be put down to a shortage of good quality supply, particularly for larger floor plates, rather than demand or economic fundamentals in the city.
Law firm, TLT Solicitors, secured the largest city-centre letting of 2015, when they signed up for an extra 27,135 sq ft at No.1 Redcliff Street, where they already occupied 60,000 sq ft.
In the last month EDF also signed its lease on 78,000 sq ft at Bridgewater House, Finzels Reach, taking the building to full occupancy and kick-starting the speculative development of the adjacent Aurora scheme (95,000 sq ft).
Out-of-town the largest deal was seen at Vertex Park, Emersons Green, where ALD Automotive signed a pre-let for 36,188 sq ft. The building is due for completion in November of this year.
The Bristol market has seen a sharp contraction in its office supply over the last few years, as Permitted Development has seen much of the city’s secondary and tertiary stock undergo a change of use towards higher value uses, such as residential and student housing.
The knock-on effect has seen an increase in rents, particularly for secondary space. On average Bristol offices saw rental value growth, according to MSCI, of 7.1% for 2015. This was the best rental growth performance of any of the ‘Big Six’ regional cities.
These rental increases have also impacted upon take-up numbers as occupiers have been put off by the new rental tone and have postponed potential office moves in favour of staying put.
Moving forward, there is still demand, particularly from public sector departments, and BNP Paribas forecast that head count within office-based employment in Bristol will grow by 12% to 2020.
.
ONE Investment volumes reach £385m
Investment volumes were up 131% year-on-year, with a new record yield set for the cycle (4.94% NIY).
TWO Rents increased 7% on average
Driven by a loss of stock of secondary and tertiary offices, average rents increased by 7%.
THREE Media Tech drove demand
The Media Tech sector accounted for c.25% of all take-up in Bristol, outshining the Professional Services sector. Key deals included The Zone, Funky Pigeon and Endemol all taking space.
The Headlines
BRISTOL OFFICESMARCH 2016
At a Glance
Leasing
The Stats... At a Glance
Source for all charts BNP Paribas Real Estate//Property Data
www.realestate.bnpparibas.com3
BRISTOL OFFICE MARKET - MARCH 2016
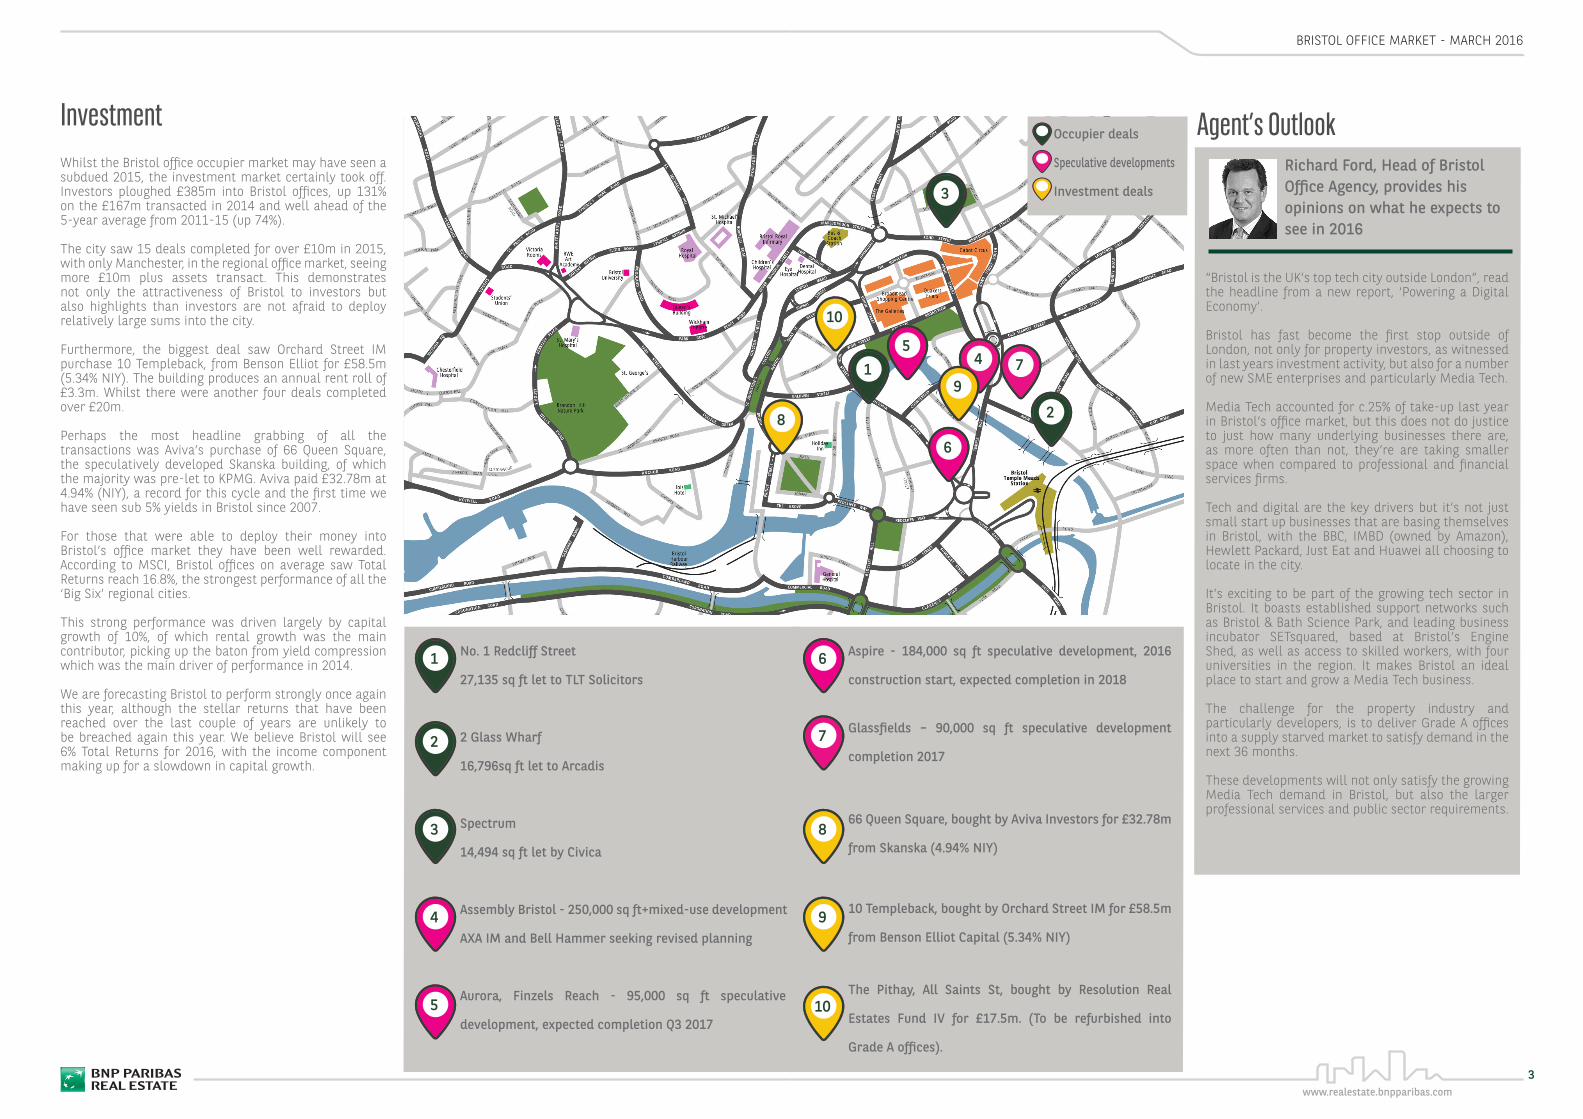
InvestmentWhilst the Bristol office occupier market may have seen a subdued 2015, the investment market certainly took off. Investors ploughed £385m into Bristol offices, up 131% on the £167m transacted in 2014 and well ahead of the 5-year average from 2011-15 (up 74%).
The city saw 15 deals completed for over £10m in 2015, with only Manchester, in the regional office market, seeing more £10m plus assets transact. This demonstrates not only the attractiveness of Bristol to investors but also highlights than investors are not afraid to deploy relatively large sums into the city.
Furthermore, the biggest deal saw Orchard Street IM purchase 10 Templeback, from Benson Elliot for £58.5m (5.34% NIY). The building produces an annual rent roll of £3.3m. Whilst there were another four deals completed over £20m.
Perhaps the most headline grabbing of all the transactions was Aviva’s purchase of 66 Queen Square, the speculatively developed Skanska building, of which the majority was pre-let to KPMG. Aviva paid £32.78m at 4.94% (NIY), a record for this cycle and the first time we have seen sub 5% yields in Bristol since 2007.
For those that were able to deploy their money into Bristol’s office market they have been well rewarded. According to MSCI, Bristol offices on average saw Total Returns reach 16.8%, the strongest performance of all the ‘Big Six’ regional cities.
This strong performance was driven largely by capital growth of 10%, of which rental growth was the main contributor, picking up the baton from yield compression which was the main driver of performance in 2014.
We are forecasting Bristol to perform strongly once again this year, although the stellar returns that have been reached over the last couple of years are unlikely to be breached again this year. We believe Bristol will see 6% Total Returns for 2016, with the income component making up for a slowdown in capital growth.
Agent’s OutlookRichard Ford, Head of Bristol Office Agency, provides his opinions on what he expects to see in 2016
“Bristol is the UK’s top tech city outside London”, read the headline from a new report, ‘Powering a Digital Economy’.
Bristol has fast become the first stop outside of London, not only for property investors, as witnessed in last years investment activity, but also for a number of new SME enterprises and particularly Media Tech.
Media Tech accounted for c.25% of take-up last year in Bristol’s office market, but this does not do justice to just how many underlying businesses there are, as more often than not, they’re are taking smaller space when compared to professional and financial services firms.
Tech and digital are the key drivers but it’s not just small start up businesses that are basing themselves in Bristol, with the BBC, IMBD (owned by Amazon), Hewlett Packard, Just Eat and Huawei all choosing to locate in the city.
It’s exciting to be part of the growing tech sector in Bristol. It boasts established support networks such as Bristol & Bath Science Park, and leading business incubator SETsquared, based at Bristol’s Engine Shed, as well as access to skilled workers, with four universities in the region. It makes Bristol an ideal place to start and grow a Media Tech business.
The challenge for the property industry and particularly developers, is to deliver Grade A offices into a supply starved market to satisfy demand in the next 36 months.
These developments will not only satisfy the growing Media Tech demand in Bristol, but also the larger professional services and public sector requirements.
No. 1 Redcliff Street
27,135 sq ft let to TLT Solicitors
2 Glass Wharf
16,796sq ft let to Arcadis
Spectrum
14,494 sq ft let by Civica
Assembly Bristol - 250,000 sq ft+mixed-use development
AXA IM and Bell Hammer seeking revised planning
Aurora, Finzels Reach - 95,000 sq ft speculative
development, expected completion Q3 2017
Aspire - 184,000 sq ft speculative development, 2016
construction start, expected completion in 2018
Glassfields – 90,000 sq ft speculative development
completion 2017
66 Queen Square, bought by Aviva Investors for £32.78m
from Skanska (4.94% NIY)
10 Templeback, bought by Orchard Street IM for £58.5m
from Benson Elliot Capital (5.34% NIY)
The Pithay, All Saints St, bought by Resolution Real
Estates Fund IV for £17.5m. (To be refurbished into
Grade A offices).
4
2
1
3
6
5
8
9
10
1
2
3
5
6
8
9
10
Occupier deals
Speculative developments
Investment deals
7
7
4

Robert Taylor Associate Director +44 (0)20 7338 4257 [email protected]
Andrea Ferranti Data Analyst +44 (0)20 7338 4155 [email protected]
Richard Ford Head of Bristol Office Agency +44 (0)171 984 8407 [email protected]
Simon Robinson Head of Birmingham & South West +44 (0)121 237 1212 [email protected]
Jeremy Hughes Head of Bristol +44 (0)171 984 8413 [email protected]
CONTACTS Charts
Please click the links below to access our other recent research or visit us at www.realestate.bnpparibas.co.uk/researchuk
BNP Paribas Real Estate Disclaimer clauseBNP Paribas Real Estate cannot be held responsible if, despite its best efforts, the information contained in the present report turns out to be inaccurate or incomplete. This report is released by BNP Paribas Real Estate and the information in it is dedicated to the exclusive use of its clients. The report and the information contained in it may not be copied or reproduced without prior permission from BNP Paribas Real Estate.
Central London Office & Retail Market - Q4 2015
UK Logistics Investment Report 2015 - in association with MSCI
UK Housing Market Prospects - Winter 2015
Fig. 1 Take-up
Fig. 2Take-up by sector in 2015
0
200,000
400,000
600,000
800,000
1,000,000
1,200,000
1,400,000
2009 2010 2011 2012 2013 2014 2015 2016*Ta
ke-u
p (s
q ft
)
Bristol in-town Bristol OOT 5-yr average (2010-'14)
Media Tech (Tech & Creative Industry)
Professional
Property Company, Development &
construction
Public services, Education & Health
Business & Consumer services
Other
Retail & Leisure
Charities & Association
Serviced Offices Insurance & Financial Services
Fig. 3 Supply and vacancy rate
Fig. 4Bristol offices investment volumes
0%
2%
4%
6%
8%
10%
12%
14%
16%
18%
0
500
1,000
1,500
2,000
2,500
2010 2011 2012 2013 2014 2015
Vaca
ncy
rate
Supp
ly 0
00’ (
sq ft
)
Supply Vancancy rate
0
100
200
300
400
500
600
2005 2006 2007 2008 2009 2010 2011 2012 2013 2014 2015£
Mill
ions
RESEARCH
AGENCY
Source: BNP Paribas Real Estate/Property Data