Briefing: Future climate projections allow engineering ...¬ng: Future climate projections allow...
4
Briefing: Future climate projections allow engineering planning John Abraham PhD School of Engineering, University of St. Thomas, St. Paul, MN, USA (corresponding author: [email protected]) Lijing Cheng PhD International Center for Climate and Environmental Sciences, Institute for Atmospheric Physics, Chinese Academy of Sciences, Beijing, China Michael E. Mann PhD Department of Meteorology and Atmospheric Science, Pennsylvania State University, State College, PA, USA It is well established that the climate is changing and much of the change is as a result of human greenhouse gas emissions. Effective strategies for adaptation or mitigation are less agreed on. From an engineering perspective, adaptation strategies require reliable expectations of the climate changes expected over the lifetime of current projects. Such projections are now possible with state-of-the-art observations and computer models that provide information over the next century and beyond. The best estimates suggest that global surface temperatures will increase by approximately 5°C (9°F) over pre-industrial temperatures or approximately 4°C (7°F) over current temperatures by the year 2100. 1. Introduction Extensive analysis originating as far back as the mid-1800s has conclusively shown that greenhouse gas (GHG) constituents within the Earth’ s atmosphere create a warming effect. Superimposed on the natural greenhouse effect is a human supplement which is mainly composed of carbon dioxide from the combustion of fossil fuels but also includes methane, nitrous oxides and other gases. What is of primary interest to engineers is the likelihood of a particular future climate and how it may stress infrastructure in a way different from the climate of today. Among the changes that have been identified by scientists are the rising sea level (Scambos and Abraham, 2015); increased precipitation, which leads to more intense flooding (Abraham et al., 2015); more intense storms, including hurricanes with heavier rainfall and winds (Emanuel, 2013; Kamahori et al., 2006; Kossin et al., 2007; Mann and Emanuel, 2006; Trenberth and Fasullo, 2007, 2008; Trenberth et al., 2007); more intense and common heat waves; changes to subsurfaces including water and soil rigidity; and added latent and sensible energy fuelling more intense storms. Many of these and other changes are already being detected, and trends towards their increase will continue for the foreseeable future. One item not often discussed is the potential for a climatologic tipping point which, if passed, may cause dramatic and rapid changes. For instance, rapid methane release from melting permafrost in the Arctic, a rapid collapse of a major ice sheet and changes to the ocean currents which redistribute heat globally are potential examples. While tipping points should be considered, they are not the topic of the present paper. Here, a brief summary will be given of the major climate projections that are expected into the near-term future (within the current century). The projections to be given will be based on computer models; however, those models are reinforced by other independent means such as the response of the past climate to changes in atmospheric GHGs. 2. Climate projections 2.1 Global mean surface temperature observations Perhaps the most commonly used (although not necessarily most important) climate metric is the global mean surface temperature. This refers to the air temperature near the Earth’ s surface; in marine locations, it involves the sea surface temperature for its determination. Global mean temperatures have been measured for many decades, and advanced tools are used to ensure that contamination of data (for instance, by the growth of cities) does not occur. Multiple data centres create these data records and, despite the differences in methodologies, the agreement is remarkable. Figure 1 shows two data sets extending from 1880 to the present year. The graph shows temperature anomalies (excursions from an average) compared to the 1951–1980 period. It is seen not only by visual inspection but also by multiple statistical analyses that there has been no cessation to warming, despite claims to the contrary in the general media (Cahill et al., 2015; Foster and Abraham, 2015; Karl et al., 2015; Lewandowsky et al., 2016; Trenberth and Fasullo, 2013). Rather, temperatures have risen steadily since the 1970s, with modest interdecadal variations in warming rate that are consistent with internal climate variability (Steinman et al., 2015). 2.2 Comparison of models with measurements One measure of the reliability climate models is their ability to simulate past temperature changes. A comparison of models/ measurements is provided in Figure 2(a). The image shows four different temperature data sets. As with Figure 1, there is excellent agreement between the measurements. The grey region shows the spread of an ensemble average of climate models with a mean provided by the solid black line. When corrections are 54 Forensic Engineering Volume 170 Issue FE2 Briefing: Future climate projections allow engineering planning Abraham, Cheng and Mann ice | proceedings Proceedings of the Institution of Civil Engineers Forensic Engineering 170 May 2017 Issue FE2 Pages 54–57 http://dx.doi.org/10.1680/jfoen.17.00002 Paper 1700002 Received 09/02/2017 Accepted 06/04/2017 Published online 08/05/2017 Keywords: buildings, structures & design/safety & hazards/weather ICE Publishing: All rights reserved Downloaded by [] on [10/07/17]. Copyright © ICE Publishing, all rights reserved.
-
Upload
nguyendung -
Category
Documents
-
view
214 -
download
0
Transcript of Briefing: Future climate projections allow engineering ...¬ng: Future climate projections allow...

Forensic EngineeringVolume 170 Issue FE2
Briefing: Future climate projections allowengineering planningAbraham, Cheng and Mann
ice | proceedings
Proceedings of the Institution of Civil EngineersForensic Engineering 170 May 2017 Issue FE2Pages 54–57 http://dx.doi.org/10.1680/jfoen.17.00002Paper 1700002Received 09/02/2017 Accepted 06/04/2017Published online 08/05/2017Keywords: buildings, structures & design/safety & hazards/weather
ICE Publishing: All rights reserved
Download
Briefing: Future climate projections allowengineering planning
John Abraham PhDSchool of Engineering, University of St. Thomas, St. Paul, MN, USA(corresponding author: [email protected])Lijing Cheng PhDInternational Center for Climate and Environmental Sciences, Institute forAtmospheric Physics, Chinese Academy of Sciences, Beijing, China
54ed by [] on [10/07/17]. Copyright © ICE Publishing, all rights reserved.
Michael E. Mann PhDDepartment of Meteorology and Atmospheric Science, Pennsylvania StateUniversity, State College, PA, USA
It is well established that the climate is changing and much of the change is as a result of human greenhouse gasemissions. Effective strategies for adaptation or mitigation are less agreed on. From an engineering perspective,adaptation strategies require reliable expectations of the climate changes expected over the lifetime of currentprojects. Such projections are now possible with state-of-the-art observations and computer models that provideinformation over the next century and beyond. The best estimates suggest that global surface temperatures willincrease by approximately 5°C (9°F) over pre-industrial temperatures or approximately 4°C (7°F) over currenttemperatures by the year 2100.
1. IntroductionExtensive analysis originating as far back as the mid-1800s hasconclusively shown that greenhouse gas (GHG) constituentswithin the Earth’s atmosphere create a warming effect.Superimposed on the natural greenhouse effect is a humansupplement which is mainly composed of carbon dioxide from thecombustion of fossil fuels but also includes methane, nitrousoxides and other gases.
What is of primary interest to engineers is the likelihood of aparticular future climate and how it may stress infrastructure in away different from the climate of today. Among the changes thathave been identified by scientists are the rising sea level (Scambosand Abraham, 2015); increased precipitation, which leads to moreintense flooding (Abraham et al., 2015); more intense storms,including hurricanes with heavier rainfall and winds (Emanuel,2013; Kamahori et al., 2006; Kossin et al., 2007; Mann andEmanuel, 2006; Trenberth and Fasullo, 2007, 2008; Trenberth etal., 2007); more intense and common heat waves; changes tosubsurfaces including water and soil rigidity; and added latent andsensible energy fuelling more intense storms. Many of these andother changes are already being detected, and trends towards theirincrease will continue for the foreseeable future. One item notoften discussed is the potential for a climatologic tipping pointwhich, if passed, may cause dramatic and rapid changes. Forinstance, rapid methane release from melting permafrost in theArctic, a rapid collapse of a major ice sheet and changes to theocean currents which redistribute heat globally are potentialexamples. While tipping points should be considered, they are notthe topic of the present paper.
Here, a brief summary will be given of the major climateprojections that are expected into the near-term future (within thecurrent century). The projections to be given will be based oncomputer models; however, those models are reinforced by other
independent means such as the response of the past climate tochanges in atmospheric GHGs.
2. Climate projections
2.1 Global mean surface temperature observationsPerhaps the most commonly used (although not necessarily mostimportant) climate metric is the global mean surface temperature.This refers to the air temperature near the Earth’s surface; inmarine locations, it involves the sea surface temperature for itsdetermination. Global mean temperatures have been measured formany decades, and advanced tools are used to ensure thatcontamination of data (for instance, by the growth of cities) doesnot occur. Multiple data centres create these data records and,despite the differences in methodologies, the agreement isremarkable. Figure 1 shows two data sets extending from 1880 tothe present year. The graph shows temperature anomalies(excursions from an average) compared to the 1951–1980 period.It is seen not only by visual inspection but also by multiplestatistical analyses that there has been no cessation to warming,despite claims to the contrary in the general media (Cahill et al.,2015; Foster and Abraham, 2015; Karl et al., 2015;Lewandowsky et al., 2016; Trenberth and Fasullo, 2013). Rather,temperatures have risen steadily since the 1970s, with modestinterdecadal variations in warming rate that are consistent withinternal climate variability (Steinman et al., 2015).
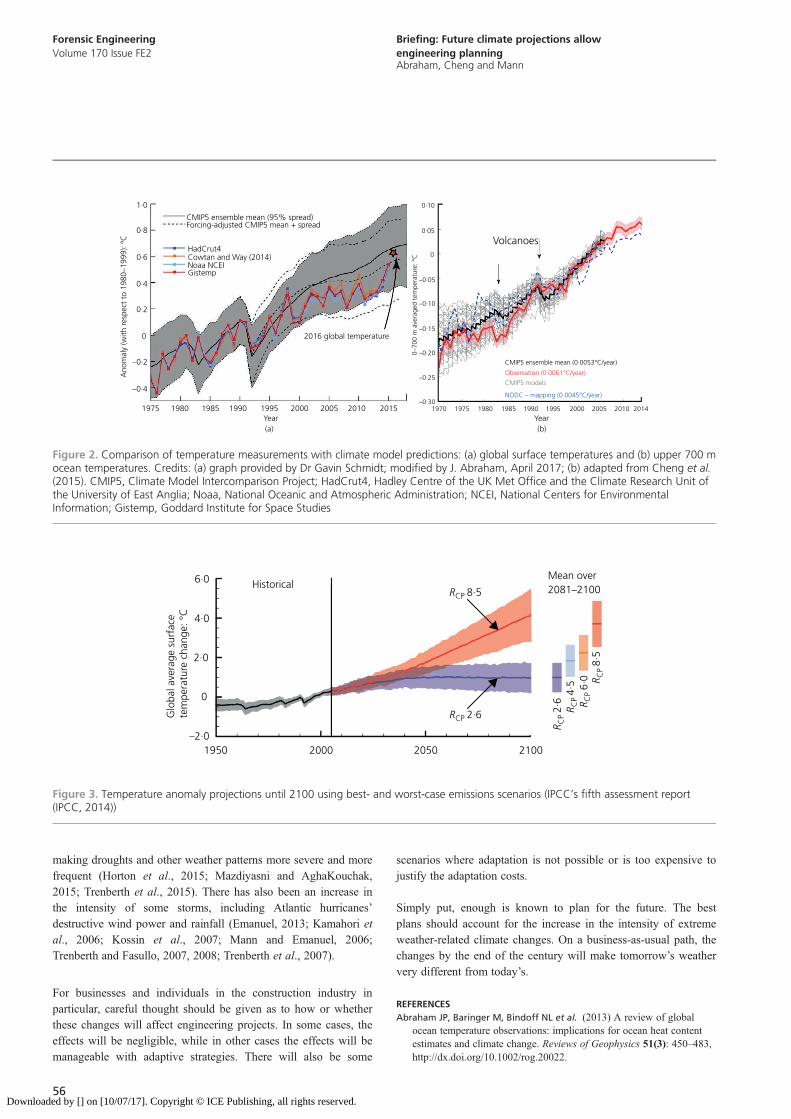
2.2 Comparison of models with measurementsOne measure of the reliability climate models is their ability tosimulate past temperature changes. A comparison of models/measurements is provided in Figure 2(a). The image shows fourdifferent temperature data sets. As with Figure 1, there isexcellent agreement between the measurements. The grey regionshows the spread of an ensemble average of climate models witha mean provided by the solid black line. When corrections are

Forensic EngineeringVolume 170 Issue FE2
Briefing: Future climate projections allowengineering planningAbraham, Cheng and Mann
Downloaded by
made for changes to incoming solar energy (such as byvolcanoes), the model range and mean are slightly reduced(shown by the long-dashed lines) (Santer et al., 2014; Schmidt etal., 2014). It is seen that 2016 is nearly identical to the centralestimate from the models. For the most recent decade, themeasurements have been at the lower end of the model range butwithin the range. The 40-year match between models andmeasurements gives confidence for future predictions. It should benoted that the model results in Figure 2 include both hindcast andforecast calculations.
Figure 2(b) compares temperature measurements in the oceans(upper 700 m of ocean waters). The CMIP5 model average isshown as a black line with a warming rate of 0·0053°C/year. Theobservations are slightly higher at 0·0061°C/year for oceanwarming. Again, this excellent agreement lends support to the useof climatological models for future temperature predictions(Abraham et al., 2013; Cheng et al., 2015, 2016, 2017).
2.3 Future temperature projectionsThe most complete future temperature estimates, although perhapsslightly conservative, are from the Intergovernmental Panel onClimate Change’s (IPCC) fifth report (IPCC, 2014). That reportprovides temperature ranges for various emissions rates (termed‘representative concentration pathways’ or ‘RCP’). RCP valuesrepresent different heat gain rates of the Earth in 2100 relative topre-industrial values; the units of RCP are Watts per square metreof the Earth’s surface area. Among the potential future scenariosconsidered by the IPCC, an RCP = 8·5 can be considered a worst-case scenario, whereas RCP = 2·6 should be considered a best-casesituation. Insofar as the current emissions are following the higherrange of projections, the temperatures predicted using the RCP 8·5
[] on [10/07/17]. Copyright © ICE Publishing, all rights reserved.
data are most appropriate. Figure 3 shows in graphical form theanticipated projections of global surface average temperature forthe two bounding emission scenarios.
Taking advantage of Figure 3, it is seen that the two scenariosresult in similar projections until approximately 2030, whendivergence begins. The temperatures in the RCP 8·5 case continueto rise, whereas the temperatures for RCP 2·6 plateau. Forcomparison, the overall temperature rise in the RCP 8·5 case is inexcess of 4°C (7°F) above the current temperature (approximately5°C (9°F) above the pre-industrial temperature). These wouldequate to temperatures not seen on Earth in at least the last 5million years.
While it is appropriate to utilise RCP 8·5 as a realistic ‘no-mitigation’ scenario, a significant global societal change in theutilisation and generation of power may bring real emissions morein line with the best-case scenario. In fact, the economics ofrenewable energy such as wind and solar power are decreasingdramatically and now are close to, or less expensive than, that ofmore traditional fossil fuels. Despite these positive factors, untilthe implementation of robust international agreements to reduceemissions is successfully completed, RCP 8·5 should be consideredthe standard. Furthermore, the effects of temperature changes (andother climate outcomes) associated with RCP 8·5 should beexpected. Some of these outcomes are already being observed. Forinstance, sea level rise is occurring with an expected ~1 m (3 feet)rise by 2100. Ocean chemistry is changing through acidification;changes to precipitation (including increases in the most heavyprecipitation events and consequent flooding) are being observed(Wang et al., 2015). At the same time, changes to groundwaterreservoirs and increased evapotranspiration in some areas are
Tem
pera
ture
ano
mal
y: °
C
Tem
pera
ture
ano
mal
y: °
F
20202000198019601940192019001880Year
Noaa
Nasa
0·36
0·72
1·10
1·40
1·80
2·20
–1·10
–0·72
–0·36
–0·6
–0·4
–0·2
0 0
0·2
0·4
0·6
0·8
1·0
1·2
Figure 1. National Oceanic and Atmospheric Administration (Noaa) and National Aeronautics and Space Administration (Nasa) global landand ocean surface temperature anomaly record
55
Forensic EngineeringVolume 170 Issue FE2
Briefing: Future climate projections allowengineering planningAbraham, Cheng and Mann
Download
making droughts and other weather patterns more severe and morefrequent (Horton et al., 2015; Mazdiyasni and AghaKouchak,2015; Trenberth et al., 2015). There has also been an increase inthe intensity of some storms, including Atlantic hurricanes’destructive wind power and rainfall (Emanuel, 2013; Kamahori etal., 2006; Kossin et al., 2007; Mann and Emanuel, 2006;Trenberth and Fasullo, 2007, 2008; Trenberth et al., 2007).
For businesses and individuals in the construction industry inparticular, careful thought should be given as to how or whetherthese changes will affect engineering projects. In some cases, theeffects will be negligible, while in other cases the effects will bemanageable with adaptive strategies. There will also be some
56ed by [] on [10/07/17]. Copyright © ICE Publishing, all rights reserved.
scenarios where adaptation is not possible or is too expensive tojustify the adaptation costs.
Simply put, enough is known to plan for the future. The bestplans should account for the increase in the intensity of extremeweather-related climate changes. On a business-as-usual path, thechanges by the end of the century will make tomorrow’s weathervery different from today’s.
REFERENCESAbraham JP, Baringer M, Bindoff NL et al. (2013) A review of global
ocean temperature observations: implications for ocean heat contentestimates and climate change. Reviews of Geophysics 51(3): 450–483,http://dx.doi.org/10.1002/rog.20022.
CMIP5 ensemble mean (95% spread)
0
(a) (b)Year Year
–0·4
–0·2
0·2
0·4
0·6
–0·05
Volcanoes
–0·302014201020052000199519901985198019751970
–0·25
–0·200–70
0 m
ave
rage
d te
mpe
ratu
re: °
C 0
–0·15
–0·10
0·050·8
1·0 0·10
Ano
mal
y (w
ith r
espe
ct t
o 19
80–1
999)
: ºC
201520102005200019951990198519801975
2016 global temperature
GistempNoaa NCEICowtan and Way (2014)HadCrut4
NODC – mapping (0·0045°C/year)
CMIP5 models
Observation (0·0061°C/year)
CMIP5 ensemble mean (0·0053°C/year)
Forcing-adjusted CMIP5 mean + spread
Figure 2. Comparison of temperature measurements with climate model predictions: (a) global surface temperatures and (b) upper 700 mocean temperatures. Credits: (a) graph provided by Dr Gavin Schmidt; modified by J. Abraham, April 2017; (b) adapted from Cheng et al.(2015). CMIP5, Climate Model Intercomparison Project; HadCrut4, Hadley Centre of the UK Met Office and the Climate Research Unit ofthe University of East Anglia; Noaa, National Oceanic and Atmospheric Administration; NCEI, National Centers for EnvironmentalInformation; Gistemp, Goddard Institute for Space Studies
Glo
bal a
vera
ge s
urfa
ce
tem
pera
ture
cha
nge:
°C
R CP
2·6
R CP
4·5
R CP
6·0 R C
P 8·
5
Mean over2081–2100
2·0
0
–2·01950 2000 2050 2100
4·0
6·0 HistoricalRCP 8·5
RCP 2·6
Figure 3. Temperature anomaly projections until 2100 using best- and worst-case emissions scenarios (IPCC’s fifth assessment report(IPCC, 2014))

Forensic EngineeringVolume 170 Issue FE2
Briefing: Future climate projections allowengineering planningAbraham, Cheng and Mann
Downloaded by
Abraham JP, Stark JR and Minkowycz WJ (2015) Briefing: Extremeweather: observed precipitation changes in the USA. Proceedings ofthe Institution of Civil Engineers – Forensic Engineering 168(2):68–70, http://dx.doi.org/10.1680/feng.14.00015.
Cahill N, Rahmstorf S and Parnell AC (2015) Change points of globaltemperature. Environmental Research Letters 10(8): 084002, https://doi.org/10.1088/1748-9326/10/8/084002.
Cheng LJ, Zhu J and Abraham JP (2015) Global upper ocean heat contentestimation: recent progresses and the remaining challenges.Atmospheric and Oceanic Science Letters 8(6): 333–338, http://dx.doi.org/10.3878/AOSL20150031.
Cheng LJ, Trenberth KE, Palmer MD, Zhu J and Abraham JP (2016)Observed and simulated full-depth ocean heat-content changes for1970–2005. Ocean Sciences 12(4): 925–935, http://dx.doi.org/10.5194/os-12-925-2016.
Cheng L, Trenberth KE, Boyer T et al. (2017) Improved estimates of oceanheat content from 1960 to 2015. Science Advances 3(3): e1601545,http://dx.doi.org/10.1126/sciadv.1601545.
Cowtan K and Way RG (2014) Coverage bias in the HadCRUT4temperature data series and its impact on recent temperature trends.Quarterly Journal of the Royal Meteorological Society 140:1935–1944, http://dx.doi.org/10.1002/qj.2297.
Emanuel KA (2013) Downscaling CMIP5 climate models shows increasedtropical cyclone activity over the 21st century. Proceedings of theNational Academy of Sciences 110(30): 12219–12224,http://dx.doi.org10.1073/pnas.1301293110.
Foster G and Abraham JP (2015) Lack of evidence for a slowdown inglobal temperature. Proceedings of 2015 US CLIVAR – ClimateVariability and Predictability, Tuscon, AZ, USA, vol. 13, pp. 6–9.
Horton DE, Johnson NC, Sign D et al. (2015) Contributions of changes inatmospheric circulation patterns to extreme temperature trends. Nature522(7557): 465–469, http://dx.doi.org/10.1038/nature14550.
IPCC (Intergovernmental Panel on Climate Change) (2014) ClimateChange 2013: the Physical Science Basis – Working Group 1Contribution to the Fifth Assessment Report of the IntergovernmentalPanel on Climate Change. IPCC, Geneva, Switzerland.
Kamahori H, Yamazaki N, Mannoji N and Takahashi K (2006) Variabilityin intense tropical cyclone days in the Western North Pacific. Sola 2:104–107, http://dx.doi.org/10.2151/sola.2006-027.
Karl TR, Arguez A, Huang B et al. (2015) Possible artifacts of data biasesin the recent global surface warming hiatus. Science 348(6242):1469–1472, http://dx.doi.org/10.1126/science.aaa5632.
Kossin PJ, Knapp KR, Vimont DJ, Murnane RJ and Harper BA (2007) Aglobally consistent reanalysis of hurricane variability and trends.Geophysical Research Letters 34(4): L004815, http://dx.doi.org/10.1029/2006GL028836.
[] on [10/07/17]. Copyright © ICE Publishing, all rights reserved.
Lewandowsky S, Risbey JS and Oreskes N (2016) The ‘pause’ in globalwarming: turning a routine fluctuation into a problem for science.Bulletin of the American Meteorological Society 97(5): 723–733,http://dx.doi.org/10.1175/BAMS-D-14-00106.1.
Mann ME and Emanuel KA (2006) Atlantic hurricane trends linked toclimate change. EOS 87(24): 233–244, http://dx.doi.org/10.1029/2006EO240001.
Mazdiyasni O and AghaKouchak A (2015) Substantial increase inconcurrent droughts and heat waves in the United States.Proceedings of the National Academy of Sciences of the United Statesof America 113(37): 11484–11489, http://dx.doi.org/10.1073/pnas.1422945112.
Santer BD, Bonfils C, Painter JF et al. (2014) Volcanic contribution todecadal changes in tropospheric temperature. Nature Geoscience 7(3):185–189, http://dx.doi.org/10.1038/ngeo2098.
Scambos T and Abraham JP (2015) Briefing: Antarctic ice sheet mass lossand future sea level rise. Proceedings of the Institution of CivilEngineers – Forensic Engineering 168(2): 81–84, http://dx.doi.org/10.1680/feng.14.00014.
Schmidt GA, Shindell DT and Tsigaridis K (2014) Reconciling warmingtrends. Nature Geoscience 7(3): 158–160, http://dx.doi.org/10.1038/ngeo2105.
Steinman BA, Mann ME and Miller SK (2015) Atlantic and Pacificmultidecadal oscillations and Northern Hemisphere temperatures.Science 347(6225): 998–991, http://dx.doi.org/10.1126/science.1257856.
Trenberth KE and Fasullo JT (2007) Water energy budgets of hurricanesand implications for climate change. Journal of Geophysical Research112(D23): D23017, http://dx.doi.org/10.1029/2006JD008304.
Trenberth KE and Fasullo JT (2008) Energy budgets of Atlantic hurricanesand changes from 1970. Geochemistry Geophysics Geosystems 9(9):Q09V08, http://dx.doi.org/10.1029/2007GC001847.
Trenberth KE and Fasullo JT (2013) An apparent hiatus in globalwarming? Earth’s Future 1(1): 19–32, http://dx.doi.org/10.1002/2013EF000165.
Trenberth KE, Davis CA and Fasullo JT (2007) Water and energy budgetsof hurricanes: case studies of Ivan and Katrina. Journal ofGeophysical Research 112(D23): D23106, http://dx.doi.org/10.1029/2006JD008303.
Trenberth KE, Fasullo JT and Shepherd TG (2015) Attribution of climateextreme events. Nature Climate Change 5: 725–730, http://dx.doi.org/10.1038/nclimate2657.
Wang SYS, Huang WR, Hsu HH et al. (2015) Role of the strengthened ElNiño teleconnection in the May 2015 floods over the southern GreatPlains. Geophysical Research Letters 42(19): 8140–8146, http://dx.doi.org/10.1002/2015GL065211.
How can you contribute?
To discuss this paper, please email up to 500 words tothe editor at [email protected]. Your contribution will beforwarded to the author(s) for a reply and, if consideredappropriate by the editorial board, it will be published asdiscussion in a future issue of the journal.
Proceedings journals rely entirely on contributions from thecivil engineering profession (and allied disciplines).Information about how to email your paper online is availableat www.icevirtuallibrary.com/page/authors, where you willalso find detailed author guidelines.
57