Bridgestone Corporation - Climate Change 2018...(C0.4) Select the currency used for all financial...
129
Bridgestone Corporation - Climate Change 2018 C0. Introduction C0.1 (C0.1) Give a general description and introduction to your organization. Bridgestone is a global leader in the tire industry, whose business consists of the “Tire sector”; manufacturing/sales of tires/tubes, sales of tire related products and car maintenance/repairs, “Diversified products sector”; chemical & industrial products, sports products, bicycle manufacturing and sales, and other various businesses, and "Solution Business"; new "solutions" service package by combining maintenance services, IT/sensing technology, tires and diversified products. The CSR, Environment and Quality Management Planning Division responds to CDP. This division plays the role of coordination and management on a global level based on our Environmental Mission Statement, providing environmental support to business sections (Strategic Business Units). C0.2 (C0.2) State the start and end date of the year for which you are reporting data. Start date End date Indicate if you are providing emissions data for past reporting years Select the number of past reporting years you will be providing emissions data for Row 1 January 1 2017 December 31 2017 No <Not Applicable> Row 2 <Not Applicable> <Not Applicable> <Not Applicable> <Not Applicable> Row 3 <Not Applicable> <Not Applicable> <Not Applicable> <Not Applicable> Row 4 <Not Applicable> <Not Applicable> <Not Applicable> <Not Applicable> C0.3 (C0.3) Select the countries/regions for which you will be supplying data. Argentina
Transcript of Bridgestone Corporation - Climate Change 2018...(C0.4) Select the currency used for all financial...

Bridgestone Corporation - Climate Change 2018
C0. Introduction
C0.1
(C0.1) Give a general description and introduction to your organization.
Bridgestone is a global leader in the tire industry, whose business consists of the “Tire
sector”; manufacturing/sales of tires/tubes, sales of tire related products and car
maintenance/repairs, “Diversified products sector”; chemical & industrial products, sports
products, bicycle manufacturing and sales, and other various businesses, and "Solution
Business"; new "solutions" service package by combining maintenance services, IT/sensing
technology, tires and diversified products. The CSR, Environment and Quality Management
Planning Division responds to CDP. This division plays the role of coordination and
management on a global level based on our Environmental Mission Statement, providing
environmental support to business sections (Strategic Business Units).
C0.2
(C0.2) State the start and end date of the year for which you are reporting data.
Start date End date Indicate if you are providingemissions data for past reportingyears
Select the number of past reporting yearsyou will be providing emissions data for
Row1
January 12017
December31 2017
No <Not Applicable>
Row2
<NotApplicable>
<NotApplicable>
<Not Applicable> <Not Applicable>
Row3
<NotApplicable>
<NotApplicable>
<Not Applicable> <Not Applicable>
Row4
<NotApplicable>
<NotApplicable>
<Not Applicable> <Not Applicable>
C0.3
(C0.3) Select the countries/regions for which you will be supplying data.
Argentina

Australia
Belgium
Brazil
Canada
China
Costa Rica
France
Hungary
India
Indonesia
Italy
Japan
Liberia
Malaysia
Mexico
Philippines
Poland
South Africa
Spain
Taiwan (Province of China)
Thailand
Turkey
United Kingdom of Great Britain and Northern Ireland
United States of America
Viet Nam
C0.4
(C0.4) Select the currency used for all financial information disclosed throughout your
response.
JPY
C0.5
(C0.5) Select the option that describes the reporting boundary for which climate-related
impacts on your business are being reported. Note that this option should align with your
consolidation approach to your Scope 1 and Scope 2 greenhouse gas inventory.
Operational control
C1. Governance

C1.1
(C1.1) Is there board-level oversight of climate-related issues within your organization?
Yes
C1.1a
(C1.1a) Identify the position(s) of the individual(s) on the board with responsibility for
climate-related issues.
Position ofindividual(s)
Please explain
ChiefExecutiveOfficer(CEO)
The CEO is a member of the board, and has the highest-level responsibility for climate-relatedissues. The CEO is responsible for deciding policies and measures or presenting to the board andoverseeing company-wide management activities about management vision, mid-term strategies,annual policies, etc. including climate-related issues.
C1.1b
(C1.1b) Provide further details on the board’s oversight of climate-related issues.
Frequencywithwhichclimate-relatedissues areascheduledagendaitem
Governancemechanismsinto whichclimate-relatedissues areintegrated
Please explain

Frequencywithwhichclimate-relatedissues areascheduledagendaitem
Governancemechanismsinto whichclimate-relatedissues areintegrated
Please explain
Scheduled– somemeetings
Reviewingand guidingstrategyReviewingand guidingmajor plansof actionReviewingand guidingriskmanagementpoliciesReviewingand guidingbusinessplansSettingperformanceobjectivesMonitoringandoverseeingprogressagainstgoals andtargets foraddressingclimate-relatedissues
Senior-level CSR responsible officers report to the board various topics includingenvironment and climate change issues which have been reviewed by Global ExecutiveCommittee (G-EXCO), Bridgestone highest-level execution committee. In 2017,(1)establishment of a collaborative network made up of a global CSR managementsystem, a regional CSR management system, and working groups for specific areasand functions including Environmental Working Group which promotes environmentalactivities such as CO2 reduction, and (2)Social expectation and our response includingclimate-related topics such as the Paris agreement and our Environmental mid-termtarget were reported to the board.
C1.2
(C1.2) Below board-level, provide the highest-level management position(s) or committee(s)
with responsibility for climate-related issues.
Name of the position(s)and/or committee(s)
Responsibility Frequency of reporting to the board onclimate-related issues
Chief Executive Officer(CEO)
Both assessing and managing climate-related risks and opportunities
Quarterly

C1.2a
(C1.2a) Describe where in the organizational structure this/these position(s) and/or
committees lie, what their associated responsibilities are, and how climate-related issues are
monitored.
At Bridgestone, the CEO is the highest-level management position and has ultimate
responsiblity for management strategy and overall management including climate-related
issues. And the highest-level committee associated with Bridgestone Group Global
business execution is the Global EXCO. Members of the Global EXCO are nominated from
full-time corporate officers by CEO/COO.
Under the Global EXCO, Bridgestone has the Global CSR Enhancement Committee (GCEC)
which reports to the Global EXCO and is comprised of executive officers in charge of CSR
and representatives of Strategic Business Unit(SBU)s and functions.
Under the GCEC, Bridgestone has 7 working groups* which are related to the areas focused
in our CSR Commitment; "Our Way to Serve". Each working group comprised of members
from corresponding function in each SBU and report to the GCEC. Among the 7-working
group, “Environment Working Group” summarizes and reports previous year results related
to CO2 and proposes next strategies to the GCEC, taking into account the latest social trend
especially which has possibility to be environmental risks/opportunities.
According to deliverables from the working groups including that from the Environment
Working Group as written above, the GCEC prioritizes CSR initiatives in areas pertaining to a
variety of global issues including climate change , formulates global CSR strategies,
confirms the progress of activities in each area. Then the GCEC reports their deliverables to
the Global EXCO and ask them for decision making on important items.
By the way, as for risk management/assessment, the Bridgestone Group broadly divides
risks into two categories: business strategic risks, which are related to management
decision-making, and operational risks, which include climate change risks and are related
to daily operations. The former is handled through business operations, while the latter is
handled by the Chief Risk Officer (CRO), who has overall responsibility for managing risks
and reports to the CEO.

*7 working groups under the GCEC: "Mobility", "People", "Environment", "Compliance, Fair
Competition", "BCP, Risk Management", "Human Rights, Labor Practices" and "Procurement"
C1.3
(C1.3) Do you provide incentives for the management of climate-related issues, including the
attainment of targets?
Yes
C1.3a
(C1.3a) Provide further details on the incentives provided for the management of climate-
related issues.
Who is entitled to benefit from these incentives?
All employees
Types of incentives
Monetary reward
Activity incentivized
Energy reduction project
Comment
At Bridgestone, business, departments and individuals who have made outstanding
achievements, including various climate change mitigation actions and results, such as
achieving a CO2 reduction target, reducing energy use, and improving efficiency or
reducing waste among others can be recognized by the CEO and COO in a company-wide
event held on March 1, the foundation day, and also can be recognized every year by the
head of the worksite in a regional event. Bridgestone’s commemorates its history and
philosophy at its foundation day while reconfirming the direction the company will take in
the future. This event aims to raise employees’ awareness of corporate activities. A
monetary recognition as well as a regional recognition is in place.
Who is entitled to benefit from these incentives?
All employees
Types of incentives
Recognition (non-monetary)
Activity incentivized
Emissions reduction project
Comment

Bridgestone Group Awards is a program for all employees that recognizes efforts of
organizations and individuals in five award categories. One of award categories,
Environment award, recognizes efforts related to climate change, such as achieving a
CO2 reduction target, reducing energy use, and improving efficiency or reducing waste for
the purpose of raising the awareness of each employee to participate in environmental
activities.
C2. Risks and opportunities
C2.1
(C2.1) Describe what your organization considers to be short-, medium- and long-term
horizons.
From(years)
To(years)
Comment
Short-term
0 5 Short-term is in line with Business Mid-term Plan and climate change relatedmeasures such as investment on equipment for energy saving are incorporated intothe plan globally.
Medium-term
5 10 Bridgestone has Environmental mid-term target including CO2 reduction in line withthe Medium-term.
Long-term
10 40 Bridgestone has Long-term Environmental vision including CO2 reduction in line withthe Long-term.
C2.2
(C2.2) Select the option that best describes how your organization's processes for
identifying, assessing, and managing climate-related issues are integrated into your overall
risk management.
Integrated into multi-disciplinary company-wide risk identification, assessment, and
management processes
C2.2a
(C2.2a) Select the options that best describe your organization's frequency and time horizon
for identifying and assessing climate-related risks.
Frequency of monitoring How far into the future are risks considered? Comment

Frequency of monitoring How far into the future are risks considered? Comment
Row 1 Annually >6 years
C2.2b
(C2.2b) Provide further details on your organization’s process(es) for identifying and
assessing climate-related risks.
1. Risk Assessment Structure in the Bridgestone group
The Bridgestone Group broadly divides risks into two categories: business strategic risks,
which are related to management decision-making, and operational risks, which include
climate change risks and are related to daily operations. The former is handled through
business operations, while the latter is handled by the Chief Risk Officer (CRO), who has
overall responsibility for managing risks and reports to the CEO. We promote risk
assessment as a part of comprehensive activities to appropriately manage risks common
to the Group, with consideration for the scale and characteristics of each site and Group
company. Through the dual promotion of Group global unified activities and autonomous
risk management activities by branches, important risks common to the Group (Corporate
risk) and risks of each site and Group company are identified.
2. The process for assessing the potential size and scope of identified risks
In the Bridgestone group, both corporate and facilities conduct risk identification at least
once a year, utilizing globally common direction. Then, they evaluate risks, utilizing a
globally unified criteria which consists of viewpoints of their impact and possibility of
occurrence. We standardized the degree of impacts of risks by impact-type such as human
life/health, financial loss, operational impact (period of suspension of sales and plant
operation or time necessary for response), social trust and so on, regardless the possible
timing of occurrence. The criterion to determine rank differ by the impact-type. But as for
environment related risks including climate change and CO2 emission etc., we consider its
possible impact is substantive when it falls under one of the following criteria: “Strong
feeling of discomfort extending to areas surrounding the office/plant, accompanied by
health damage in some cases, or health damage caused externally over a wide area”,
“Excess limit of financial amount (determined by company)”, “Over two weeks’ impact on
division (period of suspension of sales and plant operation or time necessary for
response)”, or “Trust damaged in terms of the company’s constitution (falsified reports,
organizational scandal)”. On the other hand, we also estimate possibility of occurrence and
classify them into 4 ranks based on the likelihood.
3. How climate-related risks are identified and assessed at a company/asset level
As the result of the evaluation based on impact and possibility of occurrence, the risks
“with a high possibility of occurring and major impact” and “with a significant impact of it
should occur, although its possibility is low” are considered “Significant risk” and classified
into “Corporate risk”. And others are into “Asset Risk”.
4.The process to determine the relative significance of climate-related risks in relation to
other risks
The process for risk identification and assessment mentioned above is also applied to the
risks other than environment related ones including climate change, so various risks which
we may face can be assessed in comparable manner.
5.The definitions of risk terminologies used and references to existing risk classification
frameworks
Bridgestone’s definition of “risk” is events (incidents, accidents, natural disasters or
problems, etc.) that may cause damage to organizations, employees, products and services,
financial conditions, brands, customers, shareholders, business partners or neighbors. In
addition, We promotes improvement of risk identification and management framework
referring ISO 31000, the international standard for risk management.
6.How we defines substantive financial or strategic impact on our business
Through the process written above, we figure out substantive risks. From financial
perspective, the threshold for the judgement is whether the risk is anticipated to cause
more financial loss than a standardized amount. And also, from strategic point of view, the
standardized degree determined by impact-type such as human life/health, financial loss,
operational impact(period of suspension of sales and plant operation or time necessary for
response), social trust and so on is utilized to judge. And the concrete criteria including the
amount of financial loss is determined by each of corporate, sites and Group companies
which conduct the risk assessment, with consideration for the scale and characteristics of
them.
C2.2c
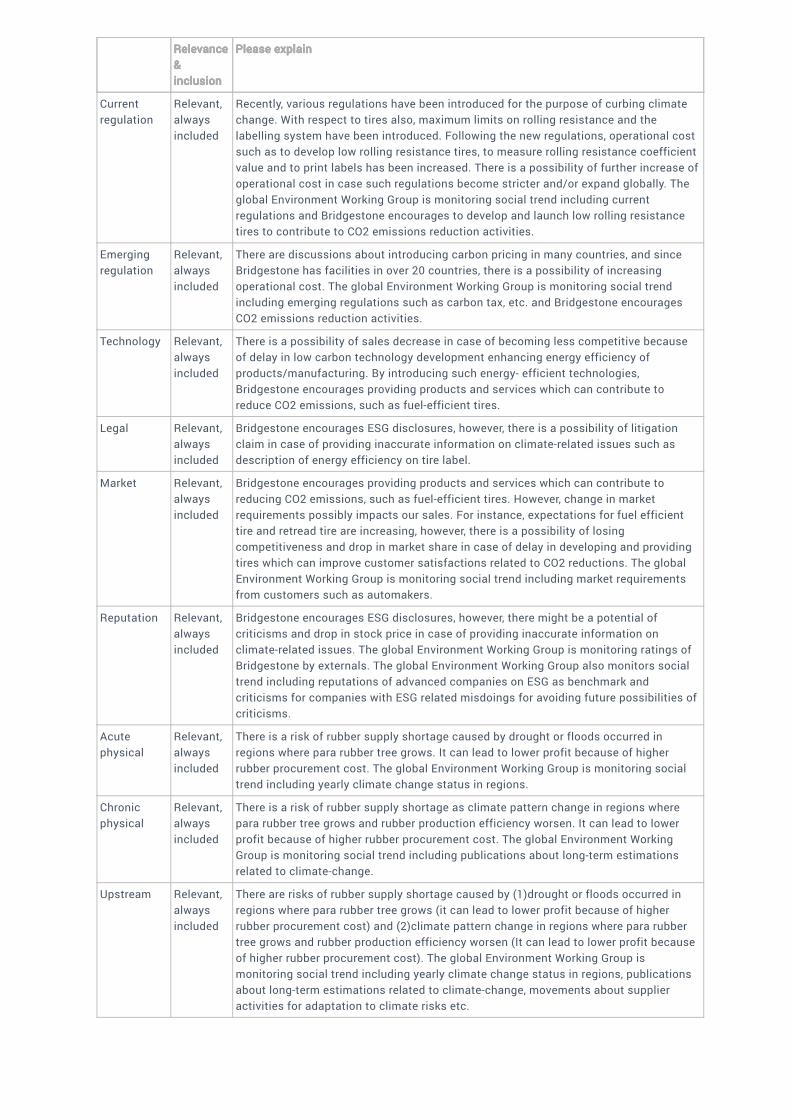
(C2.2c) Which of the following risk types are considered in your organization's climate-
related risk assessments?
Relevance&inclusion
Please explainRelevance&inclusion
Please explain
Currentregulation
Relevant,alwaysincluded
Recently, various regulations have been introduced for the purpose of curbing climatechange. With respect to tires also, maximum limits on rolling resistance and thelabelling system have been introduced. Following the new regulations, operational costsuch as to develop low rolling resistance tires, to measure rolling resistance coefficientvalue and to print labels has been increased. There is a possibility of further increase ofoperational cost in case such regulations become stricter and/or expand globally. Theglobal Environment Working Group is monitoring social trend including currentregulations and Bridgestone encourages to develop and launch low rolling resistancetires to contribute to CO2 emissions reduction activities.
Emergingregulation
Relevant,alwaysincluded
There are discussions about introducing carbon pricing in many countries, and sinceBridgestone has facilities in over 20 countries, there is a possibility of increasingoperational cost. The global Environment Working Group is monitoring social trendincluding emerging regulations such as carbon tax, etc. and Bridgestone encouragesCO2 emissions reduction activities.
Technology Relevant,alwaysincluded
There is a possibility of sales decrease in case of becoming less competitive becauseof delay in low carbon technology development enhancing energy efficiency ofproducts/manufacturing. By introducing such energy- efficient technologies,Bridgestone encourages providing products and services which can contribute toreduce CO2 emissions, such as fuel-efficient tires.
Legal Relevant,alwaysincluded
Bridgestone encourages ESG disclosures, however, there is a possibility of litigationclaim in case of providing inaccurate information on climate-related issues such asdescription of energy efficiency on tire label.
Market Relevant,alwaysincluded
Bridgestone encourages providing products and services which can contribute toreducing CO2 emissions, such as fuel-efficient tires. However, change in marketrequirements possibly impacts our sales. For instance, expectations for fuel efficienttire and retread tire are increasing, however, there is a possibility of losingcompetitiveness and drop in market share in case of delay in developing and providingtires which can improve customer satisfactions related to CO2 reductions. The globalEnvironment Working Group is monitoring social trend including market requirementsfrom customers such as automakers.
Reputation Relevant,alwaysincluded
Bridgestone encourages ESG disclosures, however, there might be a potential ofcriticisms and drop in stock price in case of providing inaccurate information onclimate-related issues. The global Environment Working Group is monitoring ratings ofBridgestone by externals. The global Environment Working Group also monitors socialtrend including reputations of advanced companies on ESG as benchmark andcriticisms for companies with ESG related misdoings for avoiding future possibilities ofcriticisms.
Acutephysical
Relevant,alwaysincluded
There is a risk of rubber supply shortage caused by drought or floods occurred inregions where para rubber tree grows. It can lead to lower profit because of higherrubber procurement cost. The global Environment Working Group is monitoring socialtrend including yearly climate change status in regions.
Chronicphysical
Relevant,alwaysincluded
There is a risk of rubber supply shortage as climate pattern change in regions wherepara rubber tree grows and rubber production efficiency worsen. It can lead to lowerprofit because of higher rubber procurement cost. The global Environment WorkingGroup is monitoring social trend including publications about long-term estimationsrelated to climate-change.
Upstream Relevant,alwaysincluded
There are risks of rubber supply shortage caused by (1)drought or floods occurred inregions where para rubber tree grows (it can lead to lower profit because of higherrubber procurement cost) and (2)climate pattern change in regions where para rubbertree grows and rubber production efficiency worsen (It can lead to lower profit becauseof higher rubber procurement cost). The global Environment Working Group ismonitoring social trend including yearly climate change status in regions, publicationsabout long-term estimations related to climate-change, movements about supplieractivities for adaptation to climate risks etc.
Relevance&inclusion
Please explain
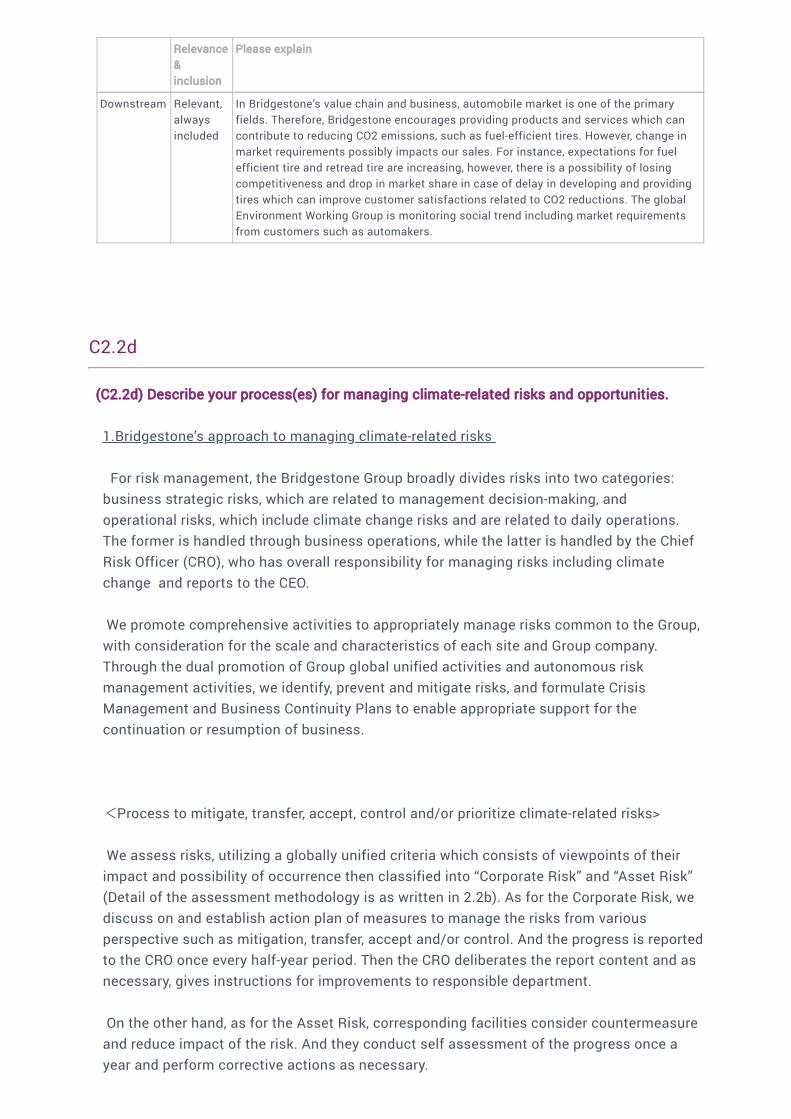
Downstream Relevant,alwaysincluded
In Bridgestone’s value chain and business, automobile market is one of the primaryfields. Therefore, Bridgestone encourages providing products and services which cancontribute to reducing CO2 emissions, such as fuel-efficient tires. However, change inmarket requirements possibly impacts our sales. For instance, expectations for fuelefficient tire and retread tire are increasing, however, there is a possibility of losingcompetitiveness and drop in market share in case of delay in developing and providingtires which can improve customer satisfactions related to CO2 reductions. The globalEnvironment Working Group is monitoring social trend including market requirementsfrom customers such as automakers.
C2.2d
(C2.2d) Describe your process(es) for managing climate-related risks and opportunities.
1.Bridgestone’s approach to managing climate-related risks
For risk management, the Bridgestone Group broadly divides risks into two categories:
business strategic risks, which are related to management decision-making, and
operational risks, which include climate change risks and are related to daily operations.
The former is handled through business operations, while the latter is handled by the Chief
Risk Officer (CRO), who has overall responsibility for managing risks including climate
change and reports to the CEO.
We promote comprehensive activities to appropriately manage risks common to the Group,
with consideration for the scale and characteristics of each site and Group company.
Through the dual promotion of Group global unified activities and autonomous risk
management activities, we identify, prevent and mitigate risks, and formulate Crisis
Management and Business Continuity Plans to enable appropriate support for the
continuation or resumption of business.
<Process to mitigate, transfer, accept, control and/or prioritize climate-related risks>
We assess risks, utilizing a globally unified criteria which consists of viewpoints of their
impact and possibility of occurrence then classified into “Corporate Risk” and “Asset Risk”
(Detail of the assessment methodology is as written in 2.2b). As for the Corporate Risk, we
discuss on and establish action plan of measures to manage the risks from various
perspective such as mitigation, transfer, accept and/or control. And the progress is reported
to the CRO once every half-year period. Then the CRO deliberates the report content and as
necessary, gives instructions for improvements to responsible department.
On the other hand, as for the Asset Risk, corresponding facilities consider countermeasure
and reduce impact of the risk. And they conduct self assessment of the progress once a
year and perform corrective actions as necessary.

2. Management processes regarding climate-related opportunities
As the first step of our managing process of climate-related opportunities, the
Environmental Working Group under the GCEC comprising members from each Strategic
Business Unit monitors social trends and oversees company’s activities on CO2 reduction,
biodiversity, resource efficiency end so on.
Based on the discussion at the Environmental Working Group, the overall global decision-
making regarding the environment, including climate change, is normally carried out by the
GCEC. Members of the committee are composed of an executive officer in charge of CSR
and representatives of regions and functions. As for important items, the GCEC reports
them to the Global EXCO and ask them for decision on them. Then, based on the
management plan finalized at Global EXCO, SBUs reflect it in each Five-Year Mid-term
Management Plan, prioritizing such opportunities from effect and investment points of
view.
3. Case Study
<Physical risk>
For Bridgestone, disruption of supplies of raw material including natural rubber is regarded
as one of major risks. So far, its probability of occurrence is not very high. But on the other
hand, as we use large quantities of natural rubber in tires and other rubber products, we
estimate its potential financial impact is substantive. Therefore, we classify it into
Corporate Risk. From climate change perspective, productivity of natural rubber which is
main raw material in tires could be decreased by droughts in South East Asia as primary
growing area of para rubber tree. Then, shortage and/or cost increase of natural rubber
could adversely affect the Companies’ operating results and financial position.
As part of countermeasures, we are promoting various research projects aimed at practical
applications for guayule, which shows promise as a new supply source for natural rubber.
Aiming for practical applications in the 2020s. we will continue to strengthen various
factors going forward, including improving guayule productivity through sustainable
methods, establishing production processes and improving logistics.
<Transition risk>
Our operations around the world are subject to diverse national laws and regulation
including environmental protection. We consider such Legal, regulatory and litigation risk
could have potential to be one of the major risks.

Labeling systems and regulations regarding tire performance such as fuel efficiency which
can contribute CO2 reduction are one of such risks. This risk has potential to decrease
sales if investment in new technology for lower rolling resistance which makes tires more
fuel-efficient in align with other performances including price is unsuccessful. As tire
business is one of our primary business, the potential financial impact is considered not
small. And as this type of systems/regulations are expanding around the world, the
probability of occurrence is relatively high. Therefore, we regard this risk as Corporate Risk
and tackle with developing tires with low rolling resistance.
C2.3
(C2.3) Have you identified any inherent climate-related risks with the potential to have a
substantive financial or strategic impact on your business?
Yes
C2.3a
(C2.3a) Provide details of risks identified with the potential to have a substantive financial or
strategic impact on your business.
Identifier
Risk 1
Where in the value chain does the risk driver occur?
Direct operations
Risk type
Transition risk
Primary climate-related risk driver
Policy and legal: Increased pricing of GHG emissions
Type of financial impact driver
Policy and legal: Increased operating costs (e.g., higher compliance costs, increased
insurance premiums)
Company- specific description
In October 2012, the Tax for Climate Change Mitigation was introduced in Japan. In
response to such introduction, the Bridgestone Group is paying more taxes directly
according to the use of fuel and indirectly according to the use of electricity. Specifically,
by using CO2 emissions factor of each fossil fuel, the tax rate per unit quantity (kilo litter
or tonne) is set so that each tax burden is equal to 289 yen per tonne of CO2 emissions.
The tax rate was raised in three stages over three and a half years and reached 289 yen in

2016. In addition, there is a possibility of increasing payment since Paris Agreement was
ratified and there are discussions about introducing carbon pricing in Japan.
Time horizon
Short-term
Likelihood
Likely
Magnitude of impact
High
Potential financial impact
935000
Explanation of financial impact
Current carbon tax rate in Japan is 289 yen/tCO2e, however, financial impact in case of
increase in tax rate can be roughly calculated as following formula. Financial impact =
increase in tax rate times CO2 emission volume in Japan (about 935 thousand yen/1 yen
increase in tax rate. This calculation includes impact of price increase of electricity)
Management method
In order to reduce CO2 emissions, we are promoting conversion to energy that produces
little CO2 emissions and also reducing energy use itself. 1. Energy saving initiatives at
production sites: We have been implementing CO2 reduction measures such as upgrading
equipment to high efficiency equipment, converting equipment to inverter which can
flexibly respond to load fluctuation, installing steam turbine generators, converting to fuel
emitting less CO2, and installing LED lighting. 2. Energy saving initiatives at offices: We
have reduced the number of units of equipment by promoting scrapping and integration
through the visualization of the layout and utilization rate of office equipment such as
printers and multifunction office equipment. We also have long succeeded in reducing
power consumption by resetting illuminance by thorough measurement of lighting
illuminance of business offices. We have introduced an “electric power visualization”
system at the business office of Technical Center which is used to visualize the status of
power consumption and verify the effects of reduction measures and to set reduction
targets.
Cost of management
1421000000
Comment
Investments mainly for enhancing energy saving through improvements of equipment,
including upgrading equipment to high efficiency equipment and converting them to
inverter, at Bridgestone plants amounted to 1,421million yen in 2017.
Identifier
Risk 2
Where in the value chain does the risk driver occur?
Supply chain
Risk type

Physical risk
Primary climate-related risk driver
Chronic: Changes in precipitation patterns and extreme variability in weather patterns
Type of financial impact driver
Increased operating costs (e.g., inadequate water supply for hydroelectric plants or to
cool nuclear and fossil fuel plants)
Company- specific description
Bridgestone’s main business is tires whose raw materials consist of natural rubber. At
present, natural rubber is almost entirely made from the sap of para rubber tree. 90% of
growing area of para rubber tree is in Southeast Asia and owing to droughts in the
tropical rainforests of Southeast Asia caused by El Nino, the deciduous period for para
rubber tree becomes longer and the period during which sap (latex) can be obtained
becomes shorter, thereby leading to a decrease in yield. As a result, the balance of supply
and demand is expected to be upset and the price of natural rubber, which plays a vital
role as a raw material of tires, is expected to surge. If the price of natural rubber rises and
it becomes difficult to procure such rubber, the cost of tire production will increase. This
in turn is expected to result in lower profit or a decrease in share due to higher tire prices.
Time horizon
Medium-term
Likelihood
Likely
Magnitude of impact
Medium-high
Potential financial impact
1880000
Explanation of financial impact
At this moment, we are unable to accurately estimate the financial implications. However,
we estimate that once this scenario takes place, the procurement cost will increase
drastically. For example, an increase of about 1.88 million yen worldwide for every yen
rise per ton of natural and synthetic rubber, based on 2017 production levels.
Management method
In order to avoid the risk above, Bridgestone produces a portion of the raw materials at
our own rubber tree farms, as well as establishes disease diagnostic technology and
conducts research on genome decoding aimed at breed improvement. Through these
efforts, we are augmenting output and preparing for the risk of being unable to procure.
The Bridgestone Group owns natural rubber tree farms in Indonesia and Liberia.
Cost of management
99700000000
Comment
The entire research and development expenses of the Global Group, including measures
like establishing disease diagnostic technology and conducting research on genome
decoding aimed at breed improvement , totaled 99.7 billion yen per year in 2017.

Identifier
Risk 3
Where in the value chain does the risk driver occur?
Customer
Risk type
Transition risk
Primary climate-related risk driver
Reputation: Increased stakeholder concern or negative stakeholder feedback
Type of financial impact driver
Reputation: Reduction in capital availability
Company- specific description
Disclosure of GHG related information is increasingly being required around the world.
Meanwhile, foreign investors own about 27% of Bridgestone stocks. If Bridgestone stocks
are deemed to be outside the scope of ESG investment by financial institutions due to our
failure to disclose information or negative campaigns are conducted by NGOs, there is a
risk that this would lead to a decline in the stock price.
Time horizon
Short-term
Likelihood
About as likely as not
Magnitude of impact
Medium-low
Potential financial impact
800000000
Explanation of financial impact
A one-yen decline in the stock price per share would result in total losses of corporate
value approximately 800 million yen as of December 31, 2017. It brings more difficult
access to capital.
Management method
In order to prevent decreasing in brand value, Bridgestone believes that it is important to
accurately disclose information on supply chain GHG. When disclosing GHG information,
we deem it crucial to 1) guarantee the reliability of information, 2) secure an information
disclosure method, and 3) secure a means of access to information for stakeholders.
Bridgestone also takes the following measures. 1) Guarantee of reliability of information:
We obtained a third-party verification of our 2017 calculation results through an external
organization and disclosed it. In addition, our environmental activities have won various
awards. This helped earn the trust of stakeholders as evaluation through the view of a
third party. 2) Method of information disclosure: Bridgestone thinks that it is possible to
meet stakeholder’s expectations by implementing the disclosure of information in
accordance with CDP requirements. By disclosing information connected with the
objective under long-term environmental vision, we have made the purpose of our

initiatives easily understandable. 3) Secure means of access to information for
stakeholders: For all stakeholders, we use our website and Global Sustainability Report to
make it possible for them to access information of our various activities.
Cost of management
29000000
Comment
Bridgestone spent approx. 29 million yen in 2017 in total for implementing measures
written in the “Management method” cell such as obtaining third-party verification of our
2017 GHG calculation results and issuing Sustainable Report.
Identifier
Risk 4
Where in the value chain does the risk driver occur?
Customer
Risk type
Transition risk
Primary climate-related risk driver
Technology: Unsuccessful investment in new technologies
Type of financial impact driver
Technology: Reduced demand for products and services
Company- specific description
Recently, various regulations have been introduced to curb climate change. With respect
to tires also, maximum limits on rolling resistance and the labelling system have been
introduced. Although tires do not emit GHG when they are used, passenger cars and
trucks emit a large volume of GHG. Improving fuel consumption, etc. would be a
countermeasure against such emissions. Although the fuel consumption of passenger
cars and trucks is determined by engine performance and various resistance factors,
among such factors, the impact of resistance by tire is said to be about 10-20% for
passenger cars and about 20-30% for trucks, though this depends on driving conditions.
Resistance by tire mentioned here is referred to as “rolling resistance” which is resistance
arising when a tire rolls. In other words, the same vehicle will have better fuel
consumption if the tire rolling resistance is low. As such, each country is adopting the
following systems as a measure to lower rolling resistance. 1. Set a maximum value for
rolling resistance and prohibit sale if this maximum value is exceeded. (Maximum limit) 2.
Grade rolling resistance according to 5-7 levels, and carry out labelling. Europe (EU
member states), South Korea, Brazil and the Middle East (GCC, Israel) have already
introduced the maximum limit and labelling systems, and Japan has introduced the
labelling system as a voluntary industry standard. In addition, Japan, Malaysia and other
countries have already decided to introduce the maximum limit system, and North
America, Thailand and countries in Asia and Oceania are considering the introduction of
one of the systems. Bridgestone considers that these systems are a risk to decrease
sales units if investment in new technology for better rolling resistance in align with other
performances including price is unsuccessful. Therefore, we are developing products with
better rolling resistance to prevent reduction of sales volume.
Time horizon
Short-term
Likelihood
Very likely
Magnitude of impact
High
Potential financial impact
30310000000
Explanation of financial impact
The global tire market is valued at approximately 151 billion US dollars in 2016
(Reference: Tire Business – Global Tire Company Rankings) and is expected to grow two
to three-fold by 2050. By considering the maximum limit and labelling system of rolling
resistance as an risk to bring financial impact. Tire sales in 2017 was about 3,031 billion
yen. We estimate ppotential financial impact to be 30.31 billion yen per 1% decreasing of
annual sales. The actual value depends on degree of sales decrease of tires not
satisfying fuel efficiency level required by future system.
Management method
The most important factor to prevent this risk is the development of technology for
reducing tire-rolling resistance. To this end, we are reducing rolling resistance by
developing technology for tires in overall focusing on the molecular structure of raw
materials, weight reduction, internal structure of tires, and tire groove configuration,
among other things. As one ahievement, we successfully developed the “Large and
Narrow concept tire” employing “ologic” technology which represents a new category of
tire that is completely different from previous tires, as a new tire environmental
technology. Tires that employ this new technology are able to realize levels of fuel
efficiency that greatly exceed those of the fuel-efficient tires Bridgestone has already put
on the market, and as a result, this is expected to reduce CO2 and occurrence of this risk.
Cost of management
83200000000
Comment
Bridgestone invests in development aiming to reduce rolling resistance every year. Tire’s
research and development expenses, including such investments, totaled 83.2 billion yen
in 2017.
C2.4
(C2.4) Have you identified any climate-related opportunities with the potential to have a
substantive financial or strategic impact on your business?
Yes

C2.4a
(C2.4a) Provide details of opportunities identified with the potential to have a substantive
financial or strategic impact on your business.
Identifier
Opp1
Where in the value chain does the opportunity occur?
Customer
Opportunity type
Products and services
Primary climate-related opportunity driver
Development and/or expansion of low emission goods and services
Type of financial impact driver
Increased revenue through demand for lower emissions products and services
Company- specific description
Recently, various regulations have been introduced with the purpose of curbing climate
change. With respect to tires also, maximum limits on rolling resistance and the labelling
system have been introduced. Although tires do not emit GHG when they are used,
passenger cars and trucks emit a large volume of GHG. Improving fuel consumption, etc.
would be a countermeasure against such emissions. Although the fuel consumption of
passenger cars and trucks is determined by engine performance and various resistance
factors, among such factors, the impact of resistance by tire is said to be about 10-20%
for passenger cars and about 20-30% for trucks, though this depends on driving
conditions. The tire resistance mentioned here is referred to as “rolling resistance” which
is resistance arising when a tire rolls. In other words, the same vehicle will have better
fuel consumption if the tire rolling resistance is low. As such, each country is adopting
the following systems as a measure to lower rolling resistance. 1. Set a maximum value
for rolling resistance and prohibit sale if this maximum value is exceeded. (Maximum
limit) 2. Grade rolling resistance according to 5-7 levels, and carry out labelling. For
example, several regions and countries such as Europe (EU member states), South Korea,
Brazil and the Middle East (GCC, Israel) have already introduced the maximum limit and
labelling systems, and Japan has introduced only the labelling system as a voluntary
industry standard. In addition, some of other countries also have already decided or are
considering to introduce such systems. Bridgestone considers these systems as an
opportunity to fairly disclose to consumers the maximum limit and grading of rolling
resistance of our products. From this viewpoint, we are developing products with better
rolling resistance and expanding sales volume.
Time horizon
Current
Likelihood
Very likely

Magnitude of impact
High
Potential financial impact
30310000000
Explanation of financial impact
The global tire market was valued at approximately 151 billion US dollars in 2016
(Reference: Tire Business – Global Tire Company Rankings) and is expected to grow two
to three-fold by 2050. By considering the maximum limit and labelling system of rolling
resistance as an opportunity and making use of such opportunity, there is huge financial
potential. Sales of tires, including fuel-efficient tires, were about 3,031 billion yen in 2017.
We estimate potential financial impact is 30.31 billion yen per 1% increasing of annual
sales. Its actual value depends on degree of sales increase by such fuel-efficient tires.
Strategy to realize opportunity
The most important factor in taking advantage of the maximum limit and labelling system
of rolling resistance as an opportunity is the development of technology for reducing tire-
rolling resistance. To this end, we are reducing rolling resistance by developing
technology for tires in overall focusing on the molecular structure of raw materials,
weight reduction, internal structure of tires, and tire groove configuration, among other
things. At the same time, Bridgestone is implementing the sales strategy of focusing on
expanding sales of “ECOPIA” tires with substantially lower rolling resistance as a global
brand. We successfully increased sales of “ECOPIA” brand products compared to sales at
the time of launch of this brand, and will continue to position this brand as an important
measure in the future. Also, we successfully developed the “Large and Narrow concept
tire” employing “ologic” technology which represents a new category of tire that is
completely different from previous tires, as a new tire environmental technology. Tires
that employ this new technology are able to realize levels of fuel efficiency that greatly
exceed those of the fuel-efficient tires Bridgestone has already put on the market, and as
a result, this is expected to reduce CO2.
Cost to realize opportunity
83200000000
Comment
Bridgestone invests in development aiming to reduce rolling resistance every year. Tire’s
research and development expenses, including such investments, totaled 83.2 billion yen
in 2017.
Identifier
Opp2
Where in the value chain does the opportunity occur?
Supply Chain
Opportunity type
Resilience
Primary climate-related opportunity driver
Resource substitutes/diversification
Type of financial impact driver
Increased reliability of supply chain and ability to operate under various conditions
Company- specific description
Currently, natural rubber, the main raw material of tires, is almost entirely made from the
sap of para rubber tree. 90% of growing area of para rubber tree is in Southeast Asia and
its price often fluctuates due to reason such as demand change, climate change and
speculation etc. Therefore, finding substitution of the material source will be one key
factor to enhance competitiveness and resilience of Bridgestone’s business. The
Bridgestone Group proactively conducts research and production of natural rubber
resources consisting of Guayule cultivated in arid climates and Russian Dandelion
cultivated in temperate climates as substitutes for para rubber tree. By doing so, we can
use this opportunity to differentiate ourselves in terms of diversity of raw material source
and cost competitiveness and supply of tires.
Time horizon
Medium-term
Likelihood
Likely
Magnitude of impact
Medium-high
Potential financial impact
207000000000
Explanation of financial impact
Financial impact to tire sales in case of change in Bridgestone’s share can be roughly
calculated as following formula. Financial impact = Current sales divided current share
multiplied percentage of change in share (about 207 billion yen per 1 % change in share).
*The calculation is based on approx. 3,021 billion yen as Bridgestone’s sales in tire
business and 14.6% as Bridgestone’s share in the tire industry in 2016
Strategy to realize opportunity
As a means of gaining opportunities, we have been promoting research and development
on alternative resources in other climatic zones aimed at easing the overconcentration of
natural rubber producing areas in Southeast Asia. 1. Guayule: The Bridgestone Group
conducts research and development of guayule as a new natural rubber source replacing
para rubber tree in order to alleviate the overconcentration of natural rubber production in
certain regions and stabilize supply. As guayule grows in arid regions, unlike para rubber
tree, and the rubber component contained in its tissue has similar properties to the
natural rubber harvested from the para rubber tree, it is expected to be a new natural
rubber source. We commenced experimental production of natural rubber harvested from
guayule in 2015 and are conducting studies for its practical application in the 2020s. 2.
Russian Dandelion: Russian Dandelion, a plant native to Kazakhstan and Uzbekistan, is a
material for natural rubber and is cultivated in temperate zones which are completely
different from the climate conditions for para rubber tree. Going forward, the Bridgestone
Group will actively conduct research and development of Russian Dandelion.
Cost to realize opportunity
99700000000

Comment
The entire research and development expenses on Group/Global basis, including
development of alternative resources such as Guayule and Russian Dandelion, totaled
99.7 billion yen per year in 2017.
Identifier
Opp3
Where in the value chain does the opportunity occur?
Customer
Opportunity type
Products and services
Primary climate-related opportunity driver
Shift in consumer preferences
Type of financial impact driver
Increased revenue through demand for lower emissions products and services
Company- specific description
As a consumption trend, demand for products with a low environmental impact is
expected to increase in the future, with retread tires expected to increase. Retread tires
refer to tires that are reused after removing used tire treads and applying freshly
vulcanized new treads. Since this process prolongs the life of tires, it leads to the
reduction of used tires and the reduction of CO2 emissions during tire production. In
addition, it results in the saving of tire expenses because it is less expensive than
purchasing new tires. In this connection, we provide a service known as ECO Value Pack.
ECO Value Pack bundles new tires, retread tires and tire maintenance service into a single
package for transport operators and other customers. This service contributes to
customers’ environmental management, improvement of vehicle fuel efficiency, reduction
of tire expenses, and enhancement of efficiency of customers’ tire related operations.
Time horizon
Current
Likelihood
Very likely
Magnitude of impact
Medium
Potential financial impact
7800000000
Explanation of financial impact
Regarding retread tires, we promote technological development (ensure durability,
increase the number of times retreaded, etc.) to advance resource saving, in addition to
aiming at a higher domestic retread tire sales ratio than the 2014 result in 2020. Annual
sales of Bridgestone Bandag Retread Manufacturing, a group company engaged in the
manufacture of retread tires in Japan, were approximately 7.8 billion yen (in 2017).
Strategy to realize opportunity

ECO Value Pack is our proprietary service that proposes the optimal combination of
maintenance and tire to solve issues that customers are facing. The combination of “new
tires, retread tires, and tire maintenance service” according to the actual status of usage
by customers contributes to “safe operation, environmental friendliness, cost reduction,
and enhancement of operational efficiency” for customers.
Cost to realize opportunity
83200000000
Comment
Bridgestone makes investments in technological development (ensure durability, increase
the number of times retreaded, etc.) to advance resource saving. Tire’s research and
development expenses, including such investments, totaled 83.2 billion yen in 2017.
C2.5
(C2.5) Describe where and how the identified risks and opportunities have impacted your
business.
Impact Description
Productsandservices
Impacted Tire industry has maximum limits on rolling resistance and the labelling system havebeen introduced. For Bridgestone, failing to respond to these systems could be a risk ofsales decline of ECO products, however, it also could be an opportunity to increase oursales of such products by improving rolling resistance of a tire. The potential of financialimpact to net sales is estimated 30.31 billion yen per 1% of our sales is increased bytaking the opportunity or decreased by occurrence of the risk. Since this risk impact isbig, Bridgestone provides products and services which can reduce customers' CO2emissions such as fuel-efficient tires, in order to take opportunities of product efficiencyregulations and standards, and changing consumer behavior toward low rolling resistancetires.
Supplychainand/orvaluechain
Impacted There is a risk of rubber supply shortage as climate pattern change in regions where pararubber tree grows and rubber production efficiency worsen. It can lead to lower profitbecause of higher rubber procurement cost. The actual impact is estimated 1.88 millionyen worldwide for every yen rise per tonne of natural and synthetic rubber, based on 2017production level. Since this risk impact is big, Bridgestone has Global SustainableProcurement Policy, which include commitment driving actions to realize long-termenvironmental benefits, to help identify and evaluate qualified suppliers, promote bestpractices on our value chain, and serve as a communication and improvement tool onenhancing CSR perspective on the supply chain among the industry.
Adaptationandmitigationactivities
Impacted There are discussions about introducing carbon pricing in many countries, and sinceBridgestone has facilities in over 20 countries, there is a possibility of increasingoperational cost. In case of Japan, the actual impact is estimated 935000 yen per 1 yenincrease in tax rate. Since this risk impact is not small, Bridgestone encourages energyefficient operations such as fuel conversions, LED introduction, etc. to reduce CO2emissions.
Investmentin R&D
Impacted Bridgestone encourages providing products and services which can contribute toreducing CO2 emissions, such as fuel-efficient tires, by introducing new technologies.There is a possibility of sales decrease in case of becoming less competitive because ofdelay in technology development. Since this risk impact is big, Bridgestone invests in R&Dfor eco-products/services, alternative materials in case of material shortage caused fromclimate-change. The entire research and development expense of the Global Grouptotaled 99.7 billion yen per year in 2017. Among that expense, tire’s research anddevelopment expenses totaled 83.2 billion yen in 2017.

Impact Description
Operations Impacted There is a risk of rubber supply shortage as climate pattern change in regions where pararubber tree grows and rubber production efficiency worsen. It can lead to lower profitbecause of higher rubber procurement cost. Since this risk impact is significant,Bridgestone has been promoting research and development on alternative resources inother climatic zones aimed at easing the overconcentration of natural rubber-producingareas in Southeast Asia. The entire research and development expenses on Global Groupbasis, including development of alternative resources such as Guayule and RussianDandelion, totaled 99.7 billion yen per year in 2017.
Other,pleasespecify
Pleaseselect
C2.6
(C2.6) Describe where and how the identified risks and opportunities have factored into your
financial planning process.
Relevance Description
Revenues Impacted In case climate change becomes worse and/or related regulation(s) becomes strict,sales of vehicles and demand for tires will be affected This is one major risk forBridgestone's revenue. It is also expected as opportunity that revenue from eco-products/services (i.e. our ECOPIA brand tires) is increased according to marketchange to low-carbon. The potential of financial impact is estimated 30.31 billion yenper 1% of our sales is increased by taking the opportunity or decreased by occurrenceof the risk.
Operatingcosts
Impacted In case of rubber supply shortage as climate pattern change in regions where pararubber tree grows or getting rubber production efficiency worse, rubber procurementcost becomes high. The actual impact is estimated 1.88 million yen worldwide forevery yen rise per tonne of natural and synthetic rubber, based on 2017 productionlevel. Since this risk impact is significant, Bridgestone has a Global SustainableProcurement Policy, which include commitment driving actions to realize long-termenvironmental benefits, to help identify and evaluate qualified suppliers, promote bestpractices on our value chain, and serve as a communication and improvement tool onenhancing CSR perspective on the supply chain among the industry.
Capitalexpenditures/ capitalallocation
Impacted The entire research and development expense of the Global Group including costs fordeveloping eco-related technology (i.e. developing tires with low rolling resistance),machines/equipment (i.e. tire building machine with low energy consumption) etc.totaled 99.7 billion yen per year in 2017. Among that expense, tire’s research anddevelopment expenses totaled 83.2 billion yen in 2017. Expenses and investmentsmainly for introducing equipment for energy saving, including upgrading them, atBridgestone plants amounted to 1,421million yen in 2017.
Acquisitionsanddivestments
Impacted In the process of considering acquisitions, various aspects are incorporated intoevaluation. CSR related factors including environmental viewpoint is one of suchaspects. In 2017, the process was applied to Bridgestone’s acquisition cases such asthat of Gaco Western in US, Ayme in France etc.
Access tocapital
Impacted Good result of external evaluation against Bridgestone from ESG perspective makesBridgestone easier or better access to capital by increasing investors' and lenders'confidence that the company's climate-related risks are appropriately assessed andmanaged. As of 2017, Bridgestone obtained relatively good score on some ofrepresentative index such as CDP, DJSI and these results brought us moreopportunities to access to capital. A one-yen increase in the stock price per sharewould result in total increase of corporate value approximately 800 million yen as ofDecember 31, 2017. It brings easier access to capital such as issuance of new shares.

Relevance Description
Assets Impacted Introducing machines/equipment to produce eco-products or to make resourceconsumption lower brought increasing of assets. Investments mainly for suchequipment, including upgrading equipment, at Bridgestone plants amounted to1,421million yen in 2017.
Liabilities Not yetimpacted
Bridgestone has an option to increase corporate liabilities for introducingmachines/equipment to produce eco-products or reducing resource consumption infuture. Additionally, in case carbon tax is newly introduced or tightened, financialimpact will be realized. In that sense, it could be “potential liabilities”. For example, ifJapan carbon tax rate increase, financial impact will be approx. 935 thousand yen/1yen increase in the tax rate.
Other Pleaseselect
C3. Business Strategy
C3.1
(C3.1) Are climate-related issues integrated into your business strategy?
Yes
C3.1a
(C3.1a) Does your organization use climate-related scenario analysis to inform your business
strategy?
No, but we anticipate doing so in the next two years
C3.1c
(C3.1c) Explain how climate-related issues are integrated into your business objectives and
strategy.
i) How the strategy has been influenced all global decision making regarding environment,
including climate change, is carried out by the Global CSR Enhancement Committee (GCEC).
Members of the committee are composed of an executive officer in charge of CSR and
representatives of regions and functions. Important decisions made by GCEC are reported
to Global Executive Committee (Global EXCO), Bridgestone’s body of global business
execution, and based on the management plan finalized at Global EXCO, Strategic Business
Units (SBUs) reflect it in each Five-Year Mid-term Management Plan. From viewpoint of our

countermeasure against climate change, Bridgestone established the “Environmental
Mission Statement” to contribute in aspects of circular economy, biodiversity and low
carbon society (including long-term target to reduce over 50% of our CO2 emission by 2050
and beyond), as a part of “the Bridgestone Essence framework” that is our corporate
philosophy. From the viewpoint of contribution through solving climate-related issues is
always incorporated into all our activities including planning and addressing of strategy.
ii) Explanation of whether business strategy links to an emissions reductions target or
energy reduction target
Bridgestone business strategy links to Environmental long-term vision and mid-term target
including emissions reductions target. Specifically, the long-term target is to reduce over
50% of our CO2 emission by 2050 and beyond, and the mid-term target is to reduce our CO2
emissions per sales from operations and products’ after-use by 35 percent vs 2005 by 2020.
Global Environmental Working Group summarizes progress of CO2 emissions reduction
target and next strategies to achieve the target and reports to Global CSR Enhancement
Committee (GCEC). GCEC then report them to G-EXCO, and G-EXCO finalizes a management
plan taking into account the report.
iii) The most substantial business decisions
Bridgestone decided to reorganize our R&D and manufacturing base located in Kodaira City,
Tokyo to accelerate technology and business model innovation for the future. We expect to
invest about 30 billion yen for this project, and the construction began in 2017. By
expanding R&D facilities and strengthening our R&D structure which supports products and
services on a global basis, we aim to create value through continuous innovations. Going
forward, we will promote R&D that contributes to mitigating climate change, such as
development of fuel-efficient tires and energy-saving technologies. Furthermore, we are
carrying out capital investment in Hikone Plant. As the flagship plant of the Group, Hikone
Plant aims to achieve by far the best competitiveness. In order to reduce CO2 emissions by
further enhancing quality and production efficiency, we are redesigning the plant’s
production lines, including a shift toward IT and automation, by introducing cutting-edge
technologies and equipment. We plan to invest roughly 15 billion yen in the plant. The
project at the Hikone Plant began in 2016 and is scheduled to conclude by 2020.
iv) Aspects of climate change influenced the strategy (e.g. need for adaptation, regulatory
changes, or opportunities to develop green business);
Need for adaptation influences Bridgestone strategy such as developing alternative
material in case of material shortage caused by climate change. Opportunities to develop
green business also influences strategies such as development of tires that contribute to
reduction of CO2 emissions from driving an automobile (through reduced rolling and air
resistance). In 2017, we succeeded developing and started to provide new ECOPIA tires

which can contribute to reducing CO2 emissions from driving with other high performance
such as wet and life.
v) The most important components of the short-term strategy Bridgestone defines the short
term to be affected by climate change as the period from the present up to 2020.
-Achievement of CO2 emission reduction targets throughout the whole Group, setting 2020
as the target year, with 2005 as the baseline. We back casted and drew up these targets
from long-term environmental vision, which are ideal conditions in 2050.
-Achievement in reduction of GHG emissions mainly by the improvement in production
efficiency and reduction of raw material losses at plants with an eye to regulatory
compliance and acquisition of emission rights
-Product development complying with product regulations and grading of each country
-Re-examination of product structure and line-up due to shifting consumer tendencies
associated with climate change.
-Needs of consumers, local residents and others in regard to climate change initiatives. In
particular, acceleration of development and expansion of sales of fuel-efficient tires.
vi) The most important components of the long-term strategy
Bridgestone defines the long term to be affected by climate change as the period from the
present up to 2050.
-Strengthening initiatives toward establishing a more sustainable society according to the
Bridgestone Group’s Environmental Mission Statement.
-As initiatives for realizing a low-carbon society, globally-agreed long-term target that
contributes to reducing GHG emissions of the whole world by at least 50% in the year 2050
and beyond.
-Re-examination of production sites controlled by the changes in weather conditions and
local regulations
-Development of lightweight products that consider changes in supplies and reserves of
raw material resources
-Development of fuel-efficient tires for which materials are controlled at nano level
vii) How this is gaining the company strategic advantage over competitors.

Our strategic advantages over competitors are as follows.
-Research and development capabilities for raw materials such as development of
biomass-derived synthetic rubber and solutions for controlling diseases and pests of rubber
trees
-Strategic planning from a long-term view up to 2050 based on long-term environmental
vision
-Planning and implementation of efficient and effective CO2 emission reduction measures
by having own sites in the entire supply chain from in-house production sites for raw
materials to production sites and sales within the Group
viii) How the Paris Agreement has influenced the business strategy
We are aware of Paris Agreement aiming to reach net zero CO2 emissions, considering
necessity of revision of strategies toward long-term environmental vision. In addition, it is
necessary to monitor and respond to social trend since there is a possibility of
establishment of measures such as carbon tax, to achieve each country’s reduction target
based on Paris Agreement.
C3.1g
(C3.1g) Why does your organization not use climate-related scenario analysis to inform your
business strategy?
We recognize and understand the need of TCFD scenario analysis. We are now considering
our post-2030 Environmental target and planning to establish it based on such scenario
analysis, clarifying impact of 2-degree scenario to our company, magnitude of related
things, direction that Bridgestone should take and so on.
C4. Targets and performance
C4.1
(C4.1) Did you have an emissions target that was active in the reporting year?
Both absolute and intensity targets

C4.1a
(C4.1a) Provide details of your absolute emissions target(s) and progress made against
those targets.
Target reference number
Abs 1
Scope
Scope 1 +2 (market-based)
% emissions in Scope
100
% reduction from base year
50
Base year
2005
Start year
2010
Base year emissions covered by target (metric tons CO2e)
4570763
Target year
2050
Is this a science-based target?
No, but we anticipate setting one in the next 2 years
% achieved (emissions)
13.7
Target status
Underway
Please explain
Target of Bridgestone Long-term Vision is to contribute to globally-agreed target (over
50% reduction of CO2 emissions).The globally-agreed target currently refers to agreement
of G8 in Toyako summit in 2008, to reduce at least 50% global GHG emissions.
Target reference number
Abs 2
Scope
Other, please specify (CO2 emission excess our contribution)
The second absolute target covers the CO2 emission amount by operations and products’ after-use excess our contribution from avoided emissions when our customers use thetires by improving fuel efficiency of our tires.

% emissions in Scope
100
% reduction from base year
100
Base year
2005
Start year
2010
Base year emissions covered by target (metric tons CO2e)
15733000
Target year
2020
Is this a science-based target?
No, but we anticipate setting one in the next 2 years
% achieved (emissions)
86
Target status
Underway
Please explain
The Bridgestone Group is working to achieve its mid-term targets to reduce the volume of
CO2 emissions over the entire lifecycle of a tire(15,733kt-CO2 in 2005). Considering the
value when CO2 emissions from operations and products’ after-use are offset by
contribution of CO2 reduction at usage stage, the reduction in 2017 was 86% (compared
to 2005). We are continuing activities with a dual approach aimed at achieving that
contribution to CO2 reduction during use exceeds CO2 emissions from our operations
and products’ after-use by 2020.
C4.1b
(C4.1b) Provide details of your emissions intensity target(s) and progress made against
those target(s).
Target reference number
Int 1
Scope
Other, please specify (Scope 1+2+3)
The target covers Scope 1+2(Market-based method + location-basedmethod)+3(Purchased goods & services, Upstream transportation & distribution,

Downstream transportation and distribution, End-of-life treatment of sold products,Upstream leased assets)
% emissions in Scope
100
% reduction from baseline year
35
Metric
Metric tons CO2e per unit revenue
Base year
2005
Start year
2010
Normalized baseline year emissions covered by target (metric tons CO2e)
585
Target year
2020
Is this a science-based target?
No, but we anticipate setting one in the next 2 years
% achieved (emissions)
100
Target status
Underway
Please explain
Focusing on the lifecycle of the Group’s products, we are working to reduce sales
intensity of CO2 emitted in the manufacturing process from raw material procurement to
production, logistics, and products’ after-use. CO2 intensity of the base year is 585
tCO2/hundred million yen. Individual targets/measures are considered by each business
division for achieving our overall objective, and progress is being made toward the
objective. The results thereof are compiled at the CSR, Environment and Quality
Management Planning Division and the status of objective achievement is reviewed at
Global EXCO.
% change anticipated in absolute Scope 1+2 emissions
-12
% change anticipated in absolute Scope 3 emissions
-12
C4.2

(C4.2) Provide details of other key climate-related targets not already reported in question
C4.1/a/b.
C4.3
(C4.3) Did you have emissions reduction initiatives that were active within the reporting
year? Note that this can include those in the planning and/or implementation phases.
Yes
C4.3a
(C4.3a) Identify the total number of projects at each stage of development, and for those in
the implementation stages, the estimated CO2e savings.
Number ofprojects
Total estimated annual CO2e savings in metric tonnes CO2e (only forrows marked *)
Under investigation 102
To be implemented* 242 14420
Implementationcommenced*
168 10797
Implemented* 119 1096
Not to be implemented 0
C4.3b
(C4.3b) Provide details on the initiatives implemented in the reporting year in the table
below.
Activity type
Energy efficiency: Building fabric
Description of activity
Other, please specify (Insulation and maintainance)
Improving energy efficiency at tire plants by insulating buildings and equipment and bymaintenance of them, etc.
Estimated annual CO2e savings (metric tonnes CO2e)
4575
Scope
Scope 1
Scope 2 (market-based)

Voluntary/Mandatory
Voluntary
Annual monetary savings (unit currency – as specified in CC0.4)
202000000
Investment required (unit currency – as specified in CC0.4)
1009000000
Payback period
4 - 10 years
Estimated lifetime of the initiative
6-10 years
Comment
Activity type
Energy efficiency: Building services
Description of activity
Other, please specify (HVAC, lighting etc.)
Improving energy efficiency at tire plants and offices by improving HVAC, lighting such asinstalling LED, etc.
Estimated annual CO2e savings (metric tonnes CO2e)
2717
Scope
Scope 1
Scope 2 (market-based)
Voluntary/Mandatory
Voluntary
Annual monetary savings (unit currency – as specified in CC0.4)
155000000
Investment required (unit currency – as specified in CC0.4)
776000000
Payback period
4 - 10 years
Estimated lifetime of the initiative
6-10 years
Comment
Activity type
Energy efficiency: Processes
Description of activity

Other, please specify (Switching fuel, optimizing process, etc.)
Improving energy efficiency at tire plants by replacing equipment with efficientequipment, switching fuel, optimizing process, etc.
Estimated annual CO2e savings (metric tonnes CO2e)
25687
Scope
Scope 1
Scope 2 (market-based)
Voluntary/Mandatory
Voluntary
Annual monetary savings (unit currency – as specified in CC0.4)
1911000000
Investment required (unit currency – as specified in CC0.4)
9557000000
Payback period
4 - 10 years
Estimated lifetime of the initiative
6-10 years
Comment
Activity type
Low-carbon energy purchase
Description of activity
Natural Gas
Estimated annual CO2e savings (metric tonnes CO2e)
7183
Scope
Scope 1
Scope 2 (market-based)
Voluntary/Mandatory
Voluntary
Annual monetary savings (unit currency – as specified in CC0.4)
44000000
Investment required (unit currency – as specified in CC0.4)
220000000
Payback period
4 - 10 years
Estimated lifetime of the initiative

6-10 years
Comment
Activity type
Process emissions reductions
Description of activity
Changes in operations
Estimated annual CO2e savings (metric tonnes CO2e)
228
Scope
Scope 1
Scope 2 (market-based)
Voluntary/Mandatory
Voluntary
Annual monetary savings (unit currency – as specified in CC0.4)
29480000
Investment required (unit currency – as specified in CC0.4)
147400000
Payback period
4 - 10 years
Estimated lifetime of the initiative
6-10 years
Comment
C4.3c
(C4.3c) What methods do you use to drive investment in emissions reduction activities?
Method Comment
Other Relevant divisions report the emission costs and reduction benefits of CO2-related measures in thebudgetary discussions, and investment decisions on capital expenditure are made for overalloptimization. Management examines the business plans in the yearly mid-term plan, but carefullyreviews investment projects based on Investment Profit Criteria taking into account the CO2 emissioncosts and reduction benefits as the criteria at that time. Based on the EUA price, CO2 emissions areconverted into monetary value and incorporated into the Investment Profit Criteria using the DiscountedCash Flow method and used as one of the indexes for investment decisions. Both aspects of costincrease and decrease resulting from CO2 emission increase/decrease are considered for decisionmaking.

C4.5
(C4.5) Do you classify any of your existing goods and/or services as low-carbon products or
do they enable a third party to avoid GHG emissions?
Yes
C4.5a
(C4.5a) Provide details of your products and/or services that you classify as low-carbon
products or that enable a third party to avoid GHG emissions.
Level of aggregation
Company-wide
Description of product/Group of products
Fuel-efficient tires: Tires that have reduced tire rolling resistance which influences vehicle
fuel efficiency. A wide-ranging lineup is available, from passenger car tires to tires for
trucks/buses and industrial vehicles, and the design facilitates rolling in order to enhance
fuel efficiency. Specifically, through the use of NanoPro-Tech which exercises control
over the fine structure of materials, we are striving to reduce rolling resistance by
reducing energy loss and controlling heat generation of tread rubber.
Are these low-carbon product(s) or do they enable avoided emissions?
Avoided emissions
Taxonomy, project or methodology used to classify product(s) as low-carbon or to
calculate avoided emissions
Other, please specify (LCA method of the Japan)
% revenue from low carbon product(s) in the reporting year
72
Comment
CO2 reduction using fuel-efficient tires during the product use stage. Reasons for the
possibility of reduction: Improvement of tire rolling efficiency can contribute to fuel
efficiency improvement/CO2reduction when customers use one’s vehicles. Since the tire
fuel efficiency or its standards differ by country, we approximate CO2 emissions. When
we calculate based on Tyre LCCO2 Calculation Guidelines published by JATMA, due to
reduction in tire rolling resistance, it contributed about 11,700,000 tons of CO2 reduction
in 2017 compared with the products in 2005.
Level of aggregation
Group of products
Description of product/Group of products

Commercial roofing and building envelope solutions such as energy-saving polyiso
insulations, roofing membranes, vegetative roofing solutions, airtight building envelope
systems, etc. which qualify for LEED credits and contribute to healthy, high-performance
construction.
Are these low-carbon product(s) or do they enable avoided emissions?
Avoided emissions
Taxonomy, project or methodology used to classify product(s) as low-carbon or to
calculate avoided emissions
Other, please specify (LEED)
Leadership in Energy and Environmental Design (LEED)
% revenue from low carbon product(s) in the reporting year
Comment
C5. Emissions methodology
C5.1
(C5.1) Provide your base year and base year emissions (Scopes 1 and 2).
Scope 1
Base year start
January 1 2005
Base year end
December 31 2005
Base year emissions (metric tons CO2e)
2303629
Comment
Scope 2 (location-based)
Base year start
Base year end
Base year emissions (metric tons CO2e)
Comment
Scope 2 (market-based)

Base year start
January 1 2005
Base year end
December 31 2005
Base year emissions (metric tons CO2e)
2267134
Comment
C5.2
(C5.2) Select the name of the standard, protocol, or methodology you have used to collect
activity data and calculate Scope 1 and Scope 2 emissions.
Japan Ministry of the Environment, Law Concerning the Promotion of the Measures to Cope
with Global Warming, Superceded by Revision of the Act on Promotion of Global Warming
Countermeasures (2005 Amendment)
The Greenhouse Gas Protocol: A Corporate Accounting and Reporting Standard (Revised
Edition)
C6. Emissions data
C6.1
(C6.1) What were your organization’s gross global Scope 1 emissions in metric tons CO2e?
Row 1
Gross global Scope 1 emissions (metric tons CO2e)
1921690
End-year of reporting period
<Not Applicable>
Comment
Row 2
Gross global Scope 1 emissions (metric tons CO2e)
<Not Applicable>
End-year of reporting period
<Not Applicable>

Comment
<Not Applicable>
Row 3
Gross global Scope 1 emissions (metric tons CO2e)
<Not Applicable>
End-year of reporting period
<Not Applicable>
Comment
<Not Applicable>
Row 4
Gross global Scope 1 emissions (metric tons CO2e)
<Not Applicable>
End-year of reporting period
<Not Applicable>
Comment
<Not Applicable>
C6.2
(C6.2) Describe your organization’s approach to reporting Scope 2 emissions.
Row 1
Scope 2, location-based
We are reporting a Scope 2, location-based figure
Scope 2, market-based
We are reporting a Scope 2, market-based figure
Comment
C6.3
(C6.3) What were your organization’s gross global Scope 2 emissions in metric tons CO2e?
Row 1
Scope 2, location-based
2349337
Scope 2, market-based (if applicable)
2335966

End-year of reporting period
<Not Applicable>
Comment
Row 2
Scope 2, location-based
<Not Applicable>
Scope 2, market-based (if applicable)
<Not Applicable>
End-year of reporting period
<Not Applicable>
Comment
<Not Applicable>
Row 3
Scope 2, location-based
<Not Applicable>
Scope 2, market-based (if applicable)
<Not Applicable>
End-year of reporting period
<Not Applicable>
Comment
<Not Applicable>
Row 4
Scope 2, location-based
<Not Applicable>
Scope 2, market-based (if applicable)
<Not Applicable>
End-year of reporting period
<Not Applicable>
Comment
<Not Applicable>
C6.4
(C6.4) Are there any sources (e.g. facilities, specific GHGs, activities, geographies, etc.) of
Scope 1 and Scope 2 emissions that are within your selected reporting boundary which are
not included in your disclosure?

Yes
C6.4a
(C6.4a) Provide details of the sources of Scope 1 and Scope 2 emissions that are within your
selected reporting boundary which are not included in your disclosure.
Source
GHGs except CO2
Relevance of Scope 1 emissions from this source
Emissions are not relevant
Relevance of location-based Scope 2 emissions from this source
Emissions are not relevant
Relevance of market-based Scope 2 emissions from this source (if applicable)
Emissions are not relevant
Explain why the source is excluded
At production sites in Japan and the Americas, GHGs except CO2 are collected but are
excluded because emissions are minimal relative to CO2.
Source
Production sites with number of workers below 50 people and is not the subject of
accreditation of ISO14001
Relevance of Scope 1 emissions from this source
Emissions are not relevant
Relevance of location-based Scope 2 emissions from this source
Emissions are not relevant
Relevance of market-based Scope 2 emissions from this source (if applicable)
Emissions are not relevant
Explain why the source is excluded
The reasons why production sites, which are sites with number of workers below 50
people and are not the subject of accreditation of ISO14001, are excluded is because
their influence on the total is very limited.
Source
Office/storages etc., nonproduction sites (supplementary facilities of plants are
excluded)
Relevance of Scope 1 emissions from this source
Emissions are not relevant
Relevance of location-based Scope 2 emissions from this source
Emissions are not relevant
Relevance of market-based Scope 2 emissions from this source (if applicable)
Emissions are not relevant
Explain why the source is excluded
Office energy is collected at major sites but is excluded because emissions are minimal.
Source
Company owned car
Relevance of Scope 1 emissions from this source
Emissions are not relevant
Relevance of location-based Scope 2 emissions from this source
Emissions are not relevant
Relevance of market-based Scope 2 emissions from this source (if applicable)
Emissions are not relevant
Explain why the source is excluded
Refilling company owned cars outside the premises is excluded because their influence
on the total is very limited. (Refilling fuel within the premises is included in Scopes)
C6.5
(C6.5) Account for your organization’s Scope 3 emissions, disclosing and explaining any
exclusions.
Purchased goods and services
Evaluation status
Relevant, calculated
Metric tonnes CO2e
7765918
Emissions calculation methodology
Calculated by multiplying the purchased amount of each raw material with CO2 emission
factors for each raw material determined by Japan Rubber Manufacturers Association
calculation methods.
Percentage of emissions calculated using data obtained from suppliers or value chain
partners
0
Explanation
Capital goods

Evaluation status
Relevant, calculated
Metric tonnes CO2e
749172
Emissions calculation methodology
Calculated by multiplying the capital expenditures material with CO2 emission factors
determined by Japanese Ministry of the Environment
Percentage of emissions calculated using data obtained from suppliers or value chain
partners
0
Explanation
Fuel-and-energy-related activities (not included in Scope 1 or 2)
Evaluation status
Relevant, calculated
Metric tonnes CO2e
684875
Emissions calculation methodology
Calculated by multiplying the energy consumption with CO2 emission factors determined
by DEFRA
Percentage of emissions calculated using data obtained from suppliers or value chain
partners
0
Explanation
Upstream transportation and distribution
Evaluation status
Relevant, calculated
Metric tonnes CO2e
434274
Emissions calculation methodology
[Ground transportation] Calculated by multiplying purchased amount of each raw material
with CO2 emission factors for each raw material determined by Japan Rubber
Manufacturers Association calculation methods. [Marine transportation] The result for
2008 is calculated based on the volume and distance of marine transportation with
respect to the CO2 emission factors of the GHG protocol for shipment. It is calculated as
a ratio of the purchased raw materials for 2016 and 2008.
Percentage of emissions calculated using data obtained from suppliers or value chain
partners
0
Explanation
Waste generated in operations
Evaluation status
Relevant, calculated
Metric tonnes CO2e
160223
Emissions calculation methodology
Calculated by multiplying the amount of waste generated with CO2 emission factors
determined by Japanese Ministry of the Environment
Percentage of emissions calculated using data obtained from suppliers or value chain
partners
0
Explanation
Business travel
Evaluation status
Relevant, calculated
Metric tonnes CO2e
18547
Emissions calculation methodology
Calculated by multiplying the number of employees with CO2 emission factors
determined by Japanese Ministry of the Environment
Percentage of emissions calculated using data obtained from suppliers or value chain
partners
0
Explanation
Employee commuting
Evaluation status
Relevant, calculated
Metric tonnes CO2e
65742
Emissions calculation methodology
Calculated by multiplying the number of employees with CO2 emission factors
determined by Japanese Ministry of the Environment
Percentage of emissions calculated using data obtained from suppliers or value chain
partners
0
Explanation
Upstream leased assets
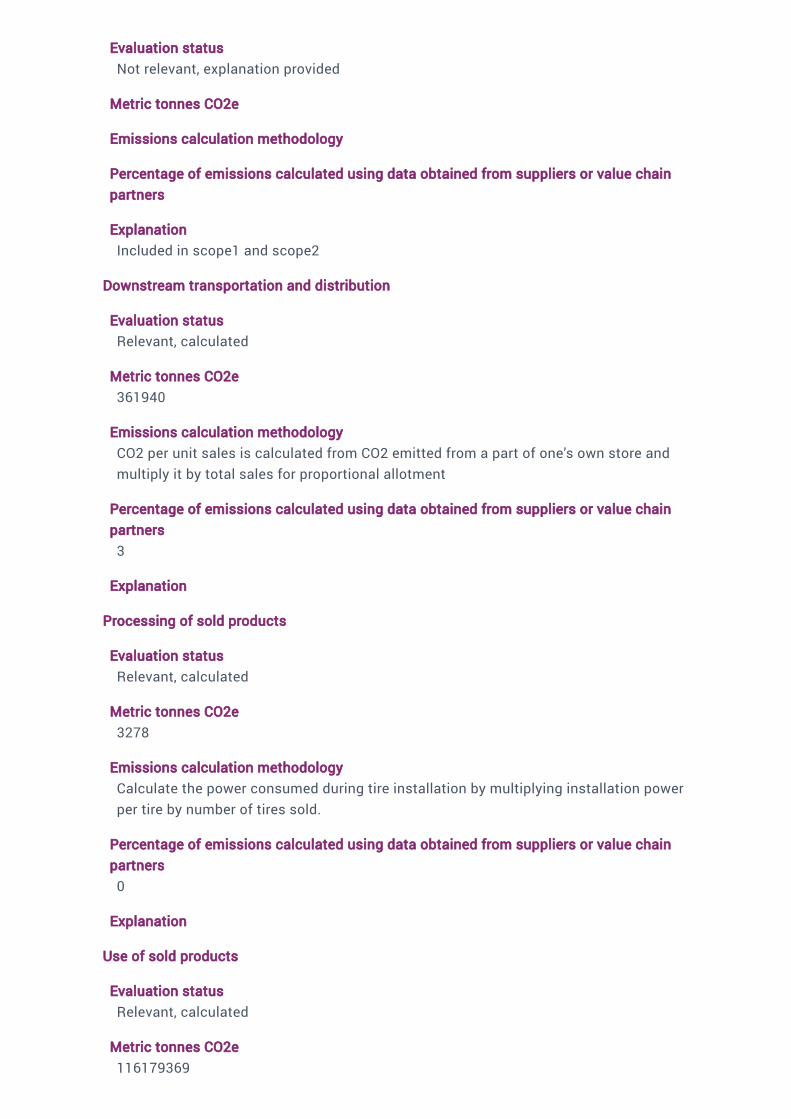
Evaluation status
Not relevant, explanation provided
Metric tonnes CO2e
Emissions calculation methodology
Percentage of emissions calculated using data obtained from suppliers or value chain
partners
Explanation
Included in scope1 and scope2
Downstream transportation and distribution
Evaluation status
Relevant, calculated
Metric tonnes CO2e
361940
Emissions calculation methodology
CO2 per unit sales is calculated from CO2 emitted from a part of one’s own store and
multiply it by total sales for proportional allotment
Percentage of emissions calculated using data obtained from suppliers or value chain
partners
3
Explanation
Processing of sold products
Evaluation status
Relevant, calculated
Metric tonnes CO2e
3278
Emissions calculation methodology
Calculate the power consumed during tire installation by multiplying installation power
per tire by number of tires sold.
Percentage of emissions calculated using data obtained from suppliers or value chain
partners
0
Explanation
Use of sold products
Evaluation status
Relevant, calculated
Metric tonnes CO2e
116179369

Emissions calculation methodology
Calculated from our Tyre sales unit and CO2 emission per 1 tire when it used based on
”Tyre LCCO2 Calculation Guidelines Ver. 2.0" by The Japan Automobile Tyre
Manufacturers Association, Inc. April 2012
Percentage of emissions calculated using data obtained from suppliers or value chain
partners
0
Explanation
End of life treatment of sold products
Evaluation status
Relevant, calculated
Metric tonnes CO2e
2107586
Emissions calculation methodology
Calculated by multiplying the purchased quantity of each raw material with CO2 emission
factors determined by Japan Rubber Manufacturers Association calculation methods.
Percentage of emissions calculated using data obtained from suppliers or value chain
partners
0
Explanation
Downstream leased assets
Evaluation status
Not relevant, explanation provided
Metric tonnes CO2e
Emissions calculation methodology
Percentage of emissions calculated using data obtained from suppliers or value chain
partners
Explanation
Bridgestone had no leased assets in 2017.
Franchises
Evaluation status
Relevant, calculated
Metric tonnes CO2e
353492
Emissions calculation methodology
Calculate by multiplying CO2 emission per typical shop by the number of franchise shops
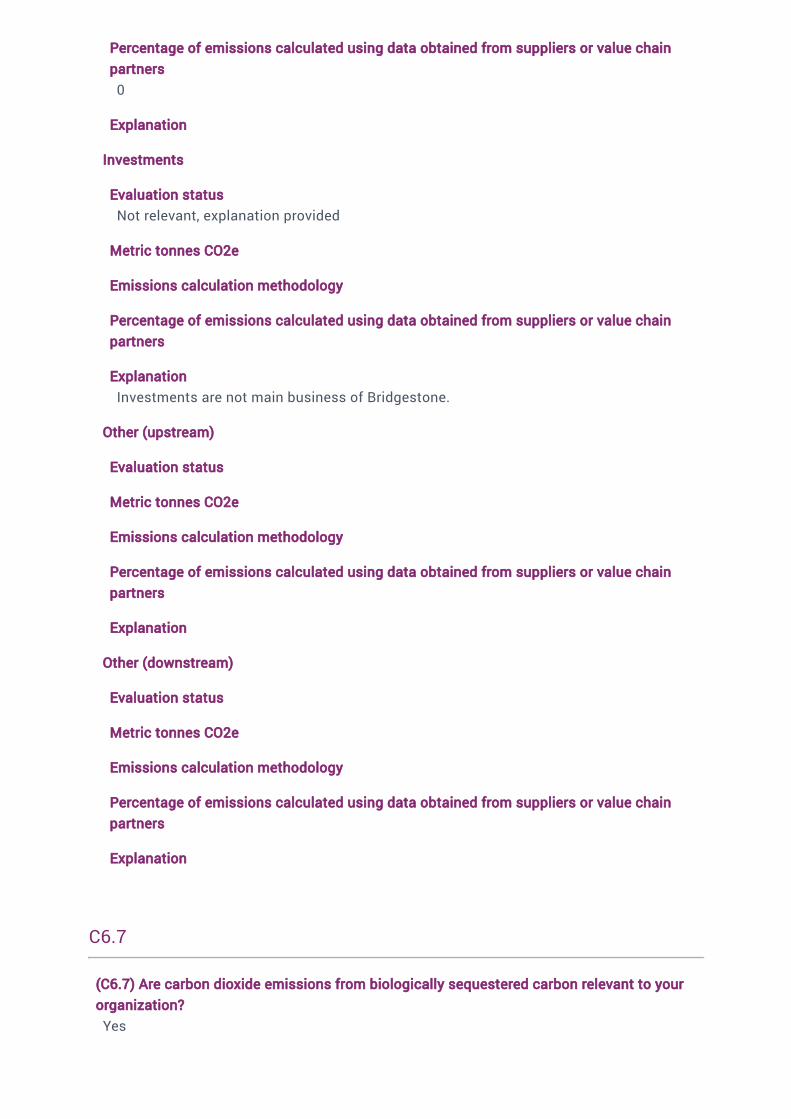
Percentage of emissions calculated using data obtained from suppliers or value chain
partners
0
Explanation
Investments
Evaluation status
Not relevant, explanation provided
Metric tonnes CO2e
Emissions calculation methodology
Percentage of emissions calculated using data obtained from suppliers or value chain
partners
Explanation
Investments are not main business of Bridgestone.
Other (upstream)
Evaluation status
Metric tonnes CO2e
Emissions calculation methodology
Percentage of emissions calculated using data obtained from suppliers or value chain
partners
Explanation
Other (downstream)
Evaluation status
Metric tonnes CO2e
Emissions calculation methodology
Percentage of emissions calculated using data obtained from suppliers or value chain
partners
Explanation
C6.7
(C6.7) Are carbon dioxide emissions from biologically sequestered carbon relevant to your
organization?
Yes
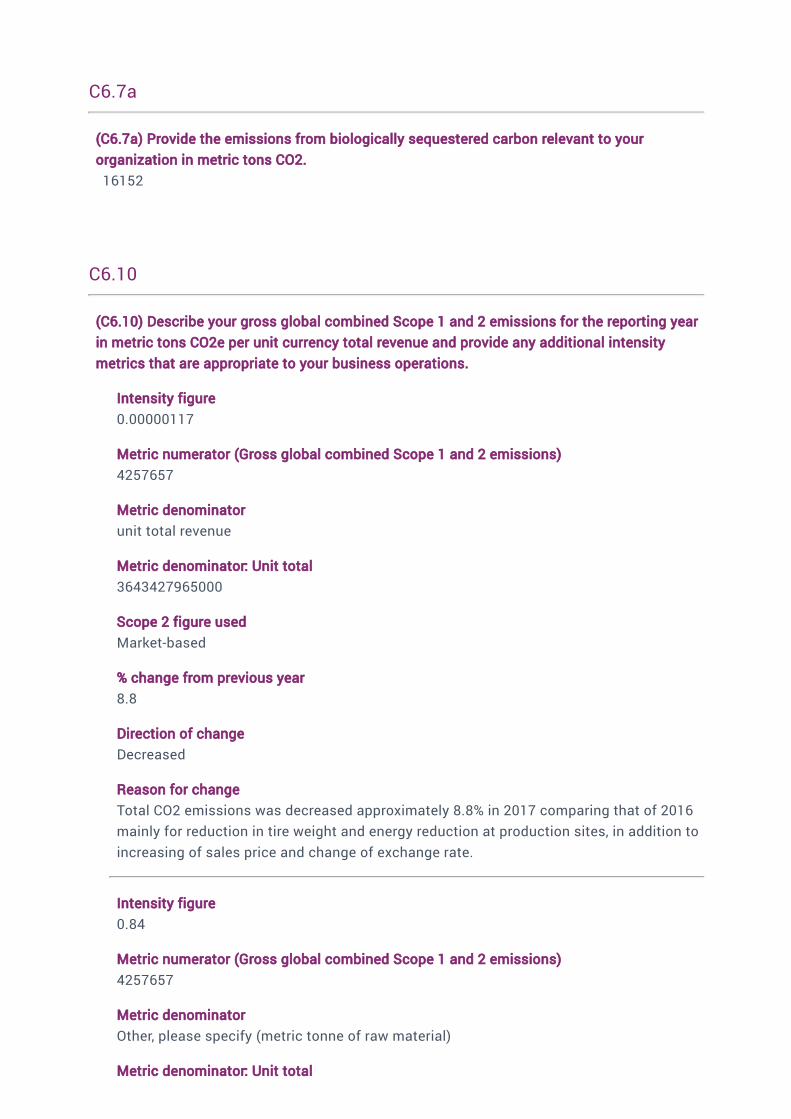
C6.7a
(C6.7a) Provide the emissions from biologically sequestered carbon relevant to your
organization in metric tons CO2.
16152
C6.10
(C6.10) Describe your gross global combined Scope 1 and 2 emissions for the reporting year
in metric tons CO2e per unit currency total revenue and provide any additional intensity
metrics that are appropriate to your business operations.
Intensity figure
0.00000117
Metric numerator (Gross global combined Scope 1 and 2 emissions)
4257657
Metric denominator
unit total revenue
Metric denominator: Unit total
3643427965000
Scope 2 figure used
Market-based
% change from previous year
8.8
Direction of change
Decreased
Reason for change
Total CO2 emissions was decreased approximately 8.8% in 2017 comparing that of 2016
mainly for reduction in tire weight and energy reduction at production sites, in addition to
increasing of sales price and change of exchange rate.
Intensity figure
0.84
Metric numerator (Gross global combined Scope 1 and 2 emissions)
4257657
Metric denominator
Other, please specify (metric tonne of raw material)
Metric denominator: Unit total

5039000
Scope 2 figure used
Market-based
% change from previous year
4.5
Direction of change
Decreased
Reason for change
Result of emission reduction activities
C7. Emissions breakdowns
C7.1
(C7.1) Does your organization have greenhouse gas emissions other than carbon dioxide?
No
C7.2
(C7.2) Break down your total gross global Scope 1 emissions by country/region.
Country/Region Scope 1 emissions (metric tons CO2e)
United States of America 404651.33
Canada 25162.08
Mexico 132018.26
Costa Rica 14823.1
Argentina 21423.62
Brazil 69021.13
France 0
Belgium 4541.85
Spain 45948.43
Poland 16236.14
Italy 24074.49
Hungary 11497.4
United Kingdom of Great Britain and Northern Ireland 384.62
Turkey 23227.68
South Africa 57473.14

Country/Region Scope 1 emissions (metric tons CO2e)
Liberia 9531.8
Thailand 241032.68
Indonesia 173325.14
Taiwan (Province of China) 8941.46
India 21332.81
Australia 78.54
Malaysia 59.39
Philippines 51.6
Viet Nam 5767.68
China 78895.23
Japan 532190.54
C7.3
(C7.3) Indicate which gross global Scope 1 emissions breakdowns you are able to provide.
By business division
C7.3a
(C7.3a) Break down your total gross global Scope 1 emissions by business division.
Business division Scope 1 emissions (metric ton CO2e)
Tire 1745430
Others 176260
C7.5
(C7.5) Break down your total gross global Scope 2 emissions by country/region.
Country/Region Scope 2,location-based (metrictons CO2e)
Scope 2,market-based(metric tonsCO2e)
Purchased andconsumed electricity,heat, steam or cooling(MWh)
Purchased and consumed low-carbonelectricity, heat, steam or coolingaccounted in market-based approach(MWh)
United States ofAmerica
636969.16 671741.89 1470720.76 0
Canada 18237.7 18237.7 144171.57 0
Mexico 62901.93 62901.93 137671.1 0
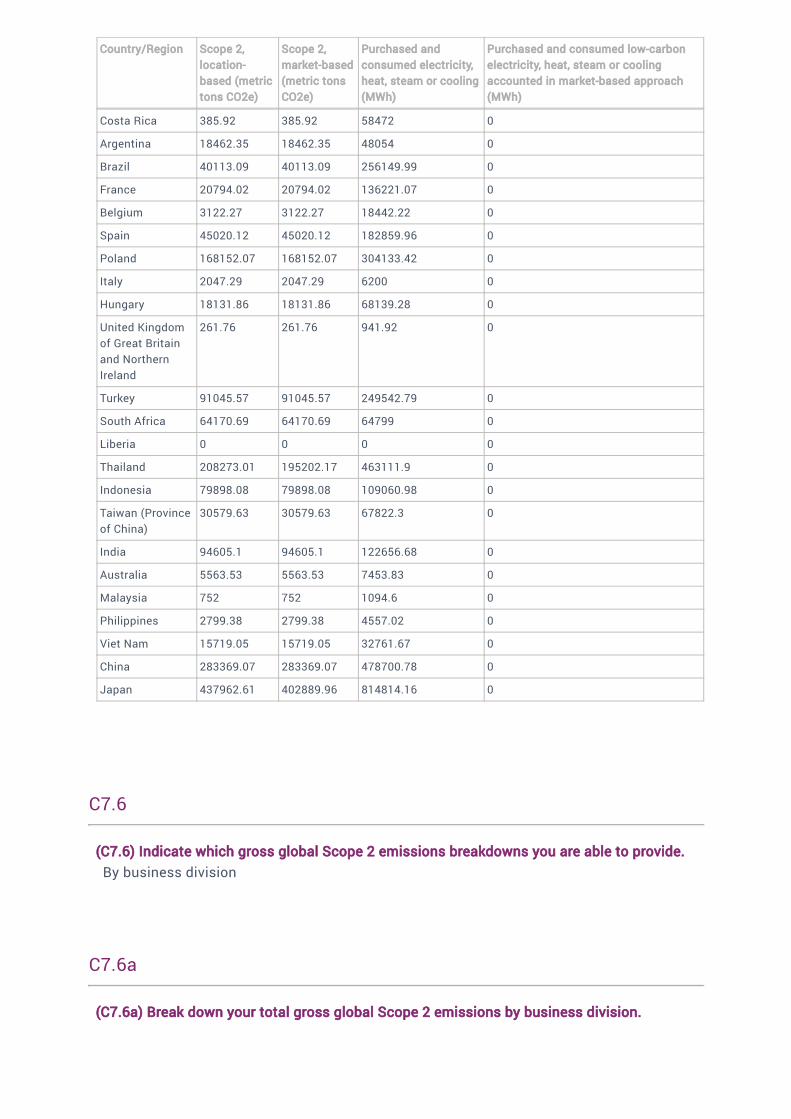
Country/Region Scope 2,location-based (metrictons CO2e)
Scope 2,market-based(metric tonsCO2e)
Purchased andconsumed electricity,heat, steam or cooling(MWh)
Purchased and consumed low-carbonelectricity, heat, steam or coolingaccounted in market-based approach(MWh)
Costa Rica 385.92 385.92 58472 0
Argentina 18462.35 18462.35 48054 0
Brazil 40113.09 40113.09 256149.99 0
France 20794.02 20794.02 136221.07 0
Belgium 3122.27 3122.27 18442.22 0
Spain 45020.12 45020.12 182859.96 0
Poland 168152.07 168152.07 304133.42 0
Italy 2047.29 2047.29 6200 0
Hungary 18131.86 18131.86 68139.28 0
United Kingdomof Great Britainand NorthernIreland
261.76 261.76 941.92 0
Turkey 91045.57 91045.57 249542.79 0
South Africa 64170.69 64170.69 64799 0
Liberia 0 0 0 0
Thailand 208273.01 195202.17 463111.9 0
Indonesia 79898.08 79898.08 109060.98 0
Taiwan (Provinceof China)
30579.63 30579.63 67822.3 0
India 94605.1 94605.1 122656.68 0
Australia 5563.53 5563.53 7453.83 0
Malaysia 752 752 1094.6 0
Philippines 2799.38 2799.38 4557.02 0
Viet Nam 15719.05 15719.05 32761.67 0
China 283369.07 283369.07 478700.78 0
Japan 437962.61 402889.96 814814.16 0
C7.6
(C7.6) Indicate which gross global Scope 2 emissions breakdowns you are able to provide.
By business division
C7.6a
(C7.6a) Break down your total gross global Scope 2 emissions by business division.

Businessdivision
Scope 2, location-based emissions (metric tonsCO2e)
Scope 2, market-based emissions (metric tonsCO2e)
Businessdivision
Scope 2, location-based emissions (metric tonsCO2e)
Scope 2, market-based emissions (metric tonsCO2e)
Tires 2092614 2072063
Others 256723 263903
C7.9
(C7.9) How do your gross global emissions (Scope 1 and 2 combined) for the reporting year
compare to those of the previous reporting year?
Decreased
C7.9a
(C7.9a) Identify the reasons for any change in your gross global emissions (Scope 1 and 2
combined) and for each of them specify how your emissions compare to the previous year.
Change inemissions(metrictons CO2e)
Direction ofchange
Emissionsvalue(percentage)
Please explain calculation
Change inrenewableenergyconsumption
<NotApplicable>
Otheremissionsreductionactivities
1096 Decreased 0.03 We reduced 1,096 tons as a result of energy-savingactivities in 2017. Since Scope 1 and 2 emissions were4,275,577 tons the previous year, that represents a 0.03%reduction from 2017.
Divestment <NotApplicable>
Acquisitions <NotApplicable>
Mergers <NotApplicable>
Change inoutput
<NotApplicable>
Change inmethodology
177438 Decreased 4.15 Electricity emission factors was updated to the latestfigures. The values on the left was difference betweenScope1 + 2(Market-based) emission in 2017 with the latestelectricity emission factors and that with the factors ofprevious year.
Change inboundary
<NotApplicable>
Change inphysicaloperatingconditions
<NotApplicable>

Change inemissions(metrictons CO2e)
Direction ofchange
Emissionsvalue(percentage)
Please explain calculation
Unidentified <NotApplicable>
Other 160614 Increased 3.76 Due to changes in the composition of energy sources,change in production volume, etc.
C7.9b
(C7.9b) Are your emissions performance calculations in C7.9 and C7.9a based on a location-
based Scope 2 emissions figure or a market-based Scope 2 emissions figure?
Market-based
C8. Energy
C8.1
(C8.1) What percentage of your total operational spend in the reporting year was on energy?
More than 0% but less than or equal to 5%
C8.2
(C8.2) Select which energy-related activities your organization has undertaken.
Indicate whether your organization undertakes this energy-relatedactivity
Consumption of fuel (excluding feedstocks) Yes
Consumption of purchased or acquiredelectricity
Yes
Consumption of purchased or acquired heat No
Consumption of purchased or acquiredsteam
Yes
Consumption of purchased or acquiredcooling
No
Generation of electricity, heat, steam, orcooling
Yes

C8.2a
(C8.2a) Report your organization’s energy consumption totals (excluding feedstocks) in
MWh.
Heating value MWh fromrenewable sources
MWh from non-renewable sources
Total MWh
Consumption of fuel (excludingfeedstock)
LHV (lowerheating value)
7627 7657575 7665202
Consumption of purchased oracquired electricity
<NotApplicable>
0 4801714 4801714
Consumption of purchased oracquired heat
<NotApplicable>
<Not Applicable> <Not Applicable> <NotApplicable>
Consumption of purchased oracquired steam
<NotApplicable>
0 446839 446839
Consumption of purchased oracquired cooling
<NotApplicable>
<Not Applicable> <Not Applicable> <NotApplicable>
Consumption of self-generated non-fuel renewable energy
<NotApplicable>
41000 <Not Applicable> 41000
Total energy consumption <NotApplicable>
48627 12906128 12954755
C8.2b
(C8.2b) Select the applications of your organization’s consumption of fuel.
Indicate whether your organization undertakes this fuelapplication
Consumption of fuel for the generation ofelectricity
Yes
Consumption of fuel for the generation of steam Yes
Consumption of fuel for the generation of cooling No
Consumption of fuel for co-generation or tri-generation
Yes
C8.2c
(C8.2c) State how much fuel in MWh your organization has consumed (excluding
feedstocks) by fuel type.
Fuels (excluding feedstocks)

Motor Gasoline
Heating value
LHV (lower heating value)
Total fuel MWh consumed by the organization
18259
MWh fuel consumed for the self-generation of electricity
0
MWh fuel consumed for self-generation of heat
18259
MWh fuel consumed for self-generation of steam
0
MWh fuel consumed for self-generation of cooling
<Not Applicable>
MWh fuel consumed for self- cogeneration or self-trigeneration
0
Fuels (excluding feedstocks)
Kerosene
Heating value
LHV (lower heating value)
Total fuel MWh consumed by the organization
5859
MWh fuel consumed for the self-generation of electricity
0
MWh fuel consumed for self-generation of heat
5859
MWh fuel consumed for self-generation of steam
0
MWh fuel consumed for self-generation of cooling
<Not Applicable>
MWh fuel consumed for self- cogeneration or self-trigeneration
0
Fuels (excluding feedstocks)
Diesel
Heating value
LHV (lower heating value)
Total fuel MWh consumed by the organization

123347
MWh fuel consumed for the self-generation of electricity
61673
MWh fuel consumed for self-generation of heat
49339
MWh fuel consumed for self-generation of steam
12335
MWh fuel consumed for self-generation of cooling
<Not Applicable>
MWh fuel consumed for self- cogeneration or self-trigeneration
0
Fuels (excluding feedstocks)
Fuel Oil Number 4
We put information about Heavy Oil A as Fuel Oil No.4
Heating value
HHV (higher heating value)
Total fuel MWh consumed by the organization
56062
MWh fuel consumed for the self-generation of electricity
0
MWh fuel consumed for self-generation of heat
0
MWh fuel consumed for self-generation of steam
56062
MWh fuel consumed for self-generation of cooling
<Not Applicable>
MWh fuel consumed for self- cogeneration or self-trigeneration
0
Fuels (excluding feedstocks)
Fuel Oil Number 6
We put information about Heavy Oil B/C as Fuel Oil No.6
Heating value
HHV (higher heating value)
Total fuel MWh consumed by the organization
259576

MWh fuel consumed for the self-generation of electricity
0
MWh fuel consumed for self-generation of heat
0
MWh fuel consumed for self-generation of steam
259576
MWh fuel consumed for self-generation of cooling
<Not Applicable>
MWh fuel consumed for self- cogeneration or self-trigeneration
0
Fuels (excluding feedstocks)
Liquefied Petroleum Gas (LPG)
Heating value
HHV (higher heating value)
Total fuel MWh consumed by the organization
142409
MWh fuel consumed for the self-generation of electricity
0
MWh fuel consumed for self-generation of heat
142409
MWh fuel consumed for self-generation of steam
0
MWh fuel consumed for self-generation of cooling
<Not Applicable>
MWh fuel consumed for self- cogeneration or self-trigeneration
0
Fuels (excluding feedstocks)
Liquefied Natural Gas (LNG)
Heating value
LHV (lower heating value)
Total fuel MWh consumed by the organization
615310
MWh fuel consumed for the self-generation of electricity
0
MWh fuel consumed for self-generation of heat
74056

MWh fuel consumed for self-generation of steam
296225
MWh fuel consumed for self-generation of cooling
<Not Applicable>
MWh fuel consumed for self- cogeneration or self-trigeneration
245029
Fuels (excluding feedstocks)
Town Gas
Heating value
LHV (lower heating value)
Total fuel MWh consumed by the organization
1006137
MWh fuel consumed for the self-generation of electricity
0
MWh fuel consumed for self-generation of heat
63624
MWh fuel consumed for self-generation of steam
254495
MWh fuel consumed for self-generation of cooling
<Not Applicable>
MWh fuel consumed for self- cogeneration or self-trigeneration
688018
Fuels (excluding feedstocks)
Natural Gas
Heating value
LHV (lower heating value)
Total fuel MWh consumed by the organization
4823050
MWh fuel consumed for the self-generation of electricity
0
MWh fuel consumed for self-generation of heat
877530
MWh fuel consumed for self-generation of steam
3510122
MWh fuel consumed for self-generation of cooling
<Not Applicable>

MWh fuel consumed for self- cogeneration or self-trigeneration
435398
Fuels (excluding feedstocks)
Coal
Heating value
LHV (lower heating value)
Total fuel MWh consumed by the organization
194576
MWh fuel consumed for the self-generation of electricity
0
MWh fuel consumed for self-generation of heat
0
MWh fuel consumed for self-generation of steam
194576
MWh fuel consumed for self-generation of cooling
<Not Applicable>
MWh fuel consumed for self- cogeneration or self-trigeneration
0
Fuels (excluding feedstocks)
Other, please specify (Carbon fuel oil)
Heating value
HHV (higher heating value)
Total fuel MWh consumed by the organization
420618
MWh fuel consumed for the self-generation of electricity
119724
MWh fuel consumed for self-generation of heat
300894
MWh fuel consumed for self-generation of steam
0
MWh fuel consumed for self-generation of cooling
<Not Applicable>
MWh fuel consumed for self- cogeneration or self-trigeneration
0
C8.2d
(C8.2d) List the average emission factors of the fuels reported in C8.2c.
Acetylene
Emission factor
<Not Applicable>
Unit
<Not Applicable>
Emission factor source
<Not Applicable>
Comment
<Not Applicable>
Agricultural Waste
Emission factor
<Not Applicable>
Unit
<Not Applicable>
Emission factor source
<Not Applicable>
Comment
<Not Applicable>
Alternative Kiln Fuel (Wastes)
Emission factor
<Not Applicable>
Unit
<Not Applicable>
Emission factor source
<Not Applicable>
Comment
<Not Applicable>
Animal Fat
Emission factor
<Not Applicable>
Unit
<Not Applicable>

Emission factor source
<Not Applicable>
Comment
<Not Applicable>
Animal/Bone Meal
Emission factor
<Not Applicable>
Unit
<Not Applicable>
Emission factor source
<Not Applicable>
Comment
<Not Applicable>
Anthracite Coal
Emission factor
<Not Applicable>
Unit
<Not Applicable>
Emission factor source
<Not Applicable>
Comment
<Not Applicable>
Asphalt
Emission factor
<Not Applicable>
Unit
<Not Applicable>
Emission factor source
<Not Applicable>
Comment
<Not Applicable>
Aviation Gasoline
Emission factor
<Not Applicable>
Unit
<Not Applicable>
Emission factor source
<Not Applicable>
Comment
<Not Applicable>
Bagasse
Emission factor
<Not Applicable>
Unit
<Not Applicable>
Emission factor source
<Not Applicable>
Comment
<Not Applicable>
Bamboo
Emission factor
<Not Applicable>
Unit
<Not Applicable>
Emission factor source
<Not Applicable>
Comment
<Not Applicable>
Basic Oxygen Furnace Gas (LD Gas)
Emission factor
<Not Applicable>
Unit
<Not Applicable>
Emission factor source
<Not Applicable>
Comment
<Not Applicable>
Biodiesel
Emission factor
<Not Applicable>
Unit
<Not Applicable>

Emission factor source
<Not Applicable>
Comment
<Not Applicable>
Biodiesel Tallow
Emission factor
<Not Applicable>
Unit
<Not Applicable>
Emission factor source
<Not Applicable>
Comment
<Not Applicable>
Biodiesel Waste Cooking Oil
Emission factor
<Not Applicable>
Unit
<Not Applicable>
Emission factor source
<Not Applicable>
Comment
<Not Applicable>
Bioethanol
Emission factor
<Not Applicable>
Unit
<Not Applicable>
Emission factor source
<Not Applicable>
Comment
<Not Applicable>
Biogas
Emission factor
<Not Applicable>
Unit
<Not Applicable>

Emission factor source
<Not Applicable>
Comment
<Not Applicable>
Biogasoline
Emission factor
<Not Applicable>
Unit
<Not Applicable>
Emission factor source
<Not Applicable>
Comment
<Not Applicable>
Biomass Municipal Waste
Emission factor
<Not Applicable>
Unit
<Not Applicable>
Emission factor source
<Not Applicable>
Comment
<Not Applicable>
Biomethane
Emission factor
<Not Applicable>
Unit
<Not Applicable>
Emission factor source
<Not Applicable>
Comment
<Not Applicable>
Bitumen
Emission factor
<Not Applicable>
Unit
<Not Applicable>

Emission factor source
<Not Applicable>
Comment
<Not Applicable>
Bituminous Coal
Emission factor
<Not Applicable>
Unit
<Not Applicable>
Emission factor source
<Not Applicable>
Comment
<Not Applicable>
Black Liquor
Emission factor
<Not Applicable>
Unit
<Not Applicable>
Emission factor source
<Not Applicable>
Comment
<Not Applicable>
Blast Furnace Gas
Emission factor
<Not Applicable>
Unit
<Not Applicable>
Emission factor source
<Not Applicable>
Comment
<Not Applicable>
Brown Coal Briquettes (BKB)
Emission factor
<Not Applicable>
Unit
<Not Applicable>
Emission factor source
<Not Applicable>
Comment
<Not Applicable>
Burning Oil
Emission factor
<Not Applicable>
Unit
<Not Applicable>
Emission factor source
<Not Applicable>
Comment
<Not Applicable>
Butane
Emission factor
<Not Applicable>
Unit
<Not Applicable>
Emission factor source
<Not Applicable>
Comment
<Not Applicable>
Butylene
Emission factor
<Not Applicable>
Unit
<Not Applicable>
Emission factor source
<Not Applicable>
Comment
<Not Applicable>
Charcoal
Emission factor
<Not Applicable>
Unit
<Not Applicable>

Emission factor source
<Not Applicable>
Comment
<Not Applicable>
Coal
Emission factor
2.1
Unit
metric tons CO2e per metric ton
Emission factor source
The Greenhouse Gas Protocol: A Corporate Accounting and Reporting Standard (Revised
Edition):Anthracite, Brown coal briquettes, Sub bituminous coal, Other bituminous coal
Comment
Coal Tar
Emission factor
<Not Applicable>
Unit
<Not Applicable>
Emission factor source
<Not Applicable>
Comment
<Not Applicable>
Coke
Emission factor
<Not Applicable>
Unit
<Not Applicable>
Emission factor source
<Not Applicable>
Comment
<Not Applicable>
Coke Oven Gas
Emission factor
<Not Applicable>
Unit
<Not Applicable>

Emission factor source
<Not Applicable>
Comment
<Not Applicable>
Coking Coal
Emission factor
<Not Applicable>
Unit
<Not Applicable>
Emission factor source
<Not Applicable>
Comment
<Not Applicable>
Compressed Natural Gas (CNG)
Emission factor
<Not Applicable>
Unit
<Not Applicable>
Emission factor source
<Not Applicable>
Comment
<Not Applicable>
Condensate
Emission factor
<Not Applicable>
Unit
<Not Applicable>
Emission factor source
<Not Applicable>
Comment
<Not Applicable>
Crude Oil
Emission factor
<Not Applicable>
Unit
<Not Applicable>
Emission factor source
<Not Applicable>
Comment
<Not Applicable>
Crude Oil Extra Heavy
Emission factor
<Not Applicable>
Unit
<Not Applicable>
Emission factor source
<Not Applicable>
Comment
<Not Applicable>
Crude Oil Heavy
Emission factor
<Not Applicable>
Unit
<Not Applicable>
Emission factor source
<Not Applicable>
Comment
<Not Applicable>
Crude Oil Light
Emission factor
<Not Applicable>
Unit
<Not Applicable>
Emission factor source
<Not Applicable>
Comment
<Not Applicable>
Diesel
Emission factor
2.67
Unit
kg CO2e per liter

Emission factor source
Facilities in Japan: Japan Ministry of the Environment, Law Concerning the Promotion of
the Measures to Cope with Global Warming, Superceded by Revision of the Act on
Promotion of Global Warming Countermeasures (2005 Amendment) Others:The
Greenhouse Gas Protocol: A Corporate Accounting and Reporting Standard (Revised
Edition)
Comment
Distillate Oil
Emission factor
<Not Applicable>
Unit
<Not Applicable>
Emission factor source
<Not Applicable>
Comment
<Not Applicable>
Dried Sewage Sludge
Emission factor
<Not Applicable>
Unit
<Not Applicable>
Emission factor source
<Not Applicable>
Comment
<Not Applicable>
Ethane
Emission factor
<Not Applicable>
Unit
<Not Applicable>
Emission factor source
<Not Applicable>
Comment
<Not Applicable>
Ethylene
Emission factor
<Not Applicable>

Unit
<Not Applicable>
Emission factor source
<Not Applicable>
Comment
<Not Applicable>
Fuel Gas
Emission factor
<Not Applicable>
Unit
<Not Applicable>
Emission factor source
<Not Applicable>
Comment
<Not Applicable>
Fuel Oil Number 1
Emission factor
<Not Applicable>
Unit
<Not Applicable>
Emission factor source
<Not Applicable>
Comment
<Not Applicable>
Fuel Oil Number 2
Emission factor
<Not Applicable>
Unit
<Not Applicable>
Emission factor source
<Not Applicable>
Comment
<Not Applicable>
Fuel Oil Number 4
Emission factor
2.71

Unit
kg CO2e per liter
Emission factor source
Japan Ministry of the Environment, Law Concerning the Promotion of the Measures to
Cope with Global Warming, Superceded by Revision of the Act on Promotion of Global
Warming Countermeasures (2005 Amendment)
Comment
We put information about Heavy Oil A as Fuel Oil No.4
Fuel Oil Number 5
Emission factor
<Not Applicable>
Unit
<Not Applicable>
Emission factor source
<Not Applicable>
Comment
<Not Applicable>
Fuel Oil Number 6
Emission factor
3
Unit
kg CO2e per liter
Emission factor source
Japan Ministry of the Environment, Law Concerning the Promotion of the Measures to
Cope with Global Warming, Superceded by Revision of the Act on Promotion of Global
Warming Countermeasures (2005 Amendment)
Comment
We put information about Heavy Oil B/C as Fuel Oil No.6
Gas Coke
Emission factor
<Not Applicable>
Unit
<Not Applicable>
Emission factor source
<Not Applicable>
Comment
<Not Applicable>

Gas Oil
Emission factor
<Not Applicable>
Unit
<Not Applicable>
Emission factor source
<Not Applicable>
Comment
<Not Applicable>
Gas Works Gas
Emission factor
<Not Applicable>
Unit
<Not Applicable>
Emission factor source
<Not Applicable>
Comment
<Not Applicable>
GCI Coal
Emission factor
<Not Applicable>
Unit
<Not Applicable>
Emission factor source
<Not Applicable>
Comment
<Not Applicable>
General Municipal Waste
Emission factor
<Not Applicable>
Unit
<Not Applicable>
Emission factor source
<Not Applicable>
Comment
<Not Applicable>

Grass
Emission factor
<Not Applicable>
Unit
<Not Applicable>
Emission factor source
<Not Applicable>
Comment
<Not Applicable>
Hardwood
Emission factor
<Not Applicable>
Unit
<Not Applicable>
Emission factor source
<Not Applicable>
Comment
<Not Applicable>
Heavy Gas Oil
Emission factor
<Not Applicable>
Unit
<Not Applicable>
Emission factor source
<Not Applicable>
Comment
<Not Applicable>
Hydrogen
Emission factor
<Not Applicable>
Unit
<Not Applicable>
Emission factor source
<Not Applicable>
Comment
<Not Applicable>

Industrial Wastes
Emission factor
<Not Applicable>
Unit
<Not Applicable>
Emission factor source
<Not Applicable>
Comment
<Not Applicable>
Isobutane
Emission factor
<Not Applicable>
Unit
<Not Applicable>
Emission factor source
<Not Applicable>
Comment
<Not Applicable>
Isobutylene
Emission factor
<Not Applicable>
Unit
<Not Applicable>
Emission factor source
<Not Applicable>
Comment
<Not Applicable>
Jet Gasoline
Emission factor
<Not Applicable>
Unit
<Not Applicable>
Emission factor source
<Not Applicable>
Comment
<Not Applicable>

Jet Kerosene
Emission factor
<Not Applicable>
Unit
<Not Applicable>
Emission factor source
<Not Applicable>
Comment
<Not Applicable>
Kerosene
Emission factor
2.49
Unit
kg CO2 per liter
Emission factor source
Facilities in Japan: Japan Ministry of the Environment, Law Concerning the Promotion of
the Measures to Cope with Global Warming, Superceded by Revision of the Act on
Promotion of Global Warming Countermeasures (2005 Amendment) Others:The
Greenhouse Gas Protocol: A Corporate Accounting and Reporting Standard (Revised
Edition)
Comment
Landfill Gas
Emission factor
<Not Applicable>
Unit
<Not Applicable>
Emission factor source
<Not Applicable>
Comment
<Not Applicable>
Light Distillate
Emission factor
<Not Applicable>
Unit
<Not Applicable>
Emission factor source
<Not Applicable>

Comment
<Not Applicable>
Lignite Coal
Emission factor
<Not Applicable>
Unit
<Not Applicable>
Emission factor source
<Not Applicable>
Comment
<Not Applicable>
Liquefied Natural Gas (LNG)
Emission factor
2.75
Unit
metric tons CO2e per metric ton
Emission factor source
Facilities in Japan: Japan Ministry of the Environment, Law Concerning the Promotion of
the Measures to Cope with Global Warming, Superceded by Revision of the Act on
Promotion of Global Warming Countermeasures (2005 Amendment) Others:The
Greenhouse Gas Protocol: A Corporate Accounting and Reporting Standard (Revised
Edition)
Comment
Liquefied Petroleum Gas (LPG)
Emission factor
3
Unit
metric tons CO2e per metric ton
Emission factor source
Japan Ministry of the Environment, Law Concerning the Promotion of the Measures to
Cope with Global Warming, Superceded by Revision of the Act on Promotion of Global
Warming Countermeasures (2005 Amendment)
Comment
Liquid Biofuel
Emission factor
<Not Applicable>
Unit

<Not Applicable>
Emission factor source
<Not Applicable>
Comment
<Not Applicable>
Lubricants
Emission factor
<Not Applicable>
Unit
<Not Applicable>
Emission factor source
<Not Applicable>
Comment
<Not Applicable>
Marine Fuel Oil
Emission factor
<Not Applicable>
Unit
<Not Applicable>
Emission factor source
<Not Applicable>
Comment
<Not Applicable>
Marine Gas Oil
Emission factor
<Not Applicable>
Unit
<Not Applicable>
Emission factor source
<Not Applicable>
Comment
<Not Applicable>
Metallurgical Coal
Emission factor
<Not Applicable>
Unit

<Not Applicable>
Emission factor source
<Not Applicable>
Comment
<Not Applicable>
Methane
Emission factor
<Not Applicable>
Unit
<Not Applicable>
Emission factor source
<Not Applicable>
Comment
<Not Applicable>
Motor Gasoline
Emission factor
2.27
Unit
kg CO2e per liter
Emission factor source
Facilities in Japan: Japan Ministry of the Environment, Law Concerning the Promotion of
the Measures to Cope with Global Warming, Superceded by Revision of the Act on
Promotion of Global Warming Countermeasures (2005 Amendment) Others:The
Greenhouse Gas Protocol: A Corporate Accounting and Reporting Standard (Revised
Edition)
Comment
Including Biogasoline
Naphtha
Emission factor
<Not Applicable>
Unit
<Not Applicable>
Emission factor source
<Not Applicable>
Comment
<Not Applicable>
Natural Gas

Emission factor
1.89
Unit
metric tons CO2e per m3
Emission factor source
Facilities in Japan: Japan Ministry of the Environment, Law Concerning the Promotion of
the Measures to Cope with Global Warming, Superceded by Revision of the Act on
Promotion of Global Warming Countermeasures (2005 Amendment) Others:The
Greenhouse Gas Protocol: A Corporate Accounting and Reporting Standard (Revised
Edition)
Comment
Natural Gas Liquids (NGL)
Emission factor
<Not Applicable>
Unit
<Not Applicable>
Emission factor source
<Not Applicable>
Comment
<Not Applicable>
Natural Gasoline
Emission factor
<Not Applicable>
Unit
<Not Applicable>
Emission factor source
<Not Applicable>
Comment
<Not Applicable>
Non-Biomass Municipal Waste
Emission factor
<Not Applicable>
Unit
<Not Applicable>
Emission factor source
<Not Applicable>
Comment

<Not Applicable>
Non-Biomass Waste
Emission factor
<Not Applicable>
Unit
<Not Applicable>
Emission factor source
<Not Applicable>
Comment
<Not Applicable>
Oil Sands
Emission factor
<Not Applicable>
Unit
<Not Applicable>
Emission factor source
<Not Applicable>
Comment
<Not Applicable>
Oil Shale
Emission factor
<Not Applicable>
Unit
<Not Applicable>
Emission factor source
<Not Applicable>
Comment
<Not Applicable>
Orimulsion
Emission factor
<Not Applicable>
Unit
<Not Applicable>
Emission factor source
<Not Applicable>
Comment

<Not Applicable>
Other Petroleum Gas
Emission factor
<Not Applicable>
Unit
<Not Applicable>
Emission factor source
<Not Applicable>
Comment
<Not Applicable>
Paraffin Waxes
Emission factor
<Not Applicable>
Unit
<Not Applicable>
Emission factor source
<Not Applicable>
Comment
<Not Applicable>
Patent Fuel
Emission factor
<Not Applicable>
Unit
<Not Applicable>
Emission factor source
<Not Applicable>
Comment
<Not Applicable>
PCI Coal
Emission factor
<Not Applicable>
Unit
<Not Applicable>
Emission factor source
<Not Applicable>
Comment

<Not Applicable>
Peat
Emission factor
<Not Applicable>
Unit
<Not Applicable>
Emission factor source
<Not Applicable>
Comment
<Not Applicable>
Pentanes Plus
Emission factor
<Not Applicable>
Unit
<Not Applicable>
Emission factor source
<Not Applicable>
Comment
<Not Applicable>
Petrochemical Feedstocks
Emission factor
<Not Applicable>
Unit
<Not Applicable>
Emission factor source
<Not Applicable>
Comment
<Not Applicable>
Petrol
Emission factor
<Not Applicable>
Unit
<Not Applicable>
Emission factor source
<Not Applicable>
Comment
<Not Applicable>
Petroleum Coke
Emission factor
<Not Applicable>
Unit
<Not Applicable>
Emission factor source
<Not Applicable>
Comment
<Not Applicable>
Petroleum Products
Emission factor
<Not Applicable>
Unit
<Not Applicable>
Emission factor source
<Not Applicable>
Comment
<Not Applicable>
Pitch
Emission factor
<Not Applicable>
Unit
<Not Applicable>
Emission factor source
<Not Applicable>
Comment
<Not Applicable>
Plastics
Emission factor
<Not Applicable>
Unit
<Not Applicable>
Emission factor source
<Not Applicable>
Comment

<Not Applicable>
Primary Solid Biomass
Emission factor
<Not Applicable>
Unit
<Not Applicable>
Emission factor source
<Not Applicable>
Comment
<Not Applicable>
Propane Gas
Emission factor
<Not Applicable>
Unit
<Not Applicable>
Emission factor source
<Not Applicable>
Comment
<Not Applicable>
Propane Liquid
Emission factor
<Not Applicable>
Unit
<Not Applicable>
Emission factor source
<Not Applicable>
Comment
<Not Applicable>
Propylene
Emission factor
<Not Applicable>
Unit
<Not Applicable>
Emission factor source
<Not Applicable>
Comment

<Not Applicable>
Refinery Feedstocks
Emission factor
<Not Applicable>
Unit
<Not Applicable>
Emission factor source
<Not Applicable>
Comment
<Not Applicable>
Refinery Gas
Emission factor
<Not Applicable>
Unit
<Not Applicable>
Emission factor source
<Not Applicable>
Comment
<Not Applicable>
Refinery Oil
Emission factor
<Not Applicable>
Unit
<Not Applicable>
Emission factor source
<Not Applicable>
Comment
<Not Applicable>
Residual Fuel Oil
Emission factor
<Not Applicable>
Unit
<Not Applicable>
Emission factor source
<Not Applicable>
Comment

<Not Applicable>
Road Oil
Emission factor
<Not Applicable>
Unit
<Not Applicable>
Emission factor source
<Not Applicable>
Comment
<Not Applicable>
SBP
Emission factor
<Not Applicable>
Unit
<Not Applicable>
Emission factor source
<Not Applicable>
Comment
<Not Applicable>
Shale Oil
Emission factor
<Not Applicable>
Unit
<Not Applicable>
Emission factor source
<Not Applicable>
Comment
<Not Applicable>
Sludge Gas
Emission factor
<Not Applicable>
Unit
<Not Applicable>
Emission factor source
<Not Applicable>
Comment

<Not Applicable>
Softwood
Emission factor
<Not Applicable>
Unit
<Not Applicable>
Emission factor source
<Not Applicable>
Comment
<Not Applicable>
Solid Biomass Waste
Emission factor
<Not Applicable>
Unit
<Not Applicable>
Emission factor source
<Not Applicable>
Comment
<Not Applicable>
Special Naphtha
Emission factor
<Not Applicable>
Unit
<Not Applicable>
Emission factor source
<Not Applicable>
Comment
<Not Applicable>
Still Gas
Emission factor
<Not Applicable>
Unit
<Not Applicable>
Emission factor source
<Not Applicable>
Comment

<Not Applicable>
Straw
Emission factor
<Not Applicable>
Unit
<Not Applicable>
Emission factor source
<Not Applicable>
Comment
<Not Applicable>
Subbituminous Coal
Emission factor
<Not Applicable>
Unit
<Not Applicable>
Emission factor source
<Not Applicable>
Comment
<Not Applicable>
Sulphite Lyes
Emission factor
<Not Applicable>
Unit
<Not Applicable>
Emission factor source
<Not Applicable>
Comment
<Not Applicable>
Tar
Emission factor
<Not Applicable>
Unit
<Not Applicable>
Emission factor source
<Not Applicable>
Comment

<Not Applicable>
Tar Sands
Emission factor
<Not Applicable>
Unit
<Not Applicable>
Emission factor source
<Not Applicable>
Comment
<Not Applicable>
Thermal Coal
Emission factor
<Not Applicable>
Unit
<Not Applicable>
Emission factor source
<Not Applicable>
Comment
<Not Applicable>
Thermal Coal Commercial
Emission factor
<Not Applicable>
Unit
<Not Applicable>
Emission factor source
<Not Applicable>
Comment
<Not Applicable>
Thermal Coal Domestic
Emission factor
<Not Applicable>
Unit
<Not Applicable>
Emission factor source
<Not Applicable>
Comment

<Not Applicable>
Thermal Coal Industrial
Emission factor
<Not Applicable>
Unit
<Not Applicable>
Emission factor source
<Not Applicable>
Comment
<Not Applicable>
Tires
Emission factor
<Not Applicable>
Unit
<Not Applicable>
Emission factor source
<Not Applicable>
Comment
<Not Applicable>
Town Gas
Emission factor
2.23
Unit
metric tons CO2e per m3
Emission factor source
Facilities in Japan: Japan Ministry of the Environment, Law Concerning the Promotion of
the Measures to Cope with Global Warming, Superceded by Revision of the Act on
Promotion of Global Warming Countermeasures (2005 Amendment) Others:The
Greenhouse Gas Protocol: A Corporate Accounting and Reporting Standard (Revised
Edition)
Comment
Unfinished Oils
Emission factor
<Not Applicable>
Unit
<Not Applicable>
Emission factor source

<Not Applicable>
Comment
<Not Applicable>
Vegetable Oil
Emission factor
<Not Applicable>
Unit
<Not Applicable>
Emission factor source
<Not Applicable>
Comment
<Not Applicable>
Waste Oils
Emission factor
<Not Applicable>
Unit
<Not Applicable>
Emission factor source
<Not Applicable>
Comment
<Not Applicable>
Waste Paper and Card
Emission factor
<Not Applicable>
Unit
<Not Applicable>
Emission factor source
<Not Applicable>
Comment
<Not Applicable>
Waste Plastics
Emission factor
<Not Applicable>
Unit
<Not Applicable>
Emission factor source

<Not Applicable>
Comment
<Not Applicable>
Waste Tires
Emission factor
<Not Applicable>
Unit
<Not Applicable>
Emission factor source
<Not Applicable>
Comment
<Not Applicable>
White Spirit
Emission factor
<Not Applicable>
Unit
<Not Applicable>
Emission factor source
<Not Applicable>
Comment
<Not Applicable>
Wood
Emission factor
<Not Applicable>
Unit
<Not Applicable>
Emission factor source
<Not Applicable>
Comment
<Not Applicable>
Wood Chips
Emission factor
<Not Applicable>
Unit
<Not Applicable>
Emission factor source

<Not Applicable>
Comment
<Not Applicable>
Wood Logs
Emission factor
<Not Applicable>
Unit
<Not Applicable>
Emission factor source
<Not Applicable>
Comment
<Not Applicable>
Wood Pellets
Emission factor
<Not Applicable>
Unit
<Not Applicable>
Emission factor source
<Not Applicable>
Comment
<Not Applicable>
Wood Waste
Emission factor
<Not Applicable>
Unit
<Not Applicable>
Emission factor source
<Not Applicable>
Comment
<Not Applicable>
Other
Emission factor
3.31
Unit
metric tons CO2e per metric ton
Emission factor source

Measured value of carbon content ratio of the fuel
Comment
Information of "carbon fuel oil" is shown in this row
C8.2e
(C8.2e) Provide details on the electricity, heat, steam, and cooling your organization has
generated and consumed in the reporting year.
Total Grossgeneration(MWh)
Generation that isconsumed by theorganization (MWh)
Gross generationfrom renewablesources (MWh)
Generation from renewable sourcesthat is consumed by theorganization (MWh)
Electricity 700752 674384 642 642
Heat 1233639 1233639 0 0
Steam 4273333 4273333 40448 40448
Cooling 0 0 0 0
C8.2f
(C8.2f) Provide details on the electricity, heat, steam and/or cooling amounts that were
accounted for at a low-carbon emission factor in the market-based Scope 2 figure reported
in C6.3.
Basis for applying a low-carbon emission factor
Off-grid energy consumption from an on-site installation or through a direct line to an off-
site generator owned by another company
Low-carbon technology type
Solar PV
Biomass (including biogas)
MWh consumed associated with low-carbon electricity, heat, steam or cooling
41000
Emission factor (in units of metric tons CO2e per MWh)
0
Comment
We utilized steam generated with biomass boiler and electricity generated with solar
power.

C9. Additional metrics
C9.1
(C9.1) Provide any additional climate-related metrics relevant to your business.
C10. Verification
C10.1
(C10.1) Indicate the verification/assurance status that applies to your reported emissions.
Verification/assurance status
Scope 1 Third-party verification or assurance process in place
Scope 2 (location-based or market-based) Third-party verification or assurance process in place
Scope 3 Third-party verification or assurance process in place
C10.1a
(C10.1a) Provide further details of the verification/assurance undertaken for your Scope 1
and/or Scope 2 emissions and attach the relevant statements.
Scope
Scope 1
Verification or assurance cycle in place
Annual process
Status in the current reporting year
Complete
Type of verification or assurance
Limited assurance
Attach the statement
GHGVerificationReport_Bridgestone2018_Eng_180518.pdf
Page/ section reference

Page 1/1
Relevant standard
ISO14064-3
Proportion of reported emissions verified (%)
100
Scope
Scope 2 market-based
Verification or assurance cycle in place
Annual process
Status in the current reporting year
Complete
Type of verification or assurance
Limited assurance
Attach the statement
GHGVerificationReport_Bridgestone2018_Eng_180518.pdf
Page/ section reference
Page 1/1
Relevant standard
ISO14064-3
Proportion of reported emissions verified (%)
100
C10.1b
(C10.1b) Provide further details of the verification/assurance undertaken for your Scope 3
emissions and attach the relevant statements.
Scope
Scope 3- all relevant categories
Verification or assurance cycle in place
Annual process
Status in the current reporting year
Complete
Attach the statement
GHGVerificationReport_Bridgestone2018_Eng_180518.pdf
Page/section reference

Page 1/1
Relevant standard
ISO14064-3
C10.2
(C10.2) Do you verify any climate-related information reported in your CDP disclosure other
than the emissions figures reported in C6.1, C6.3, and C6.5?
Yes
C10.2a
(C10.2a) Which data points within your CDP disclosure have been verified, and which
verification standards were used?
Disclosuremoduleverificationrelates to
Data verified Verificationstandard
Please explain
C6.Emissionsdata
Other, pleasespecify (Energyconsumption)
ISAE3000 Energy consumption, which is used to calculate Scope 1 and 2, isverified.Sustainability_VerificationReport_Bridgestone2018_Eng_180518.pdf
C11. Carbon pricing
C11.1
(C11.1) Are any of your operations or activities regulated by a carbon pricing system (i.e.
ETS, Cap & Trade or Carbon Tax)?
Yes
C11.1a
(C11.1a) Select the carbon pricing regulation(s) which impacts your operations.
EU ETS

Japan carbon tax
C11.1b
(C11.1b) Complete the following table for each of the emissions trading systems in which
you participate.
Alberta SGER
% of Scope 1 emissions covered by the ETS
<Not Applicable>
Period start date
<Not Applicable>
Period end date
<Not Applicable>
Allowances allocated
<Not Applicable>
Allowances purchased
<Not Applicable>
Verified emissions in metric tons CO2e
<Not Applicable>
Details of ownership
<Not Applicable>
Comment
<Not Applicable>
Australia ERF Safeguard Mechanism
% of Scope 1 emissions covered by the ETS
<Not Applicable>
Period start date
<Not Applicable>
Period end date
<Not Applicable>
Allowances allocated
<Not Applicable>
Allowances purchased
<Not Applicable>
Verified emissions in metric tons CO2e
<Not Applicable>

Details of ownership
<Not Applicable>
Comment
<Not Applicable>
BC GGIRCA
% of Scope 1 emissions covered by the ETS
<Not Applicable>
Period start date
<Not Applicable>
Period end date
<Not Applicable>
Allowances allocated
<Not Applicable>
Allowances purchased
<Not Applicable>
Verified emissions in metric tons CO2e
<Not Applicable>
Details of ownership
<Not Applicable>
Comment
<Not Applicable>
Beijing pilot ETS
% of Scope 1 emissions covered by the ETS
<Not Applicable>
Period start date
<Not Applicable>
Period end date
<Not Applicable>
Allowances allocated
<Not Applicable>
Allowances purchased
<Not Applicable>
Verified emissions in metric tons CO2e
<Not Applicable>
Details of ownership
<Not Applicable>
Comment

<Not Applicable>
California CaT
% of Scope 1 emissions covered by the ETS
<Not Applicable>
Period start date
<Not Applicable>
Period end date
<Not Applicable>
Allowances allocated
<Not Applicable>
Allowances purchased
<Not Applicable>
Verified emissions in metric tons CO2e
<Not Applicable>
Details of ownership
<Not Applicable>
Comment
<Not Applicable>
China national ETS
% of Scope 1 emissions covered by the ETS
<Not Applicable>
Period start date
<Not Applicable>
Period end date
<Not Applicable>
Allowances allocated
<Not Applicable>
Allowances purchased
<Not Applicable>
Verified emissions in metric tons CO2e
<Not Applicable>
Details of ownership
<Not Applicable>
Comment
<Not Applicable>
Chongqing pilot ETS

% of Scope 1 emissions covered by the ETS
<Not Applicable>
Period start date
<Not Applicable>
Period end date
<Not Applicable>
Allowances allocated
<Not Applicable>
Allowances purchased
<Not Applicable>
Verified emissions in metric tons CO2e
<Not Applicable>
Details of ownership
<Not Applicable>
Comment
<Not Applicable>
EU ETS
% of Scope 1 emissions covered by the ETS
5.3
Period start date
January 1 2017
Period end date
December 31 2017
Allowances allocated
70562
Allowances purchased
11633
Verified emissions in metric tons CO2e
101902
Details of ownership
Facilities we own and operate
Comment
Fujian pilot ETS
% of Scope 1 emissions covered by the ETS
<Not Applicable>
Period start date
<Not Applicable>

Period end date
<Not Applicable>
Allowances allocated
<Not Applicable>
Allowances purchased
<Not Applicable>
Verified emissions in metric tons CO2e
<Not Applicable>
Details of ownership
<Not Applicable>
Comment
<Not Applicable>
Guangdong pilot ETS
% of Scope 1 emissions covered by the ETS
<Not Applicable>
Period start date
<Not Applicable>
Period end date
<Not Applicable>
Allowances allocated
<Not Applicable>
Allowances purchased
<Not Applicable>
Verified emissions in metric tons CO2e
<Not Applicable>
Details of ownership
<Not Applicable>
Comment
<Not Applicable>
Hubei pilot ETS
% of Scope 1 emissions covered by the ETS
<Not Applicable>
Period start date
<Not Applicable>
Period end date
<Not Applicable>
Allowances allocated

<Not Applicable>
Allowances purchased
<Not Applicable>
Verified emissions in metric tons CO2e
<Not Applicable>
Details of ownership
<Not Applicable>
Comment
<Not Applicable>
Kazakhstan ETS
% of Scope 1 emissions covered by the ETS
<Not Applicable>
Period start date
<Not Applicable>
Period end date
<Not Applicable>
Allowances allocated
<Not Applicable>
Allowances purchased
<Not Applicable>
Verified emissions in metric tons CO2e
<Not Applicable>
Details of ownership
<Not Applicable>
Comment
<Not Applicable>
Korea ETS
% of Scope 1 emissions covered by the ETS
<Not Applicable>
Period start date
<Not Applicable>
Period end date
<Not Applicable>
Allowances allocated
<Not Applicable>
Allowances purchased
<Not Applicable>
Verified emissions in metric tons CO2e
<Not Applicable>
Details of ownership
<Not Applicable>
Comment
<Not Applicable>
Massachusetts state ETS
% of Scope 1 emissions covered by the ETS
<Not Applicable>
Period start date
<Not Applicable>
Period end date
<Not Applicable>
Allowances allocated
<Not Applicable>
Allowances purchased
<Not Applicable>
Verified emissions in metric tons CO2e
<Not Applicable>
Details of ownership
<Not Applicable>
Comment
<Not Applicable>
New Zealand ETS
% of Scope 1 emissions covered by the ETS
<Not Applicable>
Period start date
<Not Applicable>
Period end date
<Not Applicable>
Allowances allocated
<Not Applicable>
Allowances purchased
<Not Applicable>
Verified emissions in metric tons CO2e
<Not Applicable>
Details of ownership

<Not Applicable>
Comment
<Not Applicable>
Ontario CaT
% of Scope 1 emissions covered by the ETS
<Not Applicable>
Period start date
<Not Applicable>
Period end date
<Not Applicable>
Allowances allocated
<Not Applicable>
Allowances purchased
<Not Applicable>
Verified emissions in metric tons CO2e
<Not Applicable>
Details of ownership
<Not Applicable>
Comment
<Not Applicable>
Québec CaT
% of Scope 1 emissions covered by the ETS
<Not Applicable>
Period start date
<Not Applicable>
Period end date
<Not Applicable>
Allowances allocated
<Not Applicable>
Allowances purchased
<Not Applicable>
Verified emissions in metric tons CO2e
<Not Applicable>
Details of ownership
<Not Applicable>
Comment
<Not Applicable>
RGGI
% of Scope 1 emissions covered by the ETS
<Not Applicable>
Period start date
<Not Applicable>
Period end date
<Not Applicable>
Allowances allocated
<Not Applicable>
Allowances purchased
<Not Applicable>
Verified emissions in metric tons CO2e
<Not Applicable>
Details of ownership
<Not Applicable>
Comment
<Not Applicable>
Saitama ETS
% of Scope 1 emissions covered by the ETS
<Not Applicable>
Period start date
<Not Applicable>
Period end date
<Not Applicable>
Allowances allocated
<Not Applicable>
Allowances purchased
<Not Applicable>
Verified emissions in metric tons CO2e
<Not Applicable>
Details of ownership
<Not Applicable>
Comment
<Not Applicable>
Shanghai pilot ETS
% of Scope 1 emissions covered by the ETS
<Not Applicable>

Period start date
<Not Applicable>
Period end date
<Not Applicable>
Allowances allocated
<Not Applicable>
Allowances purchased
<Not Applicable>
Verified emissions in metric tons CO2e
<Not Applicable>
Details of ownership
<Not Applicable>
Comment
<Not Applicable>
Shenzhen pilot ETS
% of Scope 1 emissions covered by the ETS
<Not Applicable>
Period start date
<Not Applicable>
Period end date
<Not Applicable>
Allowances allocated
<Not Applicable>
Allowances purchased
<Not Applicable>
Verified emissions in metric tons CO2e
<Not Applicable>
Details of ownership
<Not Applicable>
Comment
<Not Applicable>
Switzerland ETS
% of Scope 1 emissions covered by the ETS
<Not Applicable>
Period start date
<Not Applicable>
Period end date

<Not Applicable>
Allowances allocated
<Not Applicable>
Allowances purchased
<Not Applicable>
Verified emissions in metric tons CO2e
<Not Applicable>
Details of ownership
<Not Applicable>
Comment
<Not Applicable>
Tianjin pilot ETS
% of Scope 1 emissions covered by the ETS
<Not Applicable>
Period start date
<Not Applicable>
Period end date
<Not Applicable>
Allowances allocated
<Not Applicable>
Allowances purchased
<Not Applicable>
Verified emissions in metric tons CO2e
<Not Applicable>
Details of ownership
<Not Applicable>
Comment
<Not Applicable>
Tokyo CaT
% of Scope 1 emissions covered by the ETS
<Not Applicable>
Period start date
<Not Applicable>
Period end date
<Not Applicable>
Allowances allocated
<Not Applicable>

Allowances purchased
<Not Applicable>
Verified emissions in metric tons CO2e
<Not Applicable>
Details of ownership
<Not Applicable>
Comment
<Not Applicable>
Washington CAR
% of Scope 1 emissions covered by the ETS
<Not Applicable>
Period start date
<Not Applicable>
Period end date
<Not Applicable>
Allowances allocated
<Not Applicable>
Allowances purchased
<Not Applicable>
Verified emissions in metric tons CO2e
<Not Applicable>
Details of ownership
<Not Applicable>
Comment
<Not Applicable>
Other ETS, please specify
% of Scope 1 emissions covered by the ETS
<Not Applicable>
Period start date
<Not Applicable>
Period end date
<Not Applicable>
Allowances allocated
<Not Applicable>
Allowances purchased
<Not Applicable>
Verified emissions in metric tons CO2e

<Not Applicable>
Details of ownership
<Not Applicable>
Comment
<Not Applicable>
Other ETS, please specify
% of Scope 1 emissions covered by the ETS
<Not Applicable>
Period start date
<Not Applicable>
Period end date
<Not Applicable>
Allowances allocated
<Not Applicable>
Allowances purchased
<Not Applicable>
Verified emissions in metric tons CO2e
<Not Applicable>
Details of ownership
<Not Applicable>
Comment
<Not Applicable>
Other ETS, please specify

% of Scope 1 emissions covered by the ETS
<Not Applicable>
Period start date
<Not Applicable>
Period end date
<Not Applicable>
Allowances allocated
<Not Applicable>
Allowances purchased
<Not Applicable>
Verified emissions in metric tons CO2e
<Not Applicable>
Details of ownership
<Not Applicable>
Comment
<Not Applicable>
C11.1c
(C11.1c) Complete the following table for each of the tax systems in which you participate.
Alberta carbon tax
Period start date
<Not Applicable>
Period end date
<Not Applicable>
% of emissions covered by tax
<Not Applicable>
Total cost of tax paid
<Not Applicable>
Comment
<Not Applicable>
BC carbon tax
Period start date
<Not Applicable>
Period end date
<Not Applicable>

% of emissions covered by tax
<Not Applicable>
Total cost of tax paid
<Not Applicable>
Comment
<Not Applicable>
Chile carbon tax
Period start date
<Not Applicable>
Period end date
<Not Applicable>
% of emissions covered by tax
<Not Applicable>
Total cost of tax paid
<Not Applicable>
Comment
<Not Applicable>
Colombia carbon tax
Period start date
<Not Applicable>
Period end date
<Not Applicable>
% of emissions covered by tax
<Not Applicable>
Total cost of tax paid
<Not Applicable>
Comment
<Not Applicable>
Denmark carbon tax
Period start date
<Not Applicable>
Period end date
<Not Applicable>
% of emissions covered by tax
<Not Applicable>
Total cost of tax paid
<Not Applicable>
Comment
<Not Applicable>
Estonia carbon tax
Period start date
<Not Applicable>
Period end date
<Not Applicable>
% of emissions covered by tax
<Not Applicable>
Total cost of tax paid
<Not Applicable>
Comment
<Not Applicable>
Finland carbon tax
Period start date
<Not Applicable>
Period end date
<Not Applicable>
% of emissions covered by tax
<Not Applicable>
Total cost of tax paid
<Not Applicable>
Comment
<Not Applicable>
France carbon tax
Period start date
<Not Applicable>
Period end date
<Not Applicable>
% of emissions covered by tax
<Not Applicable>
Total cost of tax paid
<Not Applicable>
Comment
<Not Applicable>
Iceland carbon tax
Period start date
<Not Applicable>
Period end date
<Not Applicable>
% of emissions covered by tax
<Not Applicable>
Total cost of tax paid
<Not Applicable>
Comment
<Not Applicable>
Ireland carbon tax
Period start date
<Not Applicable>
Period end date
<Not Applicable>
% of emissions covered by tax
<Not Applicable>
Total cost of tax paid
<Not Applicable>
Comment
<Not Applicable>
Japan carbon tax
Period start date
January 1 2017
Period end date
December 31 2017
% of emissions covered by tax
27.69
Total cost of tax paid
153803066
Comment
% of emission covered by tax was calculated by Scope1 emission in Japan divided by
global Scope1 emission. And total cost of tax paid was calculated by Scope1 emission in
Japan multiplied Japan Carbon tax rate(289yen/tCO2e) *In addition, the carbon tax is
indirectly affect electricity price in the Scope 2.
Latvia carbon tax
Period start date

<Not Applicable>
Period end date
<Not Applicable>
% of emissions covered by tax
<Not Applicable>
Total cost of tax paid
<Not Applicable>
Comment
<Not Applicable>
Liechtenstein carbon tax
Period start date
<Not Applicable>
Period end date
<Not Applicable>
% of emissions covered by tax
<Not Applicable>
Total cost of tax paid
<Not Applicable>
Comment
<Not Applicable>
Mexico carbon tax
Period start date
<Not Applicable>
Period end date
<Not Applicable>
% of emissions covered by tax
<Not Applicable>
Total cost of tax paid
<Not Applicable>
Comment
<Not Applicable>
Norway carbon tax
Period start date
<Not Applicable>
Period end date
<Not Applicable>

% of emissions covered by tax
<Not Applicable>
Total cost of tax paid
<Not Applicable>
Comment
<Not Applicable>
Poland carbon tax
Period start date
<Not Applicable>
Period end date
<Not Applicable>
% of emissions covered by tax
<Not Applicable>
Total cost of tax paid
<Not Applicable>
Comment
<Not Applicable>
Portugal carbon tax
Period start date
<Not Applicable>
Period end date
<Not Applicable>
% of emissions covered by tax
<Not Applicable>
Total cost of tax paid
<Not Applicable>
Comment
<Not Applicable>
Slovenia carbon tax
Period start date
<Not Applicable>
Period end date
<Not Applicable>
% of emissions covered by tax
<Not Applicable>
Total cost of tax paid
<Not Applicable>

Comment
<Not Applicable>
South Africa carbon tax
Period start date
<Not Applicable>
Period end date
<Not Applicable>
% of emissions covered by tax
<Not Applicable>
Total cost of tax paid
<Not Applicable>
Comment
<Not Applicable>
Sweden carbon tax
Period start date
<Not Applicable>
Period end date
<Not Applicable>
% of emissions covered by tax
<Not Applicable>
Total cost of tax paid
<Not Applicable>
Comment
<Not Applicable>
Switzerland carbon tax
Period start date
<Not Applicable>
Period end date
<Not Applicable>
% of emissions covered by tax
<Not Applicable>
Total cost of tax paid
<Not Applicable>
Comment
<Not Applicable>
UK carbon price floor
Period start date
<Not Applicable>
Period end date
<Not Applicable>
% of emissions covered by tax
<Not Applicable>
Total cost of tax paid
<Not Applicable>
Comment
<Not Applicable>
Ukraine carbon tax
Period start date
<Not Applicable>
Period end date
<Not Applicable>
% of emissions covered by tax
<Not Applicable>
Total cost of tax paid
<Not Applicable>
Comment
<Not Applicable>
Other carbon tax, please specify
Period start date
<Not Applicable>
Period end date
<Not Applicable>
% of emissions covered by tax
<Not Applicable>
Total cost of tax paid
<Not Applicable>
Comment
<Not Applicable>
Other carbon tax, please specify
Period start date
<Not Applicable>
Period end date
<Not Applicable>

% of emissions covered by tax
<Not Applicable>
Total cost of tax paid
<Not Applicable>
Comment
<Not Applicable>
Other carbon tax, please specify
Period start date
<Not Applicable>
Period end date
<Not Applicable>
% of emissions covered by tax
<Not Applicable>
Total cost of tax paid
<Not Applicable>
Comment
<Not Applicable>
Other carbon tax, please specify
Period start date
<Not Applicable>
Period end date
<Not Applicable>
% of emissions covered by tax
<Not Applicable>
Total cost of tax paid
<Not Applicable>
Comment
<Not Applicable>
Other carbon tax, please specify
Period start date
<Not Applicable>
Period end date
<Not Applicable>
% of emissions covered by tax
<Not Applicable>
Total cost of tax paid
<Not Applicable>

Comment
<Not Applicable>
Other carbon tax, please specify
Period start date
<Not Applicable>
Period end date
<Not Applicable>
% of emissions covered by tax
<Not Applicable>
Total cost of tax paid
<Not Applicable>
Comment
<Not Applicable>
C11.1d
(C11.1d) What is your strategy for complying with the systems in which you participate or
anticipate participating?
As for our strategy for reducing CO2 emissions, we incorporate measures for CO2 reduction
in advance into our Mid-Term Plan and address the measures timely according to the plan.
Representative measures are as followings.
- Energy saving initiatives at production sites
- Energy saving initiatives at business offices
- Enlightenment activities to raise employees’ environmental awareness
C11.2
(C11.2) Has your organization originated or purchased any project-based carbon credits
within the reporting period?
No
C11.3

(C11.3) Does your organization use an internal price on carbon?
Yes
C11.3a
(C11.3a) Provide details of how your organization uses an internal price on carbon.
Objective for implementing an internal carbon price
Drive energy efficiency
Drive low-carbon investment
GHG Scope
Scope 1
Scope 2
Application
Applied to decisions of investment for equipment
Actual price(s) used (Currency /metric ton)
Variance of price(s) used
Type of internal carbon price
Shadow price
Impact & implication
Internal guidelines: Our Investment Profit Criteria stipulate that carbon emission impacts
(increase or reduction) of investments are to be integrated as cost when making
profitability judgments for strategic investment projects. The cost of emission impacts is
to be calculated as the price of an emissions credit unit.
C12. Engagement
C12.1
(C12.1) Do you engage with your value chain on climate-related issues?
Yes, our suppliers
Yes, our customers
Yes, other partners in the value chain
C12.1a

(C12.1a) Provide details of your climate-related supplier engagement strategy.
Type of engagement
Compliance & onboarding
Details of engagement
Code of conduct featuring climate change KPIs
% of suppliers by number
100
% total procurement spend (direct and indirect)
100
% Scope 3 emissions as reported in C6.5
3
Rationale for the coverage of your engagement
Coverage: Bridgestone promotes development and issuance of the Global Sustainable
Procurement Policy which is applicable to all purchased materials and services, as well
as all suppliers globally. Rationale for the coverage: The journey towards “100%
Sustainable Materials,” Bridgestone’s goal for 2050 and beyond as our long-term
environmental vision including climate change viewpoint, will not be simple, nor can
Bridgestone achieve it alone. This policy is to help identify and evaluate qualified
suppliers, promote best practices, and serve as a communication and improvement tool
for the industry. Bridgestone expects all of its Suppliers to recognize the importance of
Sustainable Procurement, and work with the Company to implement appropriate
practices to create value for all Stakeholders. Note: During the development of the policy,
Bridgestone gained insights from external stakeholders, including international
consultants, non-governmental organizations (NGOs), materials suppliers, natural rubber
farmers, and key customers to ensure the policy reflects industry standards and best
practices. In addition, the policy is supported by an effective implementation and
communication plan. Available in 12 languages, the policy will be implemented, governed
and enforced regionally. As an immediate first step, Bridgestone will prioritize working
closely with its employees, suppliers and customers and other industry experts to
implement the policy.
Impact of engagement, including measures of success
The four major areas are impacted throughout Bridgestone’s supply chain: Transparency,
Compliance, QCD & Innovation, Sustainable Procurement Practices incorporating
environmentally responsible procurement including measures for climate change, the use
of energy, reduction of GHG emission as well as the use of energy. Bridgestone will work
with suppliers and partners to ensure that they have received the policy and understand
it. Following acknowledgment of the policy, suppliers will then receive a self assessment
questionnaire.
Comment

C12.1b
(C12.1b) Give details of your climate-related engagement strategy with your customers.
Type of engagement
Collaboration & innovation
Details of engagement
Run a campaign to encourage innovation to reduce climate change impacts
Size of engagement
100
% Scope 3 emissions as reported in C6.5
13
Please explain the rationale for selecting this group of customers and scope of
engagement
I) In the development of new vehicle models by automakers, which are our business
partners, the development and delivery of fuel-efficient tires that contribute to the
reduction of fuel consumption in cooperation with automakers leads to the reduction of
GHG emissions. In addition, we cooperate in calculating the emissions of automakers and
contribute to reductions in the life cycle by cooperating in the GHG emission survey of
automakers through the CDP supply chain program. Because we promote such activities
with all automakers, 100% is input into "Size of engagement" ii) By improving the rolling
resistance of tires used in automobiles, we contribute to automakers’ efforts to lower fuel
consumption during the use of their products.
Impact of engagement, including measures of success
Improvement of fuel efficiency of tires brings CO2 reduction from vehicles. The direct
impact of the engagement is calculated by the result of tire units sold to the automakers
multiplied by the average of CO2 emission per tire. And the technology which is
developed by the engagement can be applied tires which are sold directly to end-users for
their replacement needs. From this perspective, the engagement has further potential to
contribute CO2 reduction. We intend to reduce CO2 emission during the use of our tires
so our contribution from avoided emissions when our customers use the tires by
improving fuel efficiency of our tires is the measure of success. In 2017, we supplied fuel
efficient tires such as ECOPIA to low carbon emission vehicles newly developed by
automakers as tires equipped with new vehicle models. By supplying fuel efficient tire, we
contributed to superior fuel efficiency of vehicles.
C12.1c
(C12.1c) Give details of your climate-related engagement strategy with other partners in the
value chain.

We support introduction of ECO labeling system as whole tire industry to encourage tire
dealers to sell fuel efficient tires, making fuel efficiency of products visible for customers.
In case that we calculate under the condition of sold number of replacement tires listed in
catalog for passenger cars in Japan, 57% of those sold tires are conformable to the
environmental product declaration in accordance with external standard by JATMA(Japan
Automobile Tyre Manufacturers Association). From climate-change perspective,
coexistence of low rolling resistance which contributes low CO2 emission and other
performances like WET performance which supports safety is key challenge for our tire
development. Therefore, the number of our ECO products which achieves high quality in
such areas in the same time is one of our measure of success. As our achievement in 2017
from this viewpoint, we launched ECOPIA NH100 as the latest model of fuel efficient
product which features its high wet performance and wear life as well as low rolling
resistance.
C12.3
(C12.3) Do you engage in activities that could either directly or indirectly influence public
policy on climate-related issues through any of the following?
Trade associations
C12.3b
(C12.3b) Are you on the board of any trade associations or do you provide funding beyond
membership?
Yes
C12.3c
(C12.3c) Enter the details of those trade associations that are likely to take a position on
climate change legislation.
Trade association
The Japan Rubber Manufacturers Association (JRMA)
Is your position on climate change consistent with theirs?
Consistent
Please explain the trade association’s position
After the commitment period of the Kyoto Protocol (since 2013), JRMA has been working
consistently to achieve the goal of reducing CO2 in 2020 which has been set as a trade
association’s target in line with the national policy calling for the ongoing reduction of

CO2. Every year, it gives a follow-up report on the reduction status to the government. In
2015, JRMA set the target for 2030 also. Based on the targets of industry groups
including JRMA, Japan’s reduction targets submitted to COP21 were drawn up. JRMA
steadily promoted activities to reduce the emission in 2017 and reported actual CO2
reduction results to the Ministry of Economy, Trade and Industry in Japan.
How have you, or are you attempting to, influence the position?
At the Environmental Committee, Bridgestone leads industry activities and summarizes
the opinions as the chairperson
Trade association
The Japan Automobile Tyre Manufacturers Association, Inc. (JATMA)
Is your position on climate change consistent with theirs?
Consistent
Please explain the trade association’s position
JATMA is one of the major tire industry associations in the world, and has established
the Tire Labelling System in 2010, and has been contributing to increase the ratio of “Fuel
Efficient Tires" in the market. (In the lifecycle of tire, CO2 emission in usage stage
consists of more than 80%) In 2015, JATMA compiled and announced the benefits of CO2
emission reduction through reduced rolling resistance of passenger car tires from 2006
to 2012. In 2017, JATMA compiled the data in Y2016 of CO2 emission reduction through
reduced rolling resistance of passenger car tires. The result was disclosed in Jan. 2018.
Compared to 2006, CO2 emission per tire has been reduced by 13.9% in 2016
How have you, or are you attempting to, influence the position?
Our employees have participated in various committees and presented our opinions. At
the Environmental Committee, Bridgestone leads industry activities and summarizes the
opinions as the chairperson.
Trade association
World Business Council for Sustainable Development (WBCSD)
Is your position on climate change consistent with theirs?
Consistent
Please explain the trade association’s position
Since 2006, the Tire Industry Project (TIP) under the umbrella of the World Business
Council for Sustainable Development has served as a voluntary joint-initiative undertaken
by 11 global leading tire manufacturers, under the leadership of the CEOs, with an aim to
identify and address the potential human health and environmental impacts associated
with tire development and use. TIP is a proactive organization that allows the industry’s
leading companies to leverage their collective action in advancing sustainability
throughout the industry. In 2017, TIP established Tire PCR as the industry rules for the
estimation regarding life cycle impact of tire product with three major program operators.
TIP also summarized incorporation of Energy consumption, CO2 emission and Water
intake by member companies as KPI to publish.
How have you, or are you attempting to, influence the position?

As one of co-chair companies of the Tire Industry Project, Bridgestone is engaged in the
visualization of the overall impact of climate change through discussions with other
companies.
C12.3f
(C12.3f) What processes do you have in place to ensure that all of your direct and indirect
activities that influence policy are consistent with your overall climate change strategy?
In order to ensure consistency, the Environmental External Relations Department, which
belongs to Bridgestone’s headquarters and is in charge of communication and negotiation
with external companies and organizations, uniformly handles cooperation with industry
groups. Important discussions with industry groups are reported to Global Environment
Working Group (WG) and Global CSR Enhancement Committee (GCEC), reviewed to ensure
consistency and representatives of Bridgestone’s feedback to industry groups.
C12.4
(C12.4) Have you published information about your organization’s response to climate
change and GHG emissions performance for this reporting year in places other than in your
CDP response? If so, please attach the publication(s).
Publication
In voluntary sustainability report
Status
Complete
Attach the document
Sustainability Report2017.pdf
Content elements
Governance
Strategy
Risks & opportunities
Emissions figures
Emission targets
Other metrics
Publication
In mainstream reports
Status
Complete

Attach the document
Asset Securities report.pdf
Content elements
Governance
Strategy
Risks & opportunities
Other metrics
C14. Signoff
C-FI
(C-FI) Use this field to provide any additional information or context that you feel is relevant
to your organization's response. Please note that this field is optional and is not scored.
C14.1
(C14.1) Provide details for the person that has signed off (approved) your CDP climate
change response.
Job title Corresponding job category
Row1
Vice President and Officer CSR, Environment and Quality ManagementPlanning
Environment/Sustainabilitymanager