
Breust Tristan 2006
169
University of Southern Queensland Faculty of Engineering and Surveying The Design and Structural Analysis of a Steel Portal Framed Shed for the Darling Downs Historical Rail Society A dissertation submitted by Tristan David Breust in fulfillment of the requirements of Courses ENG4111 and 4112 Research Project towards the degree of Bachelor of Civil Engineering Submitted: November, 2006
-
Upload
anil995101 -
Category
Documents
-
view
4 -
download
0
Transcript of Breust Tristan 2006
University of Southern QueenslandFaculty of Engineering and Surveying
The Design and Structural Analysis of a SteelPortal Framed Shed for the Darling Downs
Historical Rail Society
A dissertation submitted by
Tristan David Breust
in fulfillment of the requirements of
Courses ENG4111 and 4112 Research Project
towards the degree of
Bachelor of Civil Engineering
Submitted: November, 2006

Abstract
The Darling Downs Historical Rail Society (DDHRS) was given a steel portalframed shed in
spare parts. The properties of the steel are unknown and need to be determined by testing. The
shed needs to be redesigned according to Australian Standards to suit the needs of the DDHRS
including the addition of a workshop pit and twin sets of railway lines. These modifications will
allow the Society to utilise the building as a workshop for restoring old steam engines back to
working order. Once restored, these trains will become a tourist attraction offering day and
charter trips across the Darling Downs. Originally the steel shed was a kit shed made in America
for the Second World War effort. The steel members were made by an American company
called Bethlehem Steel who has since ceased to exist after declaring bankruptcy in 2001.
The objectives of the project include:
1. Background study of the Darling Downs Historical Rail Society and Bethlehem Steel
Company.
2. Modifying the original shed design to suit its new purpose for restoring old steam
engines.
3. Determine the materials properties by means of laboratory testing using the tensile testing
apparatus located in the University of Southern Queensland (USQ).
4. Analyse proposed design, check for strength, deflection etc... and provide critical
comment.
5. Prepare sewer and sanitary drainage layout plans for addition of new amenities blocks as
well as structural and civil drawings for construction.
6. Site hydraulics and hydrology
7. Preparing documentation for council approval
An important part of this research project involves testing a section of steel. Since little is known
about the properties of the steel, an accurate design of the shed cannot be achieved. A
preliminary design has been completed assuming worst case scenarii for the soil type and
strength of steel. The steel has been tested and the yield strength determined to be just over 300
MPa. Following this, a design was completed to allow for the most economic use of materials
and methods of construction. The main goal is to ensure that the steel portal framed shed is built
ABSTRACT ii
safely and economically in accordance with current Australian Standards, and fits its purpose as
a restoration shed for the society to work in.
The steelportal framed shed has been safely modified and redesigned to suit the needs of the
DDHRS and their endeavours. All strength and serviceability limits have been satisfied, and the
shed analysed in the structural design program Space Gass. There is still some future work to be
completed prior to starting construction of the workshop. The main reason for the shed not being
completed by November is lack of funding. Services such as a soil test to determine the
reactivity of the soil and class the site, must be completed. The society also needs to acquire
several steel members and connection components as specified on the drawings. After meeting
these requirements, the shed will be built safely in accordance with modern Australian standards.

University of Southern Queensland
Faculty of Engineering and Surveying
ENG4111 Research Project Part 1 &ENG4112 Research Project Part 2
Limitations of Use
The Council of the University of Southern Queensland, its Faculty of Engineering andSurveying, and the staff of the University of Southern Queensland, do not accept anyresponsibility for the truth, accuracy or completeness of material contained within orassociated with this dissertation.
Persons using all or any part of this material do so at their own risk, and not at the riskof the Council of the University of Southern Queensland, its Faculty of Engineeringand Surveying or the staff of the University of Southern Queensland.
This dissertation reports an educational exercise and has no purpose or validitybeyond this exercise. The sole purpose of the course pair entitled "Research Project"is to contribute to the overall education within the student’s chosen degree program.This document, the associated hardware, software, drawings, and other material setout in the associated appendices should not be used for any other purpose: if they areso used, it is entirely at the risk of the user.
Professor R SmithDeanFaculty of Engineering and Surveying
Certification
I certify that the ideas, designs and experimental work, results, analyses andconclusions set out in this dissertation are entirely my own effort, except whereotherwise indicated and acknowledged.
I further certify that the work is original and has not been previously submitted forassessment in any other course or institution, except where specifically stated.
Tristan David Breust
Student Number: 0050009349
Signature
Date

Acknowledgements
This research project was carried out under the principle supervision of Dr Amar Khennane, who
is a lecturer in structural engineering at the University of Southern Queensland.
I would like to thank Amar for his continual efforts and exceptional guidance throughout the
year. I would also like to thank Jeff Smith, Peter Eldrich and other members of the DDHRS for
their invaluable input and support throughout the year. Thanks to GHD for helping with the
completion of my project. My thanks also go to, Dan Turner from Farr Evratt Consulting
Engineers, for his help.
TRISTAN BREUST
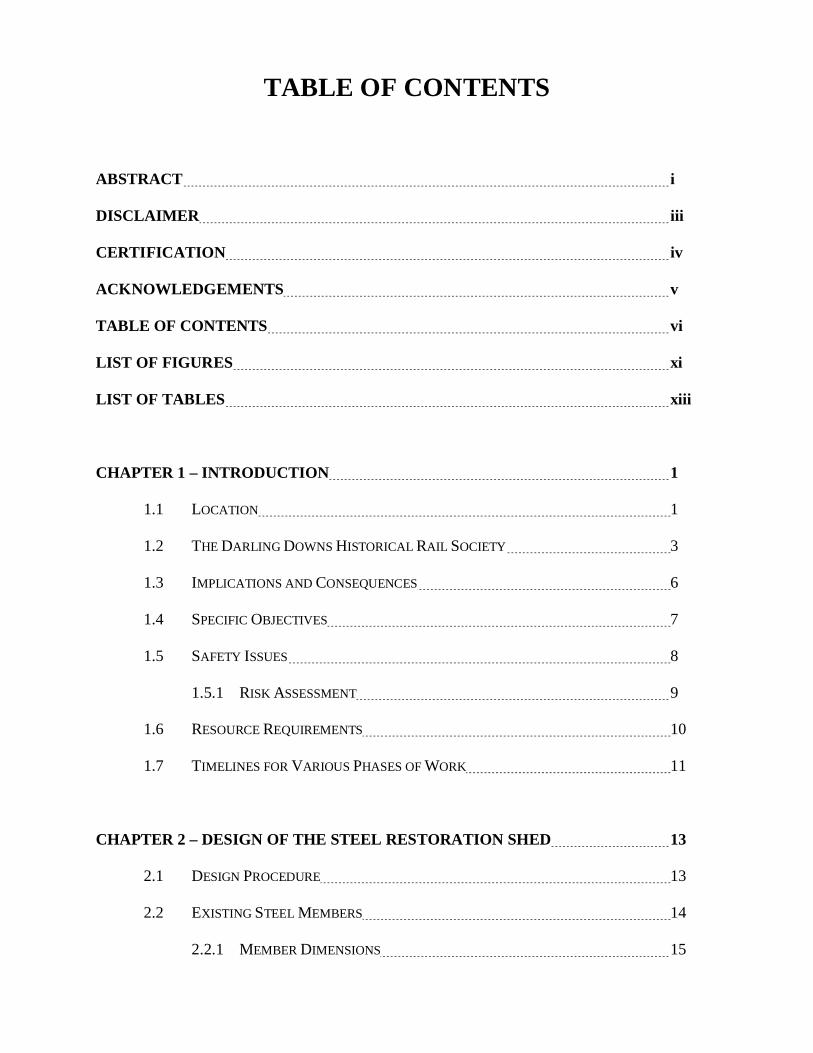
TABLE OF CONTENTS
ABSTRACT i
DISCLAIMER iii
CERTIFICATION iv
ACKNOWLEDGEMENTS v
TABLE OF CONTENTS vi
LIST OF FIGURES xi
LIST OF TABLES xiii
CHAPTER 1 – INTRODUCTION 1
1.1 LOCATION 1
1.2 THE DARLING DOWNS HISTORICAL RAIL SOCIETY 3
1.3 IMPLICATIONS AND CONSEQUENCES 6
1.4 SPECIFIC OBJECTIVES 7
1.5 SAFETY ISSUES 8
1.5.1 RISK ASSESSMENT 9
1.6 RESOURCE REQUIREMENTS 10
1.7 TIMELINES FOR VARIOUS PHASES OF WORK 11
CHAPTER 2 – DESIGN OF THE STEEL RESTORATION SHED 13
2.1 DESIGN PROCEDURE 13
2.2 EXISTING STEEL MEMBERS 14
2.2.1 MEMBER DIMENSIONS 15
TABLE OF CONTENTS vii
2.2.2 TRUSS SECTIONS 16
2.3 RESTORATION OF THE STEEL MEMBERS 18
2.4 WORKSHOP MODIFICATIONS 20
2.4.1 ADDITION OF RAILWAY LINES 21
2.4.2 INCREASING THE HEIGHT OF THE RESTORATION SHED 22
2.4.3 ADDITION OF A GANTRY CRANE 25
2.4.4 WORKSHOP SERVICE PIT 31
2.5 DESIGN CONCLUSIONS 31
CHAPTER 3 – DETERMINATION OF THE MATERIAL PROPERTIES OF THE
STEEL 32
3.1 TENSILE TESTING PROCEDURE 32
3.2 TENSILE TESTING MACHINE 33
3.3 SAMPLE TEST PIECES 34
3.3.1 TEST SETUP 34
3.4 RESULTS 37
3.5 COMPARISON OF SAMPLE RESULTS 39
3.6 CALCULATION OF STEEL PROPERTIES 39
3.7 CONCLUSION 41
CHAPTER 4 – STRUCTURAL ANALYSIS OF THE DESIGN 42
4.1 WIND CALCULATIONS 43
4.1.1 INITIAL INFORMATION 43
4.1.2 INTERNAL WIND LOADS 47

TABLE OF CONTENTS viii
4.1.2.1 CROSS WIND 47
4.1.2.2 LONGITUDINAL WIND 48
4.1.3 EXTERNAL WIND LOADS 49
4.1.3.1 CROSS WIND 49
4.1.3.2 LONGITUDINAL WIND 54
4.1.4 SUMMARY 60
4.2 PURLIN DESIGN 62
4.3 GIRT DESIGN 64
4.4 LIVE LOAD CALCULATIONS 65
4.5 SPACE GASS INPUT DIAGRAMS 67
4.6 COMPUTER ANALYSIS 68
4.6.1 MODEL 68
4.6.2 RESULTS 75
4.6.2.1 MAXIMUM DEFLECTIONS 76
4.6.2.2 MAXIMUM BENDING MOMENTS 77
4.6.2.3 MAXIMUM AXIAL FORCES 77
4.6.2.4 MAXIMUM SHEAR FORCES 78
4.6.3 SAMPLE HAND CHECKS 78
4.7 AUSTRALIAN STANDARD RECOMMENDATIONS 80
4.8 COMPLIANCE WITH AUSTRALIAN STANDARDS 81
4.9 DRAWINGS 82
4.9.1 SEWER AND SANITARY DRAINAGE PLAN 82
4.9.2 EXTERNAL LAYOUT PLAN 82
4.9.3 STRUCTURAL DRAWINGS 83

TABLE OF CONTENTS ix
4.9.4 FOUNDATION PLAN 84
4.10 ANALYSIS CONCLUSIONS 85
CHAPTER 5 – OTHER DESIGNS 86
5.1 SLAB DESIGN 86
5.1.1 SLAB CALCULATIONS 87
5.1.1.1 FORKLIFT LOAD 87
5.1.1.2 MOBILE CRANE LOAD 91
5.1.2 SUMMARY 95
5.2 WORKSHOP SERVICE PIT DESIGN 96
5.3 SITE HYDROLOGY 97
5.3.1 TANK CAPACITIES 99
5.3.2 INCOMING RAINWATER 99
5.3.3 OUTGOING RAINWATER 100
5.4 SITE HYDRAULICS 103
5.4.1 GUTTERS AND DOWNPIPES 103
5.5 BAR DESIGN 106
5.6 SUMMARY OF OTHER DESIGNS 109
CHAPTER 6 – CONCLUSIONS AND FUTURE WORK 110
6.1 FUTURE WORK 111
6.1.1 CONSTRUCTION 113
6.2 CONCLUSIONS AND RECOMMENDATIONS 114
TABLE OF CONTENTS x
BIBLIOGRAPHY 115
APPENDIX A – PROJECT SPECIFICATION 118
APPENDIX B – AERIAL PHOTOGRAPH OF SITE 120
APPENDIX C – TOOWOOMBA PLANNING SCHEME 2003 – ZONE MAP 122
APPENDIX D – SAMPLE TEST DATA 124
APPENDIX E – WIND CALCULATOR GRAPHICAL OUTPUT 126
APPENDIX F – MEMBER DISTRIBUTED FORCES DATASHEET 128
APPENDIX G SPACE GASS GRAPHICAL OUTPUT 130
APPENDIX H – C001–SEWER & SANITARY DRAINAGE PLAN 138
APPENDIX I – C002EXTERNAL LAYOUT PLAN 140
APPENDIX J – S001ROOF FRAMING PLAN 142
APPENDIX K – S002SIDE ELEVATION PLAN 144
APPENDIX L – S003END ELEVATIONS PLAN 146
APPENDIX M – S004FOUNDATION PLAN 148
APPENDIX N – CONSTRUCTION NOTES & DETAILS 150

LIST OF FIGURES
Figure 1.1 – DDHRS Site Location 3
Figure 2.1 – Comparison of Universal Beam Section 15
Figure 2.2 – Typical Truss Arrangements 17
Figure 2.3 – Truss Detail 17
Figure 2.4 – Steel Members Stored in Exposed Environment 19
Figure 2.5 – Steel Members Before Restoration 19
Figure 2.6 – Steel Members After Restoration 20
Figure 2.7 – Workshop Rail Line Locations 21
Figure 2.8 – Rail line Crosssection 22
Figure 2.9 – Blockwall Detail 23
Figure 2.10 – Besser 200 Series Blockwall Detail 24
Figure 2.11 – Gantry Electronic Controller 25
Figure 2.12 – Gantry Beam CrossSections 26
Figure 2.13 – Gantry Cranes Maximum Load 27
Figure 2.14 – Main Beam Description 28
Figure 2.15 –Section 1 and Motor Component 29
Figure 2.16 – Gantry Crane Hook 29
Figure 2.17 – Section 2 30
Figure 3.1 – Tensile Testing Apparatus 33
Figure 3.2 – Steel Test Piece 34
Figure 3.3 – Test samples 1, 2 & 3 Before Testing 36
Figure 3.4 – Test samples 1, 2 & 3 After Testing 37

LIST OF FIGURES xii
Figure 4.1 – Shed Elevation and Plan View 43
Figure 4.2 – Model 68
Figure 4.3 – Truss Design Aid 70
Figure 4.4 – Shape Builder 71
Figure 4.5 – Member Sections 72
Figure 4.6 – Self Weight Datasheet 75
Figure 4.7 – NonLinear Static Analysis 76
Figure 5.1 – Workshop Service Pit Detail 97
Figure 5.2 – Hyetograph of Monthly Rainfall 98
Figure 5.3 – Existing Bar 107
Figure 5.4 – Bar Design, Plan View 107
Figure 5.5 – Bar Design, Side Elevation 108

LIST OF TABLES
Table 1.1 – Project Objective Timelines 12
Table 2.1 – Recorded Steel Member Measurements 15
Table 2.2 – Truss Member Schedule 18
Table 2.3 – Besser Reinforcement Details 24
Table 3.1 – Steel Test Piece Dimensions 34
Table 3.2 – Summary of Sample Properties 40
Table 3.3 – Tapered Members Equivalent Sections 41
Table 4.1 – Initial Input Information 60
Table 4.2 – Summary of Design Wind Pressures 61
Table 4.3 – Node Coordinates Datasheet 69
Table 4.4 – Node Restraints 72
Table 4.5 – Load Case Titles 73
Table 4.6 – Combination Cases 74
Table 4.7 – Member Deflections 76
Table 4.8 – Member Bending Moments 77
Table 4.9 – Member Axial Forces 77
Table 4.10 – Member Shear Forces 78
Table 4.11 – Horizontal Deflection Compliance 81
Table 4.12 – Vertical Deflection Compliance 81
Table 5.1 – Summary of Slab Design Thicknesses 96
Table 5.2 – Inflow of Monthly Rainfall 100
Table 5.3 – Net Weekly Flow from Tanks 103

Chapter 1
Introduction
The aim of this research project is to design and carry out the structural analysis of a steel
portalframed shed to suit the needs of the Darling Downs Historical Rail Society
(DDHRS).
This realworld project consists of many different tasks over a diverse variety of
engineering aspects. The main focus of the project is the structural design of the
restoration shed, including wind load calculations, slab design, and various modifications
of the shed to suit the needs of the Society. The structure has been modeled in the
structural design analysis program ‘Space Gass’ for strength limit state and serviceability
limit state conditions. The material properties of the steel used for the restoration shed
have been determined by testing three sample pieces of steel, using the tensile testing
apparatus at the University of Southern Queensland. Additional tasks include the
preparation of various documents and drawings for submission to Council for approval,
as well as the design of the site hydraulics from the available hydrological rainfall data.
Planning and surveying the location of all the infrastructure, and services on site was also
an important part of the project.
CHAPTER 1 – INTRODUCTION 2
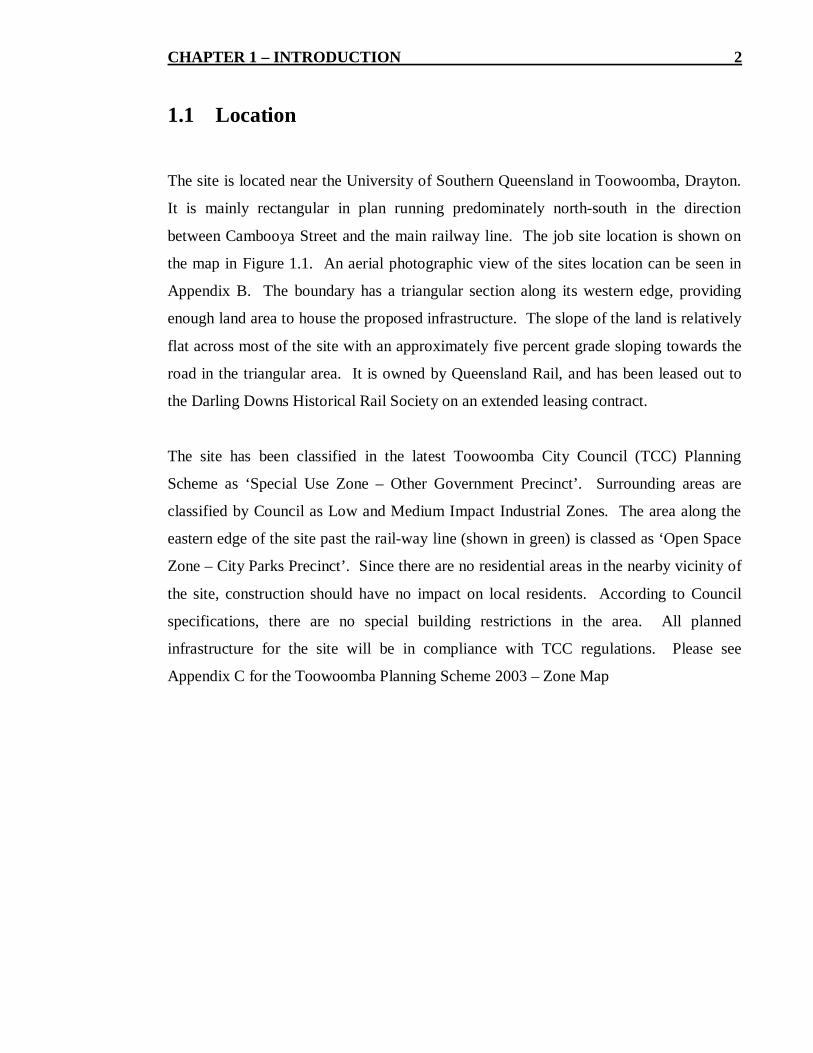
1.1 Location
The site is located near the University of Southern Queensland in Toowoomba, Drayton.
It is mainly rectangular in plan running predominately northsouth in the direction
between Cambooya Street and the main railway line. The job site location is shown on
the map in Figure 1.1. An aerial photographic view of the sites location can be seen in
Appendix B. The boundary has a triangular section along its western edge, providing
enough land area to house the proposed infrastructure. The slope of the land is relatively
flat across most of the site with an approximately five percent grade sloping towards the
road in the triangular area. It is owned by Queensland Rail, and has been leased out to
the Darling Downs Historical Rail Society on an extended leasing contract.
The site has been classified in the latest Toowoomba City Council (TCC) Planning
Scheme as ‘Special Use Zone – Other Government Precinct’. Surrounding areas are
classified by Council as Low and Medium Impact Industrial Zones. The area along the
eastern edge of the site past the railway line (shown in green) is classed as ‘Open Space
Zone – City Parks Precinct’. Since there are no residential areas in the nearby vicinity of
the site, construction should have no impact on local residents. According to Council
specifications, there are no special building restrictions in the area. All planned
infrastructure for the site will be in compliance with TCC regulations. Please see
Appendix C for the Toowoomba Planning Scheme 2003 – Zone Map

CHAPTER 1 – INTRODUCTION 3
Figure 1.1 – DDHRS Site Location
1.2 The Darling Downs Historical Rail Society (DDHRS)
The Darling Downs Historical Rail Society Ltd. is a non profit organisation whose first
objective is to maintain the railway heritage of the Toowoomba area. In the early
colonial days, the Darling Downs area was recognised as being rich and fertile, leading to
large areas of land being utilised for agricultural food production. The steam train
railway system provided a means to transport these goods to Brisbane, leading to an
increase in local development. The DDHRS aims to restore steam locomotives and
several carriages to working order for Queensland Rail line use. Once restored these
trains will serve as a tourist attraction, offering day and charter trips across the Darling
Downs. They plan to turn their development site into a profit making venture to fund
continual development, and to sustain the historical heritage of the area. Once their
facilities are adequately setup, the society may make the transition from a nonprofit
organisation into a profitable one, creating enough revenue to fund the restoration of
Job Site

CHAPTER 1 – INTRODUCTION 4
steam engines, maintenance of the site and to expand/upgrade the services they provide.
Over the past 24 months, Downs Steam volunteers have transformed the Drayton site into
a hub of railway activity.
The DDHRS was originally established in 2002 for the purpose of restoring Steam
Locomotive 106, built in the Toowoomba foundry in 1914. This action sparked interest
in the community and led to an exponential growth in the society and the services they
provide. The society has many largescale future plans to set up their site as a tourist
venture. Plans for future construction on site includes the restoration workshop with
service pit, a Westinghouse shed, an entrance shed, 2 underground concrete rainwater
tanks, a station, a platform, a toilet block, a barbeque area, and a tram restaurant. The
Darling Downs Historical Rail Society is being assisted in its endeavors by local and
national companies. Their railrunning inventory includes an 80 tonne C16 locomotive, a
guards van, two sheep trucks, seven steel suburban carriages and a tram. As part of the
Darling Downs Historical Rail Societies desire to become a successful tourist attracting
venture, they are always in the process of developing new ways in which to enlarge their
organisation and promote their interests. Steam train information and memorabilia is
currently displayed on the walls of the entrance shed for people to read before stepping
out onto site. Future jobs which currently are in the preliminary ideas stage include
turning the newly obtained tram into an old style restaurant, and running a tourist ring
circuit rail line from the site down to the range at Spring Bluff, stopping to have lunch
and then returning to the site.
The DDHRS was given a shed in spare parts. This shed is made up of a number of
separate steel members with unknown properties such as I beams, C beams and trusses.
The society has had a large number of infrastructure donated to them in spare parts.
These include the steel portal framed shed, an entrance shed, a wooden Westinghouse
shed and a station. The entrance shed will act as the society’s new tourist entrance,
located in the middle of the fenceline off Cambooya Street. Once assembled, the slender
Westinghouse shed will provide shelter for steam engines from weathering effects.
Weathering of the members leads to rusting of the steel, and the connections, stiffening of
the connection joints making them brittle, weak, and rigid. Other organisations which
CHAPTER 1 – INTRODUCTION 5
have made donations and helped the society included companies such as Wagners who
donated all the concrete to be used on site for slabs, piers and pathways, costs are
estimated to be in excess of $50 000. Clive Berghofer has offered to pay for the expense
of putting in a new sewer line and installing all the sanitary drainage on site. They also
received help with some of the less important laboring work. Groups such as ‘work for
the dole’ assisted with minor tasks including sanding, gardening and painting. Future
help includes a group of inmates who will undertake all the heavy work such as laying
new tracks and erecting the steel portal framed shed.
Originally the steel shed was a kit shed made in America for the Second World War.
When the war started, the shed members were able to be shipped over to Australia and
erected into a workshop or hanger in a timely manner to aid in the war effort. This shed
is one of many similar kit sheds used during the war. Once reerected, the shed shall be
used by the Darling Downs Historical Rail Society as a workshop for restoring old steam
engines back to life. The steel members were made by an American company called
Bethlehem Steel who had its origins in 1930 but has since shut down after declaring
bankruptcy in 2001. The steel members have “Bethlehem” and “Carnegie C USA”
printed on the side of them. This sparked an investigation into their origin and research
into the company in the hope of determining their properties for design purposes. No
such information was readily available, so a section of the steel needs to be tested by
means of a tensile test to determine its material properties, and the results analysed to
ensure that the data obtained is accurate. Bethlehem Steel was a large respected company
during operation. Many of America’s most impressive structures including the Chrysler
Building, the George Washington Bridge and the Panama Canal were built using
Bethlehem steel sections. The company was also heavily involved in the construction of
many battleships, rail roads and automobiles. Bethlehem Steel had is main steel plant in
eastern Pennsylvania which stretched nearly 5 miles and comprised of hundreds of
interlinked buildings. Upon closure of this plant, 4000 jobs were lost, bringing the grand
total to 12850 jobs that were lost as a result of the company’s shutdown, this had a
significant impact on local economy. These buildings have been demolished since the
companies shutdown in October 2001. Bethlehem Steel largely contributed to the
redevelopment of many countries infrastructure in the post World War II period. In the
CHAPTER 1 – INTRODUCTION 6
early 1980’s, 90% of Bethlehem Steels profitability was obtained through steel products,
including 14% fabricated products. In the early 1990’s, the company expanded into raw
materials sales which dominated 8% of their total business with a further 5% of sales
from other steel related services not previously offered. During this time profits from
steel products only comprised of 87% of their total sales.
1.3 Implications and Consequences
The primary goal of this project is to ensure that the steel portalframed shed is built
safely and correctly in accordance with current Australian Standards and within
Toowoomba City Council regulations. The workshop must be built to ensure that it is
sustainable and adequately fulfils its purpose for the duration of its design life at which
case it will deform in a structurally sound manner, visually giving plenty of notice to be
repaired before catastrophic failure.
The design must be completed in an economical manner without any shortcuts that might
jeopardise the safety of the public. The shed is a large steel structure that will physically
exist, making safety in this project a high priority. If not built correctly, the workshop
could collapse leaving the author and associated professional bodies responsible. The
site, including all infrastructure must be ethically acceptable to the general public for
tourist sustainability. It also must be built in an ethical way by professionals whom are
competent in each area of expertise. All critical calculations and major design decisions
will be checked by a professional body with a professional person who has gained
adequate experience in the specific field, and is extremely competent in it. Professional
bodies that will be checking the work include mainly the University of Southern
Queensland, the Toowoomba City Council and Farr Evratt Consulting Engineers. As a
member of the Institute of Engineers Australia (IEAust) and the Association of
Professional Engineers, Scientists and Managers Australia (APESMA), the author has an
obligation to abide by the 9 tenets stated within the IEAust Code of Ethics 2000 and act
ethically in all actions during this project and as an engineer.

CHAPTER 1 – INTRODUCTION 7
1.4 Specific Objectives
The objectives of this research project are very broad with skills required in many
different areas of civil engineering.
1. Background study of Darling Downs Historical Rail Society (DDHRS) and the
Bethlehem Steel company.
Finding out all relevant background information related to the society by questioning its
members and researching. Also doing research on the company that manufactured the
steel members used for the portalframed shed. This is the first step in understanding
exactly what the society wants for the shed, and how to modify the design to suit their
needs.
2. Modifying the original shed design to suit its new purpose for restoring old steam
engines.
Since the society will be moving and lifting heavy steam train sections, they will need
extra clearance within the workshop for small cranes and lifting equipment to be used.
Other modifications include the addition of two sets of railway lines and, a workshop
service pit.
3. Prepare sewer and sanitary drainage layout plans for addition of new amenities
blocks as well as other structural and civil drawings for construction.
Drawing up the plans for extending the sewer line and the layout of all onsite sanitary
drainage for submission to council for approval, along with the set of structural and civil
drawings.
4. Site hydraulics and hydrology
Design and determine the location of all rainwater tanks on site. This includes sizing
gutters and downpipes on the steel shed from rainfall data, as well as inspecting whether
overland drainage is planned correctly to divert all excess stormwater into the stormwater
system.

CHAPTER 1 – INTRODUCTION 8
5. Determine the materials properties of the steel by means of laboratory testing
using the tensile testing apparatus located at the University of Southern Queensland
(USQ).
Determination of the material properties involves testing three representative samples of
steel approximately 250 mm in length by means of a tensile test. The dimensions of the
test pieces and the testing procedure followed must be in accordance with Australian
Standards to determine the strength properties accurately.
6. Analyse proposed design, check for strength, deflection etc... and provide critical
comments.
Check that the current design satisfies all relevant criteria in accordance with current
Australian Standards. In particular, check that the design is compliant with ultimate limit
state (ULS) and serviceability limit state (SLS) conditions. Use computer analysis
software to check the deflections and forces on the shed, including axial, shear, and
bending moments do not exceed the recommendations provided in the standards.
7. Preparing documentation for council approval.
Ensure that all the drawings and documents are ready for submission to council to gain
approval, and that they comply fully with Australian Standards. Since this is a real
project, the drawings and documentation must be prepared in accordance with
Toowoomba City Council requirements, and contain all relevant information with
sufficient detail to a specific standard set out by the Council.
1.5 Safety Issues
Construction of the shed will not take place until after this project has been completed.
There are no current safety issues that will be of concern during the design stage of the
restoration shed. However there are many risks associated with the construction of this
large steel portalframed structure. The worst case scenario is if the shed collapses in
some way, resulting in loss of lives. The risk assessment lists safety issues associated
CHAPTER 1 – INTRODUCTION 9
with the construction of the restoration shed after the completion of this project. It lists
each potential risk, the associated hazard, the likelihood of occurrence of the risk, the
probability of exposure, the consequences, and the recommended control measures.
1.5.1 Risk Assessment
(a)
Risk: Workshop collapsing during construction.
Hazard: Heavy steel members.
Likelihood of occurrence: Slight.
Exposure: Frequently during construction.
Consequences: Possible death, major destruction of equipment.
Control Measures:
• Ensure correct lifting techniques are in place.
• Ensure members are erected in the proper order.
• Ensure connections are rigid enough as per the plans.
• Ensure appropriate safety equipment is used on site.
• Ensure structural components are fully supported and braced until self standing.
• Limit access by non essential staff and public to the worksite.
(b)
Risk: Workshop collapsing after construction.
Hazard: Heavy steel members.
Likelihood of occurrence: Very slight.
Exposure: Frequently for workers who are in the workshop most days.
Consequences: Possible death, major destruction of equipment.
Control Measures:
• Ensure the shed is built in accordance to Australian standards.
• Ensure the shed is built properly without any shortcuts or errors in construction.
• Ensure appropriate measures are taken if workshop conditions change.

CHAPTER 1 – INTRODUCTION 10
(c)
Risk: Slab cracking.
Hazard: Differential slab height, large cracks opening, integrity of slab compromised.
Likelihood of occurrence: Significant.
Exposure: Frequently.
Consequences: Minor equipment/component damage, minor injury.
Control Measures:
• Ensure slab is adequately vibrated to remove air bubbles.
• Ensure slab is not vibrated too much as to cause segregation.
• Check adequate cover to reinforcement as per design.
• Do not exceed load limits on slab, especially large point loads.
• Ensure subgrade has sufficient strength and compacted in layers, as specified in
notes drawing.
1.6 Resource Requirements
Many of the resources required to complete this project were made available to the
author. The University of Southern Queensland made its laboratory facilities available
for the author to use at no charge. GHD Consulting Engineers Ltd. gave the author
permission to access A3 printing facilities, scanner, Australian Standards, other text
books and computer programs to help complete the objectives of the research project.
The wind loading calculator used to check the wind loading hand calculations is a
program which was written by the author.
The following is a summary of the resources used to complete the project.
• Steel samples cut from member – USQ laboratory
• Tensile testing apparatus/equipment – USQ laboratory
• Space Gass – GHD Toowoomba office
• Wind loading program – Personal computer
• Australian Standards – GHD Toowoomba office
CHAPTER 1 – INTRODUCTION 11
• A3 Printer/photocopier – GHD Toowoomba office
• Other books, manuals and texts – GHD Toowoomba office, USQ Library
• Internet/email access – Personal computer
1.7 Timelines for Various Phases of Work
To complete the design, the following tasks need to be achieved.
• The steel needs to be tested and the strength properties determined.
• Wind loads acting on the shed need to be calculated for the area.
• The shed needs to be inputted and analysed in Space Gass.
• The soil strength and reactivity will govern the slab design, however a worst case
scenario must be assumed for the design until the society can provide finances for
a soil test.
• The shed needs to be modified to suit its purpose for restoring steam engines, and
details of all modifications defined.
• Several drawings need to be drafted including structural framing plans, a
foundation plan, an external works plan, and a sanitary drainage plan.
Table 1.1 shows the objectives completed, and the approximate dates they were
completed. A small number of tasks had time delays due to reliance upon different
people and organisations as to their completion. There were some tasks such as testing of
the materials, checking strength and deflections that were solely the responsibility of the
author as to when they were completed.

CHAPTER 1 – INTRODUCTION 12
Objective Objective Description Specific Tasks CompletionNumber Date
1 Background Study Research DDHRS 10/04/06
Research Site 10/04/06
Research Bethlehem Steel Company 10/04/06
2 Modify Original Design Add concrete wall to base of steel
columns
12/04/06
Detail Railline 28/08/06
Detail Service Pit 04/10/06
3 Prepare Sewer and Draw up site plan from QR plan 25/04/06
Sanitary Drainage Design sewer and sanitary drainage and 25/04/06
Plans add to plans
Submit plans to Clive Berghofer for
construction
30/05/06
4 Site Hydraulics and Calculate amount of water needed by 02/05/06
Hydrology society
Size gutters and downpipes for the
workshop
28/05/06
5 Material Testing Obtain a section of steel for testing 08/06/06
Subject Steel to a tensile test and
calculate lower yield strength
31/06/06
6 Analyse Design Check ultimate limit state conditions 25/08/06
Check serviceability limit state conditions 25/08/06
Check combination of actions 30/08/06
Check workshop fully complies with
Australian Standards
30/07/06
Design Workshop Slab 15/07/06
7 Prepare Drawings for Prepare sewer plans 29/05/06
Toowoomba City Council Prepare workshop structural plans 15/08/06
Approval Check rainwater tank locations are ok
with council
02/05/06
Check Planning Scheme for any building
restrictions
30/05/06
Table 1.1 – Project Objective Timelines

Chapter 2
Design of the Steel Restoration Shed
The shed is to be designed using standard procedures and practices that are applied in a
modern design office. The existing steel members and trusses are analysed in their un
restored condition and the restoration process is described. The modifications to the shed
are discussed in detail, and any associated issues addressed.
2.1 Design Procedure
The methodology used in this project is broad due to many different areas of engineering
covered. The analysis of the shed is to be completed using a software program and the
results checked against the relevant Australian Standards. The design program chosen to
model and carry out the analysis of the structure is ‘Space Gass’. Since the first internal
portal frame is subject to the largest loads, it is used to model the other frames, giving the
most conservative results. These results will not be solely relied upon as some hand
calculations using the appropriate formulas will be completed as a check. This is done
because computational error can be very common due to many reasons, one of these
being incorrect data entry.
In addition to the structural design, this project also involves the preparation of various
documents and drawings for submission to Council for approval. The site hydraulics also
needs to be designed. Surveying and planning needs to be done to locate the exact
position of the steel shed and other buildings on site. Testing the soil where the sheds

CHAPTER 2 – DESIGN OF THE STEEL RESTORATION SHED 14
foundations will be laid and classifying the area depending on the subgrades reactivity is
another aspect that has to be addressed. To accurately complete the project drawings, soil
testing at the position of where the foundations of the shed are going to be laid must be
undertaken. This will involve undertaking a California Bearing Ratio test (CBR) to
determine the CBR of the soil, and its clay consistency. This value will be used to
classify the soil type, and determine its bearing strength. Also a shrinkswell test must be
undertaken to determine the reactivity of the underlying material, i.e. how much it will
expand and contract depending on the moisture conditions. Important dimensions such
as the slab thicknesses and pier depths are dependent on the strength and reactivity of the
soil. This may require modification of the design after completing these tests.
Another important aspect of the design is to calculate the estimated future net water
consumption of the society based on the approximate amount of water used and the
averaged amount of incoming water from four years of rainfall data. The society needs
plenty of water for refilling steam engine’s boilers, landscaping, amenities facilities
including showers, cleaning of infrastructure, and for workshop use.
All survey measurements will be conducted first using a trundle wheel as an approximate
distance. Since accurate measurement with this device requires relatively flat ground,
and the user walking in a perfectly straight line, it is not always accurate enough for
planning purposes. Theses distances are to be checked and reworked either by a long
tape measure, electronic distance measuring equipment, or by a professional surveyor.
2.2 Existing Steel Members
The existing steel members have been stored in an outside environment both before being
transported to site, and ever since being moved to the site. They have been subject to
damage from weathering effects for a long period of time. Estimated damage due to
these storage conditions is approximated to be around 10 percent. Damage exhibited by
the members mainly consists of rusting of the steel surface, and corrosion leading to a

CHAPTER 2 – DESIGN OF THE STEEL RESTORATION SHED 15
reduction in steel thicknesses. The steel members are old and were manufactured when
tapered flange sections were widely used around the world. A typical tapered universal
beam section takes the shape shown on the left of Figure 2.1. In modern day
construction, regular universal beams have a flat flange and are a more economical
section with less weight as shown on the right of Figure 2.1.
Figure 2.1 – Comparison of Universal Beam Section
2.2.1 Member Dimensions
Member Section Quantity Length Depth Breadth Web FlangeType Thickness Thickness
Column UB 12 5890 400 180 10 8 12
Mullion UB 2 5773 113 200 8.5 8 12.8
32 6150 140 54.9 5.6 7 12.5
PFC 44 5780 127.5 50 6.6 7 13.8Purlin/Girt
8 5070 127.5 50 6.6 7 13.8
Bracing UA 6 5565 76.5 52.1 6.1 5.7 7.2
UA’s &Roof Truss
EA’s6 13260 3378
Table 2.1 – Recorded Steel Member Measurements
NormalUniversalBeam
TaperedFlangeUniversalBeam

CHAPTER 2 – DESIGN OF THE STEEL RESTORATION SHED 16
Note:
• All recorded measurements are in millimetres
• All sections have tapered flanges, hence the minimum and maximum flange
thicknesses observed
• UB = Universal Beam
• PFC = Parallel Flanged Channel
• UA = Unequal Angle
• EA = Equal Angle
2.2.2 Truss Sections
The truss sections have been inspected and sized for input into Space Gass. The layout of
the web and chord members of the truss are in ‘fink’ configuration, see Figure 2.2. This
style is not commonly used modern construction since engineers prefer to use a simpler
‘warren’ or ‘pratt’ truss configuration. An inspection of the truss members determined
that all of these members consist of equal and unequal angle sections. The majority of
truss members including the main top and bottom chords are made up of two unequal
angle sections, bolted together back to back at regular intervals. It is assumed that since
the bolt spacing of angles is relatively close, the combined angle sections act as a single
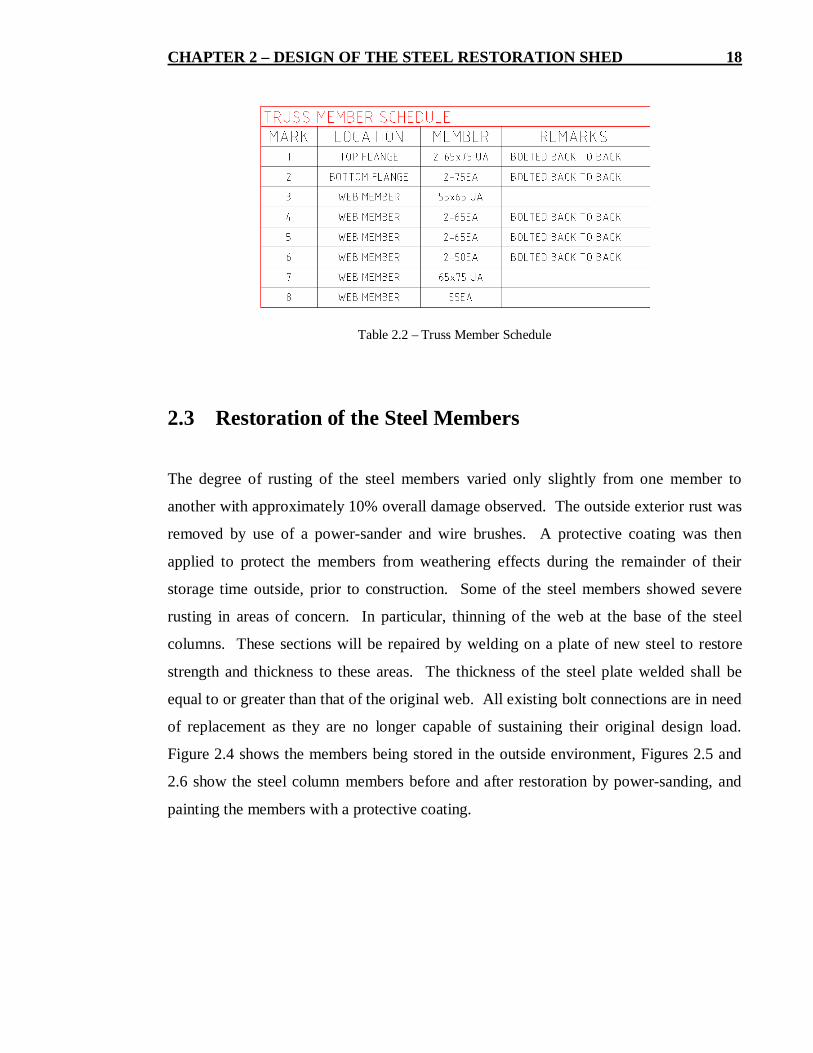
‘T section’, and is to be inputted into Space Gass accordingly. Figure 2.3 shows the truss
detail from the structural drawing, S003 – End Elevations Plan, along with a description
of the truss members in Table 2.2.

CHAPTER 2 – DESIGN OF THE STEEL RESTORATION SHED 17
Figure 2.2 – Typical Truss Arrangements
Figure 2.3 – Truss Detail
CHAPTER 2 – DESIGN OF THE STEEL RESTORATION SHED 18
Table 2.2 – Truss Member Schedule
2.3 Restoration of the Steel Members
The degree of rusting of the steel members varied only slightly from one member to
another with approximately 10% overall damage observed. The outside exterior rust was
removed by use of a powersander and wire brushes. A protective coating was then
applied to protect the members from weathering effects during the remainder of their
storage time outside, prior to construction. Some of the steel members showed severe
rusting in areas of concern. In particular, thinning of the web at the base of the steel
columns. These sections will be repaired by welding on a plate of new steel to restore
strength and thickness to these areas. The thickness of the steel plate welded shall be
equal to or greater than that of the original web. All existing bolt connections are in need
of replacement as they are no longer capable of sustaining their original design load.
Figure 2.4 shows the members being stored in the outside environment, Figures 2.5 and
2.6 show the steel column members before and after restoration by powersanding, and
painting the members with a protective coating.

CHAPTER 2 – DESIGN OF THE STEEL RESTORATION SHED 19
Figure 2.4 – Steel Members Stored in Exposed Environment
Figure 2.5 – Steel Members Before Restoration

CHAPTER 2 – DESIGN OF THE STEEL RESTORATION SHED 20
Figure 2.6 – Steel Members After Restoration
2.4 Workshop Modifications
The workshop has to be specifically designed to suit the needs of the Darling Downs
Historical Rail Society. They need a large roofed area, protected from weathering effects
in which to repair and restore large steam engines and train sections. The workshop has
to be high enough to allow for the addition of a gantry crane, and provide sufficient
lifting and manoeuvring room for the machinery used. The shed also has to
accommodate two sets of railway lines running longitudinally full length through it. It
also has to contain a below ground concrete service pit to allow workers easy access to
underneath the steam engines.

CHAPTER 2 – DESIGN OF THE STEEL RESTORATION SHED 21
2.4.1 Addition of Railway Lines
One of the main requirements of the DDHRS was that the shed needs to contain 2 sets of
railway lines running longitudinally full length through the shed, and out the other side.
This will to allow for steam trains to be driven into the shed and worked on under cover.
The shed will act as a place to store steam engines undercover to protect them from
vandalism and weathering effects. Rails will be positioned approximately 3 metres from
the eastern and western walls, with the top of the rails, flush with the top of slab. The
eastern rail will originate from the existing rail near the station from the north then after
running through the shed will rejoin back with the main line towards the extreme
southern side of the site to form a closed loop. The other western rail line will run from
the north full length of the site parallel with Cambooya St stopping at the turn table. The
other end of this western railline cuts off at a dead end after about 20 metres past the end
of the workshop. Figure 2.7 shows part of the External Layout Plan and depicts where
the rails are located within the restoration shed.
Figure 2.7 – Workshop Rail Line Locations
Throughout Australia there are 3 different railway gauges that are used (distance between
inside of rails), narrow, standard and broad gauge. Narrow gauges of 1067 mm between
rails, are used widely through out Queensland, and are used throughout the Rail Societies
base of operations. To properly design the restoration workshop for the DDHRS, this
gauge length and the rails crosssectional dimensions has to be known to ensure there is
enough room either side of the rail line for workers and benches etc… Figure 2.8 shows
the dimensions recorded, common to both the current and proposed rail line.

CHAPTER 2 – DESIGN OF THE STEEL RESTORATION SHED 22
Figure 2.8 – Rail line Crosssection
2.4.2 Increasing the Height of the Restoration Shed
A major structural modification that the rail society requested is to increase the overall
height of the shed, providing more clearance inside the workshop. The main reason for
this modification is to allow for the addition of a gantry crane to be used within the
workshop for lifting purposes, details of this are explained in the next section. Two main
methods of increasing the height of the workshop were investigated. The first method is
to increase the length of the columns by adding on extra steel. The steel has to be in a
separate section that is attached onto the main column by a welding a steel plate onto
both sections. The second method involves extending the concrete piers under the
columns by having them partially exposed 1.6 metres above the natural surface level and
building a concrete block wall using 90 mm standard Besser Blocks between each
exposed concrete pier. This method is more affordable to the society since Wagners
Concrete has previously offered to supply all the concrete needed for construction
including footpaths, piers, slabs and walls. Out of both options it was decided to adopt
option 2 and build a reinforced concrete wall approximately 1.6 metres high thus giving
and extra 1.6 metres clearance inside the restoration shed for the crane. Costs to the
society include obtaining enough reinforcing steel to comply with the Australian
Standards for the design of the wall, and to cater for the extra time required to build the
wall. This option is preferred over the first option mainly due to cost. Option 1 requires
the society to purchase new steel sections to add extra height to the columns which is
extremely expensive and tapered flange beams are no longer readily available as steel
companies no longer manufacture these types of sections. In option 1, normal flat
universal beams would have had to have been brought by the society or donated to them,
and attached to the existing columns via welding or full moment connection bolting.

CHAPTER 2 – DESIGN OF THE STEEL RESTORATION SHED 23
Figure 2.9 shows the elevation view of the block work wall to be used to increase the
height of the restoration shed, as drawn by Farr Evratt Consulting Engineers. Also Table
2.3 in conjunction with Figure 2.10 from the Besser product catalogue describes what
size and type of reinforcing are appropriate to use within the block work wall. All
reinforcement sized from the Besser catalogue has previously been checked to be within
the Australian Standards limits. The blockwork wall has been included between the
concrete piers to stabilize them and resist any horizontal movement of piers as they take
the load from the columns. Since the blockwork wall is not retaining any soil or fill as
detailed in the Besser Product catalogue and Figure 2.10, there is no need to add a key as
shown at the bottom of the blockwall. The slab will be thickened around the perimeter
of shed layout to provide extra support for the main structural loadings.
Figure 2.9 – Blockwall Detail

CHAPTER 2 – DESIGN OF THE STEEL RESTORATION SHED 24
Table 2.3 – Besser Reinforcement Details
Figure 2.10 – Besser 200 Series Blockwall Detail

CHAPTER 2 – DESIGN OF THE STEEL RESTORATION SHED 25
2.4.3 Addition of a Gantry Crane
Typically a gantry crane runs in both the ‘x’ and ‘y’ directions on a horizontal plane by
means of rail lines. A large main rail runs either side of the building along the long axis,
with a set of smaller rail lines spanning between them. A gantry crane basically uses a
hook and electronic chain, attached to the driving mechanism which runs long the short
axis rails, this section is called the ‘crab’. This left and right movement along the small
rails in combination with the forward and backwards movement along the long axis rails,
allows for heavy objects to be moved to almost any part of the shed. The crane is
controlled by an electronic controller similar to the one shown in Figure 2.11.
Figure 2.11 – Gantry Electronic Controller
During the month of February, 2006, Wagners contacted the DDHRS with news that they
might have the original 20 tonne gantry crane previously used in the same shed, stored
within their spare parts storage area. They offered to donate the gantry crane to the

CHAPTER 2 – DESIGN OF THE STEEL RESTORATION SHED 26
society and transport it for free. Following this news, two separate inspections were
undertaken to assess the suitability of the crane for use within the restoration workshop.
The workshop crane was separated into two main parts. The first part was the lower
section of the crane, containing all the electronic components, the hook, and the chain.
The second part of the crane located some 20 metres away in Wagners spare parts storage
area, contained a set of beams which supported the gantry winch with large wheels either
side, which were designed to run along the rails of section 1. The columns used to
support these were scattered in other areas, and were difficult to identify. The first
section comprised of four 510 millimetre tapered universal beams with a 10 millimetre
plate welded on the top flange, and a 118 millimetre rail on top of the plate. The second
section comprised of a set of two closely spaced tapered universal beams 610 millimetres
high with a 10 millimetre thick plate, welded on top. Figure 2.12 diagrammatically
shows sketches of both beams crosssections, recorded whilst on site.
Figure 2.12 – Gantry Beam CrossSections
The gantry crane had been severely rusted and damaged by weathering effects as a result
of being left unmaintained in the open. All of the electrical components were damaged,
in need of repairing, and all the rust sanded off. The gantry crane originally had a 20
tonne capacity which had since been downgraded to 15 tonnes capacity, most probably
due to age related damage. This was evident since embossed on the side of one of the

CHAPTER 2 – DESIGN OF THE STEEL RESTORATION SHED 27
beams was the words ‘MAXIMUM LOAD NOT TO EXCEED 20 TONS’ with the
number 15 painted over the 20, as shown in Figure 2.13.
Figure 2.13 – Gantry Cranes Maximum Load
The text below was found written on the rails, and was identified by chalk rubbings.
60 LB (B – 1928) A I S V11 9 2 4 O H
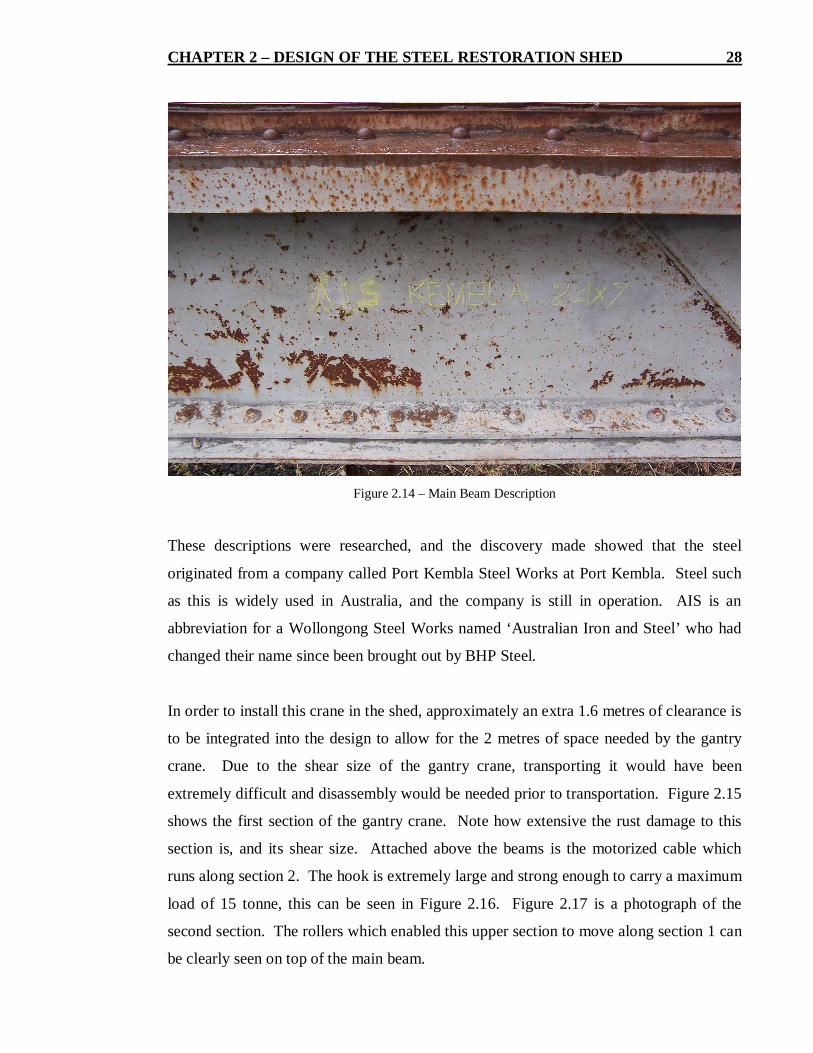
Also a description of the main beams as shown in Figure 2.14 was found to read:
A I S KEMBLA 24x7
CHAPTER 2 – DESIGN OF THE STEEL RESTORATION SHED 28
Figure 2.14 – Main Beam Description
These descriptions were researched, and the discovery made showed that the steel
originated from a company called Port Kembla Steel Works at Port Kembla. Steel such
as this is widely used in Australia, and the company is still in operation. AIS is an
abbreviation for a Wollongong Steel Works named ‘Australian Iron and Steel’ who had
changed their name since been brought out by BHP Steel.
In order to install this crane in the shed, approximately an extra 1.6 metres of clearance is
to be integrated into the design to allow for the 2 metres of space needed by the gantry
crane. Due to the shear size of the gantry crane, transporting it would have been
extremely difficult and disassembly would be needed prior to transportation. Figure 2.15
shows the first section of the gantry crane. Note how extensive the rust damage to this
section is, and its shear size. Attached above the beams is the motorized cable which
runs along section 2. The hook is extremely large and strong enough to carry a maximum
load of 15 tonne, this can be seen in Figure 2.16. Figure 2.17 is a photograph of the
second section. The rollers which enabled this upper section to move along section 1 can
be clearly seen on top of the main beam.

CHAPTER 2 – DESIGN OF THE STEEL RESTORATION SHED 29
Figure 2.15 –Section 1 and Motor Component
Figure 2.16 – Gantry Crane Hook

CHAPTER 2 – DESIGN OF THE STEEL RESTORATION SHED 30
Figure 2.17 – Section 2
After obtaining all the dimensions and details of the gantry crane from the two site visits,
the costings of repair, disassembly, transportation, and installation were approximated.
Since the DDHRS didn’t have any funds to budget for the cost of a gantry crane, this was
the best option to acquire a gantry crane to use within their restoration workshop.
Subsequently it was decided that the cost of having to repair all the electronics on the
gantry crane, plus the cost of cleaning up the rust and transportation was too much for the
society’s modest budget. The total cost of including this crane without the initial cost of
purchase, was still thousands of dollars above the societies budget. When comparing this
cost to the benefits received by the DDHRS, it is not worth including this modification in
the design. Given the relative dimensions found during the site visits, it was determined
that this crane did not belong to the original shed, and thus this constitutes another reason
for not including the crane in the design. The modification was therefore rejected.
Increasing the columns lengths, as previously discussed to achieve extra clearance, was
no longer a requirement. The DDHRS has decided that they will have enough clearance
to use particular lifting equipment inside the shed such as a mobile tractor crane, without
modifying the columns.

CHAPTER 2 – DESIGN OF THE STEEL RESTORATION SHED 31
2.4.4 Workshop Service Pit
To enable the workers to reach underneath the steam train components, a concrete
workshop pit is considered an important modification to the shed design. The workshop
pit is to be installed on the eastern side of the shed around the eastern railway line. The
society’s staff decided on this location due to the direction of the sun. The strongest heat
from the sun is during summer from a westerly direction. So the society decided to
position their workbench along the eastern wall, as well as having their work tools close
at hand. The pit location was chosen to be running closely along side the eastern wall.
The pit is designed to be similar to several existing workshop pits for restoring steam
engines in Willowburn, Cairns, Bundaberg and Rosewood. It is designed to be 15 metres
long and have a width equal to the distance between rails (1067 millimetres). It is to be
constructed in one level, approximately 1.22 metres below the top of rails.
2.5 Design Conclusions
The existing steel members must be fully repaired and restored prior to construction. All
surface rust on the steel is to be removed with a powersander and wire brushes, then the
members can be painted with a protective weather proofing layer. All existing steel
sections that are to be recycled should to be fully inspected for any thinning due to
corrosion. After inspection of the members, the repair method to use is to attach a steel
plate over the affected area by means of a continuous fillet weld. This repair method will
restore thickness and strength to the thinned area.

Chapter 3
Determination of the Material Properties
of the Steel
An important part of this research project involves testing a steel member to determine
the mechanical of the steel. Three test samples were cut and prepared from an unwanted
‘C’ section originally joined to one of the columns as a bracing member. The properties
of this steel section were determined to represent all the steel members used in the
restoration shed.
3.1 Tensile Testing Procedure
The process used for testing the three samples cut from a ‘C’ channel steel section is
described in AS1391 – Steel Tensile Testing code.
1. Using calipers, measure and record the crosssectional dimensions of the
specimen. These include gauge thicknesses, gauge lengths, flange thicknesses
and flange lengths.
2. Measure the length of the steel sample.
3. Set up the tensile testing machine ensuring the dial gauges are set to 0, and input
all initial testing information into the testing program.
4. Place the steel sample between jaws of the machine, tighten firmly and move the
safety screen into position.
CHAPTER 3 – DETERMINING THE PROPERTIES OF THE STEEL 33
5. Turn the machine on and observe the increase in load as the sample is being
loaded.
6. Once the specimen has yielded and failed, turn the machine off.
7. Remove the specimen from the clamping jaws.
8. Print the results from the computer program.
9. Read off the lower yield stress as the strength of the sample.
10. Repeat steps 1 through to 9 for all other test samples.
11. Calculate the average of the lower yield stresses for the samples as the strength of
the steel.
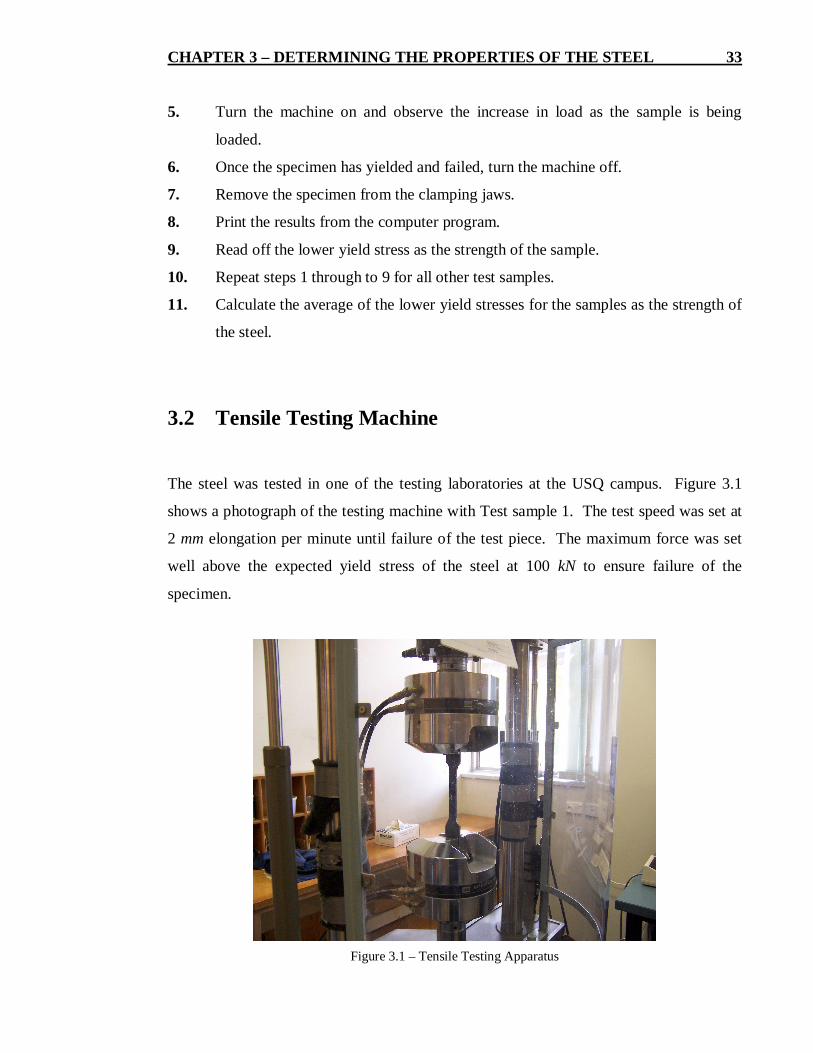
3.2 Tensile Testing Machine
The steel was tested in one of the testing laboratories at the USQ campus. Figure 3.1
shows a photograph of the testing machine with Test sample 1. The test speed was set at
2 mm elongation per minute until failure of the test piece. The maximum force was set
well above the expected yield stress of the steel at 100 kN to ensure failure of the
specimen.
Figure 3.1 – Tensile Testing Apparatus
CHAPTER 3 – DETERMINING THE PROPERTIES OF THE STEEL 34
3.3 Sample Test Pieces
The steel samples although cut to the same dimensions in accordance with AS1391, have
slightly different lengths and thicknesses due to manufacturing inaccuracies. The exact
dimensions of each member were determined using a pair of electronic callipers and the
data inputted into the testing program to produce minimal error in results. Initial
information was collected 3 times with the mode of the data used.
3.3.1 Test Setup
In accordance with AS1391
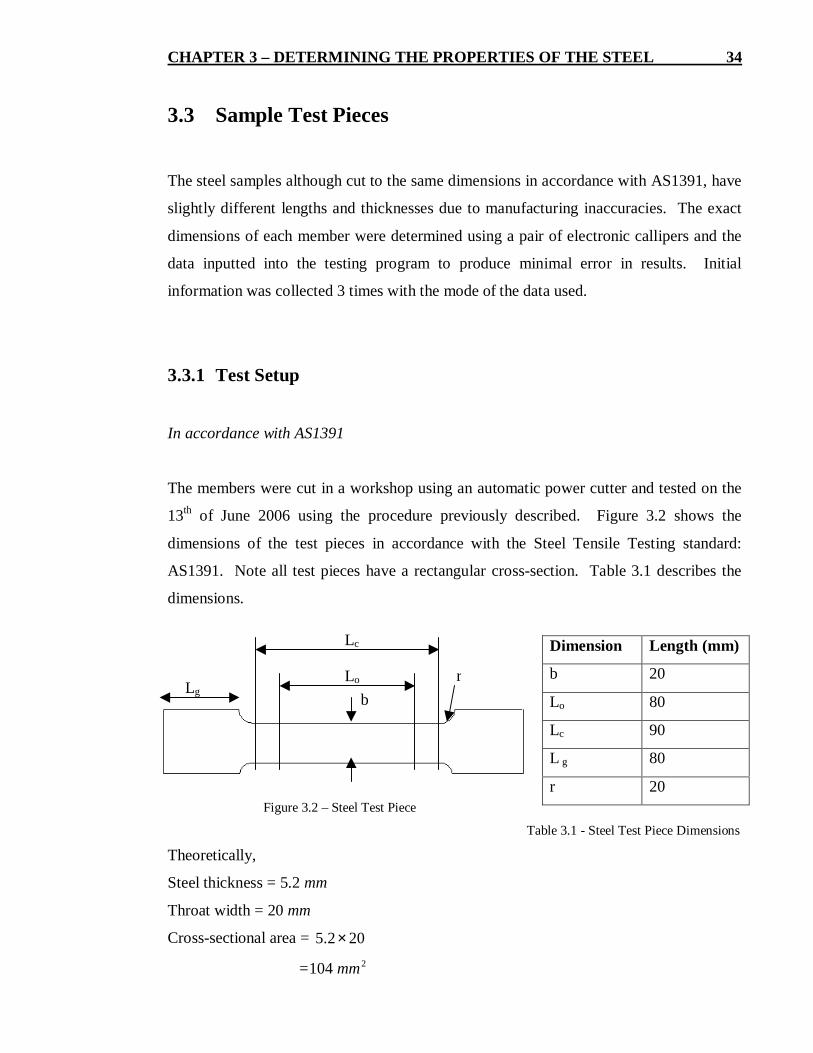
The members were cut in a workshop using an automatic power cutter and tested on the
13th of June 2006 using the procedure previously described. Figure 3.2 shows the
dimensions of the test pieces in accordance with the Steel Tensile Testing standard:
AS1391. Note all test pieces have a rectangular crosssection. Table 3.1 describes the
dimensions.
Figure 3.2 – Steel Test Piece
Table 3.1 Steel Test Piece Dimensions
Theoretically,
Steel thickness = 5.2 mm
Throat width = 20 mm
Crosssectional area = 202.5 ×
= 2104 mm
Dimension Length (mm)
b 20
Lo 80
Lc 90
L g 80
r 20
Lo
b
Lc
Lgr

CHAPTER 3 – DETERMINING THE PROPERTIES OF THE STEEL 35
Test Piece 1
Thickness = 5.20 mm, 5.22 mm, 5.20 mm
= 5.20 mm
Length = 20.01 mm, 20.10 mm, 20.10 mm
= 20.10 mm
Lo = 80 mm
Test Piece 2
Thickness = 5.19 mm, 5.18 mm, 5.18 mm
= 5.18 mm
Length = 20.17 mm, 20.17 mm, 20.18 mm
= 20.17 mm
Lo = 80 mm
Test Piece 3
Thickness = 5.18 mm, 5.19 mm, 5.18 mm
= 5.18 mm
Length = 20.15 mm, 20.19 mm, 20.19 mm
= 20.19 mm
Lo = 80 mm

CHAPTER 3 – DETERMINING THE PROPERTIES OF THE STEEL 36
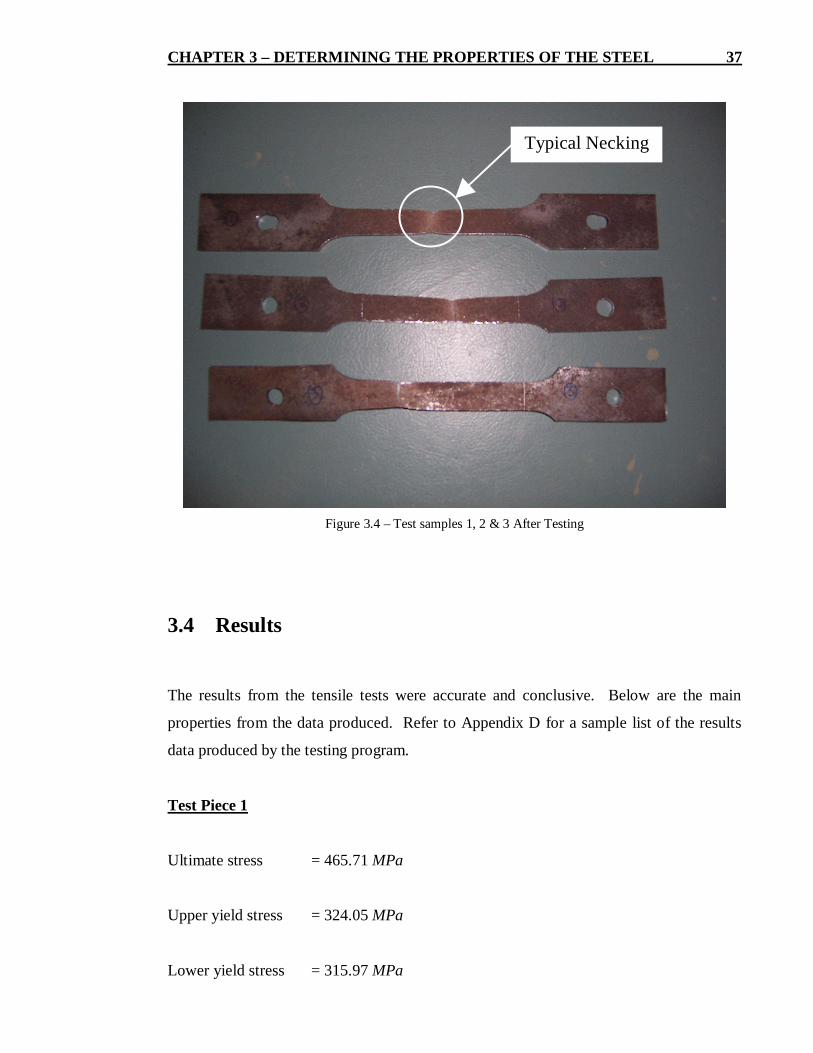
Figure 3.3 shows the test samples 1, 2 and 3 (in order from top to bottom) before testing.
Figure 3.4 shows the test samples 1, 2 and 3 (in order from top to bottom) after testing.
Notice the necking exhibited by the steel approximately midway along the sample, as it
has been increasingly strained the crosssectional area has reduced until ultimate failure
of the test piece.
Figure 3.3 – Test samples 1, 2 & 3 Before Testing
CHAPTER 3 – DETERMINING THE PROPERTIES OF THE STEEL 37
Figure 3.4 – Test samples 1, 2 & 3 After Testing
3.4 Results
The results from the tensile tests were accurate and conclusive. Below are the main
properties from the data produced. Refer to Appendix D for a sample list of the results
data produced by the testing program.
Test Piece 1
Ultimate stress = 465.71 MPa
Upper yield stress = 324.05 MPa
Lower yield stress = 315.97 MPa
Typical Necking

CHAPTER 3 – DETERMINING THE PROPERTIES OF THE STEEL 38
MPa
stressyieldAverage
01.320
297.31505.324
=
+=
Test Piece 2
Ultimate stress = 459.23 MPa
Upper yield stress = 324.46 MPa
Lower yield stress = 306.17 MPa
MPa
stressyieldAverage
32.315
217.30646.324
=
+=
Test Piece 3
Ultimate stress = 466.72 MPa
Upper yield stress = 324.74 MPa
Lower yield stress = 312.12 MPa
MPa
stressyieldAverage
48.318
212.31274.324
=
+=

CHAPTER 3 – DETERMINING THE PROPERTIES OF THE STEEL 39
3.5 Comparison of Sample Results
All three testing samples were tested at the same time under the same conditions. As
expected, they produced simular results. Although test piece 2 displayed a lower yield
strength and ultimate strength than the other 2 test pieces, the results were still very
conclusive.
3.6 Calculation of Steel Properties
Steel Ultimate Stress Mean:
( )
MPa
avgu
89.4633
72.46623.45971.465,
=
++=σ
Steel Ultimate Stress Range:
( )
MPa
SmallestgestLar uurangeu
49.723.45972.466
,
=−=
−= σσσ
Steel Upper Yield Stress Mean:
( )
MPa
avguppy
42.3243
74.32446.32405.324,,
=
++=σ

CHAPTER 3 – DETERMINING THE PROPERTIES OF THE STEEL 40
Steel Upper Yield Stress Range:
( )
MPa
SmallestgestLar uurangeuppy
69.005.32474.324
,,
=−=
−= σσσ
Steel Lower Yield Stress Mean:
( )
MPa
avglowy
45.3113
21.31217.30697.315,,
=
++=σ
Steel Lower Yield Stress Range:
( )
MPa
SmallestgestLar uurangelowy
8.917.30697.315
,,
=−=
−= σσσ
The properties for each steel sample shown above have been summarized within Table
3.2.
Sample Number
Material Property Units 1 2 3 Mean Range
Ultimate Stress (MPa) 465.71 459.23 466.72 463.887 7.49
Upper Yield Stress (MPa) 324.05 324.46 324.74 324.417 0.69
Lower Yield Stress (MPa) 315.97 306.17 312.21 311.45 9.8
Average Yield Stress (Mpa) 320.01 315.32 318.48 317.937 4.69
Table 3.2 – Summary of Sample Properties

CHAPTER 3 – DETERMINING THE PROPERTIES OF THE STEEL 41
3.7 Conclusion
From the summary of data given above in Table 3.2, the steel has an approximate yield
stress, MPayield 306=σ . Since the yield strength of the steel is above the 300 MPa
standard figure, the restoration shed can be accurately modeled in the structural design
analysis program ‘Space Gass’, and accurately designed in conjunction with the
Australian Standards since this figure is adopted as a default throughout their
subscriptions. From the tensile testing data, it has been proved that the steel used for
designing the Darling Downs Historical Rail Societies restoration shed is equal to or
greater than the strength of prefabricated standard steel sections used in today’s society,
and as listed in the ‘Australian Institute of Steel Construction – Design capacity tables’
book and the Space Gass analysis software. Table 3.3 lists the equivalent ‘flat flanged’
steel section for each existing tapered section to be used in the computer design of the
shed.
Existing Tapered Flange Section Equivalent Normal Section
Member Type Section (inch) I xx (*106 mm4) Section (mm) I xx (*106 mm4)
Column 16x6” UB 257 410UB59.7 216
Truss – flange 2.5x3” UA 0.586 65x75 UA 0.421
Truss flange 3” EA 1.03 75x75 EA 0.913
Truss web 2.5” EA 0.638 65x65 EA 0.589
Truss web 2” EA 0.319 50x50 EA 0.253
Table 3.3 – Tapered Members Equivalent Sections

Chapter 4
Structural Analysis of the Design
This chapter involves the structural analysis of the restoration shed including the
calculation of all wind loads and live loads imposed on the shed. The existing purlins
and girts for the shed have to be checked to ensure that they are large enough in section,
and there are enough existing members to achieve the required spacings. A model of a
single portal frame needs to be drawn in the structural design analysis program: ‘Space
Gass’, the worst load combinations applied to the frame, and the frame analysed. Once
the worst case loads on this frame have been analysed, the program will output all
deflections, bending moment forces, shear forces and axial forces for each component of
the frame. These loads will then be checked for compliance against the Australian
Standard recommendations. All drawings drafted for the DDHRS are have also been
listed in this chapter.
CHAPTER 4 – STRUCTURAL ANALYSIS OF THE DESIGN 43
4.1 Wind Calculations
4.1.1 Initial Information
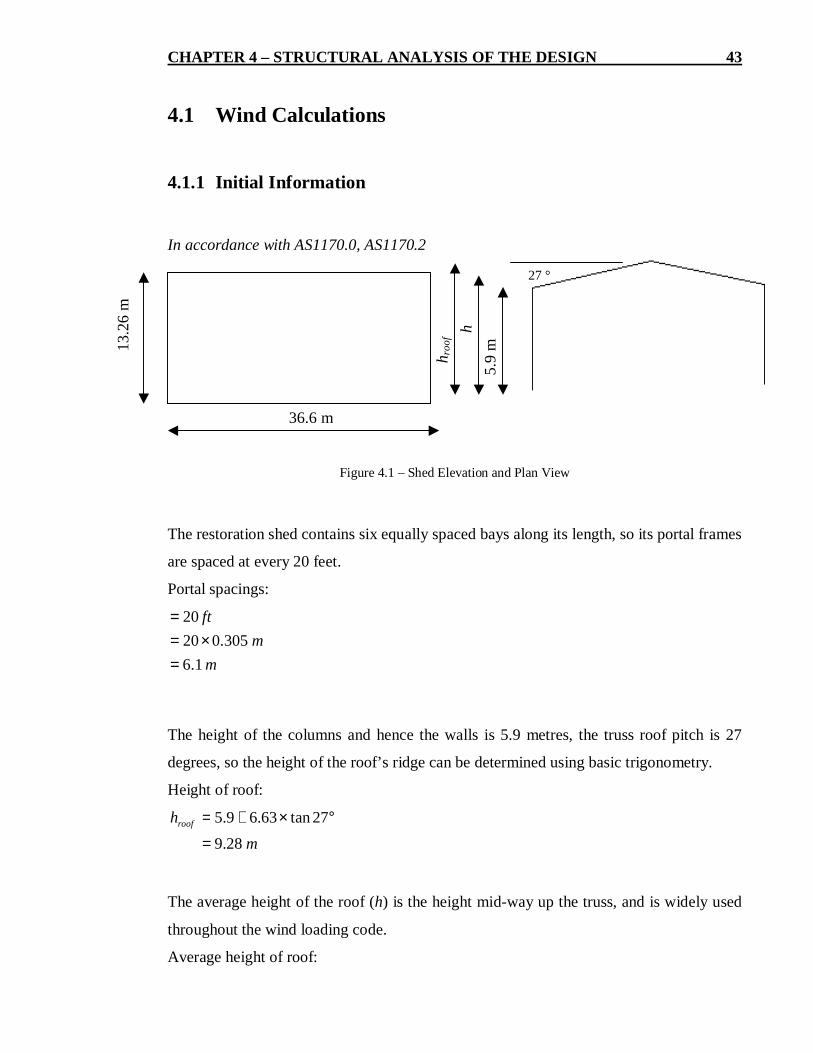
In accordance with AS1170.0, AS1170.2
Figure 4.1 – Shed Elevation and Plan View
The restoration shed contains six equally spaced bays along its length, so its portal frames
are spaced at every 20 feet.
Portal spacings:
mm
ft
1.6305.020
20
=×=
=
The height of the columns and hence the walls is 5.9 metres, the truss roof pitch is 27
degrees, so the height of the roof’s ridge can be determined using basic trigonometry.
Height of roof:
mhroof
28.927tan63.69.5
=
°×+=
The average height of the roof (h) is the height midway up the truss, and is widely used
throughout the wind loading code.
Average height of roof:
36.6 m
13.2
6 m
5.9
m
h roo
f
h
27 °

CHAPTER 4 – STRUCTURAL ANALYSIS OF THE DESIGN 44
mh 6.72
)9.528.9(9.5 =−
+=
This equation defines the sites wind speed for the eight cardinal directions ( ) at the
reference height (z) above ground; it is dependant on many of the sites variable
properties.
tscatzdrsit MMMMVV .... ,, =β [AS1170.2 – Eqn. 2.2]
The restoration shed is classified as a normal structure with a medium consequence for
loss of human life, thus has an importance level equal to 2.
Importance level = 2 [AS1170.0 – Tab. F1]
The shed is to be designed for a working life of 50 years, after which its structural
adequacy will need to be assessed and repaired accordingly.
Design working life 50 years
The shed is being built in a noncyclonic area, subject to wind loads only. The design
events for safety in terms of annual probability of exceedance is 1 in 500.
Probability of exceedance =500
1 (ultimate wind loading) [AS1170.0 – Tab. F2]
For all serviceability limit state conditions, the annual probability of exceedance is
always 1 in 20.
Probability of exceedance =201 (serviceability wind loading)
According to Figure 3.1, the location of the shed: Toowoomba, Queensland is in Region
A4.
Region = A4
CHAPTER 4 – STRUCTURAL ANALYSIS OF THE DESIGN 45
VR is the regional wind speed for all directions where R is the inverse of the annual
probability of exceedance of the wind speed. This value is 500 for ultimate wind loading,
and 20 for serviceability wind loading.
VR = 45 m/s (ultimate wind loading) [AS1170.2 – Tab. 3.1]
VR = 37 m/s (serviceability wind loading) [AS1170.2 – Tab. 3.1]
Since the building is noncircular, the wind can only act in one direction, so directional
multiplier ‘Md‘ is taken as worst case value for region A4.
Md = 0.95 [AS1170.2 – Tab. 3.2]
The terrain over which the approach wind flows towards the structure is classed as having
a few well scattered obstructions, having heights generally from 1.5 metres to 10 metres.
Terrain Category = 2 [AS1170.2 – Cl. 4.2.1]
The height of the shed (z) has been rounded up to 10 metres, so the terrain height
multiplier for gust wind speeds is equal to 1.
Mz,cat = 1.0 [AS1170.2 – Tab. 3.2]
Since there are no nearby dominant buildings to provide shielding to the restoration shed,
the shielding multiplier ‘Ms’ is negligible.
Ms = 1.0
The terrain is relatively flat with no dominant topographic features, assume topographic
multiplier ‘Mt’ is negligible.
Mt = 1.0
Using Equation 2.2, the site wind speed can be calculated for ultimate limit state
conditions and serviceability limit state conditions.
CHAPTER 4 – STRUCTURAL ANALYSIS OF THE DESIGN 46
)(/15.350.10.10.195.037
)(/75.420.10.10.195.045
,
,
statemitlilityserviceabismV
statemitliultimatesmV
sit
sit
=
××××=
=
××××=
β
β
This equation defines the design wind pressure for the restoration shed; it is dependant on
the sheds dimensions and the sites variable properties.
dynfigdesair CCVP ...5.0 2,θρ×= [AS1170.2 – Eqn. 2.4]
The density of air remains constant at a value of 1.2 kg/m3.
airρ = 1.2 kg/m3
Since there are no dynamic forces acting on restoration shed, assume dynamic loading
factor ‘Cdyn’ is negligible.
Cdyn = 1.0
Condense equation 2.2 for ultimate limit state and serviceability limit state to make it a
function of ‘Cfig’ only (the restoration sheds dimensions).
)(.74.01000/0.1..15.35.2.15.0
)(.097.11000/0.1..75.42.2.15.0
2
2
statemitlilityserviceabiCCP
statemitliultimateCCP
fig
fig
fig
fig
=
××=
=
××=
To minimise repetition of calculations a ratio of serviceability wind loading divided by
ultimate wind loading is found.
Serviceability ratio:
67.0.097.1.74.0
=
=fig
fig
CC

CHAPTER 4 – STRUCTURAL ANALYSIS OF THE DESIGN 47
Now all serviceability wind loads can be found by multiplying the corresponding ultimate
wind load by 0.67.
The aerodynamic shape factor is to be determined for specific surfaces subject to cross
winds, longitudinal winds and internal winds.
plcaepfig KKKKCC ....,= (for external wind loading) [AS1170.2 – Eqn. 5.2(1)]
cipfig KCC ..,= (for internal wind loading) [AS1170.2 – Eqn. 5.2(2)]
Some information throughout the wind loading calculations is presented in matrix format
for ease of understanding. Each column in the matrix represents where two or more
values are given for the same loading circumstance, the most critical of these values will
be used depending on the combination. Each row in the matrix represents a type of load
which varies with inclined distance along the member.
4.1.2 Internal Wind Loads
The structure is classed as having a single dominant opening on its longitudinal wall or
during a major wind storm event, all doors are assumed to be closed. Therefore structure
has all walls equally permeable in both cases. The internal pressure coefficient for the
shed is the most severe of either 0.3 or 0.
Cp,i = 0.3 or 0 [AS1170.2 – Tab. 5.1(A)]
4.1.2.1 Cross Wind
For internal pressure/suction forces resulting from a cross wind:
Anil
Underline

CHAPTER 4 – STRUCTURAL ANALYSIS OF THE DESIGN 48
The combination factor (Kc) is equal to 0.8 for positive pressures on roofs in combination
with negative internal pressures from a wall opening.
windcrossKc →= 8.0 [AS1170.2 – Tab. 5.5]
From equation 5.2(2), the aerodynamic shape factor for internal pressure/suction resulting
from a cross wind can be calculated.
]024.0[8.0]03.0[
−=
×−=figC
From the condensed form of equation 2.2, the internal pressure/suction resulting from a
cross wind can be calculated.
windcrosskPaP
→−=−×=
]026.0[]024.0[097.1
windcrossmkNP
spacingsframeportalmFor
→−=×−=
−
/]061.1[1.6]026.0[
,1.6
4.1.2.2 Longitudinal Wind
For internal pressure/suction forces resulting from a longitudinal wind:
The combination factor (Kc) is equal to 1.0 since wind action from any single surface
contributes 75 percent or more to an action effect.
windallongitudinK c →= 0.1 [AS1170.2 – Tab. 5.5]
From equation 5.2(2), the aerodynamic shape factor for internal pressure/suction resulting
from a longitudinal wind can be calculated.
]03.0[0.1]03.0[
−=
×−=figC

CHAPTER 4 – STRUCTURAL ANALYSIS OF THE DESIGN 49
From the condensed form of equation 2.2, the internal pressure/suction resulting from a
longitudinal wind can be calculated.
windallongitudinkPaP
→−=−×=
]033.0[]03.0[097.1
windallongitudinmkNP
spacingsframeportalmFor
→−=×−=
−
/]000.2[1.6]033.0[
,1.6
4.1.3 External Wind Loads
4.1.3.1 Cross Wind
For external pressure/suction forces resulting from a cross wind:
Windward Wall
The height of the building is less than 25 metres and for buildings on ground, the wind
speed is taken for z equals h. Therefore the external pressure coefficient equals 0.7.
7.0, =epC [AS1170.2 – Tab. 5.2(A)]
For the windward wall of the restoration shed, the area reduction factor (Ka) is equal to
1.0.
0.1=aK [AS1170.2 – Tab. 5.4]
The combination factor (Kc) is equal to 0.8 for positive pressures on roofs in combination
with negative internal pressures from a wall opening.

CHAPTER 4 – STRUCTURAL ANALYSIS OF THE DESIGN 50
)(8.0 casesloadwindcrossallK c = [AS1170.2 – Tab. 5.5]
The local pressure factor (Kl) is taken as 1 since wind forces are not directly applied to
fixings and members that support the cladding. The permeable cladding reduction factor
(Kp) is also taken as 1 since the external surface does not consist of permeable cladding.
0.1== pl KK
56.08.07.0
=
×=figC
kPaP
61.056.0097.1
=×=
mkNP
spacingsframeportalmFor
/75.31.661.0
,1.6
=×=
−
Leeward Wall,
The angle of the roof line is greater than 25 degrees and the ratio of d/b is greater than
0.3. Therefore the external pressure coefficient equals 0.5.
36.06.36
26.13==
bd
5.0, −=epC [AS1170.2 – Tab. 5.2(B)]
For the leeward wall of the restoration shed, the area reduction factor (Ka) is equal to 1.0.
0.1=aK [AS1170.2 – Tab. 5.4]
CHAPTER 4 – STRUCTURAL ANALYSIS OF THE DESIGN 51
The combination factor (Kc) is equal to 0.8 for positive pressures on roofs in combination
with negative internal pressures from a wall opening.
)(8.0 casesloadwindcrossallK c = [AS1170.2 – Tab. 5.5]
4.08.05.0
=
×−=figC
kPaP
44.04.0097.1
−=−×=
mkNP
spacingsframeportalmFor
/68.21.644.0
,1.6
−=×−=
−
Side Walls,
The external pressure coefficients on the side walls of the shed are dependant on the
horizontal distance from the windward edge of the wall.
hhtohfromhtohfrom
htofrom
C ep
3322110
2.03.05.0
65.0
,
>
−−−−
= [AS1170.2 – Tab. 5.2(C)]
For the side walls of the restoration shed, the tributary area has been calculated as the
area contributing to the force being considered. The area reduction factor (Ka) is
interpolated as 0.88.
88.0
39.50226.136.7 2
≈
=×=
aK
mAreaTributary[AS1170.2 – Tab. 5.4]

CHAPTER 4 – STRUCTURAL ANALYSIS OF THE DESIGN 52
The combination factor (Kc) is equal to 0.8 for positive pressures on roofs in combination
with negative internal pressures from a wall opening.
)(8.0 casesloadwindcrossallK c = [AS1170.2 – Tab. 5.5]
−−−−
=
−−−−
××=
14.021.035.046.0
2.03.05.0
65.0
8.088.0figC
kPaP
−−−−
=
−−−−
×=
15.023.038.050.0
14.021.035.046.0
097.1
mkNP
spacingsframeportalmFor
/
94.041.134.208.3
1.6
15.023.038.050.0
,1.6
−−−−
=×
−−−−
=
−
Roof,
The external pressure coefficient for the upwind slope of rectangular enclosed buildings
is found within Table 5.3(B) of the wind loading code. The upwind roof slope is taken as
30 degrees pitch and the ratio h/d is calculated to determine the appropriate coefficients.
57.026.136.7
==dh
[ ]3.02.0, −=epC [AS1170.2 – Tab. 5.3(B)]

CHAPTER 4 – STRUCTURAL ANALYSIS OF THE DESIGN 53
For the upwind roof of the restoration shed, the tributary area has been calculated as the
area contributing to the force being considered. The area reduction factor (Ka) is
interpolated as 0.83.
83.045.4063.61.6 2
≈=×=
aKmAreaTributary
[AS1170.2 – Tab. 5.4]
The combination factor (Kc) is equal to 0.8 for positive pressures on roofs in combination
with negative internal pressures from a wall opening.
)(8.0 casesloadwindcrossallK c = [AS1170.2 – Tab. 5.5]
[ ][ ] )(2.013.0
3.02.08.083.0slopeupwindfor
C fig
−=
−××=
The external pressure coefficient for the downwind slope of rectangular enclosed
buildings is found within Table 5.3(C) of the wind loading code. The downwind roof
slope is taken as greater than 25 degrees pitch and the ratios h/d and b/d are calculated to
determine the appropriate coefficient.
76.226.136.36
==db
6.0, −=epC [AS1170.2 – Tab. 5.3(C)]
For the downwind roof of the restoration shed, the tributary area has been calculated as
the area contributing to the force being considered. The area reduction factor (Ka) is
interpolated as 0.83.
83.045.4063.61.6 2
≈=×=
aKmAreaTributary
[AS1170.2 – Tab. 5.4]
The combination factor (Kc) is equal to 0.8 for positive pressures on roofs in combination
with negative internal pressures from a wall opening.
)(8.0 casesloadwindcrossallK c =

CHAPTER 4 – STRUCTURAL ANALYSIS OF THE DESIGN 54
)(4.06.08.083.0
slopedownwindforC fig
−=
−××=
The external roof pressures resulting from a cross wind can now be calculated.
[ ][ ] )(22.014.0
2.013.0097.1slopeupwindforkPa
P−=
−×=
[ ][ ] )(/34.187.0
1.622.014.0,1.6
slopeupwindformkNP
spacingsframeportalmFor
−=×−=
−
)(/68.21.644.0
,1.6
)(44.04.0097.1
slopedownwindformkNP
spacingsframeportalmFor
slopedownwindforkPaP
−=×−=
−
−=−×=
4.1.3.2 Longitudinal Wind
For external pressure/suction forces resulting from a longitudinal wind:
Windward Wall,
The height of the building is less than 25 metres and for buildings on ground, the wind
speed is taken for z equals h. Therefore the external pressure coefficient equals 0.7.
7.0, =epC [AS1170.2 – Tab. 5.2(A)]

CHAPTER 4 – STRUCTURAL ANALYSIS OF THE DESIGN 55
For the windward wall of the restoration shed, the area reduction factor (Ka) is equal to
1.0.
0.1=aK [AS1170.2 – Tab. 5.4]
The combination factor (Kc) is equal to 1.0 since wind action from any single surface
contributes 75 percent or more to an action effect.
)(0.1 casesloadwindallongitudinallK c = [AS1170.2 – Tab. 5.5]
The local pressure factor (Kl) is taken as 1 since wind forces are not directly applied to
fixings and members that support the cladding. The permeable cladding reduction factor
(Kp) is also taken as 1 since the external surface does not consist of permeable cladding.
0.1== pl KK
7.0=figC
kPaP
77.07.0097.1
=×=
mkNP
spacingsframeportalmFor
/68.41.677.0
,1.6
=×=
−
Leeward Wall,
The angle of the roof line is greater than 25 degrees and the ratio of d/b is greater than
0.3. Therefore the external pressure coefficient equals 0.55.
76.226.136.36
==bd
55.0, −=epC [AS1170.2 – Tab. 5.2(B)]

CHAPTER 4 – STRUCTURAL ANALYSIS OF THE DESIGN 56
For the leeward wall of the restoration shed, the area reduction factor (Ka) is equal to 1.0.
0.1=aK [AS1170.2 – Tab. 5.4]
The combination factor (Kc) is equal to 1.0 since wind action from any single surface
contributes 75 percent or more to an action effect.
)(0.1 casesloadwindallongitudinallK c = [AS1170.2 – Tab. 5.5]
55.0−=figC
kPaP
60.055.0097.1
−=−×=
mkNP
spacingsframeportalmFor
/68.31.660.0
,1.6
−=×−=
−
Side Walls,
The external pressure coefficients on the side walls of the shed are dependant on the
horizontal distance from the windward edge of the wall.
hhtohfromhtohfrom
htofrom
C ep
3322110
2.03.05.0
65.0
,
>
−−−−
= [AS1170.2 – Tab. 5.2(C)]
For the side walls of the restoration shed, the tributary area has been calculated as the
area contributing to the force being considered. The area reduction factor (Ka) is
interpolated as 0.88.
88.036.461.66.7 2
≈=×=
aKmAreaTributary
[AS1170.2 – Tab. 5.4]

CHAPTER 4 – STRUCTURAL ANALYSIS OF THE DESIGN 57
The combination factor (Kc) is equal to 1.0 since wind action from any single surface
contributes 75 percent or more to an action effect.
)(0.1 casesloadwindallongitudinallK c = [AS1170.2 – Tab. 5.5]
−−−−
=
−−−−
×=
18.026.044.057.0
2.03.05.0
65.0
88.0figC
kPaP
−−−−
=
−−−−
×=
20.029.048.063.0
18.026.044.057.0
097.1
mkNP
spacingsframeportalmFor
/
20.174.194.281.3
1.6
20.029.048.063.0
,1.6
−−−−
=×
−−−−
=
−
Roof,
The external pressure coefficient for the upwind slope of rectangular enclosed buildings
is found within Table 5.3(B) of the wind loading code. The upwind roof slope is taken as
30 degrees pitch and the ratio h/d is calculated to determine the appropriate coefficients.
21.06.366.7
==dh
[ ]4.02.0, −=epC [AS1170.2 – Tab. 5.3(B)]
CHAPTER 4 – STRUCTURAL ANALYSIS OF THE DESIGN 58
For the upwind roof of the restoration shed, the tributary area has been calculated as the
area contributing to the force being considered. The area reduction factor (Ka) is
interpolated as 0.83.
83.045.4063.61.6 2
≈=×=
aKmAreaTributary
[AS1170.2 – Tab. 5.4]
The combination factor (Kc) is equal to 1.0 since wind action from any single surface
contributes 75 percent or more to an action effect.
)(0.1 casesloadwindallongitudinallK c = [AS1170.2 – Tab. 5.5]
[ ][ ] )(33.017.0
4.02.083.0slopeupwindfor
C fig
−=
−×=
The external pressure coefficient for the downwind slope of rectangular enclosed
buildings is found within Table 5.3(C) of the wind loading code. The downwind roof
slope is taken as greater than 25 degrees pitch and the ratios h/d and b/d are calculated to
determine the appropriate coefficient.
4.05.302.12
==db
6.0, −=epC [AS1170.2 – Tab. 5.3(C)]
For the downwind roof of the restoration shed, the tributary area has been calculated as
the area contributing to the force being considered. The area reduction factor (Ka) is
interpolated as 0.83.
83.045.4063.61.6 2
≈=×=
aKmAreaTributary
[AS1170.2 – Tab. 5.4]
The combination factor (Kc) is equal to 1.0 since wind action from any single surface
contributes 75 percent or more to an action effect.
)(0.1 casesloadwindallongitudinallK c = [AS1170.2 – Tab. 5.5]
CHAPTER 4 – STRUCTURAL ANALYSIS OF THE DESIGN 59
)(5.06.083.0
slopedownwindforC fig
−=
−×=
The external roof pressures resulting from a longitudinal wind can now be calculated.
[ ][ ] )(36.019.0
33.017.0097.1slopeupwindforkPa
P−=
−×=
[ ][ ] )(/21.214.1
1.636.019.0,1.6
slopeupwindformkNP
spacingsframeportalmFor
−=×−=
−
)(/35.31.655.0
,1.6
)(55.05.0097.1
slopedownwindformkNP
spacingsframeportalmFor
slopedownwindforkPaP
−=×−=
−
−=−×=

CHAPTER 4 – STRUCTURAL ANALYSIS OF THE DESIGN 60
4.1.4 Summary
A summary of the initial input information is presented within Table 4.1. The internal
and external pressure coefficients along with the design wind pressures for ultimate and
serviceability limit state conditions as calculated for the restoration shed, are presented
within Table 4.2.
Input Information Input
Roof Type GableWidth (b) 13.26 mLength (d) 36.6 mRoof Pitch ( ) 27°Wall Height (h w) 5.9 mPeak Roof Height (h roof) 9.28 mAverage Roof Height (h) 7.6 mImportance Level 2Region A4Terrain Category 2Design Working Life 50 years
Table 4.1 – Initial Input Information
Gable Roof

CHAPTER 4 – STRUCTURAL ANALYSIS OF THE DESIGN 61
Wind Type Wind Type/ExternalPressure
InternalPressure
Pressure(kPa)
Pressure(kPa)
Section of BuildingCoefficient/s
(Cp,e)Coefficient/s
(Cp,i)Ultimate
Limit StateServiceability
Limit State
Internal Cross Wind 0.3 , 0 0.26 , 0 0.17 , 0
Wind Longitudinal Wind 0.3 , 0 0.33 , 0 0.22 , 0
Cross Wind Windward Wall 0.7 0.61 0.41
Leeward Wall 0.5 0.44 0.29
Sidewalls 0 to 1h 0.65 0.50 0.34
Sidewalls 1h to 2h 0.5 0.38 0.25
Sidewalls 2h to 3h 0.3 0.23 0.15
Sidewalls >3h 0.2 0.15 0.1
Roof –Upwind Slope 0.2 , 0.3 0.14 , 0.22 0.09 , 0.15
Roof – Downwind
Slope0.6 0.44 0.29
Longitudinal Windward Wall 0.7 0.77 0.52
Wind Leeward Wall 0.55 0.6 0.4
Sidewalls 0 to 1h 0.65 0.63 0.42
Sidewalls 1h to 2h 0.5 0.48 0.32
Sidewalls 2h to 3h 0.3 0.29 0.19
Sidewalls >3h 0.2 0.20 0.13
Roof –Upwind slope 0.2 , 0.4 0.19 , 0.36 0.13 , 0.24
Roof – Downwind
Slope0.6 0.55 0.37
Table 4.2 – Summary of Design Wind Pressures
The design wind pressures for ultimate and serviceability limit state conditions have been
checked against the results produced from a wind calculator software program. The wind
calculator program was created in Microsoft Excel by the author to reduce the time
required to calculate the design wind pressures on a structure. The results produced from
this program were checked against the hand calculation results presented in the summary
table above. A graphical output of the results produced from the Wind Calculator
program is shown in Appendix E.

CHAPTER 4 – STRUCTURAL ANALYSIS OF THE DESIGN 62
4.2 Purlin Design
In accordance with the BlueScope Lysaght Product Catalogue 2003 – Purlins & Girts
User’s Manual.
Assume restoration shed is to be roofed with Trimdek roof sheeting (subtle square fluted
steel cladding) or equivalent,
Base Metal Thickness (BMT) = 0.42 mm
[Lysaght – Roofing & Walling Solutions]
Roof Sheeting Weight = 4.35 kg/m2
[Lysaght – Roofing & Walling Solutions]
The dead load force due to roof sheeting is a function of the weight of the sheeting.
kPa
Fsheeting
043.0
100081.935.4
=
×=
Assume the self weight of the purlins + roof sheeting 0.05 kPa for inward loading
Assume purlin spacings of: 1000 crs. for internal spans
700 crs. for end spans
The capacity of the existing purlins and girts at the assumed centres are checked to see
whether they can support the design loads.
The maximum inward loading is a combination of the self weight plus the sum of the
worst case external pressure and internal suction applied to the roof.

CHAPTER 4 – STRUCTURAL ANALYSIS OF THE DESIGN 63
mkN
weightselfmsuctionternalinpressureexternalRinward
/74.005.01]33.036.0[
1][
=+×+=
+×+=
The maximum outward loading is the sum of the worst case external suction and internal
pressure applied to the roof.
mkN
mpressureternalinsuctionexternalRoutward
/55.01]055.0[
1][
=×+=
×+=
Assume purlins are single span (purlin lengths 6100) with 1 row of bridging. The
restoration shed has purlins equivalent in size to the C section, C15012. The span of each
purlin is 6100 mm, so the capacity values have been interpolated between spans of 6000
mm and spans of 6300 mm from the Lysaght Product Manual.
The inward and outward capacity of this section need to be checked against the critical
wind loading combinations, Rinward and Routward
Inward capacity of C15012 = 1.01 kN/m Rinward , OK
Outward capacity of C15012 = 0.63 kN/m Routward , OK
Therefore it is satisfactory to provide C15012 purlins with one row of bridging @
1000 crs. internal spans and
700 crs. end spans

CHAPTER 4 – STRUCTURAL ANALYSIS OF THE DESIGN 64
4.3 Girt Design
In accordance with the BlueScope Lysaght Product Catalogue 2006 – Purlins & Girts
User’s Manual.
Assume girt spacings of: 1000 crs. for internal spans
700 crs. for end spans
The maximum inward loading is the sum of the worst case external pressure and internal
suction applied to the walls.
mkN
msuctionternalinpressureexternalRinward
/1.11]33.077.0[
1][
=×+=
×+=
The maximum outward loading is the sum of the worst case external suction and internal
pressure applied to the walls.
mkN
mpressureternalinsuctionexternalRoutward
/63.01]063.0[
1][
=×+=
×+=
Assume girts are single span (girt lengths 6100) with 1 row of bridging. The restoration
shed has girts equivalent in size to the C section, C15012. The span of each girt is 6100
mm, so the capacity values have been interpolated between spans of 6000 mm and spans
of 6300 mm from the Lysaght Product Manual.
The inward and outward capacity of this section need to be checked against the critical
wind loading combinations, Rinward and Routward
Inward capacity of C15012 = 1.01 kN/m Rinward , FAILS

CHAPTER 4 – STRUCTURAL ANALYSIS OF THE DESIGN 65
Outward capacity of C15012 = 0.63 kN/m Routward , OK
Therefore using C15012 @ 1000 crs. fails under critical inward wind load. Girt section
size must be increased.
Try C15015:
Inward capacity of C15015 = 1.32 kN/m Rinward , OK
Outward capacity of C15015 = 0.85 kN/m Routward , OK
Therefore it is satisfactory to provide C15015 girts with one row of bridging @
1000 crs. internal spans and
700 crs. end spans
4.4 Live Load Calculations
In accordance with AS1170.1
The imposed load (Q) is required to be calculated for the restoration shed. It indicates the
variable actions imposed, resulting from the intended use or occupancy of the structure.
This value needs to be calculated for the roof of the structure which is normally only
accessible for general maintenance, repair, painting and minor repairs.
Clause 3.5.1 Roofs and Supporting Elements
Table 3.2 – Reference Values of Roof Actions
Type of live load = R2 Other roofs

CHAPTER 4 – STRUCTURAL ANALYSIS OF THE DESIGN 66
12.08.1+=
AUDL
Where ‘A’ is the plan projection of the surface area of roof supported by the member
under analysis in square metres.
The area supported by top chord of truss (A) is equal to the portal frame spacing
multiplied by the width of shed.
289.8026.131.6
mA
=
×=
Therefore live load, 12.089.808.1
+=Q
25.013.0 ≤= (lower limit)
So Q = 0.25 kPa
mkNQ
spacingsframeportalmFor
/53.11.625.0
,1.6
=×=
−
This live load is to be applied in the Space Gass model to the top chord of the truss in the
negative global ‘y’ direction (the direction of gravity).

CHAPTER 4 – STRUCTURAL ANALYSIS OF THE DESIGN 67
4.5 Space Gass Input Diagrams
Cross Windminimum uplift
Longitudinal Windmaximum uplift
Longitudinal Windminimum uplift
+2.95 1.07
+5.36 2.68
3.35 3.35
3.81 3.81
+4.21 +4.21
3.81 3.81
0.87 2.68
+5.36 2.68
Cross Windmaximum uplift

CHAPTER 4 – STRUCTURAL ANALYSIS OF THE DESIGN 68
The Space Gass input diagrams consist of four basic loading scenarii of the portal frame.
These loading cases show the worst load combinations for maximum roof uplift pressure
and maximum roof downward pressure when subjected to both cross winds and
longitudinal winds. The loads consist of a summation of the most critical external
pressures and internal pressures depending on the load case.
4.6 Computer Analysis
4.6.1 Model
A typical frame layout has been drawn in the structural design analysis program Space
Gass as a combination of columns and a truss. Models in Space Gass can either be drawn
graphically or as datasheet inputs. See Figure 4.2 for a graphical view of the model,
labelled with all the node and member numbers used in the analysis.
Figure 4.2 Model

CHAPTER 4 – STRUCTURAL ANALYSIS OF THE DESIGN 69
The two dimensional model for the restoration shed was created by initially opening the
Node Coordinates data sheet from the Structure menu. See Table 4.3 for the completed
Node Coordinates datasheet, showing the position of all nodes used in the model in the x
y plane. Nodes were used at all end points of members, changes in member direction,
and intersection of members. Nodes were numbered in increasing order from 1, with
their ‘x’ and ‘y’ coordinates entered in metres. The first node at the extreme bottom left
of the frame, was been labelled node ‘1’ at position (0,0). Once all of these nodes had
been setup within the model space, the draw command was used to graphically connect
the nodes with members, forming the shape of a typical portal frame.
Table 4.3 – Node Coordinates Datasheet
The truss was rather complicated to model on a two dimensional plane, since the ‘x’ and
‘y’ coordinates had to be known at all node locations (member intersections). The
procedure for accurately drawing the truss in Space Gass was broken down into more
manageable steps. The survey data from a site inspection of the truss listed all inclined

CHAPTER 4 – STRUCTURAL ANALYSIS OF THE DESIGN 70
distances for each section of the truss, along with crosssectional dimensions. From this
data, a typical truss layout was able to be drafted in Autocad showing the inclined
dimensions to the nodes, along the chord members of the truss. See Figure 4.3 for the
design aid used.
Figure 4.3 – Truss Design Aid
Initially the top and bottom chords of the truss were drawn in Space Gass at the roof pitch
angle of 27 degrees to form a triangle shape above the columns. The top and bottom
chord members on this triangle were able to be subdivided at inclined distances along
the members to generate the intermediate web nodes, which were then connected up with
intermediate web members using the draw tool.
The sections for the truss were found to mainly consist of back to back equal and non
equal angles. These combined sections were bolted together at regular intervals to form a
single ‘T’ section. Since these sections were nonstandard, they first had to be drawn in

CHAPTER 4 – STRUCTURAL ANALYSIS OF THE DESIGN 71
the Space Gass – Shape Builder, before being assigned to the members. Figure 4.4 shows
a nonstandard section being created using the shape builder function, note the program
automatically calculates the important properties for the section such as the second
moment of area about the xaxis. The column members were modelled as 410UB59.7
sections.
Figure 4.4 – Shape Builder
A node restraint determines the allowable movements at a node. Each node restraint
comprises of six different allowable movements including translation (movement) in the
x, y, and z directions, and rotation (bending) in the x, y, and z directions. Each of these
movements are assigned a letter in the restraint property box for each node, with ‘R’
representing released (free to move), ‘F’ representing fixed (not free to move) and ‘D’
representing deleted (not analysed). Table 4.4 summarizes the node restraints used
throughout the portal frame. Note the general restraint applied to node 2. It implies that
this particular restraint combination is to be used for all nodes not listed in the table as a
common restraint. Nodes 1 and 5 are located at the base of the columns. They are
modelled as pin connections meaning that they are fixed from ‘x’ and ‘y’ translation, but
are released for ‘z’ rotation.
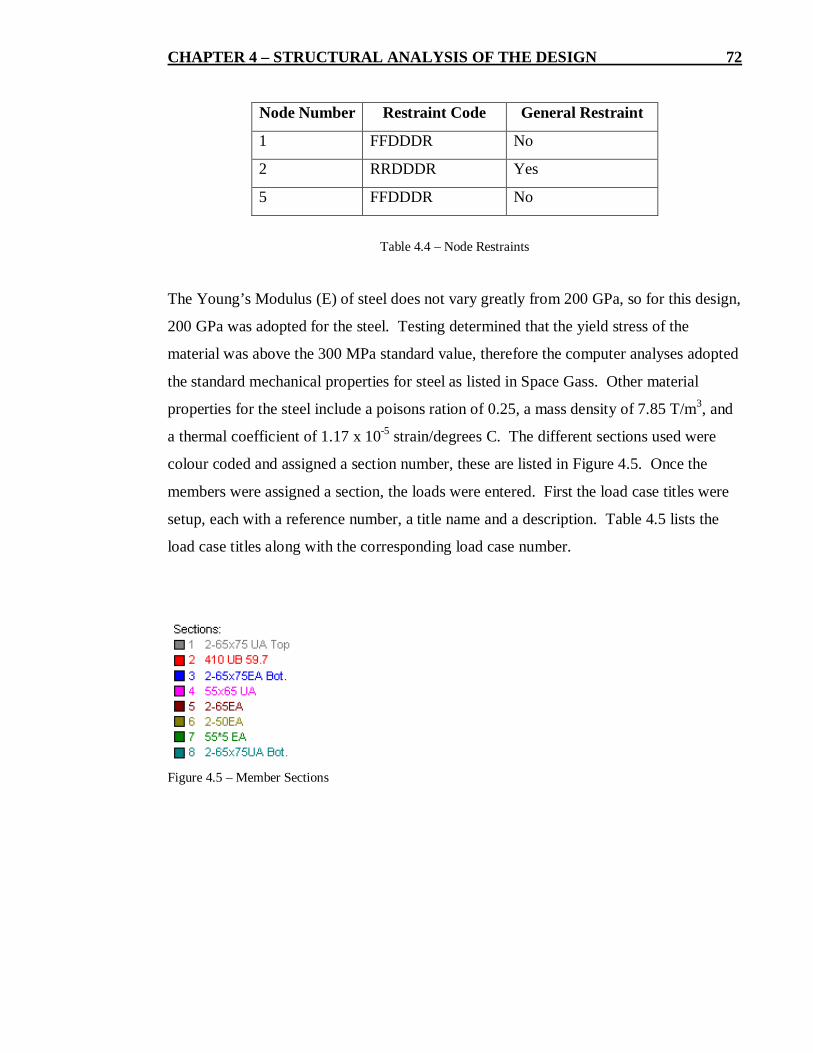
CHAPTER 4 – STRUCTURAL ANALYSIS OF THE DESIGN 72
Node Number Restraint Code General Restraint
1 FFDDDR No
2 RRDDDR Yes
5 FFDDDR No
Table 4.4 – Node Restraints
The Young’s Modulus (E) of steel does not vary greatly from 200 GPa, so for this design,
200 GPa was adopted for the steel. Testing determined that the yield stress of the
material was above the 300 MPa standard value, therefore the computer analyses adopted
the standard mechanical properties for steel as listed in Space Gass. Other material
properties for the steel include a poisons ration of 0.25, a mass density of 7.85 T/m3, and
a thermal coefficient of 1.17 x 10⁵ strain/degrees C. The different sections used were
colour coded and assigned a section number, these are listed in Figure 4.5. Once the
members were assigned a section, the loads were entered. First the load case titles were
setup, each with a reference number, a title name and a description. Table 4.5 lists the
load case titles along with the corresponding load case number.
Figure 4.5 – Member Sections

CHAPTER 4 – STRUCTURAL ANALYSIS OF THE DESIGN 73
Case Title Notes
1 G Dead Load
2 Q Live Load
3 Wuc.u Ultimate – Crosswind, maximum uplift
4 Wul.u Ultimate – Longitudinal Wind, maximum uplift
5 Wuc.d Ultimate – Crosswind, minimum uplift
6 Wul.d Ultimate – Longitudinal Wind, minimum uplift
51 Wsc.d Serviceability – Crosswind, minimum uplift
52 Wsl.d Serviceability – Longitudinal Wind, minimum uplift
53 Wsc.u Serviceability – Crosswind, maximum uplift
54 Wsl.u Serviceability – Longitudinal Wind, maximum uplift
101 1.2G + 1.5Q Ultimate – Load combination, Factored Dead Load +
Factored Live Load
102 0.9G + Wuc.u Ultimate – Load combination, Factored Dead Load +
Ultimate – Crosswind, maximum uplift
103 0.9G + Wul.u Ultimate – Load combination, Factored Dead Load +
Ultimate – Longitudinal Wind, maximum uplift
104 1.2G + Wuc.d Ultimate – Load combination, Factored Dead Load +
Ultimate – Crosswind, minimum uplift
105 1.2G + Wul.d Ultimate – Load combination, Factored Dead Load +
Ultimate – Longitudinal Wind, minimum uplift
106 G + Q Serviceability – Load combination, Dead Load + Live Load
Table 4.5 – Load Case Titles
Once the titles were setup, the combination load cases datasheet was opened within the
loads menu. The purpose of this datasheet is to allow the user to combine primary loads
and use multiplying factors where necessary to setup the combination load cases for
ultimate and serviceability limit state conditions. Table 4.6 shows the data that was
entered in the combination load cases datasheet. All serviceability loads were created by
factoring their corresponding ultimate load by 0.67, as per the calculated ratio of ultimate
to serviceability wind loads.
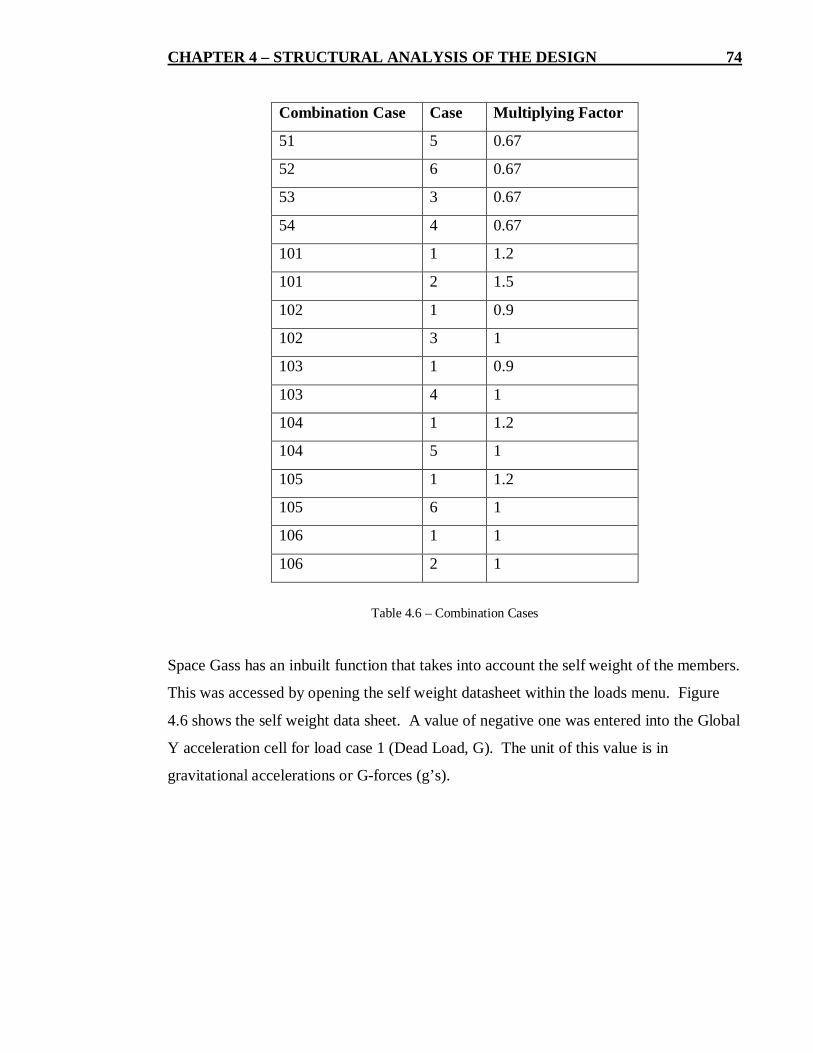
CHAPTER 4 – STRUCTURAL ANALYSIS OF THE DESIGN 74
Combination Case Case Multiplying Factor
51 5 0.67
52 6 0.67
53 3 0.67
54 4 0.67
101 1 1.2
101 2 1.5
102 1 0.9
102 3 1
103 1 0.9
103 4 1
104 1 1.2
104 5 1
105 1 1.2
105 6 1
106 1 1
106 2 1
Table 4.6 – Combination Cases
Space Gass has an inbuilt function that takes into account the self weight of the members.
This was accessed by opening the self weight datasheet within the loads menu. Figure
4.6 shows the self weight data sheet. A value of negative one was entered into the Global
Y acceleration cell for load case 1 (Dead Load, G). The unit of this value is in
gravitational accelerations or Gforces (g’s).

CHAPTER 4 – STRUCTURAL ANALYSIS OF THE DESIGN 75
Figure 4.6 – Self Weight Datasheet
Now the member distributed forces could be applied to the frame. All wind loads are
applied to the member’s local axes, i.e. perpendicular to the member in its constructed
orientation. All dead loads and live loads, act in the direction of gravity (negative global
Y direction) and thus have been applied as such. Using the Space Gass input diagrams
and live load calculations; the universally distributed loads have been applied to each
member of the frame for a typical 6.1 metre supported width (3.05 metres either side of
the frame). The live load as applied to load case 2 (Q), and the four input diagrams
applied to basic load cases 3, 5, 4, and 6 respectively. See Appendix F for the member
distributed forces datasheet, listing all loads applied to each member for each load case.
4.6.2 Results
The frame was analysed under ultimate limit state conditions using nonlinear static
analysis and under serviceability limit state conditions using linear static analysis
conditions. The nonlinear analysis accounts for the Pdelta effects which creates
additional moments in the frame. Figure 4.7 shows the nonlinear static analysis menu
for ultimate limit state with all the input data and conditions shown, including
convergence accuracy better than 99.9 percent.

CHAPTER 4 – STRUCTURAL ANALYSIS OF THE DESIGN 76
Figure 4.7 – NonLinear Static Analysis
The analysis of the frame was successful, and no buckling was observed under loading.
The critical results from the analyses are shown within the results tables below for
deflection, bending moments, axial forces, and shear forces. These tables show the
largest values produced for each member of the frame, along with a description of the
member type and its section number. These critical values will be checked against the
Australian Standard recommendations for compliance. The load cases combinations that
produced the largest deflections, bending moments, axial forces, and shear forces are
contained within Appendix G.
4.6.2.1 Maximum Deflections
Member
Type
Node
No.
Member
No.
Member
Length (mm)
Deflection
Direction Global
Critical Deflection
Distance (mm)
Column 4 4 5890 Horizontal (+x) 22.85
Bottom
Flange
9 14 2500 Vertical (y) 4.41
Top
Flange
14 20 1448 Vertical (y) 4.96
Table 4.7 – Member Deflections

CHAPTER 4 – STRUCTURAL ANALYSIS OF THE DESIGN 77
4.6.2.2 Maximum Bending Moments
Member
Type
Node No. Member
No.
Member
Length (mm)
Critical Bending Moment
about ZAxis (kN.m)
Column 4 4 5890 110.45
Bottom
Flange
4 46 1550 40.44
Top
Flange
4 25 1294 70.01
Table 4.8 – Member Bending Moments
4.6.2.3 Maximum Axial Forces
Member
Type
Node No. Member
No.
Member
Length (mm)
Critical Axial Force (kN)
(tension ‘ve’ comp. ‘+ve’)
Column 2 1 5890 20.82
Column 1 1 5890 34.68
Bottom
Flange
2 12 1550 198.95
Bottom
Flange
4 46 1550 177.94
Top
Flange
18 25 1284 153.8
Top
Flange
2 2 1294 187.54
Web 12 27 1579 130.52
Web 10 35 1579 128.34Table 4.9 – Member Axial Forces

CHAPTER 4 – STRUCTURAL ANALYSIS OF THE DESIGN 78
4.6.2.4 Maximum Shear Forces
Member
Type
Node No. Member
No.
Member
Length (mm)
Critical Shear Force
(kN)
Column 1 1 5890 34.29
Bottom
Flange
4 46 1550 31.29
Top
Flange
11 2 1294 68.1
Table 4.10 – Member Shear Forces
4.6.3 Sample Hand Checks
Check to ensure that the sum of moments about the knees of the frame (column to truss
joint) are equal to zero, using the figure within Appendix G, titled Max Moments. This
check proves that the joint has been connected properly in the program since the moment
at a common point is the same.
Left Knee:
)(0
98.6801.4099.108
OK
M kneeLeft
=
−−=
Right Knee:
)(0
01.7044.4045.110
OK
M kneeRight
=
−−=
A few hand checks have also been completed to check that the column members can
withstand the maximum moments within Appendix G.
CHAPTER 4 – STRUCTURAL ANALYSIS OF THE DESIGN 79
Maximum Moment on Columns:
mkNM columns .110=
Moment Capacity of Columns:
Section = 410UB59.7
Effective Length 6 m
Design Member Moment Capacity, Mb = 129 kN.m 110 kN.m (OK) [AISC Tab 5.3.5]
Check the maximum axial loads on the frame members including maximum tension and
compression forces shown within Appendix G.
Maximum Axial Tension of Columns:
kNNtension 7.17−=
Tensile Capacity of Columns:
Section = 410UB59.7
Design Member Tension Capacity, Nt = 1860 kN 17.7 kN (OK) [AISC Tab 710]
Maximum Axial Compression of Columns:
kNN ncompressio 68.34=
Compressive Capacity of Columns:
Section = 410UB59.7
Effective Length 6 m
Design Member Comp. Capacity, Nc = 1770 kN 34.68 kN (OK) [AISC Tab 65(A)]
Maximum Axial Compression of Web Member:
kNN ncompressio 34.128=
Compressive Capacity of Web Member:
Section = 2 – 65x75 UA

CHAPTER 4 – STRUCTURAL ANALYSIS OF THE DESIGN 80
Effective Length 2 m
Design Member Comp. Capacity, Nc = 144 kN 128.34 kN (OK) [AISC Tab 68(A)]
4.7 Australian Standard Recommendations
In accordance with AS4100: 1998 – Steel Structures and AS1170.0: 2002 – Structural
Design Principles.
The Australian Standards recommend certain deflection values for serviceability limit
state conditions, depending upon the members span. These values are to be used as a
guideline only and are not enforced by law.
Vertical Deflection Limits. [AS4100. Appendix B – Table B1]
For vertical deflection of the truss members, the type of beams is classed as other beams
in Table B1. The standard recommends a Vertical Deflection Limit of:
2501
=∆l
So,250
l=∆ where ‘l’ is the effective span of the member
Horizontal Deflection Limits. [AS4100. Appendix B – Clause B2]
For horizontal deflection of the column members, the building is classed in Clause B2 as
a building clad in steel or aluminium sheeting without gantry cranes and without internal
partitions against external walls. The standard recommends a Vertical Deflection Limit
of:
150heightcolumn
=∆

CHAPTER 4 – STRUCTURAL ANALYSIS OF THE DESIGN 81
4.8 Compliance with Australian Standards
For the restoration shed to comply with the Australian standards, the deflections and
forces exhibited by the frame, must be equal to or lower than the recommended limits
provided. The deflection limits act only as a guide, and are dependant on each members
individual length. For the horizontal deflection of truss or column members in the frame,
refer to Table 4.11 for the deflections observed from computer analysis as opposed to the
limits recommended in the standards. Table 4.12 shows a simular format for vertical
deflection.
Member
No.
Column
Height (mm)
Limit (mm) =
column height/150
Actual Horizontal
Deflection (mm)
Actual Deflection
Limit
4 5890 39.26 22.85 Yes
Table 4.11 – Horizontal Deflection Compliance
Member
No.
Length
(mm)
Limit (mm) =
length/250
Actual Vertical
Deflection (mm)
Actual
Deflection
Limit
Bottom
Flange
13260 53.04 4.41 Yes
Top
Flange
7000 28 4.96 Yes
Table 4.12 – Vertical Deflection Compliance
CHAPTER 4 – STRUCTURAL ANALYSIS OF THE DESIGN 82
4.9 Drawings
4.9.1 Sewer and Sanitary Drainage Plan
The sites sewer and sanitary drainage had to be designed for approval by Toowoomba
City Council. A preliminary design was drawn, detailing the approximate layout of the
sewer and sanitary drainage system according to the requirements of the DDHRS. An
existing manhole on lot 5 had to be relocated from inside the property boundary to the
outside, then a new sewer main extended from the new manhole, along Cambooya St
through to the corner of the site. The drawing C001 – Sewer and Sanitary Drainage Plan,
can be found in Appendix H. Note this drawing is not for construction, the terrain of the
site must be professionally surveyed to determine all invert levels of the pipes, and the
layout of amenities finalised, by the DDHRS. Upon completion of this, the plan can be
updated, and the invert levels calculated with pipe sizes using the minimum gradients
specified within AS3500 – Plumbing and Drainage.
4.9.2 External Layout Plan
A plan showing the layout of all proposed infrastructure on site was also drafted. This
plan, located in Appendix I, is the final draft of a series of drafts completed and
extensively changed due to the ongoing changes as requested by members of the
DDHRS. The external layout plan is currently at revision D, and is subject to future
change depending on the societies decisions.
The main purpose of this drawing is to visually depict where all the infrastructure are
located, and how they are orientated on site in relation to one another. One of the reasons
the plan was drawn was to ensure that there is enough access spacing between buildings
and no confliction of space. The second purpose of the drawing, equally as important as
the first, is help with the fixation of donations. The DDHRS relies heavily upon external

CHAPTER 4 – STRUCTURAL ANALYSIS OF THE DESIGN 83
donations from various organisations. In order to convince the company to donate either
materials or a service to the community based society, they need to see the benefits. By
showing this plan, directly to the company, the society’s members are more easily able to
explain their cause, where things are going, and why they need the donation. A recent
A3 copy of the plan has also been laminated and pinned up inside the main carriage on
site. This is displayed for all members to see and draw on using whiteboard marker, to
convey their ideas and future plans. Once these changes are agreed upon by all members,
and a costing plan determined, the plan will be updated in Autocad, the revision number
updated, and then the drawing reprinted. The drawing C002 – External Layout Plan is
shown in Appendix I. This drawing is also not for construction but mainly to enable the
society to plan the layout of all infrastructure on site.
4.9.3 Structural Drawings
A set of structural drawings have been drawn showing the plan view and elevation views
of the restoration shed. These drawings visually depict the layout of all steel members
throughout the shed, and include important construction notes. Member schedules in
conjunction with the corresponding marks or labels shown on the drawings, remove
unnecessary clutter and allow for easy interpretation. Member schedule tables are shown
in the upper portion of the drawing, one for the steel members used in the frame and
another for the member layout of a typical ‘fink’ truss.
Three structural drawings have been drafted:
1. S001 – ROOF FRAMING PLAN
2. S002 – SIDE ELEVATION PLAN
3. S003 – END ELEVATIONS PLAN
These drawings can be found within Appendix J, Appendix K, and Appendix L
respectively.
CHAPTER 4 – STRUCTURAL ANALYSIS OF THE DESIGN 84
4.9.4 Foundation Plan
A plan showing the layout of all foundations including the slab and piers was also drawn,
titled S004 – Foundation Plan. Slab thicknesses are shown on the drawing for internal
and edge slabs as per the critical slab calculations. The foundation plan can be found
within Appendix M. A 2200 millimetre wide edge thickening strip is to be used around
the perimeter of the shed, as shown on the foundation plan. The position and orientation
of the workshop service pit can be seen on the plan, located centrally about the eastern
rail line. Besser blockwork is to be used for the walls of the service pit as the soil
retaining structure with a concrete slab cast for the base. The end connection for the pier
detail is shown on the drawing as a 12 mm base plate welded to the base of the column
and attached to the concrete piers with 4 heavy duty M20 bolts. The steel connections
and construction notes plans have been previously drawn by Farr Evratt Consulting
Engineers. These drawings are located in Appendix N. The connection drawings show
how the steel members are joined together onsite. It is recommended that where possible,
connections should be made using structural bolts as opposed to welding. Welding
requires special equipment and trained personnel. Onsite welding is more expensive and
takes significantly longer than onsite bolting, which is the preferred connection method
for most construction workers.

CHAPTER 4 – STRUCTURAL ANALYSIS OF THE DESIGN 85
4.10 Analysis Conclusions
The DDHRS do not have enough existing purlin and girt ‘C’ sections to achieve the
required spacings as previously calculated. The existing ‘C’ sections, if used as girts, are
too small to resist the maximum wind loading case for the area. To avoid differential
roof sheeting height due to the differences in imperial to metric sections, all existing ‘C’
members are to be used as purlins for the roof and new steel ‘C’ members must be
acquired by the society for use as intermediate girt members on the walls. The analysis
results showed that the restoration shed is self standing and will not collapse or buckle
under the worst case loadings for the area. The hand check calculations proved that the
computer analysis was accurate and the restoration shed had been correctly entered into
the program. The critical deflections produced from the program for serviceability limit
state in the global x and y directions were checked against the Australian Standards
recommendations for conformity. The main deflections checked, were the sideways
movement of the columns under crosswind load combinations and the vertical
movement of the truss beams under loading. These checks showed that the deflections
produced, were significantly lower than the recommendations provided. Therefore the
shed is overdesigned, but this is acceptable since the members exist and there is no extra
cost to the DDHRS for overdesigning the structure in this manner.

Chapter 5
Other Designs
The Darling Downs Historical Rail Society is in the process of upgrading and improving
their entire site. Because of this, many different designs and constructions have started,
and are being completed simultaneously. The DDHRS have required assistance from the
author throughout many of these designs. Some of the other designs completed, such as
the slab design, are directly related to the restoration shed, whereas others are only related
to different aspects of the site.
5.1 Slab Design
In accordance with ‘Cement & Concrete Association of Australia – Industrial Floors &
Pavements and AS3600.
The slab design for the restoration shed was calculated using the Industrial Floors and
Pavements Design guide, Clause 3.4.10, ‘Design for Wheel Loading’. Since heavy
machinery will be operating on top of the slab, it is classed as industrial, and thus should
be designed as such. The slab has been designed twice for two different loading
conditions. Since two different main types of heavy machinery are going to be used
within the restoration workshop, two designs were produced, and the one with the largest
slab thicknesses adopted.

CHAPTER 5 – OTHER DESIGNS 87
The pavement will be subject to 4000 pound (1814.4 kilogram) capacity forklift, recently
acquired by the DDHRS. This forklift will be used constantly within the shed for
transporting pallets loaded with heavy machinery parts. The society also has future plans
for procurement of a mobile tractor crane, imposing large loads on the workshop slab.
This crane will not be used as much as the forklift, but it will have a higher load, and may
result in a larger slab thickness thus being the critical loading situation. Therefore it must
be checked in the design.
The slab design consists of:
1. Forklift Load Interior slab thickness (mm)
Edge slab thickness (mm)
2. Mobile Crane Load Interior slab thickness (mm)
Edge slab thickness (mm)
5.1.1 Slab Calculations
5.1.1.1 Forklift Load
INTERIOR SLAB DESIGN:
Clause 3.4.10 Design for wheel loading:
This formula calculates the stress factor (F1) for the interior slab thickness. After this
value is found, the base thickness can be read of the primary design curve on Chart 1.1
for a range of values of axial loads.
431111 ..... kkFFFfF SHEall= [Industrial F & P – Eqn. 6]
The design tensile strength of concrete is given by the formula, fall.

CHAPTER 5 – OTHER DESIGNS 88
cfall fkkf '.. 21= [Industrial F & P – Eqn. 4]
The material factor (k1) ranges from 0.85 to 0.95 for wheel loadings, so an average value
of 0.9 shall be used.
9.01 =k [Industrial F & P – Tab. 1.17]
The number of forklift loadings per day is approximately equal to 20. The design life of
the restoration shed is 50 years.
Daily loading repetitions = 20
Design Life = 50 years (maximum)
Load Repetitions = 260 000 [Industrial F & P – Tab. 1.16]
53.02 =k [Industrial F & P – Tab. 1.18]
The strength of the concrete as required by the DDHRS is the minimum value for the
area, 28 MPa.
Concrete Strength = 28 MPa
MPa
cff cf
7.3287.0
'7.0'
≈×=
×=
[AS3600 – Clause. 6.1.1.2]
From equation 4, the design tensile strength of concrete is calculated.
76.17.353.09.0
=××=allf
Assume a general description of supporting soil is medium at worst case conditions.
MPaEss 15= (Typical average shortterm Young’s modulus)
08.11 =EF (From Charts Set 1.1 – Interior Loading)
For the Toowoomba area, a typical soil depth is around 2 metres, so assume depth of soil
layer (H) is 2 metres.
H = 2 m

CHAPTER 5 – OTHER DESIGNS 89
08.11 =HF (From Charts Set 1.1 – Interior Loading)
The wheels of the forklift are spaced at one metre from centre to centre.
S = 1 m
91.01 =SF (From Charts Set 1.1 – Interior Loading)
The calibration factor for geotechnical behaviour is equal to 1.2 for interior loading of the
slab.
2.13 =k
The correction factor k4 is a calibration factor for standard concrete strengths. For a
concrete strength of 28 MPa, the factor is interpolated as 1.09.
09.14 =k [Industrial F & P – Tab. 1.19]
From equation 6, the stress factor is calculated.
44.209.12.191.008.108.176.11
=×××××=F
Since all of the formulas in the Industrial Pavements Design Guide are in metric units, the
forklift load in imperial must first be converted.
TonneLoadAxle
kg
PoundForkliftofCapacity
6.38.12
18144536.04000
4000
=×≈
≈×=
=
kNPForceAxle
3581.96.3,
≈×=
Interior Slab Thickness for 4000 Pound Forklift Load:
mmt 200= (From Charts Set 1.1 – Interior Loading)

CHAPTER 5 – OTHER DESIGNS 90
EDGE SLAB DESIGN:
Clause 3.4.10 Design for wheel loading
This formula calculates the stress factor (F2) for the edge slab thickness. After this value
is found, the base thickness can be read of the primary design curve on Chart 1.2 for a
range of values of axial loads.
432222 ..... kkFFFfF SHEall= [Industrial F & P – Eqn. 6]
From equation 4, the design tensile strength of concrete has been previously calculated
and does not change.
76.1=allf
Assume a general description of supporting soil is medium at worst case conditions.
MPaEss 15= (Typical average shortterm Young’s modulus)
1.12 =EF (From Charts Set 1.2 – Edge Loading)
Extent of edge thickening,
mm
thicknessslabternalind
200020010
10
=×=×=
[Industrial F & P –Tab. 1.20]
For the Toowoomba area, a typical soil depth is around 2 metres, so assume depth of soil
layer (H) is 2 metres.
H = 2 m
055.12 =HF (From Charts Set 1.2 – Edge Loading)
The wheels of the forklift are spaced at one metre from centre to centre.
S = 1 m
94.02 =SF (From Charts Set 1.2 – Edge Loading)

CHAPTER 5 – OTHER DESIGNS 91
The calibration factor for geotechnical behaviour is equal to 1.05 for edge loading of the
slab.
05.13 =k
The correction factor k4 is a calibration factor for standard concrete strengths. For a
concrete strength of 28 MPa, the factor is interpolated as 1.09.
09.14 =k [Industrial F & P – Tab. 1.19]
From equation 6, the stress factor is calculated.
20.209.105.194.0055.11.176.12
=×××××=F
The forklift axial force has been previously calculated for a 4000 pound capacity forklift.
kNPForceAxle 35, ≈
Interior Slab Thickness for 4000 Pound Forklift Load:
mmt 330= (From Charts Set 1.2 – Edge Loading)
4.1.1.2 Mobile Crane Load
INTERIOR SLAB DESIGN:
Clause 3.4.10 Design for wheel loading:
This formula calculates the stress factor (F1) for the interior slab thickness. After this
value is found, the base thickness can be read of the primary design curve on Chart 1.1
for a range of values of axial loads.
431111 ..... kkFFFfF SHEall= [Industrial F & P – Eqn. 6]
The design tensile strength of concrete is given by the formula, fall.

CHAPTER 5 – OTHER DESIGNS 92
cfall fkkf '.. 21= [Industrial F & P – Eqn. 4]
The material factor (k1) ranges from 0.85 to 0.95 for wheel loadings, so an average value
of 0.9 shall be used.
9.01 =k [Industrial F & P – Tab. 1.17]
The number of tractor crane loadings per day is approximately equal to 10. The design
life of the restoration shed is 50 years.
Assume Daily loading repetitions = 10
Design Life = 50 years (maximum)
Load Repetitions = 130 000 [Industrial F & P – Tab. 1.16]
553.02 =k [Industrial F & P – Tab. 1.18]
The strength of the concrete as required by the DDHRS is the minimum value for the
area, 28 MPa.
Concrete Strength = 28 MPa
7.3287.0
'7.0'
≈×=
×= cff cf
[AS3600 – Clause. 6.1.1.2]
From equation 4, the design tensile strength of concrete is calculated.
84.17.3553.09.0
=××=allf
Assume a general description of supporting soil is medium at worst case conditions.
MPaEss 15= (Typical average shortterm Young’s modulus)
08.11 =EF (From Charts Set 1.1 – Interior Loading)
For the Toowoomba area, a typical soil depth is around 2 metres, so assume depth of soil
layer (H) is 2 metres.
H = 2 m

CHAPTER 5 – OTHER DESIGNS 93
08.11 =HF (From Charts Set 1.1 – Interior Loading)
The wheels of the mobile tractor crane are approximately spaced at two metres from
centre to centre.
S = 2 m
075.11 =SF (From Charts Set 1.1 – Interior Loading)
The calibration factor for geotechnical behaviour is equal to 1.2 for interior loading of the
slab.
2.13 =k (Interior loading factor)
The correction factor k4 is a calibration factor for standard concrete strengths. For a
concrete strength of 28 MPa, the factor is interpolated as 1.09.
09.14 =k [Industrial F & P – Tab. 1.19]
From equation 6, the stress factor is calculated.
02.309.12.1075.108.108.184.11
=×××××=F
TonneLoadAxle
TonneCraneofCapacity
1682
8
=×≈
≈
kNPForceAxle
15781.916,
≈×=
Interior Slab Thickness for 8 Tonne Crane Load:
mmt 220= (From Charts Set 1.1 – Interior Loading)

CHAPTER 5 – OTHER DESIGNS 94
EXTERIOR SLAB DESIGN:
Clause 3.4.10 Design for wheel loading:
This formula calculates the stress factor (F2) for the edge slab thickness. After this value
is found, the base thickness can be read of the primary design curve on Chart 1.2 for a
range of values of axial loads.
432222 ..... kkFFFfF SHEall=
From equation 4, the design tensile strength of concrete has been previously calculated
and does not change.
84.1=allf
Assume a general description of supporting soil is medium at worst case conditions.
MPaEss 15= (Typical average shortterm Young’s modulus)
1.12 =EF (From Charts Set 1.2 – Edge Loading)
Extent of edge thickening,
mm
thicknessslabternalind
220022010
10
=×=×=
[Industrial F & P –Tab. 1.20]
For the Toowoomba area, a typical soil depth is around 2 metres, so assume depth of soil
layer (H) is 2 metres.
H = 2 m
055.12 =HF (From Charts Set 1.2 – Edge Loading)
The wheels of the mobile tractor crane are approximately spaced at two metres from
centre to centre.
S = 2 m
065.12 =SF (From Charts Set 1.2 – Edge Loading)

CHAPTER 5 – OTHER DESIGNS 95
The calibration factor for geotechnical behaviour is equal to 1.05 for edge loading of the
slab.
05.13 =k (Edge loading factor)
The correction factor k4 is a calibration factor for standard concrete strengths. For a
concrete strength of 28 MPa, the factor is interpolated as 1.09.
09.14 =k [Industrial F & P – Tab. 1.19]
From equation 6, the stress factor is calculated.
60.209.105.1065.1055.11.184.12
=×××××=F
kNPForceAxle 157, ≈
Edge Slab Thickness for 8 Tonne Crane Load:
mmt 360= (From Charts Set 1.2 – Edge Loading)
5.1.2 Summary
Soil conditions have been assumed throughout the slab design. The DDHRS currently do
not have the necessary funds to obtain a soil test at the location of the restoration shed.
This testing will be included as future work for the DDHRS and the site must be
classified depending on its reactivity before any construction or design plans will be
approved by the Toowoomba City Council.
A summary of the slab thicknesses determined using the two different load cases are
shown in Table 5.1.
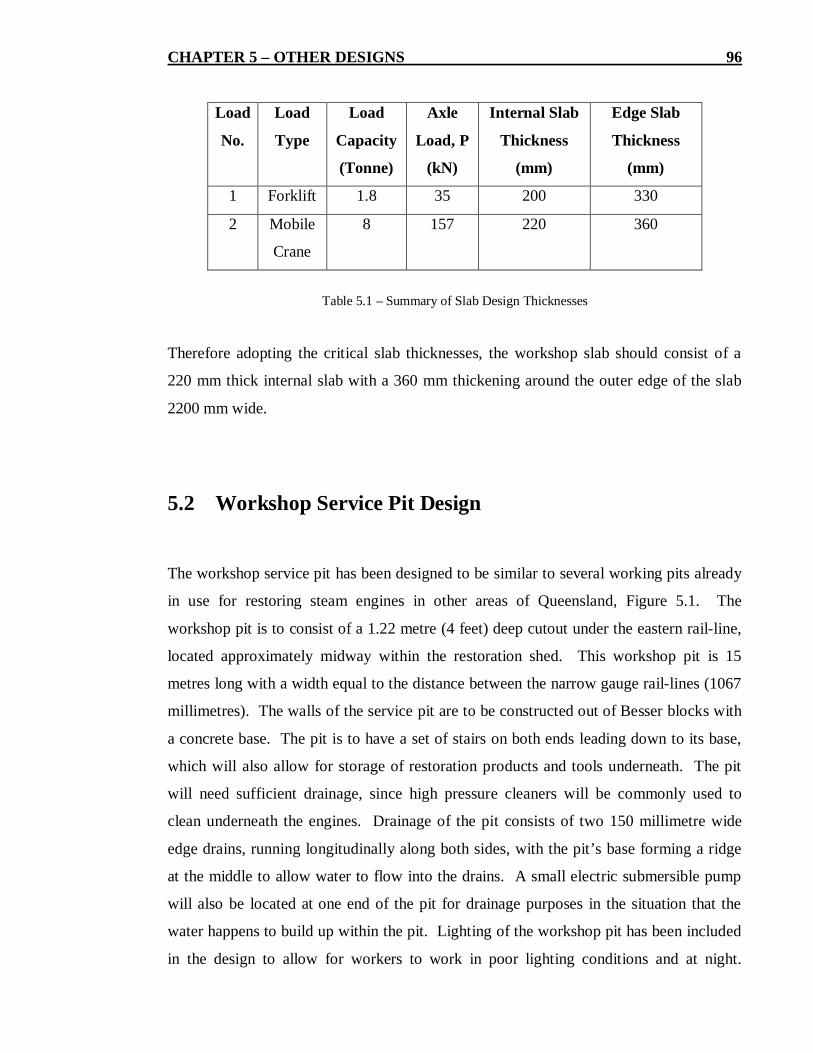
CHAPTER 5 – OTHER DESIGNS 96
Load
No.
Load
Type
Load
Capacity
(Tonne)
Axle
Load, P
(kN)
Internal Slab
Thickness
(mm)
Edge Slab
Thickness
(mm)
1 Forklift 1.8 35 200 330
2 Mobile
Crane
8 157 220 360
Table 5.1 – Summary of Slab Design Thicknesses
Therefore adopting the critical slab thicknesses, the workshop slab should consist of a
220 mm thick internal slab with a 360 mm thickening around the outer edge of the slab
2200 mm wide.
5.2 Workshop Service Pit Design
The workshop service pit has been designed to be similar to several working pits already
in use for restoring steam engines in other areas of Queensland, Figure 5.1. The
workshop pit is to consist of a 1.22 metre (4 feet) deep cutout under the eastern railline,
located approximately midway within the restoration shed. This workshop pit is 15
metres long with a width equal to the distance between the narrow gauge raillines (1067
millimetres). The walls of the service pit are to be constructed out of Besser blocks with
a concrete base. The pit is to have a set of stairs on both ends leading down to its base,
which will also allow for storage of restoration products and tools underneath. The pit
will need sufficient drainage, since high pressure cleaners will be commonly used to
clean underneath the engines. Drainage of the pit consists of two 150 millimetre wide
edge drains, running longitudinally along both sides, with the pit’s base forming a ridge
at the middle to allow water to flow into the drains. A small electric submersible pump
will also be located at one end of the pit for drainage purposes in the situation that the
water happens to build up within the pit. Lighting of the workshop pit has been included
in the design to allow for workers to work in poor lighting conditions and at night.
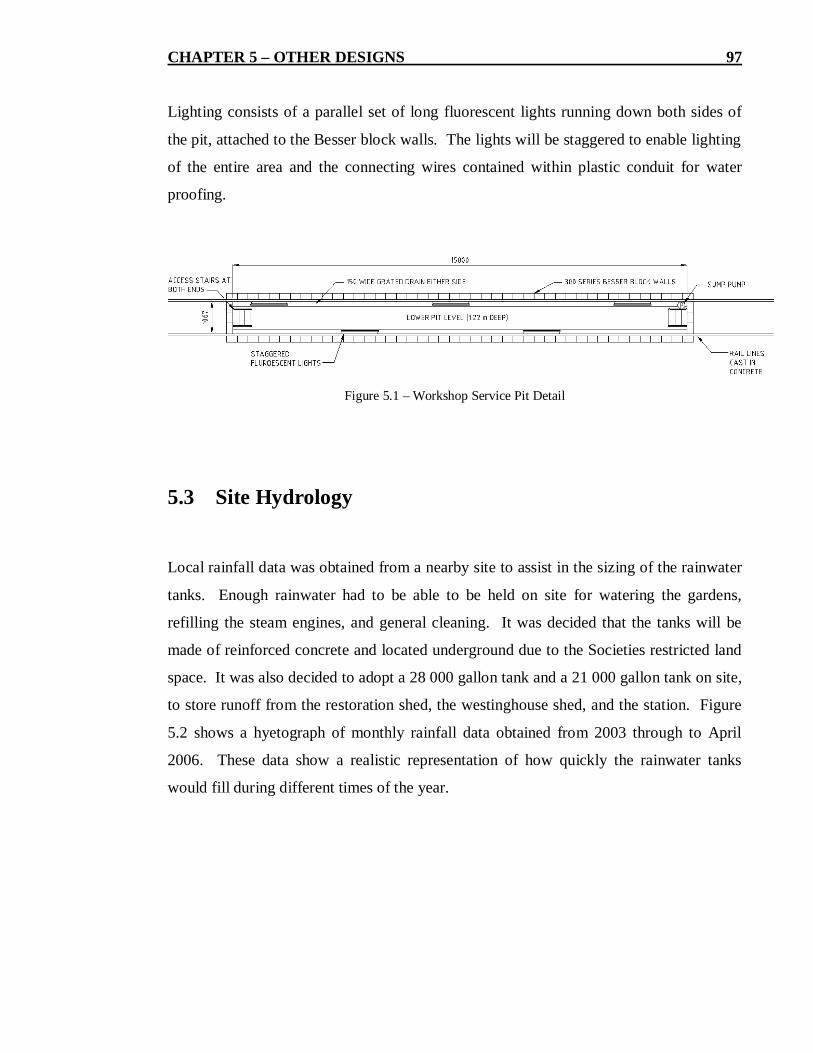
CHAPTER 5 – OTHER DESIGNS 97
Lighting consists of a parallel set of long fluorescent lights running down both sides of
the pit, attached to the Besser block walls. The lights will be staggered to enable lighting
of the entire area and the connecting wires contained within plastic conduit for water
proofing.
Figure 5.1 – Workshop Service Pit Detail
5.3 Site Hydrology
Local rainfall data was obtained from a nearby site to assist in the sizing of the rainwater
tanks. Enough rainwater had to be able to be held on site for watering the gardens,
refilling the steam engines, and general cleaning. It was decided that the tanks will be
made of reinforced concrete and located underground due to the Societies restricted land
space. It was also decided to adopt a 28 000 gallon tank and a 21 000 gallon tank on site,
to store runoff from the restoration shed, the westinghouse shed, and the station. Figure
5.2 shows a hyetograph of monthly rainfall data obtained from 2003 through to April
2006. These data show a realistic representation of how quickly the rainwater tanks
would fill during different times of the year.

CHAPTER 5 – OTHER DESIGNS 98
Monthly Rainfall for 2003 Present
0
50
100
150
200
250
January Febuary March April May June July August September October November December
Month
Rain
fall
(mm
)2003200420052006
Figure 5.2 – Hyetograph of Monthly Rainfall
The biggest consumption of water for the DDHRS is the refilling of steam engines. Since
the conversion of water to steam is the driving mechanical force behind their design, the
engines needs to be refilled regularly. Steam engines can hold approximately 3000
gallons of water or 13 638 litres. Current future plans for the steam engines estimate that
approximately one steam engine will be in need of filling per week, so 3000 gallons of
water will be needed solely for this purpose each week. Depending on business, this
value may double or half during some weeks. Other outgoing uses of water include water
for landscaping, bathroom basin, workshop basin, kitchen sinks, toilets, showers, and
cleaning of infrastructure.

CHAPTER 5 – OTHER DESIGNS 99
5.3.1 Tank Capacities
3288.127127288
546.42800028000
mLitres
Litresgallons
=
=×=
3466.9595466
546.42100021000
mLitres
Litresgallons
=
=×=
LCapacityTotal
22257495466127288
=+=
5.3.2 Incoming Rainwater
A sample hand calculation has been completed for the month of January using average
rainfall data from 2003 to 2006 showing how the total rainfall inflow into the tanks was
calculated.
weekmmweeksmmJanuary /264/104 =≈
From westinghouse shed:
L
fallrainAreaInflow
1427626)3.026.36()75.0226.13(
≈××+××+=
×=
(Allowing for a 75 mm overhang on the short roof axis and a 30 mm overhang on the
long roof axis)

CHAPTER 5 – OTHER DESIGNS 100
From entrance shed:
L
fallrainAreaInflow
24226)05.305.3(
≈××=
×=
Total weekly inflow into tanks:
LInflowTotal
1451824214276
=+=
Total inflow was calculated using the same process described above for each month of
the year, these values have been summarized in Table 5.2.
Year Jan Feb Mar Apr May Jun Jul Aug Sep Oct Nov Dec
2003 35 212 91.5 52.5 40 56 15.5 13 8.5 91.5 22.5 91.5
2004 155 82.5 121.5 31 8.5 3 8 12 43.9 44.5 64.5 173.2
2005 73.5 50 13.5 16.5 15 126 2 28 16 127 83 32
2006 151 23 18.5 39.5
Average 104 92 61 35 21 62 9 18 23 88 57 99
Weekly 26 23 15 9 5 15 2 4 6 22 14 25
Total Inflow
per week (L)14465 12825 8550 4868 2955 8608 1187 2466 3183 12238 7910 13806
Table 5.2 – Inflow of Monthly Rainfall
5.3.3 Outgoing Rainwater
1. STEAM ENGINES
Steam engines owned by the DDHRS have a water storage capacity of 3000 Gallons, it
has been estimated that one tank will need filling per week:
weekLitresLitresgallons/13638
546.430003000=
×=[1. Steam engine]

CHAPTER 5 – OTHER DESIGNS 101
2. KITCHEN SINK
Assume standard sink capacity is 25 L: sink will be filled 6 times Saturday and Sunday
and once each weekday. Since the Darling Downs Historical Rail Society has future
plans to incorporate a tram restaurant, the sink will be used more during busy periods.
175126/ =×+×=weekFills
weekLitresLusedWater
/4252517
=×=
[2. Kitchen sink]
3. TOILET
Assume standard full toilet flush is 5 L: approximately 100 people will use the toilet on
Saturday and Sunday and approximately 15 people each weekday.
2755152100/ =×+×=weekUses
weekLitresLusedWater
/13755275
=×=
[3. Toilet]
4. HAND BASIN (TOILET)
Assume standard hand wash is 1 L: approximately 100 people will wash their hands on
Saturday and Sunday and approximately 15 people each weekday.
2755152100/ =×+×=weekWashes
weekLitresLusedWater
/2751275
=×=
[4. Hand Basin (Toilet)]
5. HAND BASIN (WORKSHOP)
Assume standard hand wash is 1 L: approximately 25 workers will wash their hands each
day.
175725/ =×=weekWashes
weekLitresLusedWater
/1751175
=×=
[5. Hand Basin (Workshop)]

CHAPTER 5 – OTHER DESIGNS 102
6. SHOWERS
Assume standard shower uses 30 L: approximately 10 workers will shower each day.
70710/ =×=weekShowers
weekLitresLusedWater
/21003070
=×=
[6. Showers]
7. LANDSCAPING
Assume landscaping will only be done during the summer months and consume
approximately 500 L of water each week.
weekLitresusedWater /500= [7. Landscaping]
8. CLEANING
Assume cleaning of infrastructure will consume approximately 500 L of water each
week.
weekLitresusedWater /500= [8. Cleaning]
Total average water used on a weekly basis (summer):
Water used = (1. Steam engine) + (2. Kitchen sink) + (3. Toilet) + (4. Hand Basin
(Toilet)) + (5. Hand Basin (Workshop)) + (6. Showers) + (7. Landscaping)
+ (8. Cleaning)
= 13638 + 425 + 1375 + 275 + 175 + 2100 + 500 + 500
= 18813 Litres/Week
Now that all of the rainfall inflow and outflow data are known, a net figure of weekly
rainfall for each month can be calculated as shown in Table 5.3. Also if the tanks were
filled to the top during a particular month, then the number of typical weeks remaining
for that month until the tanks were emptied, was determined.

CHAPTER 5 – OTHER DESIGNS 103
Flow Jan Feb Mar Apr May Jun Jul Aug Sep Oct Nov DecTotal Inflow
per week (L)14465 12825 8550 4868 2955 8608 1187 2466.2 3182.7 12238 7910 13806
Total Outflow
per week (L)18813 18813 18813 18313 18313 18313 18313 18313 18313 18813 18813 18813
Net Flow
per week (L)4348 5988 10263 13445 15358 9705 17126 15847 15130 6575 10903 5007
Full capacity
of tanks (weeks)51 37 22 17 14 23 13 14 15 34 20 44
Table 5.3 – Net Weekly Flow from Tanks
5.4 Site Hydraulics
5.4.1 Gutters and Downpipes
In accordance with AS3500.3 2003, Lysaght Product Catalogue
Category: Road surfaces and paved areas (impervious) Table 5.05.1
Rainfall Duration = 5 minutes
Gutter slopes for the restoration shed shall be at a medium gradient of 1 in 500.
Gutters Grade = 1:500
From the program AUS–IFD, a table of typical rainfall intensities for Toowoomba were
able to be created for different storm durations and different Average Recurrence
Intervals.
hmmIIntensityyearsARIEventStormMajorhmmIIntensityyearsARIEventStormMinor/250,100,
/190,20,=→=
=→=
Approximate Area of Restoration Shed.
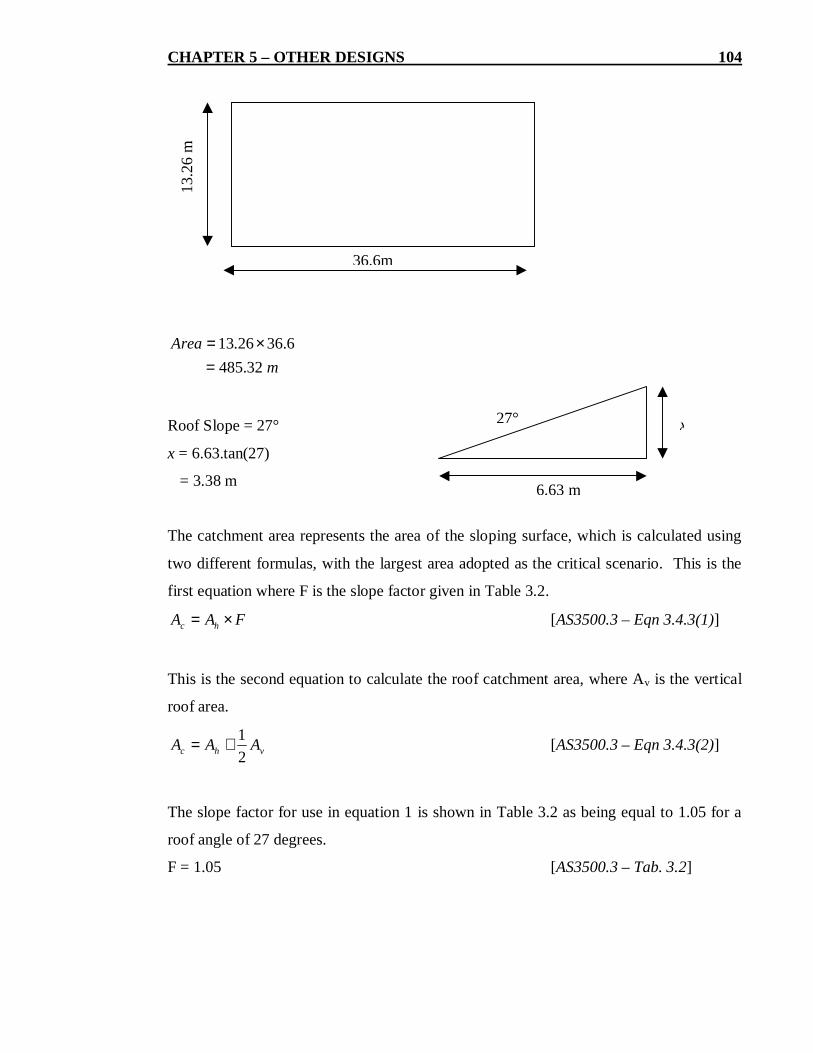
CHAPTER 5 – OTHER DESIGNS 104
mArea
32.4856.3626.13
=×=
Roof Slope = 27°
x = 6.63.tan(27)
= 3.38 m
The catchment area represents the area of the sloping surface, which is calculated using
two different formulas, with the largest area adopted as the critical scenario. This is the
first equation where F is the slope factor given in Table 3.2.
FAA hc ×= [AS3500.3 – Eqn 3.4.3(1)]
This is the second equation to calculate the roof catchment area, where Av is the vertical
roof area.
vhc AAA21
+= [AS3500.3 – Eqn 3.4.3(2)]
The slope factor for use in equation 1 is shown in Table 3.2 as being equal to 1.05 for a
roof angle of 27 degrees.
F = 1.05 [AS3500.3 – Tab. 3.2]
36.6m
13.2
6 m
x
6.63 m
27°

CHAPTER 5 – OTHER DESIGNS 105
So using equation 1,
279.254
05.1)6.3663.6(
m
Ac
=
××=
Or using equation 2,
251.304
)6.3638.3(21)6.3663.6(
m
Ac
=
×+×=
Therefore use the critical (larger) value: 51.304=cA
Try Quad 150D gutter, as specified in the Lysaght Product Catalogue
The crosssectional area of this particular make of gutter is given by Ae.28912 mmAe =
From Table 3.3, the required size of vertical downpipes (both circular and square or
rectangular) are given for a gutter gradient of 1:500 depending of the value of Ae.
Internal size of vertical downpipes:mmsquare
mmcircular75100
125×=
= φ[AS3500.3 – Tab. 3.3]
From Figure 3.5(A), the catchment area per vertical down pipe can be read off, for gutter
gradients 1:500 and steeper.
downpipemAc /52 2= [AS3500.3 – Fig. 3.5(A)]
The total number of downpipes needed for the restoration shed can now be calculated as
the total roof catchment area divided by the catchment area per vertical downpipe.
652
51.3042
1
≈
=
=c
c
AADownpipesofNumberTotal

CHAPTER 5 – OTHER DESIGNS 106
5.5 Bar Design
As part of the Darling Downs Historical Rail Societies desire to become a popular tourist
attraction, they decided to build a bar onboard their main carriage, which will one day
offer passenger trips. The bar was designed to suit the needs and ideas of the members.
Details and ideas were also taken from an already existing timber bar built in 2004,
Figure 5.3.
The bar has to withstand vibration effects produced by the moving carriage as it moves
along the railline. A post and rail system has to be designed on all open shelving to
prevent the accidental breakage of bottles due to movement from the carriage. Also all
loose fixtures including utensils and glasses must be restrained sufficiently to prevent
overturning or clashing. Members of the DDHRS suggested that miniorb roof sheeting
be used as the vertical covering material around the front and sides of the bar. Other
design ideas included creating a double level top section, with the bottom level for
working, and the top level as a serving bench.
Ideas taken from the original bar include skirting the bottom with a strip of wood to
provide a neat base and cover up the bottom edge of the miniorb, this will also prevent
injury as a result of any sharp edges on the roof sheeting. Another idea taken from the
existing bar was to provide a skirting strip around the underside of both upper serving
levels, this creates the illusion that the tabletop is double layered and twice as thick.
Refer to Figures 5.4 and 5.5 for a schematic of the design completed for the DDHRS.

CHAPTER 5 – OTHER DESIGNS 107
Figure 5.3 – Existing Bar
Figure 5.4 – Bar Design, Plan View
Upperskirtingstrip
Lowerskirtingstrip
Postand railsystem

CHAPTER 5 – OTHER DESIGNS 108
Figure 5.5 – Bar Design, Side Elevation

CHAPTER 5 – OTHER DESIGNS 109
5.6 Summary of Other Designs
Other designs completed to help the DDHRS in their endeavours have brought them
closer to achieving their goal. A summary of the other designs completed along with the
important conclusions found are listed below.
Slab Design – Adopt a 220 mm internal slab thickness with a 360 mm edge
thickness which runs 2200 mm wide around the slab boundary of
the restoration shed. Confirm the slab design upon completion of
soil testing.
Workshop Pit Construct a 15 metre long by 1.067 metre wide by 1.22 metres
deep concrete service pit. Use 300 series Besser blocks for the
walls with a concrete base, providing drainage, lighting, access
stairs and a submersible pump.
Site Hydrology Adopt a 21 000 gallon and a 28 000 underground reinforced
concrete tank for storm water storage. Install a drainage system to
capture rainwater from the restoration shed and the entrance shed.
Site Hydraulics Install six downpipes on the restoration shed, sized at either 125
mm diameter circular pipe or 100x75 mm rectangular pipe.
Bar A preliminary design for a bar in the main carriage has been
completed. Important characteristics of the design include a post
and rail system on all open shelving, top and bottom skirting strips,
and the use of mini orb roof sheeting on the sides and front of the
bar.

Chapter 6
Conclusions and Future Work
A design of the restoration shed for the DDHRS has been successfully completed in
accordance with Australian Standards. This design consisted of many different aspects of
civil/structural engineering; other designs were also completed to help the Society.
• Analysis of existing steel members
• Addition of railway lines into the shed design
• Increasing the height of the restoration shed
• Addition of a gantry crane
• Design of a workshop service pit
• Determination of the material properties of the steel
• Calculation of all loadings on the shed
• Purlin and girt design
• Space Gass analysis
• Workshop slab design
• Hydrological calculations from rainfall data
• Sizing of gutters and downpipes
• Design of a bar for the society’s main carriage
The Darling Downs Historical Rail Society still have some future work ahead before the
restoration shed can be safely built. Most of the tasks listed as future work, relate to the
procurement of construction materials. Other tasks relate to the contracting of
professional services such as surveying and soil testing, these tasks are solely dependant

CHAPTER 6 – CONCLUSIONS AND FUTURE WORK 111
upon the Society’s budget as to their completion. There are several important
construction notes that have been highlighted in this chapter to ensure that the restoration
shed is built safely and in the most economical manner in minimum time.
6.1 Future Work
Before construction of the restoration shed can take place, the DDHRS must first
complete the following tasks.
• Rethickening the webs of all rusted (thinned) out steel members by addition of
steel plates.
• Restoring all existing purlin and girt members by means of sandblasting and
painting with a weatherproofing layer.
• Restoring all truss members by means of sandblasting and painting with a
weatherproofing layer.
• Remove all existing nuts and bolts attached to the steel members, prior to
restoration, and smooth all bolt holes back to their original diameters.
• Acquirement of replacement nuts and bolts for member connections.
• Acquirement of several steel cleat plates, fin plates, turnbuckle braces, and other
steel connection components.
• Acquirement of 15015C sections to be used as girts on the walls of the restoration
shed, at the required spacings according to current Australian Standards.
• Test the soil or foundation material at the location of construction to determine its
bearing strength, and reactivity. The tests required to determine these properties
include one or more Dynamic Cone Penetrometer (DCP) tests, California Bearing
Ratio (CBR) tests and logging soil strata through drilling of boreholes.

CHAPTER 6 – CONCLUSIONS AND FUTURE WORK 112
Other future work for the DDHRS which relates to the other designs completed but does
not form part of the restoration shed include.
• Contracting a professional surveyor to determine spot levels at several locations
around the site, and accurately determine soil grades at critical locations for
drainage and construction of footpaths.
• Determine the invert levels of all onsite sanitary drainage pipes, adopting the
minimum pipe gradient of 1 in 60. Confirm the layout of pipes as shown in
preliminary design on drawing C001 – Sanitary Drainage Plan.
• Excavate the trenches and install all sanitary drainage pipes at the required invert
levels.
• Construct underground, a 28 000 gallon concrete tank and a 21 000 gallon
concrete tank. A government grant from the Toowoomba City Council will be
received to pay for the cost of constructing and installing these tanks.
• The location and sizes of all stormwater pipes need to be determined, and the
pipes placed at the minimum gradient of 1 in 100.
• The preliminary design of the bar for use in the main carriage needs to be
finalised by the DDHRS, modified if necessary, and then constructed.
CHAPTER 6 – CONCLUSIONS AND FUTURE WORK 113
6.1.1 Construction
There are several important safety and building notes to take into account when
construction of the shed takes place. Ensure that all the concrete used in construction is
of a minimum strength of 28 MPa. Adopt the appropriate concrete cover to
reinforcement on all concrete members and slabs, as detailed in the construction notes.
The correct lifting techniques need to be in place when moving large steel members and
roof sheeting. The structural members of the restoration shed must be fully propped and
positioned correctly in the appropriate order. Members must be fully fixed and self
standing prior to removal of any formwork or props. The slab must be adequately
vibrated to remove any air bubbles but not overvibrated to an extent where segregation is
evident. The load limits on the slab and roof must not be exceeded by abnormal
circumstances, especially large point loads. Appropriate construction safety equipment
must be worn by all workers and person’s onsite. If the conditions of the workshop shed
change in the future, such as purpose of the shed or addition of a gantry crane, the design
must be reassessed and modified accordingly.
CHAPTER 6 – CONCLUSIONS AND FUTURE WORK 114
6.2 Conclusions and Recommendations
It is recommended that the Darling Downs Historical Rail Society employ the local
services of ‘Soiltech’ to complete all soil testing procedures. Further more it is advised
that the DDHRS approach the University of Southern Queensland to complete all onsite
surveying. If USQ do not have the necessary time to help the Society, the society should
contact a company called ‘Ring Surveyors’ to carry out the surveying work. The
DDHRS are advised to use all existing ‘C’ sections as purlins for the restoration shed and
use all newly acquired metric ‘C’ sections as girts to avoid any differential heights.
A summary of the drawings that have been completed for the DDHRS include:
• C001 – Sanitary Drainage Plan
• C002 – External Layout Plan
• S001 – Roof Framing Plan
• S002 – Side Elevation Plan
• S003 – End Elevations Plan
• S004 – Foundation Plan
• Service Pit Detail
• Bar Design Plan
The initial plan at the beginning of 2006 was that the shed would be fully or partially
built by November 2006. The main reason for the shed not being completed by
November is the Societies lack of funds. There are several aspects of the shed design that
the DDHRS currently does not have funding for, or they do not know a company who is
willing to donate the particular material or service required. Services such as a soil test to
determine the reactivity of the soil and class the site, must be done prior to council
approval for development of the restoration shed. After all of the future work listed has
been completed, construction of the restoration shed can begin.
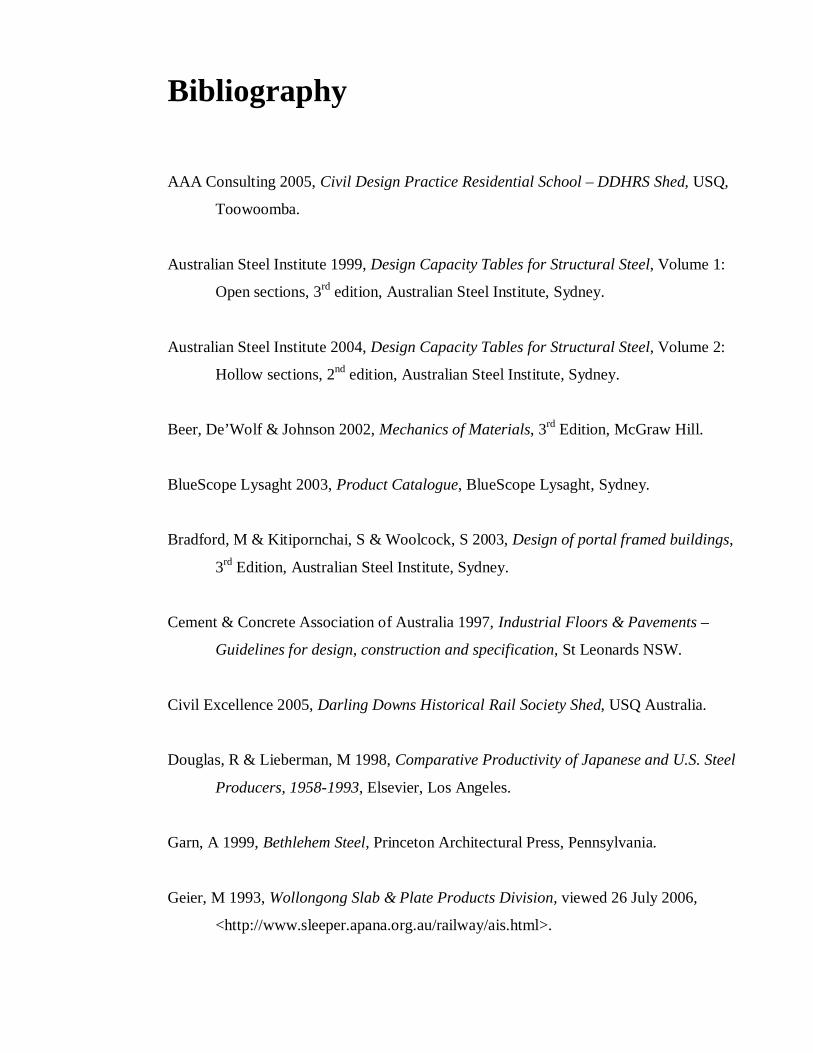
Bibliography
AAA Consulting 2005, Civil Design Practice Residential School – DDHRS Shed, USQ,
Toowoomba.
Australian Steel Institute 1999, Design Capacity Tables for Structural Steel, Volume 1:
Open sections, 3rd edition, Australian Steel Institute, Sydney.
Australian Steel Institute 2004, Design Capacity Tables for Structural Steel, Volume 2:
Hollow sections, 2nd edition, Australian Steel Institute, Sydney.
Beer, De’Wolf & Johnson 2002, Mechanics of Materials, 3rd Edition, McGraw Hill.
BlueScope Lysaght 2003, Product Catalogue, BlueScope Lysaght, Sydney.
Bradford, M & Kitipornchai, S & Woolcock, S 2003, Design of portal framed buildings,
3rd Edition, Australian Steel Institute, Sydney.
Cement & Concrete Association of Australia 1997, Industrial Floors & Pavements –
Guidelines for design, construction and specification, St Leonards NSW.
Civil Excellence 2005, Darling Downs Historical Rail Society Shed, USQ Australia.
Douglas, R & Lieberman, M 1998, Comparative Productivity of Japanese and U.S. Steel
Producers, 19581993, Elsevier, Los Angeles.
Garn, A 1999, Bethlehem Steel, Princeton Architectural Press, Pennsylvania.
Geier, M 1993, Wollongong Slab & Plate Products Division, viewed 26 July 2006,
<http://www.sleeper.apana.org.au/railway/ais.html>.

BIBLIOGRAPHY 116
Gorenc, B & Syam, A & Tinyou, R 2005, Steel Designers Handbook, 7th Edition, UNSW
Press, Sydney.
Hanson 2005, Bessa Product Catalogue, Issue 1/5, Brisbane.
Integrated Technical Software 2005, Space Gass V10.22, Licensee: GHD.
Powers, L 1931, Bethlehem Sections – Catalogue S40, Bethlehem Steel Co., Bethlehem.
Standards Australia 1996, AS2870 – Residential Slabs and Footings: Construction,
Standards Australia International Ltd, Sydney.
Standards Australia 1998, AS4100 – Steel Structures, Standards Australia International
Ltd, Sydney.
Standards Australia 2001, AS3600 – Concrete Structures, Standards Australia
International Ltd, Sydney.
Standards Australia 2002, AS1170.0 – Structural Design Principles: General Principles,
Standards Australia International Ltd, Sydney.
Standards Australia 2002, AS1170.1 – Structural Design Actions: Permanent, imposed
and other actions, Standards Australia International Ltd, Sydney.
Standards Australia 2002, AS1170.2 – Structural Design Actions: Wind actions,
Standards Australia International Ltd, Sydney.
Standards Australia 2003, AS3500.3 – Plumbing and Drainage: Stormwater drainage,
Standards Australia International Ltd, Sydney.
Standards Australia 2005, AS1391– Metallic Materials: Tensile testing at ambient
temperature, Standards Australia International Ltd, Sydney.

BIBLIOGRAPHY 117
T.J. Hogan & I.T. Thomas 1994, AISC – Design of Structural Connections, 4th edition,
Australian Steel Institute, Sydney.
Toowoomba City Council 2003, Toowoomba Planning Scheme 2003: Map 16,
Toowoomba City Council, Toowoomba.
Toowoomba City Council 2006, Automated Toowoomba Land Information System
(ATLIS), viewed 18 June 2006,
<http://www.toowoomba.qld.gov.au/eBiz/ArcIMS/Atlis/>.

APPENDIX A
Project Specification

University of Southern QueenslandFaculty of Engineering and Surveying
ENG4111/2 Research ProjectPROJECT SPECIFICATION
For: Tristan Breust
Topic: Design and Structural Analysis of a Steel Portal Framed Shed for the DarlingDowns Historical Rail Society
Supervisor: Dr Amar Khennane
Project Aim: The Darling Downs Historical Rail Society was given a steel framed shed in spareparts of unknown origin. The aim of this project is to help the Darling Downs Historical RailSociety erect the shed to provide a place for them to restore old steam engines to life. In particularthe project aims to determine the properties of the steel given, redesign the shed to allow extraclearance for installation of a gantry crane, supervise the erection of the shed then check todetermine whether it is safe.
Program: Issue C, 30 April 2006
1. Background study of Darling Downs Historical Rail Society (DDHRS) and the Bethlehem Steelcompany.
2. Modifying the original shed design to suit its new purpose for restoring old steam engines.
3. Prepare sewer and sanitary drainage layout plans for addition of new amenities blocks as well asother structural and civil drawings for construction.
4. Site hydraulics and hydrology
5. Determine the materials properties of the steel by means of laboratory testing using the tensiletesting apparatus located at the University of Southern Queensland (USQ).
6. Analyse proposed design, check for strength, deflection etc... and provide critical comments.
7. Preparing documentation for council approval.
AGREED: (Student) (Supervisor)
__ / __ / __ __ / __ /

APPENDIX B
Aerial Photograph of Site


APPENDIX C
Toowoomba Planning Scheme 2003 –Zone Map


APPENDIX D
Sample Test Data

APPENDIX D – SAMPLE TEST DATA 125
Test MethodMMTTensileTest.msm
Sample I. D. tristangr2501.mssSpecimen Number 1
Time (s) Load (N) Stress (MPa) Time (s) Load (N) Stress (MPa)
0 275 2.64 9 18753 179.420 24 0.23 9 19145 183.170 256 2.45 9 19587 187.41 697 6.67 9 19927 190.661 1080 10.33 10 20356 194.761 1426 13.64 10 20769 198.711 1858 17.78 10 21151 202.371 2364 22.61 10 21546 206.152 2824 27.02 10 21988 210.372 3242 31.02 11 22392 214.242 3749 35.87 11 22812 218.262 4176 39.96 11 23228 222.242 4575 43.77 11 23675 226.523 5056 48.38 11 24042 230.033 5459 52.23 11 24463 234.053 5914 56.58 12 24864 237.883 6360 60.85 12 25295 242.013 6823 65.28 12 25647 245.384 7222 69.09 12 25994 248.74 7677 73.45 12 26424 252.814 8133 77.81 13 26742 255.864 8589 82.18 13 27126 259.534 9044 86.53 13 27524 263.345 9476 90.66 13 27848 266.435 9955 95.25 13 28207 269.875 10412 99.62 14 28525 272.925 10873 104.03 14 28849 276.025 11293 108.05 14 29175 279.136 11747 112.39 14 29513 282.366 12127 116.03 14 29820 285.316 12621 120.75 15 30127 288.246 13018 124.55 15 30417 291.026 13443 128.62 15 30720 293.927 13914 133.12 15 30923 295.867 14344 137.23 15 31152 298.057 14762 141.23 16 31379 300.227 15262 146.02 16 31567 302.027 15685 150.07 16 31769 303.958 16166 154.67 16 31926 305.468 16593 158.76 16 32129 307.48 17007 162.728 17461 167.068 17914 171.49 18350 175.56

APPENDIX E
Wind Calculator Graphical Output

APPENDIX E – WIND CALCULATOR GRAPHICAL OUTPUT 127

APPENDIX F
Member Distributed Forces Datasheet

APPENDIX F – MEMBER DISTRIBUTED FORCES DATASHEET 129

APPENDIX G
Space Gass Graphical Output


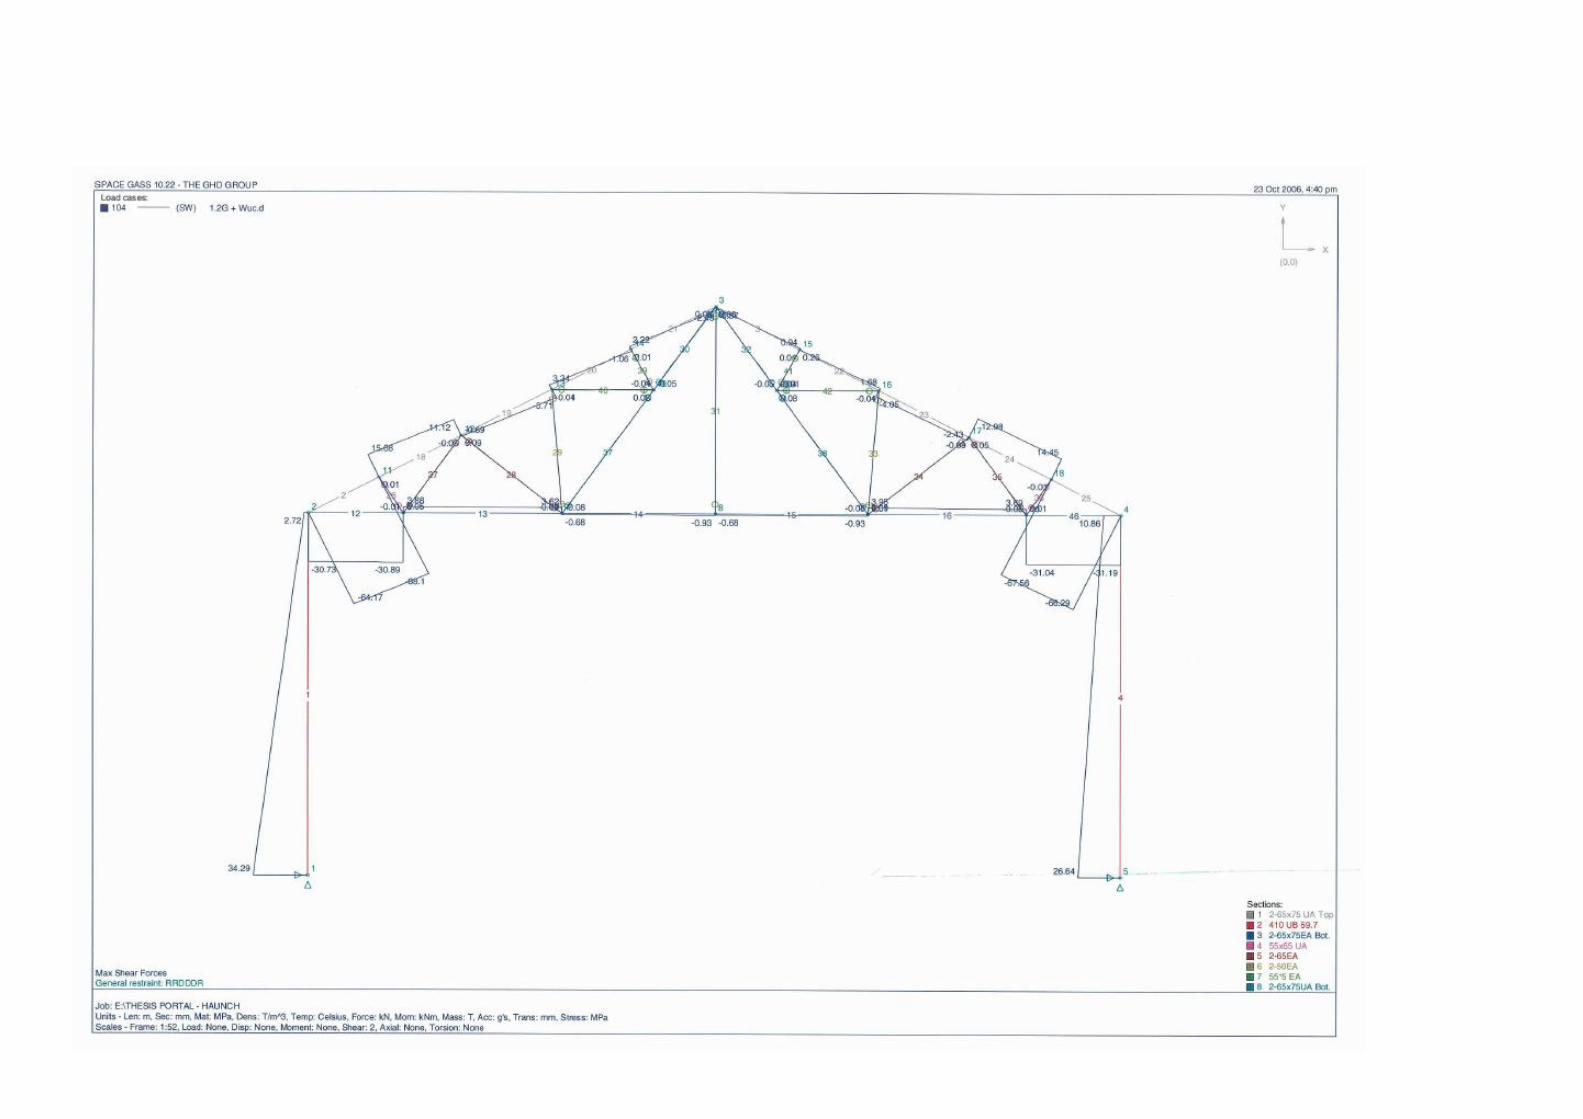

APPENDIX H
C001 – Sewer & Sanitary Drainage Plan
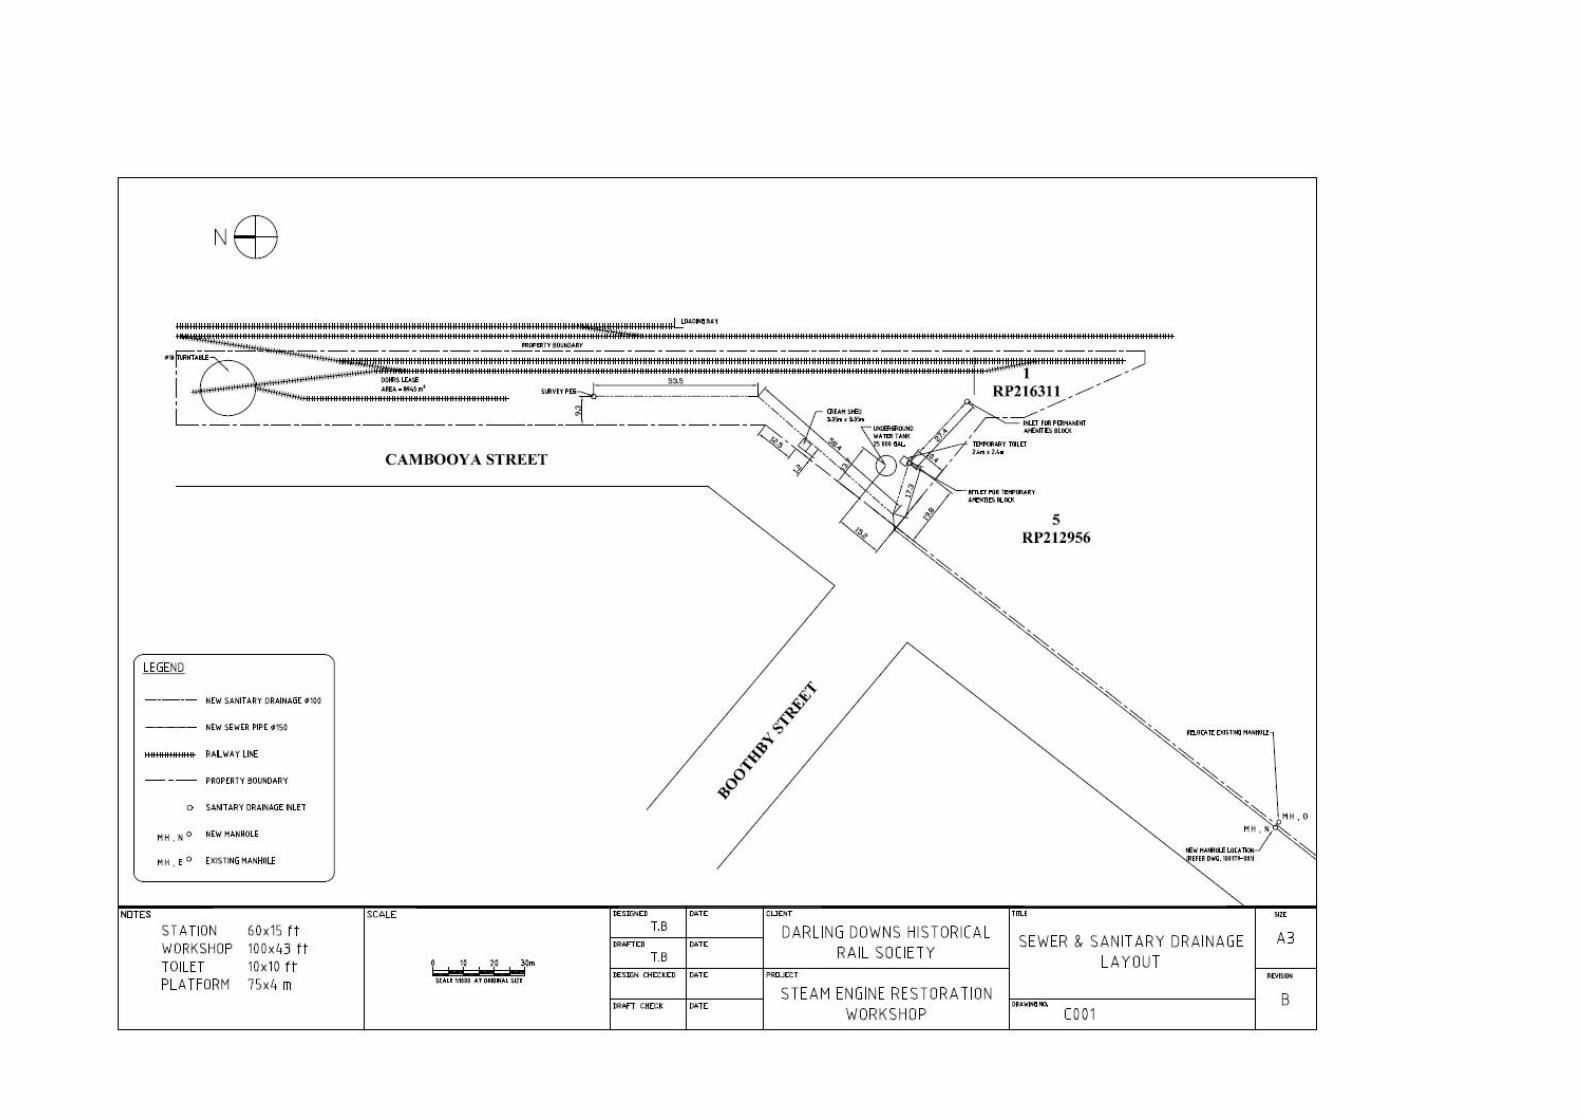

APPENDIX I
C002 – External Layout Plan


APPENDIX J
S001 – Roof Framing Plan


APPENDIX K
S002 – Side Elevation Plan

APPENDIX L
S003 – End Elevations Plan


APPENDIX M
S004 – Foundation Plan
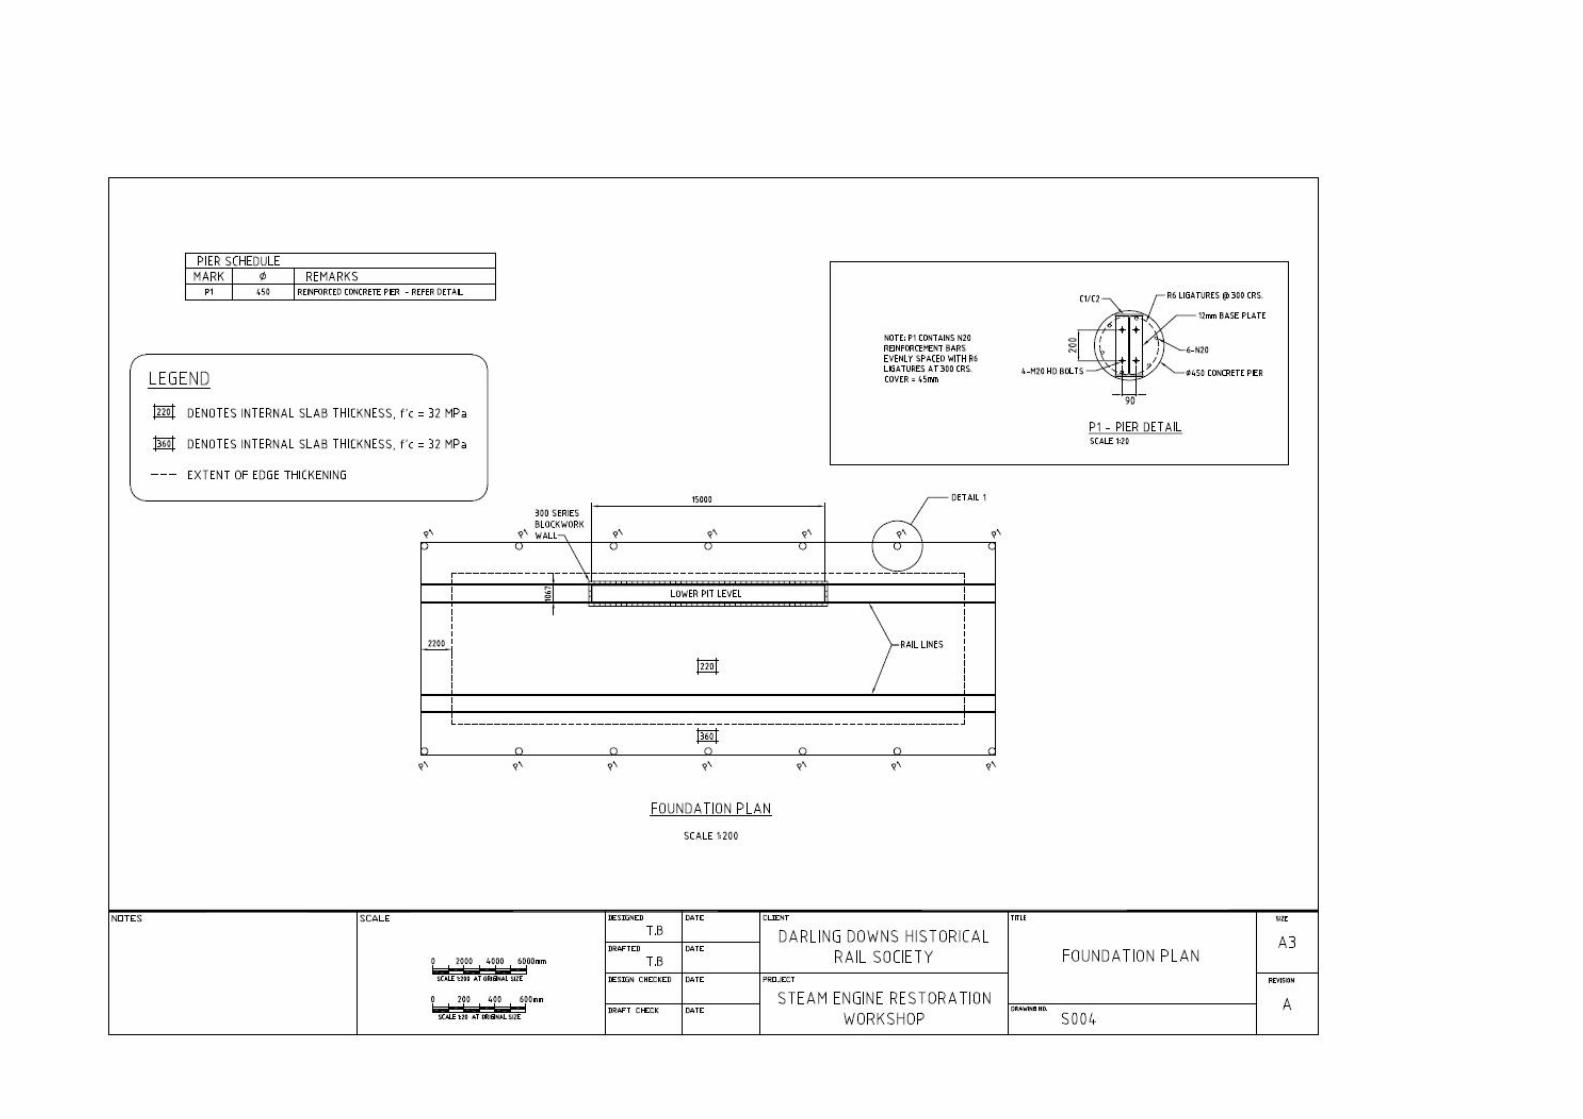

APPENDIX N
Construction Notes & Details