Pictures from Platts Global Energy Outlook Forum - Dec 12, 2013
Upload
apex-brasil-agencia-brasileira-de-promocao-de-exportacoes-e-investimentosCategory
view
881download
4description

17 Edition | December | 2012th
Brazilian Economic
OUTLOOK Ministry ofFinance
B R A Z I L I A N G O V E R N M E N T

Ministry of Finance
December Edition | Year 2012
3
Foreword
Economic Activity
Employment and Income
Inflation
Interest Rates and Credit
Fiscal Policy
External Sector
International Overview
Glossary
Summary
7
9
35
53
61
81
93
111
135


NOTE
The “Brazilian Economic Outlook” Report is published by the Ministry of Finance. It consolidates and updates the main macroeconomic variables related to the Brazilian economy. The report is coordinated by the Economic Policy Secretariat (SPE) with the contribution of the following Ministry of Finance´s bureaus: National Treasury Secretariat (STN), International Affairs Secretariat (SAIN), Secretariat for Economic Monitoring (SEAE) and Federal Revenue Secretariat (RFB). Data used in the report were updated until December 6th, 2012.


Ministry of Finance
December Edition | Year 2012
7
Ministry of Finance
Foreword
7
Brazilian economy prepared for a sustained economic growth
The Brazilian economy has shown strength in 2012, even with advanced economies remaining sluggish and world trade stagnated. Growth accelerated in the third quarter, and the economic outlook for 2013 is strong.
In order to boost the country’s productive capacity even further, this Administration has given incentives for investment and production, which have been showing consistent results. Not only do public sector investments play an important role, with emphasis on the Growth Acceleration Program (PAC 2), but also private investments are key to economic growth.
Public-private partnerships to fund relevant infrastructure projects are being stimulated, and incentives for the development of a long-term private credit market in Brazil are being implemented. As for production, payroll tax exemptions measures as well as energy cost actions have been taken, with benefits for several economic sectors.
Brazil is experiencing a very promising new macroeconomic balance with low interest rates and reduced financial costs of investment, a more competitive exchange rate, and sound fiscal results. The outcome of these measures has started to take effect, but a large part of their effects is still in the pipeline.


Brazilian Economy
OUTLOOK
Ministry ofFinance
B R A Z I L I A N G O V E R N M E N T
Economic Activity
Ministry of Finance
December Edition | Year 2012
10
Economic Activity
10
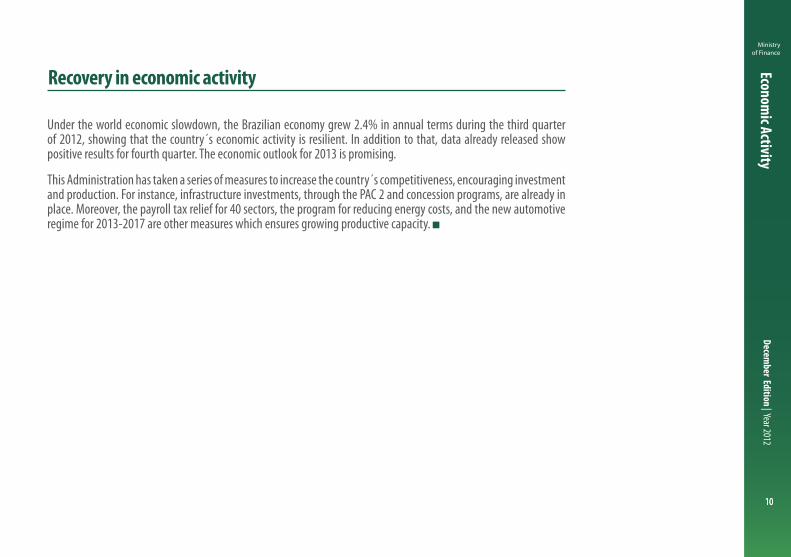
Under the world economic slowdown, the Brazilian economy grew 2.4% in annual terms during the third quarter of 2012, showing that the country´s economic activity is resilient. In addition to that, data already released show positive results for fourth quarter. The economic outlook for 2013 is promising.
This Administration has taken a series of measures to increase the country´s competitiveness, encouraging investment and production. For instance, infrastructure investments, through the PAC 2 and concession programs, are already in place. Moreover, the payroll tax relief for 40 sectors, the program for reducing energy costs, and the new automotive regime for 2013-2017 are other measures which ensures growing productive capacity.
Recovery in economic activity
Ministry of Finance
December Edition | Year 2012
Economic Activity
11
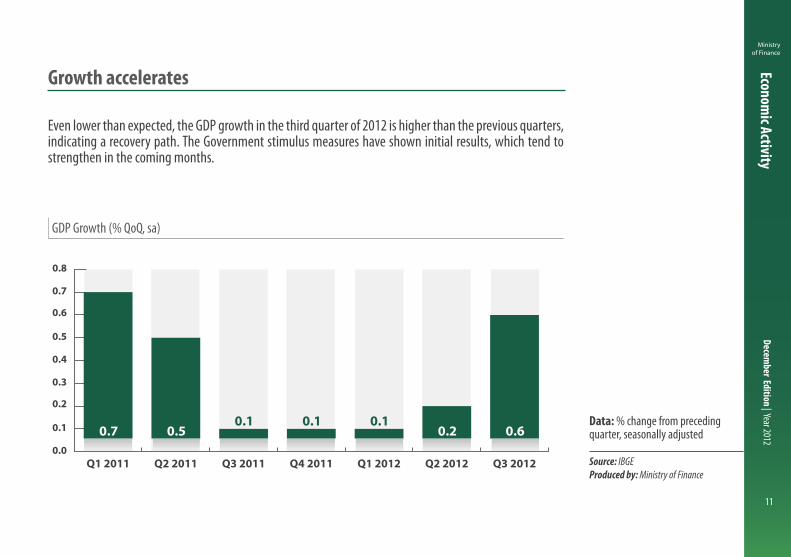
GDP Growth (% QoQ, sa)
Data: % change from preceding quarter, seasonally adjusted
Source: IBGEProduced by: Ministry of Finance
Growth accelerates
Even lower than expected, the GDP growth in the third quarter of 2012 is higher than the previous quarters, indicating a recovery path. The Government stimulus measures have shown initial results, which tend to strengthen in the coming months.
0.0
0.1
0.2
0.3
0.4
0.5
0.6
0.7
0.8
Q3 2012Q2 2012Q1 2012Q4 2011Q3 2011Q2 2011Q1 2011
0.7 0.50.1 0.1 0.1
0.2 0.6

Ministry of Finance
December Edition | Year 2012
Economic Activity
12
GDP Growth Rate: Demand and Supply (% QoQ, sa)
Q2 2012 Q3 2012
Data: % change from preceding quarter, seasonally adjusted
Source: IBGEProduced by: Ministry of Finance
Economic growth: supply and demand
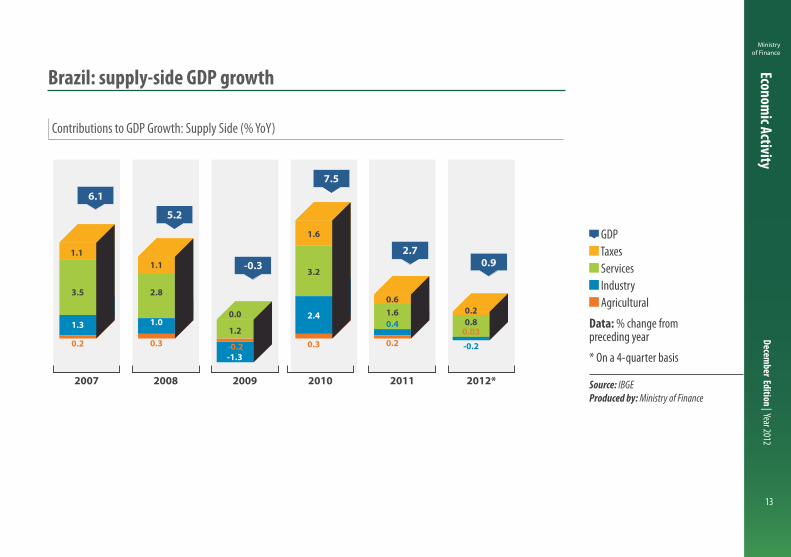
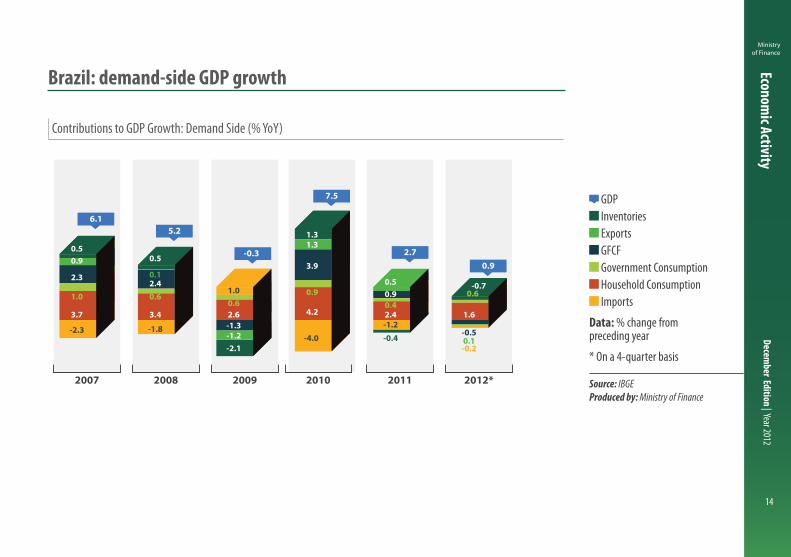
From a supply-side perspective, the 3rd-quarter output was driven by the performances of the agricultural (2.5%) and industrial sectors (1.1%), highlighted by manufacturing and civil construction industries. From a demand-side perspective, household consumption supported GDP growth (0.9%).
-2
-1
0
1
2
3
4
5
6
7
8
Gross Fixed Capital
Formation
GovernmentConsumption
HouseholdConsumption
GDPServicesIndustryAgricultural
Supply Demand
2012Q3 2012Q2
2.5 1.
1
0.0 0.6 0.
9
0.1
6.8
0.5
0.2 0.7 1.0
-2.0
-1.8
-1.6
Ministry of Finance
December Edition | Year 2012
Economic Activity
13
Contributions to GDP Growth: Supply Side (% YoY)
GDP Taxes Services Industry Agricultural
Data: % change from preceding year
* On a 4-quarter basis
Source: IBGEProduced by: Ministry of Finance
Brazil: supply-side GDP growth
2007 2008 2009 2010 2011 2012*
GDP
Services
Industry
Agriculture
Taxes
6.1
5.2
7.5
-0.32.7
0.91.1
3.5
1.3
0.2
1.1
2.8
1.0
0.3-1.3-0.2
0.0
1.2
1.6
3.2
2.4
0.3
0.61.60.4
0.2
0.20.8
0.03
-0.2
Ministry of Finance
December Edition | Year 2012
Economic Activity
14
Contributions to GDP Growth: Demand Side (% YoY)
GDP Inventories Exports GFCF Government Consumption Household Consumption Imports
Data: % change from preceding year
* On a 4-quarter basis
Source: IBGEProduced by: Ministry of Finance
Brazil: demand-side GDP growth
2007 2008 2009 2010 2011 2012*
6.15.2
-0.3
7.5
2.70.9
GDP
Inventories
GFCF
Government consumption
Household consumption
Imports
Exports
0.9
2.3
3.7
1.0
0.5
-2.3
0.5
2.4
3.4
0.1
0.6
-1.8
1.00.62.6
-2.1-1.2-1.3
3.9
0.9
4.2
-4.0
1.31.3
0.50.90.42.4
-0.4
-1.2
0.6
1.6
0.1
-0.7
-0.5
-0.2
Ministry of Finance
December Edition | Year 2012
Economic Activity
15
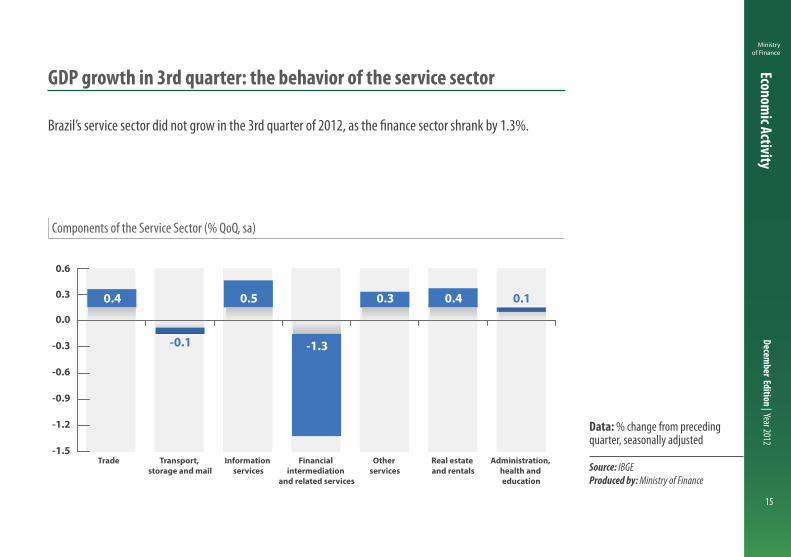
Components of the Service Sector (% QoQ, sa)
Data: % change from preceding quarter, seasonally adjusted
Source: IBGEProduced by: Ministry of Finance
GDP growth in 3rd quarter: the behavior of the service sector
Brazil’s service sector did not grow in the 3rd quarter of 2012, as the finance sector shrank by 1.3%.
-1.5
-1.2
-0.9
-0.6
-0.3
0.0
0.3
Administration, health and education
Real estate and rentals
Other services
Financial intermediation
and related services
Information services
Transport, storage and mail
Trade
0.6
0.4
-0.1
0.5
-1.3
0.3 0.4 0.1
Ministry of Finance
December Edition | Year 2012
Economic Activity
16
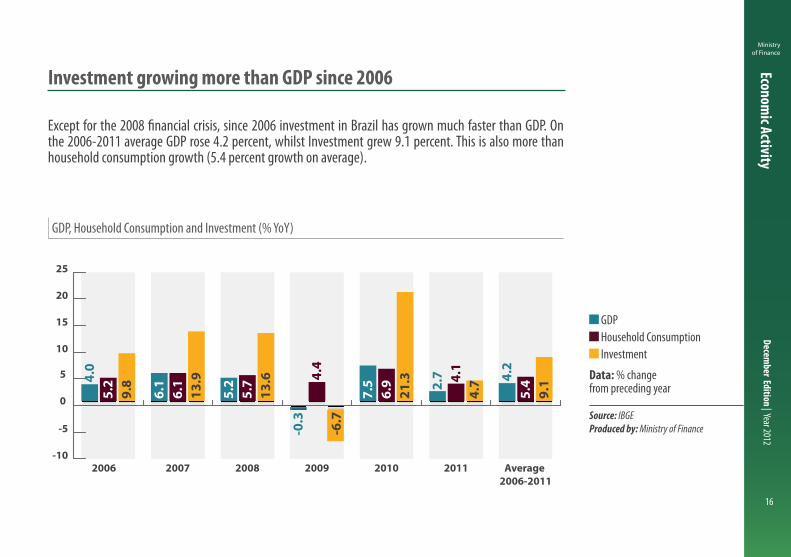
GDP, Household Consumption and Investment (% YoY)
GDP Household Consumption Investment
Data: % change from preceding year
Source: IBGEProduced by: Ministry of Finance
Investment growing more than GDP since 2006
Except for the 2008 financial crisis, since 2006 investment in Brazil has grown much faster than GDP. On the 2006-2011 average GDP rose 4.2 percent, whilst Investment grew 9.1 percent. This is also more than household consumption growth (5.4 percent growth on average).
-10
-5
0
5
10
15
20
25
-0.3
9.8
13.9
13.6
-6.7
21.3
4.7
9.1
5.2
6.1
5.7 4.
4
6.9 4.
1
5.44.
0
6.1
5.2
7.5 2.
7 4.2
Average 2006-2011
201120102009200820072006
GDPGFCF Household Consumption

Ministry of Finance
December Edition | Year 2012
Economic Activity
17
Industrial Production Index (index number, sa)
Data: index number, seasonally adjusted (average 2002 = 100)
Source: IBGEProduced by: Ministry of Finance
Industrial production points to growth recovery
Industrial production increased by 0.9% in October 2012 against September, sustained mainly by the manufacturing of intermediate goods (0.6%). The third quarter of 2012 had already recorded an 1.1% expansion. The result strengthens the optimism in relation to the activity recovery for the industrial sector.
90
95
100
105
110
115
120
125
130
135
Oct 2012
Sep 2012
Jun 2012
Mar 2012
Dec 2011
Sep 2011
Jun 2011
Mar 2011
Dec 2010
Sep 2010
Jun 2010
Mar 2010
Dec 2009
Sep 2009
Jun 2009
Mar 2009
Dec 2008
Sep 2008
Jun 2008
Mar 2008
Dec 2007
Sep 2007
127.0
Index-number (average 2002=100)
Ministry of Finance
December Edition | Year 2012
Economic Activity
18
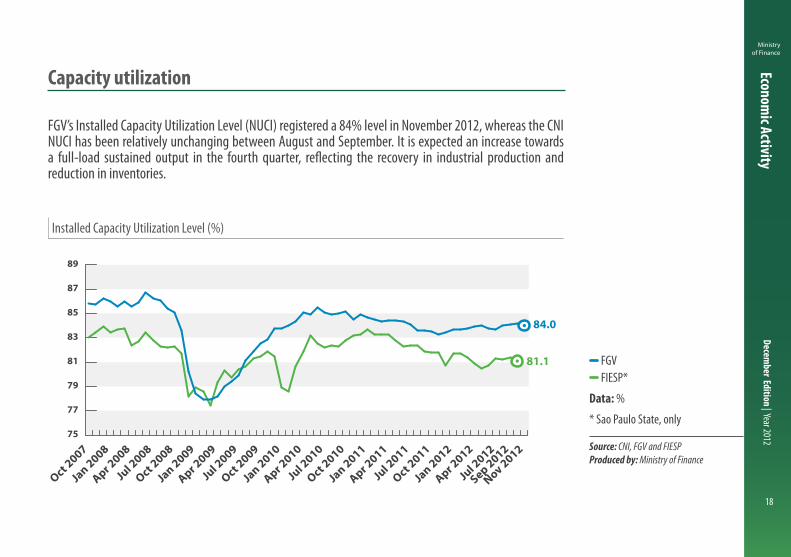
Installed Capacity Utilization Level (%)
FGV FIESP*
Data: %
* Sao Paulo State, only
Source: CNI, FGV and FIESPProduced by: Ministry of Finance
Capacity utilization
FGV’s Installed Capacity Utilization Level (NUCI) registered a 84% level in November 2012, whereas the CNI NUCI has been relatively unchanging between August and September. It is expected an increase towards a full-load sustained output in the fourth quarter, reflecting the recovery in industrial production and reduction in inventories.
75
77
79
81
83
85
87
89
84.0
81.1
NUCI - FIESP** NUCI - FGV
Nov 2012
Sep 2012
Jul 2
012
Apr 2012
Jan 2012
Oct 2011
Jul 2
011
Apr 2011
Jan 2011
Oct 2010
Jul 2
010
Apr 2010
Jan 2010
Oct 2009
Jul 2
009
Apr 2009
Jan 2009
Oct 2008
Jul 2
008
Apr 2008
Jan 2008
Oct 2007

Ministry of Finance
December Edition | Year 2012
Economic Activity
19
Retail Trade Survey (% YoY)
PMC Broad PMC*
Data: % change from preceding year
* Including vehicles, motorcycles, parts and pieces, and building materials
Source: IBGEProduced by: Ministry of Finance
Robust retail sales
Both retail sales indicators follow an acceleration trend, registering 8.1% and 6.6% on a 12-month basis, respectively.
8.1
6.6
0
2
4
6
8
10
12
14
Sep 2012
Jul 2
012
May 2012
Mar 2012
Jan 2012
Nov 2011
Sep 2011
Jul 2
011
May 2011
Mar 2011
Jan 2011
Nov 2010
Sep 2010
Jul 2
010
May 2010
Mar 2010
Jan 2010
Nov 2009
Sep 2009
Broad PMC Restricted PMC
Ministry of Finance
December Edition | Year 2012
Economic Activity
20
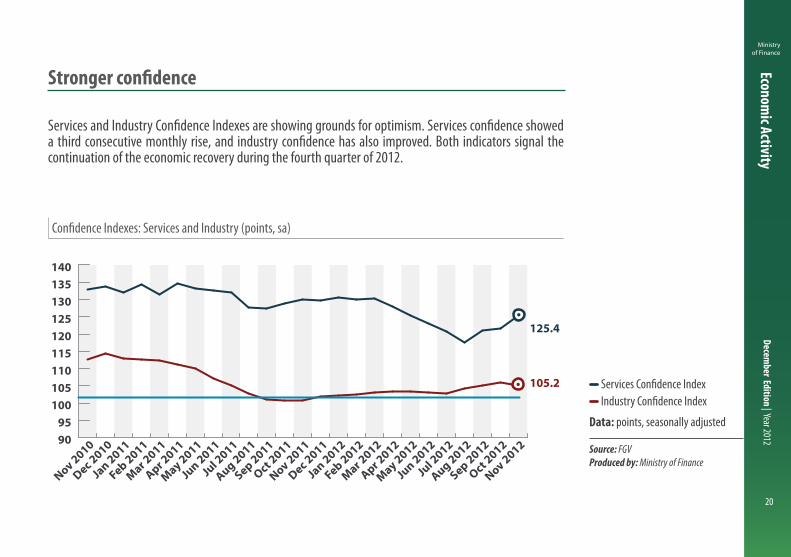
Confidence Indexes: Services and Industry (points, sa)
Services Confidence Index Industry Confidence Index
Data: points, seasonally adjusted
Source: FGVProduced by: Ministry of Finance
Stronger confidence
Services and Industry Confidence Indexes are showing grounds for optimism. Services confidence showed a third consecutive monthly rise, and industry confidence has also improved. Both indicators signal the continuation of the economic recovery during the fourth quarter of 2012.
9095
100105110115120125130135140
125.4
105.2
Industry Con�dence IndexServices Con�dence Index
Nov 2012
Oct 2012
Sep 2012
Aug 2012
Jul 2
012
Jun 2012
May 2012
Apr 2012
Mar 2012
Feb 2012
Jan 2012
Dec 2011
Nov 2011
Oct 2011
Sep 2011
Aug 2011
Jul 2
011
Jun 2011
May 2011
Apr 2011
Mar 2011
Feb 2011
Jan 2011
Dec 2010
Nov 2010
Ministry of Finance
December Edition | Year 2012
Economic Activity
21
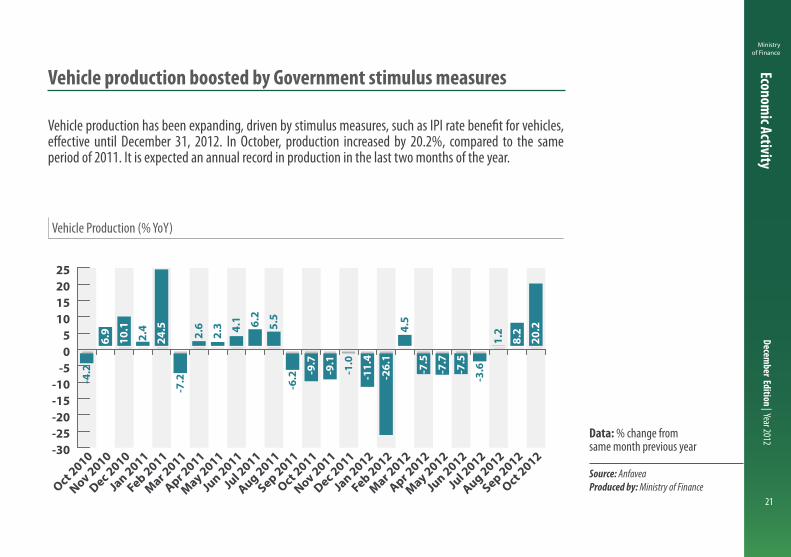
Vehicle Production (% YoY)
Data: % change from same month previous year
Source: AnfaveaProduced by: Ministry of Finance
Vehicle production boosted by Government stimulus measures
Vehicle production has been expanding, driven by stimulus measures, such as IPI rate benefit for vehicles, effective until December 31, 2012. In October, production increased by 20.2%, compared to the same period of 2011. It is expected an annual record in production in the last two months of the year.
-30-25-20-15-10
-505
10152025
Oct 2012
Sep 2012
Aug 2012
Jul 2
012
Jun 2012
May 2012
Apr 2012
Mar 2012
Feb 2012
Jan 2012
Dec 2011
Nov 2011
Oct 2011
Sep 2011
Aug 2011
Jul 2
011
Jun 2011
May 2011
Apr 2011
Mar 2011
Feb 2011
Jan 2011
Dec 2010
Nov 2010
Oct 2010
10.1
2.4
24.5
2.6
2.3 4.
1 6.2
4.5
1.2
20.2
-4.2
-7.2 -6.2 -2
6.1
-3.6
-11.
4
-7.5
-7.7
-7.5
-9.7
-9.1
-1.0
5.5
6.9
8.2
Ministry of Finance
December Edition | Year 2012
Economic Activity
22
Manufacturing PMI (index)
Data: index
* Values above 50 indicate growth
Source: BloombergProduced by: Ministry of Finance
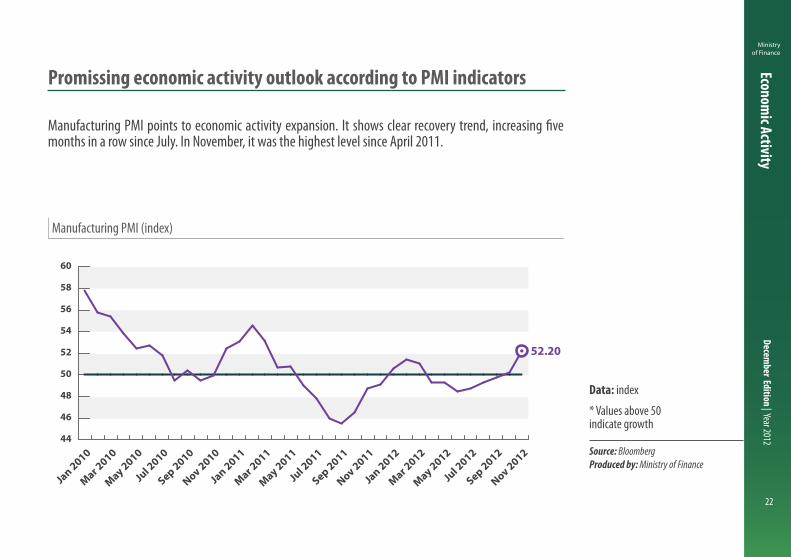
Promissing economic activity outlook according to PMI indicators
Manufacturing PMI points to economic activity expansion. It shows clear recovery trend, increasing five months in a row since July. In November, it was the highest level since April 2011.
44
46
48
50
52
54
56
58
60
PMI Brazil Manufacture
52.20
Nov 2012
Sep 2012
Jul 2
012
May 2012
Mar 2012
Jan 2012
Nov 2011
Sep 2011
Jul 2
011
May 2011
Mar 2011
Jan 2011
Nov 2010
Sep 2010
Jul 2
010
May 2010
Mar 2010
Jan 2010
Ministry of Finance
December Edition | Year 2012
Economic Activity
23
Household Consumption in 2020: Selected Countries (R$ trillion)
Data: R$ trillion
Source: Exame Magazine, Mckinsey Consulting and FecomercioProduced by: Ministry of Finance
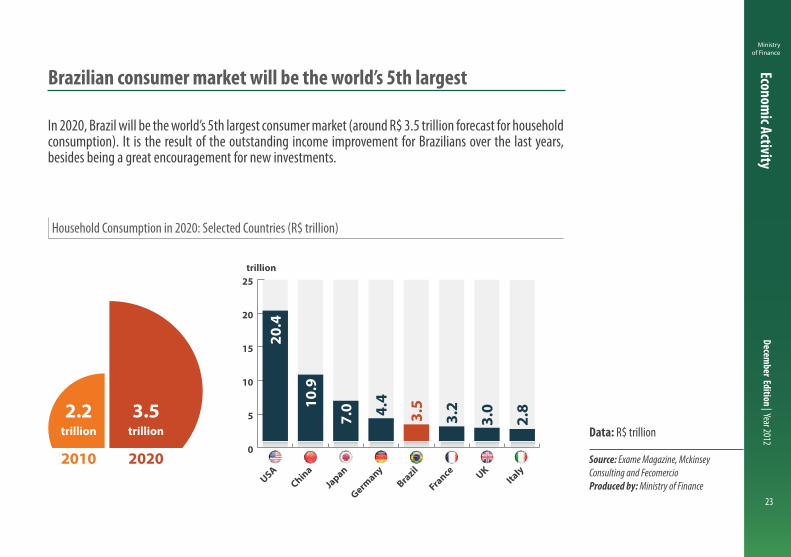
Brazilian consumer market will be the world’s 5th largest
In 2020, Brazil will be the world’s 5th largest consumer market (around R$ 3.5 trillion forecast for household consumption). It is the result of the outstanding income improvement for Brazilians over the last years, besides being a great encouragement for new investments.
0
5
10
15
20
25
ItalyUK
France
Brazil
Germany
Japan
ChinaUSA
20.4
10.9
7.0 4.
4
3.5
3.2
3.0
2.8
2010 2020
2.2 3.5trillion
trillion
trillion

Ministry of Finance
December Edition | Year 2012
Economic Activity
24
Consumer Market (position)
Data: position
Source: Exame Magazine, Mckinsey Consulting, Escopo, Euromonitor, Anfavea and AbracicloProduced by: Ministry of Finance
Brazilian consumer market will attract more and more investments
Investors recognize the growing trend of the Brazilian consumer market and, despite the international crisis, Brazil continues as one of the leading investment destinations.
Brazilian ConsumptionSector 2012 2020
Perfumery Articles 1st 1st
Automobiles 4th 3rd
Food and beverages 4th 3rd
Clothing 5th 3rd
Domestic Aviation 4th -
Motorcycles 4th 3rd
Computers 3rd -
Refrigerators 3rd -
Products for Pet Animals 3rd 2nd

Ministry of Finance
December Edition | Year 2012
Economic Activity
25
Brazilian Grain Harvest (millions of tons)
Data: millions of tons
* Conab forecasts
Source: Conab/MAPAProduced by: Ministry of Finance
Record for the Brazilian harvest
The Brazilian grain harvest in 2011/2012 states a new record-breaking achievement, equal to 166.2 million of tons, despite the lower increase in the planted area. The growing trend of agricultural production is a result of increasing investment in the sector, and an even better result is expected for 2012/2013.
70
80
90
100
110
120
130
140
150
160
170
180
2012/2013*
2011/2012
2010/2011
2009/2010
2008/2009
2007/2008
2006/2007
2005/2006
2004/2005
2003/2004
2002/2003
2001/2002
2000/2001
1999/2000
83.0
100.3 96.8
123.2 119.1114.7
122.5
131.8
144.1135.1
149.3
162.8 166.2
180.2

Ministry of Finance
December Edition | Year 2012
Economic Activity
26
Agricultural Production in Selected Countries (index number)
Brazil Russia India China USA Canada European Union
Data: index number (average 2005 = 100)
Source: FAOProduced by: Ministry of Finance
Brazilian agriculture pushed to the forefront
Brazil is one of the world’s largest producer of agricultural goods and its production will grow even further in the coming years. Due to outstanding agricultural production, the country has already established itself as one of the main exporters of primary goods.
40
60
80
100
120
140
160
180
20192016
20132010
20072004
20011998
19951992
Brazil
Russia
China
CanadaEU*
United States
India
Estimates
2014

Ministry of Finance
December Edition | Year 2012
Economic Activity
27
Federal Government Investment (R$ billion and %)
2011 2012
Data: R$ billion and % change in the period
* YTD: year-to-date
Source: STN/Ministry of FinanceProduced by: Ministry of Finance
Federal investment has increased
Federal Government investment pace has increased in the last 12 months. Until October 2012, investments are 22.9% above the same period last year.
0
10
20
30
40
50
60
OctSepAugJulJunMayAprMarFeb Jan
27.9% 23.3%22.9%
-1.0%3.3%
23.5%28.9%
30.2%
29.4%
30.7%
7.7
9.6
15.7
21.1
26.2
32.8
38.8
42.5
45.2
50.9
7.8
9.3
12.7
16.4
20.2
25.1
30.0
33.2
36.7
41.4

Ministry of Finance
December Edition | Year 2012
Economic Activity
28
Public Sector Investment* (% of GDP)
State-owned companies States and Municipalities Government
Data: % of GDP
* Only investments carried out directly by the National Government (not including transfers to States and Municipalities, to private institutions or MCMV, which are accounted by the IBGE as GFCF);
** Ministry of Finance forecast
Source: STN/Ministry of FinanceProduced by: Ministry of Finance
Public investment is also increasing fast
The consolidated public investment is on an expansion track in 2012, contributing to better long-term economic prospects.
0
1
2
3
4
5
1.6 1.51.5
1.3
0.80.8
0.9
1.1
1.1 1.0 1.0
1.0 1.1
1.4
1.8
1.9
1.7
1.9
1.7 1.81.5
2.0
1.31.5 1.5
1.8
1.3 1.4 1.3
1.61.4
1.8 1.7
2.0
1.71.8
2012**2011
20102009
20082007
20062005
20042003
20022001
20001999
19981997
19961995
0.5 0.4 0.4 0.5 0.3 0.3 0.4 0.5 0.2 0.2 0.3 0.4 0.4 0.5 0.6 0.8 0.6 0.7
1.7 1.81.5
2.0
1.31.5 1.5
1.8
1.3 1.4 1.31.6
1.4
1.8 1.7
2.0
1.71.8
1.6 1.51.5
1.3
0.80.8
0.9
1.1
1.1 1.0 1.01.0 1.1
1.41.8
1.9
1.71.9
State-owned Companies States and Municipalities Federal Government
Ministry of Finance
December Edition | Year 2012
Economic Activity
29
“Minha Casa Minha Vida” Housing Program (R$ million)
Data: R$ million
Source: STN/Ministry of FinanceProduced by: Ministry of Finance
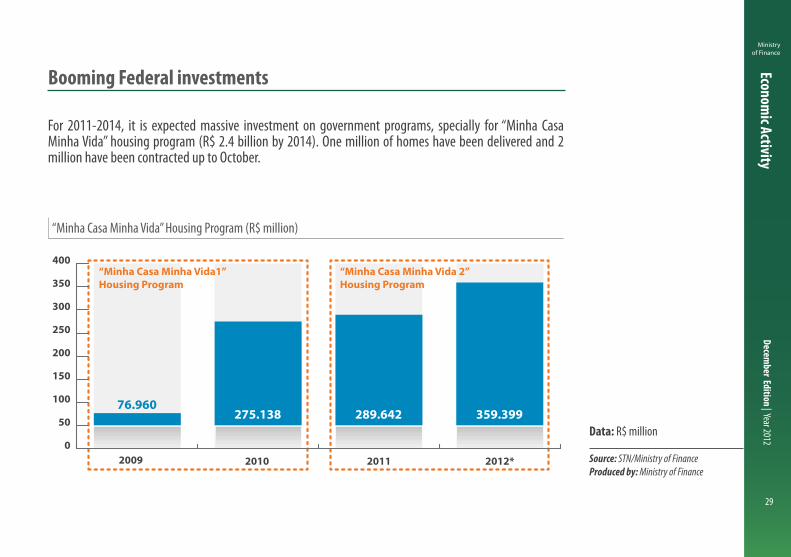
Booming Federal investments
For 2011-2014, it is expected massive investment on government programs, specially for “Minha Casa Minha Vida” housing program (R$ 2.4 billion by 2014). One million of homes have been delivered and 2 million have been contracted up to October.
0
50
100
150
200
250
300
350
400
2012*201120102009
76.960 275.138 289.642 359.399
“Minha Casa Minha Vida1”Housing Program
“Minha Casa Minha Vida 2” Housing Program

Ministry of Finance
December Edition | Year 2012
Economic Activity
30
PAC Spending: 2011-2012 (R$ billion)
2011 2012
Data: R$ billion
* YTD: year-to-date
Source: STN/Ministry of FinanceProduced by: Ministry of Finance
PAC speeds up investments
PAC 2 investments have moved consistently upwards in 2012 compared to last year. For example, amounts paid up to October 2012 (R$ 26.6 billion) are larger 27.7% than in 2011 (R$ 20.8 billion). As a result, there will be increasing economic activity and higher country’s productive capacity.
0
5
10
15
20
25
30
5.6% 19.1%
46.9%50.0%
44.8%
52.6%36.3%
33.5%35.1%
27.7%
3.1
4.1
8.0
11.3
14.2
18.6
20.3
22.3
24.3
26.6
2.9
3.5
5.5
7.6
9.8
12.2
14.9
16.7
18.0
20.8
2012 2011
OctSepAugJulJunMayAprMarFebJan

Ministry of Finance
December Edition | Year 2012
Economic Activity
31
Petrobras Business Plan (US$ billion)
Data: US$ billion
* Released on June 14, 2012
Source: PetrobrasProduced by: Ministry of Finance
Petrobras: top 2 global energy investor
According to the International Energy Agency (IEA), Petrobras will invest US$ 47.3 billion in new projects in 2012, just below Petrochina (US$ 48 billion). Also, Petrobras will remain as a major worldwide investor over the next four years, based on the company’s business plan, which states a US$ 236.5 billion investment for 2012-2016.
Business Plan - Petrobras*, 2012 to 2016 (US$ billion)
Exploration and Production 141.865.5
Gas and Energy 13.8Petrochemical 5.0Distribution 3.6Biofuel 3.8Corporate 3.0Total 236.5
Re�ning, Transportation and trading

Ministry of Finance
December Edition | Year 2012
Economic Activity
32
Public Service Concession
Source: Secretariat of Civil AviationProduced by: Ministry of Finance
Concession Program will leverage investments in infrastructure
Infrastructure investments in Brazil will count on the private sector’s active involvement. The airport sector total investment will be approximately R$ 16 billion in the coming years, considering only airport concessions in Brasilia, Guarulhos and Viracopos. Also, the Logistics Investment Program considers R$ 133 billion for renovation and construction of federal highways and railways. Around 60% (R$ 79.5 billion) will be invested within 5 years.
Total Investment: R$ 133 billion (R$ 79.5 billionin 5 years and R$ 53.5 billion from 20 to 25 years
Airport Concession: Planned Investment R$ 16.2 billion
Investment on Highways R$ 42 billion
(7.500 km)(R$ 23.5 bi in 5 years and R$ 18.5 bi in 20 years)
Investment in Railways R$ 91 billion (10,000 km)
(R$ 56 bi in 5 years and R$ 35 bi in 25 years)
Guarulhos
Total in 25 years
R$ 2.85 bi
Total in 30 years
R$ 8.70 bi
ViracoposBrasília
Total in 20 years
R$ 4.70 bi
Planned Investment = 16.2 bi

Ministry of Finance
December Edition | Year 2012
Economic Activity
33
Energy Cost Reduction
* From January 2013
Source: Ministry of Mining and EnergyProduced by: Ministry of Finance
Government has adopted incentives to improve competitiveness
Among the measures aimed at increasing domestic firms’ competitiveness, the 20.2% average reduction in energy prices is directed to the industrial sector. The measure will also benefit consumers, reducing their energy bill.
Average reduction in eletricity prices*
Group Tari� Voltage level Deduction (%)
High Voltage A
A1 230 kV or more 28.0A2 88 to 138 kV 24.7A3 69 kV 21.5
A3a 30 to 44 kV 20.0A4 2,3 to 25 kV 19.4AS Underground 19.7
Low Voltage B B lower than 2,3 kV 16.2
Average 20.2
Ministry of Finance
December Edition | Year 2012
Economic Activity
34
Payroll Tax Exemption: 40 Sectors (R$ billion)
Data: R$ billion
* Without R$ 970 million in cash flow relief
Source: Ministério da FazendaProduced by: Ministry of Finance
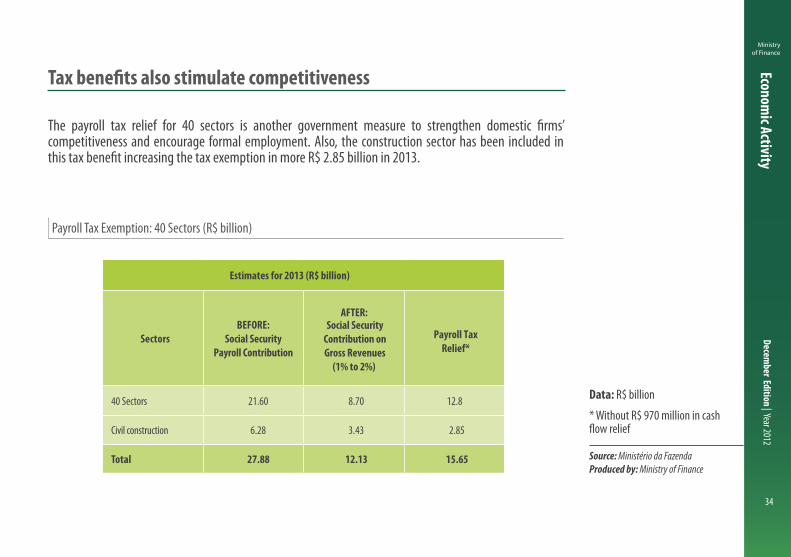
Tax benefits also stimulate competitiveness
The payroll tax relief for 40 sectors is another government measure to strengthen domestic firms’ competitiveness and encourage formal employment. Also, the construction sector has been included in this tax benefit increasing the tax exemption in more R$ 2.85 billion in 2013.
Estimates for 2013 (R$ billion)
Sectors
AFTER:
Payroll TaxRelief*
40 Sectors 21.60 8.70 12.8
Civil construction 6.28 3.43 2.85
Total 27.88 12.13 15.65
BEFORE:Social Security
Payroll Contribution
Social SecurityContribution onGross Revenues
(1% to 2%)

Brazilian Economy
OUTLOOK
Ministry ofFinance
B R A Z I L I A N G O V E R N M E N T
Employment and Income

Ministry of Finance
December Edition | Year 2012
36
Employm
ent and Income
The labor market remains a key element in the process of upward social mobility. In this context, the unemployment rate reached 5.3% in October 2012 and approximately 1.7 million formal jobs were created in the year. Thus, it is expected that the increasing formalization and the expansion of policies related to guarantee of basic income, access to public services and productive inclusion continue driving the socioeconomic inclusion of the poorest.
The prospect is that the Brazilian economy will be even stronger with the increase of the middle class, or “C” class. According to the IPEA, the “C” class will incorporate 15 million people by 2014, reaching 59% of the population. This means an enormous consumption potential, which is fundamental to stimulate an increase in the productive capacity in Brazil.
It is also important to emphasize that the strengthening of the social safety net increases not only household consumption, but also the quality of the workforce that enters the labor market. The pro-equity social policies have contributed substantially towards the rise in labor productivity. In this sense, the share of the employed population with 11 years or more of schooling has increased from 33.6% to 46.3% between 2004 and 2011. This is another stimulus towards new investment.
Inclusive growth driven by increased schooling
Ministry of Finance
December Edition | Year 2012
37
Employm
ent and Income
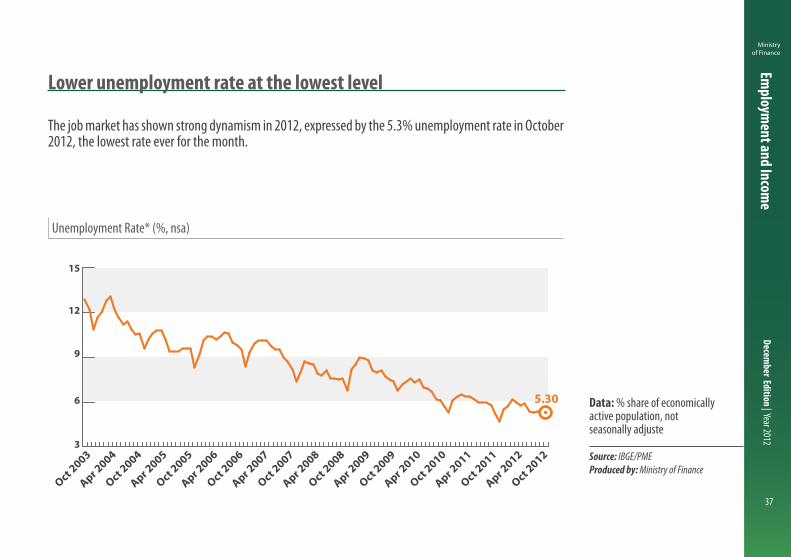
Unemployment Rate* (%, nsa)
Data: % share of economically active population, not seasonally adjuste
Source: IBGE/PMEProduced by: Ministry of Finance
Lower unemployment rate at the lowest level
The job market has shown strong dynamism in 2012, expressed by the 5.3% unemployment rate in October 2012, the lowest rate ever for the month.
3
6
9
12
15
5.30
Oct 2012
Apr 2012
Oct 2011
Apr 2011
Oct 2010
Apr 2010
Oct 2009
Apr 2009
Oct 2008
Apr 2008
Oct 2007
Apr 2007
Oct 2006
Apr 2006
Oct 2005
Apr 2005
Oct 2004
Apr 2004
Oct 2003
Ministry of Finance
December Edition | Year 2012
38
Employm
ent and Income
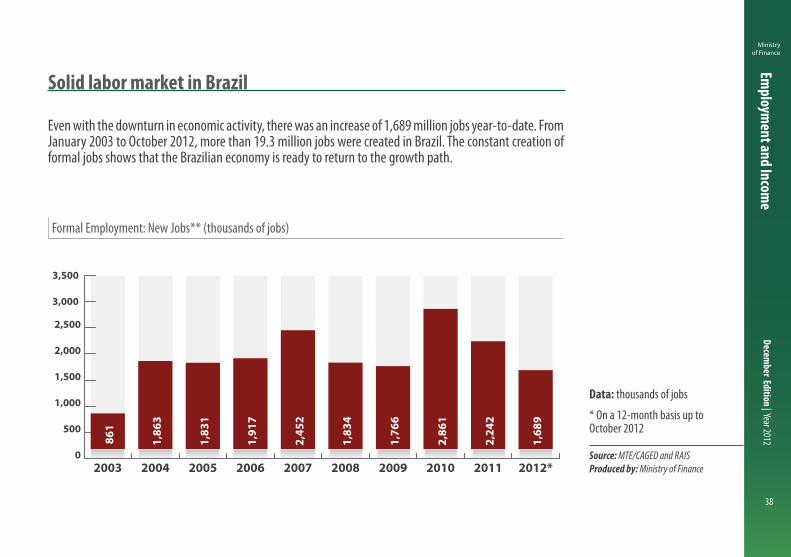
Formal Employment: New Jobs** (thousands of jobs)
Data: thousands of jobs
* On a 12-month basis up to October 2012
Source: MTE/CAGED and RAISProduced by: Ministry of Finance
Solid labor market in Brazil
Even with the downturn in economic activity, there was an increase of 1,689 million jobs year-to-date. From January 2003 to October 2012, more than 19.3 million jobs were created in Brazil. The constant creation of formal jobs shows that the Brazilian economy is ready to return to the growth path.
0
500
1,000
1,500
2,000
2,500
3,000
3,500
2012*201120102009200820072006200520042003
Formal employment (thousands)**
861
1,86
3
1,83
1
1,91
7
2,45
2
1,83
4
1,76
6
2,86
1
2,24
2
1,68
9
Ministry of Finance
December Edition | Year 2012
39
Employm
ent and Income
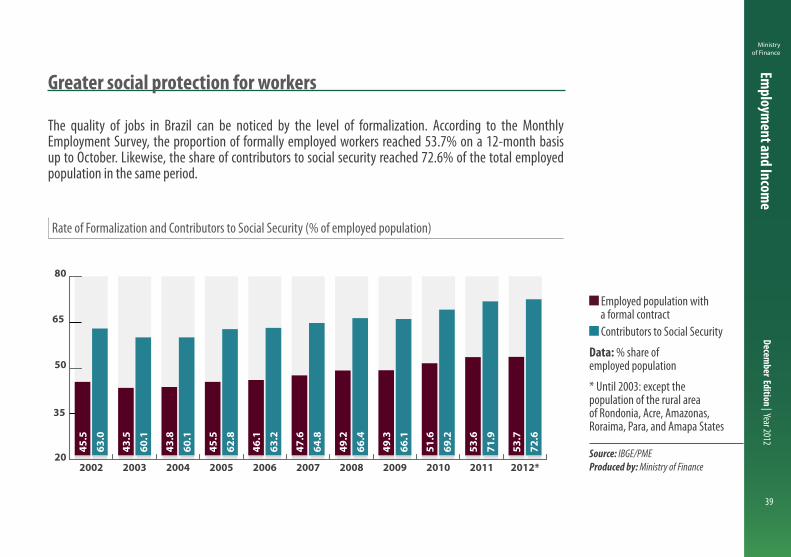
Rate of Formalization and Contributors to Social Security (% of employed population)
Employed population with a formal contract Contributors to Social Security
Data: % share of employed population
* Until 2003: except the population of the rural area of Rondonia, Acre, Amazonas, Roraima, Para, and Amapa States
Source: IBGE/PMEProduced by: Ministry of Finance
Greater social protection for workers
The quality of jobs in Brazil can be noticed by the level of formalization. According to the Monthly Employment Survey, the proportion of formally employed workers reached 53.7% on a 12-month basis up to October. Likewise, the share of contributors to social security reached 72.6% of the total employed population in the same period.
20
35
50
65
80
2012*2011201020092008200720062005200420032002
Contributors to Social Security
Employed population with a formal contract
63.0
60.1
60.1
62.8
63.2
64.8
66.4
66.1
69.2
71.9
72.6
45.5
43.5
43.8
45.5
46.1
47.6
49.2
49.3
51.6
53.6
53.7
Ministry of Finance
December Edition | Year 2012
40
Employm
ent and Income
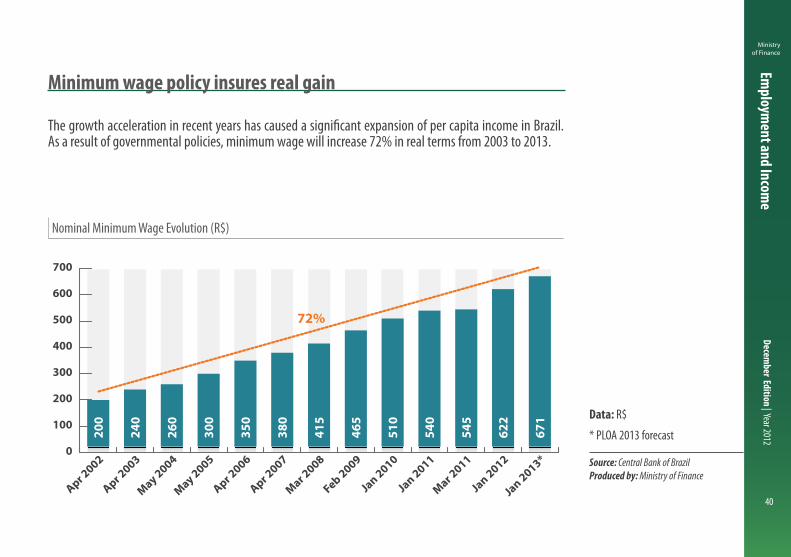
Nominal Minimum Wage Evolution (R$)
Data: R$
* PLOA 2013 forecast
Source: Central Bank of BrazilProduced by: Ministry of Finance
Minimum wage policy insures real gain
The growth acceleration in recent years has caused a significant expansion of per capita income in Brazil. As a result of governmental policies, minimum wage will increase 72% in real terms from 2003 to 2013.
0
100
200
300
400
500
600
700
Jan 2013*
Jan 2012
Mar 2011
Jan 2011
Jan 2010
Feb 2009
Mar 2008
Apr 2007
Apr 2006
May 2005
May 2004
Apr 2003
Apr 2002
72%
200
240
260
300
350
380
415
465
510
540
545
622
671

Ministry of Finance
December Edition | Year 2012
41
Employm
ent and Income
Minimum wage purchasing power for Washing Machine: 1994-2012 (R$)
Minimum Wage (R$) Nominal Price of Washing Machine (R$) Washing Machine/Minimum Wage Ratio
Data: R$
Source: IBGE, GfK and LCAProduced by: Ministry of Finance
Restoring the purchasing power of the minimum wage
0
200
400
600
800
1,000
1,200
20122011
20102009
20082007
20062005
20042003
20022001
20001999
19981997
19961995
19940
1
2
3
4
5
6
7
8
9
1.5
622
930
Minimum Wage (R$) Nominal Price of Washing Machine (R$) Washing Machine/Minimum Wage Ratio
(R$)
• 1994: a worker would spend 8 months’ worth of minimum wage to be able to afford a Washing Machine.
• 2012: he/she would spend only 1.5 month’s worth of minimum wage.

Ministry of Finance
December Edition | Year 2012
42
Employm
ent and Income
Minimum wage purchasing power for stoves: 1994-2012 (R$)
Minimum Wage (R$) Nominal Price of Stove (R$) Stove/Minimum Wage Ratio
Data: R$
Source: IBGE, GfK and LCAProduced by: Ministry of Finance
Restoring the purchasing power of the minimum wage
0
100
200
300
400
500
600
700
20122011
20102009
20082007
20062005
20042003
20022001
20001999
19981997
19961995
1994
0.00.2
0.4
0.6
0.8
1.01.2
1.4
1.6
1.8
2.0
0.5
622
330
Minimum Wage (R$) Nominal Price of Stove (R$) Stove/Minimum Wage Ratio
(R$)
• 1994: a worker would spend 1.9 months’ worth of minimum wage to be able to afford a stove.
• 2012: he/she would spend only 0.5 month’s worth of minimum wage.
Ministry of Finance
December Edition | Year 2012
43
Employm
ent and Income
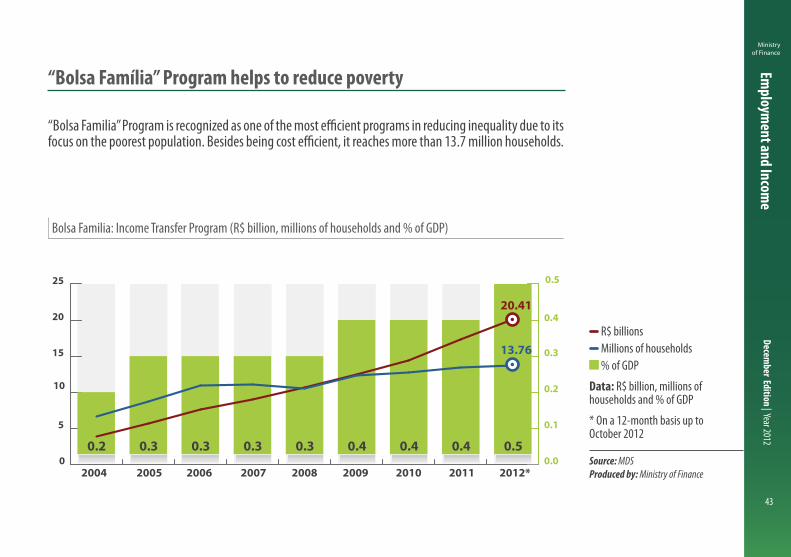
Bolsa Familia: Income Transfer Program (R$ billion, millions of households and % of GDP)
R$ billions Millions of households % of GDP
Data: R$ billion, millions of households and % of GDP
* On a 12-month basis up to October 2012
Source: MDSProduced by: Ministry of Finance
“Bolsa Família” Program helps to reduce poverty
“Bolsa Familia” Program is recognized as one of the most efficient programs in reducing inequality due to its focus on the poorest population. Besides being cost efficient, it reaches more than 13.7 million households.
0
5
10
15
20
25
0.0
0.1
0.2
0.3
0.4
0.5
2012*20112010200920082007200620052004
(% of GDP) R$ billion Number of households (million)
20.41
13.76
0.2 0.3 0.3 0.3 0.3 0.4 0.4 0.4 0.5
Ministry of Finance
December Edition | Year 2012
44
Employm
ent and Income
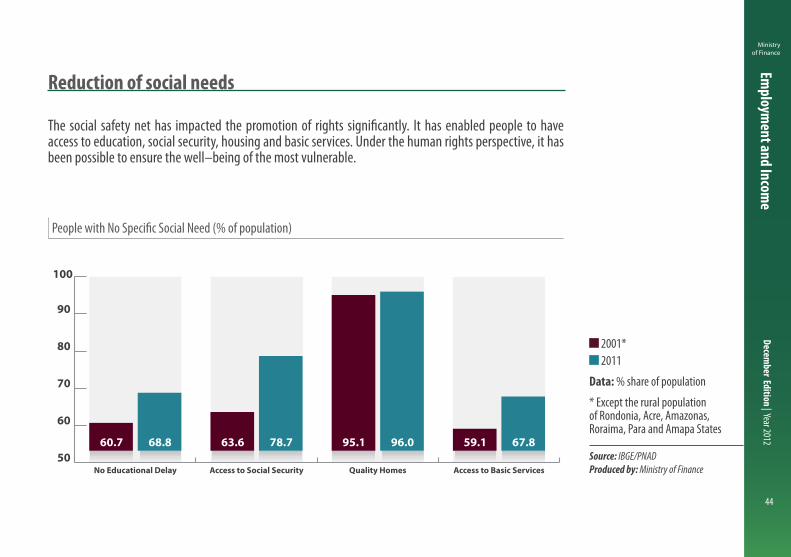
People with No Specific Social Need (% of population)
2001* 2011
Data: % share of population
* Except the rural population of Rondonia, Acre, Amazonas, Roraima, Para and Amapa States
Source: IBGE/PNADProduced by: Ministry of Finance
Reduction of social needs
The social safety net has impacted the promotion of rights significantly. It has enabled people to have access to education, social security, housing and basic services. Under the human rights perspective, it has been possible to ensure the well–being of the most vulnerable.
50
60
70
80
90
100
Access to Basic ServicesQuality HomesAccess to Social SecurityNo Educational Delay
68.8 78.7 96.0 67.860.7 63.6 95.1 59.1
2001*2011

Ministry of Finance
December Edition | Year 2012
45
Employm
ent and Income
Real Income Growth in Income Groups: 2004-2011* (%)
Data: % of simple classes, average monthly income from all jobs
* Except information from people with no declaration of income from all jobs. Deflated by INPC index.
Source: IBGE/PNADProduced by: Ministry of Finance
Income growth especially for the poorest
The real income growth was significant for the period from 2004 to 2011. Even more relevant than the 29.8% total expansion was the income growth for the 20% poorest of the population, which amounted to around 75%.
0
10
20
30
40
50
60
70
80
More th
an
90 to 100
More th
an
80 to 90
More th
an
70 to 80
More th
an
60 to 70
More th
an
50 to 60
More th
an
40 to 50
More th
an
30 to 40
More th
an
20 to 30
More th
an
10 to 20
Up to 10
Tota
l
29.8 73.8 75.3 48.5 49.9 43.8 38.4 36.5 30.3 24.8 20.8
2004-2011 Change
20%poorest
20%richest
Income deciles
Ministry of Finance
December Edition | Year 2012
46
Employm
ent and Income
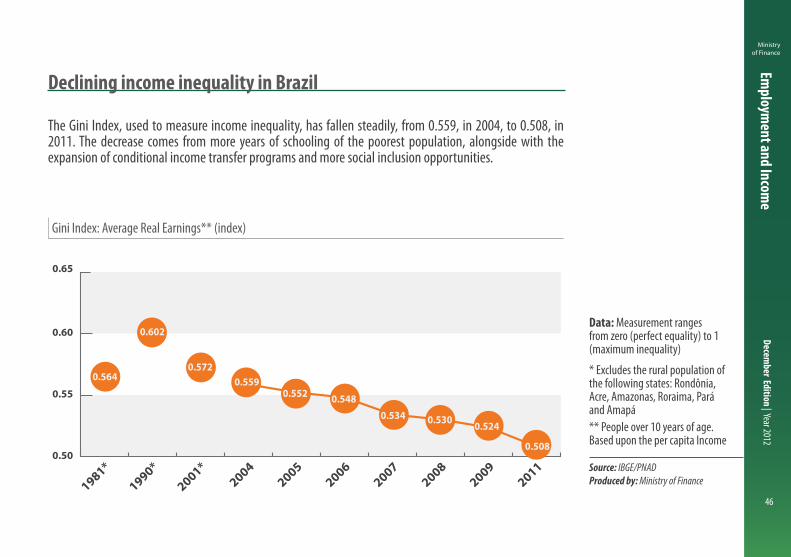
Gini Index: Average Real Earnings** (index)
Data: Measurement ranges from zero (perfect equality) to 1 (maximum inequality)
* Excludes the rural population of the following states: Rondônia, Acre, Amazonas, Roraima, Pará and Amapá** People over 10 years of age. Based upon the per capita Income
Source: IBGE/PNADProduced by: Ministry of Finance
Declining income inequality in Brazil
The Gini Index, used to measure income inequality, has fallen steadily, from 0.559, in 2004, to 0.508, in 2011. The decrease comes from more years of schooling of the poorest population, alongside with the expansion of conditional income transfer programs and more social inclusion opportunities.
0.50
0.55
0.60
0.6
0.6
0.6
0.6
0.6
0.5
20112009
20082007
20062005
20042001*
1990*
1981*
0.564
0.602
0.552 0.5480.534 0.530 0.524
0.508
0.5720.559
0.65
Ministry of Finance
December Edition | Year 2012
47
Employm
ent and Income
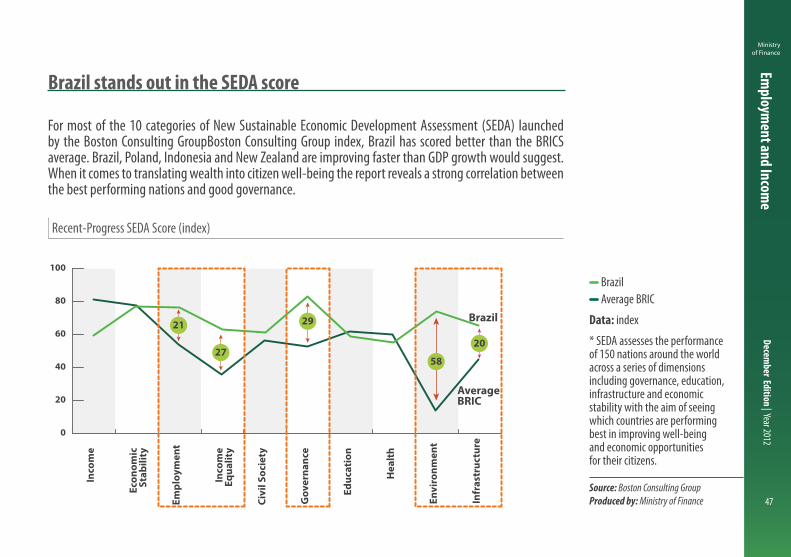
Recent-Progress SEDA Score (index)
Brazil Average BRIC
Data: index
* SEDA assesses the performance of 150 nations around the world across a series of dimensions including governance, education, infrastructure and economic stability with the aim of seeing which countries are performing best in improving well-being and economic opportunities for their citizens.
Source: Boston Consulting GroupProduced by: Ministry of Finance
Brazil stands out in the SEDA score
For most of the 10 categories of New Sustainable Economic Development Assessment (SEDA) launched by the Boston Consulting GroupBoston Consulting Group index, Brazil has scored better than the BRICS average. Brazil, Poland, Indonesia and New Zealand are improving faster than GDP growth would suggest. When it comes to translating wealth into citizen well-being the report reveals a strong correlation between the best performing nations and good governance.
0
20
40
60
80
100
Infr
astr
uctu
re
Envi
ronm
ent
Hea
lth
Educ
atio
n
Gov
erna
nce
Civi
l Soc
iety
Inco
me
Equa
lity
Empl
oym
ent
Econ
omic
Stab
ility
Inco
me
29
2027
21
58
Brazil
AverageBRIC

Ministry of Finance
December Edition | Year 2012
48
Employm
ent and Income
Social Classes (million of people)
Data: million of people
* Forecasts. Baseline: 6,5% YoY income growth rate
Source: IBGE and IPEAProduced by: Ministry of Finance
15 million additional Brazilian people can be included in the new middle class
The growth of ABC classes and consequent reduction of DE classes have been translated into poverty reduction and better income distribution, both playing a key role to the expansion of the domestic market. According to IPEA forecasts, C class should correspond to 59% of population by 2014.
A Class
B Class
C ClassD and EClasses
Total: 175 million Total: 188 million Total: 192 million Total: 196 million
2003 2009 2011 2014*
6.3
7.0
65.9
96.2
9.6
10.4
73.3
94.9
12.6
14.5
115.2
53.8
10.5
11.2
100.3
69.6
Ministry of Finance
December Edition | Year 2012
49
Employm
ent and Income
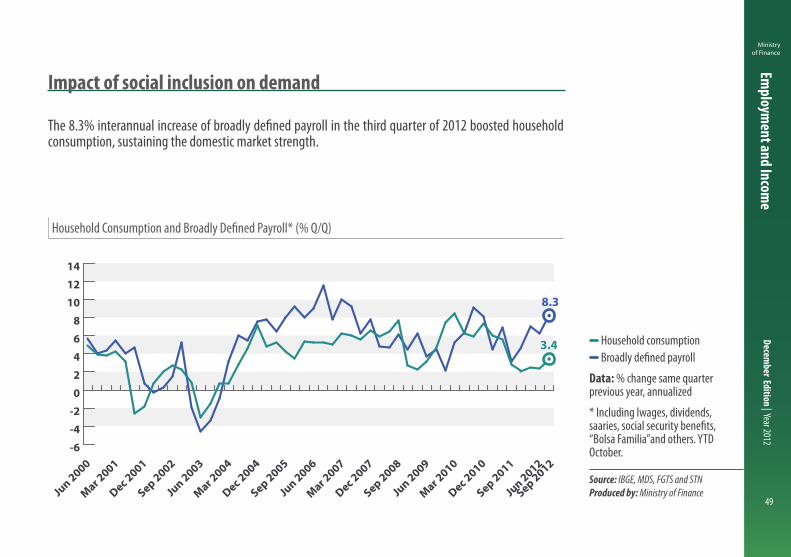
Household Consumption and Broadly Defined Payroll* (% Q/Q)
Household consumption Broadly defined payroll
Data: % change same quarter previous year, annualized
* Including lwages, dividends, saaries, social security benefits, “Bolsa Familia”and others. YTD October.
Source: IBGE, MDS, FGTS and STNProduced by: Ministry of Finance
Impact of social inclusion on demand
The 8.3% interannual increase of broadly defined payroll in the third quarter of 2012 boosted household consumption, sustaining the domestic market strength.
-6
-4
-2
0
2
4
6
8
10
12
14
Sep 2012
Jun 2012
Sep 2011
Dec 2010
Mar 2010
Jun 2009
Sep 2008
Dec 2007
Mar 2007
Jun 2006
Sep 2005
Dec 2004
Mar 2004
Jun 2003
Sep 2002
Dec 2001
Mar 2001
Jun 2000
8.3
3.4
Expanded Wage MassHousehold Consumption

Ministry of Finance
December Edition | Year 2012
50
Employm
ent and Income
People Employed with more than 11 Years of Schooling (% of total)
Data: % of total
Source: IBGE/PNADProduced by: Ministry of Finance
More qualified workers
One of the main elements for reducing income inequality and improving productivity is the educational level. Between 2004 and 2011, occupied population with more than 11 years of schooling went from 33.6% to 46.4%, respectively.
20
26
32
38
44
50
2011200920082007200620052004200320022001
28.8 30.7 32.5 33.6 35.2 37.4 39.0 41.2 43.2 46.4
Ministry of Finance
December Edition | Year 2012
51
Employm
ent and Income
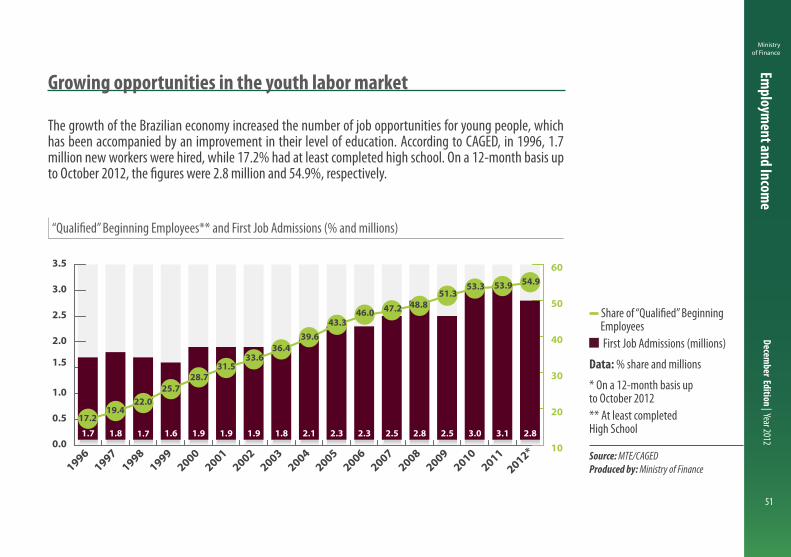
“Qualified” Beginning Employees** and First Job Admissions (% and millions)
Share of “Qualified” Beginning Employees First Job Admissions (millions)
Data: % share and millions
* On a 12-month basis up to October 2012 ** At least completed High School
Source: MTE/CAGEDProduced by: Ministry of Finance
Growing opportunities in the youth labor market
The growth of the Brazilian economy increased the number of job opportunities for young people, which has been accompanied by an improvement in their level of education. According to CAGED, in 1996, 1.7 million new workers were hired, while 17.2% had at least completed high school. On a 12-month basis up to October 2012, the figures were 2.8 million and 54.9%, respectively.
0.0
0.5
1.0
1.5
2.0
2.5
3.0
3.5
10
20
30
40
50
60
2012*2011
2010
2009
2008
2007
2006
2005
2004
2003
2002
2001
2000
1999
1998
1997
1996
First Job Admissions Share of "Quali�ed" Beginning Employees*
2.83.13.02.52.82.52.32.32.11.81.91.91.91.61.81.7 1.7
54.953.953.351.3
48.847.246.043.3
39.636.4
33.631.5
28.725.7
22.019.4
17.2


Brazilian Economy
OUTLOOK
Ministry ofFinance
B R A Z I L I A N G O V E R N M E N T
Inflation

Ministry of Finance
December Edition | Year 2012
54
Inflation
Consumer price inflation rates increased in the third quarter of 2012, driven mainly by the impact of extreme weather conditions on agricultural production. The combination of higher than usual pressures in some fresh food prices in the Brazilian domestic market, and in important agricultural commodities in the international market, due to the drought in the US, caused an acceleration of inflation in mid-2012, which peaked in October.
Since then, inflation pressures have begun to ease, as producer prices related to important items such as soybeans, corn and wheat are clearly pointing to a retreat to lower levels. As well as that, several fresh food items are showing monthly deflation rates. This scenario shows that more relief should arrive in coming months, helping bring down consumer price inflation and also helping to drive the yearly IPCA to the center of the target set by the National Monetary Council.
Inflation rate under control
Ministry of Finance
December Edition | Year 2012
55
Inflation
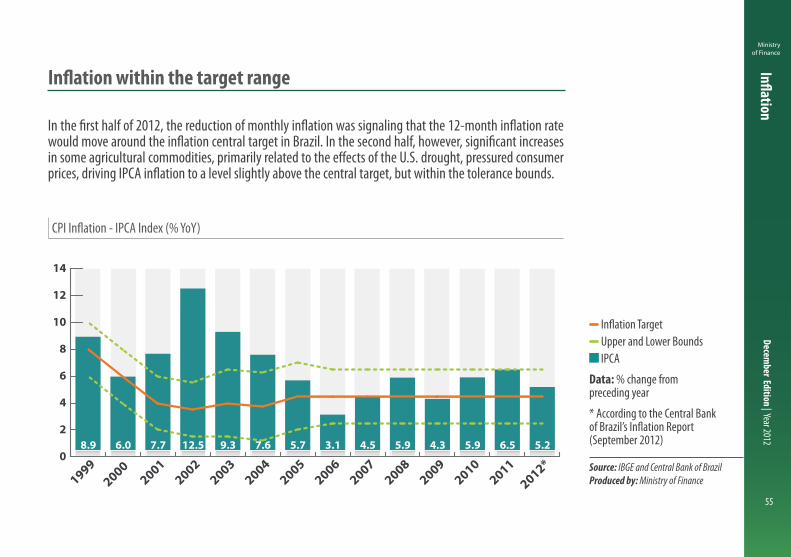
CPI Inflation - IPCA Index (% YoY)
Inflation Target Upper and Lower Bounds IPCA
Data: % change from preceding year
* According to the Central Bank of Brazil’s Inflation Report (September 2012)
Source: IBGE and Central Bank of BrazilProduced by: Ministry of Finance
Inflation within the target range
In the first half of 2012, the reduction of monthly inflation was signaling that the 12-month inflation rate would move around the inflation central target in Brazil. In the second half, however, significant increases in some agricultural commodities, primarily related to the effects of the U.S. drought, pressured consumer prices, driving IPCA inflation to a level slightly above the central target, but within the tolerance bounds.
0
2
4
6
8
10
12
14
2012*2011
20102009
20082007
20062005
20042003
20022001
2000 1999
8.9 6.0 7.7 12.5 9.3 7.6 5.7 3.1 4.5 5.9 4.3 5.9 6.5 5.2
IPCA Target Center Upper and Lower Bounds
, ,
Ministry of Finance
December Edition | Year 2012
56
Inflation
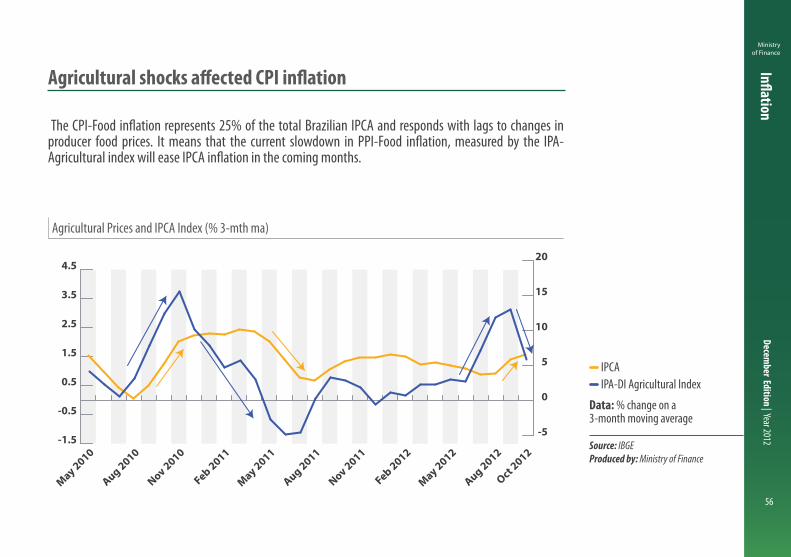
Agricultural Prices and IPCA Index (% 3-mth ma)
IPCA IPA-DI Agricultural Index
Data: % change on a 3-month moving average
Source: IBGEProduced by: Ministry of Finance
Agricultural shocks affected CPI inflation
The CPI-Food inflation represents 25% of the total Brazilian IPCA and responds with lags to changes in producer food prices. It means that the current slowdown in PPI-Food inflation, measured by the IPA-Agricultural index will ease IPCA inflation in the coming months.
-1.5
-0.5
0.5
1.5
2.5
3.5
4.5
Oct 2012
Aug 2012
May 2012
Feb 2012
Nov 2011
Aug 2011
May 2011
Feb 2011
Nov 2010
Aug 2010
May 2010
-5
0
5
10
15
20
IPCAIPA-DI Agricultural
IPCA, IPA-DI Agricultural
Ministry of Finance
December Edition | Year 2012
57
Inflation
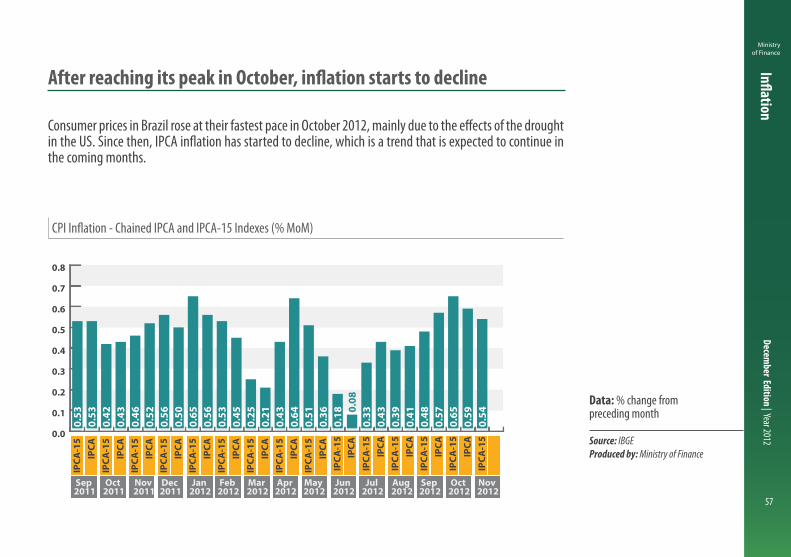
CPI Inflation - Chained IPCA and IPCA-15 Indexes (% MoM)
Data: % change from preceding month
Source: IBGEProduced by: Ministry of Finance
After reaching its peak in October, inflation starts to decline
Consumer prices in Brazil rose at their fastest pace in October 2012, mainly due to the effects of the drought in the US. Since then, IPCA inflation has started to decline, which is a trend that is expected to continue in the coming months.
0.0
0.1
0.2
0.3
0.4
0.5
0.6
0.7
0.8
IPCA
-15
IPCA
IPCA
-15
IPCA
IPCA
-15
IPCA
IPCA
-15
IPCA
IPCA
-15
IPCA
IPCA
-15
IPCA
IP
CA-1
5 IP
CA
IPCA
-15
IPCA
IP
CA-1
5 IP
CA
IPCA
-15
IPCA
IP
CA-1
5 IP
CA
IPCA
-15
IPCA
IP
CA-1
5 IP
CA
IPCA
-15
IPCA
IP
CA-1
5
Nov 2012
Oct 2012
Sep 2012
Aug 2012
Jul 2012
Jun 2012
May 2012
Apr 2012
Mar 2012
Feb 2012
Jan 2012
Dec 2011
Nov 2011
Oct 2011
Sep 2011
0.53
0.53
0.42
0.43
0.46
0.52
0.56
0.50
0.65
0.56
0.53
0.45
0.25
0.21
0.43
0.64
0.51
0.36
0.18 0.
080.
330.
430.
390.
410.
480.
570.
650.
590.
54

Ministry of Finance
December Edition | Year 2012
58
Inflation
Inflation: IGP-M and Main Components (% YoY)
IGP-M IPA-M INCC-M IPC-M
Data: % change from preceding year on a 12-month basis
Source: FGVProduced by: Ministry of Finance
General Price Index already decelerating
After two consecutive quarters of acceleration, the 12-month General Price Index (IGP-M) inflation started a decreasing trend, reaching a percentage below 7.0% in November 2012. Lower producer prices (measured by the IPA index) in the past two months have played an important role in easing the pressure on the Brazilian IGP inflation.
-6
-3
0
3
6
9
12
15
Nov 2012
Sep 2012
Jul 2
012
May 2012
Mar 2012
Jan 2012
Nov 2011
Sep 2011
Jul 2
011
May 2011
Mar 2011
Jan 2011
Nov 2010
Sep 2010
Jul 2
010
May 2010
Mar 2010
Jan 2010
Nov 2009
7.33
6.967.30
5.77
INCC-MIPC-MIPA-MIGP-M
Ministry of Finance
December Edition | Year 2012
59
Inflation
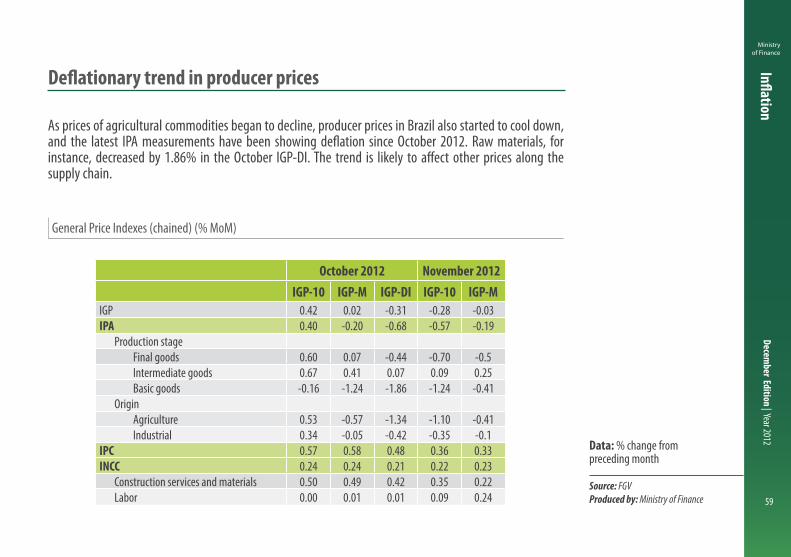
General Price Indexes (chained) (% MoM)
Data: % change from preceding month
Source: FGVProduced by: Ministry of Finance
Deflationary trend in producer prices
As prices of agricultural commodities began to decline, producer prices in Brazil also started to cool down, and the latest IPA measurements have been showing deflation since October 2012. Raw materials, for instance, decreased by 1.86% in the October IGP-DI. The trend is likely to affect other prices along the supply chain.
October 2012 November 2012IGP-10 IGP-M IGP-DI IGP-10 IGP-M
IGP 0.42 0.02 -0.31 -0.28 -0.03IPA 0.40 -0.20 -0.68 -0.57 -0.19
Production stageFinal goods 0.60 0.07 -0.44 -0.70 -0.5Intermediate goods 0.67 0.41 0.07 0.09 0.25Basic goods -0.16 -1.24 -1.86 -1.24 -0.41
OriginAgriculture 0.53 -0.57 -1.34 -1.10 -0.41Industrial 0.34 -0.05 -0.42 -0.35 -0.1
IPC 0.57 0.58 0.48 0.36 0.33INCC 0.24 0.24 0.21 0.22 0.23
Construction services and materials 0.50 0.49 0.42 0.35 0.22Labor 0.00 0.01 0.01 0.09 0.24


Brazilian Economy
OUTLOOK
Ministry ofFinance
B R A Z I L I A N G O V E R N M E N T
Interest Rates and Credit
Ministry of Finance
December Edition | Year 2012
62
Interest Rates and Credit
From August 2011 up to October 2012, the Central Bank of Brazil lowered the policy rate by 525 basis-points, bringing both nominal and real rates to their lowest levels in the recent Brazilian monetary history. In fact, spreads and lending rates in the financial system have also fallen to record lows, although still at high levels.
Brazil is now even more focused on encouraging the development of the capital and long-term private credit markets. The country’s financial system is sound, operating in accordance with Basel principles, and it is actively participating in the development of important financial instruments, such as financial bills, FDICs, debentures, and other long-term corporate bonds.
As a matter of fact, this new environment of lower interest rates and investment opportunities has already begun to influence the decision-making process of economic agents. It will positively impact investment and production even further, as investors leave behind the time when the Brazilian economy was used to high short-term interest rate.
Interest rate at its lowest level ever

Ministry of Finance
December Edition | Year 2012
63
Interest Rates and Credit
Brazil: Real Ex-Ante Interest Rates* (% pa)
Data: % per annum
* 360-day swap deflated by inflation expectations for the 12 months ahead; 2012: November 30; 2001-2011: December 31
Source: Central Bank of BrazilProduced by: Ministry of Finance
Real interest rate at its lowest level due to sound macroeconomic fundamentals
Short-term real interest rates in Brazil have been showing a significant decrease for the past ten years, from 14.0% in December 2002 to 1.8% in November 2012. For the last 10 years, it has been a result of credible and sound monetary and fiscal policy coordination.
0
4
8
12
16
2012**2011201020092008200720062005200420032002
Average2002-2005 = 11.5
Average2006-2010 = 6.9
Average2011-2012 = 3.2
14.0 9.4 11.2 11.4 7.9 7.7 6.9 5.8 6.2 4.5 1.8

Ministry of Finance
December Edition | Year 2012
64
Interest Rates and Credit
Real and Nominal Interest Rates* (% pa)
SELIC interest rate target Real ex-ante interest rate*
Data: % per annum
* 360-day swap deflated by inflation expectations for the 12 months ahead
Source: Central Bank of BrazilProduced by: Ministry of Finance
Selic benchmark interest rate at its lowest level ever
Central Bank of Brazil has reduced its benchmark interest rate (Selic) since August 2011. The latest reduction in October 2012, from 7.50% to 7.25%, implied the lowest rate ever. The real interest rate reached 1.80% on November 30, 2012.
1.80
7.25
0
5
10
15
20
25
30
Real Ex-Ante Interest Rates Selic benchmark
Nov 2012
Oct 2012
Apr 2012
Oct 2011
Apr 2011
Oct 2010
Apr 2010
Oct 2009
Apr 2009
Oct 2008
Apr 2008
Oct 2007
Apr 2007
Oct 2006
Apr 2006
Oct 2005
Apr 2005
Oct 2004
Apr 2004
Nov 2003

Ministry of Finance
December Edition | Year 2012
65
Interest Rates and Credit
Interest Rates: DI Contracts* (% pa)
Jan 2013 Jan 2014 Jan 2015
Data: % per annum
* DI: one-day interbank deposits
Source: Central Bank of BrazilProduced by: Ministry of Finance
Long-term interest rates declining in Brazil
After a widespread decline throughout the last 12 months, the long-term rates traded in the futures DI stabilized at a level close to the current Selic rate. The difference between the curves expresses the risk associated with the exposure duration.
7.2 7.8
7.1 7
8
9
10
11
12
13
Nov 2012
Oct 2012
Jul 2
012
Apr 2012
Jan 2012
Oct 2011
Jul 2
011
Apr 2011
Jan 2011
Oct 2010
Jul 2
010
Apr 2010
Jan 2010
Jan 2015Jan 2013 Jan 2014

Ministry of Finance
December Edition | Year 2012
66
Interest Rates and Credit
Interest Rates and Average Maturity (% pa and days)
Average maturity (days) Interest rates (% YoY)
Data: % per annum and number of days
Source: Central Bank of BrazilProduced by: Ministry of Finance
Lower Selic rate and banking spreads benefit borrowers
Lower interest rates and banking spreads have been benefitting final borrowers. Interest rates on loans to individuals reached 35.4 percent, whereas rates on loans to corporations reached 22.1 percent. These percentages are well below the 2011 average and show sharp decline throughout 2012, with reductions of 9.7 p.p. and 6.6 p.p. for individuals and corporations, respectively. In the opposite direction, average maturity signaled slight increase in the period.
300
350
400
450
500
550
600
650
40
45
50
55
60
Oct 2012
Jun 2012
Dec 2011
Jun 2011
Dec 2010
Jun 2010
Dec 2009
Jun 2009
Dec 2008
May 2008200
250
300
350
400
450
Average Maturity
20
24
26
28
30
32
34
Interest Rates
Oct 2012
Jun 2012
Dec 2011
Jun 2011
Dec 2010
Jun 2010
Dec 2009
Jun 2009
Dec 2008
May 2008
Individuals Corporations
620.5
35.4
431.8
22.1
Average MaturityInterest Rates
Ministry of Finance
December Edition | Year 2012
67
Interest Rates and Credit
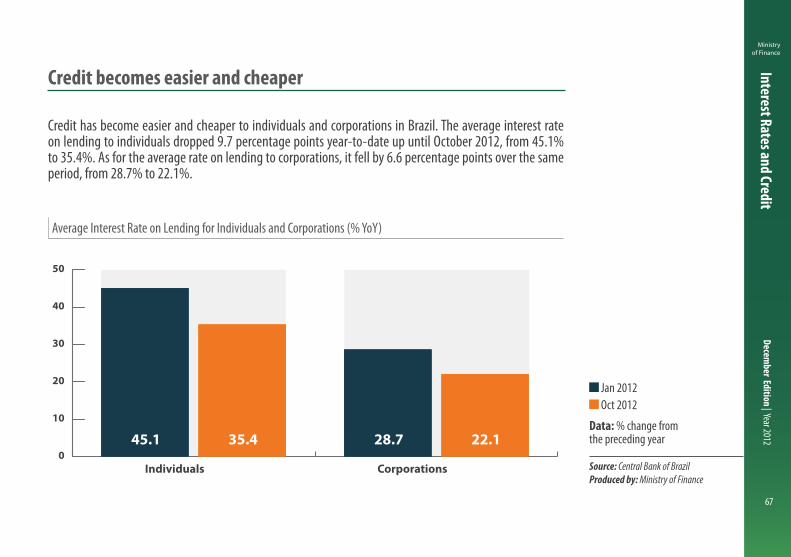
Average Interest Rate on Lending for Individuals and Corporations (% YoY)
Jan 2012 Oct 2012
Data: % change from the preceding year
Source: Central Bank of BrazilProduced by: Ministry of Finance
Credit becomes easier and cheaper
Credit has become easier and cheaper to individuals and corporations in Brazil. The average interest rate on lending to individuals dropped 9.7 percentage points year-to-date up until October 2012, from 45.1% to 35.4%. As for the average rate on lending to corporations, it fell by 6.6 percentage points over the same period, from 28.7% to 22.1%.
0
10
20
30
40
50
CorporationsIndividualsOct 2012 Jan 2012
35.4 22.145.1 28.7

Ministry of Finance
December Edition | Year 2012
68
Interest Rates and Credit
Banking Spread to Individuals and Corporations (pp)
Jan 2012 Oct 2012
Data: percentage point
* Spread = Lending Rate - Funding Rate
Source: Central Bank of BrazilProduced by: Ministry of Finance
Lower banking spread to individuals and corporations
Although still high in comparison with other economies, spreads on loans to individuals and corporations have been declining in Brazil lately. The former went from 34.9 p.p. in January 2012 to 27.8 p.p. in October 2012, while the latter went from 18.5 p.p. to 15.0 p.p. in the same period.
0
5
10
15
20
25
30
35
40
45
50
CorporationsIndividualsOct 2012 Jan 2012
27.8 15.034.9 18.5
Ministry of Finance
December Edition | Year 2012
69
Interest Rates and Credit
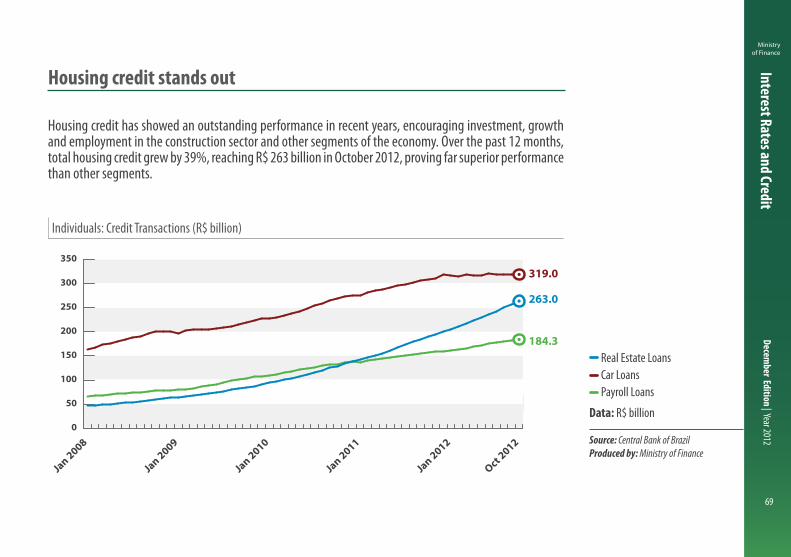
Individuals: Credit Transactions (R$ billion)
Real Estate Loans Car Loans Payroll Loans
Data: R$ billion
Source: Central Bank of BrazilProduced by: Ministry of Finance
Housing credit stands out
Housing credit has showed an outstanding performance in recent years, encouraging investment, growth and employment in the construction sector and other segments of the economy. Over the past 12 months, total housing credit grew by 39%, reaching R$ 263 billion in October 2012, proving far superior performance than other segments.
0
50
100
150
200
250
300
350
Payroll Loans Car LoansReal Estate Loans
Oct 2012
Jan 2012
Jan 2011
Jan 2010
Jan 2009
Jan 2008
263.0
319.0
184.3
Ministry of Finance
December Edition | Year 2012
70
Interest Rates and Credit
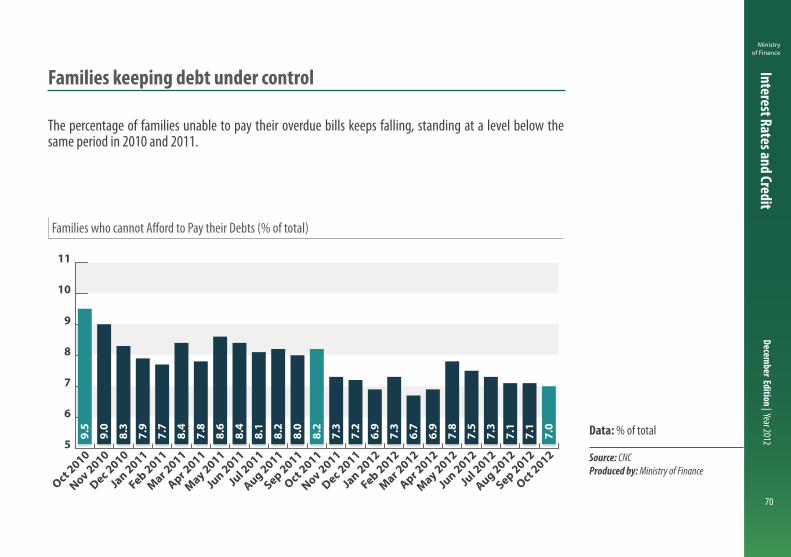
Families who cannot Afford to Pay their Debts (% of total)
Data: % of total
Source: CNCProduced by: Ministry of Finance
Families keeping debt under control
The percentage of families unable to pay their overdue bills keeps falling, standing at a level below the same period in 2010 and 2011.
5
6
7
8
9
10
11
Oct 2012
Sep 2012
Aug 2012
Jul 2
012
Jun 2012
May 2012
Apr 2012
Mar 2012
Feb 2012
Jan 2012
Dec 2011
Nov 2011
Oct 2011
Sep 2011
Aug 2011
Jul 2
011
Jun 2011
May 2011
Apr 2011
Mar 2011
Feb 2011
Jan 2011
Dec 2010
Nov 2010
Oct 2010
9.5
9.0
8.3
7.9
7.7
8.4
7.8
8.6
8.4
8.1
8.2
8.0
8.2
7.3
7.2
6.9
7.3
6.7
6.9
7.8
7.5
7.3
7.1
7.1
7.0
Ministry of Finance
December Edition | Year 2012
71
Interest Rates and Credit
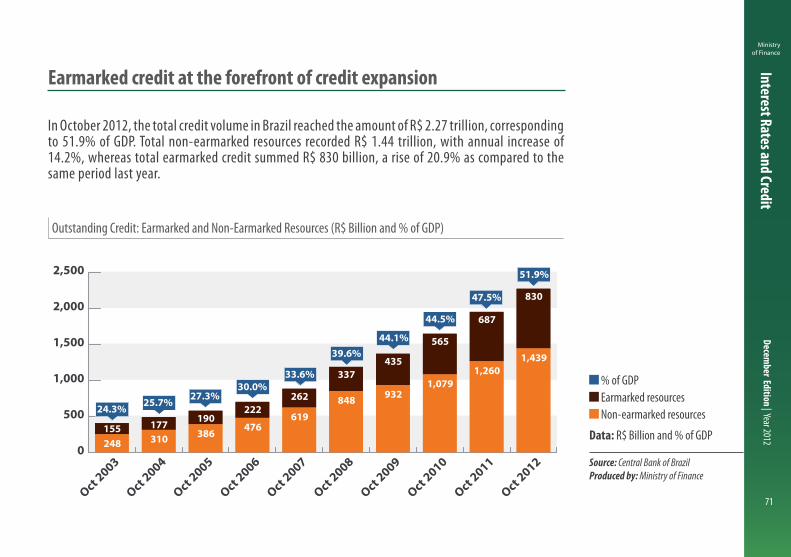
Outstanding Credit: Earmarked and Non-Earmarked Resources (R$ Billion and % of GDP)
% of GDP Earmarked resources Non-earmarked resources
Data: R$ Billion and % of GDP
Source: Central Bank of BrazilProduced by: Ministry of Finance
Earmarked credit at the forefront of credit expansion
In October 2012, the total credit volume in Brazil reached the amount of R$ 2.27 trillion, corresponding to 51.9% of GDP. Total non-earmarked resources recorded R$ 1.44 trillion, with annual increase of 14.2%, whereas total earmarked credit summed R$ 830 billion, a rise of 20.9% as compared to the same period last year.
0
500
1,000
1,500
2,000
2,500
Oct 2012
Oct 2011
Oct 2010
Oct 2009
Oct 2008
Oct 2007
Oct 2006
Oct 2005
Oct 2004
Oct 2003
44.1%
44.5%
47.5%
51.9%
39.6%
33.6%30.0%
27.3%25.7%24.3%
155 177 190222
262
337435
565
687
830
248 310 386 476619
848 9321,079
1,2601,439
Earmarked Non-Earmarked % of GDP
Ministry of Finance
December Edition | Year 2012
72
Interest Rates and Credit
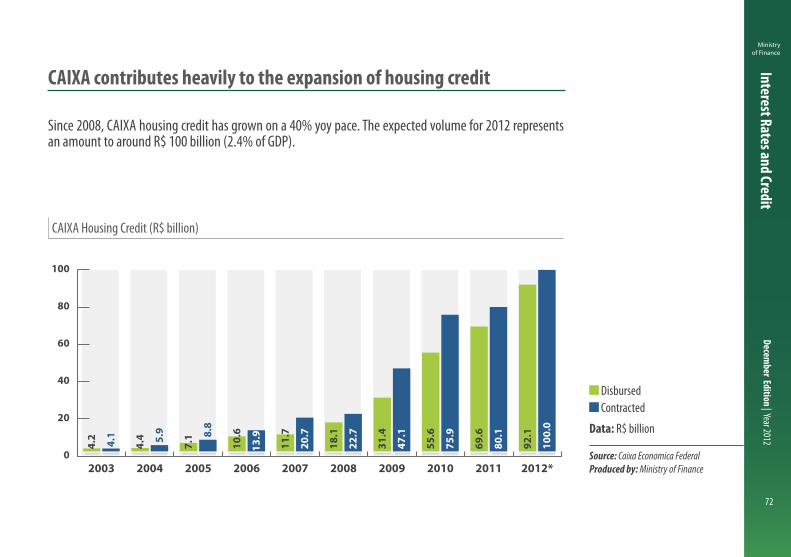
CAIXA Housing Credit (R$ billion)
Disbursed Contracted
Data: R$ billion
Source: Caixa Economica FederalProduced by: Ministry of Finance
CAIXA contributes heavily to the expansion of housing credit
Since 2008, CAIXA housing credit has grown on a 40% yoy pace. The expected volume for 2012 represents an amount to around R$ 100 billion (2.4% of GDP).
0
20
40
60
80
100
2012*201120102009200820072006200520042003
Contracted Disbursed
4.1 5.9 8.
8
13.9
20.7
22.7
47.1
75.9
80.1
100.
0
4.2
4.4
7.1
10.6
11.7
18.1
31.4
55.6
69.6
92.1

Ministry of Finance
December Edition | Year 2012
73
Interest Rates and Credit
Credit Operations in Brazil (% of GDP)
Earmarked resources* Non-Earmarked Resources
Data: % of GDP
* YTD October 2012
Source: Central Bank of BrazilProduced by: Ministry of Finance
Sustained rates of credit growth in Brazil
Credit operations as a share of GDP have been growing in a sustained pace in Brazil. In October 2012, lending with non-earmarked funds represented 32.9% of GDP, while earmarked credit stood at 19.0% of GDP. Mortgage has expanded at a rate of approximately 40% per annum, and now represents 6.0% of GDP.
0
10
20
30
40
50
60
Non-Earmarked Resource/GDP
2012*2011
2010
2009
2008
2007
2006
2005
2004
2003
2002
2001 19.013.012.211.59.88.78.48.28.08.28.27.2
32.9
31.529.629.528.724.821.018.816.415.016.317.0
Earmarked Resource/GDP
Ministry of Finance
December Edition | Year 2012
74
Interest Rates and Credit
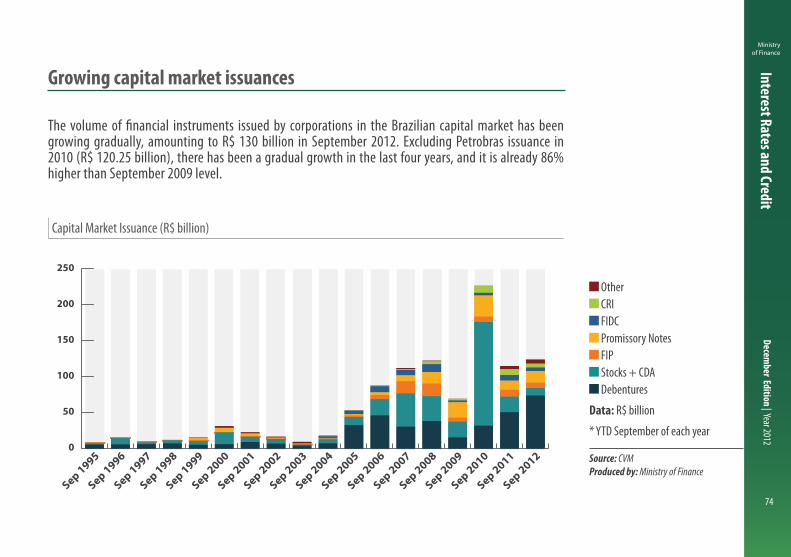
Capital Market Issuance (R$ billion)
Other CRI FIDC Promissory Notes FIP Stocks + CDA Debentures
Data: R$ billion
* YTD September of each year
Source: CVMProduced by: Ministry of Finance
Growing capital market issuances
The volume of financial instruments issued by corporations in the Brazilian capital market has been growing gradually, amounting to R$ 130 billion in September 2012. Excluding Petrobras issuance in 2010 (R$ 120.25 billion), there has been a gradual growth in the last four years, and it is already 86% higher than September 2009 level.
0
50
100
150
200
250
0.4
1.91.1
0.2
0.5
4.85.7
0.8
0.93.7
2.5
9.2
7.95.4
8.6
7.511.1
2.3
3.8
7.84.7
3.7
8.2 16.0
21.6
29.4
12.716.3
5.7
16.8 17.6
7.3
9.67.6
22.746.4 34.4 21.6
10.4
FIDCOthersCerti�cate of Real Estate Receivables Promissory Notes FIP Common Stock Debentures
Sep 2012
Sep 2011
Sep 2010
Sep 2009
Sep 2008
Sep 2007
Sep 2006
Sep 2005
Sep 2004
Sep 2003
Sep 2002
Sep 2001
Sep 2000
Sep 1999
Sep 1998
Sep 1997
Sep 1996
Sep 1995

Ministry of Finance
December Edition | Year 2012
75
Interest Rates and Credit
Real Estate Investment - Public Offers - FIDC, CRI and FII (R$ billion*)
FIDC CRI FII
Data: R$ billion
* Current values
Source: CVMProduced by: Ministry of Finance
Significant increase in Real Estate Credit
0
5
10
15
20
25
30
3.8
7.8
4.7
4.1
13.1
7.1
FIDC
0.2 0.2 0.2 0.2 0.6 0.8 0.9 3.7 2.5 5.47.99.20.1 0.3
0.70.2
0.40.6 1.0
4.1 13.17.1
Sep 2012
Sep 2011
Sep 2010
Sep 2009
Sep 2008
Sep 2007
Sep 2006
Sep 2005
Sep 2004
Sep 2003
Sep 2002
Sep 2001
Sep 2000
FII CRI
0.3 0.31.0
2.65.0
8.67.5
11.1
2.3
3.8
7.8
4.7
Ministry of Finance
December Edition | Year 2012
76
Interest Rates and Credit
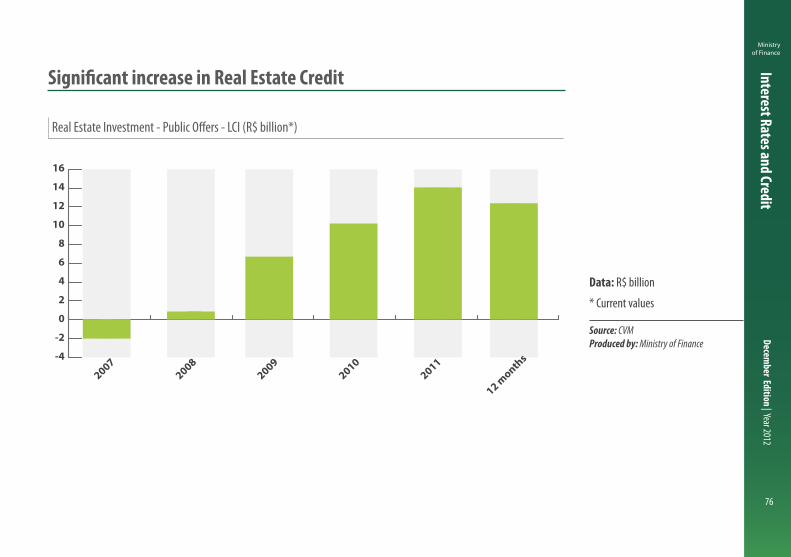
Real Estate Investment - Public Offers - LCI (R$ billion*)
Data: R$ billion
* Current values
Source: CVMProduced by: Ministry of Finance
Significant increase in Real Estate Credit
-4
-2
0
2
4
6
8
10
12
14
16
12 month
s
20112010
20092008
2007
Ministry of Finance
December Edition | Year 2012
77
Interest Rates and Credit
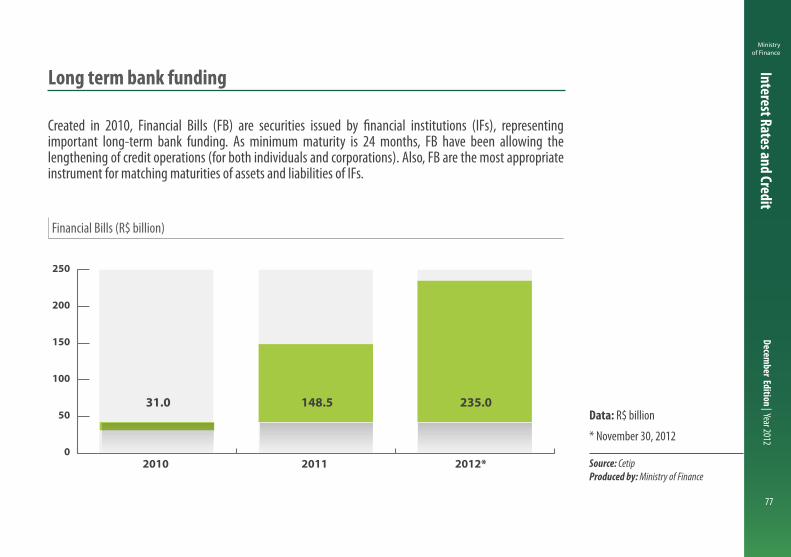
Financial Bills (R$ billion)
Data: R$ billion
* November 30, 2012
Source: CetipProduced by: Ministry of Finance
Long term bank funding
Created in 2010, Financial Bills (FB) are securities issued by financial institutions (IFs), representing important long-term bank funding. As minimum maturity is 24 months, FB have been allowing the lengthening of credit operations (for both individuals and corporations). Also, FB are the most appropriate instrument for matching maturities of assets and liabilities of IFs.
0
50
100
150
200
250
2012*20112010
31.0 148.5 235.0
Ministry of Finance
December Edition | Year 2012
78
Interest Rates and Credit
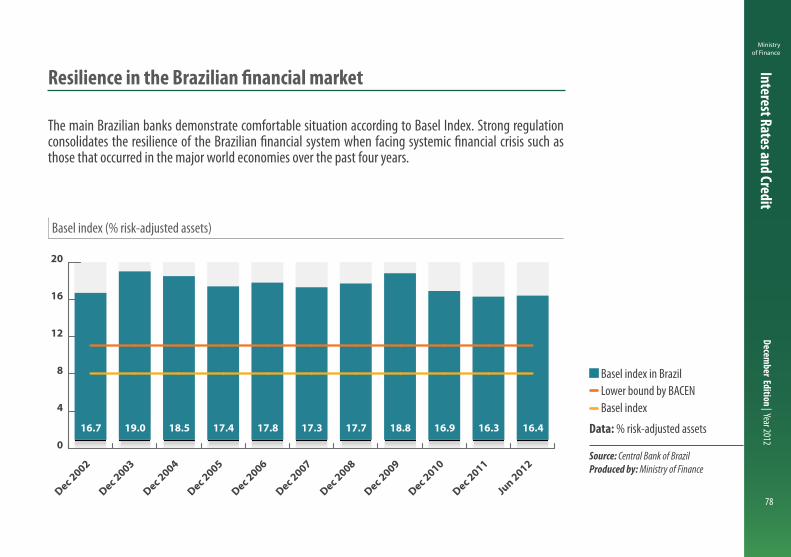
Basel index (% risk-adjusted assets)
Basel index in Brazil Lower bound by BACEN Basel index
Data: % risk-adjusted assets
Source: Central Bank of BrazilProduced by: Ministry of Finance
Resilience in the Brazilian financial market
The main Brazilian banks demonstrate comfortable situation according to Basel Index. Strong regulation consolidates the resilience of the Brazilian financial system when facing systemic financial crisis such as those that occurred in the major world economies over the past four years.
0
4
8
12
16
20
Jun 2012
Dec 2011
Dec 2010
Dec 2009
Dec 2008
Dec 2007
Dec 2006
Dec 2005
Dec 2004
Dec 2003
Dec 2002
16.7 19.0 18.5 17.4 17.8 17.3 17.7 18.8 16.9 16.3 16.4
Basel index in Brazil Lower bound by BACEN Basel Index
Ministry of Finance
December Edition | Year 2012
79
Interest Rates and Credit
Produced by: Ministry of Finance
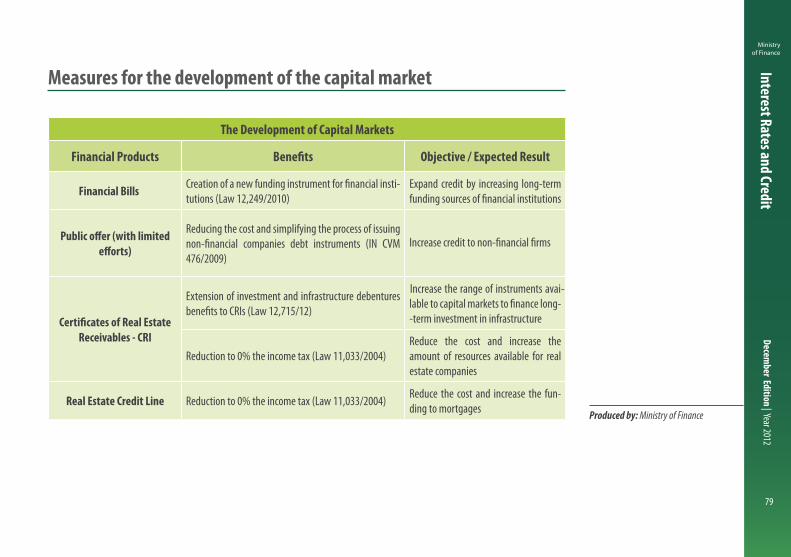
Measures for the development of the capital market
The Development of Capital Markets
Financial Products Objective / Expected Result
Financial Bills -tutions (Law 12,249/2010)
Expand credit by increasing long-term
Reducing the cost and simplifying the process of issuing
476/2009)Increase credit to non-�nancial �rms
Receivables - CRI
Extension of investment and infrastructure debentures Increase the range of instruments avai--
-term investment in infrastructure
Reduction to 0% the income tax (Law 11,033/2004)Reduce the cost and increase the amount of resources available for real estate companies
Real Estate Credit Line Reduction to 0% the income tax (Law 11,033/2004) Reduce the cost and increase the fun-ding to mortgages

Ministry of Finance
December Edition | Year 2012
80
Interest Rates and Credit
Produced by: Ministry of Finance
Measures for the development of the capital market
The Development of Capital Markets
Financial Products Objective / Expected Result
Investment DebenturesDecrease to 0 percent the rates of Financial Transaction Tax and Income Tax to foreign in-vestors (Law 12.431/11)
Encourage long-term Capital Markets as a way to broadenthe sources of funding for investments
Infrastructure Debentures
Decrease to 0 percent the rates of Financial Transaction Tax and Income Tax to foreign in-vestors, to 0 percent of income tax to individual domestic investors and decrease of 10 p.p. of
-panies (Law 12.431/11)
Develop long-term Capital Markets as a way to broaden the sources of funding for investments

Brazilian Economy
OUTLOOK
Ministry ofFinance
B R A Z I L I A N G O V E R N M E N T
Fiscal Policy
Ministry of Finance
December Edition | Year 2012
82
Fiscal PolicyIn 2012 Federal Government used fiscal policy instruments in order to avoid downturns on domestic economy due to the international crisis. The strategy also means to maintain fiscal fundamentals in a sound situation.
The strong fiscal results allows the Public Sector Net Debt at 35.2 percent of GDP close to the lowest series values. Also, the continuous improvement in Federal Public Debt profile, both in terms of composition and maturity, has been reflected on the declining rates of external issuances. The issuance of Global 2023 bond, in September, resulted on the lowest rate of all times for a Brazilian external public debt bond.
Moreover, consistent fiscal situation has still placed Brazil in a privileged position when compared to other G20 countries. It is expected the country should perform one of the greatest primary surpluses in the group, and one of the lowest nominal deficits.
Fiscal consolidation favors investment

Ministry of Finance
December Edition | Year 2012
83
Fiscal Policy
Public Sector Fiscal Result (% of GDP)
Public Sector Primary Result Central Government Primary Result Subnational Entities Primary Result (States and Municipalities) State-owned Companies Primary Result Public Sector Nominal Result
Data: % of GDP
* On a 12-month basis up to October 2012
Source: Central Bank of BrazilProduced by: Ministry of Finance
Economic growth with fiscal consolidation
The public sector continues to pursue the fiscal target in line with fiscal responsibility principles, one of the pillars of Brazilian economic policy. In fact, the fiscal and monetary policy coordination has sought to mitigate the effects of international crisis on domestic activity. Also, the projected targets will reduce even more both nominal deficit and public debt.
-6
-5
-4
-3
-2
-1
0
1
2
3
4
0.0
2.6
2.2
2012*2011201020092008200720062005200420032002
3.2 3.3
3.7 3.8
3.2 3.3 3.4
2.0
2.7
3.1
2.2
-4.4
-5.2
-2.9
-3.6 -3.6
-2.8
-2.0
-3.3
-2.5 -2.6 -2.7
3.2 3.33.7 3.8
3.2 3.3 3.4
2.02.7
3.1
2.2
-4.4-5.2
-2.9-3.6 -3.6
-2.8-2.0
-3.3-2.5 -2.6 -2.7
Nominal Result Primary Result State-owned Companies
State and Municipalities Central Government
0.1
0.00.
8
0.6
0.0
0.10.
6
0.5
1.3
2.1
2.20.1
0.2
-0.0
0.1
0.9
1.0
0.8
1.1
1.00.3
0.20.
7 0.8
2.2
2.3
2.7
2.6
2.2
2.2
2.40.2
1.6

Ministry of Finance
December Edition | Year 2012
84
Fiscal Policy
Primary and Nominal Results (% of GDP)
Primary Result Nominal Result
Data: % of GDP
* IMF forecasts - Fiscal Monitor October 2012. For Brazil, Focus Market Report - Central Bank of Brazil (November 30, 2012)
Source: Central Bank of Brazil and IMFProduced by: Ministry of Finance
Brazil stands out in the international fiscal scenario
Brazilian sound fiscal results stand out in comparison advanced and other emerging countries. For 2012, Brazil has one of the strongest levels of nominal and primary results, both as a share of GDP.
-10 -8 -6 -4 -2 0 2Japan
India
USA
UK
France
Canada
Italy
Mexico
Brazil
China
Germany
Russia
-10 -8 -6 -4 -2 0 2 4Japan
USA
UK
India
Canada
France
China
Mexico
Russia
Germany
BrazilItaly
Primary Fiscal Result (% of GDP) - 2012 Nominal Result (% of GDP) - 2012
-0.6
-2.2
-3.2
-5.2
-5.6
-6.5
-9.0
2.6
2.6
1.4
1.1
0.2
0.5
-0.4
-1.3
-2.3
-2.4
-2.7
-3.8
-4.7
-8.2
-8.7
-9.5
-10.0
Ministry of Finance
December Edition | Year 2012
85
Fiscal Policy
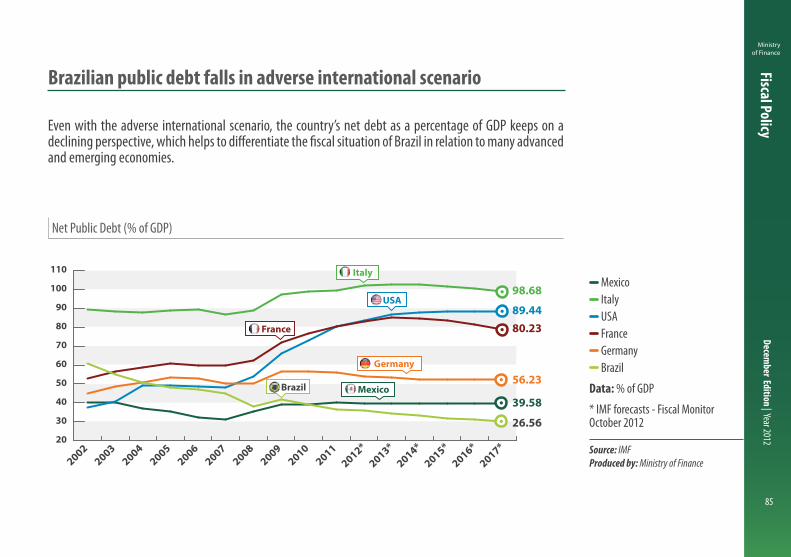
Net Public Debt (% of GDP)
Mexico Italy USA France Germany Brazil
Data: % of GDP
* IMF forecasts - Fiscal Monitor October 2012
Source: IMFProduced by: Ministry of Finance
Brazilian public debt falls in adverse international scenario
Even with the adverse international scenario, the country’s net debt as a percentage of GDP keeps on a declining perspective, which helps to differentiate the fiscal situation of Brazil in relation to many advanced and emerging economies.
20
30
40
50
60
70
80
90
100
110
2017*
2016*
2015*
2014*
2013*
2012*2011
2010
2009
2008
2007
2006
2005
2004
2003
2002
56.23
39.58
26.56
80.2389.44
98.68
Italy
France
Germany
MexicoBrazil
USA

Ministry of Finance
December Edition | Year 2012
86
Fiscal Policy
Central Government Primary Fiscal Result - Above the Line (% of GDP)Data: % of GDP
* On a 12-month basis up to October 2012 ** Including social security benefits, allowance and unemployment insurance, assistential benefits (LOAS and RMV) and “Bolsa Família” Program *** Including only investments classified as GND 4 **** Including the Sovereign Wealth Fund constitution (2008) and the capitalization operation of Petrobras (2010)
Source: National Treasury Secretariat/Ministry of Finance/SenateProduced by: Ministry of Finance
Brazil is improving its public expenditure profile
The Central Government fiscal results have gone through significant changes since 2002, due to the positive impact of job formalization on the economy, as well as the focus on reducing inequalities. The growth in net revenues has been directed to income transfers to households and to public investments.
% GDP 2002
2003
2004
2005
2006
2007
2008
2009
2010
2011
2012
*
Gross revenue 21.7 21.0 21.6 22.7 22.9 23.3 23.6 22.8 22.4 23.9 23.9Transfers to states and municipalities 3.8 3.5 3.5 3.9 3.9 4.0 4.4 3.9 3.7 4.2 4.1Net revenue 17.9 17.4 18.1 18.8 19.0 19.3 19.2 18.9 18.7 19.7 19.8Primary expenditure 15.7 15.1 15.6 16.4 17.0 17.1 16.4 17.7 17.4 17.5 18.2
- Payroll 4.8 4.5 4.3 4.3 4.5 4.4 4.3 4.7 4.4 4.3 4.2 - Income transfers to households** 6.8 7.2 7.6 8.1 8.4 8.5 8.1 8.7 8.5 8.6 9.1 - Investments*** 0.8 0.3 0.5 0.5 0.6 0.7 0.9 1.0 1.2 1.0 1.1
1.7 1.6 1.7 1.8 1.7 1.8 1.7 1.9 2.0 2.0 2.11.6 1.6 1.5 1.8 1.8 1.8 1.4 1.4 1.4 1.5 1.7
2.1 2.3 2.5 2.5 2.1 2.2 2.8 1.2 1.2 2.3 1.6
0.0 0.0 0.0 0.0 0.0 0.0 -0.5 0.0 0.8 0.0 0.0
Final primary results (above the line) 2.1 2.3 2.5 2.5 2.1 2.2 2.4 1.2 2.1 2.3 1.6
11.1 10.3 10.5 10.8 10.6 10.8 11.1 10.2 10.2 11.1 10.7Net revenue minus transfers
- Health and education - Other expenses
Primary result without sovereingwealth fund and onerous assignment
Impact of socereing wealth fund andonerous assignment****

Ministry of Finance
December Edition | Year 2012
87
Fiscal Policy
Selected Public Expenditures (% of GDP)
Transfers to families Payroll Expenses and Changes
Data: % of GDP
* On a 12-month basis up to October 2012
Source: National Treasury Secretariat/Ministry of Finance and Federal SenateProduced by: Ministry of Finance
Stability of the payroll expenditure and increase in transfers
Despite salary adjustments and the efforts to enhance civil servant workforce, payroll costs have reached 4.2% of GDP in October 2012 on a 12-month basis, below the average for the past 10 years. Meanwhile, income transfers to households have increased.
4.0
5.5
7.0
8.5
10.0
6.8
7.2
7.6
8.1
8.48.5
8.1
8.7
8.58.6
9.1
4.8
4.54.3 4.3
4.44.4 4.3
4.7
4.44.3
4.2
2012*
2011
2010
2009
2008
2007
2006
2005
2004
2003
2002
Transfers to familiesPayroll Expenses and Charges
4.84.5 4.3 4.3 4.4 4.4 4.3
4.7 4.4 4.3 4.2
6.87.2
7.68.1
8.4 8.58.1
8.7 8.5
9.1
8.6

Ministry of Finance
December Edition | Year 2012
88
Fiscal Policy
Federal Public Debt Profile** (% of total debt)
Exchange Rate Linked Floating Rate* Inflation Linked Fixed Rate
Data: % of total debt
* Including SELIC, TR and other ** Including domestic and external debts managed by the National Treasury
Source: National Treasury Secretariat/Ministry of FinanceProduced by: Ministry of Finance
Brazil makes good progress in Public Debt composition
The share of floating rate bonds in Federal Public Debt decreased to 23.0%, the second lowest value since November 1997. On the other hand, the share of fixed rate plus inflation linked bonds, which ensures greater predictability for the public debt, reached 72.6%, the second highest historical level.
0
10
20
30
40
50
60
70
80
90
100
Oct 2012
20122011
20102009
20082007
20062005
20042003
20022001
20001999
19981997
19961995
19941993
19921991
1990
Exchange Rate Floating Rate* In�ation Linked Fixed Rate
4.4
23.0
33.8
38.7
40.2
48.3
5.0
6.5
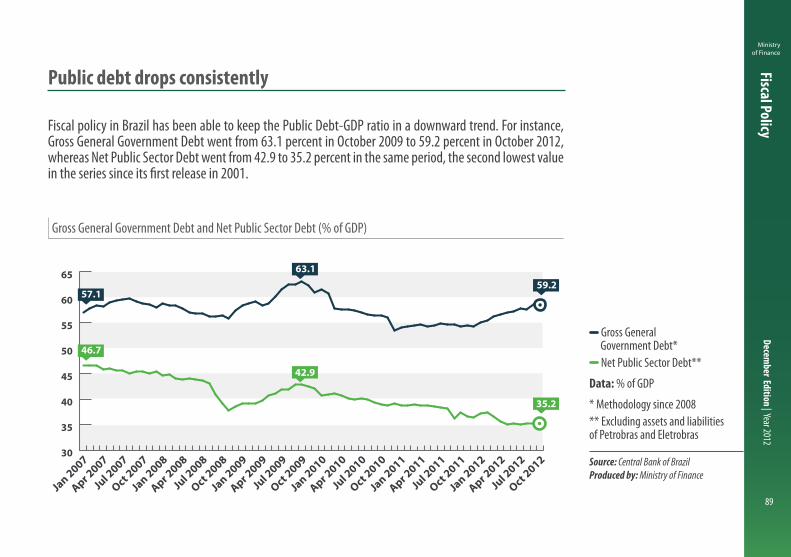
Ministry of Finance
December Edition | Year 2012
89
Fiscal Policy
Gross General Government Debt and Net Public Sector Debt (% of GDP)
Gross General Government Debt* Net Public Sector Debt**
Data: % of GDP
* Methodology since 2008 ** Excluding assets and liabilities of Petrobras and Eletrobras
Source: Central Bank of BrazilProduced by: Ministry of Finance
Public debt drops consistently
Fiscal policy in Brazil has been able to keep the Public Debt-GDP ratio in a downward trend. For instance, Gross General Government Debt went from 63.1 percent in October 2009 to 59.2 percent in October 2012, whereas Net Public Sector Debt went from 42.9 to 35.2 percent in the same period, the second lowest value in the series since its first release in 2001.
30
35
40
45
50
55
60
65
46.7
57.1
35.2
59.2
42.9
63.1
Data de elaboração: 23-11-12 Nome do Arquivo: DLSP_Divida Bruta_do_Governo Central--PT--23-11-12_PF.xls copiar célula acima e colar valores na célula abaixo
Net Public Sector Debt **
Gross General Government Debt**
Oct 2012
Jul 2
012
Apr 2012
Jan 2012
Oct 2011
Jul 2
011
Apr 2011
Jan 2011
Oct 2010
Jul 2
010
Apr 2010
Jan 2010
Oct 2009
Jul 2
009
Apr 2009
Jan 2009
Oct 2008
Jul 2
008
Apr 2008
Jan 2008
Oct 2007
Jul 2
007
Apr 2007
Jan 2007
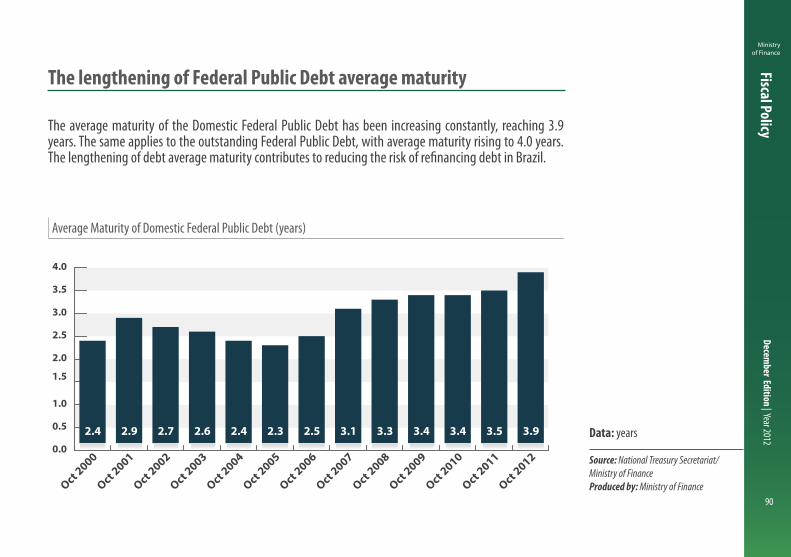
Ministry of Finance
December Edition | Year 2012
90
Fiscal Policy
Average Maturity of Domestic Federal Public Debt (years)
Data: years
Source: National Treasury Secretariat/Ministry of FinanceProduced by: Ministry of Finance
The lengthening of Federal Public Debt average maturity
The average maturity of the Domestic Federal Public Debt has been increasing constantly, reaching 3.9 years. The same applies to the outstanding Federal Public Debt, with average maturity rising to 4.0 years. The lengthening of debt average maturity contributes to reducing the risk of refinancing debt in Brazil.
0.0
0.5
1.0
1.5
2.0
2.5
3.0
3.5
4.0
Oct 2012
Oct 2011
Oct 2010
Oct 2009
Oct 2008
Oct 2007
Oct 2006
Oct 2005
Oct 2004
Oct 2003
Oct 2002
Oct 2001
Oct 2000
Stock
3.93.53.43.43.33.12.52.32.42.62.72.92.4
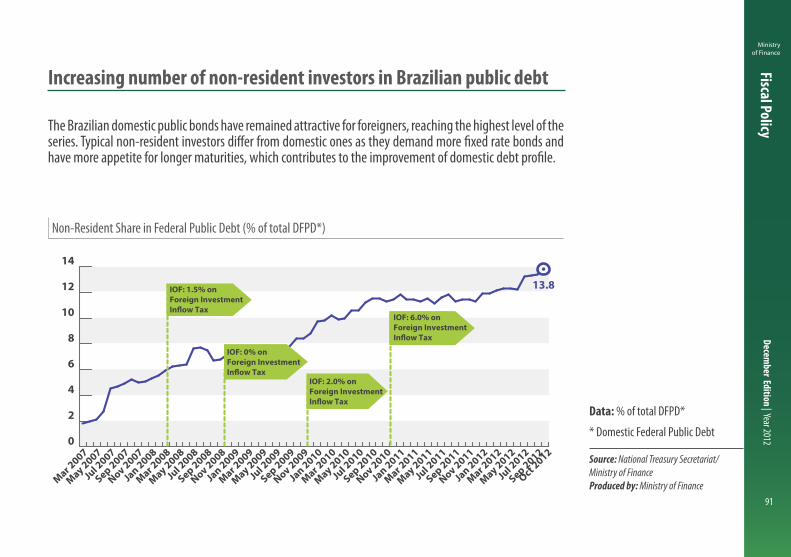
Ministry of Finance
December Edition | Year 2012
91
Fiscal Policy
Non-Resident Share in Federal Public Debt (% of total DFPD*)
Data: % of total DFPD*
* Domestic Federal Public Debt
Source: National Treasury Secretariat/Ministry of FinanceProduced by: Ministry of Finance
Increasing number of non-resident investors in Brazilian public debt
The Brazilian domestic public bonds have remained attractive for foreigners, reaching the highest level of the series. Typical non-resident investors differ from domestic ones as they demand more fixed rate bonds and have more appetite for longer maturities, which contributes to the improvement of domestic debt profile.
0
2
4
6
8
10
12
14
Oct 2012
Sep 2012
Jul 2
012
May 2012
Mar 2012
Jan 2012
Nov 2011
Sep 2011
Jul 2
011
May 2011
Mar 2011
Jan 2011
Nov 2010
Sep 2010
Jul 2
010
May 2010
Mar 2010
Jan 2010
Nov 2009
Sep 2009
Jul 2
009
May 2009
Mar 2009
Jan 2009
Nov 2008
Sep 2008
Jul 2
008
May 2008
Mar 2008
Jan 2008
Nov 2007
Sep 2007
Jul 2
007
May 2007
Mar 2007
13.8IOF: 1.5% onForeign InvestmentIn�ow Tax
IOF: 0% onForeign InvestmentIn�ow Tax
IOF: 2.0% onForeign InvestmentIn�ow Tax
IOF: 6.0% onForeign InvestmentIn�ow Tax
Non-Resident Share

Ministry of Finance
December Edition | Year 2012
92
Fiscal Policy
Yields of 10-year Brazilian and USA bonds (% per annum)
Brazilian Sovereign Bonds US Treasury Bonds
Data: % per annum
* Measured by the differential of yields from 10-year Brazilian bonds denominated in USD and yields from US Treasury bonds (same maturity), traded on the secondary market on the same date
Source: National Treasury Secretariat/Ministry of FinanceProduced by: Ministry of Finance
Increase of investors confidence for sovereign bonds
Commitment to fiscal responsability throughout the years combined with economic growth have contributed to the reduction of credit risk* in Brazil and reinforced the appealing of Brazilian sovereign bonds. Brazilian National Treasury issued, on September 5, the Global 2023 at a yield of 2.686% per year, the lowest rate ever for a Brazilian Global bond issuance.
0
3
6
9
12
15 14,6
12,6
10,6
10,8
8,27,9 7,7 7,8
6,25,9
5,36,1 5,8
2,7
4,8 5,04,5 4,2
3,44,2
6,2
4,9
3,34,5 4,4 4,0
4,6 4,7 4,73,8
2,53,3 3,6 3,8
3,0 3,12,0
1,6
Sep 2012
Jan 2012
Jul 2
011
Jul 2
010
Apr 2010
Dec 2009
May 2009
Jan 2009
May 2008
Apr 2007
Nov 2006
Nov 2005
Jun 2005
Feb 2005
Dec 2004
Jul 2
004
Jun 2003
Jan 2002
Oct 1999

Brazilian Economy
OUTLOOK
Ministry ofFinance
B R A Z I L I A N G O V E R N M E N T
External Sector

Ministry of Finance
December Edition | Year 2012
94
External Sector
In 2012, the Brazilian trade balance has been influenced by external factors, resulting in decreases in exports and imports, in the 12 months accumulated up to October 2012. It is due to a weaker global demand and new bureaucratic procedures faced by Brazilian exporters. In fact, trade barriers imposed by Argentina, one of our main trade partners, have resulted in delays in the import approval process. However, Brazil shows a relevant export market diversification quality, which has mitigated such difficulties.
Even under this adverse scenario in 2012, Brazil’s low external vulnerability lies in its excellent macro fundamentals. As opposed to previous crisis episodes, the volume of foreign reserves has considerably exceeded external debt and the current account deficit remains around 2.3% of GDP, being entirely financed by foreign direct investment. As a matter of fact, Brazil has been one of the main receptors of FDI in the world.
External factors influencing the Brazilian trade balance
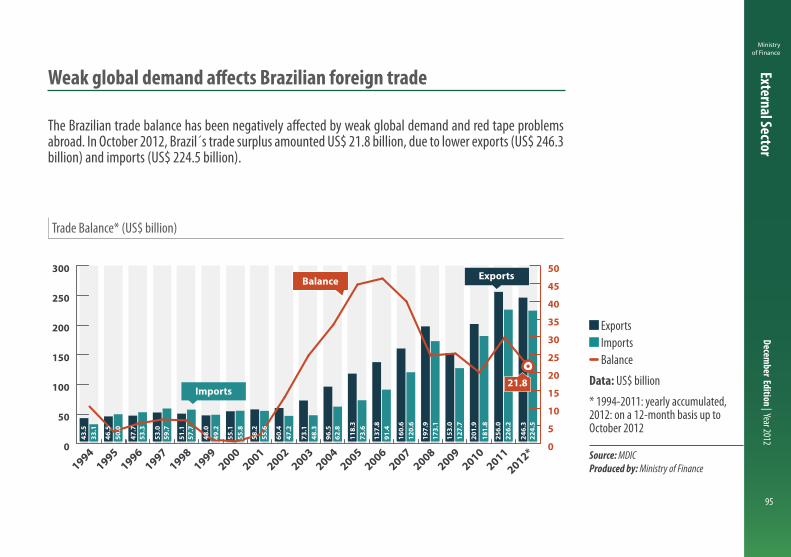
Ministry of Finance
December Edition | Year 2012
95
External Sector
Trade Balance* (US$ billion)
Exports Imports Balance
Data: US$ billion
* 1994-2011: yearly accumulated, 2012: on a 12-month basis up to October 2012
Source: MDICProduced by: Ministry of Finance
Weak global demand affects Brazilian foreign trade
The Brazilian trade balance has been negatively affected by weak global demand and red tape problems abroad. In October 2012, Brazil´s trade surplus amounted US$ 21.8 billion, due to lower exports (US$ 246.3 billion) and imports (US$ 224.5 billion).
0
50
100
150
200
250
300
2012*2011
20102009
20082007
20062005
20042003
20022001
20001999
19981997
19961995
19940
5
10
15
20
25
30
35
40
45
50Exports
Imports
Balance
21.8
33.1
50.0
53.3
59.7
57.7
49.2
55.8
55.6
47.2
48.3
62.8
73.6
91.4
120.
6
173.
1
127.
7
181.
8
226.
2
224.
5
43.5
46.5
47.7
53.0
51.1
48.0
55.1
58.2
60.4
73.1
96.5
118.
3
137.
8
160.
6
197.
9
153.
0
201.
9
256.
0
246.
3
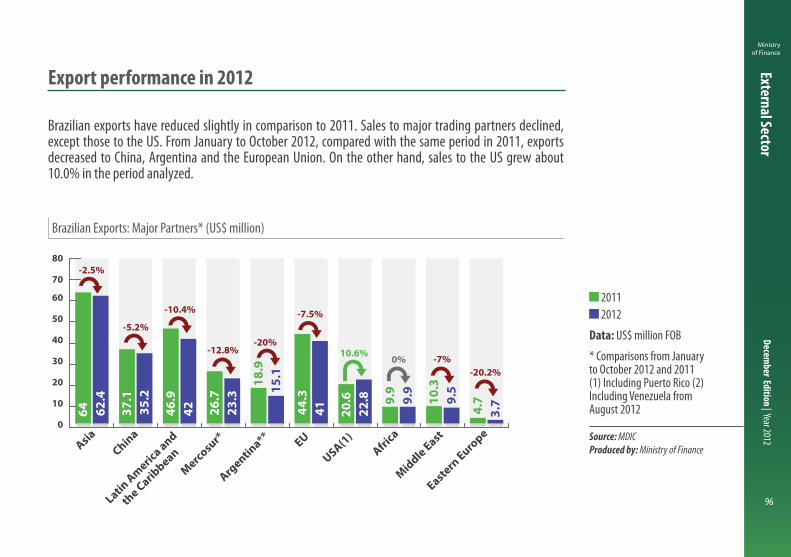
Ministry of Finance
December Edition | Year 2012
96
External Sector
Brazilian Exports: Major Partners* (US$ million)
2011 2012
Data: US$ million FOB
* Comparisons from January to October 2012 and 2011 (1) Including Puerto Rico (2) Including Venezuela from August 2012
Source: MDICProduced by: Ministry of Finance
Export performance in 2012
Brazilian exports have reduced slightly in comparison to 2011. Sales to major trading partners declined, except those to the US. From January to October 2012, compared with the same period in 2011, exports decreased to China, Argentina and the European Union. On the other hand, sales to the US grew about 10.0% in the period analyzed.
-2.5%
2011 2012
0
10
20
30
40
50
60
70
80
62.4
35.2
42 23.3 15
.1
41 22.8 9.
9
9.5
3.7
64 37.1
46.9
26.7
18.9
44.3
20.6 9.
9
10.3
4.7
Eastern
Europe
Middle EastAfri
ca
USA(1)EU
Argentin
a**
Mercosur*
Latin Americ
a and
the Carib
beanChinaAsia
-5.2%
-10.4%
-12.8%-20%
-7.5%
10.6%0% -7%
-20.2%
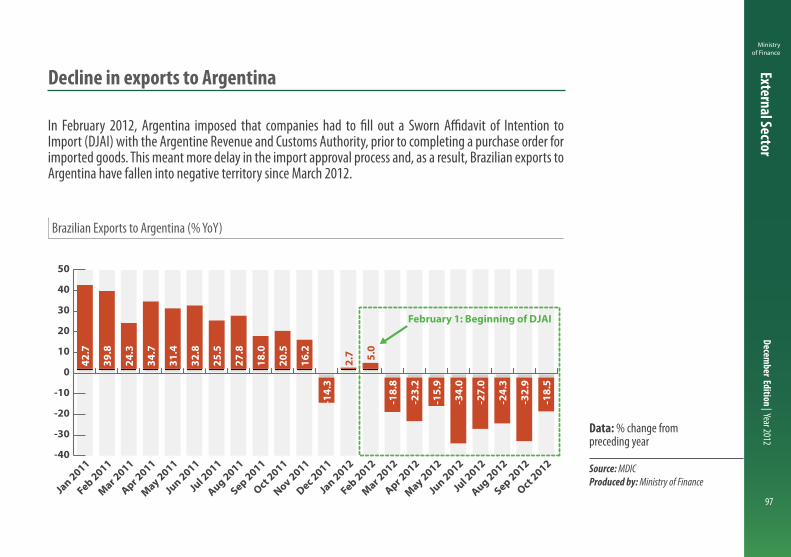
Ministry of Finance
December Edition | Year 2012
97
External Sector
Brazilian Exports to Argentina (% YoY)
Data: % change from preceding year
Source: MDICProduced by: Ministry of Finance
Decline in exports to Argentina
In February 2012, Argentina imposed that companies had to fill out a Sworn Affidavit of Intention to Import (DJAI) with the Argentine Revenue and Customs Authority, prior to completing a purchase order for imported goods. This meant more delay in the import approval process and, as a result, Brazilian exports to Argentina have fallen into negative territory since March 2012.
-40
-30
-20
-10
0
10
20
30
40
50
Oct 2012
Sep 2012
Aug 2012
Jul 2
012
Jun 2012
May 2012
Apr 2012
Mar 2012
Feb 2012
Jan 2012
Dec 2011
Nov 2011
Oct 2011
Sep 2011
Aug 2011
Jul 2
011
Jun 2011
May 2011
Apr 2011
Mar 2011
Feb 2011
Jan 2011
February 1: Beginning of DJAI
42.7
39.8
24.3
34.7
31.4
32.8
25.5
27.8
18.0
20.5
16.2
2.7 5.
0
-14.
3
-18.
8
-23.
2
-15.
9
-34.
0
-27.
0
-24.
3
-32.
9
-18.
5

Ministry of Finance
December Edition | Year 2012
98
External Sector
Brazil: Largest Trading Partners (% of total exports)
1990 1998 2004 2012*
Data: % share of total exports
* YTD October 2012 ** Venezuela not included
Source: MDICProduced by: Ministry of Finance
Greater export diversification
Market diversification has been one of the strategies to increase Brazilian exports. The share of exports to China grew in importance in recent years, from 1.2% in 1990 to 17.4% in year-to-date. Share of exports to Mercosur** partners also increased, from 4.2% in 1990 to 9.4% in 2012.
0
5
10
15
20
25
30
35
1.817.4 11.2 20.3 9.45.6 20.8 25.5 9.21.8 19.1 29.8 17.429.2 33.3 4.21.2
1990
1998
2008
2012
MercosurEuropean UnionUSAChina

Ministry of Finance
December Edition | Year 2012
99
External Sector
Brazilian Exports: Manufactured Goods* (% of total manufactured exports)
Argentina United States China European Union
Data: % share of total manufactured exports
* YTD October 2012
Source: MDICProduced by: Ministry of Finance
Main destinations of Brazilian manufactured exports
Manufactured exports to Argentina have grown in importance since 2002, while sales of manufactured sales to the US have decreased over the last years. Since 2010, however, there has been a recovery in sales to the USA and a drop to our main Mercosur partner. Nowadays, the EU is the main destination of Brazilian manufactured exports, purchasing about 20% of these products.
0
5
10
15
20
25
30
35
2012*2011
20102009
20082007
20062005
20042003
20022001
2000
19.618.314.8
2.7
European UnionArgentina
ChinaUSA
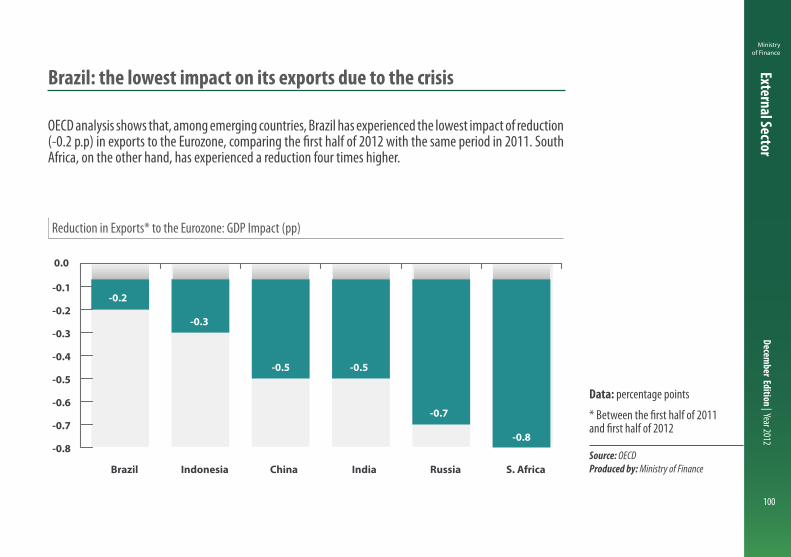
Ministry of Finance
December Edition | Year 2012
100
External Sector
Reduction in Exports* to the Eurozone: GDP Impact (pp)
Data: percentage points
* Between the first half of 2011 and first half of 2012
Source: OECDProduced by: Ministry of Finance
Brazil: the lowest impact on its exports due to the crisis
OECD analysis shows that, among emerging countries, Brazil has experienced the lowest impact of reduction (-0.2 p.p) in exports to the Eurozone, comparing the first half of 2012 with the same period in 2011. South Africa, on the other hand, has experienced a reduction four times higher.
-0.8
-0.7
-0.6
-0.5
-0.4
-0.3
-0.2
-0.1
0.0
S. AfricaRussiaIndia China IndonesiaBrazil
-0.8
-0.7
-0.5-0.5
-0.3
-0.2

Ministry of Finance
December Edition | Year 2012
101
External Sector
Current Account Balance* (US$ billion and % of GDP)
Balance (US$ billion) Current Account (% of GDP)
Data: US$ billion and % of GDP
* 2012: on a 12-month basis up to October 2012
Source: Central Bank of BrazilProduced by: Ministry of Finance
Current account deficit relatively stable
Current account deficit in Brazil, which totaled US$ 50 billion in 2011, reached US$ 52.2 billion in the 12 months through October 2012. The lower volume of profits and dividends remittances, a result of the currency devaluation, has been the major factor responsible for the stability of the deficit to GDP ratio at 2.3%.
-60
-50
-40
-30
-20
-10
0
10
20
20122011
20102009
20082007
20062005
20042003
20022001
20001999
19981997
1996-10
-8
-6
-4
-2
0
2
4
Current Account Balance (US$ billion) Current Account (% GDP)-7
.6
-23.
2
-24.
2
-25.
3
-33.
4
-30.
5
-23.
5
1.6
13.6
14.0
11.7
4.2
-52.
2
-52.
5
-47.
3-24.
3
-28.
2 -2.3-2.1-2.2-1.5-1.7
0.1
1.31.61.8
0.8
-1.5
-4.2-3.8
-4.3-4.0-3.5
-2.8
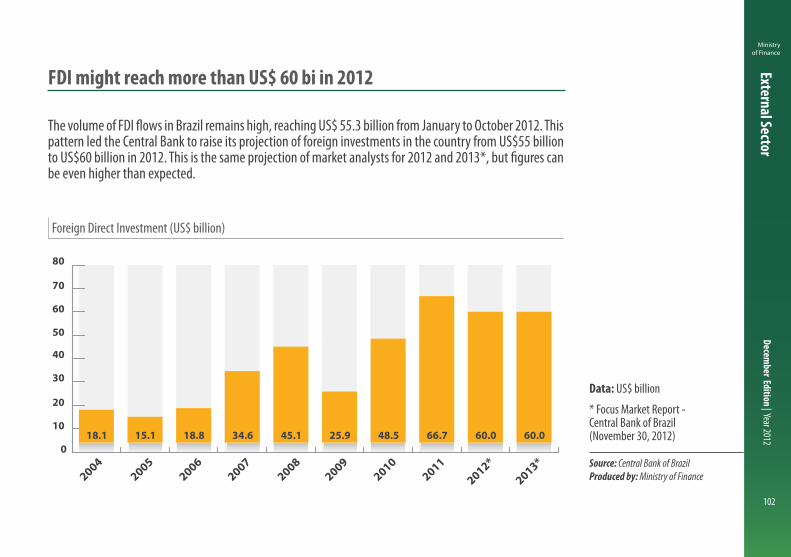
Ministry of Finance
December Edition | Year 2012
102
External Sector
Foreign Direct Investment (US$ billion)
Data: US$ billion
* Focus Market Report - Central Bank of Brazil (November 30, 2012)
Source: Central Bank of BrazilProduced by: Ministry of Finance
FDI might reach more than US$ 60 bi in 2012
The volume of FDI flows in Brazil remains high, reaching US$ 55.3 billion from January to October 2012. This pattern led the Central Bank to raise its projection of foreign investments in the country from US$55 billion to US$60 billion in 2012. This is the same projection of market analysts for 2012 and 2013*, but figures can be even higher than expected.
0
10
20
30
40
50
60
70
80
2013*
2012*2011
20102009
20082007
20062005
2004
18.1 15.1 18.8 34.6 45.1 25.9 48.5 66.7 60.0 60.0
FDI total
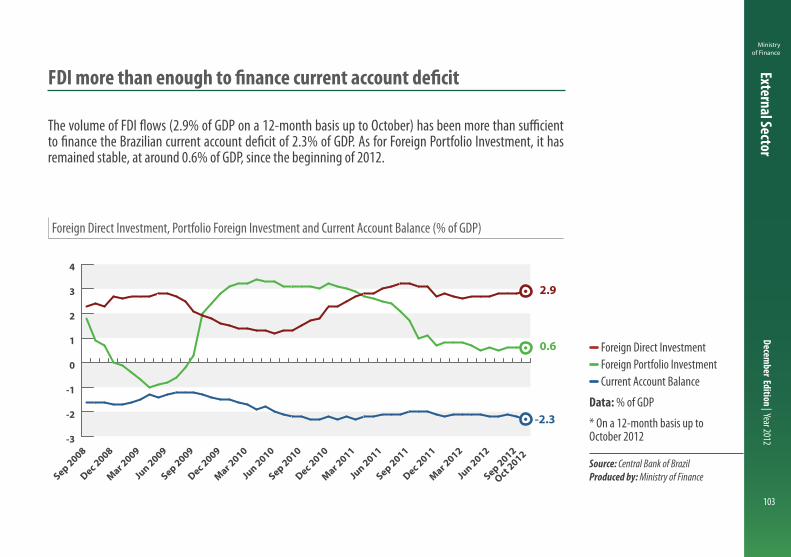
Ministry of Finance
December Edition | Year 2012
103
External Sector
Foreign Direct Investment, Portfolio Foreign Investment and Current Account Balance (% of GDP)
Foreign Direct Investment Foreign Portfolio Investment Current Account Balance
Data: % of GDP
* On a 12-month basis up to October 2012
Source: Central Bank of BrazilProduced by: Ministry of Finance
FDI more than enough to finance current account deficit
The volume of FDI flows (2.9% of GDP on a 12-month basis up to October) has been more than sufficient to finance the Brazilian current account deficit of 2.3% of GDP. As for Foreign Portfolio Investment, it has remained stable, at around 0.6% of GDP, since the beginning of 2012.
0.6
-2.3
2.9
Current Account BalanceForeign Portfolio Investment
Foreign Direct Investment
-3
-2
-1
0
1
2
3
4
Oct 2012
Sep 2012
Jun 2012
Mar 2012
Dec 2011
Sep 2011
Jun 2011
Mar 2011
Dec 2010
Sep 2010
Jun 2010
Mar 2010
Dec 2009
Sep 2009
Jun 2009
Mar 2009
Dec 2008
Sep 2008
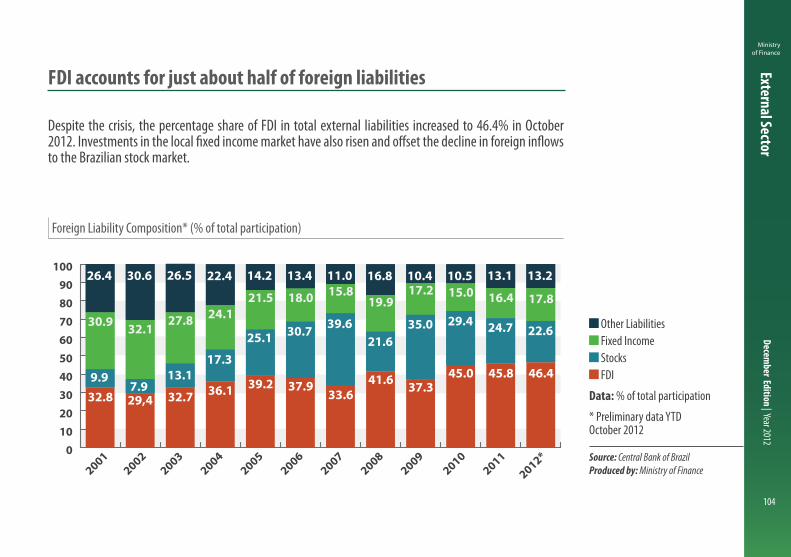
Ministry of Finance
December Edition | Year 2012
104
External Sector
Foreign Liability Composition* (% of total participation)
Other Liabilities Fixed Income Stocks FDI
Data: % of total participation
* Preliminary data YTD October 2012
Source: Central Bank of BrazilProduced by: Ministry of Finance
FDI accounts for just about half of foreign liabilities
Despite the crisis, the percentage share of FDI in total external liabilities increased to 46.4% in October 2012. Investments in the local fixed income market have also risen and offset the decline in foreign inflows to the Brazilian stock market.
Other Liabilities Fixed Income Stocks FDI
0102030405060708090
100
26.4 30.6 26.5 22.4 14.2 13.4 11.0 16.8 10.4 10.5 13.1 13.2
30.9 32.1 27.8 24.121.5 18.0 15.8
19.917.2 15.0 16.4 17.8
9.97.9
13.117.3
25.1 30.739.6
21.635.0 29.4 24.7 22.6
29,4
26.4 30.6 26.5 22.4 14.2 13.4 11.0 16.8 10.4 10.5 13.1 13.2
30.9 32.127.8 24.1
21.5 18.0 15.819.9
17.2 15.0 16.4 17.8
9.97.9
13.117.3
25.1 30.7 39.621.6
35.0 29.4 24.7 22.6
32.8 32.7 36.1 39.2 37.933.6
41.6 37.345.0 45.8 46.4
2012*2011
20102009
20082007
20062005
20042003
20022001
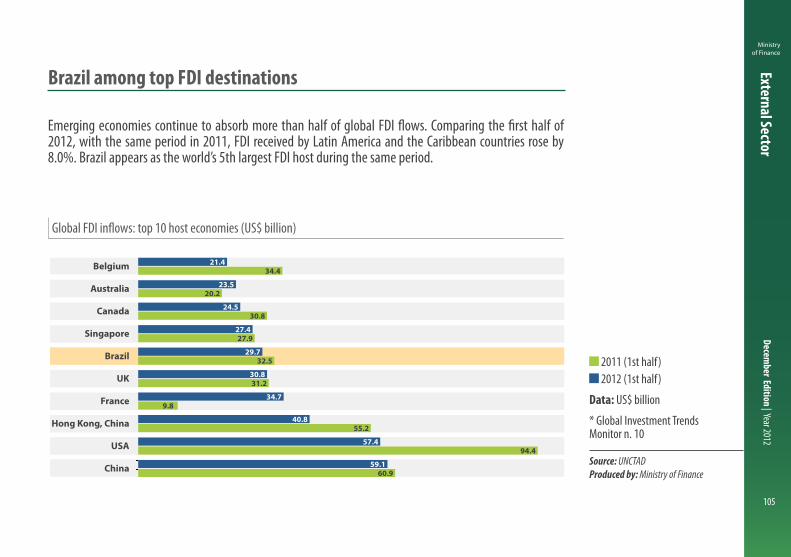
Ministry of Finance
December Edition | Year 2012
105
External Sector
Global FDI inflows: top 10 host economies (US$ billion)
2011 (1st half) 2012 (1st half)
Data: US$ billion
* Global Investment Trends Monitor n. 10
Source: UNCTADProduced by: Ministry of Finance
Brazil among top FDI destinations
Emerging economies continue to absorb more than half of global FDI flows. Comparing the first half of 2012, with the same period in 2011, FDI received by Latin America and the Caribbean countries rose by 8.0%. Brazil appears as the world’s 5th largest FDI host during the same period.
China
USA
Hong Kong, China
France
UK
Brazil
Singapore
Canada
Australia
Belgium
2012 2011
21.4
23.5
24.5
27.4
29.7
30.8
34.7
40.8
57.4
59.1
34.4
20.2
30.8
27.9
32.5
31.2
9.8
55.2
94.4
60.9
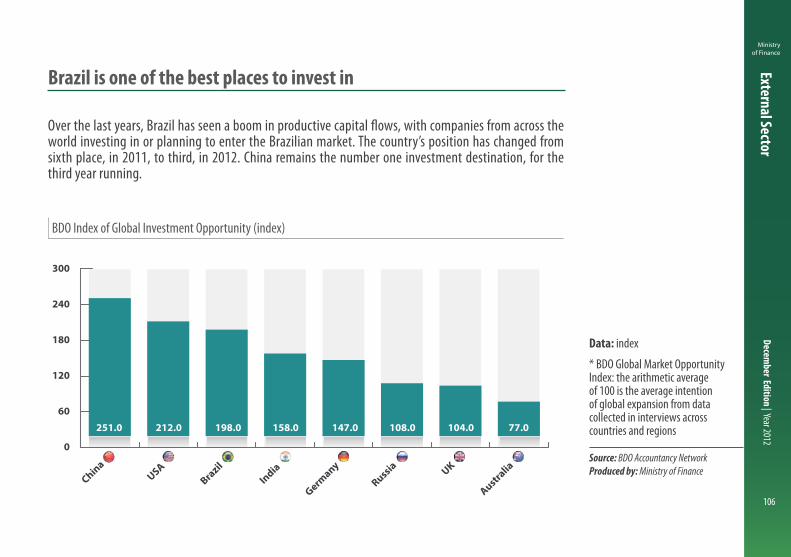
Ministry of Finance
December Edition | Year 2012
106
External Sector
BDO Index of Global Investment Opportunity (index)
Data: index
* BDO Global Market Opportunity Index: the arithmetic average of 100 is the average intention of global expansion from data collected in interviews across countries and regions
Source: BDO Accountancy NetworkProduced by: Ministry of Finance
Brazil is one of the best places to invest in
Over the last years, Brazil has seen a boom in productive capital flows, with companies from across the world investing in or planning to enter the Brazilian market. The country’s position has changed from sixth place, in 2011, to third, in 2012. China remains the number one investment destination, for the third year running.
0
60
120
180
240
300
AustraliaUK
Russia
Germany
India
Brazil
USAChina
251.0 212.0 198.0 158.0 147.0 108.0 104.0 77.0

Ministry of Finance
December Edition | Year 2012
107
External Sector
International Reserves (US$ billion)
IMF loans - annual Total International reserves liquidity concept - annual
Data: US$ billion
* Up to November 30, 2012
Source: Central Bank of BrazilProduced by: Ministry of Finance
Foreign reserves reduce external vulnerability
International reserves, which amounted to US$ 378.6 billion in November 2012, continue to be higher than total foreign debt. As so, the country remains a strong net external creditor. International reserve accumulation is one of the pillars of Brazilian economic policy for external vulnerability reduction, especially in a crisis environment.
0
50
100
150
200
250
300
350
400
0.0 0.00.0
0.0
0.00.0
2012*2011
20102009
20082007
20062005
20042003
2002
IMF loans - annualTotal international reserves liquidity Concept - Annual
20.8 28.3 24.9
17.0 21.0 28.0 53.8 85.8 180.3 193.8 238.5 288.6 352.0 378.6
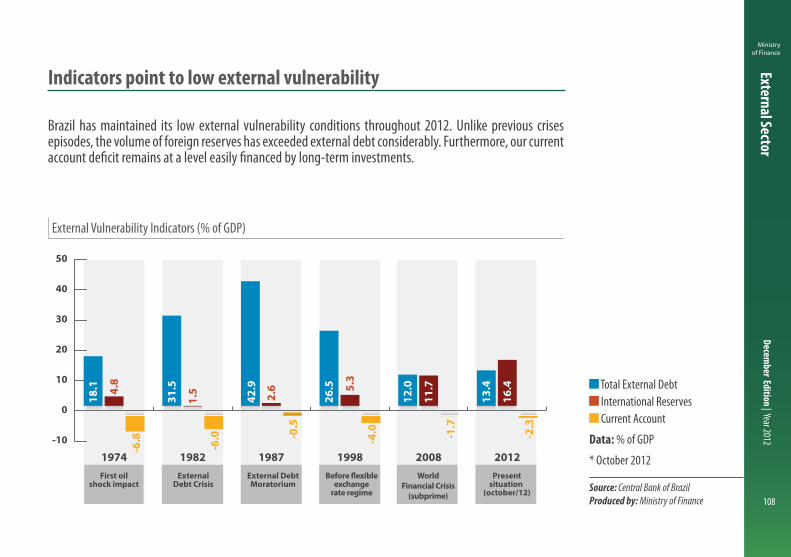
Ministry of Finance
December Edition | Year 2012
108
External Sector
External Vulnerability Indicators (% of GDP)
Total External Debt International Reserves Current Account
Data: % of GDP
* October 2012
Source: Central Bank of BrazilProduced by: Ministry of Finance
Indicators point to low external vulnerability
Brazil has maintained its low external vulnerability conditions throughout 2012. Unlike previous crises episodes, the volume of foreign reserves has exceeded external debt considerably. Furthermore, our current account deficit remains at a level easily financed by long-term investments.
-10
0
10
20
30
40
50
201220081998198719821974
Current Account (%GDP) International Reserves (%GDP) Total External Debt (%GDP)
First oilshock impact
ExternalDebt Crisis
External DebtMoratorium
Before �exibleexchange
rate regime
Presentsituation
(october/12)
WorldFinancial Crisis
(subprime)
4.8
1.5 2.6 5.
3
11.7
16.4
18.1
31.5
26.5
12.0
13.4
-6.8
-6.0 -0
.5
-4.0 -1
.7
-2.3
42.9
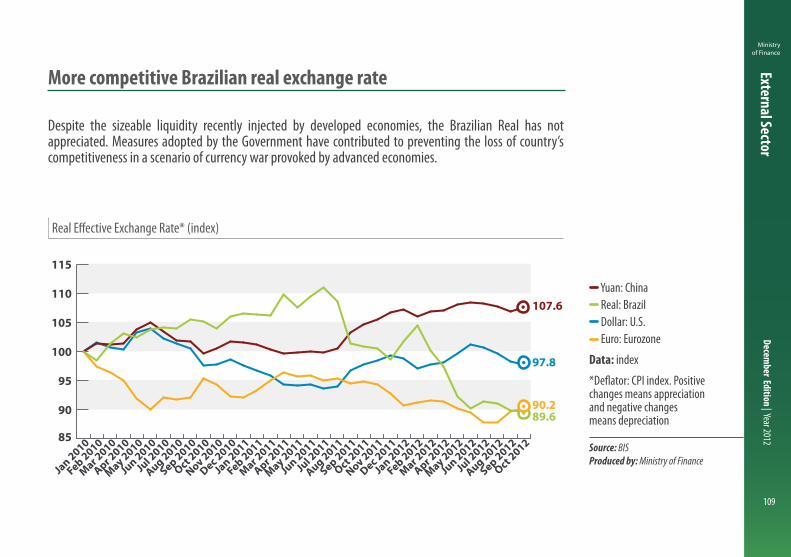
Ministry of Finance
December Edition | Year 2012
109
External Sector
Real Effective Exchange Rate* (index)
Yuan: China Real: Brazil Dollar: U.S. Euro: Eurozone
Data: index
*Deflator: CPI index. Positive changes means appreciation and negative changes means depreciation
Source: BISProduced by: Ministry of Finance
More competitive Brazilian real exchange rate
Despite the sizeable liquidity recently injected by developed economies, the Brazilian Real has not appreciated. Measures adopted by the Government have contributed to preventing the loss of country’s competitiveness in a scenario of currency war provoked by advanced economies.
85
90
95
100
105
110
115
Oct 2012
Sep 2012
Aug 2012
Jul 2
012
Jun 2012
May 2012
Apr 2012
Mar 2012
Feb 2012
Jan 2012
Dec 2011
Nov 2011
Oct 2011
Sep 2011
Aug 2011
Jul 2
011
Jun 2011
May 2011
Apr 2011
Mar 2011
Feb 2011
Jan 2011
Dec 2010
Nov 2010
Oct 2010
Sep 2010
Aug 2010
Jul 2
010
Jun 2010
May 2010
Apr 2010
Mar 2010
Feb 2010
Jan 2010
97.8
90.289.6
107.6
Dollar: USA Euro: Eurozone Yuan: China Real: Brasil

Ministry of Finance
December Edition | Year 2012
110
External Sector
Nominal Exchange Rate (RS/US$)
Data: R$/US$
Source: Central Bank of BrazilProduced by: Ministry of Finance
Winning the currency war: Brazilian Real in a more competitive level
The Brazilian Government has dealt with the so-called currency war by implementing macroprudential policies to manage short-term foreign capital inflows. The financial operations tax (IOF), charged on short-term foreign loans, contributed to the increase in the average exchange rate (R$/US$) from R$ 1.72 in 2011 to current values around R$ 2.10 at the beginning of December 2012.
2.11
1.5
1.6
1.7
1.8
1.9
2.0
2.1
Dec 2012
Nov 2012
Oct 2012
Sep 2012
Aug 2012
Jul 2
012
Jun 2012
May 2012
Apr 2012
Mar 2012
Feb 2012
Jan 2012
Dec 2011
Nov 2011
Oct 2011
Sep 2011
Aug 2011
Jul 2
011
Jun 2011
May 2011
Apr 2011
Mar 2011
Feb 2011
Jan 2011
20112nd halfAverage: R$ 1.72
20121st halfAverage:R$ 1.87
20122nd halfAverage: R$ 2.04
20111st halfAverage: R$ 1.63
Average Exchange Rate - Free- US Dollar (purchase) - u.m.c./US$

Brazilian Economy
OUTLOOK
Ministry ofFinance
B R A Z I L I A N G O V E R N M E N T
International Overview
Ministry of Finance
December Edition | Year 2012
112
International Overview
The 2008 financial turmoil has not yet come to an end, as the world is still waiting to see advanced economies address important financial and political problems. In the United States, the Federal Reserve has become the main source of economic stimulus, having implemented the third round of quantitative easing, without satisfactory results for the US, but with negative consequences for emerging economies. From the fiscal point of view, the debate has dragged on since 2011, resulting in the so-called “Fiscal Cliff”, which is a series of budget cuts and tax increases to go into effect at the beginning of 2013. If this fiscal tightening fully takes place then the economy would suffer a serious recession, negatively impacting the global economy. Thus, the US politicians must make a deal on the budget deficit, in order to avoid a recession.
In Europe, the crisis still persists in countries like Greece, Portugal and Spain, with severe economic and social consequences. The crisis is also starting to affect more solid economies, such as Germany. Therefore, it is important that Euro zone countries come up with rapid and durable solutions, specially in terms of banking supervision and fiscal consolidation, so that economic growth picks up in the region.
Advanced economies still face major challenges
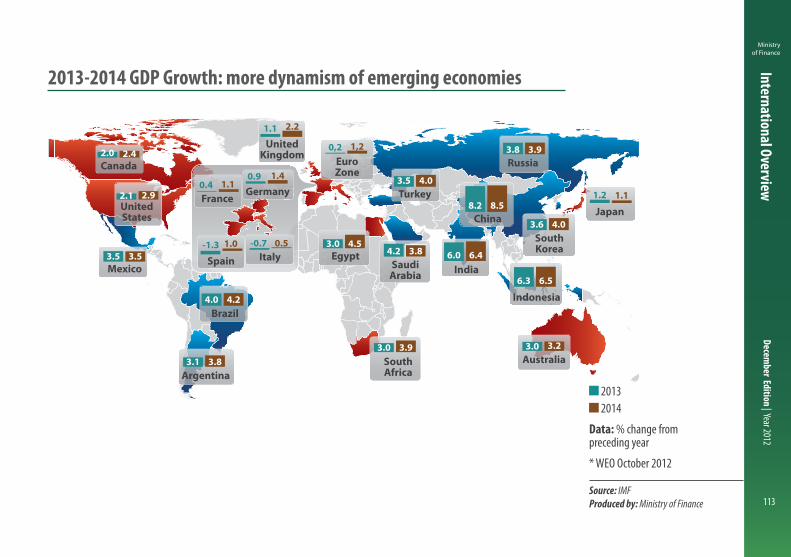
Ministry of Finance
December Edition | Year 2012
113
International Overview
2013 2014
Data: % change from preceding year
* WEO October 2012
Source: IMFProduced by: Ministry of Finance
2013-2014 GDP Growth: more dynamism of emerging economies
Canada
Brazil
ArgentinaSouthAfrica
EgyptSaudi
Arabia India
Russia
Japan
Australia
SouthKorea
Indonesia
China
Turkey
UnitedKingdom
Mexico
UnitedStates
2.42.0
2.92.1
3.53.5
4.24.0
3.83.13.93.0
4.53.0
2.21.1
4.03.5
3.84.2 6.46.0
8.58.2
3.93.8
1.11.2
4.03.6
6.56.3
3.23.0
1,20,2EuroZone
Spain Italy
France0.4 1.1
-1.3 1.0 -0.7 0.5
Germany1.40.9

Ministry of Finance
December Edition | Year 2012
114
International Overview
2013 2014
Data: % change from preceding year
* WEO October 2012
Source: IMF and Brazilian GovernmentProduced by: Ministry of Finance
2013-2014: inflation forecasts
2014
2013
SaudiArabia
Brazil*
Russia
Argentina
India
China
Indonesia
SouthKorea
Australia
JapanUSA
South Africa
Mexico
Canada Eurozone
4.9
9.7
3.5
5.2
4.69.6
6.6
2.7
5.1
3.0
2.6
-0.21.8
2.0 1.6
4.8
5.0
4.98.3
6.5
2.1
3.0
3.0
4.9
2.39.8
3.0
2.0
2.01.4
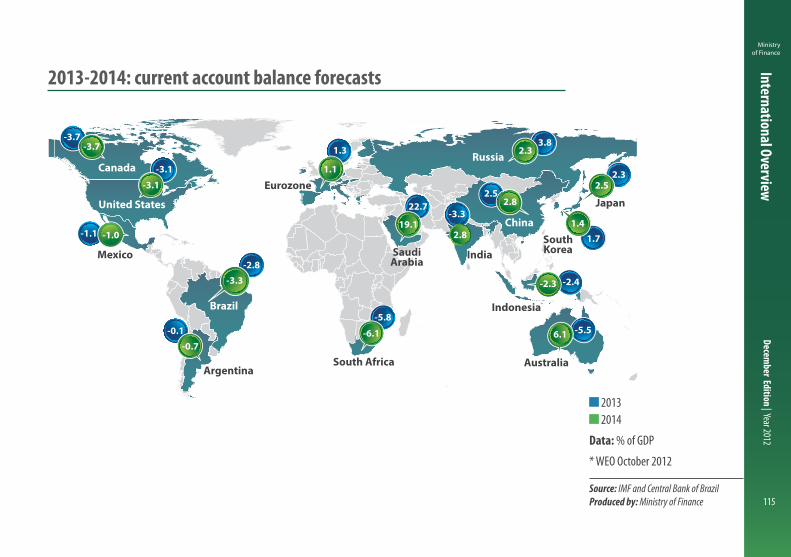
Ministry of Finance
December Edition | Year 2012
115
International Overview
2013 2014
Data: % of GDP
* WEO October 2012
Source: IMF and Central Bank of BrazilProduced by: Ministry of Finance
2013-2014: current account balance forecasts
2013
2014
SaudiArabia
Brazil
Russia
Argentina
India
China
Indonesia
SouthKorea
Australia
JapanUnited States
South Africa
Mexico
Canada
Eurozone
-0.1
-1.1
-5.8
22.7-3.3
3.8
1.7
-2.4
2.5
-5.5
2.3-3.1
-3.71.3
-2.8
z
-6.1
19.12.8
2.3
2.5
1.4
2.8
-2.3
6.1-0.7
-1.0
-3.1
-3.7
1.1
-3.3

Ministry of Finance
December Edition | Year 2012
116
International Overview
Deviation of Actual and Potential GDP Growth Rates* (pp)
Very strong (<-2.5) Strong (between -2.5 and -2.0) Moderated (between -2.0 and -1.5) Limited (between -1.5 and 0.0)
Data: percentage point
* IMF calculations
Source: IMFProduced by: Ministry of Finance
Brazil will be the least affected in the case of crisis worsening
The IMF analyzed the effects of an intensification of the European crisis, taking into account factors such as a sharp drop in global demand and commodity prices, among others. Under this scenario, Brazil would be among the least affected economies by the financial crisis in Europe.
Strong (between -2,5 and -2,0)
Very strong (<-2,5)
Limited (between -1,5 and 0,0)
Moderated (between -2,0 and -1,5)

Ministry of Finance
December Edition | Year 2012
117
International Overview
GDP Growth: Advanced and Emerging Economies (% YoY)
Data: % change from preceding year
* WEO October 2012
Source: IMFProduced by: Ministry of Finance
Global Economy: slow recovery in the short-term scenario
Due to the current financial crisis, the global economy will not be able to fully recover in all regions at the same time. In the next two years, the prospects for economic growth in Latin America, Emerging Asia and Africa are much more positive than in advanced economies, such as in Europe and Japan.
-10
-5
0
5
10
15
2014*
2013*
2012*2011
20102009
20082007
20062005
20042003
20022001
2000-10
-5
0
5
10
15
2014*
2013*
2012*2011
20102009
20082007
20062005
20042003
20022001
2000
7.5
4.1
5.5
2012 2013
Emerging Asia 6.7 7.2
Latin America 3.2 3.9
Sub Saharan Africa 5.0 5.7
2014
2012 2013
United States 2.2 2.1
Euro Area -0.4 0.2
Japan 2.2 1.2
2014
2.9
1.2
1.1

Ministry of Finance
December Edition | Year 2012
118
International Overview
Eurozone GDP Growth (% QoQ)
Data: % change from preceding quarter
Source: BCEProduced by: Ministry of Finance
Recession in the Eurozone
Since the fourth quarter of 2011, quarter-over-quarter economic growth in the Eurozone has been zero or below. In third quarter of 2012, the Eurozone economy shrank for a second consecutive quarter, falling by 0.1% over the previous one. European leaders are still struggling to find a consistent solution in order to put the region back on track.
-0.6
-0.4
-0.2
0.0
0.2
0.4
0.60.8
1.0
1.2
3 Q 2012
2 Q 2012
1 Q 2012
4 Q 2011
3 Q 2011
2 Q 2011
1 Q 2011
4 Q 2010
3 Q 2010
2 Q 2010
1 Q 2010
0.5
1.0
0.40.3
0.6
0.20.1
-0.3
0.0
-0.2-0.1

Ministry of Finance
December Edition | Year 2012
119
International Overview
G20 and Europe: Gross Public Debt (% of GDP)
G20 countries G20 European countries Eurozone members
Data: % of GDP
* WEO October 2012 forecasts
Source: IMFProduced by: Ministry of Finance
Public debt in Europe is still a concern
The current economic crisis is deeply related to the high level of debt over GDP in countries such as Italy, Ireland and Portugal. The projections for 2012 show that these three countries have debt-to-GDP ratio above 110%. The Greek situation is even worse, as its debt-to-GDP ratio is 170%. The US and Japan debt levels have increased as well.
2007 2012*
Argentina 67,09 45,22 Australia 9,71 27,07 Brazil 65,19 64,08 Canada 66,52 87,52 China 19,59 22,16 India 75,46 67,59 Indonésia 35,05 23,90 Japan 183,01 236,56 Mexico 37,56 43,08 Russia 8,51 11,03 South Africa 28,29 41,25 South Korea 30,66 33,46 Turkey 39,92 37,70 UK 67,16 107,18 USA 66,43 93,62
2007 2012*
France 64,22 89,97
Germany 65,36 83,04
Italy 103,08 126,33
UK 43,71 88,68
Belgium 84,01 99,03
Greece 107,45 170,73
Ireland 24,99 117,74
Netherlands 45,30 68,20
Poland 44,99 55,10
Portugal 68,27 119,07
Spain 36,30 90,69
Sweden 39,73 37,15
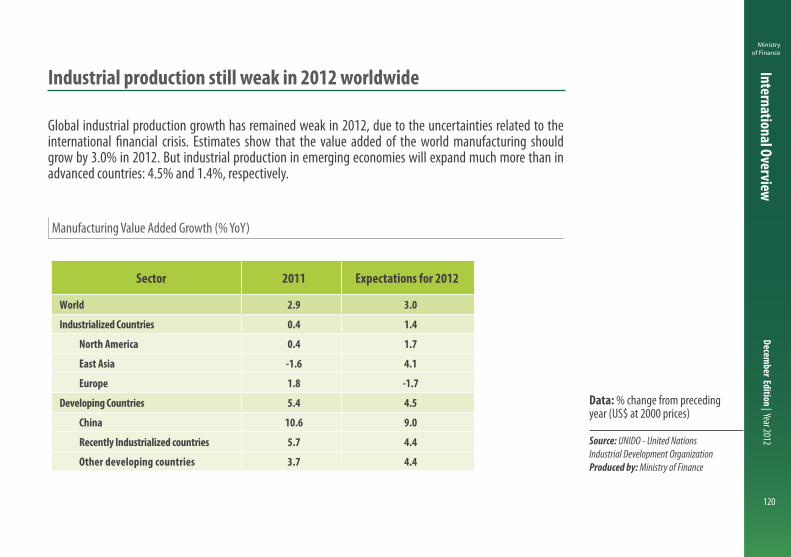
Ministry of Finance
December Edition | Year 2012
120
International Overview
Manufacturing Value Added Growth (% YoY)
Data: % change from preceding year (US$ at 2000 prices)
Source: UNIDO - United Nations Industrial Development OrganizationProduced by: Ministry of Finance
Industrial production still weak in 2012 worldwide
Global industrial production growth has remained weak in 2012, due to the uncertainties related to the international financial crisis. Estimates show that the value added of the world manufacturing should grow by 3.0% in 2012. But industrial production in emerging economies will expand much more than in advanced countries: 4.5% and 1.4%, respectively.
Sector 2011 Expectations for 2012
World 2.9 3.0
Industrialized Countries 0.4 1.4
North America 0.4 1.7
East Asia -1.6 4.1
Europe 1.8 -1.7
Developing Countries 5.4 4.5
China 10.6 9.0
Recently Industrialized countries 5.7 4.4
Other developing countries 3.7 4.4
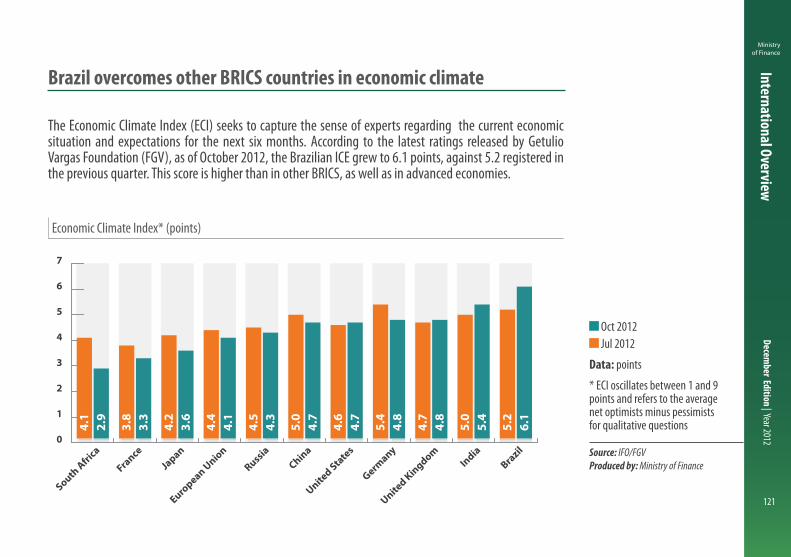
Ministry of Finance
December Edition | Year 2012
121
International Overview
Economic Climate Index* (points)
Oct 2012 Jul 2012
Data: points
* ECI oscillates between 1 and 9 points and refers to the average net optimists minus pessimists for qualitative questions
Source: IFO/FGVProduced by: Ministry of Finance
Brazil overcomes other BRICS countries in economic climate
The Economic Climate Index (ECI) seeks to capture the sense of experts regarding the current economic situation and expectations for the next six months. According to the latest ratings released by Getulio Vargas Foundation (FGV), as of October 2012, the Brazilian ICE grew to 6.1 points, against 5.2 registered in the previous quarter. This score is higher than in other BRICS, as well as in advanced economies.
0
1
2
3
4
5
6
7
Brazil
India
United Kingdom
Germany
United Sta
tes
China
Russia
European U
nionJa
pan
France
South Afri
ca
Oct 2012Jul 2012
2.9
3.3
3.6
4.1
4.3
4.7
4.7
4.8
4.8
5.4
6.1
4.1
3.8
4.2
4.4
4.5
5.0
4.6
5.4
4.7
5.0
5.2

Ministry of Finance
December Edition | Year 2012
122
International Overview
OECD Leading Indicator (points)
China Brazil USA Euro
Data: points
* The horizontal line at 100 represents the long-term trend of economic activity
Source: OCDEProduced by: Ministry of Finance
OECD leading indicator shows Brazilian recovery
The OECD leading indicator, which anticipates in six months the inflection of long-term trend of economic activity, continues to point to weak growth prospects in many major economies of the world, especially in the Eurozone. But there are already signs of improvement in countries like China and the US The prospects for Brazil point to a recovery in economic growth.
BrazilChina EuroUSA
92
94
96
98
100
102
104
20122011
20102009
20082007
20062005
20042003
200292
94
96
98
100
102
104
20122011
20102009
20082007
20062005
20042003
2002

Ministry of Finance
December Edition | Year 2012
123
International Overview
Unemployment Rate*: Brazil, Eurozone and the US (%, sa and nsa)
US (sa) Eurozone (sa) Brazil (nsa)
Data: %, Brazil data: not seasonally adjusted, United States and Eurozone data: seasonally adjusted
* Data up to October 2012, aside from Eurozone (September 2012)
Source: BloombergProduced by: Ministry of Finance
Unemployment rates dynamics in the US, Europe and Brazil
Unemployment rates have presented different dynamics in Brazil, US and Eurozone. In the U.S, the unemployment rate has been declining, but it is still above its historical average. In Europe, the poor performance of the labor market is a major concern. On the other hand, unemployment has fallen consistently in Brazil, reaching 5.3% in October 2012.
7.9
5.3
11.6
4
5
6
7
8
9
10
11
12
Oct 2012
Jul 2
012
Apr 2012
Jan 2007
Oct 2006
Jul 2
006
Apr 2006
Jan 2006
Oct 2005
Jul 2
005
Apr 2005
Jan 2005
Oct 2009
Jul 2
009
Apr 2009
Jan 2009
Oct 2008
Jul 2
008
Apr 2008
Jan 2008
Oct 2007
Jul 2
007
Apr 2007
Jan 2007
Oct 2006
Jul 2
006
Apr 2006
Jan 2006
Oct 2005
Jul 2
005
Apr 2005
Jan 2005
BrazilEurozoneUnited States
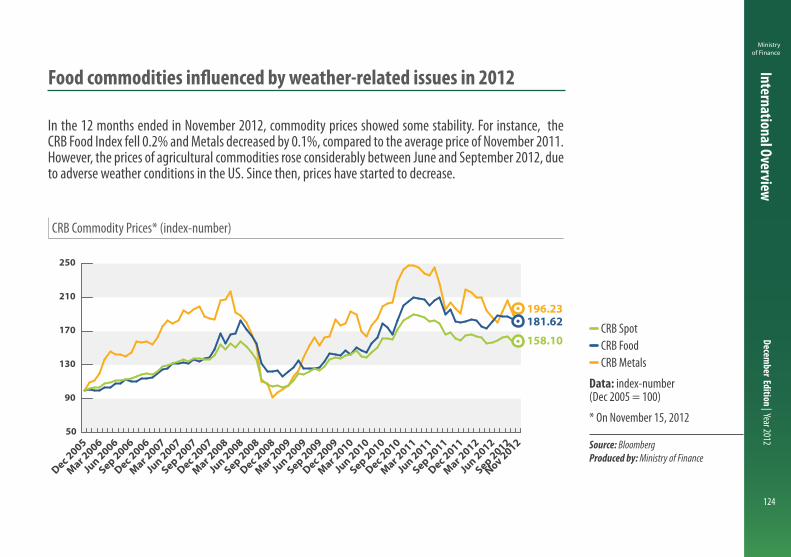
Ministry of Finance
December Edition | Year 2012
124
International Overview
CRB Commodity Prices* (index-number)
CRB Spot CRB Food CRB Metals
Data: index-number (Dec 2005 = 100)
* On November 15, 2012
Source: BloombergProduced by: Ministry of Finance
Food commodities influenced by weather-related issues in 2012
In the 12 months ended in November 2012, commodity prices showed some stability. For instance, the CRB Food Index fell 0.2% and Metals decreased by 0.1%, compared to the average price of November 2011. However, the prices of agricultural commodities rose considerably between June and September 2012, due to adverse weather conditions in the US. Since then, prices have started to decrease.
50
90
130
170
210
250
Nov 2012
Sep 2012
Jun 2012
Mar 2012
Dec 2011
Sep 2011
Jun 2011
Mar 2011
Dec 2010
Sep 2010
Jun 2010
Mar 2010
Dec 2009
Sep 2009
Jun 2009
Mar 2009
Dec 2008
Sep 2008
Jun 2008
Mar 2008
Dec 2007
Sep 2007
Jun 2007
Mar 2007
Dec 2006
Sep 2006
Jun 2006
Mar 2006
Dec 2005
196.23181.62
158.10
CRB Metals CRB Food CRB Spot
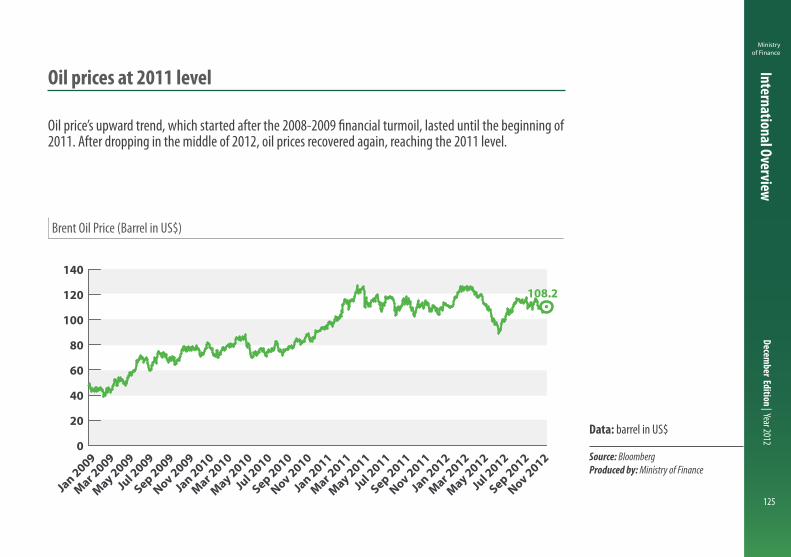
Ministry of Finance
December Edition | Year 2012
125
International Overview
Brent Oil Price (Barrel in US$)
Data: barrel in US$
Source: BloombergProduced by: Ministry of Finance
Oil prices at 2011 level
Oil price’s upward trend, which started after the 2008-2009 financial turmoil, lasted until the beginning of 2011. After dropping in the middle of 2012, oil prices recovered again, reaching the 2011 level.
0
20
40
60
80
100
120
140
Nov 2012
Sep 2012
Jul 2
012
May 2012
Mar 2012
Jan 2012
Nov 2011
Sep 2011
Jul 2
011
May 2011
Mar 2011
Jan 2011
Nov 2010
Sep 2010
Jul 2
010
May 2010
Mar 2010
Jan 2010
Nov 2009
Sep 2009
Jul 2
009
May 2009
Mar 2009
Jan 2009
108.2
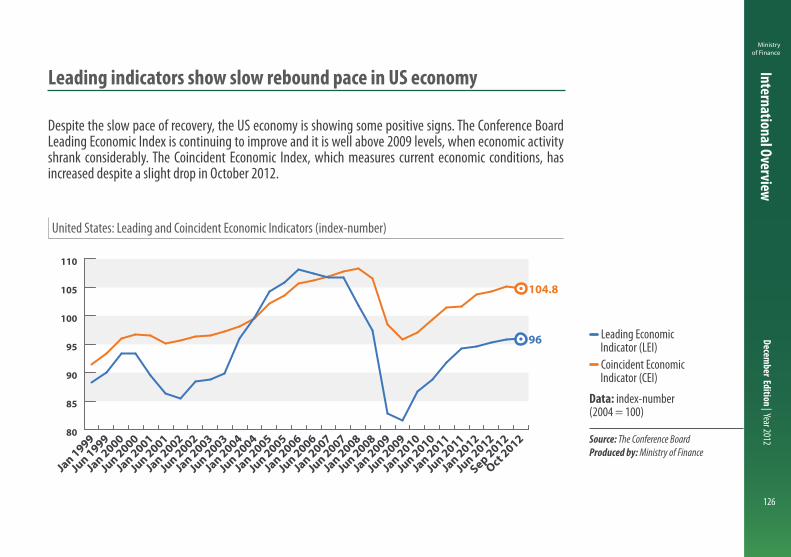
Ministry of Finance
December Edition | Year 2012
126
International Overview
United States: Leading and Coincident Economic Indicators (index-number)
Leading Economic Indicator (LEI) Coincident Economic Indicator (CEI)
Data: index-number (2004 = 100)
Source: The Conference BoardProduced by: Ministry of Finance
Leading indicators show slow rebound pace in US economy
Despite the slow pace of recovery, the US economy is showing some positive signs. The Conference Board Leading Economic Index is continuing to improve and it is well above 2009 levels, when economic activity shrank considerably. The Coincident Economic Index, which measures current economic conditions, has increased despite a slight drop in October 2012.
80
85
90
95
100
105
110
Oct 2012
Sep 2012
Jun 2012
Jan 2012
Jun 2011
Jan 2011
Jun 2010
Jan 2010
Jun 2009
Jan 2009
Jun 2008
Jan 2008
Jun 2007
Jan 2007
Jun 2006
Jan 2006
Jun 2005
Jan 2005
Jun 2004
Jan 2004
Jun 2003
Jan 2003
Jun 2002
Jan 2002
Jun 2001
Jan 2001
Jun 2000
Jan 2000
Jun 1999
Jan 1999
104.8
96
Coincident Economic Indicator (CEI)Leading Economic Indicator (LEI)
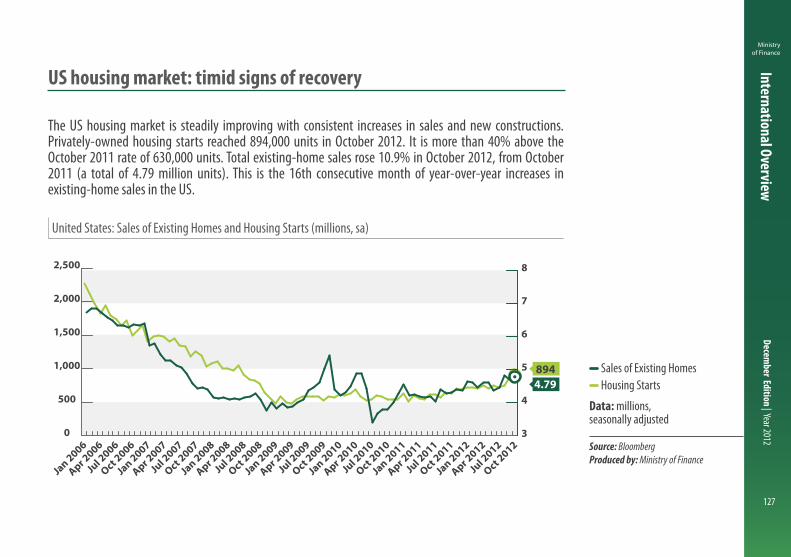
Ministry of Finance
December Edition | Year 2012
127
International Overview
United States: Sales of Existing Homes and Housing Starts (millions, sa)
Sales of Existing Homes Housing Starts
Data: millions, seasonally adjusted
Source: BloombergProduced by: Ministry of Finance
US housing market: timid signs of recovery
The US housing market is steadily improving with consistent increases in sales and new constructions. Privately-owned housing starts reached 894,000 units in October 2012. It is more than 40% above the October 2011 rate of 630,000 units. Total existing-home sales rose 10.9% in October 2012, from October 2011 (a total of 4.79 million units). This is the 16th consecutive month of year-over-year increases in existing-home sales in the US.
0
500
1,000
1,500
2,000
2,500
Oct 2012
Jul 2
012
Apr 2012
Jan 2012
Oct 2011
Jul 2
011
Apr 2011
Jan 2011
Oct 2010
Jul 2
010
Apr 2010
Jan 2010
Oct 2009
Jul 2
009
Apr 2009
Jan 2009
Oct 2008
Jul 2
008
Apr 2008
Jan 2008
Oct 2007
Jul 2
007
Apr 2007
Jan 2007
Oct 2006
Jul 2
006
Apr 2006
Jan 2006
Housing StartsSales of Existing Homes
4.79894
3
4
5
6
7
8

Ministry of Finance
December Edition | Year 2012
128
International Overview
United States: Government Revenue and Expenditure, Debt and GDP (US$ trillion)
Expenditure Revenue Debt GDP
Data: US$ trillion
* Fiscal data are Government expectations. Public debt: October 2012
Source: US Official Press and BloombergProduced by: Ministry of Finance
US public debt is now higher than annual GDP
The fiscal results in the show that, over the last years, revenues have decreased and expenses increased, either due to the economic crisis or to political decisions. The US public debt has reached US$ 16 trillion (higher than GDP), meaning that the country’s fiscal trajectory must be reversed. But a tighter fiscal squeeze could lead the country to recession, with repercussions on the rest of the world.
0.00.5
1.0
1.5
2.02.5
3.0
3.5
4.0
2012*2011
20102009
20082007
20062005
20042003
20022001
20000
2
4
6
8
1012
14
16
18
2012*2011
20102009
20082007
20062005
20042003
20022001
2000
Japão
ExpenditureRevenue
3.5
2.4
9.9
10.3
10.6
11.1
11.8
12.6
13.4
14.0
14.3
14.0
14.5
15.1
15.6
5.7
5.9
6.4
7.0
7.6
8.2
8.7
9.2
10.7
12.3
14.0
15.2
16.3
USA GDPUSA Debt Level
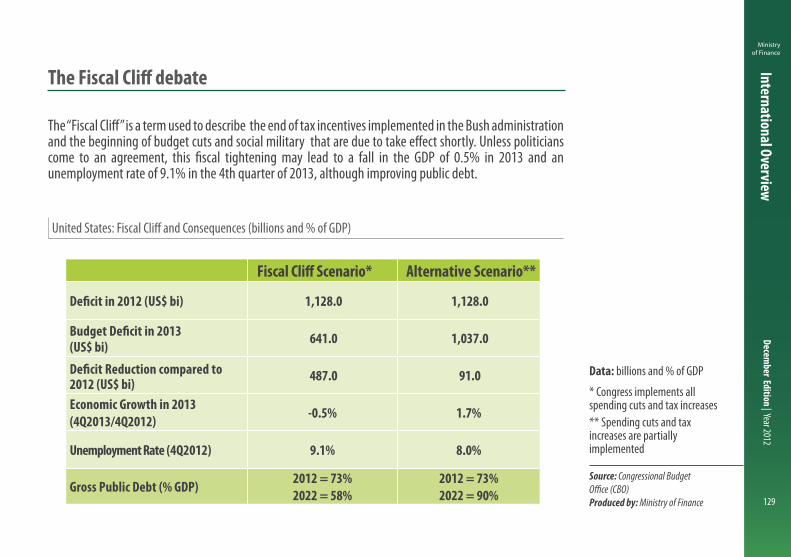
Ministry of Finance
December Edition | Year 2012
129
International Overview
United States: Fiscal Cliff and Consequences (billions and % of GDP)
Data: billions and % of GDP
* Congress implements all spending cuts and tax increases ** Spending cuts and tax increases are partially implemented
Source: Congressional Budget Office (CBO)Produced by: Ministry of Finance
The Fiscal Cliff debate
The “Fiscal Cliff” is a term used to describe the end of tax incentives implemented in the Bush administration and the beginning of budget cuts and social military that are due to take effect shortly. Unless politicians come to an agreement, this fiscal tightening may lead to a fall in the GDP of 0.5% in 2013 and an unemployment rate of 9.1% in the 4th quarter of 2013, although improving public debt.
Fiscal Cli� Scenario* Alternative Scenario**
1,128.0 1,128.0
(US$ bi) 641.0 1,037.0
2012 (US$ bi) 487.0 91.0
Economic Growth in 2013 (4Q2013/4Q2012) -0.5% 1.7%
Unemployment Rate (4Q2012) 9.1% 8.0%
Gross Public Debt (% GDP) 2012 = 73% 2022 = 58%
2012 = 73%2022 = 90%
De�cit Reduction compared to
Budget De�cit in 2013
De�cit in 2012 (US$ bi)

Ministry of Finance
December Edition | Year 2012
130
International Overview
Possible Scenarios of Economic Slowdown in Different Regions (pp)
Data: percentage point
Source: IMFProduced by: Ministry of Finance
Global effects of the crisis in the US and Europe
The economic problems facing the Eurozone are already having important consequences in various regions of the world. The US fiscal debate tends to add more uncertainty in the global economy. It is expected Latin America be less affected by those aspects.
-7
-6
-5
-4
-3
-2
-1
0
Latin Americ
a
Emerging Asia
Japan
Other c
ountries
USAWorld
Central E
urozone
Periphera
l Euro
zone-2.0
-1.8
-1.6
-1.4
-1.2
-1.0
-0.8
-0.6
-0.4
-0.2
0.0
Latin Americ
a
Emerging Asia
Japan
Other c
ountries
USAWorld
Central E
urozone
Periphera
l Euro
zone
Eurozone depression scenario
(Fall in GDP, 2013 base scenariopercentage deviation)
(Fall in GDP, 2013 base scenariopercentage deviation)
USA �scal crisis
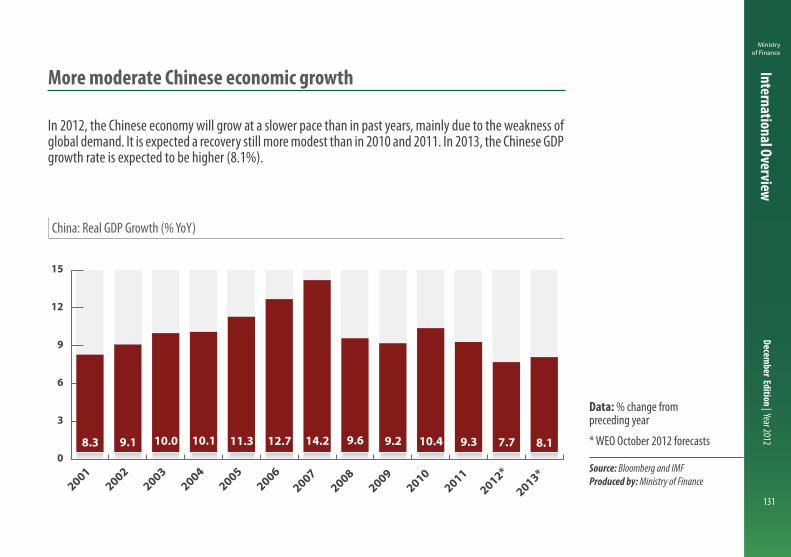
Ministry of Finance
December Edition | Year 2012
131
International Overview
China: Real GDP Growth (% YoY)
Data: % change from preceding year
* WEO October 2012 forecasts
Source: Bloomberg and IMFProduced by: Ministry of Finance
More moderate Chinese economic growth
In 2012, the Chinese economy will grow at a slower pace than in past years, mainly due to the weakness of global demand. It is expected a recovery still more modest than in 2010 and 2011. In 2013, the Chinese GDP growth rate is expected to be higher (8.1%).
0
3
6
9
12
15
2013*
2012*2011
2010
2009
2008
2007 2006
20052004
20032002
2001
8.3 9.1 10.0 10.1 11.3 12.7 14.2 9.6 9.2 10.4 9.3 7.7 8.1

Ministry of Finance
December Edition | Year 2012
132
International Overview
China: Confidence Indexes (index)
Business Confidence Index Real Estate Confidence Index
Data: index
Source: BloombergProduced by: Ministry of Finance
Confidence indexes shows China cooling off
Chinese confidence indices have been trending downwards since mid-2011, due to greater economic uncertainty. The result is a less buoyant economic activity, as shown by the GDP growth, which is expected to reach 7.7% in 2012, having already reached much higher growth rates in the recent past.
90.2
82.9
60
65
70
75
80
85
90
95
100
105
Sep 2012
Jun 2012
Mar 2012
Dec 2011
Sep 2011
Jun 2011
Mar 2011
Dec 2010
Sep 2010
Mar 2010
Dec 2009
Sep 2009
Jun 2009
Mar 2009
Dec 2008
Sep 2008
Sep 2008
Jun 2008
Mar 2008
Real Estate Con�dence Index Business Con�dence Index
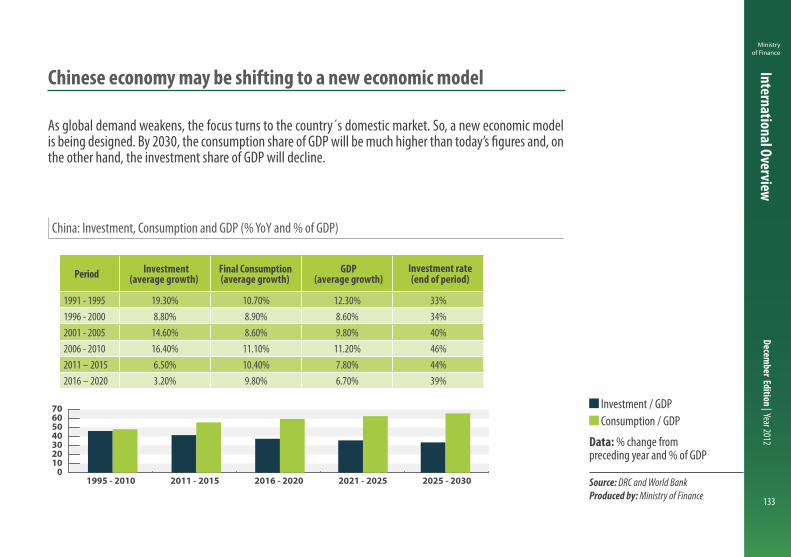
Ministry of Finance
December Edition | Year 2012
133
International Overview
China: Investment, Consumption and GDP (% YoY and % of GDP)
Investment / GDP Consumption / GDP
Data: % change from preceding year and % of GDP
Source: DRC and World BankProduced by: Ministry of Finance
Chinese economy may be shifting to a new economic model
As global demand weakens, the focus turns to the country´s domestic market. So, a new economic model is being designed. By 2030, the consumption share of GDP will be much higher than today’s figures and, on the other hand, the investment share of GDP will decline.
Period Investment(average growth)
Final Consumption(average growth)
GDP(average growth)
Investment rate
1991 - 1995 19.30% 10.70% 12.30% 33%1996 - 2000 8.80% 8.90% 8.60% 34%2001 - 2005 14.60% 8.60% 9.80% 40%2006 - 2010 16.40% 11.10% 11.20% 46%2011 – 2015 6.50% 10.40% 7.80% 44%2016 – 2020 3.20% 9.80% 6.70% 39%
010203040506070
2025 - 20302021 - 20252016 - 20202011 - 20151995 - 2010
(end of period)

Ministry of Finance
December Edition | Year 2012
135
Glossary - Institutions
BCE European Central Bank
BIS Bank for International Settlements
BLS Bureau of Labor Statistics
BNDES National Bank of Economic and Social Development
BoE Bank of England
BoJ Bank of Japan
CAGED General File of the Employed and Unemployed
CBO Congressional Budget Office
Cetip Custody and Settlement Chamber
CNC National Confederation of Commerce Brazil
CNI National Confederation of Industry
Conab National Company of Food Supply
CVM Securities and Exchange Commission of Brazil
ECB European Central Bank
EU European Union
FAO Food and Agriculture Organization
Fed Federal Service
FGTS Employment Security Fund
FGV Getulio Vargas Foundation
FIESP Federation of Industries from São Paulo State
GfK German Society for Consumer Research
IBGE Brazilian Institute of Geography and Statistics
IFS International Financial Statistics
IMF International Monetary Fund
IPEA Institute for Applied Economic Research
MAPA Ministry of Agriculture, Cattle and Food Supply
MDS Ministry of Social Development and Fight against Hunger
MTE Ministry of Labor and Employment
OCDE Organisation for Economic Co-operation and Development
OECD Organisation for Economic Co-operation and Development
RAIS Annual Social Information Relation
STN Brazilian National Treasury Secretariat
UNCTAD Conference on Trade and Development
UNIDO United Nations Industrial Development Organization

Ministry of Finance
December Edition | Year 2012
136
Glossary - Terms
CDA Multi-market Investment Fund
CEI Coincident Economic Indicator
CRI Certificate of Real Estate Receivables
DI Interbank Deposits
DLSP Public Sector Net Debt
DXY US Dollar Index
ECI Economic Climate Index
FDI Foreign Direct Investment
FDP Federal Public Debt
FIDC Investment Fund in Credit Rights
FII Real Estate Investment Fund
FIP Share Investment Fund
FOMC Federal Open Market Committee
FSB Sovereign Wealth Fund
GFCF Gross Fixed Capital Formation
IGP-DI General Price Index - Domestic Supply / FGV
IGP-M General Price Index - Market / FGV
INCC National Construction Cost Index / FGV
INPC National Consumer Price Index /IBGE
IOF Financial Operation Tax
IPA Wholesale Price Index /IBGE
IPC Consumer Price Index /IBGE
IPCA Broad National Consumer Price Index / IBGE
IPI Industrialized Products Tax
LCI Real Estate Credit Letter/Bill
LEI Leading Economic Indicator
LTRO Long Term Refinancing Operations
MCMV "Minha Casa Minha Vida" Housing Program
PAC Growth Acceleration Program
PEA Economically Active Population
PLOA Annual Budgetary Law
PMC Monthly Retail Sale Survey / IBGE
PMI Purchasing Managers Index
PNAD National Survey by Household Sample / IBGE
SEDA New Sustainable Economic Development Assessment
SELIC Special System for Settlement and Custody
VIX Chicago Board Options Exchange Market Volatility Index
WEO World Economic Outlook
YTD year-to-date
Ministry of Finance
December Edition | Year 2012
137
Ministry ofFinance
B R A Z I L I A N G O V E R N M E N T
Presidente da República: Dilma Vana RousseffMinistro da Fazenda: Guido MantegaSecretário Executivo: Nelson BarbosaSecretário de Política Econômica: Márcio Holland Chefe de Gabinete do Ministro: Marcelo Fiche
Production and ExecutionEconomic Policy Secretariat
Editorial BoardAndré MinellaCleomar GomesFabio Graner José Gilberto Scandiucci FilhoLígia Ourives
Technical SupportAdvisory on Economic Affairs to the Minister of FinanceSocial Communication Advisory - ACSInternational Affairs Secretariat - SAINSecretariat for Economic Monitoring - SEAENational Treasury Secretariat - STNFederal Service of Data Processing - SERPRO
Finished in December 6th, 2012
ArtVisual Project and Final Art: Viviane BarrosCover: André Nóbrega Layout Development: Alline Luz and Letícia LopesDesign Trainee: Barbara Vonne
www.fazenda.gov.br Available at: http://www.fazenda.gov.br/ebp