2020 Brazil Strategy Outlook...Dec 16, 2019 · − Allocations to Brazilian equities, both by...
221
1 2020 Brazil Strategy Outlook Carlos E. Sequeira, CFA [email protected] +1 646 924-2479 Osni Carfi [email protected] +55 11 3383-2634
Transcript of 2020 Brazil Strategy Outlook...Dec 16, 2019 · − Allocations to Brazilian equities, both by...

1
2020 Brazil Strategy Outlook
Carlos E. Sequeira, CFA
+1 646 924-2479
Osni Carfi
+55 11 3383-2634

December 2019
2020 Brazil Equity Strategy Outlook
Economic growth to drive markets in 2020
LEGAL DISCLAIMERS & DISCLOSURES:
www.btgpactual.com/research/Disclaimers/Overview.aspx
Carlos E. Sequeira, CFA
+1 646 924-2479
Osni Carfi
+55 11 3383-2634

3
We expect Brazilian equities to continue its run in 2020
✓Economic recovery to drive equities further up
– We expect Brazilian equities to continue its run in 2020, after performing strongly for four years in a row – the Ibovespa is up 147% in BRL
from 2016 to 2019.
– Even though the performance has been strong, we anticipate the next leg of the rally to be just starting and to be supported by an
accelerated economic recovery.
– At this point, signs that the economy is picking up are evident. We expect investments and household consumption to be the main drivers of
economic growth in 2020, fueled by employment growth, credit expansion and another round of economic reforms.
✓A new round of economic reforms are expected in 2020
– In 2019, the government and congress focused its efforts to approve a much waited and essential reform of Brazil’s pension system – with
savings estimated at R$800bn in the next 10 years.
– For 2020, the administration and congress are already working on a series of additional constitutional amendments aiming at consolidating
Brazil’s fiscal accounts and overhauling the country’s public administration.
– The reform agenda also includes a sorely-needed, but tough to implement tax reform. More than reducing the tax burden, the tax reform
proposals focus on simplifying Brazil’s extremely complex tax system ultimately boosting companies’ productivity.
✓Domestic-companies’ earnings to grow 18% in 2020
− We estimate earnings of companies that sell basically domestically to grow 18% in 2020.
✓Brazilians stocks are under-owned by locals and foreigners
− Allocations to Brazilian equities, both by foreign and local investors, are at quite reduced levels. Increased flows to Brazilian equities have
the potential to drive valuations further up.

4
Valuations are relatively attractive
✓The Ibovespa is now trading at 13.8x 12-month forward P/E, somewhat above its historical average
− Some may argue that the Ibovespa has moved up too much in recent months. It is indeed trading somewhat above its historical average
(13.8x vs. 12.6x 12-month forward P/E), but now the scenario is different.
− Brazil’s historical valuation levels were built in a scenario of much higher real interest rates. In our view, sustainable, lower-than-historical
real interest rates should translate into higher-than-historical valuation levels.
− Long-term real interest rates were at 5.9% before the elections and have since plummeted to 3% on expectations of structural changes.
− We believe that under this scenario of structural low long-term interest rates, the Ibovespa could quickly trade at one-standard deviation
above average. Using our 12-month forward earnings, this puts the index at ~118k points.
Brazil’s 12-month forward P/E
Source: Economática, BTG Pactual estimates
13.8
7x
9x
11x
13x
15x
17x
19x
Jun-
07O
ct-0
7Fe
b-08
Jun-
08O
ct-0
8Fe
b-09
Jun-
09O
ct-0
9Fe
b-10
Jun-
10O
ct-1
0Fe
b-11
Jun-
11O
ct-1
1Fe
b-12
Jun-
12O
ct-1
2Fe
b-13
Jun-
13O
ct-1
3Fe
b-14
Jun-
14O
ct-1
4Fe
b-15
Jun-
15O
ct-1
5Fe
b-16
Jun-
16O
ct-1
6Fe
b-17
Jun-
17O
ct-1
7Fe
b-18
Jun-
18O
ct-1
8Fe
b-19
Jun-
19O
ct-1
9
Average +1 Std Dev -1 Std Dev P/E 12MF (ex-Petro & Vale)

5
Premium to hold equities at historical high levels
✓Equity Risk Premium soared after strong decline in long-term real rates
− Earnings yield, i.e. the inverse of the P/E (Earnings / market cap) minus ten-year real interest rates, is above one-standard deviation above
its historical average, suggesting room for stock prices to move up further and bring the yield back to average.
− At one-standard above average (earnings yield of 3.2%), the Ibovespa would have to go up to 122k points. To go back to historical average
(2.2% earnings yield), the Ibovespa would have to go up to 147k points.
Earnings yield (E/P minus 10-year interest rates)
Source: Bloomberg, Tesouro Direto, BTG Pactual estimates
4.5
2.2%
0%
1%
1%
2%
2%
3%
3%
4%
4%
5%
5%
Jan-
11
May
-11
Sep
-11
Jan-
12
May
-12
Sep
-12
Jan-
13
May
-13
Sep
-13
Jan-
14
May
-14
Sep
-14
Jan-
15
May
-15
Sep
-15
Jan-
16
May
-16
Sep
-16
Jan-
17
May
-17
Sep
-17
Jan-
18
May
-18
Sep
-18
Jan-
19
May
-19
Sep
-19
Real Earnings Yield (Ex-Petro & Vale) AVERAGE +1 Std Dev -1 Std Dev

6
Long-term real interest rates falling fast
✓Long-term real rates have fallen consistently since the election of President Bolsonaro.
Brazil’s long-term real interest rates (NTN-B 2024/2035)
3.0%2.5%
3.5%
4.5%
5.5%
6.5%
7.5%
8.5%
Feb
-15
Ap
r-1
5
Jun
-15
Au
g-1
5
Oct
-15
De
c-1
5
Feb
-16
Ap
r-1
6
Jun
-16
Au
g-1
6
Oct
-16
De
c-1
6
Feb
-17
Ap
r-1
7
Jun
-17
Au
g-1
7
Oct
-17
De
c-1
7
Feb
-18
Ap
r-1
8
Jun
-18
Au
g-1
8
Oct
-18
De
c-1
8
Feb
-19
Ap
r-1
9
Jun
-19
Au
g-1
9
Oct
-19

7
Earnings should continue to grow nicely in 2020
✓We are modeling for 2020 domestic earnings to grow 18% y/y
– Another round of interest rate cuts (200bps in 2019), deleveraging and a faster growing economy should drive the next leg of earnings
expansion.
✓Consolidated earnings (ex-Petro & Vale) expected to grow 20% in 2020
– Consolidated earnings ex-Petro & Vale, but including commodity exporters, are set to grow 20.2% y/y in 2020.
Domestic companies’ earnings growth
Source: BTG Pactual estimates
2015 2016 2017 2018 2019E 2020E
Net revenues 741,042 805,257 842,760 936,887 1,025,458 1,118,212
Growth 8.7% 4.7% 11.2% 9.5% 9.0%
Net income 113,764 114,377 123,629 145,107 173,627 205,449
Growth 0.5% 8.1% 17.4% 19.7% 18.3%
Consolidated earnings and revenue growth (ex-Petro & Vale)
Source: BTG Pactual estimates
2015 2016 2017 2018 2019E 2020E
Net revenues 1,050,672 1,104,853 1,150,165 1,302,566 1,410,752 1,522,607
Growth 5.2% 4.1% 13.3% 8.3% 7.9%
Net income 107,540 116,190 130,812 163,145 184,877 222,205
Growth 8.0% 12.6% 24.7% 13.3% 20.2%

8
Brazilian equities are under-owned
✓Allocations to equities by locals should continue to grow; Foreigners remain a question mark
✓ Local investors have been continuously and consistently increasing allocations to Brazilian equities. At the end of October, equity allocation
by local investors reached 12.5%, from 8.9% in August 2018. Despite the increase, allocation levels are still below the average of 14% from
2011 to 2014 (pre-recession) and way below 2007’s 22% peak.
✓ With interest rates at historically low levels, we expect locals to continue to increase the share of their portfolios invested in equities in 2020.
✓ Foreign investors, though, have been way more cautious. Since President Bolsonaro’s election, and reflecting a global risk-off mode, they
have not increased their exposure to Brazilian equities much.
✓ Stronger economic growth could finally drive foreign flows to Brazil, but the situation of global markets will be important to define foreigners’
appetite for emerging markets’ exposure.
Local investors’ allocation
Allocation of global and GEM-weighted funds
Source: Anbima Source: EPFR
97 88 80 99 113 133 221362
224 334 356 311 321 331 303 255 278 330 431 586
854 893717
940 9811,167
1,4201,651
1,500 1,858
1,950
2,104
2,2462,362
2,5572,803
3,269
3,776
4,182
4,672
11.3%
9.9%
11.1%
10.6% 11.6%11.4%
15.5%
22.0%
14.9%
18.0% 18.3%
14.8%
14.3% 14.0%
11.9%9.1%
8.5%
8.7%
10.3%
12.5%
0%
5%
10%
15%
20%
25%
0
500
1000
1500
2000
2500
3000
3500
4000
4500
5000
2000 2001 2002 2003 2004 2005 2006 2007 2008 2009 2010 2011 2012 2013 2014 2015 2016 2017 2018 Oct-19
Eq
uity
Sh
are
of
Mu
tua
l F
un
ds,
Se
lic R
ate
(%
)
Au
M (
R$
bn
)
Fixed Income AuM (R$bn) Equity AuM (R$bn) Equity Share End of Period Selic Rate
G.E.M. Global
Dec-09 16.7% 2.40%
Dec-10 15.9% 1.97%
Dec-11 16.4% 2.24%
Dec-12 11.9% 1.31%
Dec-13 11.0% 1.07%
Dec-14 9.1% 1.07%
Dec-15 6.0% 0.52%
Dec-16 8.6% 0.93%
Dec-17 7.2% 0.60%
Jun-18 6.0% 0.42%
Dec-18 8.0% 0.58%
Mar-19 7.6% 0.46%
May-19 8.2% 0.48%
Jul-19 8.7% 0.51%
Sep-19 8.4% 0.51%
Oct-19 8.5% 0.47%
Allocation into Brazilian equities

9
Economic recovery to drive Brazilian equities further up
✓Economic activity Heat Map shows the recovery is under way
− Our Macroeconomic team built a tool that brings together all indicators, simplifying assessments of the true state of Brazil’s economy. The proposal is a simple approach based
on a combination of the visual resource of heat maps and a univariate analysis between each economic activity indicator and GDP.
− We can conclude that employment growth, retail sales, and the auto industry are already pointing to higher GDP growth rates. On the other hand, capacity utilization, the
construction sector, and the services sector are still indicating low levels of GDP growth.
Dec-18 Jan-19 Feb-19 Mar-19 Apr-19 May-19 Jun-19 Jul-19 Aug-19 Sep-19 Oct-19 Nov-19
Employment growth (IBGE) 2.0% 1.8% 1.7% 2.0% 2.5% 3.0% 3.4% 3.5% 3.3% 2.8% 2.5%
Supermarket sales (ABRAS) 2.5% 2.6% 2.3% 1.4% 1.6% 1.6% 2.5% 2.4% 3.0% 2.9%
Heavy vehicles traffic (ABCR) 2.2% 2.3% 3.4% 2.7% 2.1% 6.2% 5.4% 6.0% 0.7% 2.8% 3.1%
Auto sales (Fenabrave) 3.8% 3.3% 3.8% 3.5% 3.3% 3.1% 3.5% 3.7% 2.6% 2.7% 2.3% 2.8%
New payroll jobs (CAGED) 2.6% 2.2% 2.4% 1.5% 1.7% 0.9% 1.6% 1.7% 2.2% 2.4% 2.7%
Construction supplies (IBGE) 1.7% 1.2% 2.0% 1.9% 1.9% 2.9% 3.0% 3.2% 1.6% 2.2% 2.0%
Auto production (Anfavea) 1.1% 0.6% 1.5% 1.8% 2.1% 2.4% 2.5% 2.8% 1.5% 2.2% 2.2%
Broad retail sales (IBGE) 2.2% 2.0% 1.6% 1.6% 1.2% 1.9% 2.1% 2.8% 2.0% 1.9%
Manufacturing production (IBGE) 1.1% 0.6% 1.4% 1.3% 1.6% 2.8% 2.8% 2.7% 0.7% 1.6% 2.3%
Core retail sales (IBGE) 1.7% 1.7% 1.4% 1.3% 0.9% 0.7% 0.7% 1.4% 1.4% 1.6%
Industrial production (IBGE) 1.3% 0.8% 1.3% 0.9% 0.6% 1.5% 1.6% 1.7% 0.3% 1.4% 2.0%
Household credit growth (CB) -0.2% 0.0% 0.3% 0.4% 0.4% 0.4% 0.4% 0.7% 1.0% 1.2% 1.4%
Cardboard expedition (ABPO) 1.2% 0.4% 0.9% 0.6% 1.0% 4.4% 2.4% 2.2% -1.8% 0.9% 1.3%
Real wage bill growth (IBGE) 1.4% 1.5% 1.6% 1.7% 1.7% 1.5% 1.3% 1.2% 1.0% 0.9% 1.0%
Real wage growth (IBGE) 1.5% 1.6% 1.8% 1.7% 1.5% 1.1% 0.8% 0.7% 0.7% 0.8% 1.0%
Mining production (IBGE) 2.5% 2.4% 1.6% 0.1% -2.0% -2.5% -2.6% -1.5% -0.3% 0.6% 0.8%
Services output (IBGE) 0.8% 0.8% 1.3% 0.8% 0.3% 0.5% 0.3% 0.8% -0.3% 0.6%
Corporate credit growth (CB) 0.3% 0.4% 0.5% 0.5% 0.5% 0.4% 0.3% 0.2% 0.2% 0.3% 0.3%
Source: IBGE, FGV, Central Bank, Fenabrave, Anfavea, ABRAS, ABCR, ABPO and BTG Pactual
Brazil economic activity heat map (hard data)

10
A new round of economic reforms are expected in 2020
✓With the pension reform approved, the government is ready to move forward with its reform
agenda.
✓Some of them will continue the efforts to improve Brazil’s fiscal accounts, including:
➢ i) The administrative reform: Payroll expenses is the second largest federal government expense line (22% of total).
The goal of the administrative reform is to: i) restructure civil servants’ careers; ii) reduce starting salaries to levels
compatible with the private sector; iii) lengthen salary progression and end with automatic promotions based on time of
service; and iv) end job stability, except for specific careers like diplomats and auditors.
➢ The new rules would apply only to new civil servants, which would make it a lot easier to approve in congress. That said, 49% of all civil
servants are expected to retire by 2026, creating a unique opportunity to implement a big change in public administration.
➢ The speaker of the House has said the administrative reform is his number 1 priority. President Bolsonaro also said this should be
congress’ top priority.
➢ ii) Changes to the Golden Rule: Proposes changing tax rules by curbing mandatory expenditures and creating triggers
that would help comply with the rule. The PEC prevents a shutdown of the State apparatus by activating triggers such
as authorization to reduce the number of working hours of civil servants (with a proportional decrease in remuneration)
and charging a supplementary social security contribution of 3pp for civil servants (active, retirees and pensioners). The
changes should give flexibility to manage the government’s budget and are expected to free up to R$102bn in
mandatory expenses in a period of 12 months.
➢ iii) New federative pact: The goal is to redesign rights and obligations of the federal government, states and
municipalities, with the federal government transferring more resources to state and municipalities.
➢ The redesign will be done via approval of a series of legislation (some already approved), including: i) transfer of funds to states and
municipalities related to the upcoming transfer-of-rights oil auction (already approved, PL5479/19); ii) higher transfer of resources from
the social fund (constituted with resources from Oil&Gas exploration) to states and municipalities; iii) extension of the term to pay debt
related to court decisions (PEC dos Precatórios / PEC95/19), which was already approved in the Senate and has now moved to the
Lower House; and iv) Plano Mansueto (PL149/19), which allows for lower credit rating states and municipalities to issue new debt
guaranteed by the federal government, under certain conditions.
✓ The reform agenda also includes a sorely-needed, but tough to implement, tax reform.

11
Brighter outlook for Brazil’s fiscal accounts
✓Our macroeconomic team is more optimistic on the evolution of Brazil’s fiscal accounts
− We now expect the primary deficit for 2019 and 2020 to be R$60.7bn (0.8% of GDP) and R$96bn (1.2% of GDP), way less than what is in the budget
(primary deficits of R$132bn and R$119bn, respectively).
− Several reasons help explain these better prospects:
➢ i) additional revenues related to oil & gas concessions and dividend payments by state-owned companies;
➢ ii) lower personnel expenses (R$6bn already “recognized”, with the potential to deliver another >R$4bn);
➢ iii) lower inflation;
➢ iv) gains from reviewing/auditing some of the so-called “social” expenses;
➢ v) a much lower Selic interest rate, which is at record low levels, reducing financial expenses (positive impact on nominal deficit).
− In addition, Brazil’s expected economic recovery should also help improve tax revenues and reduce the fiscal deficit in the coming years. The approval of
additional reforms (like the administrative reform and changes to the Golden Rule) have the potential to consolidate the improvement in the fiscal
scenario.

12
Tax reform: Time to make things less complex
✓Many possible reforms show the complexity of the theme; new tax system to boost productivity
– The proposal being debated in the Lower House transforms five federal (PIS, Cofins and IPI), state (ICMS) and municipal (ISS) taxes into a
single VAT, called goods and services tax (IBS). The new tax would be regulated by complementary law and managed by a national
committee that would centralize and collect taxes and transfer them to the federal government, states and municipalities.
– However, it is far from clear if this proposal will prevail. Right now, there are 4-5 tax reform proposals being discussed. It is also unclear how
broad the reform will be. A relevant portion of the debate so far has been centered on taxation of goods and services, which account for just
over 40% of Brazil’s tax burden. However, we believe there is a good chance that changes to the taxation of income and profits (20% of the
overall tax burden) will also be proposed.
– The proposal in the Lower House is thorough and tackles most challenges of Brazil’s tax system. But as it affects more groups, including a
tough reorganization of state and municipal taxes, it may be tougher to pass. This is probably why the government has been indicating it
should send congress a simpler, less controversial, easier-to-approve reform. Lower House Speaker Rodrigo Maia has already pledged to
incorporate the government’s proposal into the debate once the government sends it to Congress.
– The sheer fact that there are a number of possible reforms under discussion indicates the complexity of the subject and suggests that the
debate may be long and that approval of a reform may take a while.
✓Changes to corporate taxes, tax on dividends and IOE are also likely
– The government proposal, besides simplifying federal taxes on sales, may also reduce tax on corporate earnings (IRPJ/CSLL) whilst taxing
dividends. The government’s goal is to lower production tax and raise capital gains tax. Measures alleviating low-income taxpayers whilst
raising taxes at the top of the pyramid are also possible.

13
Big infrastructure concessions and additional Oil&Gas auctions
✓The government raised R$96bn in the first 10 months of the new administration by selling a number of state-
controlled assets.
– Between selling subsidiaries of state-owned companies (most of them controlled by Petrobras, like TAG, BR Distribuidora, distribution
assets in Paraguay, and a refining business in the US) and minority stakes in listed companies, the government raised R$78.6bn this year.
– In addition, it auctioned concessions for the operation of 12 airport terminals, port terminals and railroad concessions that combined raised a
total of R$5.7bn. Lastly, the government sold some Oil&Gas camps that combined brought in a total of R$11.9bn.
– At this point, there is a list of 17 companies being prepared to be privatized, including some high-profile ones like the national post-office
company Correios (needs approval of a constitutional amendment authorizing the sale) and Eletrobras (needs approval of ordinary
legislation).
✓Additional Oil&Gas concession auctions to happen in 2020
– Leftovers from the November auction may be offered to the market in 2020.
✓ Big highway concessions scheduled for 2020; Several projects in other areas
– The Sao Paulo government is planning to auction a 30-year concession to operate 1,273Km of highway connecting Piracicaba to Panorama,
in the state of Sao Paulo. This is the largest concession auction ever in Brazil, with expected investments of R$14bn.
– Brazil’s Infrastructure Ministry plans to auction the concession to operate 8 highways spread across the country, with total investments
estimated to reach R$47bn. It expects to auction most of these projects in 2020.
– It is also working to auction the concession to operate 4 new railroads that combined could mean investments of more than R$20bn – in
March it auctioned the concession to operate the North-South railroad with expected investments of R$2.8bn.

14
Top Picks, by sector
✓Retail
ᅳ Lojas Renner
ᅳ Magazine Luiza
✓Financials, ex-banks
ᅳ B3
ᅳ Stone
✓Agribusiness
ᅳ São Martinho
✓Banks
ᅳ Bradesco
ᅳ Itau
✓Utilities
ᅳ Cemig
ᅳ CPFL
ᅳ Light
✓Oil & Gas
ᅳ Petrobras
ᅳ Cosan
✓Basic Materials
ᅳ Gerdau
ᅳ Suzano
✓Food & Beverage
ᅳ JBS
ᅳ Minerva
✓Healthcare & Education
ᅳ Cogna
ᅳ Hapvida
✓Transportation, Infra, Capital Goods
ᅳ Rumo
ᅳ Localiza
ᅳ CCR
✓Telecom, Media, Technology
ᅳ Totvs
ᅳ Sinqia
ᅳ Oi
✓Homebuilders
ᅳ Trisul
✓Malls & Properties
– BR Properties
– Aliansce Sonae

15
BTG Pactual’s December 10SIM
Company Ticker Weight (%) ADTV (R$m) Mkt Cap (R$m) PE 2019E
Itau Unibanco ITUB4 15% 728.5 315,387 12.9x
JBS JBSS3 10% 406.9 75,900 11.3x
Lojas Renner LREN3 10% 206.6 41,099 30.9x
RUMO RAIL3 10% 162.7 38,087 47.2x
CPFL CPFE3 10% 70.7 36,400 14.5x
Localiza RENT3 10% 241.6 32,410 33.7x
Gerdau GGBR4 10% 223.2 27,307 11.2x
Totvs TOTS3 10% 98.2 12,337 47.1x
BR Properties BRPR3 10% 28.0 6,280 27.0x
Oi S.A. OIBR3 5% 85.5 5,528 na.

16
BTG Pactual’s December Small Caps portfolio
Company Ticker Weight (%) ADTV (R$m) Mkt Cap (R$m) PE 2019E
São Martinho SMTO3 20% 15.9 7,291 22.6x
BR Properties BRPR3 20% 28.0 6,280 91.7x
CVC CVCB3 20% 138.4 5,921 26.0x
JSL JSLG3 20% 8.9 4,421 22.1x
Trisul TRIS3 20% 19.3 2,484 17.9x
17
Why we selected these stocks
✓ Itau
ᅳ We remain positive on Brazilian banking stocks since: i) we are at an inflection point for GDP growth; ii) bank stocks seem under-owned;
and iii) the decline in ROEs should be smooth and not as aggressive as many seem to believe. We see a credit growth rebound in Brazil
being led by the private sector, while a change in mix towards SMEs and individuals should drive NII acceleration and give some support to
fees.
✓ Totvs
ᅳ While we still consider an economic rebound the main top line driver for Totvs’ core business in the coming years, we are also confident in
the cross-selling potential of its CRM & Analytics platforms, as well as the success of its TechFin initiatives, which include: i) providing credit
services/products to SMEs; ii) offering financial services, such as payroll loans and paycheck advances, to employees (10mn people) of
companies using its HR solutions; iii) offering payment solutions to retail clients via partnerships with established acquirers; and iv) offering
financial solutions to students (3.5mn) and doctors (10,000).
✓ JBS
ᅳ We continue to have JBS as our Top Pick in the protein sector and believe it to be the best vehicle for exposure to the African swine fever
outbreak in China. After an 81% 6-month rally, valuations remain reasonable and the stock still trades at a discount to peers at 5.1x 2020
EBITDA, or 6.8x even if excluding the ASF impact, which is below fair mid-cycle multiples. That said, we note that the main source of upside
to JBS continues to rely on our belief that its longstanding corporate governance/management-related discount will gradually fade as
management team professionalizes, the company puts greater efforts to enhance corporate governance and pursues a more reasonable
capital structure and lower cost of debt.
✓ Oi
ᅳ With the restructuring moving ahead as planned, Oi’s restructured debt will collapse, leaving hefty upside for equity holders. Even under our
more conservative estimates for the NPV of its restructured net debt, we still see a huge upside for the stock. Our target price is based on a
fair EV/EBITDA multiple of 5.5x (LatAm sector average).
✓ CPFL
ᅳ CPFL is our Top Pick in the sector, as we see it trading at an attractive real IRR of 9.4% and an EV/RAB 2020 of 1.94x, a big discount to
other top-quality operators, whilst delivering strong cashflow generation through top-quality assets. CPFL’s distribution assets are located in
premium and concentrated concessions, which have one of the highest GDP per capita and the company has a track record of capital
discipline and is well positioned to grow as a consolidator in distribution and generation (renewables).

18
Why we selected these stocks
✓ Gerdau
ᅳ We added Gerdau to our portfolio on the heels of an improving demand for long steel stemming from a booming real estate market. With new
launches in Brazil skyrocketing since mid-2018, construction phase for those projects is just now kicking-off, and should support demand for
Gerdau’s long steel products in the coming months/years. The company works with operating rates in the 65-70% range, so we see there’s
more than enough room to grow sales while also diluting fixed costs and increasing operating leverage. All in, we believe Gerdau could easily
reach ~R$7bn in EBITDA for 2020, which would mean the company currently trading at ~5.3x, which we consider inexpensive.
✓ Rumo
ᅳ Remains our top pick in Transportation. The company has the highest long-term EBITDA growth prospects in our coverage universe, and we
believe volume momentum will significantly improve in the coming months on strong corn exports. We also see good upside risks coming from
new projects (such as Sorriso) and continued strong execution.
✓ BR Properties
ᅳ Corporate offices in São Paulo’s prime business districts are poised to grow rents in the coming years due to low (and decreasing) vacancy rates as demand
for office space is bouncing back (leasing spreads in prime regions are already growing 10-20% in real terms). Besides, we expect an increase in occupancy
in Rio’s AAA corporate towers due to fly-to-quality movement (which is already happening). In light of this positive scenario for offices in Brazil’s main markets,
we believe BR Properties is well positioned to surf a rebound in rents in its assets in São Paulo (30% of total GLA comprised of AAA offices in the city +
101,865m² of AAA GLA in São Paulo to be added to the portfolio with the delivery of Parque da Cidade’s towers in 2H21, meaning 26% of company’s GLA
today) and BR Properties could increase occupancy in its AAA offices in Rio (post the sale of B offices in Rio, ~75% of BR Properties vacancy in Rio is in
Ventura AAA towers).
✓ Localiza
ᅳ The growth rates in car rental industry have been nothing short of stellar (especially Localiza, whose rent-a-car volumes grew at over 30%
CAGR since 2015, accelerating year after year since then) despite a sluggish GDP scenario. With the corporate demand recovery, still low
rental penetration in Brazil and potential for further market share gains, we expect strong growth rates to persist for longer. Also, given its capital
intensiveness and strong growth, Localiza is one of the stocks we cover with the longest cash flow duration, which means it should continue to
outperform in a declining cost of capital scenario.
✓ Renner
ᅳ LREN’s consistent track record over a long period shows management’s execution discipline, leaving us more comfortable with the challenges
ahead (ecommerce’s greater share of sales). Poised to grow in the coming years and reaping the benefits of an assertive supply chain strategy,
coupled with a more multichannel approach, LREN is the best positioned player in a fragmented apparel retail segment (with only 6% market
share), paving the way for more consolidation. The company is currently trading at 28x P/E 2019, which is not a bargain, but it is a good (and
premium) alternative to be exposed to retail sector.

19
Why we selected these stocks
✓ JSL
ᅳ JSLG3 benefited from Movida’s strong 3Q19 results and follow-on process held in August, positively contributing to company’s deleverage
process. Looking forward, JSL has solid prospects for growth, based on the ongoing trend of vehicle outsourcing (which JSL benefits
through the controlling businesses of Movida, Vamos and CS Brasil). This vehicle outsourcing business provides company with an attractive
profile of long-term contracts, combining growth with improving profitability. Lastly, we consider current valuation level as attractive (13.1x
PE2020).
✓ CVC
ᅳ CVCB3 has struggled since the beginning of the year (down 34% YTD), on the back of concerns related to Avianca (which was an
important channel to sell cheaper tickets), an increase in the credit provisions (with CVC using more of its own balance sheet to finance
consumers), as well as lower demand in the leisure segment since the middle of last year. We see these factors as much more temporary
than structural and believe that synergies from recently acquired companies (already adding Esferatur, Biblos, Avantrip and Ola), coupled
with a brighter macro outlook, will lead to better prospects, especially in the leisure division. CVC is also one of the best choices to play the
economic recovery from 2H19 onwards, especially considering the improvement in consumers' confidence and purchasing intentions.
✓ São Martinho
ᅳ SMTO3 continues as an undervalued story, in our view, and remains our Top Pick in the ag sector. Despite the stock rally of 19% seen in
November, we continue to see the stock trading at an attractive FY2021 FCF yield of 10%. Recent concerns regarding sugar prices look
overcooked, suggesting an asymmetric risk-reward value proposition. SMTO already has almost 90% of its sugar sales hedged at
R$1,208/ton (+9.4% y/y) for the ongoing crop-year. More importantly, over half of SMTO’s revenues during 2019/20 crop is expected to
derive from ethanol sales, where the scenario remains solid amid a resilient demand and rising gasoline prices. All-in, we see believe
SMTO’s case seems asymmetric, with risks skewed to the upside, and ready to become a nice combo of value + growth.
✓ Trisul
ᅳ Trisul is the best option to surf next cycle in mid/high-income housing space since it offers strong earnings growth (EPS CAGR of 35% for
2018-2022E) + attractive valuation (10x P/E for 2021E). Trisul’s investment case is based on: (i) they are boasting higher ROEs than peers
(19% in 9M19 vs. a sector average of 4%) as they entered the crisis unleveraged and without much inventory; (ii) Trisul will grow launches
in the coming years (after the follow-on the company is capitalized to increase landbank), we expect launches to grow to R$1.3bn in 2019
and stabilized launches of R$1.5bn/year; (iii) their differentiated strategy of land acquisition boosts asset turns and ROEs (basically Trisul
“creates” land plots by purchasing small houses via call options that only it can cancel); (iv) premium homebuilder with a verticalized
operation, boasting high margins in projects and we forecast nice ROEs (17% and 19% ROE in 2020E and 2021E).

20
BTG Pactual’s 10SIM Historical Performance
2009 0.2% 13.3% 4.8% 19.1% 11.5% 19.1% 11.5%
2010 -5.5% 0.3% 0.1% -1.1% -2.8% -2.4% 12.3% -1.4% 8.6% 4.8% -2.4% 2.3% 12.0% 1.0% 33.4% 12.7%
2011 -2.2% 2.7% 1.6% 0.6% -1.4% -2.2% -4.6% -1.0% -10.8% 9.5% 0.2% 2.1% -6.5% -18.1% 24.7% -7.7%
2012 3.2% 10.3% -0.2% -0.8% -8.7% -0.1% 2.3% 5.1% 6.9% 3.0% 2.1% 8.1% 34.4% 7.4% 67.6% -0.9%
2013 6.1% -1.9% 1.4% 1.9% -2.1% -6.1% -0.5% 5.1% 2.8% 5.3% -0.6% -3.5% 7.3% -15.5% 79.9% -16.3%
2014 -6.1% -0.7% 4.0% 1.5% 0.2% 5.6% 1.9% 6.4% -10.8% 6.8% 0.8% -8.6% -0.9% -2.9% 78.3% -18.7%
2015 -6.3% 6.2% 3.6% 3.5% -3.1% -0.1% -5.5% -6.8% 2.4% 1.5% 3.6% -0.4% -2.4% -13.3% 73.9% -29.5%
2016 -5.5% 3.2% 4.4% 7.2% -6.0% 6.8% 12.9% 0.9% -0.2% 10.9% -6.5% -2.5% 26.0% 38.9% 119.1% -2.1%
2017 11.2% 3.9% -5.6% 1.7% -4.2% -2.1% 5.7% 4.3% 2.9% -0.9% -4.6% 2.9% 14.7% 26.9% 151.4% 24.2%
2018 10.2% -0.4% 1.6% 1.5% -6.7% 0.1% 1.9% -2.7% 2.5% 5.0% -0.7% 0.2% 12.3% 15.0% 182.3% 42.9%
2019 8.3% 5.0% -2.1% 2.3% -1.6% 5.2% 4.8% -0.1% 4.3% 1.2% 0.8% 31.2% 23.2% 270.3% 75.9%
Jun Jul AugJan Feb Mar Apr May Accum.Ibov
Accum.Sep Oct Nov Dec Year Ibov.
370.3
175.9
204.4
50
100
150
200
250
300
350
400
Oct-09 Oct-10 Oct-11 Oct-12 Oct-13 Oct-14 Oct-15 Oct-16 Oct-17 Oct-18 Oct-19
10SIM portfolio
Ibovespa
IBX-50

The power of lower long-term interest rates

22
The power of lower long-term interest rates
✓ Falling long-term real interest rates are driving down cost of capital
− Since President Bolsonaro’s election last October, real interest rates have fallen from 6% to 3% on prospects of dwindling fiscal deficits and
more sustainable debt-to-GDP levels.
− The approval of a comprehensive Pension Reform and additional reforms under debate in Congress may drive LT rates even lower and
keep them low in the long term.
− As we all know, low real LT rates mean a lower cost of capital.
✓ Top-down approach to Ibovespa target price
– We performed an exercise to gauge the Ibovespa’s theoretical upside potential using a top-down approach. Using a little algebra (more
details below), Gordon’s Growth model and the sustainable growth rate formula, we can relate a given P/E to its Return on Equ ity (ROE),
cost of equity (Ke) and expected growth rate
– We ran a few simulations (more details on the coming slides). In a scenario assuming key constitutional reforms are passed and the
economy starts growing again, the upside could be big. Discussing real interest rates of ~3% may be a bit premature, but if the pension
reform passes, the debate on how low real rates can go will take center stage.
𝑷
𝑬=
𝑹𝑶𝑬𝒍𝒕−𝒈𝒍𝒕
𝑹𝑶𝑬𝒍𝒕 𝑲𝒆,𝒍𝒕−𝒈𝒍𝒕

23
Top-down approach to Ibovespa target price: Our assumptions
✓ Estimating ROE, Ke and growth
– We based our ROE estimates on the actual, consolidated ROEs delivered by Brazilian companies we cover in recent years, and below we
show ROEs and our estimates for the next couple of years.
✓ We keep our inflation estimates constant at 3.5% and work with equity risk premiums of 4.0%, 3.5% and 3.0% in the
different scenarios.
✓The two most sensitive variables are real interest rates (today at 3.0%) and real GDP growth (expected to range
between 2.0% and 2.5% in 2020).
Brazilian listed companies’ ROE
Source: Company reports and BTG Pactual estimates
12.8% 12.9% 13.6%
15.4%16.5%
18.5%
4.8%
9.7%11.0%
14.6% 14.4%
16.9%
-1.5%
0.5%
2.5%
4.5%
6.5%
8.5%
10.5%
12.5%
14.5%
16.5%
18.5%
2015 2016 2017 2018 2019E 2020E
Ex Petro & Vale Consolidated

24
Lower real interest rates to support premium valuations
✓ Our optimistic (base-case) scenario shows decent upside
− Our base-case scenario may look optimistic to most people, but we like its odds. We are using ROE of 16%, in line with the 2018-19
average and less than what we are currently forecasting for 2019-20.
− We assume equity risk premium falling from 4.5% to 3.0%, at which level the ERP would still be one-standard deviation above its 2.2%
historical average.
− In this scenario, we assume LT real interest rates at the current 3.0% level, based on the government’s efforts to balance Brazil’s fiscal
accounts (including the possibility that additional reforms are approved, which would consolidate Brazil’s long-term fiscal situation).
− Finally, we assume sustainable GDP growth of 2.0%. In the short term, Brazil’s accelerating economic recovery indicates GDP growth
between 2.0% and 2.5% in 2020, but delivering this growth consistently overtime requires additional steps to modernize Brazil ’s economy.
− In this scenario, we reach a target P/E for the Ibovespa of 16.4x, putting Brazil’s broad tape at 134k points and offering upside of 19%.
Ibovespa target price sensitivity in different scenarios
Source: BTG Pactual estimates
Scenario 1 Scenario 2 Scenario 3 Scenario 4 Scenario 5
ROE 14.0% 15.0% 16.0% 16.0% 17.0%
Ke 12.0% 11.0% 9.5% 9.5% 9.0%
Inflation 3.5% 3.5% 3.5% 3.5% 3.5%
Real rates 4.5% 4.0% 3.0% 3.0% 2.5%
Interest Rates 8.0% 7.5% 6.5% 6.5% 6.0%
Premium 4.0% 3.5% 3.0% 3.0% 3.0%
Growth 5.0% 5.5% 5.5% 6.0% 6.5%
Inflation 3.5% 3.5% 3.5% 3.5% 3.5%
Real growth 1.5% 2.0% 2.0% 2.5% 3.0%
Target P/E 9.2x 11.5x 16.4x 17.9x 24.7x
Current P/E 13.8x 13.8x 13.8x 13.8x 13.8x
IBOV 112,390 112,390 112,390 112,390 112,390
IBOV Target 74,794 93,782 133,616 145,432 201,210Upside -33.5% -16.6% 18.9% 29.4% 79.0%

25
Bottom-up approach: The power of a lower cost of equity
✓ The impact of a lower Ke on companies’ valuations can vary
importantly
– This is because companies have different leverage, Beta, capital structure
and cashflow duration – some companies have more of their cashflow in
the years out.
– To better understand how these differences could impact valuations in a
scenario of a lower cost of capital, we asked our analysts to run their
models for 54 companies under coverage (we cover more than 120
companies in Brazil), assuming a cost of equity 100bps lower. The results
are shown in the table.
– The average target price increase for the companies analyzed was 19%,
but the range goes from 7% all the way to 44%.
– Utilities and telecom operators have the lowest target price increases
(average of 12.2% and 13.8%, respectively) as these businesses produce
consistent, recurring cash flows.
– Car rental companies and apparel retailers and consumer discretionary
companies enjoy an above-average target price increase (average of 40%
and 26%, respectively).
Changes to selected Brazilian companies’ target prices with a 100bps reduction in Ke
Source: BTG Pactual estimates
Upside Upside
Real Estate Education
Multiplan 21.2% Kroton 18.8%
Iguatemi 17.3% Ânima 13.6%
Cyrela 17.3% YDUQS 12.8%
MRVE 14.5% Ser 8.8%
Retail Financials
Lojas Americanas 13.0% Banco do Brasil 19.3%
Pão de Açucar 13.8% Bradesco 25.0%
Magazine Luiza 32.7% Itau 26.7%
Lojas Renner 32.2% B3 35.6%
CVC 23.4% Pulp & Paper / Metals & Mining
B2W 10.3% Vale 14.8%
Natura 20.7% Suzano 22.7%
Raia Drogasil 34.4% Gerdau 15.6%
Food & Beverage Utilities
JBS 22.9% Energisa 13.8%
BRF 7.3% Equatorial 12.5%
Minerva 9.1% Cemig 9.1%
Marfrig 25.0% Light 15.2%
Ambev 15.0% CPFL 10.3%
M. Dias Branco 17.1% TMT
Oil & Gas / Agribusiness TIM 13.8%
BR Distribuidora 20.0% Telefonica Brasil 13.8%
Petrobras 11.8% Transportation & Capital Goods
Ultrapar 15.1% Localiza 43.6%
Cosan 16.3% JSL 37.5%
São Martinho 13.4% Ecorodovias 6.7%
SLC Agrícola 16.7% Rumo 8.3%
Healthcare Movida 38.1%
GNDI 39.4% Marcopolo 14.5%
OdontoPrev 25.0%
Hapvida 32.8%
Alliar 16.7%
Fleury 14.3%
Qualicorp 8.7%

Local credit markets are booming

27
Funding costs are plummeting, while durations are getting longer
✓ In mid-2016, with the Selic at 14.25% and spreads at double the 2010-14 average level, financing costs were high
− A decline in the Selic rate (a movement that started in mid-2016) and normalization of debt capital markets in the last two years have
slashed Brazilian companies’ cost of funding.The Selic is down a further 200bps YTD (after a 50bps cut in 2018 and 675bps in 2017), with
lower spreads than in 2014 and longer issuance durations.
− Average spreads for issuers rated AA- or higher now stand at DI+0.5% with an average duration of 4.9 years, compared to DI+2.3% in
2016, with a duration of 3.3 years. A few high-quality companies, like Petrobras, Rumo and Klabin and Neoenergia, have issued bonds with
+10-year maturities.
Domestic debentures¹: average spread (DI+) vs. average duration of issuances
Source: Anbima, BTG Pactual (¹issuers/issuances rated AA- or higher on Brazilian national scale, ²Excluding issuances by NCF Participacoes and B3

28
Lower rates + falling spreads: a potent combo
✓ The bulk of the Selic´s downward cycle is admittedly over, but further (small) cuts and narrower spreads can still
impact earnings
− We ran an exercise comparing the situation of the credit markets today vs. in the beginning of 2019 for a high-quality issuer with a 3x net
debt-to-EBITDA leverage. We conclude that under the current credit conditions, and keeping all other variables unchanged, earnings would
improve some 17%.
Lower interest rates + spreads = a potent combo
Source: BTG Pactual
Scenario 1 Scenario 2 Scenario 3
Selic - 6.5% Selic - 5.5% Selic - 4.5%
Spread - 1% Spread - 0.5% Spread - 0.5%
Net Debt/EBITDA - 3x Net Debt/EBITDA - 3x Net Debt/EBITDA - 3x
Net Revenues 100 100 100
COGS (40) (40) (40)
Gross profit 60 60 60
SG&A (30) (30) (30)
EBITDA 30 30 30
EBITDA mg. 30% 30% 30%
D&A (10) (10) (10)
EBIT 20 20 20
Financial result (6.8) (5.4) (4.5)
Taxes (34%) (4.5) (5.0) (5.3)
Net income 8.7 9.6 10.2
Net mg. 8.7% 9.6% 10.2%

29
Looking for extra returns on high-quality, longer-duration bonds
Debenture issuances with ratings AA- and above (% of total issued)
Source: ANBIMA, BTG Pactual
93,4%97,9%
87,4% 86,7
97,6% 96,5%
2014 2015 2016 2017 2018 10M19
AAA AA+ AA AA-
✓ Investors want extra returns on high-quality, longer-duration bonds
− Lower rates and spreads leave fixed income investors with two options to preserve profitability: i) invest in longer duration bonds; or ii) invest
in lower-quality, high-yield issuers. Right now, investors are going for longer-duration bonds of high-quality issuers.
− In fact, the % of debentures issued by companies rated AA- and above was 96.5% in the first 10 months of 2019 (66% of AAA) vs. 86.7% in
2017 (23% of AAA).

30
Local debt capital markets are on fire
✓Local debt capital market is on fire; More than R$120bn issued YTD (all time record level)
✓ International capital markets are fully open for Brazilian issuers again
− Brazilian companies raised USD30bn in bonds and USD7.7bn in equity transactions in 2017, plus USD11.6bn in bonds and USD3.5bn in
equity transactions last year.
− This year’s international capital markets have surpassed all expectations, with Brazilian companies raising ~USD25.4bn in bonds and
USD9.2bn in equity transactions YTD (or a staggering USD20bn if we add secondary offers).
Local bond market (R$bn)
Source: Anbima, BTG Pactual
37.030.7
38.9
95.9 100.2
83.8
122.3
2014 2015 2016 2017 2018 2018YTD 2019YTD
FIDC (Receivables Securitization Fund) CRI (real estate receivables certificates)
Promissory Notes CRA (agricultural receivables certificates)
Debentures

31
Capital markets are fully operational again
✓ It was tough to sell local capital market operations in 2015-16, and foreign markets were basically closed to Brazilian
issuers
− Top quality issuers had to rely more on bank loans, and banks reduced loans to smaller (riskier) companies.
− Result: the number of companies filing for bankruptcy protection in 2016 was 2.2x more than in 2014.
− But with banks now gradually lending out money to smaller, riskier companies at better terms, this number is already falling. In Jan-Sep
2019, 1,030 companies filed for bankruptcy protection – still a high number but, again, a sequential marked improvement y/y.
Number of companies filing for bankruptcy protection
Source: Serasa
252 269 312
670 475 515
757 874 828
1.287
1.863
1.420 1.408
1.030
2006 2007 2008 2009 2010 2011 2012 2013 2014 2015 2016 2017 2018 Set-19

32
Corporate bonds are gaining grounds
✓Corporate bonds are gaining ground…but not from government bonds
– Corporate bonds are gaining share (from 3% of allocations in fixed income instruments in 2016 to 5.7% in October 2019), but it’s banking
credit that has been losing ground, not government bonds (80% of all fixed income instruments in October 2019, same level as YE18).
Local funds’ allocation in fixed income instruments (ex-government bonds)
Source: Anbima, BTG Pactual
18.74%
23.21%19.73%
14.74%
13.88%
18.44%16.05%
9.03%
4.86% 4.77%3.68%
5.72%
Dec-09 Dec-10 Dec-11 Dec-12 Dec-13 Dec-14 Dec-15 Dec-16 Dec-17 Dec-18 Oct-19
Total Credit Financials Corporates

33
Credit investment funds are gaining ground
✓Credit investment funds keep gaining ground
– Stronger demand for more sophisticated investment products and lower supply of bank credit notes have paved the way for growth in credit
investment funds. These funds (current and new ones) are growing rapidly and increasing demand for corporate bonds.
Private banking and retail investors (WuM, R$bn)
Net inflows into funds (R$bn)
Source: ANBIMA, BTG Pactual Source: ANBIMA
29,0%
R$ 690 bn
28,7%R$ 765 bn
30,4%
R$ 849bn
29,6%R$ 899 bn
38,5%R$ 918 bn
34,2%R$ 950 bn
34,0%R$ 950 bn
32,5% R$ 988 bn
32,5%R$ 774 bn
37,1%R$ 989 bn
39,8%
R$ 1.113 bn
41,8%R$ 1.270 bn
R$ 1.382 bnR$ 2.664 bn
R$ 2.798 bnR$ 3.037 bn
Dec-16 Dec-17 Dec-18 Oct-19
Saving accounts & other Marketable securities Investments funds
113.6 100.8 99.8
56.3
1.7 0.4
127.5
258.3
94.2 83.3
235.8
7.4% 5.6% 4.7% 2.4% 0.1% 0.0%3.9%
6.8%2.2% 1.9%
4.8%
2010 2011 2012 2013 2014 2015 2016 2017 2018 10M18 10M19
Net inflows (R$bn) % of AuM

Domestic-companies’ earnings to grow 18% in 2020

35
Earnings should continue to grow nicely in 2020
✓We are modeling for 2020 domestic earnings to grow 18% y/y
✓Consolidated earnings (ex-Petro & Vale) expected to grow 20% in 2020
– Consolidated earnings ex-Petro & Vale, but including commodity exporters, are set to grow 20% y/y in 2020.
Domestic companies’ earnings growth
Source: BTG Pactual estimates
2015 2016 2017 2018 2019E 2020E
Net revenues 741,042 805,257 842,760 936,887 1,025,458 1,118,212
Growth 8.7% 4.7% 11.2% 9.5% 9.0%
Net income 113,764 114,377 123,629 145,107 173,627 205,449
Growth 0.5% 8.1% 17.4% 19.7% 18.3%
Consolidated earnings and revenue growth (ex-Petro & Vale)
Source: BTG Pactual estimates
2015 2016 2017 2018 2019E 2020E
Net revenues 1,050,672 1,104,853 1,150,165 1,302,566 1,410,752 1,522,607
Growth 5.2% 4.1% 13.3% 8.3% 7.9%
Net income 107,540 116,190 130,812 163,145 184,877 222,205
Growth 8.0% 12.6% 24.7% 13.3% 20.2%

36
Earnings/nominal GDP growth multiplier to peak in 2019
✓We expect the domestic earnings/nominal GDP growth multiplier to peak in 2019, at 4.6x – considering real GDP
growth of 0.8% and inflation of 3.4%
– For 2020, we expect the multiplier to drop to 3.2x, still higher than the last 10-year average of 1.6x.
Domestic companies’ earnings growth / nominal GDP growth
Source: Company reports and BTG Pactual estimates. 2015/2016 numbers adjusted for gains/losses with derivatives booked by JBS.
2.8x
0.7x 0.6x
0.9x 1.1x 0.3x
-0.7x
2.0x
3.4x
4.6x
3.2x
2010 2011 2012 2013 2014 2015 2016 2017 2018 2019 2020

37
We haven’t seen heavy revisions in 2019 after all
✓The last time we published our consolidated earnings analysis, 5 months ago, we were modelling for domestic
earnings to grow 22% in 2019
– In the report, we anticipated the possibility that, with Brazil’s economy recovering only mildly and with 2019 GDP growth expectations
consistently revised down, it could be a matter of time before 2019 consolidated earnings estimates were trimmed.
– At the end of the day, the revision ended up being lighter than what we would have expected, given that 2019 GDP growth was revised
down to less than 1%, from 2.5% at the start of the year. On the other hand, our estimates for 2020 earnings were revised up, in spite of the
still weak macro scenario.
– Since the beginning of 2019, our domestic earnings forecasts for 2019 were cut by only 2.8%. For 2020, earnings forecasts were revised
upwards by 2% (vs. 5 months ago).

38
Double-digit growth for several sectors in 2020
✓Many sectors are expected to grow at double-digit levels in 2020
– Excluding commodity exporters, we estimate relevant earnings growth for Housing (+92% y/y in 2020), Capital Goods (+64%), Infrastructure
(+48%), Retail (37%), Food & Beverage (+33), Car Rental & Logistics (+32%), and Healthcare providers (+23%).
– In 2020, the banking sector will account for 35% of consolidated earnings. The next most relevant sectors for consolidated earnings are
Metals & Mining (17%), Oil & Gas (9%), Utilities (9%), and Food & Beverage (9%).
Earnings growth by sector
Earnings share by sector
Source: BTG Pactual estimates Source: BTG Pactual estimates
2018 2019 2020
Food & Beverage 4.7% 138.0% 33.1%
Capital Goods -35.7% 61.6% 63.8%
Car Rental & Logistics 55.4% 30.6% 31.7%
Infrastructure 4.7% 29.5% 48.4%
Banks 15.2% 19.4% 10.0%
Commercial Properties 16.1% 14.6% 12.6%
Healthcare 10.5% 8.0% 22.9%
Oil & Gas n.a. 5.0% -19.2%
Retail 24.0% 4.0% 37.3%
Utilities 37.5% 2.9% 20.5%
Financials ex-banks -1.0% 2.4% 16.7%
Agribiness 26.7% 0.0% 9.2%
Education -14.8% -17.7% 18.6%
TMT n.a. n.a. 7.4%
Metals & Mining 89.6% -43.7% 151.1%
Pulp & paper 16.3% -127.6% -446.3%
Airlines & Mileage n.a. n.a. 66.1%
Housing -55.4% n.a. 92.4%
2018 2019 2020
Banks 34.8% 39.4% 34.5%
Oil & Gas 14.1% 14.0% 9.0%
Utilities 9.3% 9.0% 8.7%
Food & Beverage 3.9% 8.8% 9.3%
Metals & Mining 15.6% 8.3% 16.6%
Financials ex-banks 6.4% 6.2% 5.7%
Retail 3.7% 3.6% 4.0%
TMT 5.5% 3.2% 2.8%
Infrastructure 1.0% 1.2% 1.4%
Agribiness 1.2% 1.1% 1.0%
Capital Goods 0.7% 1.1% 1.4%
Commercial Properties 0.9% 0.9% 0.8%
Healthcare 0.9% 0.9% 0.9%
Education 1.1% 0.9% 0.8%
Car Rental & Logistics 0.6% 0.7% 0.7%
Housing -0.3% 0.6% 0.8%
Airlines & Mileage -0.5% 0.4% 0.6%
Pulp & paper 1.4% -0.4% 1.0%

Brazilian equities look under-owned

40
Local investors to continue to increase allocations to equities in 2020
✓We are seeing a continuous and consistent increase in allocations into Brazilian equities by local investors
− With interest rates plummeting, local investors are moving their money over to equities.
− In October, equity allocation by local investors reached 12.5%, up from 8.9% in August 2018. Despite the increase, allocation levels are still
below the average of 14% from 2011 to 2014 (pre-recession) and way below 2007’s 22% peak.
✓Foreign investors, though, have been way more cautious
− Foreign investors, though, have been way more cautious. Since President Bolsonaro’s election, and reflecting a global risk-off mode, they
have not increased their exposure to Brazilian equities much.
− In October, GEM funds had 8.5% of their money parked in Brazilian equities, a tad above the 8% level seen in October 2018. Global fund
allocations into Brazil were 0.47% in October, a very low level.
− We believe stronger economic growth should finally drive foreign flows to Brazil.
Local investors’ allocation
Allocation of global and GEM-weighted funds
Source: Anbima Source: EPFR
8.9%9.1% 9.1%
9.4%
9.1%8.9%
9.1%8.9%
9.2%
9.8%
10.2%10.3%
10.7%10.8%
10.6%
10.8%
10.8%
11.3%
11.6%
11.9%12.1%
12.5%
G.E.M. Global
Jan-18 7.6% 0.69%
Mar-18 7.5% 0.62%
Jun-18 6.0% 0.42%
Sep-18 6.4% 0.37%
Oct-18 8.0% 0.51%
Nov-18 7.7% 0.47%
Dec-18 8.0% 0.58%
Jan-19 8.3% 0.64%
Feb-19 7.9% 0.52%
Mar-19 7.6% 0.46%
Apr-19 7.6% 0.45%
May-19 8.2% 0.48%
Jun-19 8.3% 0.51%
Jul-19 8.7% 0.51%
Aug-19 8.3% 0.54%
Sep-19 8.4% 0.51%
Oct-19 8.5% 0.47%
Allocation into Brazilian equities

41
Huge potential inflows from foreigners
✓Potential inflows into Brazilian equities is huge
− Although low allocation levels reveal Foreign Investors’ continued (extreme) cautiousness when it comes to investing in Brazil, we see huge
potential inflows into Brazilian equities.
− Assuming allocations return to October 2014 levels, i.e. just before ex-President Rousseff´s reelection, and based on the current AUM
levels of all fund categories, our back-of-the envelope calculation estimates BRL226bn (USD55bn) could flow into Brazilian equities.
Source: EPFR
April 2010 54.8 51.6 0.31 0.4 107 439 25.8x
April 2012 66.8 54.0 0.56 0.3 122 499 29.3x
Oct/14 (Before elections) 33.6 22.1 0.37 (0.8) 55 226 13.3x
Feb 2017 22.8 4.1 0.07 (0.8) 26 107 6.3x
Apr 2017 16.2 (2.7) 0.00 (1.2) 12 51 3.0x
AuM @ December 2019 (US$bn) 3,589.4 688.0 4.1 13.8
Total USD Total BRL# Trading days
(YTD ADTV)
Estimated inflows to Brazilian equities
assuming past allocations (US$ bn)Global GEM BRIC LatAm
April 2010 2.00% 16.0% 25.0% 66.0%
April 2012 2.33% 16.3% 31.1% 65.5%
Oct/14 (Before elections) 1.41% 11.7% 26.3% 57.1%
Feb 2017 1.11% 9.1% 19.1% 57.3%
Apr 2017 0.92% 8.1% 17.4% 54.7%
Jun 2017 0.75% 7.1% 16.2% 52.6%
Dec 2017 0.60% 7.2% 14.7% 56.4%
Mar 2018 0.62% 7.5% 16.7% 58.2%
Oct 2018 0.51% 8.0% 17.0% 60.3%
Dec 2018 0.58% 8.0% 18.5% 59.9%
Feb 2019 0.52% 7.9% 17.0% 60.0%
Apr 2019 0.45% 7.6% 15.8% 60.1%
Jun 2019 0.51% 8.3% 18.1% 61.0%
Aug 2019 0.54% 8.3% 17.5% 62.4%
Oct 2019 0.47% 8.5% 17.3% 63.2%
Allocation to Brazilian Equities Global GEM BRIC LatAm

42
Local funds: potentially another R$69bn in flows from local industry
✓Despite the increase, allocation levels are still below the average of 14% from 2011 to 2014 (pre-recession) and way
below 2007’s 22% peak.
✓ With long-term rates set to fall, equities inflows from local funds are set to soar.
✓ If locals also increase their allocations to equities back to the average seen from 2011 to 2014 (14%), then the extra flows could reach
BRL69bn (USD17bn).
Source: Anbima
97 88 80 99 113 133 221362
224 334 356 311 321 331 303 255 278 330 431 586
854 893717
940 9811,167
1,4201,651
1,500 1,858
1,950
2,104
2,2462,362
2,5572,803
3,269
3,776
4,182
4,672
11.3%
9.9%
11.1%
10.6% 11.6%11.4%
15.5%
22.0%
14.9%
18.0% 18.3%
14.8%
14.3% 14.0%
11.9%9.1%
8.5%
8.7%
10.3%
12.5%
0%
5%
10%
15%
20%
25%
0
500
1000
1500
2000
2500
3000
3500
4000
4500
5000
2000 2001 2002 2003 2004 2005 2006 2007 2008 2009 2010 2011 2012 2013 2014 2015 2016 2017 2018 Oct-19
Equ
ity S
hare
of M
utua
l F
unds
, Sel
ic R
ate
(%)
AuM
(R
$bn)
Fixed Income AuM (R$bn) Equity AuM (R$bn) Equity Share End of Period Selic Rate

Seeking FX exposure? Look at food processors

44
Weakening BRL
✓FX hasn’t followed the Ibovespa
– Expectations on the government´s reform agenda have led the Ibovespa to climb to record levels and long-term real interest rates to fall
consistently (to record lows).
– But the BRL has gone the other way, mainly due to global risk-off sentiment amid an escalating trade war and a smaller differential between
domestic interest rates and other countries (making the BRL less attractive from a carry-currency perspective).
– YTD, Brazil´s broad tape is up 28% in BRL, long-term real rates have fallen from 5% to 3%, and the BRL has depreciated 5.1% vs. the USD.
USD/BRL and Ibovespa historical performances
Source: BTG Pactual
0.00
1.00
2.00
3.00
4.00
5.00
8000
28000
48000
68000
88000
108000
IBOV Index (USD) IBOV Index (BRL) USD/BRL

45
BRL has performed poorer than other emerging currencies
✓ In fact, the BRL is one of the six currencies to depreciate most (YTD) in the universe of emerging market countries.
EM currencies spot return YTD (%) - base in USD
Source: Bloomberg and BTG Pactual
-32.8
-8.3
-6.8
-6.5
-5.2
-5.1
-4.7
-4.2
-3.6
-3.4
-3.3
-2.7
-2.5
-2.1
-1.6
-1.2
-0.9
-0.1
0.8
0.8
1.1
2.4
6.3
6.6
Argentine Peso
Turkish Lira
Hungarian Forint
South Korean Won
Romanian Leu
Brazilian Real
Polish Zloty
Czech Koruna
Bulgarian Lev
Colombian Peso
Chinese Renminbi
Indian Rupee
Chilean Peso
South African Rand
Taiwanese Dollar
Singapore Dollar
Malaysian Ringgit
Hong Kong Dollar
Peruvian Sol
Mexican Peso
Philippine Peso
Indonesian Rupiah
Thai Baht
Russian Ruble

46
Seeking FX exposure? Look at food processors
✓Embraer, food processors, commodity
exporters, industrials to gain
– In theory, the winners and losers in a weaker BRL
scenario can be easily identified. With more
revenues in USD/Euro than cash costs, the
EBITDA impact is positive whenever the BRL
weakens. This is the case for aircraft maker
Embraer, food processors, pulp & paper
companies (Suzano and Klabin), agribusiness
companies (SLC and SMTO), steelmakers and
industrials (Iochpe, Tupy).
✓Our top FX plays: JBS, Minerva and Embraer
– Our #1 stock for exposure to a stronger USD is
food processor JBS. Besides benefiting from a
stronger USD, ASF outbreak in China is also good
for the company.
– We like Minerva as well, for similar reasons.
– Embraer is another nice option to gain USD
exposure. The stock has underperformed recently
on market concerns related to the Boeing deal tie-
up.
Steel & Mining
VALE3 100% 49% 90% 18%
GGBR4 65% 55% 26% 0%
USIM5 25% 40% 50% 0%
Pulp & Paper
DTEX3 19% 30% 5% 100%
SUZB5 85% 28% 77% 10%
KLBN11 65% 30% 75% 0%
Oil & Gas
BRDT3 2% 0% 0% 0%
UGPA3 2% 0% 46% 41%
PETR4 90% 50% 86% 5%
Agribusiness
SLCE3 94% 60% 11% 100%
CSAN3 11% 5% 60% 12%
SMTO3 30% 15% 30% 0%
Food & Beverage
ABEV3 45% 50% 53% 100%
MDIA3 1% 55% 45% 100%
BRFS3 45% 40% 45% 50%
JBSS3 86% 80% 97% 10%
BEEF3 75% 60% 75% 50%
MRFG3 90% 70% 99% 0%
Retail
CVCB3 0% 0% 39% 100%
MEAL3 66% 48% 49% 100%
LAME4 0% 0% 13% 100%
BTOW3 0% 0% 16% 100%
AMAR3 0% 12% 17% 100%
HYPE3 0% 27% 0% 100%
RADL3 0% 0% 0% 0%
HGTX3 3% 15% 0% 0%
ARZZ3 10% n.a. 84% 0%
MGLU3 0% 0% 0% 0%
TECN3 0% 74% 78% 100%
NATU3 37% 30% 36% 100%
PCAR4 0% 0% 14% 100%
LREN3 0% 25% 41% 100%
VVAR11 0% 0% 9% 100%
GOLL4 15% 50% 95% 0%
WEGE3 61% 66% 85% 50%
EMBR3 90% 80% 94% 83%
POMO4 55% n.a. 43% n.a.
RAPT4 17% 15% 19% 0%
MYPK3 76% 60% 77% n.a.
TUPY3 83% 45% 99% n.a.
CCRO3 0% 0% 8% 0%
RAIL3 0% 0% 46% 100%
Utilities
CESP6 0% 0% 5% 0%
CMIG4 0% 0% 42% 100%
SBSP3 0% 0% 49% 0%
Companies
Capital Goods, Airlines & Mileage,
Aerospace & Transportation
% Sales in FX % Cash costs in FX% of FX-
denominated debt
% of FX-denominated
debt hedged
The post-pension reform agenda is moving forward

48
Government is moving forward with its reform agenda
✓With the pension reform approved, the
government is ready to move forward with its
reform agenda
− Some of them will continue the efforts to improve
Brazil’s fiscal accounts, including:
− i) the administrative reform;
− ii) changes to the Golden Rule;
− iii) a new federative pact redesigning rights and obligations
of the federal government, states and municipalities.
− The reform agenda also includes a sorely-needed, but
tough to implement, tax reform.
Proposals on the Economic Agenda

49
Government will move forward with its reform agenda (II)
Proposals on the Economic Agenda

50
Government will move forward with its reform agenda (III)
Proposals on the Economic Agenda

51
Status of reforms in the Lower House and the Senate
Constitutional Amendments (PEC)

52
Status of reforms in Congress (ordinary legislation)
Ordinary legislation

Tax reform: Time to make things less complex…

54
The tax burden is high and should remain high
✓A simpler tax system to boost productivity
– Now that the Pension Reform has been approved in the Lower House (and is expected to be voted in the Senate in the next couple of
months), Congress and the government are expected to move to the next, also extremely challenging reform: the Tax Reform.
– Most economists argue that Brazil’s tax burden is high for a middle-income, emerging country. The tax burden reached 33.6% of GDP in
2018, expanding 11pp since 1998. Municipalities grew their share of the tax pie strongly in the period.
Tax burden on goods and services (% of GDP and as share of total)
Source: IRS, National’s Treasury and BTG Pactual
16.1
16.3
20
.5
16.7 17
.5 18.5
20.5
18.3
17.6
18.0 18
.6 19.9 20
.9
21.3 22
.5
21.4 22
.1 23.4
23.0
23.5
23.2
22.2
22.4 23
.3
22.5
22.4
21.8
21.9
22.0
22
.1
22.7
5.7
7.2
9.0
7.3
7.4 6.
5
8.0
7.6
7.5 7.2 7.
1
7.2
7.9 8.
2
8.3
8.3
8.5
8.6
8.5 8.
4
8.5
8.3 8.3
8.2
8.2
8.2
8.1
8.2
8.2
8.3 8
.7
0.6
0.7
0.9
1.2 1.
0
0.8
1.0
1.3
1.3
1.3 1.
4
1.3
1.4 1.
4
1.4
1.4
1.4
1.6
1.7 1.
7
1.7
1.8 1.8
1.8
1.9
1.9
1.9 2.0
2.0 2.
0
2.3
22.4
24.2
30.5
25.225.8 25.7
29.5
27.2
26.4 26.627.1
28.4
30.2
30.9
32.1
31.1
32.0
33.733.3
33.6 33.5
32.2 32.5
33.3
32.6 32.531.8 32.1 32.2 32.5
33.6
1988 1989 1990 1991 1992 1993 1994 1995 1996 1997 1998 1999 2000 2001 2002 2003 2004 2005 2006 2007 2008 2009 2010 2011 2012 2013 2014 2015 2016 2017 2018
Federal States Municipalities Total
55
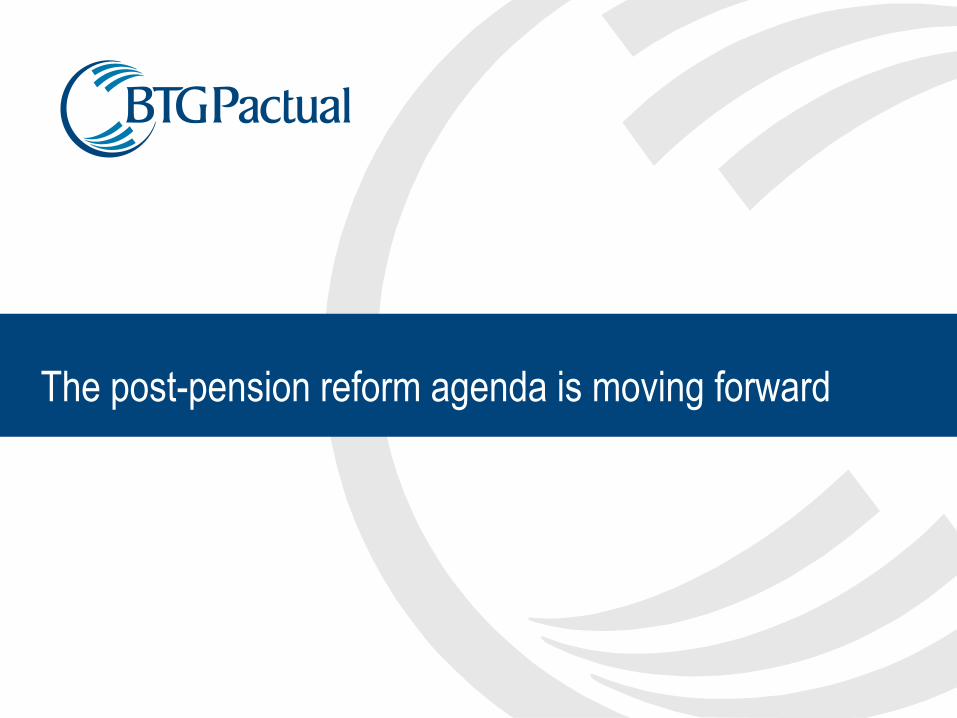
Tax on goods and services is the main focus of the reform
✓Taxes on goods and services account for just over 40% of the tax pie (these taxes will probably be the main focus of
the reform), followed by payroll taxes, with 28%, and taxes on income, profits and capital gains, at 21%
Tax burden on goods and services (% of GDP and as share of total)
Source: National’s Treasury and BTG Pactual
14.3, 43%
9.5, 28%
7.2, 21%
1.6, 5%
0.6, 2%
0.4, 1%2.6, 8%
Goods and services Payroll
Income, profits and capital gains Properties
International Trade Others

56
Brazil taxes more than its Latin American peers
✓Brazil taxes way more than other emerging market countries and Latin American peers, and almost as much as
some developed countries, even though it offers its population poor quality public services.
– According to an OECD study using 2017 data, Brazil taxes, on average, 9.6 percentage points of GDP more than the average of Latin
American and Caribbean countries — after Cuba, Brazil ranks second in a list of 24 countries in the region. It taxes almost as much as the
average of 34 developed economies, at 34.5% of GDP.
Tax Burden – LatAm and Caribbean Countries (% of GDP)
Source: OECD and BTG Pactual
40.6
34.532.3 31.8
30.9 30.328.2
27.326.2
24.1 23.9 23.822.8 22.2
20.4 20.2 19.918.8 17.9
16.2 15.3 14.7 13.9 13.812.4

57
Paying taxes in Brazil is a nightmare
✓Brazil ranks 109 out of 190 countries in the Ease of Doing Business
ranking compiled by the World Bank.
– The ranking is built taking into account a variety of items, including getting credit,
enforcing contracts, labor market regulations, etc. One of the variables that is central
to the ranking is tax systems and how easy it is to pay taxes.
✓A simplified tax system has the potential to reduce the costs of paying taxes, as well as tax-related litigations.
– According to a study by the World Bank, Brazilian companies are among those that take longest to pay their taxes. In fact, Brazil has one of
the worst rankings when it comes to paying taxes, according to World Bank (184 out of 190). Brazilian companies spend a total of 1,958
hours per year just to pay taxes, i.e. they need to employ armies of people fully dedicated to paying taxes.
– Only South American countries Bolivia and Venezuela and four sub-Saharan African countries (Republic of Congo, Central African Republic,
Chad and Somalia) rank lower than Brazil in the paying taxes ranking.
Ease of doing business
Source: World Bank, BTG Pactual
Country Rank
New Zealand 1
United States 8
Canada 22
Germany 24
China 46
Israel 49
Chile 56
Colombia 65
Peru 68
Uruguay 95
Brazil 109
Paraguay 113
Argentina 119
Ecuador 123
Bolivia 156
Venezuela 188
Time to pay taxes (hours per year)
Source: World bank
1,958
1,025
792
664
378312 296 260 256 239 218 175 163 142 140 131

58
Tax reform can boost productivity; Approving one won’t be easy
✓Many possible reforms show the complexity of the theme; new tax system to boost productivity
– The proposal being debated in the Lower House transforms five federal (PIS, Cofins and IPI), state (ICMS) and municipal (ISS) taxes into a
single VAT, called goods and services tax (IBS). The new tax would be regulated by complementary law and managed by a national
committee that would centralize and collect taxes and transfer them to the federal government, states and municipalities.
– However, it is far from clear if this proposal will prevail. Right now, there are 4-5 tax reform proposals being discussed. It is also unclear how
broad the reform will be. A relevant portion of the debate so far has been centered on taxation of goods and services, which account for just
over 40% of Brazil’s tax burden. However, we believe there is a good chance that changes to the taxation of income and profits (20% of the
overall tax burden) will also be proposed.
– The proposal in the Lower House is thorough and tackles most challenges of Brazil’s tax system. But as it affects more groups, including a
tough reorganization of state and municipal taxes, it may be tougher to pass. This is probably why the government has been indicating it
should send congress a simpler, less controversial, easier-to-approve reform. Lower House Speaker Rodrigo Maia has already pledged to
incorporate the government’s proposal into the debate once the government sends it to Congress.
– The sheer fact that there are a number of possible reforms under discussion indicates the complexity of the subject and suggests that the
debate may be long and that approval of a reform may take a while.
✓Changes to corporate taxes, tax on dividends and IOE are also likely
– The government proposal, besides simplifying federal taxes on sales, may also reduce tax on corporate earnings (IRPJ/CSLL) whilst taxing
dividends. The government’s goal is to lower production tax and raise capital gains tax. Measures alleviating low-income taxpayers whilst
raising taxes at the top of the pyramid are also possible.

State-owned companies: A long list of assets to sell

60
A big government
✓A Finance Ministry report a few weeks ago shows that there were 148 Federal government-owned companies in
Brazil at the end of 2017, 5 less than at the end of 2016
– However, since the end of 2004, i.e. in the past 13 years, 16 new state-owned companies were created.
– The chart below shows the different types of stakes held by the government. It controls some companies directly, some indirectly and is a
minority investor in others.
Types of ownership
Source: Finance Ministry report on Brazilian government’s ownership stakes
Fed
eral
Go
vern
men
t Co
mp
anie
s
Indirect Control
State owned
companies
Mixed capital
companies
Indirectly controlled companies
Direct Control
Control Interest
Minority Interest
State Government Companies
Privately-held
Companies
Stakes in other
institutions
Equity Share

61
47 directly-controlled companies
✓At the end of 2017, the government controlled 47 companies directly, including high-profile listed companies like
Petrobras, Eletrobras and Banco do Brasil.
Companies directly controlled by the government
Source: Finance Ministry report on Brazilian government’s ownership stakes
13 Non-dependents
ABGF-AG.BR.GEST.FUND.GARANT. 100.00 50.73 51.18
BNDES 100.00 ELETROBRÁS (*) 40.99
CAIXA ECONÔMICA FEDERAL 100.00 PETROBRAS (*) 28.67
CASA DA MOEDA 100.00 TELEBRAS (*) 47.39
DATAPREV 51.00 51.00
CORREIOS ECT 100.00 50.92
EMGEA-EMP.GEST.ATIVOS 100.00 11 Non-listed
EMGEPRON-EMP.GEST.PROJ.NAVAIS 100.00 92.96
FINEP-FINANCIAD.ESTUDOS 100.00 99.68
HEMOBRAS-EMP.BR.HEMOD.BIOTEC. 100.00 99.57
INFRAERO 100.00 99.93
PPSA-PRÉ-SAL PETRÓLEO S.A. 100.00 100.00
13 Dependents CDRJ-CIA DOCAS DO RJ 99.99
AMAZUL-AMAZÔNIA AZUL TEC.DEFESA 100.00 CODEBA-CIA DOCAS DA BA 98.36
CEITEC-CENT.EXCEL.TEC.ELETR.AVANÇ. 100.00 CODERN-CIA DOCAS DO RN 99.99
CODEVASF-CIA DES.VALES.FR.PARN 100.00 CODESA-CIA DOCAS DO ES 99.45
CONAB-CIA NAC.ABASTECIMENTO 100.00 CODESP-CIA DOCAS DE SP 99.97
CPRM-CIA PESQUISA REC.MINERAIS 97.33 CODOMAR-CIA DOCAS DO MA 99.97
EBC-EMP.BRASIL COMUNICAÇÃO 100.00
EBSERH-EMP.BR.SERVIÇOS HOSPIT. 100.00 CBTU-CIA BR. TRENS URBANOS 99.99
EMBRAPA-EMP.BR.PESQUISA AGROP. 100.00 HNSC-HOSP.N.S.CONCEIÇÃO 99.99
EPE-EMP.PESQ.ENERGÉTICA 100.00 TRENSURB-EMP.TR.URB.P.ALEGRE 99.88
EPL SA-EMP.PLANEJ.LOGÍSTICA 100.00
HCPA-HOPS.CLÍNICAS PORTO ALEGRE 100.00
IMBEL-IND. MATERIAL BÉLICO DO BR 100.00
VALEC ENG.CONSTR.FERROVIAS S.A. 100.00
6 Listed
%26 state-owned %
Controlling stake - 148 companies
CDC-CIA DOCAS DO CEARÁ
CEASAMINAS-CENT.ABAST.MG
CEAGESP-CIA ENTREP.ARMAZ.SP
Direct control - 47 Companies
3 Dependents (non-listed)
ALCANTRA CYCLONE SPAC
CASEMG-CIA ARMAZ. SILOS DE MG
CDP-CIA DOCAS DO PARÁ
1 Binational
company%
BANCO DO BRASIL
BNB - BANCO DO NORDESTE
BASA-BANCO DA AMAZÔNIA
20 mixed public-private
capital companies
62
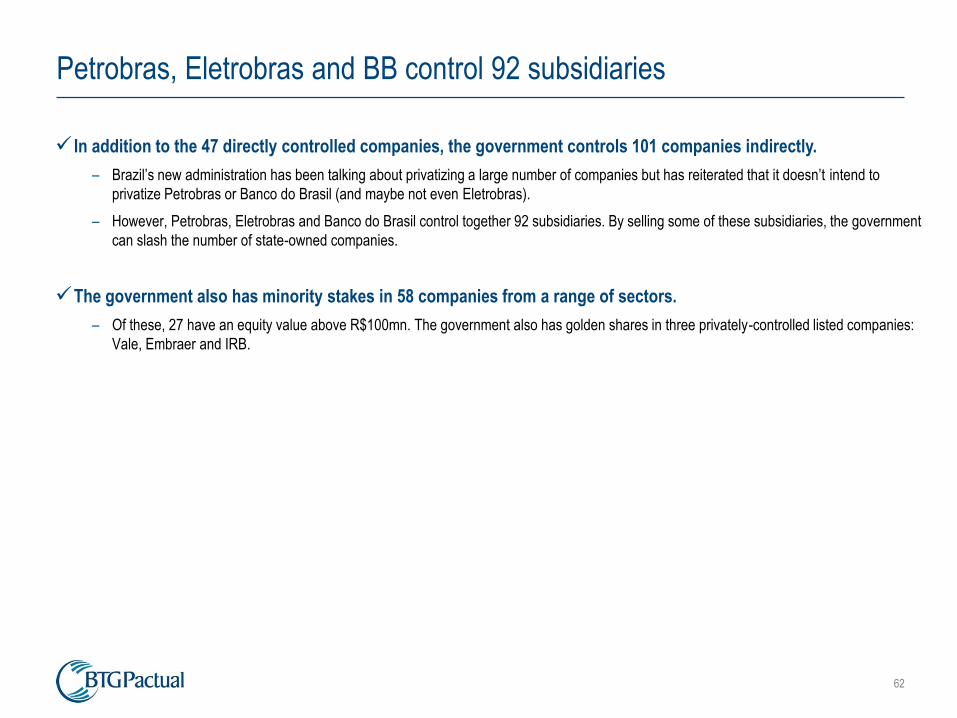
Petrobras, Eletrobras and BB control 92 subsidiaries
✓ In addition to the 47 directly controlled companies, the government controls 101 companies indirectly.
– Brazil’s new administration has been talking about privatizing a large number of companies but has reiterated that it doesn’t intend to
privatize Petrobras or Banco do Brasil (and maybe not even Eletrobras).
– However, Petrobras, Eletrobras and Banco do Brasil control together 92 subsidiaries. By selling some of these subsidiaries, the government
can slash the number of state-owned companies.
✓The government also has minority stakes in 58 companies from a range of sectors.
– Of these, 27 have an equity value above R$100mn. The government also has golden shares in three privately-controlled listed companies:
Vale, Embraer and IRB.

63
Broad privatization program could slash debt levels
✓Big companies under control
– The book value of the government´s stakes in the 47 companies it directly controls was R$270bn at the end of 2017. In 2014, before the
write-downs at Petrobras and Caixa, the book value of these stakes was R$314bn.
Book value of government´s direct stakes in 47 companies
Source: Finance Ministry report on Brazilian government’s ownership stakes
46 53
96 95 98 100 8973 72 76
37 33
31 34 29 2623
17 18 1920 24
30 34 33 3540
36 394425
28
66 6152 61
66
3155
63
1313
15 2025
3562
26
27
34
2728
3237 40
36
34
22
18
34
2008 2009 2010 2011 2012 2013 2014 2015 2016 2017
Petrobras Eletrobras BB BNDES Caixa Others
270
229
205
314
293277281
270
179168

64
Profits of state-owned companies have plummeted
✓The three big listed state-owned companies were trading at or below their book values at the end of 2017.
✓The profits generated by government-controlled companies have also plummeted in recent years, as shown in the
table below.
Price/Book Value: Petrobras, Eletrobras and Caixa
Source: Finance Ministry report on Brazilian government’s ownership stakes
0.41 x
0.84 x
0.15 x
0.39 x
0.52 x
0.22 x
0.83 x
0.92 x
0.72 x
0.82 x
1.03 x
0.58 x
1.03 x
0.79 x
0.50 x
Petrobras BB Eletrobras
2014 2015 2016 2017 3Q18
Earnings of companies directly controlled by the government (R$mn)
Source: Finance Ministry report on Brazilian government’s ownership stakes
Caixa
-4,434 -3,154
2012
-1,764
41,980
-6,879
6,066
-6,287
1,452
44,822 -1,153 -32,782 2,193 24,162
-2,984
20,895 23,408 -21,692 -34,836
-3,428 -9,609
3,426
6,723 7,092 5,797 3,702
-3,031 -14,442
8,594 6,199 6,392
-14,824 -446
12,462
6,183
Total
Other
Eletrobras
Petrobras
BNDES
Company 20172016201520142013
Banco do Brasil 10,8817,93014,10911,31315,81012,310
8,136 8,150

65
State-owned companies have been draining cash
✓Consistent negative contributions
– State-owned companies have consistently negatively contributed
to the country’s fiscal accounts. In other words, the government is
having to put more money into state-owned companies
(capitalizations + debt financing) than it has been able to collect
(dividends + interest).
– The amount of money required to fund these companies’ deficits
has been growing consistently, rising from R$6.5bn in 2012 to
~R$15bn in 2017.
– In the past 5 years, except for 2014, the government has pumped
more money into state-owned companies than it has taken out. In
2016 and 2017, the money-in/money-out ratio was as low as 0.2x
and 0.3x, respectively.
Direct subsidies for state-owned companies (R$mn)
Source: Finance Ministry report on Brazilian government’s ownership stakes
6,533
8,229
9,856
11,146
13,348
14,841
2012 2013 2014 2015 2016 2017
Costs vs. returns of state-owned companies (R$mn)
Source: Finance Ministry report on Brazilian government’s ownership stakes
2012
2013
2014
2015
2016
2017
Total
Costs (R$ thousands) Return (R$ thousands)
0.9830,166,39127,775,0512,391,34030,917,3106,531,679
Year Hybrid Instruments Subsidy Total CostsInterest Income
(Hybrid Instruments)
142,490,12063,953,10345,099,99633,437,021
21,099,997
Return/CostsAFCI
3,285,634
Dividends Total Return
22,014,80113,348,53608,666,265
20,175,30014,840,91005,334,390
15,988,5329,856,531999,9995,132,002
16,779,94311,145,85705,634,086
36,614,2348,229,59023,000,0005,384,644 16,909,531 18,282,547 0.50
2,779,339 18,905,531 21,684,870 1.36
1,373,016
11,918,521 83,968,544 95,887,065 0.67
2,677,569 12,044,357 14,721,926 0.88
1,668,075 2,835,828 4,503,903 0.20
1,029,182 5,498,246 6,527,428 0.32

The Brazilian economy(Claudio Ferraz & team)

67
Summary – Baseline scenario and risks
67
➢ Recovery gains traction. The weak performance of the economy involved both cyclical and structural/persistent aspects. But, consistent signs of
recovery begin to emerge. Slack remains significant.
➢ Benign inflation outlook. 12-month accumulated inflation at 3.3%p.a. in November and should accelerate towards ~4.0% at YE19 due totemporary price shocks. However, core and services inflation stand at historically low levels. Also, forecasts point to IPCA inflation well below targetin 2020.
➢ Selic rate. Conditional inflation forecasts indicate room for the easing cycle to continue a little further. Language has been more cautious at themargin.
➢ Fiscal performance improves. Spending cap can be met in 2020/22. Debt remains high but may have peaked. Pension reform was key andadditional fiscal measures should be implemented (“More Brazil” Plan). Execution needs to be monitored.
➢ External position. Strong FDI inflow and high level of reserves. Current account deficit (revised series) has increased markedly due to diminishedtrade balance and income account outflows. There is an ongoing structural change in the FX market.
➢ Accelerating growth with continued reforms and increased confidence should help the overall environment in 2020. But, the evolution of
the international setting will also play a key role.

Economic Activity
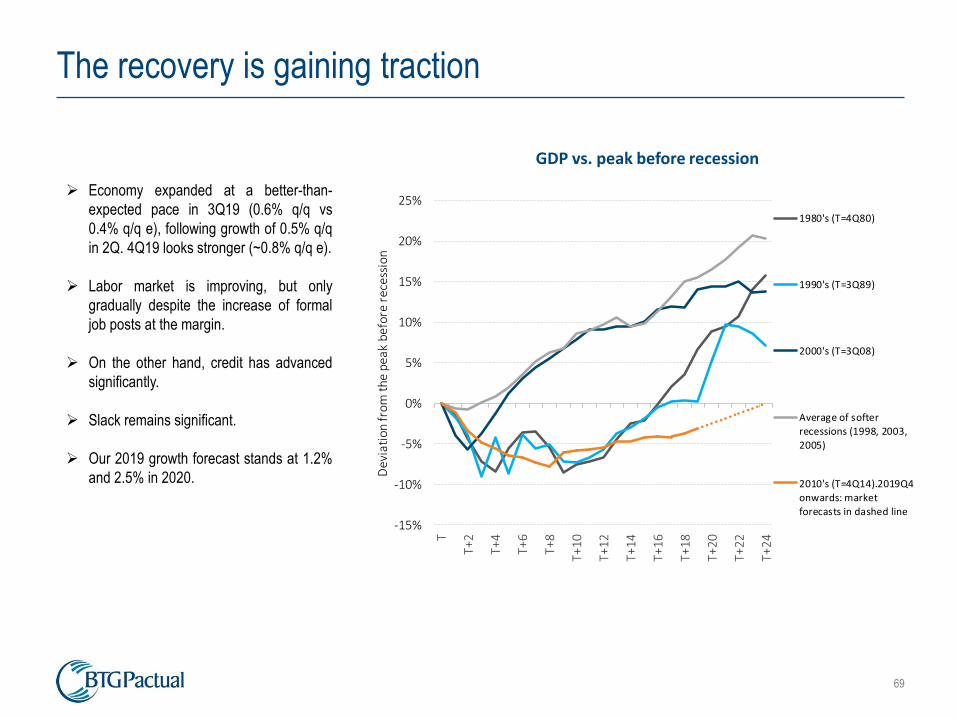
69
GDP vs. peak before recession
-15%
-10%
-5%
0%
5%
10%
15%
20%
25%
T
T+2
T+4
T+6
T+8
T+1
0
T+
12
T+1
4
T+1
6
T+
18
T+
20
T+2
2
T+2
4
Dev
iati
on fr
om th
e pe
ak b
efor
e re
cess
ion
1980's (T=4Q80)
1990's (T=3Q89)
2000's (T=3Q08)
Average of softer
recessions (1998, 2003,
2005)
2010's (T=4Q14).2019Q4
onwards: market
forecasts in dashed line
➢ Economy expanded at a better-than-
expected pace in 3Q19 (0.6% q/q vs
0.4% q/q e), following growth of 0.5% q/q
in 2Q. 4Q19 looks stronger (~0.8% q/q e).
➢ Labor market is improving, but only
gradually despite the increase of formal
job posts at the margin.
➢ On the other hand, credit has advanced
significantly.
➢ Slack remains significant.
➢ Our 2019 growth forecast stands at 1.2%
and 2.5% in 2020.
The recovery is gaining traction

70
Public sector engine has lost steam
Government Consumption
-5%
0%
5%
10%
15%
20%
t+0
t+1
t+2
t+3
t+4
t+5
t+6
t+7
t+8
t+9
t+1
0
t+1
1
t+1
2
t+1
3
t+1
4
t+1
5
t+1
6
t+1
7
t+1
8
t+1
9
t+2
0
t+2
1
t+2
2
t+2
3
t+2
4
De
viat
ion
fro
m p
eak
be
fore
th
e r
ece
ssio
n
Jun-16 Sep-14
Sep-02 Jun-11
Jun-04 Average others
Federal Budget - Investment
0.50%
0.60%
0.70%
0.80%
0.90%
1.00%
1.10%
1.20%
1.30%
1.40%
1.50%
De
c-0
7
Jul-
08
Fe
b-0
9
Se
p-0
9
Ap
r-1
0
No
v-1
0
Jun
-11
Jan
-12
Au
g-1
2
Ma
r-1
3
Oct
-13
Ma
y-1
4
De
c-1
4
Jul-
15
Fe
b-1
6
Se
p-1
6
Ap
r-1
7
No
v-1
7
Jun
-18
Jan
-19
Au
g-1
9
%
of
GD
P

71Source: BTG Pactual
Dec-18 Jan-19 Feb-19 Mar-19 Apr-19 May-19 Jun-19 Jul-19 Aug-19 Sep-19 Oct-19 Nov-19
Employment growth (IBGE) 2.0% 1.8% 1.7% 2.0% 2.5% 3.0% 3.4% 3.5% 3.3% 2.8% 2.5%
Supermarket sales (ABRAS) 2.5% 2.6% 2.3% 1.4% 1.6% 1.6% 2.5% 2.4% 3.0% 2.9%
Heavy vehicles traffic (ABCR) 2.2% 2.3% 3.4% 2.7% 2.1% 6.2% 5.4% 6.0% 0.7% 2.8% 3.1%
Auto sales (Fenabrave) 3.8% 3.3% 3.8% 3.5% 3.3% 3.1% 3.5% 3.7% 2.6% 2.7% 2.3% 2.8%
New payroll jobs (CAGED) 2.6% 2.2% 2.4% 1.5% 1.7% 0.9% 1.6% 1.7% 2.2% 2.4% 2.7%
Construction supplies (IBGE) 1.7% 1.2% 2.0% 1.9% 1.9% 2.9% 3.0% 3.2% 1.6% 2.2% 2.0%
Auto production (Anfavea) 1.1% 0.6% 1.5% 1.8% 2.1% 2.4% 2.5% 2.8% 1.5% 2.2% 2.2%
Broad retail sales (IBGE) 2.2% 2.0% 1.6% 1.6% 1.2% 1.9% 2.1% 2.8% 2.0% 1.9%
Manufacturing production (IBGE) 1.1% 0.6% 1.4% 1.3% 1.6% 2.8% 2.8% 2.7% 0.7% 1.6% 2.3%
Core retail sales (IBGE) 1.7% 1.7% 1.4% 1.3% 0.9% 0.7% 0.7% 1.4% 1.4% 1.6%
Industrial production (IBGE) 1.3% 0.8% 1.3% 0.9% 0.6% 1.5% 1.6% 1.7% 0.3% 1.4% 2.0%
Household credit growth (CB) -0.2% 0.0% 0.3% 0.4% 0.4% 0.4% 0.4% 0.7% 1.0% 1.2% 1.4%
Cardboard expedition (ABPO) 1.2% 0.4% 0.9% 0.6% 1.0% 4.4% 2.4% 2.2% -1.8% 0.9% 1.3%
Real wage bill growth (IBGE) 1.4% 1.5% 1.6% 1.7% 1.7% 1.5% 1.3% 1.2% 1.0% 0.9% 1.0%
Real wage growth (IBGE) 1.5% 1.6% 1.8% 1.7% 1.5% 1.1% 0.8% 0.7% 0.7% 0.8% 1.0%
Mining production (IBGE) 2.5% 2.4% 1.6% 0.1% -2.0% -2.5% -2.6% -1.5% -0.3% 0.6% 0.8%
Services output (IBGE) 0.8% 0.8% 1.3% 0.8% 0.3% 0.5% 0.3% 0.8% -0.3% 0.6%
Corporate credit growth (CB) 0.3% 0.4% 0.5% 0.5% 0.5% 0.4% 0.3% 0.2% 0.2% 0.3% 0.3%
Heat Map – Economic ActivityRecovery gain traction

72
Confidence is gaining some traction (again)
72
Source: FGV and BTG Pactual
60
70
80
90
100
110
120Ja
n-1
1
May
-11
Sep
-11
Jan
-12
May
-12
Sep
-12
Jan
-13
May
-13
Sep
-13
Jan
-14
May
-14
Sep
-14
Jan
-15
May
-15
Sep
-15
Jan
-16
May
-16
Sep
-16
Jan
-17
May
-17
Sep
-17
Jan
-18
May
-18
Sep
-18
Jan
-19
May
-19
Sep
-19
Industry
Consumer
Construction
Services
Retail
Confidence Indices, s.a.
But remains below its historical average

73
Sector breakdown
75
80
85
90
95
100
105
110
115
120
125Ja
n-1
1
Jun-
11
No
v-1
1
Ap
r-12
Sep
-12
Feb
-13
Jul-
13
Dec
-13
May
-14
Oct
-14
Mar
-15
Au
g-1
5
Jan
-16
Jun-
16
No
v-1
6
Ap
r-17
Sep
-17
Feb
-18
Jul-1
8
Dec
-18
May
-19
Manufacturing industry
Services
Retail sales
Broad retail sales
Seasonally-adjusted Indices; Jan/11 = 100
Diverging sector performance, but good signs at the margin

74
✓ Major contribution to growth has come from
household consumption
✓ FGTS drawdowns should bring temporary
boost in consumption
✓ Recovery of formal employment and household
credit should boost consumption by 2020
✓ But slowdown in real income and rising in
household debt service ratio need monitoring
Source: IBGE
Household Consumption
-15%
-10%
-5%
0%
5%
10%
15%
20%
25%
30%
t+0
t+1
t+2
t+3
t+4
t+5
t+6
t+7
t+8
t+9
t+1
0
t+1
1
t+1
2
t+1
3
t+1
4
t+1
5
t+1
6
t+1
7
t+1
8
t+1
9
t+2
0
t+2
1
t+2
2
t+2
3
t+2
4
De
viat
ion
fro
m p
eak
be
fore
th
e r
ece
ssio
n
Jun-16 Jun-97 Jun-93
Mar-95 Jun-02 Dec-14
Consumption should continue to be the main growth engine

75
✓ Our results show that the FGTS measure should
increase GDP by 0.5% to be incorporated in 4Q19
and 1Q20 (higher than the government estimated
effect of 0.35% of GDP).
✓ Why should the effect be greater?
1. The 2019 measure will affect ~ 96 million people,
while in 2017 it affected ~ 26 million people;
2. This measure applies to all accounts (inactive and
active), while in 2017 it involved only inactive FGTS
accounts.
3. 80% of FGTS accounts have a balance of up to
R$500
4. Households' financial situation is better than in
2017.
Estimated results for consumption (in log) with and without FGTS
shock in payroll
Source: IBGE and BTG Pactual
FGTS should promote a temporary stimulus

76
Positive signs from CAGED indicate a resumption of formal
employment
Source: IBGE, Ministério da Economia and BTG Pactual
Formal job creation - CAGED vs PNAD (s.a.)
-200
-150
-100
-50
0
50
100
150
200
Apr-
13Au
g-13
Dec
-13
Apr-
14Au
g-14
Dec
-14
Apr-
15Au
g-15
Dec
-15
Apr-
16Au
g-16
Dec
-16
Apr-
17Au
g-17
Dec
-17
Apr-
18Au
g-18
Dec
-18
Apr-
19Au
g-19
Thou
sand
s
PNAD (mm12m) Caged (mm12m)
New employment contracts - % total admitted
0.0%
0.2%
0.4%
0.6%
0.8%
1.0%
1.2%
1.4%
1.6%
1.8%
2.0%
No
v-17
Dec
-17
Jan-
18Fe
b-1
8M
ar-1
8A
pr-
18
May
-18
Jun-
18Ju
l-18
Au
g-18
Sep
-18
Oct
-18
No
v-18
Dec
-18
Jan-
19Fe
b-1
9M
ar-1
9A
pr-
19
May
-19
Jun-
19Ju
l-19
Au
g-19
Sep
-19
Oct
-19
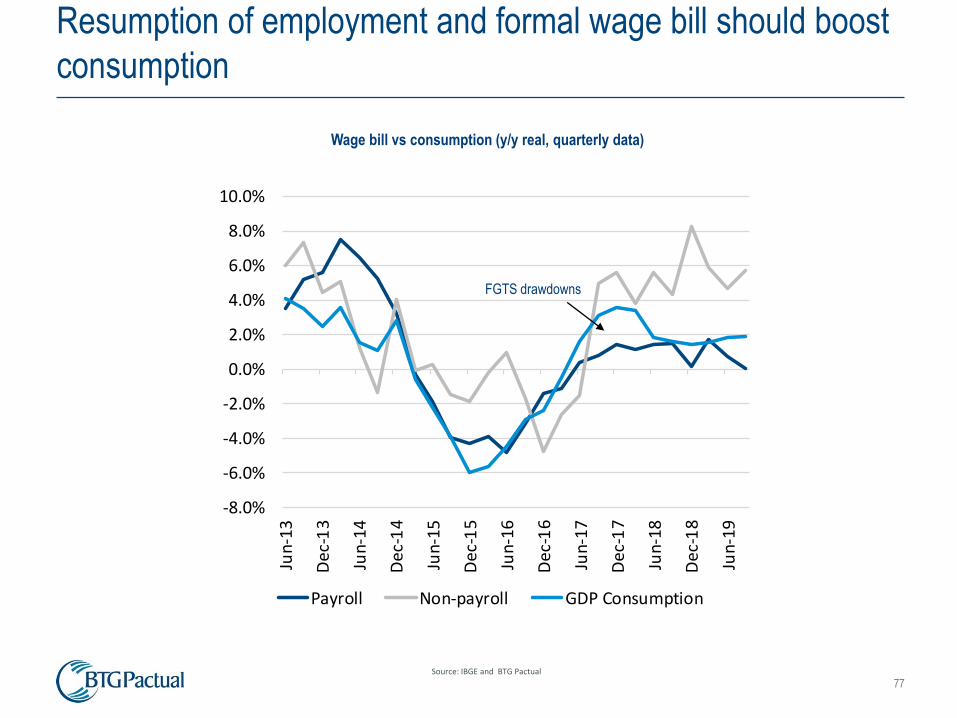
77
Resumption of employment and formal wage bill should boost
consumption
-8.0%
-6.0%
-4.0%
-2.0%
0.0%
2.0%
4.0%
6.0%
8.0%
10.0%
Jun-
13
Dec
-13
Jun-
14
Dec
-14
Jun-
15
Dec
-15
Jun-
16
Dec
-16
Jun-
17
Dec
-17
Jun-
18
Dec
-18
Jun-
19
Payroll Non-payroll GDP Consumption
Wage bill vs consumption (y/y real, quarterly data)
FGTS drawdowns
Source: IBGE and BTG Pactual

78
Employment recovery should have positive effect on
consumer confidence
Source: FGV
Consumer confidence by household income groups (s.a.)
60.0
70.0
80.0
90.0
100.0
110.0
120.0
Sep
-10
Ap
r-11
No
v-11
Jun-
12
Jan-
13
Au
g-13
Mar
-14
Oct
-14
May
-15
Dec
-15
Jul-1
6
Feb
-17
Sep
-17
Ap
r-18
No
v-18
Jun-
19
Below R$2.1kR$2.1k - R$4.8kR$4.8k - R$9.6kAbove R$9.6k
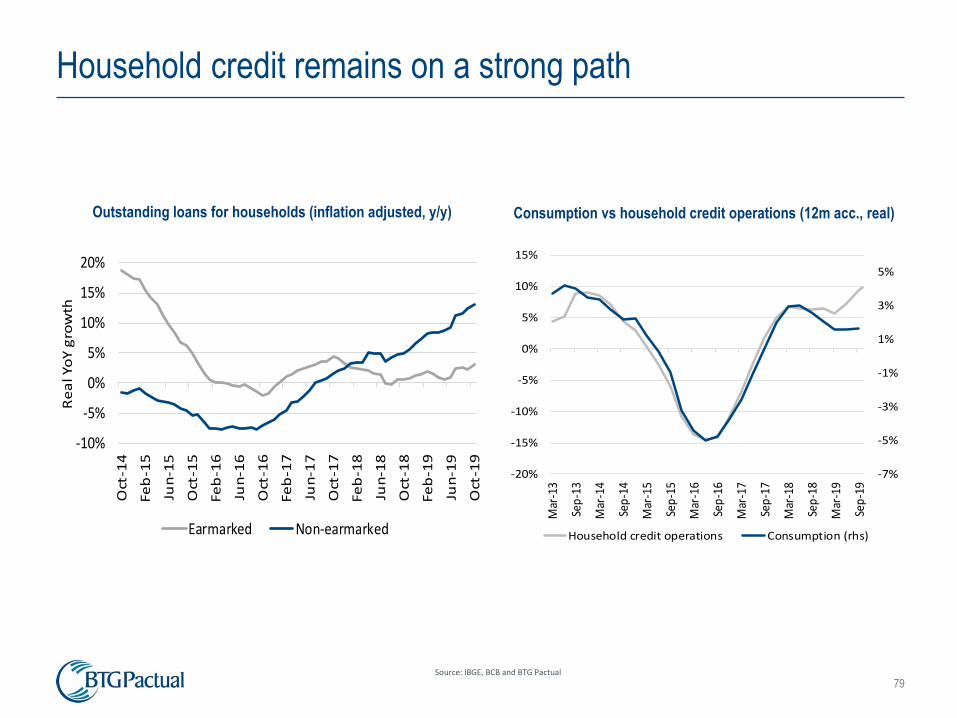
79
Household credit remains on a strong path
Source: IBGE, BCB and BTG Pactual
Outstanding loans for households (inflation adjusted, y/y)
-10%
-5%
0%
5%
10%
15%
20%
Oct
-14
Fe
b-1
5
Jun
-15
Oct
-15
Fe
b-1
6
Jun
-16
Oct
-16
Fe
b-1
7
Jun
-17
Oct
-17
Fe
b-1
8
Jun
-18
Oct
-18
Fe
b-1
9
Jun
-19
Oct
-19
Re
al Yo
Y g
row
th
Earmarked Non-earmarked
Consumption vs household credit operations (12m acc., real)
-7%
-5%
-3%
-1%
1%
3%
5%
-20%
-15%
-10%
-5%
0%
5%
10%
15%
Mar
-13
Sep
-13
Mar
-14
Sep
-14
Mar
-15
Sep
-15
Mar
-16
Sep
-16
Mar
-17
Sep
-17
Mar
-18
Sep
-18
Mar
-19
Sep
-19
Household credit operations Consumption (rhs)

80
But the labor market is still weakVery gradual decline of the unemployment rate
Unemployed by time spent seeking employment
(% of total unemployment, s.a.)
Source: IBGE and BTG Pactual
31
33
35
37
39
41
43
57
59
61
63
65
67
69
Mar
-12
Jul-
12
Nov
-12
Mar
-13
Jul-
13
Nov
-13
Mar
-14
Jul-
14
Nov
-14
Mar
-15
Jul-
15
Nov
-15
Mar
-16
Jul-
16
Nov
-16
Mar
-17
Jul-
17
Nov
-17
Mar
-18
Jul-
18
Nov
-18
Mar
-19
Less than 1 year Over 1 year (rhs)
Labor underutilization, s.a. %
12.0
24.1
5
10
15
20
25
30
Ma
r-12
Au
g-1
2
Jan
-13
Jun
-13
No
v-1
3
Ap
r-1
4
Sep
-14
Feb
-15
Jul-
15
De
c-15
Ma
y-1
6
Oct
-16
Ma
r-17
Au
g-1
7
Jan
-18
Jun
-18
No
v-1
8
Ap
r-1
9
Sep
-19
Unemployment rate Labor underutilization rate

81
Real wage drop calls attention
Average income (y/y)
-6
-4
-2
0
2
4
6
8
10
12
Oct
-13
Ap
r-14
Oct
-14
Ap
r-15
Oct
-15
Ap
r-16
Oct
-16
Ap
r-17
Oct
-17
Ap
r-18
Oct
-18
Ap
r-19
Oct
-19
Nominal Real
Source: IBGE
Average income per segment (y/y real)
-8.0
-6.0
-4.0
-2.0
0.0
2.0
4.0
6.0
8.0
10.0
Mar
-13
Au
g-13
Jan-
14
Jun-
14
No
v-14
Ap
r-1
5
Sep
-15
Feb
-16
Jul-1
6
Dec
-16
May
-17
Oct
-17
Mar
-18
Au
g-18
Jan-
19
Jun-
19
Payroll Non-payroll
Public sector Self-employment

82
Interest still high for the segment, despite the fall of Selic
Source: BCB and Bloomberg
Household interest vs interbank interest (% y/y)
27
32
37
42
47
52
57
62
67
72
3
8
13
18
23M
ar-1
2
Sep
-12
Mar
-13
Sep
-13
Mar
-14
Sep
-14
Mar
-15
Sep
-15
Mar
-16
Sep
-16
Mar
-17
Sep
-17
Mar
-18
Sep
-18
Mar
-19
Sep
-19
Swap DI-Pre 360
Household interest - non earmarked (rhs)
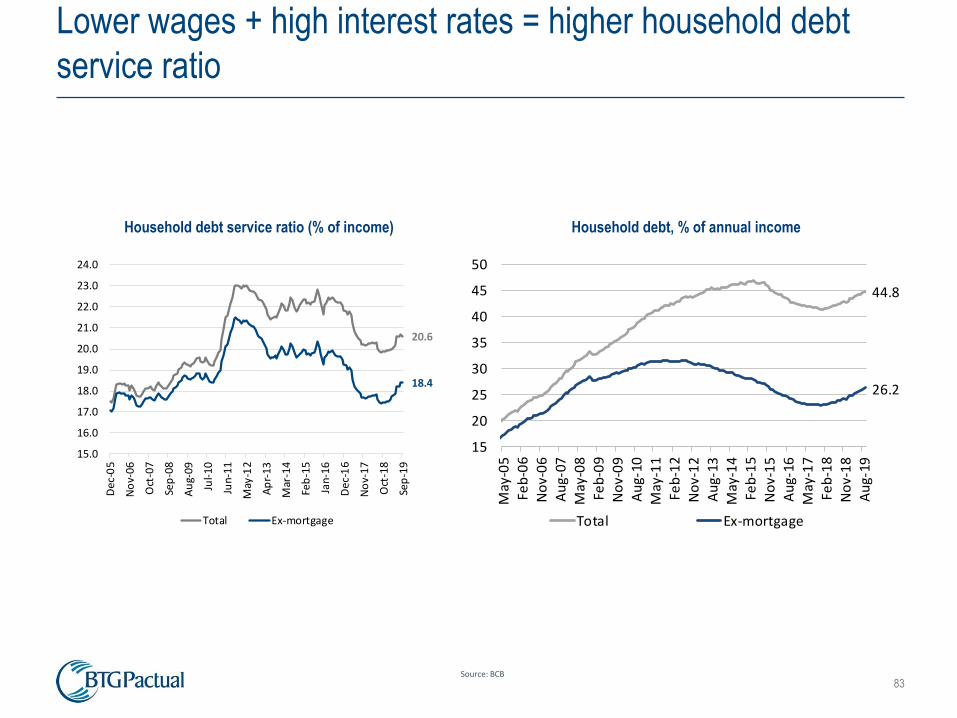
83
Lower wages + high interest rates = higher household debt
service ratio
Household debt service ratio (% of income)
20.6
18.4
15.0
16.0
17.0
18.0
19.0
20.0
21.0
22.0
23.0
24.0
Dec
-05
No
v-0
6
Oct
-07
Sep
-08
Au
g-0
9
Jul-
10
Jun
-11
May
-12
Ap
r-1
3
Mar
-14
Feb
-15
Jan
-16
Dec
-16
No
v-1
7
Oct
-18
Sep
-19
Total Ex-mortgage
Source: BCB
Household debt, % of annual income
44.8
26.2
15
20
25
30
35
40
45
50
May
-05
Feb
-06
No
v-0
6A
ug-
07M
ay-0
8Fe
b-0
9N
ov-
09
Au
g-10
May
-11
Feb
-12
No
v-1
2A
ug-
13M
ay-1
4Fe
b-1
5N
ov-
15
Au
g-16
May
-17
Feb
-18
No
v-1
8A
ug-
19
Total Ex-mortgage

84
✓ Loose financial conditions should boost credit
(including banking) and contribute to a resumption of
investment
✓ Civil construction gives positive signs, although still
incipient
✓ A big risk could come from an external negative
shock (trade war, slowdown in Argentina, etc.)
✓ Government concessions and privatizations so far
were timid.
✓ Fiscal adjustment should continue to weigh on
investments.
90
100
110
120
130
140
150
160
170
180
3T05
2T06
1T07
4T07
3T08
2T09
2T10
1T11
4T11
3T12
2T13
1T14
4T14
3T15
2T16
1T17
4T17
3T18
2T19
Household consumption Investments
Consumption vs Investments (s.a.)
24% below
peak
Source: IBGE
Investments could show a better performance in 2020

85
Financial conditions are loose and should drive the resumption
of investments
85
Financial conditions vs investiments (y/y)
Financial conditions componentes (z-scores)
-4
-3
-2
-1
0
1
2
3
4
jan
/16
ab
r/1
6
jul/
16
ou
t/1
6
jan
/17
ab
r/1
7
jul/
17
ou
t/1
7
jan
/18
ab
r/1
8
jul/
18
ou
t/1
8
jan
/19
ab
r/1
9
jul/
19
ou
t/1
9
Ibovespa CDS 5Y
USDBRL VIX
Ex-ante interest rate CRB
Source: Bloomberg and BTG Pactual
-30%
-20%
-10%
0%
10%
20%
30%
-2.0
-1.5
-1.0
-0.5
0.0
0.5
1.0
1.5
2.0
mar
/03
jan
/04
no
v/0
4
set/
05
jul/
06
mai
/07
mar
/08
jan
/09
no
v/0
9
set/
10
jul/
11
mai
/12
mar
/13
jan
/14
no
v/1
4
set/
15
jul/
16
mai
/17
mar
/18
jan
/19
no
v/1
9
Financial Conditions* (1 quarter lag) Investments (y/y, rhs)

86
Shrinking bank credit has been compensated by access to
capital markets
Source: BCB
Broad outstanding loans – non-financial companies (s.a., constant prices)
2.5
2.7
2.9
3.1
3.3
3.5
3.7
300
500
700
900
1,100
1,300
1,500
Oct
-14
Feb
-15
Jun-
15
Oct
-15
Feb
-16
Jun-
16
Oct
-16
Feb
-17
Jun-
17
Oct
-17
Feb
-18
Jun-
18
Oct
-18
Feb
-19
Jun-
19
Oct
-19
R$
tri
llio
ns
R$
bil
lio
ns
Earmarked Non-earmarked Debentures
External Debt Total (rhs)

87
Drag from shrinking public credit is probably over?
Source: BCB
0
100
200
300
400
500
600
700
800
900
Jun
-00
Sep
-01
De
c-0
2
Mar
-04
Jun
-05
Sep
-06
De
c-0
7
Mar
-09
Jun
-10
Sep
-11
De
c-1
2
Mar
-14
Jun
-15
Sep
-16
De
c-1
7
Mar
-19
Bil
lio
ns
Descontinued series New series Trend 00-07
BNDES total outstanding loans (constant prices)
Discontinued series
0
200
400
600
800
1,000
1,200
1,400
Mar
-07
Mar
-08
Mar
-09
Mar
-10
Mar
-11
Mar
-12
Mar
-13
Mar
-14
Mar
-15
Mar
-16
Mar
-17
Mar
-18
Mar
-19
Bill
ions
BNDES State-owned banks - ex. BNDES
Total outstanding loans (constant prices)

88
Construction sector shows visible signs of recovery
Source: IBGE and FGV
55
65
75
85
95
105
115
Jul-1
0
Feb
-11
Sep
-11
Ap
r-1
2
No
v-12
Jun-
13
Jan-
14
Au
g-14
Mar
-15
Oct
-15
May
-16
Dec
-16
Jul-1
7
Feb
-18
Sep
-18
Ap
r-1
9
No
v-19
Constuction
Buldings
Infrastructure
Construction confidence indexes (s.a.)Typical construction materials (q/q, s.a.)
-16%
-12%
-8%
-4%
0%
4%
8%
12%
16%
-450
-350
-250
-150
-50
50
150
250
350
450
Mar
-96
Dec
-97
Sep
-99
Jun-
01
Mar
-03
Dec
-04
Sep
-06
Jun-
08
Mar
-10
Dec
-11
Sep
-13
Jun-
15
Mar
-17
Dec
-18
Tho
usa
nd
s
CAGED construction GDP construction (rhs)

89
Lack of confidence has held back recovery of investments
Source: IBGE and FGV
Business confidence (s.a.) vs investiments (y/y)
-30%
-20%
-10%
0%
10%
20%
30%
65
75
85
95
105
115
125
Jun
-01
Jul-0
2
Au
g-0
3
Sep
-04
Oct
-05
No
v-06
Dec
-07
Jan-
09
Feb
-10
Mar
-11
Ap
r-1
2
May
-13
Jun
-14
Jul-1
5
Au
g-1
6
Sep
-17
Oct
-18
No
v-19
Business confidence Investments (rhs)

90
Global slowdown seems to explain recent confidence
worsening
Source: IBGE and FGV
Industry confidence indexes (s.a.)
40.0
50.0
60.0
70.0
80.0
90.0
100.0
110.0
120.0
130.0
140.0
Jan-
01
Mar
-02
May
-03
Jul-0
4
Sep
-05
No
v-06
Jan-
08
Mar
-09
May
-10
Jul-1
1
Sep
-12
No
v-13
Jan-
15
Mar
-16
May
-17
Jul-1
8
Sep
-19
External demand Domestic demand
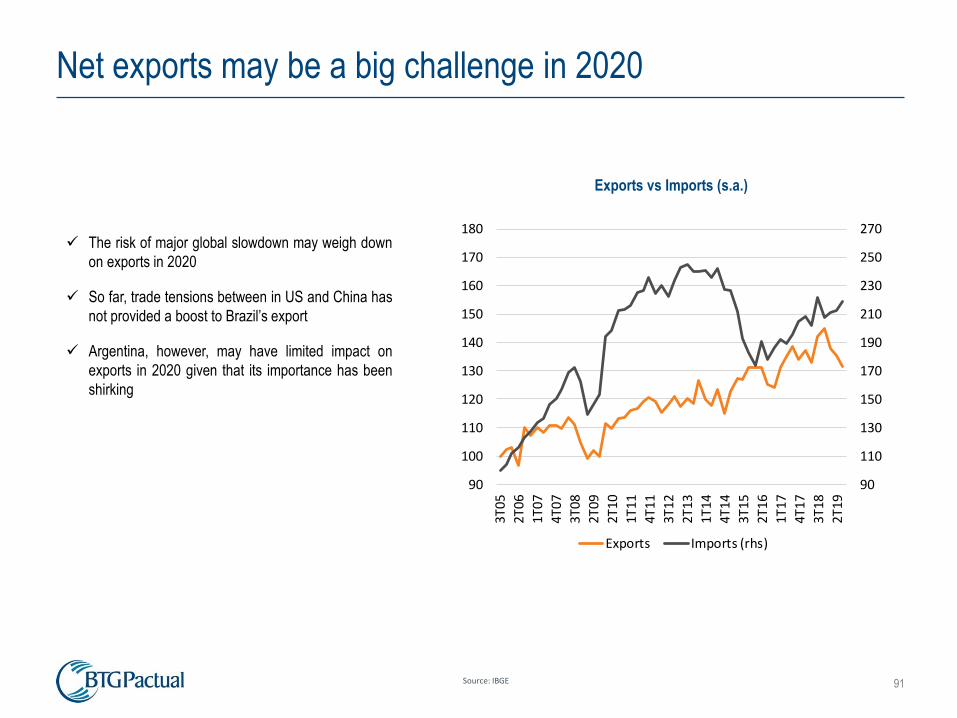
91Source: IBGE
90
110
130
150
170
190
210
230
250
270
90
100
110
120
130
140
150
160
170
180
3T05
2T06
1T07
4T07
3T08
2T09
2T10
1T11
4T11
3T12
2T13
1T14
4T14
3T15
2T16
1T17
4T17
3T18
2T19
Exports Imports (rhs)
Exports vs Imports (s.a.)
✓ The risk of major global slowdown may weigh down
on exports in 2020
✓ So far, trade tensions between in US and China has
not provided a boost to Brazil’s export
✓ Argentina, however, may have limited impact on
exports in 2020 given that its importance has been
shirking
Net exports may be a big challenge in 2020

92
Exports already declining with global slowdown
Source: Funcex
Exports (12 month change)
-20%
-15%
-10%
-5%
0%
5%
10%
15%
20%
Au
g-1
0
Fe
b-1
1
Au
g-1
1
Fe
b-1
2
Au
g-1
2
Fe
b-1
3
Au
g-1
3
Fe
b-1
4
Au
g-1
4
Fe
b-1
5
Au
g-1
5
Fe
b-1
6
Au
g-1
6
Fe
b-1
7
Au
g-1
7
Fe
b-1
8
Au
g-1
8
Fe
b-1
9
Au
g-1
9
GDP - exports Funcex - Exports
% of exports to Argentina
0%
2%
4%
6%
8%
10%
12%
14%
16%
Jan
-97
Jun
-98
No
v-9
9
Ap
r-0
1
Se
p-0
2
Fe
b-0
4
Jul-
05
De
c-0
6
May
-08
Oct
-09
Mar-
11
Au
g-1
2
Jan
-14
Jun
-15
No
v-1
6
Ap
r-1
8
Se
p-1
9
0
10
20
30
40
50
60
70
80
No
v-0
2
No
v-0
3
No
v-0
4
No
v-0
5
No
v-0
6
No
v-0
7
No
v-0
8
No
v-0
9
No
v-1
0
No
v-1
1
No
v-1
2
No
v-1
3
No
v-1
4
No
v-1
5
No
v-1
6
No
v-1
7
No
v-1
8
No
v-1
9
Th
ou
sa
nd
s
Vehicle exports 3-month moving average
Vehicle exports (s.a.)

93
Conclusion: Growth should accelerate to 2.5% in 2020
Source: IBGE and BTG Pactual
GDP growth (annual)
4.0%
6.1%
5.1%
-0.1%
7.5%
4.0%
1.9%
3.0%
0.5%
-3.5%-3.3%
1.3% 1.3% 1.2%
2.5%

94
Slack remains large
GDP gap, s.a.
Source: IBGE and BTG Pactual

95
2019 GDP forecast updated to 1.2% (from 1.0%)
and 2020 to 2.5% (vs. 2.3%)
95
Source: BTG Pactual
GDPHousehold
Consumption
Govt.
ConsumptionInvestments Exports Imports Agriculture Industry Services Taxes
2014 0.5 2.3 0.8 -4.2 -1.6 -2.3 2.8 -1.5 1.0 0.8
2015 -3.5 -3.2 -1.4 -13.9 6.8 -14.2 3.3 -5.8 -2.7 -6.0
2016 -3.3 -3.9 0.2 -12.1 0.9 -10.3 -5.2 -4.6 -2.3 -5.6
2017 1.1 1.4 -0.9 -2.5 5.2 5.0 12.5 -0.5 0.5 1.5
2018 1.1 1.9 0.0 4.1 4.1 8.5 0.1 0.6 1.3 1.4
2019 1.2 1.9 -0.5 3.4 -2.6 2.5 1.7 0.5 1.2 1.6
2020 2.5 2.5 0.0 5.1 2.5 3.8 2.7 3.2 2.0 3.0

96
Beware of some structural factorsPopulation growth has decreased
96
Working-age population growth y/y Accumulated impact on potential GDP level
(Working-age population growth from 1.5% to 1% y/y / alpha=0.4)
-0.3%
-0.6%
-0.9%-1.0%
-0.9%
-0.8%
-0.7%
-0.6%
-0.5%
-0.4%
-0.3%
-0.2%
-0.1%
0.0%
2018 2019 2020 2021
0.9%
1.5%
0%
1%
2%
3%
4%
5%
6%
Sep
-93
Mar
-95
Sep
-96
Mar
-98
Sep
-99
Mar
-01
Sep
-02
Mar
-04
Sep
-05
Mar
-07
Sep
-08
Mar
-10
Sep
-11
Mar
-13
Sep
-14
Mar
-16
Sep
-17
Mar
-19
Average of
2008-17:

Inflation

98Source: IBGE and BTG Pactual
✓ Sizable slack favors contained inflationary
pressures.
✓ Most underlying inflation measures keep running at
a muted pace.
✓ Medium and long-term inflation expectations
remain well-anchored, amidst declining inflation
targets.
✓ Central Bank strong credibility should maintain
inflation expectations anchored despite the BRL
more volatile environment.
✓ Our expectation for the IPCA is ~4.0% for 2019
(target: 4.25%) and ~3.5-3.6% for 2020 (target:
4.0%).
12-month accumulated inflation, %
3.0
3.3
0
2
4
6
8
10
12
Jan
-12
Au
g-12
Mar
-13
Oct
-13
May
-14
Dec
-14
Jul-
15
Feb
-16
Sep
-16
Ap
r-1
7
No
v-1
7
Jun
-18
Jan
-19
Au
g-19
Headline Average of core measures
Benign inflation scenario

99
Industrial and services inflation at low levels
IPCA inflation, Industrial Goods, % IPCA inflation, Services, %
Source: IBGE and BTG Pactual
0
2
4
6
8
10
12
14
Jan
-10
Jun
-10
No
v-1
0A
pr-
11
Sep
-11
Feb
-12
Jul-
12
Dec
-12
May
-13
Oct
-13
Mar
-14
Au
g-14
Jan
-15
Jun
-15
No
v-1
5A
pr-
16
Sep
-16
Feb
-17
Jul-
17
Dec
-17
May
-18
Oct
-18
Mar
-19
Au
g-19
YoY 3 month acc., s.a., Annualized
-4
-2
0
2
4
6
8
10
Jan
-10
Jun
-10
No
v-1
0A
pr-
11
Sep
-11
Feb
-12
Jul-
12
Dec
-12
May
-13
Oct
-13
Mar
-14
Au
g-14
Jan
-15
Jun
-15
No
v-1
5A
pr-
16
Sep
-16
Feb
-17
Jul-
17
Dec
-17
May
-18
Oct
-18
Mar
-19
Au
g-19
YoY 3 month acc., s.a., annualized

100
So, core inflation measures are also contained
Source: IBGE and BTG Pactual
Average of core measures, %
0
1
2
3
4
5
6
7
8
9
10Ja
n-1
0Ju
n-1
0N
ov-
10
Ap
r-1
1Se
p-1
1Fe
b-1
2Ju
l-1
2D
ec-1
2M
ay-1
3O
ct-1
3M
ar-1
4A
ug-
14Ja
n-1
5Ju
n-1
5N
ov-
15
Ap
r-1
6Se
p-1
6Fe
b-1
7Ju
l-1
7D
ec-1
7M
ay-1
8O
ct-1
8M
ar-1
9A
ug-
19
YoY 3 month acc., s.a., annualized

101
0
20
40
60
80
100
120
140
160
180
200
Jan-
12
Ma
y-1
2
Sep
-12
Jan-
13
May
-13
Sep
-13
Jan-
14
Ma
y-1
4
Sep
-14
Jan-
15
May
-15
Sep
-15
Jan-
16
Ma
y-1
6
Sep
-16
Jan-
17
May
-17
Sep
-17
Jan-
18
May
-18
Sep
-18
Jan-
19
Ma
y-1
9
Sep
-19
Beef Poultry
The bulk of ASF impact in domestic inflation appears to have
materialized in 2019But some residual impact is still expected in 2020
Exports (Quantum), index 2017=100
Source: Secex and BTG Pactual
✓ Since September, the number of slaughter houses
with licenses to export beef to China increased
substantially. This has led to a sharp rise in exports
(and export prices) since October
✓ Coupled with seasonally lower supply and
seasonally higher demand, this caused cattle prices
to soar to record levels, pushing up consumer
prices dramatically
✓ While prices may give a little at the start of 2020 as
demand falls after the holidays (and high prices will
curtail demand), we expect some pressure to
remain through 2020
✓ Chinese protein imports are expected to peak in
2020. Added to that, the Brazilian herd’s internal
dynamics suggest a slowdown in slaughtering is
highly likely next year, thus reducing supply

102
Non-core items: Commodity prices’ decline offset the weaker
2019 BRLFor 2020, commodity futures indicate a moderate acceleration
Source: Bloomberg, IBGE and BTG Pactual
Tradeables’ inflation (y/y) vs. IC-Br commodities index (y/y)
-50
-30
-10
10
30
50
70
90
-7
-2
3
8
13
18
23
20
01
2002
20
03
2004
2005
20
06
2007
2008
2009
2010
20
11
2012
2013
20
14
2015
20
16
2017
2018
20
19
2020
IPCA tradeables YoY IC-Br MM3M YoY t-3m (rhs)
IC-Br - futures (BRL 4.10)

103
Electricity expected to be an important deflationary vectorCosts have fallen for distributors and will lead to lower electricity tariffs
Source: IBGE and BTG Pactual
✓ Hydrological risk has retreated significantly over the
past year. This is the most important factor in for
electric energy prices in 2020
✓ Early payment (in 2019) of a 2014 loan made by
regulators with private banks to rescue failing
energy distributors will reduce debt servicing, thus
lowering tariffs in 2020 (This effect has already
started in 2H19)
✓ Average price of contracted (non-spot) energy
expected to fall in 2020 for some distributors, as
contracts negotiated in 2014 (during the hydrologic
crisis) are expiring.
✓ Assuming constant electricity lags in December, we
expect electricity deflation of -0.8% y/y (vs 5.5% y/y
in 2019)
0
100
200
300
400
500
600
700
800
De
c-1
0
Au
g-1
1
Ap
r-1
2
De
c-1
2
Au
g-1
3
Ap
r-1
4
De
c-1
4
Au
g-1
5
Ap
r-1
6
De
c-1
6
Au
g-1
7
Ap
r-1
8
De
c-1
8
Au
g-1
9
Energy spot price, Southeast, 12 months moving average

104
Inflation expectations remain very well anchored
Source: Central Bank Focus Survey and BTG Pactual
Average of 1y and 2y forward
3.50
4.00
4.50
5.00
5.50
6.00
6.50
7.00
Jan
-11
Jun
-11
No
v-1
1
Ap
r-1
2
Sep
-12
Feb
-13
Jul-
13
De
c-1
3
Ma
y-1
4
Oct
-14
Ma
r-1
5
Au
g-1
5
Jan
-16
Jun
-16
No
v-1
6
Ap
r-1
7
Sep
-17
Feb
-18
Jul-
18
De
c-1
8
Ma
y-1
9
Oct
-19
Avg 1y2y
Midpoint Target+1
Average of 2y and 3y forward
3.50
4.00
4.50
5.00
5.50
6.00
6.50
7.00
Jan
-11
Jun
-11
No
v-1
1
Ap
r-1
2
Sep
-12
Feb
-13
Jul-
13
De
c-1
3
Ma
y-1
4
Oct
-14
Ma
r-1
5
Au
g-1
5
Jan
-16
Jun
-16
No
v-1
6
Ap
r-1
7
Sep
-17
Feb
-18
Jul-
18
De
c-1
8
Ma
y-1
9
Oct
-19
Avg 2y3y
Midpoint Target+2

105
12-month accumulated IPCA and Focus - Expectations Inflection points?
0.0
2.0
4.0
6.0
8.0
10.0
12.0
14.0
16.0
18.0
20.0
Jan
-02
Oct
-02
Jul-
03
Ap
r-0
4
Jan
-05
Oct
-05
Jul-
06
Ap
r-0
7
Jan
-08
Oct
-08
Jul-
09
Ap
r-1
0
Jan
-11
Oct
-11
Jul-
12
Ap
r-1
3
Jan
-14
Oct
-14
Jul-
15
Ap
r-1
6
Jan
-17
Oct
-17
Jul-
18
Ap
r-1
9
Jan
-20
Oct
-20
IPCA
Focus 12m ahead
Headline inflation Inflection point vs 12-month ahead Focus Forecasts
Source: Central Bank Focus Survey and BTG Pactual
IPCA Non-Monitored Food at home Industrials Services Monitored
2018 3.7 2.9 4.5 1.1 3.4 6.2
2019F 4.0 3.5 6.4 1.8 3.3 5.2
2020F 3.5 3.5 6.2 1.6 3.9 3.0

Fiscal Accounts

107
Consolidated Public Sector Accounts: Indebtedness Significant rise of public indebtedness in recent years
➢ Huge amount of capitalization in government
entities, like BNDES and Caixa, helped to
deteriorate indebtedness
➢ From 2007 to 2015, more than R$550bn were
funded by National Treasury to finance government
owned companies.
➢ Thanks to BNDES anticipated repayments, net
debt dynamic was less negative at the margin
➢ Even when not considering international reserves,
public debt in Brazil is close to 60% of GDP, higher
than emerging market peers (51%, on average)
% o
f GD
P
Source: Treasury and BTG Pactual
30%
35%
40%
45%
50%
55%
60%
65%
70%
75%
80%
85%
90%
95%
Dec-0
6Apr-
07
Aug-0
7Dec-0
7Apr-
08
Aug-0
8Dec-0
8Apr-
09
Aug-0
9Dec-0
9Apr-
10
Aug-1
0Dec-1
0Apr-
11
Aug-1
1Dec-1
1Apr-
12
Aug-1
2Dec-1
2Apr-
13
Aug-1
3Dec-1
3Apr-
14
Aug-1
4Dec-1
4Apr-
15
Aug-1
5Dec-1
5Apr-
16
Aug-1
6Dec-1
6Apr-
17
Aug-1
7Dec-1
7Apr-
18
Aug-1
8Dec-1
8Apr-
19
Aug-1
9
Gross Debt (International Methodology)
General Govt Gross Debt
General Govt Gross Debt, Net of International Reserves
Consolidated Net Debt

108
High debt and high tax burden
Gross Debt (% of GDP) – IMF Fiscal Monitor Net Debt (% of GDP) – IMF Fiscal Monitor
Tax Burden (% of GDP) – IMF 2015
% o
f GD
P
103.6
87.9
69.5
50.8
45.0
0 20 40 60 80 100 120
Developed Countries
Brazil
Latin-America
Emerging Markets
Low-Income Countries
75.4
54.1
43.7
36.4
0 10 20 30 40 50 60 70 80
Developed Countries
Brazil
Latin-America
Emerging Markets
0
5
10
15
20
25
30
35
40
Developedeconomies
Brazil Emergingeconomies
Low incomecountries

109
13%
14%
15%
16%
17%
18%
19%
20%
21%
1997
1998
1999
2000
2001
2002
2003
2004
2005
2006
2007
2008
2009
2010
2011
2012
2013
2014
2015
2016
2017
2018
Net Revenue Total Expenditures
% o
f GD
P
➢ From 1998 to 2018, on average, the real growth rate
of non-financial expenditure was 5.2% y/y
➢ Main anchor for spending growth, RGPS pension
increased 6.2% y/y, on average, from 1998 to 2018
➢ Other social expenditures such as salary bonuses
and unemployment insurance, linked to the minimum
wage and inflation, experienced a remarkable
expansion of 6.7% y/y in the same period.
➢ Granting real adjustments to the minimum wage
(price effect) above the average labor market wage
has contributed to the expansion of the potential
beneficiaries (quantity effect) of social policies, such
as the salary bonuses.
Public Sector - Central Government Primary AccountsOn average, expenditues grow above GDP and structurally pressures the fiscal side

110
➢ Extraordinary revenues made a significant
contribution in reversing deficit into surplus
in the late 1990s
➢ For 7 years, from 2002 to 2008, the
average primary surplus was 3.3% of
GDP, strongly supported by recurring
results.
➢ From 2009 to 2014, anticipated dividends
and “Refis” contributed to minimize the
sharp decline in the fiscal balance.
➢ In 2015, the “fiscal pedaling” was paid in
the amount of R$55.6 billion or 0.9% of
GDP.
➢ As of 2016, revenues from repatriation of
capital, “Refis” and Concessions and
Grants sustained the fiscal results.
% o
f GD
P
0.2
0.9 0.80.4 0.3 0.1 0.0 0.1 0.0 0.0 0.1
-0.20.5
1.30.8 1.0 1.2
0.7
-0.4
0.9 1.10.8 0.7
-1.3-0.7
1.41.9
2.4 3.1 3.23.6 3.7
3.1 3.1 3.6
1.5
1.4 2.11.2 0.5
-1.2-1.5
-3.4-2.8
-2.4-2.0
-1.1
0.2
2.3 2.32.8
3.2 3.23.7 3.7
3.2 3.2 3.3
1.9
2.62.9
2.2
1.7
-0.6
-1.9
-2.5-1.7
-1.6-1.3
-4.0
-3.0
-2.0
-1.0
0.0
1.0
2.0
3.0
4.0
5.0
1997 1998 1999 2000 2001 2002 2003 2004 2005 2006 2007 2008 2009 2010 2011 2012 2013 2014 2015 2016 2017 2018 2019*
Non-Recurring Recurring Consolidated
*12 month accumulated - September
Primary Result from Consolidated Public SectorAfter significant deficit in 2016, fiscal consolidation advance gradually

111
Budget RigidityBrazil has the highest rigidity of public spending among LatAm countries
9388
85 85
7875 74
71 70 70 7065
55 55 5349
0
10
20
30
40
50
60
70
80
90
100
More Rigid (+) Less Rígid (-)
% of Required Spending

112
43.5
4.2
9.6
12.4
2.71.3 1.01.03.7
7.9
2.51.0
7.02.2
2017
Source: STN, BTG Pactual
Social security benefits under RGPS
(private-sector employees)
Benefit for the elderly and the disabled
Payroll (central government)
Inactive personnel
Unemployment benefit
Ministry of Health
Ministry of Education
Growth Acceleration Program (PAC) expenditures
Other, executive branch
Social security
expenditures (57.3%)
Personal expenditures
ex-RPPS (12.4%)
Non-earmarked
discretionary (9.2%)
Earmarked
discretionary (11.4%)
Other mandatory
expenditures (9.7%)
Primary expenditures (% of total)
Other mandatory
Salary bonusTax relief
Subsidies and subventions
Legislative and judicial branches,
Federal Prosecution and
Defense Service
20181 Establishes that the primary expenditures cannot increase in real terms.
➢ Social security accounts for 57% of primary
expenditures. With the high level of growth of
expenses with the social security benefits,
other expenditures have to be cut.
➢ However, only ~9% of primary expenditures
(non-earmarked discretionary) can be cut
without changes in the law. Social security
expenditures, other personal expenditures,
other mandatory expenditures, and
discretionary expenditures for healthcare,
education and other areas, account for more
than 90% of the total.
Budget Rigidity
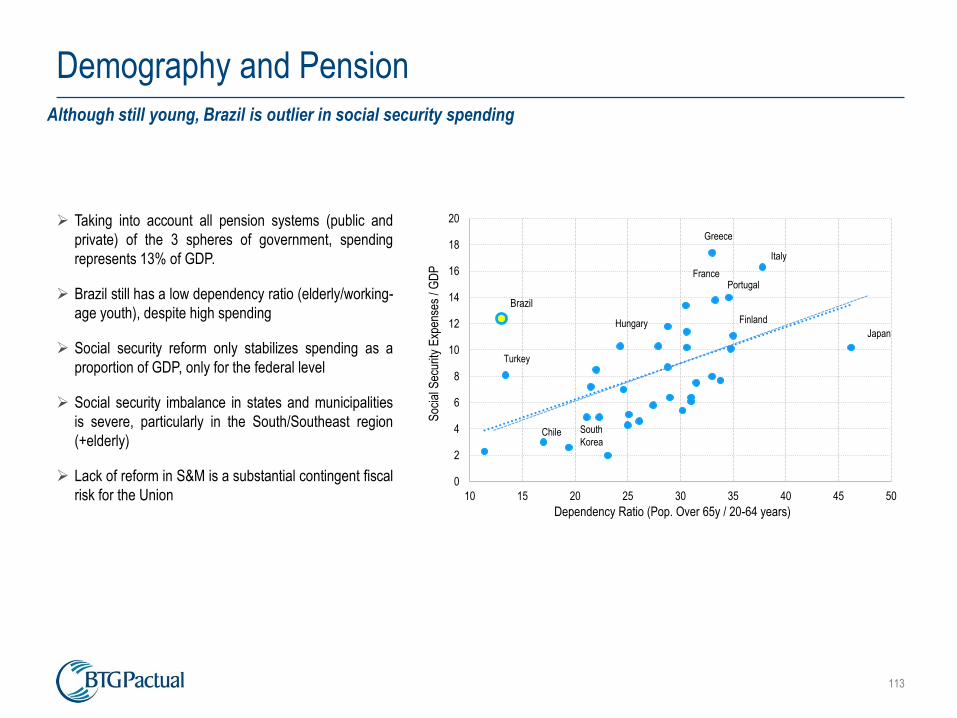
113
➢ Taking into account all pension systems (public and
private) of the 3 spheres of government, spending
represents 13% of GDP.
➢ Brazil still has a low dependency ratio (elderly/working-
age youth), despite high spending
➢ Social security reform only stabilizes spending as a
proportion of GDP, only for the federal level
➢ Social security imbalance in states and municipalities
is severe, particularly in the South/Southeast region
(+elderly)
➢ Lack of reform in S&M is a substantial contingent fiscal
risk for the Union
Demography and PensionAlthough still young, Brazil is outlier in social security spending
0
2
4
6
8
10
12
14
16
18
20
10 15 20 25 30 35 40 45 50
Soc
ial S
ecur
ity E
xpen
ses
/ GD
P
Dependency Ratio (Pop. Over 65y / 20-64 years)
Japan
Italy
Greece
Turkey
Brazil
Chile South
Korea
Hungary
Portugal
Finland
France

114
➢ Relationship between social security deficit size and
demographics in states is almost 1:1
➢ Traditionally older states (such as RS, RS, MG)
have a larger social security deficit as a reason for
their respective revenues. Only a few very young
states (such as RR, RO, TO and AP) registered a
social security surplus in 2017.
➢ The number of states with intermediate social
security deficits is large, so that the absence of
reform will inevitably explain the size of the social
security fiscal imbalance.
➢ Trade-off between aging speed and transition rules
gains relevance given nearly 70% of special
retirements
Demography and PensionLack of reform in E&M is a risk to be monitored
AC
MS
AM
AP
CE
DF
ES
MG
PA
PI
PR
RJ
RN
RO
RR
RS
SC
SE
SP
TO
0%
5%
10%
15%
20%
25%
-40% -30% -20% -10% 0% 10% 20%
Pop
ulat
ion
aged
55
and
over
(%
of
Tot
al P
opul
atio
n)
Result of Public Pension Plan (RPPS) (% of Net Current Revenue)

115
➢ Relationship between social security deficit size and
demographics in states is almost 1:1
➢ Traditionally older states (such as RS, RS, MG) have a
larger social security deficit as a reason for their
respective revenues. Only a few very young states (such
as RR, RO, TO and AP) registered a social security
surplus in 2017.
➢ The number of states with intermediate social security
deficits is large, so that the absence of reform will
inevitably explain the size of the social security fiscal
imbalance.
➢ Trade-off between aging speed and transition rules gains
relevance given nearly 70% of special retirements
Demography and PensionLack of reform in E&M is a risk to be monitored
66 69 70
58 56 5347 50
4555
41 41 40 37
23 16 12
1913 15
19 1518
8
16 1311 12
8985
8277
69 68 67 65 63 63
56 5450 49
67
0.0
10.0
20.0
30.0
40.0
50.0
60.0
70.0
80.0
90.0
100.0
SC RS MG SP GO ES PE PR PA AP MS AC CE PB
Teachers Military Total Average
Share of Special Retirements in Total Inactive (%)

116
Pure discretionary is the most appropriate proxy for assessing the degree of freedom of fiscal policy enforcement in the short term. There are,
however, important restrictions to its reduction.
Short Term Fiscal ScenarioShort-term adjustment focuses on discretionary spending
Evolution of Federal Expenditure (Accum. 12 months, R$ billion)
90
110
130
150
170
190
210
230
250
600
700
800
900
1,000
1,100
1,200
1,300
1,400
abr-
11
ago
-11
de
z-1
1
abr-
12
ago
-12
de
z-1
2
abr-
13
ago
-13
de
z-1
3
abr-
14
ago
-14
de
z-1
4
abr-
15
ago
-15
de
z-1
5
abr-
16
ago
-16
de
z-1
6
abr-
17
ago
-17
de
z-1
7
abr-
18
ago
-18
de
z-1
8
abr-
19
ago
-19
Tho
usa
nd
s
Mandatory (rhs)
Discretionary

117
✓ In the Base Scenario, to meet the spending ceiling by 2026, the cumulative gap is ~R$300bn for discretionary spending in 2022.
• Minimum wage with real gain of 0.5% y/y from 2023
• Personnel growth rate of 0.5% y/y since 2020
✓ In the Optimistic Scenario, the accumulated gap is ~R$200bn and would occur in the following year (2023).
• Minimum wage with no real gain since 2020
• No staff growth since 2020, only inflation correction
Outlook for discretionary spendingHow long can the spending ceiling be met and what is the gap until 2026?
Base Case Scenario
-120
-70
-20
30
80
130
180
230
2017 2018 2019 2020 2021 2022 2023 2024 2025 2026
Pure Discretionary vs Benchmark Pure Discretionary
Pure Discretionary (Benchmark)
Optimistic Scenario
-100
-50
0
50
100
150
200
2017 2018 2019 2020 2021 2022 2023 2024 2025 2026
Pure Discretionary vs Benchmark Pure Discretionary
Pure Discretionary (Benchmark)

118
-0.5
0.0
0.5
1.0
1.5
2.0
2.5
3.0
3.5
4.0
De
c-16
Feb
-17
Apr
-17
Jun-
17
Aug
-17
Oct
-17
De
c-17
Feb
-18
Apr
-18
Jun-
18
Aug
-18
Oct
-18
De
c-18
Feb
-19
Apr
-19
Jun-
19
Aug
-19
Social Assistance Benefits (Loas/Rmv)
Pension System (Retirement + Death Pensions + Others)
Social Security and Assistance ExpendituresEven without reform, data indicate a substantial decline
➢ There is a remarkable decrease in the vegetative
growth rate of social security and welfare benefits.
➢ RGPS benefits have systematically declined since
2016 from ~3.5% to less than 2%
➢ BPC registers extraordinary decline and registers
negative growth rate of benefits issued for payment,
from ~3.5% in 2016 to -0.3% in August/19
Beneficiary Quantum Growth Rate (y/y)
Recovery from
extraordinary advance
in disability pensions of
almost 8% in August
alone

119
Fiscal Timing and Structural ReformsApproval of structural fiscal agenda anchors feasibility of spending ceiling
▪ Of the 3 PECs recently sent to the Senate, Emergency PEC is a priority for the fiscal over the medium term.
▪ The PEC of the Federative Pact is important for states and municipalities, but requires caution when decentralizing resources
▪ “State HR”
• Taking 2016 data from 1.2 million public servants, just over 540,000 were active
• Civil servants eligible for retirement by 2026 make up nearly half of the workforce
• There is a unique window of opportunity to restructure public service positions and salaries
Public Agencies Until 2016 2017/18 2019/20 2021/22 2023/24 2025/26 2016/26
Federal Higher Education Institutions 39,757 10,632 11,893 10,426 10,664 10,336 93,708
Ministries of Health, Labor, Social Security and INSS 42,240 7,023 6,775 5,195 4,502 3,268 69,003
Ministries of Finance and Planning 9,717 2,081 2,172 1,999 1,784 1,570 19,323
Federal Police and Federal Highway Police 3,154 1,409 1,434 1,300 2,407 2,354 12,058
Advocacy and Comptroller General and Public Defense 1,386 358 411 408 421 410 3,394
Regulatory agencies 917 196 207 180 204 260 1,964
Military Commands 6,879 1,342 1,570 1,199 935 857 12,782
Other Ministries and Presidency of the Republic 8,320 1,325 1,174 938 742 622 13,121
Other autarchies and foundations 17,063 3,509 3,249 2,462 1,775 1,377 29,435
Former federal territories 7,760 1,294 1,383 814 685 701 12,637
Total 137,193 29,169 30,268 24,921 24,119 21,755 267,425
% of Potential Retirements 25.2 5.4 5.6 4.6 4.4 4.0 49.2

120
Public Sector Borrowing RequirementsAfter surpassing 8% in 2015, net nominal interest fell to ~5% of GDP
% o
fGD
P
-12
-10
-8
-6
-4
-2
0
2
4
6
jan-
02ju
n-02
nov
-02
abr
-03
set-
03fe
v-04
jul-0
4d
ez-0
4m
ai-0
5o
ut-0
5m
ar-0
6a
go-0
6ja
n-07
jun-
07n
ov-0
7a
br-0
8se
t-08
fev-
09ju
l-09
dez
-09
mai
-10
out
-10
mar
-11
ago
-11
jan-
12ju
n-12
nov
-12
abr
-13
set-
13fe
v-14
jul-1
4d
ez-1
4m
ai-1
5o
ut-1
5m
ar-1
6a
go-1
6ja
n-17
jun-
17n
ov-1
7a
br-1
8se
t-18
fev-
19ju
l-19
Interest payments Interest Payments ex-Swaps Nominal Result
Nominal Result ex-Swaps Primary Result

121
➢ Expected Gross Revenue from transfer of rights is R$107bi, with automatic payment of R$35bi to Petrobras
➢ In 2019 and 2020, net revenue (from payments to Petrobras and the states and municipalities) from the assignment will be R$24bn each year.
➢ For 2019, net collection of R$24bi will enter the Treasury single account at the end of Dec/19 and will be fully reversed to reduce the primarydeficit.
➢ By 2019, automatic transfer to 27 states and more than 5,500 municipalities from R$12bi will improve primary S&M result
➢ Non-linearity of GDP-revenue during the closing of the gap can lead to better recurring revenue performance, as well as surprises aroundextraordinary events (such as the Legal Taxpayer PM)
Scenarios for Primary OutcomeIn the optimistic scenario, consolidated result target is met by 2022
-68.2
-147.6 -143.0 -139.6
-53.8
-80.2
-50.9
-30.4
-61.6
-96.0
-80.6-74.9
-132.0
-118.9
-65.2
-30.3
-160
-140
-120
-100
-80
-60
-40
-20
0
2019 2020 2021 2022
Pessimistic Optimistic Base case Estimated
Consolidated Primary Result (R$bn)
-0.9
-1.9-1.7
-1.6
-0.7
-1.0
-0.6
-0.3
-0.9
-1.2
-1.0-0.9
-1.8
-1.6
-0.8
-0.3
-2.5
-2.0
-1.5
-1.0
-0.5
0.0
2019 2020 2021 2022
Pessimistic Optimistic Base case Estimated
Consolidated Primary Result (% of GDP)

External Sector
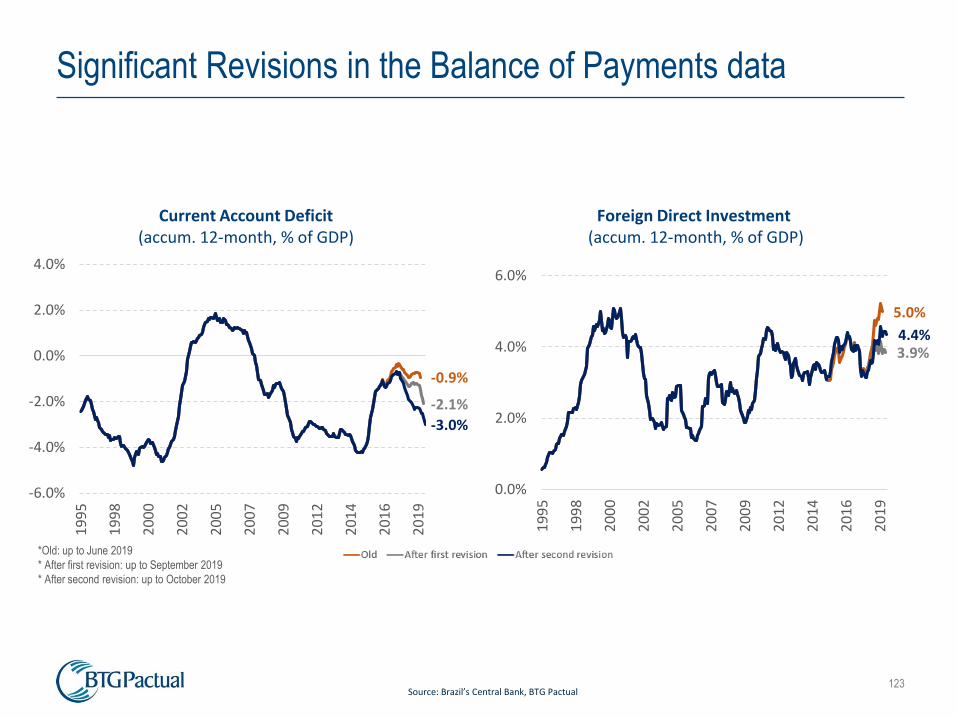
123Source: Brazil’s Central Bank, BTG Pactual
Current Account Deficit (accum. 12-month, % of GDP)
Foreign Direct Investment(accum. 12-month, % of GDP)
*Old: up to June 2019
* After first revision: up to September 2019
* After second revision: up to October 2019
-0.9%
-2.1%
-3.0%
-6.0%
-4.0%
-2.0%
0.0%
2.0%
4.0%
19
95
19
98
20
00
20
02
20
05
20
07
20
09
20
12
20
14
20
16
20
19
5.0%
3.9%4.4%
0.0%
2.0%
4.0%
6.0%
19
95
19
98
20
00
20
02
20
05
20
07
20
09
20
12
20
14
20
16
20
19
Significant Revisions in the Balance of Payments data

124
The current account deficit will increase to 3.0% of GDP in 2019 and to 3.8% of GDP in 2020, from 2.2% of GDP in 2018. The decline in the
trade balance will be the main driver of the reduction in the current account deficit in the year.
Source: Brazil’s Central Bank, BTG Pactual
Current account balance 12-month accumulated (left axis: US$bn; right axis: % of GDP)
-24-8
411
1413 0
-31 -26
-79 -76 -84 -80
-101
-54
-24-15
-42-55
-70
-4.2
-1.6
0.7
1.7 1.51.2
0.0
-1.8-1.6
-3.6
-2.9
-3.4 -3.2
-4.1
-3.0
-1.3
-0.7
-2.2
-3.1
-3.8
-5.0
-4.0
-3.0
-2.0
-1.0
0.0
1.0
2.0
-120.0
-100.0
-80.0
-60.0
-40.0
-20.0
0.0
20. 0
01 02 03 04 05 06 07 08 09 10 11 12 13 14 15 16 17 18 19e 20e
Increase in the current account deficit in 2019-2020

125
Breakdown of current account balance 12-month accumulated (% of GDP)
Source: Central Bank of Brazil and BTG Pactual
-6
-4
-2
0
2
4
6
2000 2001 2002 2003 2004 2005 2006 2007 2008 2009 2010 2011 2012 2013 2014 2015 2016 2017 2018
Other services and income Trade balance Interest rate Profits and dividends
Equipment rentals Transportation Travel Current Account Deficit
Lower trade balance explained the higher current account
deficit in 2019

126Source: Brazil’s Central Bank, BTG Pactual
Exports (US$bn, daily average,statistics refer to 2011-2018 period)
Imports (US$bn, daily average,statistics refer to 2011-2018 period
580
660
740
820
900
980
1060
1140
Jan
Feb
Mar
Ab
r
May Jun
Jul
Au
g
Sep
Oct
No
v
Dec
500
575
650
725
800
875
950
1025
1100
Jan
Feb
Mar
Ab
r
May Jun
Jul
Au
g
Sep
Oct
No
v
Dec
Weakening trade surplus is also at playDue to weaker exports

127Source: Brazil’s Central Bank, BTG Pactual
Brazil Exports - Value (%yoy, accum. 12-month)
Brazil Exports – Value per Segment(%yoy, accum. 12-month)
-38.5
-5.2
-2.8
-50
-40
-30
-20
-10
0
10
20
30
40
Nov-17 May-18 Nov-18 May-19 Nov-19
Exports to Argentina
Total Exports
Total Exports (ex-Argentina)
-5.2
1.0
-9.3
-5.1
-15
-10
-5
0
5
10
15
20
25
30
Nov-17 May-18 Nov-18 May-19 Nov-19
Total
Basic goods
Manufactured goods
Semi-manufactured goods
Weakening trade surplusRegional and global drivers
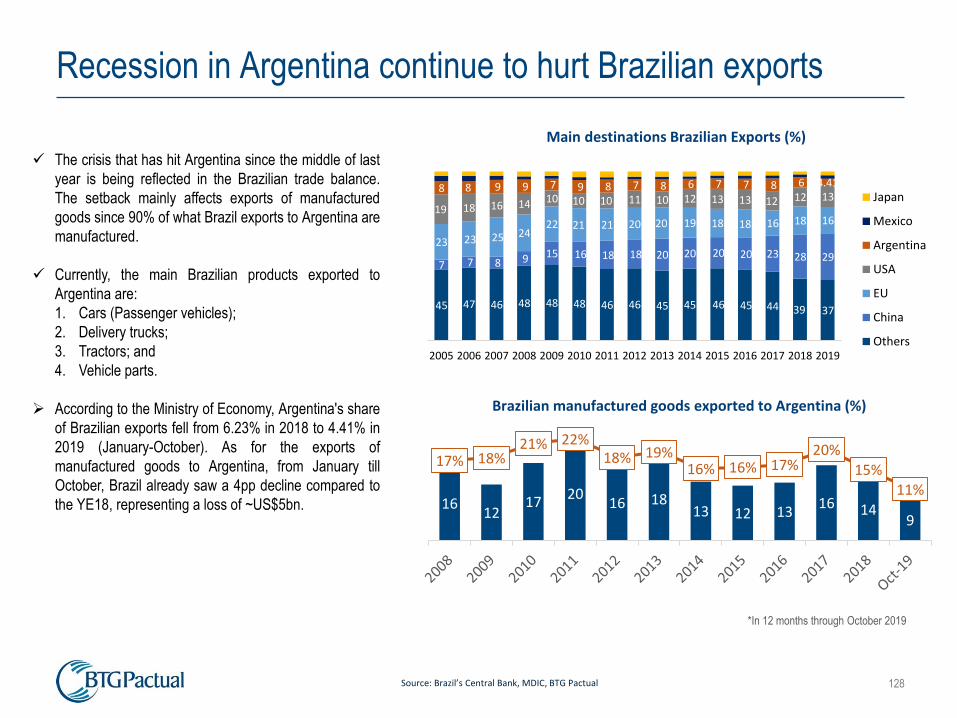
128
Brazilian manufactured goods exported to Argentina (%)
Main destinations Brazilian Exports (%)
*In 12 months through October 2019
Source: Brazil’s Central Bank, MDIC, BTG Pactual
45 47 46 48 48 48 46 46 45 45 46 45 44 39 37
7 7 8 9 15 16 18 18 20 20 20 20 23 28 29 23 23 25 24
22 21 21 20 20 19 18 18 16 18 16 19 18 16 14 10 10 10 11 10 12 13 13 12 12 13 8 8 9 9 7 9 8 7 8 6 7 7 8 6 4.41
2005 2006 2007 2008 2009 2010 2011 2012 2013 2014 2015 2016 2017 2018 2019
Japan
Mexico
Argentina
USA
EU
China
Others
1612
1720
16 1813 12 13
16 149
17% 18%21% 22%
18% 19%16% 16% 17%
20%15%
11%
0%
5%
10%
15%
20%
25%
0
5
10
15
20
25
✓ The crisis that has hit Argentina since the middle of last
year is being reflected in the Brazilian trade balance.
The setback mainly affects exports of manufactured
goods since 90% of what Brazil exports to Argentina are
manufactured.
✓ Currently, the main Brazilian products exported to
Argentina are:
1. Cars (Passenger vehicles);
2. Delivery trucks;
3. Tractors; and
4. Vehicle parts.
➢ According to the Ministry of Economy, Argentina's share
of Brazilian exports fell from 6.23% in 2018 to 4.41% in
2019 (January-October). As for the exports of
manufactured goods to Argentina, from January till
October, Brazil already saw a 4pp decline compared to
the YE18, representing a loss of ~US$5bn.
Recession in Argentina continue to hurt Brazilian exports

129
Exports of goods and services (as % of GDP) as of 2018
Exports overview: countries, products and share
Source: Brazil’s Central Bank, MDIC, BTG Pactual
84
47 4539
3430 30 29
2015 14
Main destinations – Exports (%) – 2019 YTD
41
17
16
11
75 3 Asia (ex-Middle East)
NAFTA
European Union
Others
Mercosur
Middle East
Africa
Main products – Exports (%) – 2019 YTD
42
15
13
10
77
4 2 OthersSoy ComplexOil & FuelsIron oreMeat ComplexMetallurgical productsPulpSugar Complex

130
Foreign Direct Investment (US$bn)
➢ The government’s privatization program will contribute to increase the FDI to US$80bn in 2019 and to US$90bn in 2020.
➢ FDI will continue to finance the current account deficit comfortably in 2019.
Source: Brazil’s Central Bank, BTG Pactual
3019 17
919 15 15
26 3020
6986
70
3749 42 49
64 57
8090
34
-1
1
0
0 4
1921
12
13
16
23
38
39
2325
5 21
33
2317
1018 15
19
4551
31
82
102
93
75
88
6574
6978 80
90
00 01 02 03 04 05 06 07 08 09 10 11 12 13 14 15 16 17 18 19e 20e
Equity and investment fund shares
Intercompany loans
FDI will reach US$80bn in 2019

131
Current account balance and foreign direct investment (US$ bn)
➢ We expect an increase in the current account deficit in 2019 and 2020, primarily owing to a decline in the trade balance.
➢ The government’s privatization program will contribute to increase the FDI in 2019 and 2020. FDI will continue to finance the current
account deficit comfortably in both years.
➢ International reserves remain at a very high level, helping to keep Brazil’s external vulnerability at a low level.
➢ The dynamic of the exchange rate in 2020 will depend on the external scenario, in particular on the trade negotiations between China and
the US.
Source: Brazil’s Central Bank, BTG Pactual
-30.6-26.3
-79.0 -76.3 -83.8 -79.8-101.4
-54.5
-24.2 -15.0-41.5
-55.0 -70.0
50.731.5
82.4102.4
92.675.2
87.764.7 74.3 68.9 78.2 80.0 90.0
20.15.2 3.4
26.18.8
-4.6 -13.710.3
50.1 53.936.6 25.0 20.0
2008 2009 2010 2011 2012 2013 2014 2015 2016 2017 2018 2019e 2020e
Current Account Forein direct investment (FDI) Balance
External accounts

132
Foreign investment in portfolio (US$ bn)
Foreign investment in portfolio (12m, US$ bn)
Source: Brazil’s Central Bank, BTG Pactual
7.2 5.6 11.1 11.5 9.8 11.0 5.7-3.1 -9.7
5.3 11.4
31.0 27.116.7
-26.7
-5.1 -4.3-5.4
12.417.0
42.1 38.6
26.5
-15.6
0.6
-7.4-15.0
2011 2012 2013 2014 2015 2016 2017 2018 Dec-19
Equity and investmets fund
Debt securities issued in Brazil
0.7-2.0 -1.4
3.5
-1.5-1.3
-0.3-2.4
1.04.9
-3.5-1.5 -1.2
1.5
-3.4-2.8
3.1
6.01.1
-0.22.2
-1.0
0.1
-3.1-3.4 -2.8
2.2
-5.4-4.3
6.6
4.5
-0.2 -0.5 -0.3 0.0
5.0
-6.6-4.9
-4.0
Oct-18 Dec-18 Feb-19 Apr-19 Jun-19 Aug-19 Oct-19
Equity and investmets fund
Debt securities issued in Brazil
Portfolio investment
Foreign investments in equities remain very low in 2019

133
FX flows accumulated 12 months (US$ bn)
Source: Brazil’s Central Bank, BTG Pactual
-39.9
-60
-40
-20
0
20
40
60
80
100
1983 1987 1991 1995 1999 2003 2007 2011 2015 2019
FX outflow accumulated in 12-months through November still
close to the highest in the data series reached in October

134
Monthly total FX flows (US$ bn)
Source: Brazil’s Central Bank, BTG Pactual
Net FX outflow of US$27.2 billion YTD through November

135
Net FX position (international reserves – swap position – repos position and others) (US$ bn)
Source: Brazil’s Central Bank, BTG Pactual
*Up to November 29.
International Reserves
366.4
Repos and others
4.2
FX Swaps
-42.4
Net FX Position
328.2
-200
-100
0
100
200
300
400
500
2008 2009 2010 2011 2012 2013 2014 2015 2016 2017 2018 2019
High demand for dollar in the spot market lead the Central
Bank to change its policy

136
International Reserves (US$bn, % of GDP)
Source: Brazil’s Central Bank, BTG Pactual
*Up to December 3.
33 36 38 49 53 5486
180 194
239
289
352373 359 364 356 365 374 375 366
5
67
98
6
8
13
11
1413 13
1515 15
20 20
18
20 20
0
5
10
15
20
25
0.0
50. 0
100 .0
150 .0
200 .0
250 .0
300 .0
350 .0
400 .0
International Reserves still at a high level

137
International reserves/External debt (ratio)
Brazil’s exports are higher than the net external debt
Net total external debt/Exports (ratio)
Source: Brazil’s Central Bank, BTG Pactual
0.2 0.3 0.3
0.5
0.9 1.0
1.21.1 1.1 1.1 1.1
1.0 1.1 1.1 1.2 1.2 1.2
2003 2005 2007 2009 2011 2013 2015 2017 Jun-19
3.93.4
2.8 2.7
2.1
1.40.9
0.5
-0.1 -0.1-0.4 -0.3 -0.2 -0.3 -0.4 -0.2 -0.3 -0.4 -0.4 -0.3 -0.3
1999 2001 2003 2005 2007 2009 2011 2013 2015 2017 Jun-19

Exchange Rate

139
BRL/USD versus peers bascket
Cesta-PCA alt: AUD, CAD, CLP, COP, NZD, ZAR, TRY, RUB, INR, MXN
Deviation
1.95
2.45
2.95
3.45
3.95
4.45
2014
2015
2016
2017
2018
2019
BR
L/U
SD -
Exch
ange
Rat
e
BRL
PCA-Alt
Median
-15%
-10%
-5%
0%
5%
10%
15%
20%
2012
2013
2014
2015
2016
2017
2018
2019
Exchange rate: BRL versus peers
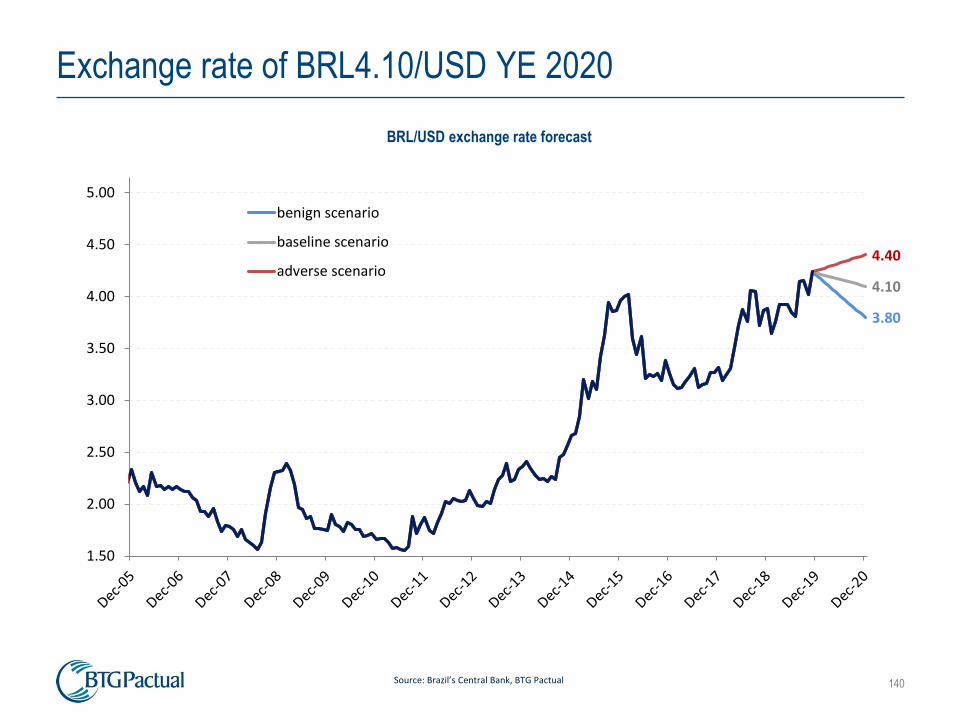
140Source: Brazil’s Central Bank, BTG Pactual
3.80
4.10
4.40
1.50
2.00
2.50
3.00
3.50
4.00
4.50
5.00
benign scenario
baseline scenario
adverse scenario
BRL/USD exchange rate forecast
Exchange rate of BRL4.10/USD YE 2020

141
10-year CDS spread (index)
150
200
300
75
125
175
225
275
325
375
425
475
525
575
625
benign scenario
baseline scenario
adverse scenario
Source: Brazil’s Central Bank, BTG Pactual
Approval of the social security reform could reduce Brazil
country risk

142
ICE dollar index DXY
Thomson Reuters/Jefferies Commodity Index CRB
102
98
70
75
80
85
90
95
100
105 Market consensus
185150
200
250
300
350
400
450
500
Source: Brazil’s Central Bank, BTG Pactual
Futures market - Strengthening dollar up to YE20?

Investment Themes, by sector

Financials

145
In Financials, our top picks for Brazil are B3, Bradesco and Stone
✓Stocks that benefit from Brazil’s financial deepening should keep performing well: B3, BPAC11 and XP
– The structural fall in long-term interest rate is leading to a financial deepening of Brazil’s capital market. In this scenario we like stocks that
benefit from such financial deepening, in our view: B3, BPAC and XP. As B3 is the only under our coverage, it is our chosen horse. Albeit
B3’s shares were up more than 85% in 2019, we believe there is still alpha in the name. Over the last 10 years Brazil suffered from a major
crowding-out effective, but dynamics definitely changed and we may be at the verge of a new, long and virtuous cycle that will be superb for
the exchange revenues, allowing investors to still dream very big with B3.
✓Attractive bank stock valuations. Bradesco is our preferred name
– Positive outlook for lending operating with demand for credit rising. Loan portfolio mix change towards more Individuals and SMEs should
give some support to NIM and drive NII acceleration. In addition, gap between ROE and CoE is at an all-time high, but valuations aren’t.
Bradesco is our preferred name. It is better positioned to benefit from the cyclical recovery in the credit business, reflecting (i) high exposure
to BZ; (ii) operational leverage from HSBC M&A, (iii) “late-cycle” status, allowing for lower NPLs/provisions; and (iv) more exposure to SMEs
and regions that suffered more in the crisis.
✓ In payments, Stone is our Top Pick
− Stone has a business model difficult to replicate, based on good costumer services and software solutions that ensure a more complete way
of serving the client. Thus, although competition has been intense, with incumbents more aggressive on prices to defend market share,
Stone’s operating and financial figures are not being impacted, and renegotiation requests continue at normalized levels. The qualitative
side of the story also remain very solid. In 2019 Stone focused on a number of new initiatives, from banking accounts to credit, and 2020
looks like the year to scale those initiatives via a fully integrated platform (Payments, Banking and Credit).

146
139 156 190 188 136 88 71 69
101 129
121 139
101 108 167 219
62 96 80
102
24 69 101 52 19
14 24 15
18 11
40 11 321
395 415 444
279 276
379 351
2011 2012 2013 2014 2015 2016 2017 2018
Capital raising activity (R$bn)
BNDES Capital Markets Fixed Income (Brazil)
Capital Markets Fixed Income (Off-shore) Capital Markets Equities
B3: Strong earnings momentum powered by a crowing-in effect
Capital markets more active, particularly in fixed incomeDomestic pension funds allocation in equities has a lot
of room to increase…
… funds as well With lower interest rates, more individual investors are
buying more equity-related products
70% 70% 71% 73% 75% 76% 74% 72% 70%
21% 21% 21% 20% 20% 19% 20% 21% 22%
9% 9% 8% 7% 5% 4% 5% 7% 8%
2011 2012 2013 2014 2015 2016 2017 2018 10M19
AuM - Funds
Fixed income and others Multi Market Equity
61% 62% 60% 64%71% 72% 74% 73% 74%
30% 29% 29%25% 19% 18% 18% 19% 18%
9% 10% 11% 11% 11% 10% 9% 8% 8%
2011 2012 2013 2014 2015 2016 2017 2018 06M19
AuM - Pension Funds
Fixed income Equities Others
482 484 510 438 413 498
1,041
1,571
2,192
583 587 589 564 557 564 620 813
1,417
2011 2012 2013 2014 2015 2016 2017 2018 09M19
Number of individual investors by asset class ('000)
Multi Market Funds Equities

147
✓ROE-CoE gap has never been higher
– Gap between ROE and CoE is at an all-time high, but valuations aren’t. Thus, investors are clearly worried about disruption in the system.
– Fintechs´ impact in the ST shouldn’t be that strong. To build stickiness, digital banks will need to learn how to give credit and that is not an
easy task.
– Credit demand, supply and approvals are all on the rise
– Banks traded at higher levels in the past (12M TTM P/BV)
Scenario remains positive for banks: we prefer Bradesco
Although credit is booming… …and ROE and CoE gap is at an all time high,…
-
2.0
4.0
6.0
8.0
10.0
12.0
14.0
16.0
18.0
De
c-10
Jun-
11
De
c-11
Jun-
12
De
c-12
Jun-
13
De
c-13
Jun-
14
De
c-14
Jun-
15
De
c-15
Jun-
16
De
c-16
Jun-
17
De
c-17
Jun-
18
De
c-18
Jun-
19
Adjusted ROE for the system SELIC
SelicROE above Selic and
gap to remain wide
0.0x
2.0x
4.0x
6.0x
8.0x
10.0x
12.0x
14.0x
P/E 12M FORWARD Banks Historic Average
-1.3pp-1.0pp-0.8pp-0.5pp-0.3pp0.0pp0.3pp0.5pp0.8pp1.0pp1.3pp1.5pp
1Q11
2Q11
3Q11
4Q11
1Q12
2Q12
3Q12
4Q12
1Q13
2Q13
3Q13
4Q13
1Q14
2Q14
3Q14
4Q14
1Q15
2Q15
3Q15
4Q15
1Q16
2Q16
3Q16
4Q16
1Q17
2Q17
3Q17
4Q17
1Q18
2Q18
3Q18
4Q18
1Q19
2Q19
3Q19
Credit Condition Indicator - Observed Demand
Corporate SME Consumer Mortgage
…valuation is not at its pick

148
Stone: Decent prospects for 2020
✓Good dynamics for 2020
– Our perception is that 2020 should bring good dynamics, both for the core (payments) business and new initiatives in banking and credit
– Stone still sees room for nice TPV and client growth in 2020. The company continues opening hubs at the same pace as previous quarters
and sees no room for deceleration.
– Stone believes that an effective pricing policy, with fast response/pricing adjustments to competition in the field, has been helping a lot to
keep take-rate at similar levels in recent quarters.
TPV market share – Cielo, Rede, GetNet, Stone
54.5% 53.4% 52.1% 51.4% 51.6% 52.3% 52.5% 50.9% 49.4% 47.9% 46.3% 44.7% 45.6% 46.3% 45.8%
36.3% 35.0% 34.6% 34.1% 33.5% 32.5% 31.8% 32.1% 32.0% 32.3% 32.8% 33.7% 32.9% 32.1% 31.7%
8.9% 9.2% 10.1% 10.7% 11.2% 11.4% 11.8% 12.5% 13.2% 14.0% 14.3% 14.5% 13.9% 13.2% 13.8%
0.4% 2.4% 3.3% 3.8% 3.7% 3.8% 3.9% 4.5% 5.4% 5.9% 6.6% 7.0% 7.7% 8.4% 8.7%
0.0%
10.0%
20.0%
30.0%
40.0%
50.0%
60.0%
70.0%
80.0%
90.0%
100.0%
1Q16 2Q16 3Q16 4Q16 1Q17 2Q17 3Q17 4Q17 1Q18 2Q18 3Q18 4Q18 1Q19 2Q19 3Q19
Cielo Rede (Itau) GetNet (Santander) Stone
0.20%
0.40%
0.60%
0.80%
1.00%
1.20%
1.40%
1.60%
1.80%
1Q16 2Q16 3Q16 4Q16 1Q17 2Q17 3Q17 4Q17 1Q18 2Q18 3Q18 4Q18 1Q19 2Q19 3Q19
Cielo Rede Getnet Stone
Revenue yield – Cielo, Rede, GetNet, Stone

Retail

150
Economic recovery should play a big role on retail sector’s rebound from 2H19 onwards;
discretionary players such as CVC, B2W, MGLU, HGTX and VVAR should be the largest beneficiaries.
Turnaround stories, such as NATU and HGTX, should be kept on the radar screen. However, Natura’s
demanding valuation, coupled with the execution risks brought by the acquisition of Avon and the
turnaround of The Body Shop, prevent us being more bullish on the name.
E-commerce should post secular growth in the coming years, but only with a few potential winners.
We are bullish on e-commerce and its consolidation trend among MGLU, MELI and B2W.
Exposure to staples segment and cheap valuation theses does not always pay off during economic
downturns. We prefer top-notch execution! Premium companies should continue outperforming, even
during more volatile times (with Renner as a Top Pick).
Brazilian Retail – what to watch

151
Premium
Companies
Exposure to
Internet Secular
Growth
Good operating
Momentum
Economic
recovery
Short term
portfolio (3-6
months)
Mid-term
portfolio (1-2
years)
Long-term
portfolio
LREN MGLU MGLU CVC LREN MGLU MGLU
RADL MELI RADL B2W MGLU LREN MELI
MELI B2W LREN MGLU B2W MELI LREN
ARZZ B2W VVAR LAME B2W RADL
LAME LAME HGTX CVC
MGLU CNTO
Our callsConsumer & Retail main themes
Asymmetric ST calls
(risk/reward)
Dynamic periodic table 2020 – our main calls

152
Highest correlations were between combined top line growth, with: (i) purchasing intentions (0.36), consumer confidence (0.51), GDP growth (0.54), Selic rate (-0.70) and uncertainty index (-0.63).
Correlations AMAR ARZZ HGTX HYPE MEAL LAME LLIS LREN MGLU NATU PCAR RADL VULC VVAR BTOW Median Combined
Revenue x GDP 0.55 0.41 0.59 0.17 0.60 0.25 0.23 0.42 0.57 0.32 0.12 (0.71) (0.10) 0.13 0.28 0.28 0.54
Revenue x IPCA (0.29) (0.24) (0.34) 0.03 0.07 0.09 (0.28) (0.20) (0.87) (0.60) 0.01 0.76 (0.32) (0.44) (0.09) (0.24) (0.62)
Revenue x Selic (0.49) (0.45) (0.49) (0.12) (0.27) (0.15) (0.33) (0.26) (0.71) (0.60) (0.10) 0.92 0.03 (0.31) 0.16 (0.27) (0.70)
Revenue x Unemployment (0.47) (0.30) (0.28) (0.33) (0.86) (0.38) (0.08) (0.45) 0.29 0.35 0.01 (0.05) 0.28 0.25 0.80 (0.08) 0.13
Revenue x Uncertainty (0.55) (0.55) (0.64) (0.21) (0.38) (0.14) (0.44) (0.29) (0.70) (0.30) (0.12) 0.72 0.04 (0.31) 0.33 (0.30) (0.63)
Revenue x Purchase Intention 0.69 0.68 0.57 0.38 0.80 0.34 0.39 0.46 0.24 (0.05) 0.08 (0.35) (0.29) 0.05 0.53 0.38 0.36
Revenue x Consumer Confidence 0.67 0.77 0.67 0.39 0.59 0.23 0.53 0.28 0.31 (0.03) 0.14 (0.36) (0.33) 0.19 0.42 0.31 0.51
Revenue x Household debt (0.01) (0.19) (0.19) 0.00 0.51 0.25 (0.33) 0.28 (0.68) (0.51) (0.12) 0.38 (0.09) (0.52) 0.14 (0.09) (0.49)
SSS x GDP 0.50 0.34 0.47 0.51 0.38 (0.04) 0.25 0.64 0.10 (0.39) 0.56 0.38
SSS x IPCA (0.32) (0.45) (0.56) 0.16 0.16 (0.60) (0.17) (0.80) 0.00 0.74 (0.76) (0.32)
SSS x Selic (0.50) (0.29) (0.67) (0.30) (0.17) (0.21) (0.18) (0.67) (0.16) 0.77 (0.65) (0.29)
SSS x Unemployment (0.35) (0.01) 0.10 (0.74) (0.47) 0.57 (0.30) 0.12 0.02 (0.41) 0.10 (0.01)
SSS x Uncertainty (0.48) (0.54) (0.40) (0.20) (0.13) (0.25) (0.13) (0.75) (0.20) 0.46 (0.77) (0.25)
SSS x Purchase Intention 0.56 0.39 0.25 0.65 0.40 (0.18) 0.22 0.35 0.21 0.03 0.39 0.35
SSS x Consumer Confidence 0.55 0.47 0.29 0.47 0.26 (0.06) 0.04 0.38 0.37 (0.03) 0.51 0.37
SSS x Household debt (0.05) (0.38) (0.37) 0.47 0.35 (0.66) 0.32 (0.51) (0.28) 0.55 (0.58) (0.28)
Our regression shows that the four variables (uncertainty index, purchasing intention, household debt and unemployment) are statistically significant
Retailnomics – a statistical approach

153Source: Forrester and BTG Pactual
Brazilian e-commerce sales (R$bn) to triple until 2025
59 69
82 96
117
139
167
200
224
251
2016A 2017A 2018A 2019E 2020E 2021E 2022E 2023E 2024E 2025E
CAGR17/25E = 17.5%
CAGR17/21E = 19.2%
Brazilian e-commerce – secular growth ahead

154
28,614
75,289 53,140
175,674
2018 2025
Taobao-like market Tmall-like market
65%
35%
70%
30%
Source: BTG Pactual
Taobao-like marketTmall-like market
R$82bn
R$251bn
Total GMV (R$bn)
72%
28%
2018
MELI's Share (Taobao-like market) Others
7%
28%
13%
52%
2018
MELI B2W MGLU Others
86%
14%
2025
MELI's Share (Taobao-like market) Others
14%
39%
35%
12%
2025
MELI B2W MGLU Others
Brazilian e-commerce – only a few potential winners
Food and Beverage

156
Our main Food & Beverage calls
In a low beta sector, we favor stocks that benefit from undemanding valuations and positive cyclical effects
✓ Proteins: ASF, deleveraging, and positive cycles to drive stronger performance
− JBS: one of our Top Picks, with the YTD stock rally still not translating into demanding valuations. The company should continue to
benefit from a solid sector backdrop, with the 13% LTM FCF yield suggesting an attractive carryover. Also, further de-risking could
mean that the discount at which JBS’ shares have historically traded to peers will continue to narrow.
− Minerva: one of our Top Picks, and set to benefit from still solid cattle availability across most regions, favorable beef prices and
strong demand coming from China. We see Minerva trading at 6x EV/2020EBITDA (still within historical range), while the pre-tax
15% 2020 FCFE yield still signals a nice carry.
− BRF: delivering on key initiatives to the LT sustainability of the business and also a beneficiary from ASF, but we remain neutral on
valuation (as current share price implies an above-historical LT margin) and signs that the poultry cycle could be turning.
− Marfrig: exposure to stronger US and Brazil beef outlook, but weaker track record of execution and lower clarity on further
deleveraging after recent acquisitions makes us prefer to surf the sector’s positive backdrop through other vehicles.
✓ Ambev (Neutral) seems unattractive as the company continues to struggle to fix the core segment, which we view
as key for them to consistently deliver on margin and ROIC expansion, both demanded by current valuations
✓ M.Dias Branco: lower visibility on a historically stable top line performance, changes in the top management, and
uncertainty on what a new commercial approach will mean margin-, return-, and volume- wise leaves us Neutral,
with MDB being our bottom F&B pick in Brazil

157
2020: Sector outlook – ASF, Brazil Beef & Poultry cyclesASF is set to have its strongest impact for global meatpackers in 2020. Cattle cycle could be turning in Bz, but overseas
demand is set to remain solid. Poultry production is booming, and prices have so far failed to catch up.
ASF: we estimate an 8.5% global price gain Beef: Female slaughtering has stabilized in Brazil…
… but spreads remain a solid 6% above average Poultry: booming output could limit price growth
Source:
Bloomberg / OECD / Cepea / APINCO / Secex / IGBE / USDA / BTG Pactual
Pre-ASF impact
1. Consumption ('000 ton)
2. Average price (USD/ton)
3. Market size (U$mn) (1x2)
Protein as % of global GDP
Post-ASF impact Bear Case Base Case Bull Case
4. Production drop (%) -30% -45% -60%
5. Production drop ('000 ton) (16,212) (24,318) (32,424)
6. Consumption ('000 ton) (1+5) 295,292 287,186 279,080
7. Market size (U$mn) (=3) 646,763 646,763 646,763
8. Average price (USD/ton) (7÷6) 2,190 2,252 2,317
Price change 5.5% 8.5% 11.6%
646,763
0.8%
OECD 2018
311,504
2,076
20%
25%
30%
35%
40%
45%
50%
55%
2000
2001
2002
2003
2004
2005
2006
2007
2008
2009
2010
2011
2012
2013
2014
2015
2016
2017
2018
2019
Cow slaughtering (% of total slaughter)
12M moving average
1.0
1.2
1.3
1.5
1.6
1.8
1.9
Apr-1
0
Oct
-10
Apr-1
1
Oct
-11
Apr-1
2
Oct
-12
Apr-1
3
Oct
-13
Apr-1
4
Oct
-14
Apr-1
5
Oct
-15
Apr-1
6
Oct
-16
Apr-1
7
Oct
-17
Apr-1
8
Oct
-18
Apr-1
9
Oct
-19
Brazil beef export spread Average
450,000
470,000
490,000
510,000
530,000
550,000
570,000
590,000
JAN FEB MAR APR MAY JUN JUL AUG SEP OCT NOV DEC
Last 5-y range of variation 2018 2019
Brazil production of broiler chicks (th heads)
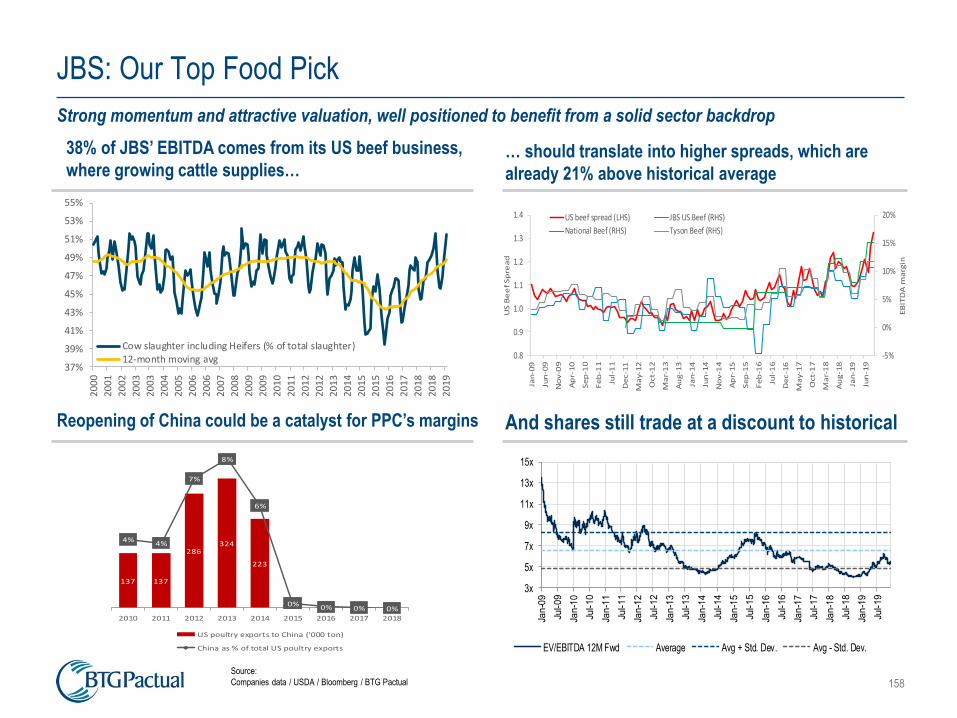
158
137 137
286324
223
9 3 1 0
4%4%
7%
8%
6%
0% 0% 0% 0% 0%
1%
2%
3%
4%
5%
6%
7%
8%
9%
0
50
100
150
200
250
300
350
400
2010 2011 2012 2013 2014 2015 2016 2017 2018
US poultry exports to China ('000 ton)
China as % of total US poultry exports
JBS: Our Top Food Pick
Strong momentum and attractive valuation, well positioned to benefit from a solid sector backdrop
Reopening of China could be a catalyst for PPC’s margins And shares still trade at a discount to historical
Source:
Companies data / USDA / Bloomberg / BTG Pactual
38% of JBS’ EBITDA comes from its US beef business,
where growing cattle supplies…… should translate into higher spreads, which are
already 21% above historical average
37%
39%
41%
43%
45%
47%
49%
51%
53%
55%
20
00
20
01
20
02
20
03
20
03
20
04
20
05
20
06
20
06
20
07
20
08
20
09
20
09
20
10
20
11
20
12
20
12
20
13
20
14
20
15
20
15
20
16
20
17
20
18
20
18
20
19
Cow slaughter including Heifers (% of total slaughter)12-month moving avg -5%
0%
5%
10%
15%
20%
0.8
0.9
1.0
1.1
1.2
1.3
1.4
Jan
-09
Jun
-09
No
v-0
9
Ap
r-1
0
Se
p-1
0
Fe
b-1
1
Jul-
11
De
c-1
1
Ma
y-1
2
Oct
-12
Ma
r-1
3
Au
g-1
3
Jan
-14
Jun
-14
No
v-1
4
Ap
r-1
5
Se
p-1
5
Fe
b-1
6
Jul-
16
De
c-1
6
Ma
y-1
7
Oct
-17
Ma
r-1
8
Au
g-1
8
Jan
-19
Jun
-19
EB
ITD
A m
arg
in
US
Be
ef
Sp
rea
d
US beef spread (LHS) JBS US Beef (RHS)
National Beef (RHS) Tyson Beef (RHS)
3x
5x
7x
9x
11x
13x
15x
Jan
-09
Jul-
09
Jan
-10
Jul-
10
Jan
-11
Jul-
11
Jan
-12
Jul-
12
Jan
-13
Jul-
13
Jan
-14
Jul-
14
Jan
-15
Jul-
15
Jan
-16
Jul-
16
Jan
-17
Jul-
17
Jan
-18
Jul-
18
Jan
-19
Jul-
19
EV/EBITDA 12M Fwd Average Avg + Std. Dev. Avg - Std. Dev.
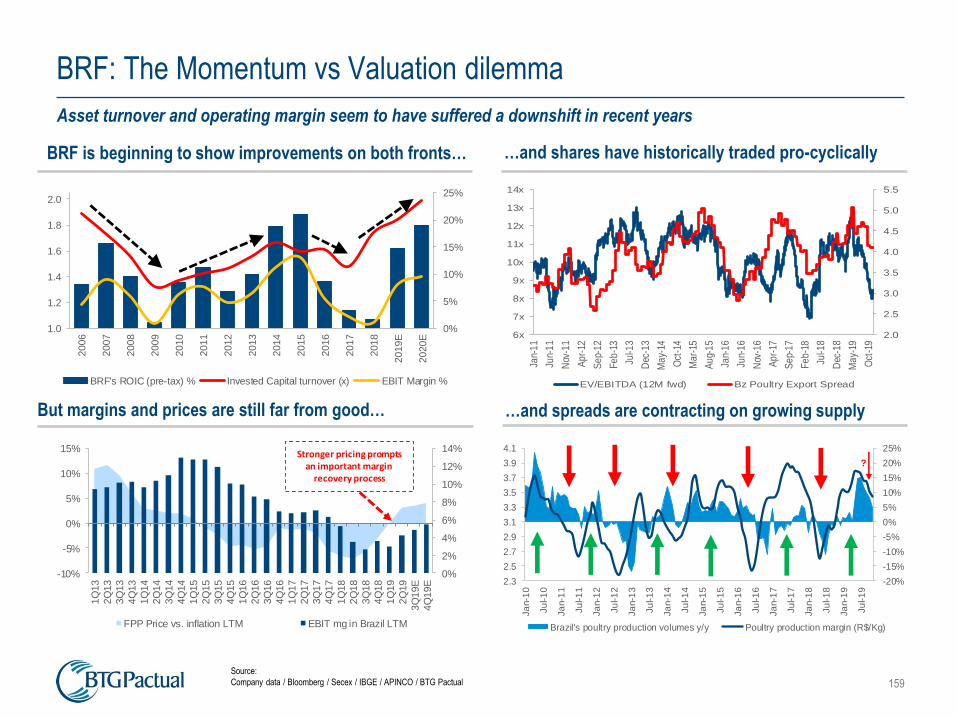
159
BRF: The Momentum vs Valuation dilemma
Asset turnover and operating margin seem to have suffered a downshift in recent years
But margins and prices are still far from good… …and spreads are contracting on growing supply
Source:
Company data / Bloomberg / Secex / IBGE / APINCO / BTG Pactual
BRF is beginning to show improvements on both fronts… …and shares have historically traded pro-cyclically
0%
5%
10%
15%
20%
25%
1.0
1.2
1.4
1.6
1.8
2.0
2006
2007
2008
2009
2010
2011
2012
2013
2014
2015
2016
2017
2018
2019E
2020E
BRF's ROIC (pre-tax) % Invested Capital turnover (x) EBIT Margin %
2.0
2.5
3.0
3.5
4.0
4.5
5.0
5.5
6x
7x
8x
9x
10x
11x
12x
13x
14x
Jan-
11
Jun-
11
Nov
-11
Ap
r-12
Se
p-1
2
Fe
b-1
3
Jul-1
3
Dec
-13
Ma
y-14
Oct
-14
Ma
r-15
Au
g-1
5
Jan-
16
Jun-
16
Nov
-16
Ap
r-17
Se
p-1
7
Fe
b-1
8
Jul-1
8
Dec
-18
Ma
y-19
Oct
-19
EV/EBITDA (12M fwd) Bz Poultry Export Spread
0%
2%
4%
6%
8%
10%
12%
14%
-10%
-5%
0%
5%
10%
15%
1Q
13
2Q
13
3Q
13
4Q
13
1Q
14
2Q
14
3Q
14
4Q
14
1Q
15
2Q
15
3Q
15
4Q
15
1Q
16
2Q
16
3Q
16
4Q
16
1Q
17
2Q
17
3Q
17
4Q
17
1Q
18
2Q
18
3Q
18
4Q
18
1Q
19
2Q
19
3Q
19E
4Q
19E
FPP Price vs. inflation LTM EBIT mg in Brazil LTM
Stronger pricing prompts an important margin
recovery process
-20%
-15%
-10%
-5%
0%
5%
10%
15%
20%
25%
2.3
2.5
2.7
2.9
3.1
3.3
3.5
3.7
3.9
4.1
Ja
n-1
0
Ju
l-1
0
Ja
n-1
1
Ju
l-1
1
Ja
n-1
2
Ju
l-1
2
Ja
n-1
3
Ju
l-1
3
Ja
n-1
4
Ju
l-1
4
Ja
n-1
5
Ju
l-1
5
Ja
n-1
6
Ju
l-1
6
Ja
n-1
7
Ju
l-1
7
Ja
n-1
8
Ju
l-1
8
Ja
n-1
9
Ju
l-1
9
Brazil's poultry production volumes y/y Poultry production margin (R$/Kg)
?

160
Ambev: The price conundrum
Pricing power is down as the company continues to struggle with a changing industry landscape
Volume growth typically precedes stronger pricing Margin resilience based on pricing power is under threat
Skol has lost 5p.p. of market share over the decade Duopolistic market challenges Ambev’s high returns
Source:
Company data / IBGE / Euromonitor / BTG Pactual
-8%
-6%
-4%
-2%
0%
2%
4%
6%
8%
63%
64%
65%
66%
67%
68%
69%
70%
71%
200
4
200
5
200
6
200
7
200
8
200
9
201
0
201
1
201
2
201
3
201
4
201
5
201
6
201
7
201
8
Ambev Beer Brazil mkt share Price premium to IPCA index
-8%
-6%
-4%
-2%
0%
2%
4%
6%
8%
20%
25%
30%
35%
40%
45%
50%
55%
60%
2Q
05
4Q
05
2Q
06
4Q
06
2Q
07
4Q
07
2Q
08
4Q
08
2Q
09
4Q
09
2Q
10
4Q
10
2Q
11
4Q
11
2Q
12
4Q
12
2Q
13
4Q
13
2Q
14
4Q
14
2Q
15
4Q
15
2Q
16
4Q
16
2Q
17
4Q
17
2Q
18
4Q
18
2Q
19
Premium to IPCA index EBITDA Margin (LTM) SG&A as % of rev (LTM)
32%31%
30%29%
28% 28%28% 28%
28%27%
2009 2010 2011 2012 2013 2014 2015 2016 2017 2018
Skol market share
0.0
0.2
0.4
0.6
0.8
1.0
1.2
1.4
10%
15%
20%
25%
30%
35%
40%
45%
50%
55%
200
4
200
5
200
6
200
7
200
8
200
9
201
0
201
1
201
2
201
3
201
4
201
5
201
6
201
7
201
8
201
9 E
ROIC (Pre-Tax) Asset turnover / IC

Agribusiness

162
S&E
Sugar market fundamentals are starting to prevail
We’re becoming more bullish that 19/20 harvest-year will point to a hard to ignore deficit of ~5.0mn tons, which should
continue to support sugar prices recoveryAttribute Country 2009/2010 2010/2011 2011/2012 2012/2013 2013/2014 2014/2015 2015/2016 2016/2017 2017/2018 2018/2019E 2019/2020E
Brazil 36,400 38,350 36,150 38,600 37,800 35,950 34,650 39,150 41,204 29,040 29,780
China 11,429 11,199 12,341 14,001 14,263 11,000 9,050 9,300 10,300 10,600 10,700
India 20,637 26,574 28,620 27,337 26,605 30,460 27,385 22,200 34,309 32,830 29,990
Thailand 6,930 9,663 10,235 10,024 11,333 10,793 9,743 10,033 14,710 14,190 13,100
EU-28 16,897 15,939 18,320 16,655 16,020 18,449 14,283 18,314 20,823 17,640 17,120
Others 60,825 55,676 60,250 66,918 63,469 66,140 70,451 70,734 62,594 70,000 71,000
World 153,118 157,401 165,916 173,535 169,490 172,792 165,562 169,731 183,940 174,300 171,690
World 154,926 155,938 160,217 166,437 166,960 168,839 170,238 171,592 174,645 174,895 176,644
% y/y 0.3% 0.7% 2.7% 3.9% 0.3% 1.1% 0.8% 0.8% 1.8% 0.1% 1.0%
Surplus / (deficit) World -1,808 1,463 5,699 7,098 2,530 3,953 -4,676 -1,861 9,295 -595 -4,954
Ending Stocks (1000 MT) World 28,028 29,491 35,190 42,288 44,818 48,771 44,095 42,234 51,529 50,934 45,980
Stock-to-Use (%) World 18.1% 18.9% 22.0% 25.4% 26.8% 28.9% 25.9% 24.6% 29.5% 29.1% 26.0%
Avg. Sugar Price (USDc/lbs) World 20.9 28.2 22.9 18.0 16.8 13.4 16.6 17.4 12.7 12.0 14.5
Avg. BRL/USD World 1.77 1.65 1.89 2.11 2.29 3.01 3.62 3.20 3.52 3.84 3.90
Avg. Sugar Price (BRLc/lbs) World 37.0 46.4 43.2 37.9 38.5 40.3 60.2 55.6 44.6 46.1 56.6
Avg. Sugar Price (BRL/ton) World 815.95 1,023.99 952.10 836.38 849.17 889.21 1,327.99 1,225.42 982.45 1,015.89 1,246.71
Sugar Production (1000 MT)
Total Use (1000 MT)
5
10
15
20
25
30
10%
15%
20%
25%
30%
35%
2009/2
010
2010/2
011
2011/2
012
2012/2
013
2013/2
014
2014/2
015
2015/2
016
2016/2
017
2017/2
018
2018/2
019E
2019/2
020E
Stock-to-Use (%) Avg. Sugar Price (USDc/lbs)
-1,808
1,463
5,6997,098
2,5303,953
-4,676
-1,861
9,295
-595
-4,954
-8,000
-4,000
0
4,000
8,000
12,000
130,000
142,000
154,000
166,000
178,000
190,000
2009/2
010
2010/2
011
2011/2
012
2012/2
013
2013/2
014
2014/2
015
2015/2
016
2016/2
017
2017/2
018
2018/2
019E
2019/2
020E
Surplus / (deficit) Sugar Production (1000 MT) Total Use (1000 MT)

163
São Martinho: our Top Agri Pick
When asset quality pays off: strong FCF, even during sugar price lows
SMTO is one of the most efficient sugar/ethanol
producer
We see SMTO trading at a compelling 10% FY2021E FCF yield, despite recent stock rally of +20% since October
Low leverage ratio may allow stronger dividends
ahead
Source: Company / Bloomberg / BTG Pactual - * BTGe for 2018
9.9 9.6
12.814.0
1.0 1.5
0.8
São Martinho Adecoagro Raízen BrazilAverage *
0.0x
0.5x
1.0x
1.5x
2.0x
2.5x
0
800
1,600
2,400
3,200
4,000
R$
mn
(R$mn) FY2015A FY2016A FY2017A FY2018A FY2019A FY2020E FY2021ENet Revenues 2,294 2,727 3,003 3,436 3,360 3,705 4,094EBIT 587 570 850 1,049 706 740 829EBIT Margin 25.6% 20.9% 28.3% 30.5% 21.0% 20.0% 20.2%
Cash net fin expenses (158) (247) (264) (209) (284) (282) (205)Cash Income Tax (32) 8 (162) (131) (65) (25) (156)Earnings 397 331 424 708 357 433 468D&A 599 736 739 896 1,045 1,287 1,390Cash Earnings 996 1,067 1,163 1,604 1,402 1,720 1,858CAPEX (687) (751) (869) (1,168) (1,282) (1,280) (1,222)FCF 309 315 294 436 120 440 636Adjusted Market Cap * 7,438 7,438 7,438 7,438 7,438 6,294 6,294 Adjusted FCF Yield 4% 4% 4.0% 5.9% 1.6% 7.0% 10.1%* Market cap adjusted for the NPV of the gov ernment indemnity net proceeds
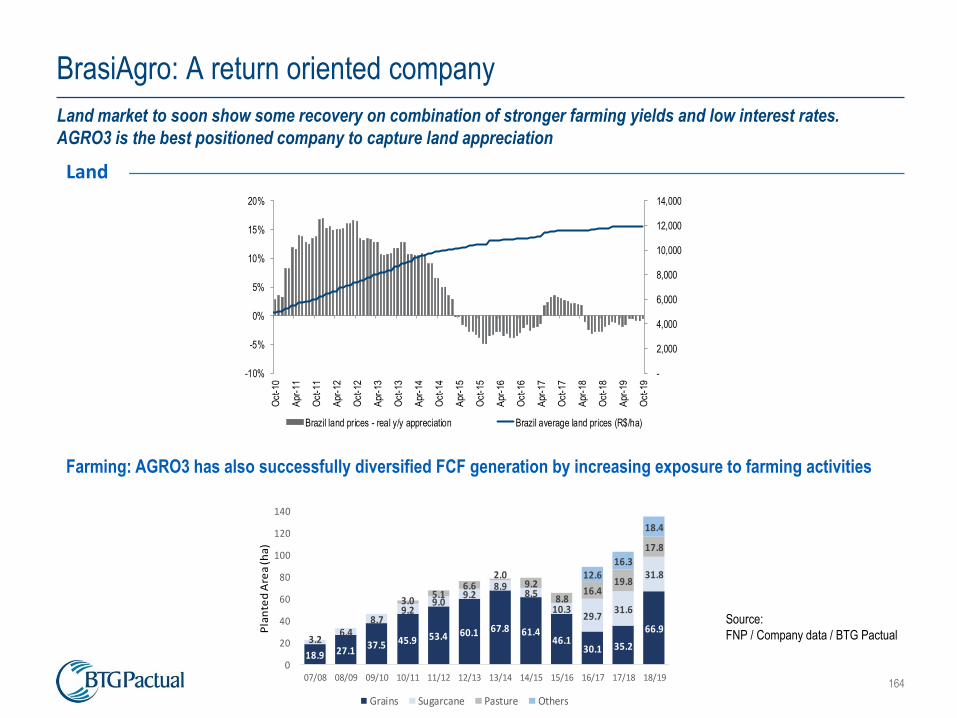
164
BrasiAgro: A return oriented company
Land market to soon show some recovery on combination of stronger farming yields and low interest rates.
AGRO3 is the best positioned company to capture land appreciation
Land
18.9 27.137.5 45.9 53.4 60.1 67.8 61.4
46.130.1 35.2
66.93.2
6.48.7
9.29.0
9.28.9
8.5
10.329.7
31.6
31.8
3.05.1
6.62.0
9.2
8.816.4
19.8
17.8
12.616.3
18.4
0
20
40
60
80
100
120
140
07/08 08/09 09/10 10/11 11/12 12/13 13/14 14/15 15/16 16/17 17/18 18/19
Pla
nte
d A
rea
(ha)
Grains Sugarcane Pasture Others
Farming: AGRO3 has also successfully diversified FCF generation by increasing exposure to farming activities
-
2,000
4,000
6,000
8,000
10,000
12,000
14,000
-10%
-5%
0%
5%
10%
15%
20%
Oct
-10
Apr
-11
Oct
-11
Apr
-12
Oct
-12
Apr
-13
Oct
-13
Apr
-14
Oct
-14
Apr
-15
Oct
-15
Apr
-16
Oct
-16
Apr
-17
Oct
-17
Apr
-18
Oct
-18
Apr
-19
Oct
-19
Brazil land prices - real y/y appreciation Brazil average land prices (R$/ha)
Source:
FNP / Company data / BTG Pactual

165
SLC Agrícola: Higher yield translated into higher returns
There are times when execution is not enough - upsides are now more difficult to find
Source: USDA / CONAB / Bloomberg / Company Data / BTG Pactual
..\..\..\..\Companies\Agribusiness\SLC
%20AGRÍCOLA\Notes\2018\Support\
SLC%20-
%20Update_June_2018.xlsx
... but cotton prices are under pressure and we expect little
to none smoothing up until 2H20
Mature areas for cotton crop enables SLC to have higher
productivity vs Brazil’s average…
1.20
1.30
1.40
1.50
1.60
1.70
1.80
1.90
20
05
/06
20
06
/07
20
07
/08
20
08
/09
20
09
/10
20
10
/11
20
11
/12
20
12
/13
20
13
/14
20
14
/15
20
15
/16
20
16
/17
20
17
/18
20
18
/19
20
19
/20
E
Tons /
ha
Cotton (CONAB) Cotton (SLCE3)
In our view, current P/NAV of 0.9x is above the company’s average and seems fair in light of a relatively quiet land market in Brazil
48 48 61 62 63 62 61 46 49 72 89 100
107
90 80 81 81 81
67%63%
2002
/03
2003
/04
2004
/05
2005
/06
2006
/07
2007
/08
2008
/09
2009
/10
2010
/11
2011
/12
2012
/13
2013
/14
2014
/15
2015
/16
2016
/17
2017
/18
2018
/19
E
2019
/20
P
Cotton Ending Stocks (MM Bales) Stock-To-Use Average StU
0.9x0.8x
0.3x
0.5x
0.7x
0.9x
1.1x
1.3x
1.5x
1.7x
1.9x
Dec
-09
Jun-
10
Dec
-10
Jun-
11
Dec
-11
Jun-
12
Dec
-12
Jun-
13
Dec
-13
Jun-
14
Dec
-14
Jun-
15
Dec
-15
Jun-
16
Dec
-16
Jun-
17
Dec
-17
Jun-
18
Dec
-18
Jun-
19
Dec
-19
P/NAV Average (10yr) +1 std dev -1 std dev
R$k P/NAV
Market Cap 3,872,890
(-) Leased area NPV 1,597,608
Market Cap adjusted for NPV of leased areas 2,275,282
NAV 2,997,610
(+) Land + Machinery 4,240,681
(-) Net Debt as of 2020E 1,243,071
P/NAV - Adjusted by leased areas 0.8x

Oil & Gas

167Source: Company data / Bloomberg / BTG Pactual
Divestments should continue to drive the company’s deleverage
process…
73
-12
+42
269
+45
+74
+61
+110
-78
-33 -12
0
90
180
270
360
450
2009 2010 2011 2012 2013 2014 2015 2016 2017 2018 EoP
ND
R$ b
n
Altogether, PBR should continue to gradually transfer value from
debt to equity
0%
20%
40%
60%
80%
100%
0
140
280
420
560
700
R$ b
n
EV Market Cap Mkt Cap as % EV
… while investments are now much more focused in PBR’s core E&P
business, where returns are higher
48
%
86
%
80
%
38
%
8%
9%
0%
20%
40%
60%
80%
100%
2010 2011 2012 2013 2014 2015 2016 2017 2018 2019E
E&P R&M G&P Distribution Biofuel Corporate
PBR is one of the few cases of strong production growth
worldwide: 5% CAGR in 2020-24
2.2 2.3 2.5 2.72.9
2.42.6
2.83.0
3.2
2.72.9
3.13.3
3.5
2020E 2021E 2022E 2023E 2024E
MM
boe
d
Oil production Commercial production Total
Petrobras: our O&G Top Pick
Petrobras continues to be a triple-alpha play

168Source: ANP / Company Data / BTG Pactual
Castello Branco’s divestment plan will transfer 8 refineries to the private sector Brazil will remain a net importer of oil products, underscoring the
scarcity value of domestic refineries
-2,500
-2,000
-1,500
-1,000
-500
0
Oct-02
Oct-03
Oct-04
Oct-05
Oct-06
Oct-07
Oct-08
Oct-09
Oct-10
Oct-11
Oct-12
Oct-13
Oct-14
Oct-15
Oct-16
Oct-17
Oct-18
Oct-19
'000 m
3
Brazil's gasoline short position
-2,500
-1,900
-1,300
-700
-100
500
Oct-02
Oct-03
Oct-04
Oct-05
Oct-06
Oct-07
Oct-08
Oct-09
Oct-10
Oct-11
Oct-12
Oct-13
Oct-14
Oct-15
Oct-16
Oct-17
Oct-18
Oct-19
'000 m
3
Brazil's diesel short position
Downstream dreams
Privatizing a system that was built to be a monopoly – The sale of PBR’s refineries should be the most important
event of Brazil’s O&G industry in 2020-21
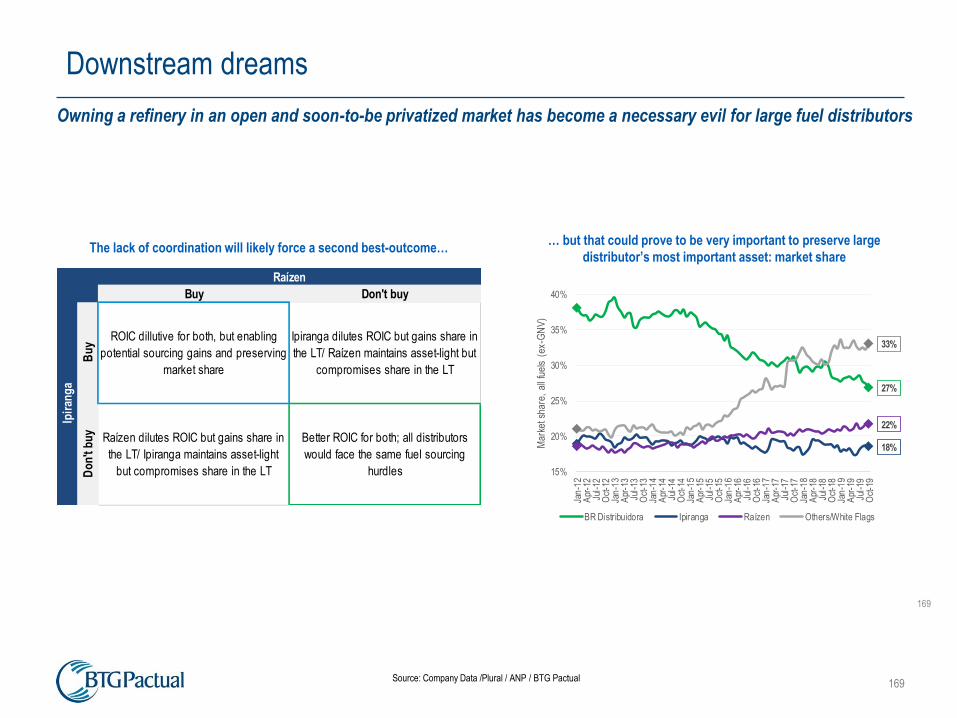
169
169
Source: Company Data /Plural / ANP / BTG Pactual
The lack of coordination will likely force a second best-outcome…… but that could prove to be very important to preserve large
distributor’s most important asset: market share
Ipir
ang
a
Raízen
Buy Don't buy
ROIC dillutive for both, but enabling
potential sourcing gains and preserving
market share
Ipiranga dilutes ROIC but gains share in
the LT/ Raízen maintains asset-light but
compromises share in the LT
Better ROIC for both; all distributors
would face the same fuel sourcing
hurdles
Raízen dilutes ROIC but gains share in
the LT/ Ipiranga maintains asset-light
but compromises share in the LT
Bu
yD
on
't b
uy
27%
18%
22%
33%
15%
20%
25%
30%
35%
40%
Jan
-12
Apr
-12
Jul-
12O
ct-1
2Ja
n-1
3A
pr-1
3Ju
l-13
Oct
-13
Jan
-14
Apr
-14
Jul-
14O
ct-1
4Ja
n-1
5A
pr-1
5Ju
l-15
Oct
-15
Jan
-16
Apr
-16
Jul-
16O
ct-1
6Ja
n-1
7A
pr-1
7Ju
l-17
Oct
-17
Jan
-18
Apr
-18
Jul-
18O
ct-1
8Ja
n-1
9A
pr-1
9Ju
l-19
Oct
-19
Mar
ket s
hare
, al
l fue
ls (
ex-G
NV
)
BR Distribuidora Ipiranga Raízen Others/White Flags
Downstream dreams
Owning a refinery in an open and soon-to-be privatized market has become a necessary evil for large fuel distributors

170Source: Company data / BTG Pactual
Pre-tax ROIC has trended higher for private Co’s…
Asset turnover, in turn, has failed to impress, with Raízen being the only exception
… driven mainly by higher EBIT margins
6.0
7.2
8.4
9.6
10.8
12.0
13.2
2011 2012 2013 2014 2015 2016 2017 2018
Ipiranga Raizen Combustíveis BR Distribuidora
2.0%
2.4%
2.8%
3.2%
3.6%
4.0%
2011 2012 2013 2014 2015 2016 2017 2018
BR Distribuidora Ipiranga Raizen Combustíveis
10%
16%
22%
28%
34%
40%
2011 2012 2013 2014 2015 2016 2017 2018
Ipiranga Raizen Combustíveis BR Distribuidora
Cosan: our Top Fuel Distribution Pick
Cosan is better positioned in a scenario of increasing competition

171Source: Company Data / Bloomberg / BTG Pactual
Capex BTG 2020E Diff.
R$mn Expansion Maintenance Consolidated
Ipiranga 528 345 873 970 -10%
Oxiteno 19 209 228 213 7%
Ultragaz 179 135 314 280 12%
Ultracargo 103 135 238 111 113%
Extrafarma 15 39 53 150 -64%
Others 0 65 65 0 n.m.
Total 843 927 1,771 1,725 3%
UGP 2020E
Ipiranga’s gas station conversion pace is currently at the
lowest level during this decade
Recently announced ’20 capex guidance suggests no-growth
mode shall persist
22.8x
10x
17x
24x
31x
38x
45x
2009
2010
2011
2012
2013
2014
2015
2016
2017
2018
2019
P/E 12M Forward Average
Avg + Std. Dev. Avg - Std. Dev.
Our UGPA valuation is SOTP derived, using a 7% WACC
(in real terms)
283
253278
311
249
0
-32 -35
-50
30
110
190
270
350
0
1,600
3,200
4,800
6,400
8,000
2013 2014 2015 2016 2017 2018 1Q19 2Q19 3Q19
Gas stations (Active) Sequential growth
SOTP EBITDA 2020 Multiple Unit R$m R$/share US$/ADR
Total assets
Ultragaz 598 7.9x EV/EBITDA 4,726 4.4 1.1
Oxiteno 344 10.0x EV/EBITDA 3,442 3.2 0.8
Ultracargo 253 5.6x EV/EBITDA 1,418 1.3 0.3
Ipiranga 2,606 9.2x EV/EBITDA 23,925 22.0 5.6
Extrafarma 47 4.7x EV/EBITDA 220 0.2 0.1
(-) Net debt (2020) (10,274) (9.5) (2.4)
Net asset value 23,456 22.0 6.0
Valuations seem to fairly reflect company’s lower growth
Ultrapar – Still between a rock and a hard place
Although we welcome management’s capital allocation rationality, we believe the decision to reduce conversion of
new stations will slowdown a faster recovery

172Source: Company Data / Plural / ANP/ BTG Pactual
27%
18%
22%
33%
15%
20%
25%
30%
35%
40%
Jan
-12
Apr
-12
Jul-
12O
ct-1
2Ja
n-1
3A
pr-1
3Ju
l-13
Oct
-13
Jan
-14
Apr
-14
Jul-
14O
ct-1
4Ja
n-1
5A
pr-1
5Ju
l-15
Oct
-15
Jan
-16
Apr
-16
Jul-
16O
ct-1
6Ja
n-1
7A
pr-1
7Ju
l-17
Oct
-17
Jan
-18
Apr
-18
Jul-
18O
ct-1
8Ja
n-1
9A
pr-1
9Ju
l-19
Oct
-19
Mar
ket s
hare
, al
l fue
ls (
ex-G
NV
)
BR Distribuidora Ipiranga Raízen Others/White Flags
100
180
260
340
420
500
2012 2013 2014 2015 2016 2017 2018
Pri
ce
/ In
ve
ste
d c
ap
ita
l
Raízen Ipiranga BR Distribuidora
1,000
1,900
2,800
3,700
4,600
5,500
2012 2013 2014 2015 2016 2017 2018
Vo
lum
e /
In
ve
ste
d C
ap
ita
l
Raízen Ipiranga BR Distribuidora
The company aims to close R$40/m3 gap margin vs
peers…
… but we see high execution risks as the company
continues to lose market share
Moreover, it’s not on volumes where BRDT’s asset turnover truly underperforms, but instead on pricing
80
40
120
0
20
40
60
80
100
120
140
2017 Adj. EBITDA ex-Pension Fund
Gap Close 2021E Adj. EBITDA ex-Pension Fund
R$
/ m
3
BR Distribuidora – A binary story!
BR Distribuidora remains a turnaround story, but with unattractive risk-reward

173Source: Company Data / BTG Pactual
DCF, BRL mn 2020E 2021E 2022E 2023E 2024E 2025E 2026E 2027E 2028E
EBIT (ex-PF) 2,703 3,142 3,565 3,825 4,103 4,401 4,720 5,062 5,428
(-) Tax (919) (1,068) (1,212) (1,301) (1,395) (1,496) (1,605) (1,721) (1,845)
NOPLAT 1,784 2,074 2,353 2,525 2,708 2,905 3,115 3,341 3,582
(+) Depreciation 560 542 526 513 501 492 485 480 476
(-) NWC 304 (110) (425) (455) (486) (520) (556) (594) (635)
(-) Capex (330) (343) (356) (369) (383) (398) (413) (428) (445)
Cash Flow 2,318 2,163 2,098 2,213 2,340 2,479 2,632 2,798 2,978
Cash flow (real) 2,318 2,084 1,947 1,979 2,016 2,058 2,104 2,155 2,210
Inflation factor 100 104 108 112 116 120 125 130 135
Discount factor 1.00 0.93 0.86 0.80 0.75 0.69 0.65 0.60 0.56
DCF 2,318 1,937 1,683 1,590 1,506 1,429 1,359 1,294 1,234
PV to 2028 14,352
Perpetuity 25,168
DCF valuation 39,519
Adj. Net Debt (BRL) (2020) (8,749)
Recovery of ELET's rec. 262
Equity Value (BRL) 31,032
Number of Shares 1,165
Target per share 27.0
BR Distribuidora – A binary story!
We run a DCF-based valuation for BRDT shares, using a real WACC of 7.6% and real perpetuity of 3%

Basic Materials

175
Iron ore: Markets gradually normalizing
Source: Bloomberg, LBH, BTG Pactual | CSP: Crude Steel Prodution
We still expect a deficit in 2020… … largely driven by lower volumes from Brazil
Chinese CSP growing ~8% YTD! Prices to remain in the US$75-85/t range
40
60
80
100
120
140
IO Fe 62% IO Fe 65%
-1%-1%
4%
1%2%
3%3%
3%
0%
-2%-4%
-3%
4%
-1%
-4%
-7%
-3%
-10%
-5%
0%
5%
10%
15%
0
400
800
1200
1600
2000Total Capacity (Mt)
Total Demand (Mt)
% Excess Capacity
-20%
-10%
0%
10%
20%
30%
40%
50%
0
20
40
60
80
100
China CSP (Mt) LHS y/y (%)
15
20
25
30
35
40
Iron Ore Shipments from Bz (Mt)

176
VALE | Risk/return profile looking attractive
Source: BTG Pactual
IO price 55 60 65 70 75 80 85 90 95
Implied EBITDA/t 22 27 32 37 42 47 52 57 62
Volumes - Mt 370 370 370 370 370 370 370 370 370
IO EBITDA - US$mn 7,955 9,805 11,655 13,505 15,355 17,205 19,055 20,905 22,755
Bmetals/others EBITDA - US$mn 2,500 2,500 2,500 2,500 2,500 2,500 2,500 2,500 2,500
TOTAL EBITDA 10,455 12,305 14,155 16,005 17,855 19,705 21,555 23,405 25,255
EV/EBITDA target 5.5x 5.5x 5.5x 5.5x 5.5x 5.5x 5.5x 5.5x 5.5x
Implied EV 57,503 67,678 77,853 88,028 98,203 108,378 118,553 128,728 138,903
Net Debt (includes Refis) 14,810 13,608 12,405 11,203 10,000 8,798 7,595 6,393 5,190
Brumadinho / Capex NPV / Other 6,000 6,000 6,000 6,000 6,000 6,000 6,000 6,000 6,000
Implied Equity value - 2019 36,693 48,070 59,448 70,825 82,203 93,580 104,958 116,335 127,713
Equity value/shr - 2019 7.1 9.2 11.4 13.6 15.8 18.0 20.2 22.4 24.6
Upside/downside -41% -23% -5% 14% 32% 50% 68% 87% 105%
Simplified risk/return analysis for Vale - stock currently pricing in ~US$65/t

177
-40%
-20%
0%
20%
40%
60%
0
500
1000
1500
2000
2500
Flats App. Dem. Longs App. Dem. y/y
200
400
600
800
China HRC (US$/t) Turkey HRC (US$/t)
-30%
-10%
10%
30%
Flats Import Premium Normalized Range
-30%
-10%
10%
30%
Longs Import Premium Normalized range
Brazilian Steels: Recovery in all fronts
Source: Bloomberg, Platts, IABr, BTG Pactual
Import parity premiums have been negative… … and price hikes are expected ahead…
… helped by a rebound in demand… … and stronger international prices + FX!

178
Gerdau
Source: Abrainc, IABr, BTG Pactual | Note: Figures are shown in ‘000
New launches in Brazil growing ~20% y/y… … and its starting to show in steel demand!
50
60
70
80
90
100
110
0
3
5
8
10
13
15
18
20
Tho
usa
nd
s
Total Launches LTM Launches
-40%
-30%
-20%
-10%
0%
10%
20%
30%
40%
0
200
400
600
800
1000
1200
Longs App. Dem. y/y
Volumes set to increase on booming real estate market. Top pick!

179
400
500
600
700
800
900
1,000
China BHKP China NBSK
0
500
1,000
1,500
2,000 Qingdao
Changshu
-50%
-25%
0%
25%
50%
200
400
600
800
1000
1200
1400
1600
Shipments to China y/y (%)
-10%
-5%
0%
5%
10%
110
115
120
125
130
135
LTM (Mt) YoY %
Pulp: Rebound at sight in 2020. SUZB top pick!
Source: FOEX, RISI, PPPC, NBS, BTG Pactual
Prices currently below marginal costs High inventories being worked lower…
… driven by strong Chinese demand (up 10% YTD!)… … to be supported by a recovering paper mkt
-10%
-5%
0%
5%
10%
110
115
120
125
130
135
Paper Output LTM (Mt) YoY %

Transportation & Capital Goods

181
Transportation and Capital Goods Best Ideas
✓ Rumo: Still our top pick
✓ Bz Airlines: We remain positive on the sector
✓ Marcopolo: Improving fundamentals
✓ Car Rentals: Opportunities following recent profit taking
✓ Embraer: Good risk/return from Boeing outcome
✓ CCR: Good upside from new projects
✓ JSL: Growing upside from long-term rental contracts
181

182
Rumo: Still top pick
182
➢ 2019 to remain strong: market share gains, new projects
➢ Highest long term EBITDA / earnings CAGR in coverage universe
(5-year CAGR of 16% and 59% respectively)
➢ Exponential FCFE ramp-up
➢ Malha Paulista’s renewal was already approved by the Federal
Audit Court; we believe the likelihood of approval by the other
entities is still high.
➢ Sorriso Project is material upside risk
Sorriso
New Terminal
Rondonópolis
Rio Grande
Santos
Paranaguá
São Francisco
Competitive Advantage
R$mn
EBITDA 4,455
Capex, pre expansion 1,954
Net financials expenses, cash (1,054)
Taxes (400)
Working capital change 230
FCFE 1,311
Market cap 39,350
FCFE yield (early 2021s) 2.7%
P/CF 21.5x

183
➢ Still positive on the car rental sector
➢ Consolidation thesis playing out
➢ Still low penetration of fleet rental segment
➢ Improving GDP and activity data
➢ Changing consumer behavior is a positive
➢ Vehicle purchasing conditions remain favorable
➢ Increasing product digitalization
Car Rental
183
ATUALIZAR
Consolidated Market Share in 2018
(in terms of fleet size)
26%
45%
13%
16%
Other
Localiza
Unidas
Movida
Consolidated Fleet Rental Market Share in 2018
(in terms of fleet size)
63%13%
17%
7%
Other
Localiza
Unidas
Movida
Source: ABLA and BTG Pactual
*not including CNAE secondary figuresSource: ABLA and BTG Pactual
*not including CNAE secondary figures
Volumes - Y/Y growth 2016 2017 1Q18 2Q18 3Q18 4Q18 2018 1Q19 2Q19 3Q19
1. Unidas/Locamerica
Number of Rental Days - RAC 4,797 6,486 1,965 1,809 2,138 2,642 8,554 3,156 3,328 3,578
y/y growth 20.7% 35.2% 27.2% 23.6% 28.1% 46.0% 31.9% 60.6% 84.0% 67.3%
Number of Rental Days - Fleet 20,045 18,840 5,593 5,595 5,684 5,753 22,624 6,069 6,420 6,461
y/y growth 148.8% -6.0% 12.0% 10.8% 8.9% 7.8% 9.8% 8.5% 14.8% 13.7%
2. Movida
Number of Rental Days - RAC 8,217 11,311 3,199 3,253 3,617 3,721 13,790 3,728 3,744 4,178
y/y growth 61.8% 37.7% 23.1% 20.0% 21.3% 23.3% 21.9% 16.5% 15.1% 15.5%
Number of Rental Days - Fleet 5,231 5,099 1,640 1,703 2,014 2,254 7,610 2,426 2,547 2,953
y/y growth -7.4% -2.5% 38.2% 38.4% 66.1% 53.3% 49.2% 48.0% 49.6% 46.6%
3. Localiza
Number of Rental Days - RAC 18,681 25,264 8,139 8,234 8,974 9,937 35,285 10,278 10,636 12,062
y/y growth 19.9% 35.2% 53.3% 47.9% 36.2% 27.4% 39.7% 26.3% 29.2% 34.4%
Number of Rental Days - Fleet 11,240 12,752 3,576 3,658 3,908 4,094 15,236 4,386 4,611 4,911
y/y growth 3.2% 13.5% 22.1% 21.4% 20.6% 14.7% 19.5% 22.6% 26.1% 25.7%

184
Toll roads: Positive pipeline of investments opportunities
184
• Abundant pipeline of new investment opportunities, including contract amendments, new toll roads, airports and
urban mobility projects
• Improvements on the regulatory front, such as rebalancing negotiations and problematic assets return
• Expected improvements on traffic performance with the economic recovery
• Abundance of projects enables players to become selective in terms of investments, increasing rationality
AM
AC
ROMT
RRAP
PA
MA
TO PI
CERNPBPE
ALSE
BA
GO
MS
SP
PR
SC
RS
MGES
RJ
1
2
34
5 6
7
8
9
10
11
12
DF

Real Estate

186
Housing: 2020 is shaping up much better
✓ In a scenario of much lower interest rates and rising consumer
confidence, home launches/sales in mid/high-income segment grew
a lot in 2019 and expect this positive scenario to continue in 2020.
Thus, we are more positive on mid/high-end homebuilders and
brokers (Trisul is our top pick)
✓ Low-income homebuilders has been under pressure, as MCMV
housing program should face some changes (= likely lower
subsidies). But, with a huge pent-up demand and since the
government is committed with MCMV program, we expect the
continuity of the program.
Interest rates on new mortgage loans (“taxa balcão”)
Affordability for homebuyers has never been so good…
Launches / sales of residential units in the city of São Paulo
Note: Assuming a hypothetical purchase of a R$500k house in the state of São Paulo for an
individual earning R$10k per month. 360-month duration contract using SAC financing scheme
7.0%
7.5%
8.0%
8.5%
9.0%
9.5%
10.0%
10.5%
11.0%
11.5%
12.0%
Feb-15 Sep-15 Apr-16 Nov-16 Jun-17 Jan-18 Aug-18 Mar-19 Oct-19
Bradesco
Itau
BB
Santander
CEF
29%
pre-crisis av erage
23%
20%
23%
25%
28%
30%
33%
35%
Jan
-12
May-1
2
Se
p-1
2
Jan
-13
May-1
3
Se
p-1
3
Jan
-14
May-1
4
Se
p-1
4
Jan
-15
May-1
5
Se
p-1
5
Jan
-16
May-1
6
Se
p-1
6
Jan
-17
May-1
7
Se
p-1
7
Jan
-18
May-1
8
Se
p-1
8
Jan
-19
May-1
9
Sep
-19
25 26
39
34
30
38 38
28
3335
21
18
29
33
51
24
28
37
3336 36
28 27
33
22 20
16
24
30
42
20 17
15 17
14
10
14
18 18 21
27 25
21 19
22
200
5
200
6
200
7
200
8
200
9
201
0
201
1
201
2
201
3
201
4
201
5
201
6
201
7
201
8
LTM
Launches (units) Net Sales (units) Avg. Inventory (units)
Mid/high-income is getting better all the time. MCMV program remains a government priority

187
Housing: we prefer mid/high-income
✓ On the back of a positive sector scenario, mid/high-
income homebuilders are set to grow launches and sales
a lot. Consequently, we forecast aggregate ROEs to
grow a lot in the coming years. Trisul is our top pick.
✓ Low-income homebuilders are facing more restrictive
credit conditions in MCMV, which has been impacting
margins. We find valuation attractive, but we need more
color on changes MCMV to assess risk-returns
(government will unveil changes in December/January)
Homebuilders aggregate ROE
Aggregate launches and sales – mid/high-end segment
Brazilian Housing – Valuation multiples
Company Price P/TBV
6-Dec 19E 20E 21E Last
MRV 19.26 12.1x 11.4x 8.1x 2.01x
Cyrela 28.77 26.2x 15.4x 9.4x 2.20x
Tecnisa 1.66 nm nm 20.4x 1.29x
Even 13.28 20.4x 15.1x 7.9x 1.74x
Eztec 46.60 36.0x 18.1x 12.2x 2.73x
Helbor 3.79 nm 20.6x 12.3x 2.03x
Direcional 13.20 18.4x 9.5x 7.3x 1.48x
Trisul 14.60 17.5x 13.8x 10.1x 2.53x
Lopes 8.89 nm 18.5x 11.9x nm
Average 21.7x 15.3x 11.1x 1.92x
P/E
8.69.6 9.5
15.216.6
13.2 13.3
10.8
4.9 5.5 5.27.0
10.7
13.7
6.1
8.2
11.6
13.9 14.3
12.3 12.5
9.5
6.35.0 5.7
7.3
10.711.9
7.8
11.210.3
12.4
18.519.6
21.3
18.717.6
16.715.8 16.3
18.6
200
7
200
8
200
9
201
0
201
1
201
2
201
3
201
4
201
5
201
6
201
7
201
8
201
9E
202
0E
Launches Sales Inventory
16%
22%
13% 15%16%
12%
6%
0%
-9%
-6%
8%
12%
17%
12.5%
200
9
201
0
201
1
201
2
201
3
201
4
201
5
201
6
201
7
201
8
201
9E
202
0E
202
1E
Consolidated ROE Average Ke
Launches/sales are set to grow a lot in mid/high-end segment (= higher ROEs!)

188
Malls: sales to grow in 2020; Offices: rents and occupancy growth
✓ We expect nice Same-Store-Sales for malls: (i) retail
sales improving and (ii) easy comps. In this scenario, we
hopefully should see some growth in the sector (via
higher rents and start of new projects).
✓ In office spaces, we expect growth in rents in offices in
São Paulo (explained by low vacancy rates in the prime
regions) and occupancy to increase in AAA properties in
Rio (due to fly-to-quality movement). Our preferred pick
in the office space is BR Properties.
Same-Store-Sales (SSS) growth of listed shopping malls
Same-Store-Rents (SSR) growth of listed shopping mallsHistorical and projected vacancy rate in offices in São Paulo
-10%
-5%
0%
5%
10%
15%
20%
1Q1
0
3Q1
0
1Q1
1
3Q1
1
1Q1
2
3Q1
2
1Q1
3
3Q1
3
1Q1
4
3Q1
4
1Q1
5
3Q1
5
1Q1
6
3Q1
6
1Q1
7
3Q1
7
1Q1
8
3Q1
8
1Q1
9
3Q1
9
Aliansce BR Malls Iguatemi Multiplan
16%
13%
14%
0%
5%
10%
15%
20%
25%
199
8
199
9
200
0
200
1
200
2
200
3
200
4
200
5
200
6
200
7
200
8
200
9
201
0
201
1
201
2
201
3
201
4
201
5
201
6
201
7
201
8
201
9E
202
0E
Bear
Bull
Base
-5%
0%
5%
10%
15%
20%
1Q1
0
3Q1
0
1Q1
1
3Q1
1
1Q1
2
3Q1
2
1Q1
3
3Q1
3
1Q1
4
3Q1
4
1Q1
5
3Q1
5
1Q1
6
3Q1
6
1Q1
7
3Q1
7
1Q1
8
3Q1
8
1Q1
9
3Q1
9
Aliansce BR Malls Iguatemi Multiplan
We expect malls sales to recover in 2020; Growth in rents SP and occupancy in Rio’s office markets

189
Properties: solid outlook for malls & offices
✓ We expect a solid 2020 for shopping malls: (i) retail
sales recovering, top line growth (higher sales and
some reduction of discounts to tenants), adjusted
Ebitda growth (lower vacancy and NPLs).
✓ We prefer more premium portfolios (AAA-oriented),
that we believe are in better shape to surf a recovery
of tenants’ sales (it should be translated into higher
rents faster).
✓ For the office companies, we expect vacancy to
decrease in Rio’s AAA market (fly-to-quality) and
rents increasing in São Paulo (due to low vacancy
rate).
✓ In terms of valuation, we see malls trading at
attractive valuations (nice premium to long-term real
interest rates vs. historical levels). In offices we see
expensive short-term multiples, but top line/earnings
should growth a lot on higher rents and occupancy.
Our preferred pick is BR Properties.
Brazilian Properties – Implied IRR vs. long-term interest rates
Brazilian Properties – Valuation multiples
4.8% 4.9%5.3% 5.5%
5.2%
6.3%5.9%
5.3%
NTN-B 10Y 3.3%
BRML3 MULT3 IGTA3 ALSC3 BRPR3 SCAR3 CCPR3 LOGG3
Company Price IRR
6-Dec (%) 19E 20E 21E
BR Malls 16.55 4.6% 20.1x 20.8x 19.4x
Multiplan 30.53 4.8% 26.3x 22.5x 20.3x
Iguatemi 49.49 5.3% 23.1x 20.6x 18.6x
Aliansce Sonae 44.17 5.5% 26.7x 19.8x 16.0x
Parque Arauco 1,835.0 6.5% 17.3x 15.7x 13.7x
BR Properties 13.93 5.3% 110.5x 27.6x 19.1x
São Carlos 44.01 6.2% 32.5x 22.4x 16.6x
CCP 23.02 5.9% 69.4x 26.6x 23.8x
LOG CP 27.87 5.3% 31.9x 22.9x 18.6x
Average 39.7x 22.1x 18.5x
P/FFO
Retail sales & rents recovering + low interest rates = Buy malls & offices

190
• Mid/high-end homebuilders: Trisul and EZTec
• Corporate offices: BR Properties
• Shopping malls: Aliansce Sonae and Iguatemi
Summary of our calls
Top stock ideas
Who to own?
• Mid/high-income homebuilders focused on São Paulo, with low leverage, less problematic
inventories, large landbank and solid track-record;
• Commercial properties with exposure to the office sector as offices in São Paulo are posting
high leasing spreads and AAA offices in Rio should benefit from fly-to-quality;
Who to avoid?
• Low-income homebuilders with high exposure to Level 1.5, since subsidies should be
downsized in this bracket;

Healthcare and Education

192
32% 33% 33% 33% 35% 33% 38% 43%54% 57%
68% 67% 67% 67% 65% 67% 62% 57%46% 43%
2010 2011 2012 2013 2014 2015 2016 2017 2018 2019
% of Learning System % of Textbooks
103.6 107.2 110.5 117.8 126.8 136.0149.7
167.8
4.0% 3.6% 3.1%6.6% 7.6% 7.3%
10.0%12.1%
2011 2012 2013 2014 2015 2016 2017 2018T
hous
ands
Onsite Student Base Growth (y/y)
Education: All eyes on K12, DL and Medical Courses
Robust growth opportunity in K12 segment
Cogna is exposed to basic education (33% of 2019 revenues), where LT growth opportunities seem huge.
LS penetration remains relatively low - In the private segment, with 7.9mn K12 students (as of 2017), 43% are
using learning systems (~3.4mn), and most of the rest uses textbooks. Cogna supplies both learning
solutions.
Cogna’s 2020 sales cycle for Vasta (ie. its B2B niche for K12 segment) was R$687mn, up a strong 20%. A
potential IPO of this business unit should be a major catalyst for Cogna.
Distance Learning: we are increasingly positive on DL expansion
0.99 1.11 1.15 1.34 1.39 1.49 1.76 2.06
6.7%
12.2%
3.6%
16.3%
3.9%
7.2%
17.7% 16.9%
2011 2012 2013 2014 2015 2016 2017 2018
Milli
ons
DL Student Base Growth (y/y)
YDUQS, SER and Anima are substantially exposed to medical courses, representing respectively ~10%,
~12% and ~9% of FY2018 revenues.
Medicine seats’ maturation are certainly going to be accretive for abovementioned companies.
Further M&A moves in Medicine should bring relevant upside risks.
Med Schools: value generation via maturation + more M&As
The higher flexibility in the regulatory framework for DL was the main catalyst for the recent market growth
acceleration. COGN is the market leader of the segment, but YDUQS has been narrowing the gap in terms of
growth.
In 2019 on-site's weak student base figures were offset by more growth in DL segment, which in turn was
driven by additional learning centers, higher portfolio of courses and better macro environment.
Penetration of learning systems in private segments
Student Base Distance Learning (DL)
Med Schools Student Base in Brazil

193
Cogna: Our Top Pick in Education
Our bullish view is based on:
✓ A nice valuation, trading at 13.5x P/E 2020 and 9x EV/EBITDA 2020;
✓ Stronger growth prospects in K12, which seems mispriced (especially Vasta);
✓ Cogna recently confirmed (through material fact) the of intention structuring Vasta’s IPO;
✓ Leadership in onsite and DL (making it a price maker) in postsec education;
✓ Solid execution track record;
New holding entity “Cogna”

194
Healthcare – Vertical players still outperforming
Vertical players will keep consolidating the market
In a still very fragmented market (e.g. five largest players holding less than 30% share, excluding local
medical cooperatives as a group), we see consolidation as a natural path, mainly bolstered by the
following facts:
1. several players don’t have scale to vertically integrate their operations, especially in countryside
regions;
2. better MLR usually results in better pricing policies, thus resulting in market share gains by
vertically integrated operators;
3. Private health insurance is a highly regulated business, so poor execution should (unsurprisingly)
result in regulatory intervention.
Healthcare operators keep showing strong appetite for M&A
Recent robust M&A activity reflects that there is additional growth opportunities coming from further inorganic moves.
Main HC transactions in 2019:
Hapvida: São Francisco, América, Medical
GNDI: Clinipam, São Lucas, SMEDSJ, Belo Dente
85%81%
79%
88% 87%
60% 58%
74%71%
2013 2014 2015 2016 2017 2018
MLR
Amil SULA BBDC HAPV GNDI
Arm wrestling - payers vs. providers
We see bargaining power moving even further away from providers and over to payers, especially HMOs
(health maintenance organizations – e.g. vertically-integrated medical insurance groups).
Although eliminating the level of waste in the industry should be a long-term positive for everyone in the
HC chain, it should be negative for providers in the short term, likely reducing frequency levels on the
back of soft earnings momentum
% of Copay + Franchise increased [% of total members]

195
Hapvida: Our Top Pick in Healthcare
Our bullish view is based on:
✓ Discounted valuation vs. GNDI, trading at 35x P/E 2020 but a still attractive ~2x 3-year PEG ratio);
✓ HAPV is set to deliver the strongest non-adjusted earnings growth among healthcare listed companies;
✓ Robust earnings power;
✓ Bright LT growth prospects;
✓ Intense M&A activity;
✓ Less competitive landscape (GNDI is more exposed to Southeast), which in turn lead to further growth potential, especiallygiven HAPV’s exposure to the Individual HC plan market;
7.9%7.7%7.8% 7.8%
4.4%
6.2%
6.9%
4.7%
6.7%
8.5%
3.7%3.8%
2017 2018 2019E 2020E 2021E 2022E 2023E
HC Market Share[Consolidated]
BBDC Amil GNDI HAPV SULA
We see HAPV and GNDI gaining the most part of market share in
private HC industry going forward mostly from regional players
and PPOs

Telecom and Technology

197
A redefining moment for Brazil’s telco sector
✓Brazil’s telecom sector is at a strategic crossroad
− Oi, Brazil’s third largest telecom operator (by revenues), with nationwide, integrated operations, announced it is looking for strategic alternatives involving
its national mobile operations – number 4 in the country with 37.5mn mobile users (16.4% market share and 11% revenue share).
− In addition, approval of the Telecom Reform has created the conditions for potential new players to consider coming to Brazil.
− For existing operators (TIM, Vivo and Claro), buying Oi’s mobile operations would make business sense. By buying Oi’s mobile operations, existing
players would block the entrance of a newcomer in the market, guaranteeing a 3-player market in the long term, with the 4th player (Oi) being a provider
of wholesale fiber capacity to the market and operating a B2C FTTH broadband business.
− A scenario in which Oi is sold to a new, big, well-capitalized operator could put tremendous pressure on margins and profitability across the sector.
✓ Spectrum is probably Oi’s most valuable mobile asset
- One of Oi’s most valuable assets is its spectrum holdings.
- This is especially true now that Claro bought Nextel Brazil, increasing its spectrum holdings in the country to 170Mhz (ex-trunking), from 136Mhz before,
and opening a big gap to its main competitor Vivo (which controls 139Mhz) and TIM, which is a distant third with 113Mhz. Brazil’s spectrum holdings by operator and spectrum band
Source: Anatel
40 40
20 20
4529
22 24
43
26
3543
4
3
5
5
18
21
11
20
20
20
170
139
113
92
Claro Vivo Tim Oi
Brazilian Spectrum700 MHz (4G) 800 MHz (2G/3G)
900 MHz (2G/3G) 1,800 MHz (2G/4G)
1,900/2,100 MHz (3G/4G) 2,500/2,600 MHz (4G)

198
A redefining moment for Brazil’s telco sector
✓Vivo & TIM could buy Oi and still comply with spectrum cap rules
− Anatel’s new spectrum cap regulation, approved in October last year, changed the way spectrum caps are defined in Brazil.
− Now, spectrum caps are defined based on coverage (lower frequencies) and capacity (higher frequencies), rather than solely based on bands.
− The changes made the rules more modern, efficient and flexible, paving the way for consolidation in the Brazilian mobile market (the first move under the
new rules was the acquisition of Nextel Brazil by Claro).
− According to the new rules, an operator is allowed to have 35% of the entire lower/coverage spectrum (450/700/850/900Mhz) available in a specific
region. The new rules also allow operators to exceed the 35% threshold, all the way up to 40%, if some conditions to be imposed by Anatel are met.
− Under the new spectrum cap rules, both Vivo and TIM would be able to buy Oi’s mobile operations without exceeding the 40% cap, as shown in table 1
below – Claro would exceed the caps in some areas.
Oi + Vivo and Oi + TIM spectrum holdings
Source: Anatel, companies´ websites and BTG Pactual estimates
700 850 900 <1GB % 1800 2100 2500x 2500p >1GB % 700 850 900 <1GB % 1800 2100 2500x 2500p >1GB %
1 - São Paulo capital 20 25 5 50 24.5% 60 50 60 40 210 36.5% 20 0 10 30 14.7% 80 50 40 20 190 33.0%
2 - São Paulo country-side 20 25 5 50 24.5% 75 50 60 0 185 32.2% 20 0 10 30 14.7% 100 40 40 0 180 31.3%
2' - São Paulo Algar area 20 0 5 25 12.3% 70 30 60 0 160 27.8% 20 0 10 30 14.7% 90 20 40 0 150 26.1%
3 - Rio de Janeiro / Espírito Santo 20 25 10 55 27.0% 65 60 60 20 205 35.7% 20 0 10 30 14.7% 85 50 40 20 195 33.9%
4 - Minas Gerais 20 25 10 55 27.0% 60 50 60 0 170 29.6% 20 25 10 55 27.0% 70 40 40 20 170 29.6%
4' - Minas Gerais Algar area 20 0 10 30 14.7% 70 50 60 0 180 31.3% 20 25 10 55 27.0% 60 20 40 0 120 20.9%
5 - Paraná / Santa Catarin 20 25 10 55 27.0% 60 60 60 40 220 38.3% 20 25 10 55 27.0% 70 50 40 40 200 34.8%
5' - Londrina & Tamarana 20 25 5 50 24.5% 30 50 60 20 160 27.8% 20 0 10 30 14.7% 60 50 40 20 170 29.6%
6 - Rio Grande do Sul 20 25 10 55 27.0% 65 60 60 40 225 39.1% 20 0 10 30 14.7% 90 50 40 20 200 34.8%
6' - Região Pelotas 20 0 5 25 12.3% 90 60 60 20 230 40.0% 20 25 10 55 27.0% 60 50 40 20 170 29.6%
7 - Mid-west 20 25 10 55 27.0% 65 60 60 20 205 35.7% 20 0 10 30 14.7% 90 50 40 20 200 34.8%
7' - Region Itumbiara 20 0 5 25 12.3% 80 50 60 0 190 33.0% 20 0 10 30 14.7% 60 40 40 0 140 24.3%
8 - North 20 25 10 55 27.0% 65 40 60 20 185 32.2% 20 0 10 30 14.7% 80 50 40 40 210 36.5%
9 - Bahia / Sergipe 20 25 10 55 27.0% 65 60 60 20 205 35.7% 20 25 10 55 27.0% 65 50 40 20 175 30.4%
10 - Northeast 20 0 5 25 12.3% 90 50 60 20 220 38.3% 20 25 10 55 27.0% 60 40 40 40 180 31.3%
RegionOi + Vivo Oi + TIM

199
A redefining moment for Brazil’s telco sector
✓R$8bn in sales: Scale gains and synergies
− Spectrum is not the only reason why current operators would be interested in Oi.
− The company has 37.5mn mobile users and generates R$8bn in sales every year. TIM, for instance, would increase its sales by close to 50% if it buys
Oi’s mobile operations.
− Given the synergies and scale gains, the impact on EBITDA would be even greater -- the marginal EBITDA margin for TIM is certainly higher than Oi’s
current margin.
− If we conservatively assume that the marginal EBITDA margin on Oi’s R$8bn in sales is 50%, TIM would see its consolidated EBITDA jump by more than
60% -- from R$6.5bn to more than R$10bn. It would significantly reduce the operating free cashflow gap to Claro, which is expected to post R$12bn
EBITDA in 2019.
− Even for Vivo, which is already the largest telecom operator in the country, the gains are relevant. Vivo’s sales would exceed R$50bn and its EBITDA
would approach the R$20bn mark if it buys Oi’s mobile operations.
Revenues, EBITDA and mobile clients of the big-4 telcos
Source: Company reports and BTG Pactual estimates
2019E R$mn Vivo Claro TIM Oi
Net Revenues 43,774 35,559 17,260 20,171
EBITDA 15,649 12,069 6,591 4,989
EBITDA mg. 35.7% 33.9% 38.2% 24.7%
Mobile subs. (mn) 73.9 60.0 54.9 37.5
Market share 32.3% 26.2% 24.0% 16.4%
Postpaid subs (mn) 42.0 29.0 21.2 11.6
Market share 39.9% 27.6% 20.2% 11.0%
Prepaid subs (mn) 32.0 30.9 33.7 26.0
Market share 25.9% 25.1% 27.3% 21.0%

200
A redefining moment for Brazil’s telco sector
✓ Oi’s mobile business could be worth north of R$15bn
- Given the economic and strategic benefits of a deal with Oi, we wouldn’t be surprised to see the existing telecom operators willing to pay a
6-8x EV/EBITDA multiple for Oi’s mobile operations, as they would ultimately be eliminating a relevant player and consolidating Brazil’s
historically competitive mobile market.
- Oi’s mobile revenues reached R$8bn in 2018 and we estimate its mobile EBITDA to be some R$2.5bn (Oi does not report EBITDA by
business). If it sells its mobile operations for 6-8x EV/EBITDA, it would raise between R$15bn-R$20bn.
- While some may think 7-8x EV/EBITDA may be too much to pay for Oi’s mobile operations, if the acquirers are the other existing Brazilian
telecom operators, the synergies would be so big that the implicit multiple would be much lower than this.
- The incremental margins for existing operators could range from 50% to 70%, which would bring the implied multiple paid down to a range
of 3.0-5.0x, including synergies.
✓ AMX acquisition of Nextel Brasil: Positive read-through for Oi
- AMX bought Nextel Brazil operations in March, paying US$954mn. Considering Nextel Brazil standalone, the price paid implied a valuation of ~46x
EV/EBITDA, as subscale Nextel Brazil reported EBITDA margin of only 3.7% in 2018.
- However, assuming a marginal EBITDA margin of 50-70%, AMX actually paid an implied multiple in the 2.4-3.4x EV/EBITDA range.
- The valuation AMX paid for Nextel Brazil supports our view that Oi’s mobile operations standalone could be worth between R$15bn-20bn.
- Applying the same EV/sales multiple AMX paid for Nextel Brazil to Oi’s R$8bn/year mobile sales, we would get an EV of R$14.4bn. In addition, Oi has
more than twice the spectrum of Nextel in the main Brazilian states (in some areas it has 5x more) and a mobile base that is 13x larger.
✓ AMX paid close to 10x EV/EBITDA for Telefonica’s assets in Central America
- Back in Janauary, AMX announced the acquisition of Telefonica’s operations in Guatemala and El Salvador (the latter has never been approved by local
anti-trust authorities, though) for US$650mn.
- In a release issued by Telefonica, it said AMX paid the equivalent of 9.7x EV/EBITDA for Telefonica’s operations in these two countries. As was the case
with Nextel Brazil, market consolidation usually commands big valuation premiums as synergies more than compensate the potential excess payment.
✓ Market concentration could be addressed by current operators
✓

201
Totvs is our top pick in the software universe
✓ We have recently revised our estimates for Totvs…
- Our new target price points to a fair value of R$70 per share.
- We are valuing the company in two separate blocks: i) Core business, which we think is worth R$55; ii) Techfin, which we believe has the
potential to add na extra R$15 to our target price;
✓ Core business: Big room for improvement
- Macro recovery: remains the main top line driver for the company over the next few years
- Cross-selling opportunities: but we have also grown confident in the cross-selling potential of Totvs’ CRM & Analytics platforms.
✓ Flying with two engines again: Franchises back on board
- Totvs’ relationship with some of its franchises had become strained in recent years. Problems ranged from sales inadequate sales model to lack
of of new solutions/products being launched. On Totvs’ side, the company noted that a number of franchises were under delivering on several
fronts.
- At this point, these issues have been addressed… and Totvs has started to reap the benefits of this realignment in its relationship with franchises. 1H19
confirm this. We expect this to continue helping results throughout 2019.
✓ As Brazil’s leading ERP player (~50% share), Totvs is clearly in a unique position to pursue Fintech opportunities
- Its client base (>32,000 clients) accounts for 25% of Brazil’s GDP, with sales equivalent to approximately R$1.6trn per year
- Its payroll system provides services to 10mn payroll employees (via Totvs’ HR platforms), or 25% of all payroll workers in Brazil
- It is the 2nd largest provider of management solutions to retailers in Brazil, with close to 20% of the market
- Its education vertical serves schools & universities that combined have 3.5mn students and a R$30bn TPV
- Its medical solutions are used by more than 10,000 doctors across Brazil.

Utilities

203
Coverage
Tough hydrological conditions: GSF still expected @ 84%
Potential privatizations (Eletrobras?)
Consolidation of distribution segment
Sector regulatory framework to be reshaped by Bill #232
Sanitation bill to be voted in Lower House and Senate
New Gas Market could create opportunities in Utilities sector
Municipal elections
Relevant topicsAES TIETEALUPARCEMIGCESPCOPELCOPASACPFLEDP DO BRASILENERGISAENEVAENGIE BRASILEQUATORIALLIGHTOMEGASANEPARSABESPTRANSMISSÃO PAULISTATAESA
Highlights for 2020
After several follow-on offers in 2019 (Eneva, CPFL, Light, Omega) and a sluggish macroeconomic rebound, we
expect progress on the regulatory agenda in 2020, with a new sector structure surfacing sooner than expected.

204
Utilities´ average IRR is close to 7%, reflecting the decline in Brazilian 10y real rates to 2.6%
We see Utilities´ ERP close to 4.5%
IRRUtilities ERP
0%
2%
4%
6%
8%
10%
12%
14%
16%
Jan
-13
Ap
r-1
3Ju
l-1
3O
ct-1
3Ja
n-1
4A
pr-
14
Jul-
14
Oct
-14
Jan
-15
Ap
r-1
5Ju
l-1
5O
ct-1
5Ja
n-1
6A
pr-
16
Jul-
16
Oct
-16
Jan
-17
Ap
r-1
7Ju
l-1
7O
ct-1
7Ja
n-1
8A
pr-
18
Jul-
18
Oct
-18
Jan
-19
Ap
r-1
9Ju
l-1
9O
ct-1
9
Average IRR Median IRR 10y Real Rates
0%
1%
2%
3%
4%
5%
6%
7%
8%
Jan
-13
Ap
r-1
3
Jul-
13
Oct
-13
Jan
-14
Ap
r-1
4
Jul-
14
Oct
-14
Jan
-15
Ap
r-1
5
Jul-
15
Oct
-15
Jan
-16
Ap
r-1
6Ju
l-1
6
Oct
-16
Jan
-17
Ap
r-1
7
Jul-
17
Oct
-17
Jan
-18
Ap
r-1
8
Jul-
18
Oct
-18
Jan
-19
Ap
r-1
9Ju
l-1
9
Oct
-19
Utility ERP Top 5 IRR - Bottom 5 IRR
Utilities´ IRR and ERP

205
• Its distribution assets are located in rich concession areas, with very low energy theft and delinquency, but this hasn’t stopped it
outperforming regulatory EBITDA in most of its concessions.
• In generation, they have low exposure to the hydro deficit as most hydro plants are fully hedged against GSF.
• CEEE’s privatization is expected to be concluded in 1H20, and CPFL is the most prepared player to acquire it, consolidating its
distribution footprint in Rio Grande do Sul and benefiting from operating synergies at RGE. CEB is another potential acquisition
target.
• As a strong cashflow generator, we see room for a higher dividend payout if they can´t find M&A opportunities.
Solid cashflow generation and potential dividends1
Valuation
• CPFL is our Top Pick in the sector, as we see it trading at an attractive real IRR of 9.0% and an EV/RAB 2020 of 2.04x, a significant
discount to other top-quality operators, whilst delivering strong cashflow generation via top-quality assets.
Top Picks: CPFL
2

206
• Light is our most challenging Top Pick, but we believe the company has the best combination of factors to deliver on its long-awaited
turnaround.
• The company now has a much lower influence from Cemig, senior management now has the proper incentives via its stock option
plan, and the profile of the Board is slowly becoming more market-oriented.
• Potential gains (not included in our numbers) from PIS/Cofins tax dispute could be very positive.
• We believe the new management team has the expertise to deliver on the company’s energy loss guidance.
Alignment of interest seems on point 1
Valuation
• We see Light trading at 1.06x EV/RAB and, once it becomes a sustainable concession, it could morph into an M&A target for other
groups.
Top Picks: Light
2

207
• We now see lower chances of Cemig being privatized, with a lack of political support the main obstacle.
• The recent sell-off was overcooked. While a privatized Cemig could be worth R$21/share, we believe a state-owned, well-run
company (our base case) is worth R$15/share, offering upside to current prices.
• We believe Governor Zema is doing his best to continue pushing the privatization agenda. He recently published Decree #47,766,
regulating the privatization of public-sector companies. The decree aims to regulate state privatization policy by creating a state
privatization board, charged with reorganizing the state’s strategic position by transferring to 'private initiative' those activities that can
be better explored by the private sector.
Recent sell-off seems overcooked1
Valuation
• We see Cemig trading at a 9.0% real IRR and, in our TP, we assume a well-managed (albeit still state-owned) company.
Top Picks: Cemig
2

Ibovespa: Looks attractive, and under-owned

209
Valuations are relatively attractive
✓The Ibovespa is now trading at 13.8x 12-month forward P/E, above its historical average
− Some may argue that the Ibovespa has moved up too much in recent months, but we disagree. It is indeed trading above its historical
average (13.8x vs. 12.6x 12-month forward P/E), but with a whole different scenario.
− This average of 12.6x was built based on an historical setup of relatively high long-term real interest rates, expectations of consistently lower
rates could drive the Ibovespa to trade at a premium to its average.
− Long-term real interest rates were at 5.9% before the elections and have since plummeted to 3% on expectations of structural changes.
− We believe that under this scenario of structural low long-term interest rates, the Ibovespa could quickly trade at one-standard deviation
above average. Using our 12-month forward earnings, this puts the index at ~118k points.
Brazil’s 12-month forward P/E
Source: Economática, BTG Pactual estimates
13.8
7x
9x
11x
13x
15x
17x
19x
Jun-
07O
ct-0
7Fe
b-08
Jun-
08O
ct-0
8Fe
b-09
Jun-
09O
ct-0
9Fe
b-10
Jun-
10O
ct-1
0Fe
b-11
Jun-
11O
ct-1
1Fe
b-12
Jun-
12O
ct-1
2Fe
b-13
Jun-
13O
ct-1
3Fe
b-14
Jun-
14O
ct-1
4Fe
b-15
Jun-
15O
ct-1
5Fe
b-16
Jun-
16O
ct-1
6Fe
b-17
Jun-
17O
ct-1
7Fe
b-18
Jun-
18O
ct-1
8Fe
b-19
Jun-
19O
ct-1
9
Average +1 Std Dev -1 Std Dev P/E 12MF (ex-Petro & Vale)

210
Premium to hold equities moving up
✓Equity Risk Premium soared after strong decline in long-term real rates
− Earnings yield, i.e. the inverse of the P/E (Earnings / market cap) minus ten-year / one-year real interest rates, is above one-standard
deviation above its historical average, suggesting room for stock prices to move up further and bring the yield back to average.
Earnings yield (E/P minus 10-year interest rates)
Source: Bloomberg, Tesouro Direto, BTG Pactual estimates
3.9%
2.2%
0.0%
0.5%
1.0%
1.5%
2.0%
2.5%
3.0%
3.5%
4.0%
4.5%
5.0%
Nov
-11
Mar
-12
Jul-1
2
Nov
-12
Mar
-13
Jul-1
3
Nov
-13
Mar
-14
Jul-1
4
Nov
-14
Mar
-15
Jul-1
5
Nov
-15
Mar
-16
Jul-1
6
Nov
-16
Mar
-17
Jul-1
7
Nov
-17
Mar
-18
Jul-1
8
Nov
-18
Mar
-19
Jul-1
9
Nov
-19
Real Earnings Yield (Ex-Petro & Vale) AVERAGE +1 Std Dev -1 Std Dev

211
Long positive cycles can yield outstanding performances
✓We looked at an Ibovespa series (in USD) dating back to the 1980s (chart 1 below) and identified lengthy rallies,
usually triggered by key political events that drove the Ibovespa to post outstanding performances.
✓The impeachment of President Dilma may have started a new cycle.
Source: BTG Pactual and Bloomberg
100
1,000
10,000
100,0000
2/0
1/1
98
0
02
/01
/19
81
02
/01
/19
82
02
/01
/19
83
02
/01
/19
84
02
/01
/19
85
02
/01
/19
86
02
/01
/19
87
02
/01
/19
88
02
/01
/19
89
02
/01
/19
90
02
/01
/19
91
02
/01
/19
92
02
/01
/19
93
02
/01
/19
94
02
/01
/19
95
02
/01
/19
96
02
/01
/19
97
02
/01
/19
98
02
/01
/19
99
02
/01
/20
00
02
/01
/20
01
02
/01
/20
02
02
/01
/20
03
02
/01
/20
04
02
/01
/20
05
02
/01
/20
06
02
/01
/20
07
02
/01
/20
08
02
/01
/20
09
02
/01
/20
10
02
/01
/20
11
02
/01
/20
12
02
/01
/20
13
02
/01
/20
14
02
/01
/20
15
02
/01
/20
16
02
/01
/20
17
02
/01
/20
18
02
/01
/20
19
End of Dictatorship+ Plano Cruzado
Impeachment of President Collor
Election of President Lula +
Letter to Brazilians
Impeachmentof President
Dilma
+19x
+30x
+16x

Ibovespa recent performance

213
What a rally!
Ibovespa performance (2008 – 2019) Stock market performance in 2018 (in US$)
Source: BTG Pactual, Bloomberg and Economatica
Ibovespa performance 2019 Stock market performance YTD (in US$)
-50.2%
-18.6%
-15.6%
-10.9%
-6.9%
-6.2%
-5.6%
-1.8%
-60% -50% -40% -30% -20% -10% 0%
Argentina MERVAL
Chile IPSA
MEXBOL
Colombia IGBC
Peru SPBLPGPT
S&P 500
Dow Jones
IBOV
21,000
22,000
23,000
24,000
25,000
26,000
27,000
28,000
29,000
6,000
11,000
16,000
21,000
26,000
31,000
36,000
41,000
46,000
-23.0%
-13.2%
3.9%
9.2%
14.6%
20.6%
20.7%
26.5%
-35% -25% -15% -5% 5% 15% 25% 35%
Argentina MERVAL
Chile IPSA
Peru SPBLPGPT
MEXBOL
Colombia IGBC
Dow Jones
IBOV
S&P 500

214
Performance by sector YTD in 2019
Source: BTG Pactual, Bloomberg and Economatica
81.4
72.7
60.6 59.0 58.5
47.0 45.039.3
27.7 25.822.9 21.3 21.0 20.3 19.4 18.3
9.83.8
1.1
-0.7-10.0
0.0
10.0
20.0
30.0
40.0
50.0
60.0
70.0
80.0
90.0
Foo
d &
Bev
erag
e
Edu
cati
on
Re
al E
stat
e
Infr
astr
uctu
re
Ca
r R
en
tal &
Lo
gist
ics
Uti
litie
s
Hea
lth
care
Fin
an
cia
ls e
x-B
anks
IBO
V
Ibrx
-50
Pu
lp, P
aper
& W
oo
d
Re
tail
Oil,
Ga
s &
Ch
em
ica
ls
Agr
ibus
ines
s
Stee
l
Air
lines
& M
ilea
ge
Ban
ks
Min
ing
Te
lco
& T
ech
Ca
pita
l Go
od
s
YTD (%)

215
In 2018, IBOV performed better than other LatAm indexes
Ibovespa performance (2008 – 2018) Stock market performance in 2017 (in US$)
Source: BTG Pactual, Bloomberg and Economatica
Ibovespa performance 2018 Stock market performance in 2018 (in US$)
-49.2%
-13.3%
-5.6%
-0.8%
1.3%
6.2%
7.1%
7.7%
-60% -50% -40% -30% -20% -10% 0% 10% 20%
Argentina MERVAL
Chile IPSA
Peru SPBLPGPT
IBOV
MEXBOL
Colombia IGBC
Dow Jones
S&P 500
0
5,000
10,000
15,000
20,000
25,000
30,000
35,000
40,000
45,000
50,000
17,000
19,000
21,000
23,000
25,000
27,000
29,000
-50.2%
-18.6%
-15.6%
-10.9%
-6.9%
-6.2%
-5.6%
-1.8%
-60% -50% -40% -30% -20% -10% 0%
Argentina MERVAL
Chile IPSA
MEXBOL
Colombia IGBC
Peru SPBLPGPT
S&P 500
Dow Jones
IBOV

Valuation maps

217
Valuation Summary
Source: BTG Pactual estimates
General Data Market Cap. ADTV (R$mn) Price (R$) P/E EV/EBITDA P/BV Dividend Yield (%) Net Debt/EBITDA
Ticker Rating (R$ mn) 12M Average Last Target 2019E 2020E 2021E 2019E 2020E 2021E 2019E 2020E 2021E 2019E 2020E 2021E 2019E 2020E 2021E
Banks
Itaú ITUB4 Buy 330,688 3,617 36.31 45.00 12.3x 10.9x 10.2x n.a. n.a. n.a. 2.7x 2.5x 2.3x 4.5% 5.1% 5.5% n.a. n.a. n.a.
Bradesco BBDC4 Buy 270,346 3,155 34.80 44.00 11.1x 10.0x 9.2x n.a. n.a. n.a. 2.0x 1.9x 1.7x 5.5% 5.4% 5.9% n.a. n.a. n.a.
Banco do Brasil BBAS3 Neutral 135,266 2,754 48.53 57.00 6.9x 6.2x 5.5x n.a. n.a. n.a. 1.2x 1.1x 1.0x 5.1% 6.0% 6.7% n.a. n.a. n.a.
Santander Brasil SANB11 Neutral 166,289 366 44.71 52.00 11.3x 10.5x 9.5x n.a. n.a. n.a. 2.3x 2.1x 1.9x 4.2% 4.6% 5.1% n.a. n.a. n.a.
Banco ABC ABCB4 Buy 4,166 48 19.36 23.00 8.2x 7.7x 6.6x n.a. n.a. n.a. 1.0x 1.0x 0.9x 5.6% 6.0% 7.0% n.a. n.a. n.a.
Banco Inter BIDI11 Buy 10,338 209 44.25 63.00 163.2x 52.6x 30.8x n.a. n.a. n.a. 5.1x 4.8x 4.4x 0.5% 0.7% 1.2% n.a. n.a. n.a.
Banrisul BRSR6 Neutral 8,936 140 20.60 25.00 7.0x 6.4x 5.9x n.a. n.a. n.a. 1.1x 1.0x 0.9x 6.1% 6.7% 7.2% n.a. n.a. n.a.
Median 11.1x 10.0x 9.2x n.a. n.a. n.a. 2.0x 1.9x 1.7x 5% 5% 6% n.a. n.a. n.a.
Financials (ex-Banks)
B3 B3SA3 Buy 94,926 1,900 46.40 59.00 n.a. n.a. n.a. 24.4x 21.1x 18.9x 3.7x 3.6x 3.6x 2.4% 2.8% 3.4% n.a. n.a. n.a.
Cielo CIEL3 Neutral 23,818 681 8.78 8.00 14.1x 15.4x 14.2x 8.8x 9.1x 9.2x 1.7x 1.6x 1.5x 2.6% 2.1% 3.8% 1.4 2.2 1.9
IRB Brasil IRBR3 Neutral 34,158 862 36.68 40.00 21.2x 17.9x 15.8x n.a. n.a. n.a. 7.7x 7.0x 6.3x 3.5% 4.2% 4.7% n.a. n.a. n.a.
BB Seguridade BBSE3 Buy 74,573 587 37.35 39.00 8.5x 25.3x 23.5x n.a. n.a. n.a. 10.2x 9.2x 8.3x 4.9% 4.9% 5.3% n.a. n.a. n.a.
Wiz WIZS3 Neutral 2,181 35 13.64 11.00 9.5x 8.1x 7.3x n.a. n.a. n.a. 46.7x 40.3x 44.4x 8.3% 10.8% 12.6% n.a. n.a. n.a.
Porto Seguro PSSA3 Neutral 19,459 208 60.26 64.00 14.0x 13.0x 11.6x n.a. n.a. n.a. 2.5x 2.3x 2.1x 4.3% 4.7% 5.2% n.a. n.a. n.a.
Sul America SULA11 Neutral 22,238 415 53.70 45.00 19.0x 8.4x 16.0x n.a. n.a. n.a. 2.9x 2.7x 2.5x 1.4% 10.9% 2.7% n.a. n.a. n.a.
Median 14.1x 14.2x 15.0x 16.6x 15.1x 14.1x 3.7x 3.6x 3.6x 4% 5% 5% 1.4 2.2 1.9
Retail
B2W Digital BTOW3 Buy 34,613 600 66.20 74.00 n.a. 822.2x 145.3x 69.1x 47.9x 34.0x 5.6x 5.6x 5.4x 0.0% 0.0% 0.0% 3.6 n.a. n.a.
CVC Brasil CVCB3 Buy 6,435 467 43.63 64.00 27.5x 20.0x 17.4x 13.6x 10.6x 9.5x 4.5x 3.8x 3.3x 1.3% 1.1% 1.5% 2.2 1.6 1.5
Lojas Americanas LAME4 Buy 39,463 472 26.74 28.00 67.4x 43.3x 30.7x 16.2x 13.8x 11.6x 7.1x 6.4x 5.6x 1.0% 0.8% 0.9% 1.8 1.2 0.9
Magazine Luiza MGLU3 Buy 79,726 1,545 49.07 44.00 96.8x 153.1x 150.0x 53.6x 55.6x 50.4x 21.8x 19.5x 17.6x 0.1% 0.2% 0.2% n.a. 0.0 n.a.
Natura NATU3 Neutral 31,778 634 36.71 25.00 45.2x 36.3x 27.6x 20.6x 17.7x 15.4x 9.6x 7.9x 6.4x 0.6% 0.7% 0.9% 3.2 2.3 1.7
Via Varejo VVAR3 Neutral 14,115 918 10.87 8.00 48.0x 24.7x 19.8x 12.5x 9.1x 7.9x 4.2x 3.7x 3.2x 0.0% 0.7% 1.3% 1.2 0.9 0.7
Centauro CNTO3 Buy 6,935 198 33.00 18.00 49.9x 31.1x 21.0x 18.0x 15.2x 12.5x 5.9x 4.9x 3.9x 0.0% 0.0% 0.0% 0.3 n.a. n.a.
Cia Hering HGTX3 Neutral 5,453 247 33.57 26.00 18.7x 16.9x 15.3x 18.4x 16.4x 14.7x 4.3x 4.2x 4.1x 4.7% 5.2% 5.7% n.a. n.a. n.a.
Lojas Renner LREN3 Buy 43,043 904 54.25 51.00 36.1x 29.0x 23.5x 24.1x 19.7x 16.4x 8.0x 6.6x 5.4x 0.9% 1.1% 1.3% 0.3 0.2 0.1
Hypera HYPE3 Buy 20,881 310 33.12 30.00 17.2x 16.9x 15.5x 16.4x 16.5x 15.0x 2.3x 2.2x 2.0x 3.1% 2.9% 3.1% n.a. n.a. n.a.
Pão de Açucar PCAR4 Buy 22,970 666 83.99 106.00 18.9x 16.5x 15.3x 7.1x 6.7x 6.3x 2.6x 2.4x 2.2x 3.1% 3.2% 3.7% 0.3 0.2 0.1
Raia Drogasil RADL3 Buy 35,274 498 107.01 90.00 67.6x 49.9x 37.4x 21.6x 18.4x 15.8x 8.8x 7.8x 6.8x 0.7% 0.7% 0.8% 0.4 0.2 0.0
Carrefour BR CRFB3 Neutral 41,269 285 20.80 20.00 21.8x 18.4x 15.9x 11.4x 10.2x 9.0x 2.6x 2.4x 2.2x 1.6% 2.4% 2.8% 0.4 0.0 n.a.
BK Brasil BKBR3 Buy 3,766 103 16.60 26.00 22.6x 14.9x 10.7x 10.6x 8.2x 6.5x 1.9x 1.7x 1.5x 0.9% 1.2% 1.8% n.a. n.a. n.a.
Lojas Marisa AMAR3 Neutral 2,390 47 11.72 12.00 n.a. n.a. 114.9x 14.3x 12.0x 10.9x 3.0x 3.4x 3.3x 0.0% 0.0% 0.0% 2.3 3.6 3.1
Median 36.1x 26.9x 21.0x 16.4x 15.2x 12.5x 4.5x 4.2x 3.9x 1% 1% 1% 1.2 0.6 0.8
Stock Guide

218
Valuation Summary
Source: BTG Pactual estimates
General Data Market Cap. ADTV (R$mn) Price (R$) P/E EV/EBITDA P/BV Dividend Yield (%) Net Debt/EBITDA
Ticker Rating (R$ mn) 12M Average Last Target 2019E 2020E 2021E 2019E 2020E 2021E 2019E 2020E 2021E 2019E 2020E 2021E 2019E 2020E 2021E
Housing
Eztec EZTC3 Buy 11,146 145 49.10 39.00 44.1x 25.3x 17.5x 97.4x 29.8x 20.8x 3.2x 3.2x 3.0x 0.4% 4.4% 4.8% n.a. n.a. n.a.
Lopes Brasil LPSB3 Buy 1,400 15 9.49 6.70 162.6x 24.4x 18.5x 36.7x 16.9x 14.3x 16.1x 10.7x 8.6x 0.0% 2.1% 4.5% n.a. n.a. n.a.
Cyrela Realt CYRE3 Buy 11,314 380 29.43 27.00 33.0x 20.5x 14.5x 36.5x 23.2x 16.9x 2.3x 2.4x 2.3x 5.2% 8.4% 5.1% 2.5 1.0 0.2
MRV MRVE3 Buy 9,814 428 22.16 23.00 12.1x 10.9x 9.9x 14.1x 13.1x 12.4x 1.8x 1.6x 1.5x 3.8% 6.6% 8.0% 0.5 0.4 n.a.
Even EVEN3 Buy 3,075 73 14.65 12.00 24.4x 18.4x 10.9x 23.8x 24.7x 16.7x 1.8x 1.7x 1.5x 1.1% 2.8% 4.8% 4.6 3.3 1.0
Direcional DIRR3 Buy 2,134 38 14.44 15.00 17.2x 9.5x 7.3x 10.6x 8.8x 7.5x 1.5x 1.4x 1.3x 4.3% 7.9% 10.3% 0.7 0.2 0.2
Helbor HBOR3 No Rating 2,833 37 4.27 n/a n.a. 28.1x 23.5x 555.5x 30.2x 28.0x 2.5x 2.2x 2.0x 0.0% 0.0% 1.6% 207.6 7.0 4.4
Tecnisa TCSA3 Buy 1,229 64 1.67 2.00 n.a. n.a. 22.0x -7.2x -11.6x -61.9x 1.3x 1.4x 1.3x 0.0% 0.0% 1.1% n.a. n.a. n.a.
Trisul TRIS3 Buy 2,710 34 14.52 16.00 20.2x 14.1x 10.8x 19.0x 14.5x 11.0x 2.5x 2.2x 2.0x 0.8% 1.8% 3.8% 1.3 n.a. 0.9
Median 28.7x 20.5x 16.0x 30.2x 20.1x 15.5x 2.0x 1.9x 1.8x 1% 4% 5% 2.5 1.0 0.6
Commercial Properties
BR Malls Par BRML3 Buy 14,662 508 17.39 15.00 23.2x 20.4x 18.0x 18.4x 17.3x 15.9x 1.4x 1.3x 1.3x 1.8% 2.5% 2.8% 2.4 1.9 1.9
Iguatemi IGTA3 Buy 8,821 301 50.02 46.00 31.9x 29.9x 25.6x 19.9x 18.5x 16.8x 2.9x 2.8x 2.6x 1.6% 1.7% 1.9% 2.6 1.9 1.5
Multiplan MULT3 Buy 18,394 388 30.85 27.00 34.7x 30.0x 25.9x 22.7x 20.9x 18.4x 3.2x 3.1x 2.9x 1.4% 1.6% 1.7% 0.7 0.3 0.1
Alianscsonae ALSO3 Buy 10,395 74 43.66 22.00 n.a. n.a. n.a. 29.1x 27.1x 25.0x 2.1x 2.0x 2.1x 1.1% 1.9% 6.1% 3.4 2.4 1.9
BR Propert BRPR3 Buy 7,144 59 14.64 15.00 n.a. 32.5x 20.4x 35.4x 27.2x 19.8x 1.0x 1.0x 0.9x 0.0% 0.9% 1.5% 6.2 4.1 2.9
Log Com Prop LOGG3 Buy 3,079 53 30.14 29.00 48.3x 35.6x 29.0x 45.6x 35.0x 27.0x 0.9x 0.9x 0.9x 0.5% 1.0% 1.2% 8.4 6.0 4.9
Sao Carlos SCAR3 Neutral 2,419 2 43.00 42.00 28.5x 39.1x 24.9x 21.6x 18.4x 16.2x 1.6x 1.6x 1.5x 0.8% 0.6% 1.0% 5.6 4.2 3.4
Median 31.9x 31.3x 25.3x 22.7x 20.9x 18.4x 1.6x 1.6x 1.5x 1% 2% 2% 3.4 2.4 1.9
Utilities
CPFL Energia CPFE3 Buy 38,485 287 33.40 37.00 15.3x 13.2x 12.2x 10.4x 9.7x 9.0x 2.5x 2.3x 2.1x 3.4% 3.9% 4.2% 3.2 1.8 1.6
Equatorial EQTL3 Buy 22,882 552 22.67 23.00 15.9x 18.5x n.a. 12.0x 14.5x n.a. 3.4x 3.1x n.a. 1.6% 2.7% n.a. 2.1 4.5 n.a.
Energisa ENGI11 Buy 19,603 305 51.36 50.00 37.5x 16.4x 25.3x 12.7x 11.6x 10.5x 3.2x 2.9x 2.7x 1.4% 3.3% 2.1% n.a. n.a. n.a.
Light S/A LIGT3 Buy 6,696 195 22.03 22.00 11.4x 6.2x 5.8x 8.5x 7.8x 7.2x 1.2x 1.0x 0.9x 2.2% 4.1% 4.4% 4.7 2.9 2.6
Cemig CMIG4 Buy 19,883 689 13.03 15.50 5.0x 7.1x n.a. 7.1x 7.6x n.a. 1.1x 1.0x n.a. 5.2% 3.7% n.a. 3.5 2.9 n.a.
Copel CPLE6 Neutral 18,242 208 65.49 64.00 9.1x 5.7x 5.5x 7.4x 6.2x 6.4x 1.0x 1.0x 0.9x 5.7% 9.0% 9.4% 2.4 1.6 1.4
Energias BR ENBR3 Buy 12,507 249 20.68 22.00 12.9x 10.7x 9.1x 8.5x 7.8x 6.6x 1.4x 1.4x 1.3x n.a. n.a. n.a. 2.3 1.8 1.6
AES Tiete E TIET11 Neutral 5,762 74 14.45 14.00 18.0x 9.0x 9.1x 9.7x 6.8x 6.6x 3.6x 3.6x 3.6x 5.9% 11.6% 11.4% 3.5 2.2 1.9
Cesp CESP6 Neutral 9,745 145 29.97 32.00 n.a. 26.3x 21.6x 21.7x 12.7x 11.4x 1.4x 1.4x 1.4x 0.0% 4.7% 5.7% n.a. 1.1 0.3
Engie Brasil EGIE3 n.a. 39,156 294 47.99 n.a. n.a. n.a. n.a. n.a. n.a. n.a. n.a. n.a. n.a. n.a. n.a. n.a. n.a. n.a. n.a.
Eneva ENEV3 Buy 12,578 154 39.89 34.00 24.1x 21.8x n.a. 12.6x 12.5x n.a. 1.9x 1.7x n.a. 0.0% 0.0% n.a. 2.9 2.2 n.a.
Omega Ger OMGE3 Buy 6,057 48 36.74 37.00 27.9x 20.6x 20.2x 15.6x 13.8x 13.3x 2.3x 2.1x 1.9x 1.1% 1.5% 1.5% 3.1 4.4 3.6
Alupar ALUP11 Buy 8,457 87 27.06 27.00 13.1x 43.4x 12.9x 9.4x 15.5x 8.1x 1.7x 1.7x 1.5x 4.2% 1.3% 8.6% 1.9 4.3 3.1
Taesa TAEE11 Neutral 10,373 197 30.36 31.00 9.6x 10.3x 10.3x 14.6x 16.7x 16.9x 2.2x 2.2x 2.2x 9.5% 9.9% 9.9% 2.4 3.3 4.4
Tran Paulist TRPL4 Neutral 15,689 170 22.75 20.00 13.3x 10.8x 9.8x 12.7x 11.8x 11.0x 1.3x 1.3x 1.3x 7.2% 9.2% 10.1% 1.6 1.0 0.6
Copasa CSMG3 Neutral 8,280 201 65.51 65.00 12.0x 9.9x 10.6x 7.2x 6.2x 6.1x 1.3x 1.3x 1.3x 3.2% 9.5% 8.9% 2.0 1.5 1.6
Sabesp SBSP3 Buy 39,917 691 58.40 53.00 15.8x 13.6x 13.6x 9.9x 9.0x 8.5x 2.0x 1.8x 1.6x 1.5% 1.7% 1.7% 1.8 1.3 1.2
Sanepar SAPR11 Neutral 9,361 240 94.42 114.00 8.7x 6.8x 6.2x 7.3x 6.0x 5.4x 1.6x 1.5x 1.3x 8.5% 7.2% 7.9% 2.0 1.8 1.7
Median 13.2x 10.8x 10.4x 9.9x 9.7x 8.3x 1.7x 1.7x 1.5x 3% 4% 8% 2.4 2.0 1.6
Stock Guide

219
Valuation Summary
Source: BTG Pactual estimates
General Data Market Cap. ADTV (R$mn) Price (R$) P/E EV/EBITDA P/BV Dividend Yield (%) Net Debt/EBITDA
Ticker Rating (R$ mn) 12M Average Last Target 2019E 2020E 2021E 2019E 2020E 2021E 2019E 2020E 2021E 2019E 2020E 2021E 2019E 2020E 2021E
Metals and Mining
Vale VALE3 Buy 275,696 5,029 53.76 56.28 19.5x 7.8x 8.9x 7.7x 5.3x 5.6x 1.4x 1.3x 1.2x 5.3% 5.3% 5.3% 1.3 0.4 0.3
CSN CSNA3 Neutral 19,570 814 14.18 15.00 11.3x 9.1x n.a. 9.5x 8.0x n.a. 2.0x 1.6x n.a. 9.6% 2.8% n.a. 5.1 3.7 n.a.
Gerdau GGBR4 Buy 29,551 888 18.49 19.00 11.1x 9.8x n.a. 7.4x 6.8x n.a. 1.1x 1.0x n.a. 2.1% 2.2% n.a. 2.0 1.5 n.a.
Usiminas USIM5 Neutral 11,570 587 9.25 10.00 20.8x n.a. n.a. 9.5x n.a. n.a. 0.7x n.a. n.a. 0.0% n.a. n.a. 2.3 n.a. n.a.
Median 15.4x 9.1x 8.9x 8.6x 6.8x 5.6x 1.3x 1.3x 1.2x 4% 3% 5% 2.2 1.5 0.3
Pulp and Paper
Suzano S.A. SUZB3 Buy 52,458 1,238 38.88 44.00 n.a. 29.1x 18.3x 11.8x 11.4x 10.6x 2.8x 2.6x 2.3x 1.3% 1.3% 1.3% 1.1 5.1 4.4
Klabin S/A KLBN11 Buy 20,600 346 18.83 20.00 n.a. 43.7x 45.7x 9.5x 10.8x 9.9x 3.6x 3.8x 4.0x 4.1% 3.6% 3.7% 3.3 4.2 4.6
Median n.a. 36.4x 32.0x 10.7x 11.1x 10.2x 3.2x 3.2x 3.2x 3% 2% 2% 2.2 4.7 4.5
Healthcare and Education
Qualicorp QUAL3 Neutral 9,605 299 34.22 32.00 24.6x 22.4x 18.1x 11.3x 11.0x 10.5x 4.0x 4.0x 3.9x 3.1% 4.3% 5.2% 0.3 0.6 0.6
Odontoprev ODPV3 Neutral 8,371 120 15.81 16.00 31.3x 27.6x 19.7x 20.7x 19.7x 16.2x 7.7x 7.4x 7.1x 1.7% 2.8% 3.1% n.a. n.a. n.a.
Hapvida HAPV3 Buy 41,741 439 56.18 64.00 47.3x 41.3x n.a. 42.8x 37.0x n.a. 8.8x 7.5x n.a. 0.6% 0.6% n.a. 0.0 0.0 n.a.
Fleury FLRY3 Neutral 9,116 217 28.78 25.00 23.7x 22.0x n.a. 14.2x 13.2x n.a. 5.2x 5.2x n.a. n.a. n.a. n.a. 0.8 0.8 n.a.
Intermedica GNDI3 Buy 32,285 679 60.00 66.00 65.3x 44.8x 37.7x 33.0x 24.4x 20.8x 10.8x 9.1x 8.9x 0.0% 0.0% 0.0% n.a. 0.6 0.5
Alliar AALR3 Neutral 2,147 14 18.15 18.00 18.2x 14.9x n.a. 9.6x 8.5x n.a. 1.5x 1.4x n.a. n.a. n.a. n.a. 1.9 1.4 n.a.
Cogna COGN3 Buy 19,943 748 12.20 16.00 21.8x 18.2x 15.4x 11.8x 11.1x 10.3x 1.2x 1.2x 1.1x 0.0% 0.0% 0.0% 2.0 3.5 3.1
Yduqs YDUQ3 Neutral 14,191 445 47.20 39.00 18.8x 18.7x 16.3x 12.9x 12.7x 11.9x 4.3x 3.7x 3.3x 0.0% 0.0% 0.0% 1.0 0.7 0.5
Ser Educacional SEER3 Buy 3,475 77 27.00 32.00 14.8x 13.4x n.a. 10.4x 9.6x n.a. 2.0x 1.8x n.a. 1.7% 2.4% n.a. n.a. n.a. n.a.
Median 23.7x 22.0x 18.1x 12.9x 12.7x 11.9x 4.3x 4.0x 3.9x 1% 1% 0% 0.9 0.7 0.6
Oil
Petrobras PETR4 Buy 401,112 7,252 29.98 32.00 14.6x 14.6x 13.5x 5.4x 5.9x 5.7x 1.3x 1.2x 1.1x 2.6% 2.0% 2.1% 1.9 2.2 1.8
BR Distribuidora BRDT3 Neutral 32,061 817 27.52 27.00 12.8x 18.3x 16.9x 16.7x 13.3x 11.6x 3.8x 4.0x 3.9x 2.1% 2.1% 2.1% 1.2 1.4 1.2
Ultrapar UGPA3 Neutral 24,175 627 22.26 22.00 24.3x 19.9x 17.9x 11.6x 10.4x 9.3x 2.3x 2.2x 2.1x 2.5% 3.1% 3.4% 2.7 2.7 2.4
Median 14.6x 18.3x 16.9x 11.6x 10.4x 9.3x 2.3x 2.2x 2.1x 3% 2% 2% 1.9 2.2 1.8
Agribusiness
SLC Agricola SLCE3 Neutral 3,888 119 20.87 18.00 7.6x 14.2x 11.4x 6.8x 11.5x 9.9x 1.4x 1.3x 1.3x 4.4% 3.5% 4.3% 1.2 2.5 2.0
Sao Martinho SMTO3 Buy 7,808 74 22.38 25.00 24.9x 26.9x 22.4x 8.2x 7.1x 6.4x 2.3x 2.2x 2.2x 1.0% 1.3% 4.5% 1.6 1.2 1.1
Brasilagro AGRO3 Buy 968 6 17.99 18.00 7.3x 10.9x n.a. 8.0x 12.7x n.a. 1.1x 1.2x n.a. n.a. n.a. n.a. n.a. n.a. n.a.
Cosan CSAN3 Buy 27,211 384 69.30 70.00 12.8x 13.4x 11.5x 6.2x 6.2x 5.7x 1.0x 1.0x 1.0x -2.2% 5.0% 6.9% 2.3 1.9 1.8
Median 10.2x 13.8x 11.5x 7.4x 9.3x 6.4x 1.3x 1.2x 1.3x 1% 3% 4% 1.6 1.9 1.8
Food and Beverage
BRF SA BRFS3 Neutral 27,559 1,028 33.95 41.00 42.3x 20.5x 29.9x 9.4x 8.2x 8.7x 3.7x 3.5x 3.7x 0.6% 1.2% 0.8% 3.6 2.7 2.8
JBS JBSS3 Buy 68,332 1,290 25.64 35.00 11.0x 7.9x 10.3x 7.3x 5.9x 6.7x 2.1x 1.9x 1.8x 2.4% 3.4% 2.7% 3.1 2.1 2.3
Marfrig MRFG3 Neutral 6,679 202 10.91 12.00 12.8x 4.8x 9.4x 5.6x 5.3x 6.5x 1.7x 1.5x 1.5x 1.9% 5.1% 2.6% 2.1 3.0 3.6
Minerva BEEF3 Buy 5,130 138 13.73 16.00 82.2x 8.0x 9.3x 7.3x 6.2x 6.5x 15.9x 6.8x 7.6x 0.2% 2.1% 1.8% 3.9 2.5 2.4
Ambev ABEV3 Neutral 299,031 1,942 19.01 20.00 23.5x 20.0x 18.4x 14.3x 12.9x 12.1x 4.9x 5.0x 5.1x 3.5% 5.6% 6.0% n.a. n.a. n.a.
M.Diasbranco MDIA3 Neutral 11,977 142 35.33 35.00 26.2x 18.8x 14.8x 20.0x 15.1x 12.4x 1.9x 1.9x 1.8x 0.9% 1.3% 1.6% 1.3 0.6 0.5
Median 24.8x 13.4x 12.6x 8.3x 7.2x 7.7x 2.9x 2.7x 2.8x 1% 3% 2% 3.1 2.5 2.4
Stock Guide

220
Valuation Summary
Source: BTG Pactual estimates
General Data Market Cap. ADTV (R$mn) Price (R$) P/E EV/EBITDA P/BV Dividend Yield (%) Net Debt/EBITDA
Ticker Rating (R$ mn) 12M Average Last Target 2019E 2020E 2021E 2019E 2020E 2021E 2019E 2020E 2021E 2019E 2020E 2021E 2019E 2020E 2021E
Car Rental & Logistics
Tegma TGMA3 Buy 2,266 40 34.37 34.00 16.9x 15.4x 13.9x 11.6x 10.3x 9.3x 4.4x 4.3x 4.1x 5.5% 6.1% 6.7% 0.4 0.5 0.5
Localiza RENT3 Buy 33,698 895 46.83 55.00 37.8x 28.7x 24.8x 21.5x 17.6x 15.0x 6.0x 5.1x 4.4x 0.7% 0.8% 1.1% 2.8 2.2 2.3
Locamerica LCAM3 Buy 8,919 142 20.12 21.00 26.1x 19.0x 16.3x 12.1x 10.5x 9.1x 3.0x 2.6x 2.3x 0.0% 0.0% 0.0% 2.9 3.0 2.9
Movida MOVI3 Buy 5,225 102 17.55 21.00 25.1x 17.0x 14.6x n.a. n.a. n.a. 2.1x 2.0x 1.8x 1.0% 1.5% 1.8% n.a. n.a. n.a.
JSL JSLG3 Buy 4,984 30 24.11 24.00 25.1x 14.9x 11.0x n.a. n.a. n.a. 2.6x 2.3x 2.0x 0.0% 0.0% 0.0% n.a. n.a. n.a.
Median 25.1x 17.0x 14.6x 12.1x 10.5x 9.3x 3.0x 2.6x 2.3x 1% 1% 1% 2.8 2.2 2.3
Aerospace
Gol GOLL4 Buy 12,861 680 36.18 60.00 35.2x 13.2x 6.6x 5.3x 4.9x 4.3x -1.9x -2.3x -3.6x 0.0% 0.0% 0.0% 1.5 2.3 1.6
Embraer EMBR3 Buy 14,005 274 19.03 28.64 12.0x 9.1x n.a. 3.6x 3.1x n.a. 0.7x 0.7x n.a. 4.1% 5.4% n.a. 1.5 1.2 n.a.
Median 23.6x 11.2x 6.6x 4.4x 4.0x 4.3x -0.6x -0.8x -3.6x 2% 3% 0% 1.5 1.7 1.6
Capital Goods
Randon Part RAPT4 Neutral 3,851 114 12.08 10.00 19.8x 17.6x 15.5x 12.3x 10.8x 9.9x 2.5x 2.3x 2.1x 2.2% 2.4% 2.8% 2.5 2.7 2.6
Marcopolo POMO4 Buy 3,564 69 3.88 5.50 13.1x 8.3x n.a. 13.5x 9.0x n.a. 1.5x 1.4x n.a. 4.0% 6.3% n.a. 1.6 0.7 n.a.
Iochp-Maxion MYPK3 Buy 3,093 98 20.30 33.00 9.1x 7.4x 6.1x 5.6x 5.0x 4.5x 1.0x 0.9x 0.8x 5.0% 6.1% 7.4% 2.2 1.5 1.3
Tupy TUPY3 Buy 2,807 56 19.47 25.00 9.2x 9.2x 10.4x 5.8x 5.6x 5.6x 1.3x 1.3x 1.4x 11.2% 10.8% 9.5% 1.1 1.1 1.1
Weg WEGE3 Neutral 71,420 353 34.05 25.00 47.5x 41.5x 37.0x 38.8x 33.8x 29.8x 8.2x 7.5x 6.9x 1.1% 1.2% 1.4% n.a. n.a. n.a.
Median 13.1x 9.2x 13.0x 12.3x 9.0x 7.8x 1.5x 1.4x 1.7x 4% 6% 5% 1.9 1.3 1.3
Telecom,Media and Tech
Linx LINX3 Buy 5,812 252 32.10 45.00 87.2x 37.6x 24.4x 24.3x 19.5x 12.6x 3.0x 2.8x 2.7x 0.4% 0.6% 1.2% n.a. n.a. n.a.
Totvs TOTS3 Buy 13,100 313 68.70 70.00 49.4x 35.6x 28.9x 28.3x 25.0x 20.6x 4.8x 4.5x 4.3x 0.3% 1.6% 2.5% n.a. n.a. n.a.
Sinqia SQIA3 Buy 1,543 29 21.87 22.00 n.a. 56.8x 39.9x 72.6x 35.1x 28.4x 3.0x 2.8x 2.7x 0.0% 0.0% 0.5% n.a. n.a. n.a.
Time For Fun SHOW3 Buy 379 4 5.63 11.00 10.1x 8.1x 7.3x 5.1x 4.6x 4.4x 1.0x 0.9x 0.8x 0.8% 2.7% 3.3% n.a. n.a. n.a.
Valid VLID3 Neutral 1,038 39 14.77 15.00 9.7x 7.2x 6.6x 5.5x 5.0x 5.0x 0.9x 0.8x 0.8x 5.3% 6.0% 7.0% 2.0 1.6 1.4
Tim Part S/A TIMP3 Buy 35,534 271 14.68 16.00 21.7x 17.1x 15.1x 5.5x 5.1x 4.9x 1.7x 1.6x 1.6x 6.1% 3.5% 4.7% 0.4 0.2 0.1
Oi OIBR3 Buy 5,763 488 0.96 3.50 n.a. n.a. n.a. 4.1x 3.7x 3.4x 0.2x 0.3x n.a. n.a. n.a. n.a. 2.9 3.3 3.2
Telef Brasil VIVT4 Buy 90,097 434 56.33 54.00 17.4x 17.9x 15.8x 6.3x 6.1x 5.8x 1.4x 1.4x 1.4x 8.2% 6.0% 5.8% 0.8 0.8 0.7
Median 19.6x 17.9x 15.8x 5.9x 5.6x 5.4x 1.5x 1.5x 1.6x 1% 3% 3% 1.4 1.2 1.0
Infrastructure
Rumo S.A. RAIL3 Buy 39,615 832 25.41 24.00 49.6x 24.7x 18.8x n.a. n.a. n.a. 4.5x 4.0x 3.4x 0.0% 0.0% 0.0% n.a. n.a. n.a.
CCR SA CCRO3 Buy 35,431 580 17.54 18.00 22.2x 15.6x 15.5x 13.0x 9.7x 9.0x 3.8x 3.4x 3.4x 0.0% 0.0% 0.0% 3.7 2.4 2.0
Ecorodovias ECOR3 Buy 8,230 183 14.79 15.00 24.1x 18.9x 13.2x 8.4x 7.0x 6.2x 9.2x 9.2x 9.2x 1.2% 5.3% 7.6% 2.7 2.9 2.7
Santos Brp STBP3 Buy 5,312 56 7.95 8.00 123.0x 49.6x 37.6x 25.8x 19.2x 15.3x 3.8x 3.6x 3.3x 0.2% 0.5% 0.7% 0.1 n.a. n.a.
Median 24.1x 18.9x 15.5x 10.7x 8.3x 7.6x 4.5x 4.0x 3.4x 0% 0% 0% 3.2 2.7 2.3
Stock Guide

221
Disclaimer