Brasil 11.21 - MDICinvestimentos.mdic.gov.br/public/arquivo/arq1295884145.pdf · Brasil 11.21.2011...
32
Infrastructure Investment Opportunities Brasil 11.21.2011 Brazil CELSO KNIJNIK Special Advisor Executive Office of the President of Brazil
Transcript of Brasil 11.21 - MDICinvestimentos.mdic.gov.br/public/arquivo/arq1295884145.pdf · Brasil 11.21.2011...

Infrastructure Investment OpportunitiesBrasil 11.21.2011
Brazil
CELSO KNIJNIKSpecial AdvisorExecutive Office of the President of Brazil

In 2007 – PAC 1 To accelerate economic growth To increase employment and income rates To decrease social and regional inequalities To overcome infrastructure bottlenecks
In 2009, a new goal To reduce the impact of the international economic crisis –
countercyclical policy
In 2010, launched a new stage: PAC 2 – 2011-2014
PAC – Growth Acceleration Program

Two blocks of action:
Make the investment enviroment better :Credit raiseTax relievesTax system improvementsRegulation refinements
Infrastructure worksTo incentive private investmentTo remove obstacles - bureaucratic, administrative,
normative, law-abiding, environmental impacts andlegislative - related to growth
To increase public investment in infra -structure
Growth Acceleration Program – ConceptPAC – Growth Acceleration ProgramConcept

Infrastructure projects in three areas
GROWTH ACCELERATIONPROGRAM – PAC 1, 2007-2010
US$ billion
Area 2007-2010 After 2010 TOTAL
LOGISTICS 54.5 28.9 83.3ENERGY 171.7 429.4 601.1
SOCIAL AND URBAN 146.8 18.0 164.9
TOTAL 373.0 476.3 849.3
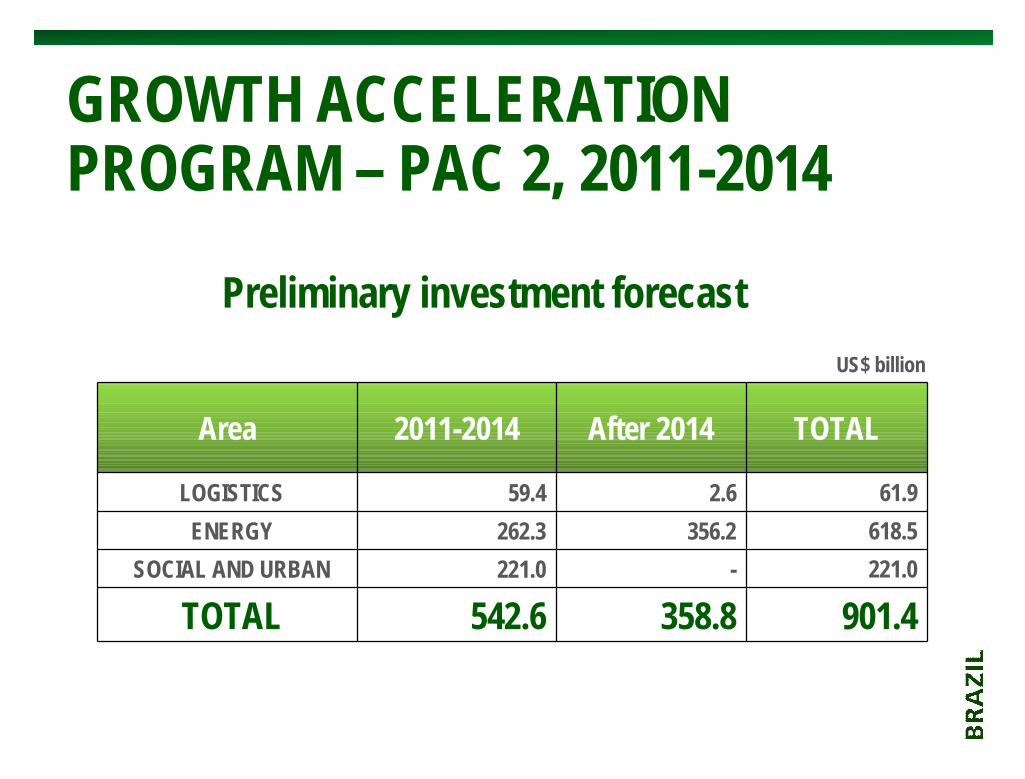
GROWTH ACCELERATIONPROGRAM – PAC 2, 2011-2014
Area 2011-2014 After 2014 TOTAL
LOGISTICS 59.4 2.6 61.9ENERGY 262.3 356.2 618.5
SOCIAL AND URBAN 221.0 - 221.0
TOTAL 542.6 358.8 901.4
Preliminary investment forecastUS$ billion

POWER GENERATION AND TRANSMISSION
OIL AND GAS
HOUSING AND SANITATION
HIGHWAYS
RAILROADS – High-Speed Rail
AIRPORTS
PORTS
URBAN MOBILITY
INVESTMENT OPPORTUNITIES:

ELECTRIC POWERGENERATION AND TRANSMISSION

ELECTRIC POWER SYSTEM – GENERAL FEATURES
• Number of Customers – 64.6 million• Energy Production – 463.2 TWh / year –
60% of South America• Peak – 67,632 MW
Installed Capacity – 105,066 MW
• Transmission Lines – 96,207 km ≥ 230kV
Source: Ministry of Mines and Energy

Annual tenders to contract energy in the regulatedcontracts environment Hydroelectric power plants – energy to be delivered at the fifth
year after the tender Thermal power plants and others – energy to be delivered at the
third year after the tender Needs previous environmental license to participate
Tenders planned2011 7 HPP – 1,470 MW – US$ 2,1 billion – 1st half
3 HPP – 1,096 MW – US$ 1,5 billion – 2nd half
ELECTRIC POWER GENERATION
New enterprises as thermoelectric plants will have to be include d accordingly to the 2008-2020 planning
54 HPP – 47.856 MW – US$ 54,8 billion2011-2014

HYDRIC SOURCES – ELETRIC POWER GENERATIONNorth Region
UHE Santo Antônio
UHE Jirau
UHE São SalvadorUHE Rondon II
UHE Serra Quebrada
Usinas plataforma
Chacorão
Cachoeira do Caí
JatobáUHE Estreito
Jardim do Ouro
Cachoeira dos Patos
Jamanxim
Marabá
Cachoeira Caldeirão
Ferreira Gomes
UHE Santo Antônio do Jari
Tabajara
PAC 2PAC 1PAC 1 com conclusãooriginal após 2010
São Luiz do Tapajós
UHE Belo Monte
Santa Izabel

UHE Cachoeira
UHE Castelhano
UHE Estreito do Parnaiba
UHE Uruçui
UHE Ribeiro Gonçalves
UHE Riacho Seco
PAC 1 com conclusãooriginal após 2010
HYDRIC SOURCES – ELETRIC POWER GENERATIONNorthest Region

UHE Retiro Baixo
UHE Baguari
UHE Barra do Braúna
UHE Baú I
UHE Simplicio
PAC 2PAC 1PAC 1 com conclusãooriginal após 2010
UHE Travessão
UHE Crenaque
UHE ResplendorUHE Pompeu
UHE Formoso
UHE Davinópolis
HYDRIC SOURCES – ELETRIC POWER GENERATIONSouthest Region
PAC 2PAC 1PAC 1 com conclusãooriginal após 2010
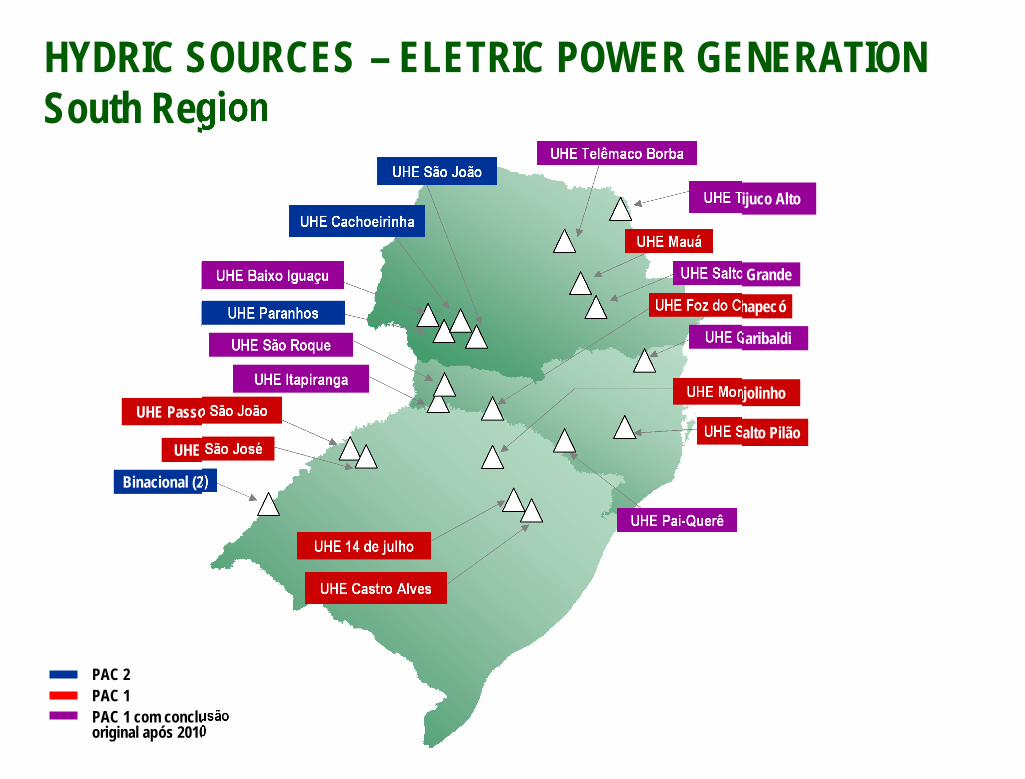
HYDRIC SOURCES – ELETRIC POWER GENERATIONSouth Region
UHE Foz do Chapecó
UHE 14 de julho
UHE Castro Alves
UHE Passo São JoãoUHE Salto Pilão
UHE Monjolinho
UHE Baixo Iguaçu
UHE Itapiranga
UHE Pai-Querê
UHE Telêmaco Borba
UHE São Roque
UHE Paranhos
UHE Salto Grande
UHE Mauá
UHE Tijuco AltoUHE Cachoeirinha
UHE São João
Binacional (2)
UHE São José
UHE Garibaldi

UHE Dardanelos
UHE Batalha
UHE Serra do Facão
UHE Salto
UHE Barra dos Coqueiros
UHE Caçu
UHE Foz do Rio Claro
UHE Salto do Rio Verdinho
UHE Corumbá III
UHE Água Limpa
UHE Toricoejo
UHE PorteirasUHE Mirador
UHE Colíder
UHE Sinop
UHE Porteiras
UHE Couto Magalhães
UHE São Manoel
UHE Teles Pires
UHE Foz do Apiacás
UHE São Domingos
Usinas plataformaPAC 2PAC 1PAC 1 com conclusãooriginal após 2010
HYDRIC SOURCES – ELETRIC POWER GENERATIONCenter-west Region
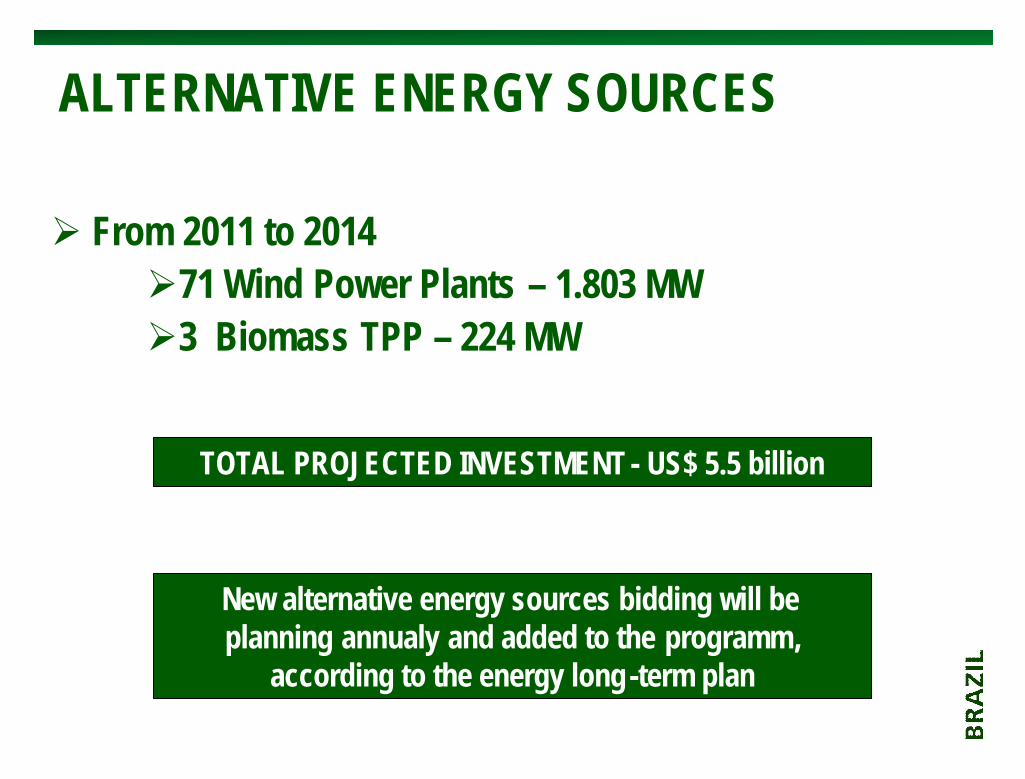
ALTERNATIVE ENERGY SOURCES
From 2011 to 201471 Wind Power Plants – 1.803 MW3 Biomass TPP – 224 MW
TOTAL PROJECTED INVESTMENT - US$ 5.5 billion
New alternative energy sources bidding will beplanning annualy and added to the programm,
according to the energy long -term plan

PAC 2
Osório 2
Aratua 1
Sangradouro 2Sangradouro 3
Fazenda Rosário 3
Fazenda RosárioCoxilha Negra VII
Coxilha Negra VICoxilha Negra V
Areia BrancaCoqueiros
QuixabaGarças
Lagoa SecaCajucoco
Vento do OesteDunas do Paracuru
Taíba ÁguiaTaíba Andorinha
Icarai
Santa Clara II, III, IV, V e VI
EmbuacaColonia
Icarai I e II
Faisa I, II, III, IV e V
Buriti
Nossa Senhora da Conceição
Novo Horizonte
Pajeu do vento
Barra dos Coqueiros
Macaubas
GuirapaIgaporaSerra do salto
IlheusPindai
Porto SeguroRio Verde
Rei dos Ventos 1, 3
Eurus VICabeco Preto
Mangue Seco 1, 2 , 3 e 5
Licinio de Almeida
Planaltina
Santa Clara I
SeabraPedra do Reino
AlvoradaCandiba
Guanambi
Mar e Terra
Morro dos ventos I, III, IV, VI, IX
Araras
Miassaba 3
Alternative Energy SourcesWind Power

ELECTRIC POWER TRANSMISSIONLarge interconnections
To provide greater security and reliability to the electric powe r supply To complete the interconnection of the Isolated Systems to the N ational
Interconnected System To ensure the energy flow from large hydropower projects – Belo Monte,
Tapajós and Teles Pires To meet the expanding demand in all country regions
Tenders planned2011 615 km – US$ 553 million – 1st half 20102011-14 36,000 km – US$15.6 billion
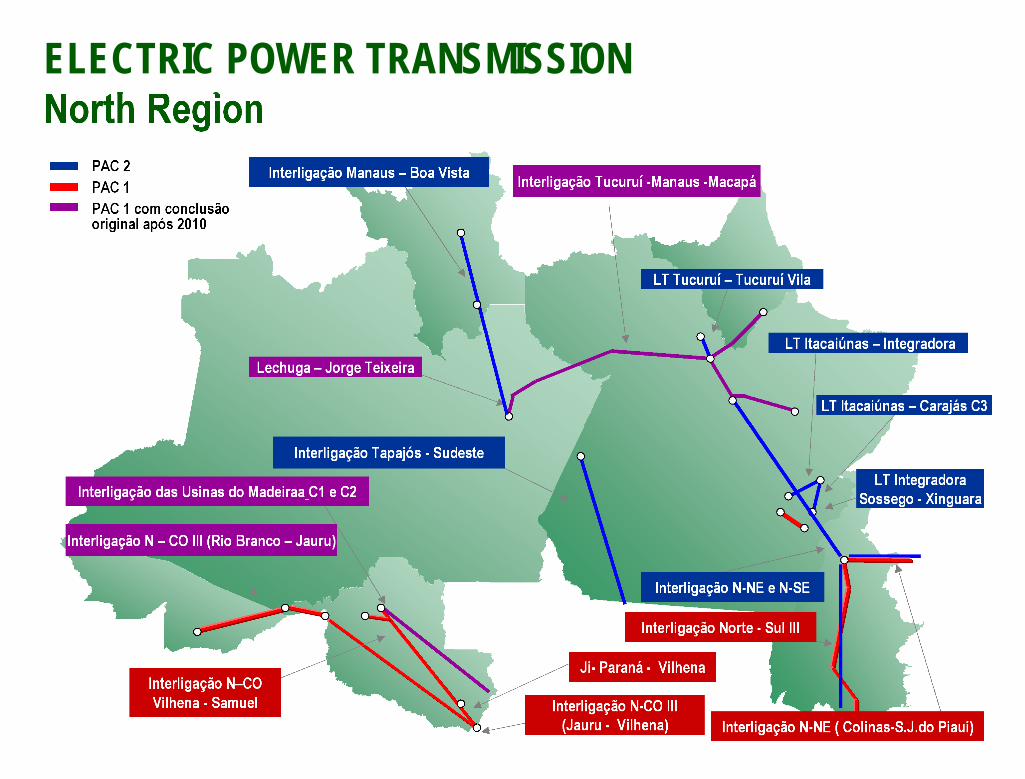
Interligação Tucuruí -Manaus -Macapá
Interligação Norte - Sul III
Interligação das Usinas do Madeiraa C1 e C2
Lechuga – Jorge Teixeira
Interligação N – CO III (Rio Branco – Jauru)
LT Itacaiúnas – Carajás C3
LT IntegradoraSossego - Xinguara
LT Tucuruí – Tucuruí Vila
Interligação N–COVilhena - Samuel
LT Itacaiúnas – Integradora
Interligação Manaus – Boa Vista
Ji- Paraná - Vilhena
Interligação Tapajós - Sudeste
Interligação N-NE e N-SE
Interligação N-NE ( Colinas-S.J.do Piauí)
PAC 2PAC 1PAC 1 com conclusãooriginal após 2010
Interligação N-CO III(Jauru - Vilhena)
ELECTRIC POWER TRANSMISSIONNorth Region

Picos - Tauá
Paraíso - Açu II
Jardim - Penedo
Funil - Itapebi
Balsas - Ribeiro Gonçalves
Banabuíu - Mossoró
Xingó - Angelim
Interligação N-NE(Colinas - S.J. Piauí)
Interligação N-NE(S.J. Piauí – Milagres)
Pau Ferro – Santa Rita II
Eunápolis – T.de Freitas II C1
Sapeaçu – Sto. Antônio de Jesus C3
Teresina II – Teresina III
Milagres - TauáMiranda – Encruzo Novo
P.Dutra – Miranda II
Açailândia – P.Dutra
Ibicoara – Brumado II
São Luiz II – São Luiz III C1São Luiz II – São Luiz III C2
Interligação N-NE e N-SE
Interligação Açailândia –P.Dutra – São Luiz
Eunápolis – T.de Freitas II C2
PAC 2PAC 1PAC 1 com conclusãooriginal após 2010
Milagres - Coremas
ELECTRIC POWER TRANSMISSIONNortheast Region

Irapé - Araçuaí
Itutinga - Juiz de Fora
LT Campos - Macaé
LT São Simão – Ribeirão Preto
Paracatu - Pirapora
Interligação das Usinas do MadeiraPorto Velho – Araraquara SP
PAC 2PAC 1PAC 1 com conclusãooriginal após 2010
LT São Simão – Itaguaçu
Jaguara – Poços de Caldas
Estreito – Nova Ponte - Emborcação
Bom Despacho 3 – Ouro Preto 3
Chapadão – Ilha Solteira
LT Itumbiara - Bom Despacho
Furnas – Pimenta C2
Itararé - Jaguariaíva
Estreito – Ribeirão PretoMesquita - Viana
Neves - Mesquita
Interligação Tapajós - Sudeste
Interligação Teles Pires - Sudeste
Interligação Sul - Sudeste
Interligação Norte - Sudeste
Taubaté – Terminal Rio
Araraquara - Nova Iguaçu
Interligação Região Sudeste
Mascarenhas - Verona
Mascarenhas - Linhares
Montes Claros - Pirapora
Araraquara - Taubaté
ELECTRIC POWER TRANSMISSIONSoutheast Region

LT Santa Cruz I – Presidente Médici
Jorge Lacerda B - Siderópolis
LT Londrina - Maringá
LT Cascavel Oeste – Foz doIguaçu Norte
Videira – Campos Novos
LT Itararé - Jaguariaíva
Rio do Sul – Barra Grande
Desterro – Palhoça
PAC 2PAC 1
Campo Bom - Taquara
Salto Osório – Foz do Chopim
Cascavel do Oeste - Umuarama
Umuarama - Guaíra
Ivinhema - Umuarama
Curitiba – Joinville Norte
Curitiba - Bateias
Bateias - Pilarzinho
Interligação Sul - Sudeste
Londrina Esul – Londrina Copel
Garibaldi – Monte Claro
Machadinho – Campos Novos
Campos Novos – Nova Santa Rita
Porto Alegre 9 – Porto Alegre 8
Nova Santa Rita – Porto Alegre 9
Porto Alegre - Restinga
Viamão - Restinga
Porto Alegre 9 – Porto Alegre 4
Foz do Iguaçu - Cascavel Oeste
ELECTRIC POWER TRANSMISSIONSouth Region

PAC 2PAC 1PAC 1 com conclusãooriginal após 2010
Trindade - Xavantes
Interligação N – S III
Juba - Jauru
Interligação MadeiraPorto Velho – Araraquara C1 e C2
Corumbá – Anastácio
Anastácio - ChapadãoChapadão – Ilha Solteira 2
Juína - Brasnorte
Jauru - Cuiabá
Brasnorte – Nova Mutum
Brasnorte – Juba
Interligação N – Sudeste
Serra da Mesa – Barro Alto
Interligação Tapajós - Sudeste
Cuiabá – Nobres – Nova Mutum C2
Cuiabá – Ribeirãozinho - RioVerde Norte
Rio Verde Norte - Trindade
Interligação N – CO III (Rio Branco – Jauru)
Interligação N-CO(Jauru – Vilhena)
Trindade - Carajás
Chapadão - Jataí
Barra dos Coqueiros -Quirinópolis
Itaguaçu – Barra dos Coqueiros
São Simão - Itaguaçu
São Simão – Rib. Preto
Palmeiras - Edéia
Luziânia - Emborcação
Itumbiara – Bom Despacho
Nova Mutum- Sorriso - Sinop
Interligação Teles Pires - Sudeste
Parecis - Brasnorte
ELECTRIC POWER TRANSMISSIONCenter-east Region

OIL AND GASExploration, Production and Natural Gas Transport Infrastructure

Increase oil and gas productionSeismic assessment , drilling, plataform production
To explore the reserves and enlarge national production ,including the new Pre-Salt discoveries
Value chain: naval industry; mecaninc engineering, steel, quimic,precision engineering among other
PRODUCTION AND EXPLORATION
US$ 418,5 billion2011-2014 – US$ 110.4 billion
Pós 2014 – US$ 308 billion
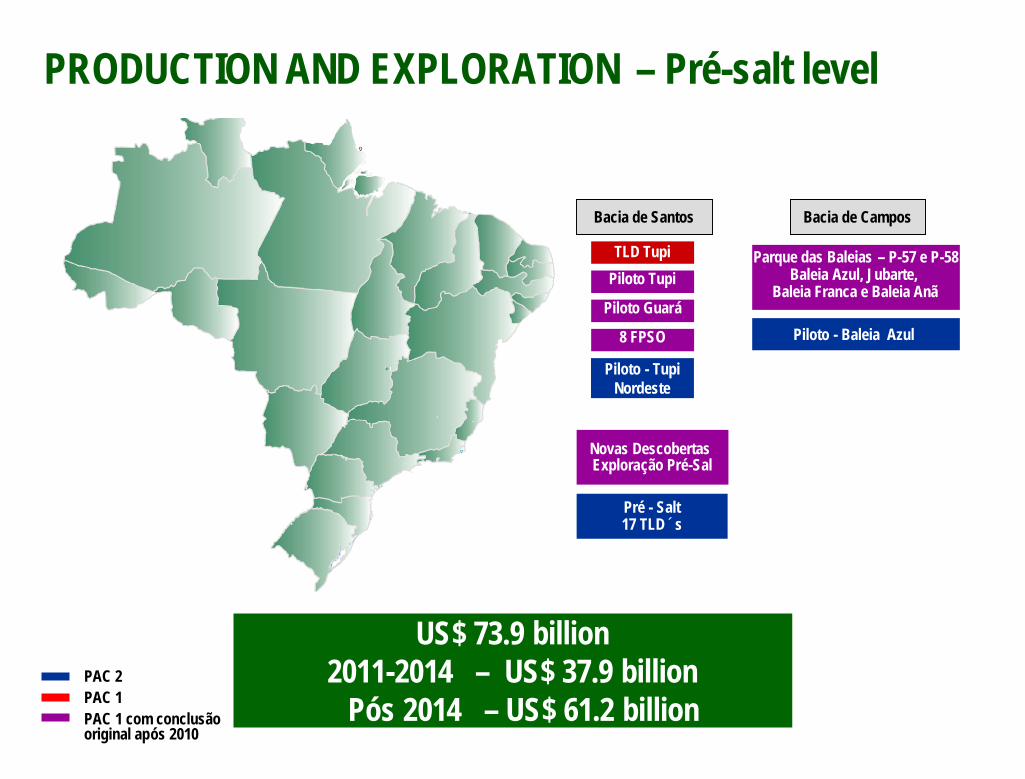
Bacia de Santos Bacia de Campos
TLD TupiPiloto Tupi
Parque das Baleias – P-57 e P-58Baleia Azul, Jubarte,
Baleia Franca e Baleia Anã
Pré - Salt17 TLD´s
PAC 2PAC 1PAC 1 com conclusãooriginal após 2010
Piloto - Baleia AzulPiloto Guará
Novas DescobertasExploração Pré-Sal
8 FPSO
Piloto - TupiNordeste
US$ 73.9 billion2011-2014 – US$ 37.9 billion
Pós 2014 – US$ 61.2 billion
PRODUCTION AND EXPLORATION – Pré-salt level

Petroquímica Suape – PTA
Refinaria Abreu e Lima
Complexo Petroquímico do Rio
Refinaria Premium I Refinaria Clara Camarão
Fábrica de FertilizantesNitrogenados III
Complexo QuímicoUFN-4
Fabrica de Amônia
PAC 2PAC 1PAC 1 com conclusãooriginal após 2010
Refinaria Premium II
FAFEN-SESulfato de amônio
REFINEMENT, PETROCHEMESTRY and FERTILIZER
Petroquímica Suape – PET POY
US$ 76.6 billion2011-2014 – US$ 41,8 billionPós 2014 – US$ 34,71 billion

HIGHWAYS

Length: 2,212.4 km• BR-040/Distrito Federal-Goiás-Minas Gerais – 937 km• BR-116/Minas Gerais – 817 km• BR-101/Espírito Santo – 458.4 km
Total Investment: US$ 5.5 billion
Central-South Region54% of Brazil’s GDP
FEDERAL HIGHWAY CONCESSION PROGRAM
GovernadorValadares
BeloHorizonte
GO
DF
MG
BR-040
BR-116
Vitória
ES
BR-101
Concession bidding1st Half, 2011

Internal Rate of Return: 8.0% per yearReference value used on the 3rd Phase of the Federal Highway Concession
Program
Term of Concession: 25 years
Annual tariff adjustment according to inflation variation
Investments described in the Highway Usage ProgramConstructions required (recovery, duplication, lighting, and oth ers)Constructions conditioned to the volume of traffic (to expand ca pacity)Performance Parameters: paving, safety, signage, lighting, user assistance,
and others.
Focus on service qualityConcessionaire performs the necessary investments in the most ef ficient way tomeet the Performance Parameters
*Allows the participation of Brazilian or foreign companies, fin ancial institutions,pensions funds and private equity funds, separately or in consor tiums
CONCESSION MODEL

HIGH-SPEED RAILS PLANNED
Campinas - São Paulo - Rio de Janeiro – 511 km
Market Potential• Metropolitan Region of São Paulo: 19 million inhabitants• Metropolitan Region of Rio de Janeiro: 12 million inhabitants• Metropolitan Region of Campinas: 2.5 million inhabitants
Economic Importance• Rio de Janeiro and São Paulo States concentrate 45 % of Brazil ’s GDP• São Paulo is Latin America's biggest financial center, concentrating 70% of t he stock market• Rio de Janeiro is the biggest Brazilian tourism hub
Concession bidding2nd Quarter, 2011
Metropolitan Region of Campinas
Metropolitan Region of São Paulo
São José dos Campos Taubaté
Volta Redonda
Resende
Metropolitan Region of Rio de Janeiro
36 millioninhabitants

HIGH-SPEED RAIL – HSRProject scopeEstimated investment: US$ 19.7 billionDeadline for entry into operation: 2016
Concessionaire responsible for the design, construction, operati on andmaintenance, complying with technical performance parameters;Auction to be open to all existing technologiesCompulsory technology transferPublic sector participation: own capital and financingDocumentation available at www. tavbrasil.gov.br
• Technical studies on demand, alignment, geology, operation and e conomic-financialmodeling completed and available

Infrastructure Investment OpportunitiesBrasil 11.21.2011
Brazil
CELSO KNIJNIKSpecial AdvisorExecutive Office of the President of Brazil