Brain structure changes visualized in early- and late...
7
Brain structure changes visualized in early- and late-onset blind subjects Natasha Leporé a, ⁎, Patrice Voss b , Franco Lepore b , Yi-Yu Chou a , Madeleine Fortin b , Frédéric Gougoux b , Agatha D. Lee a , Caroline Brun a , Maryse Lassonde b , Sarah K. Madsen a , Arthur W. Toga a , Paul M. Thompson a a Laboratory of Neuro Imaging, Department of Neurology, David Geffen School of Medicine at UCLA, Los Angeles, CA 90095, USA b Department of Psychology, University of Montreal, Montreal, QC, Canada abstract article info Article history: Received 20 August 2008 Revised 3 July 2009 Accepted 21 July 2009 Available online 28 July 2009 Keywords: Blindness Brain imaging Corpus callosum MRI Plasticity Tensor-based morphometry We examined 3D patterns of volume differences in the brain associated with blindness, in subjects grouped according to early and late onset. Using tensor-based morphometry, we mapped volume reductions and gains in 16 early-onset (EB) and 16 late-onset (LB) blind adults (onset b 5 and N 14 years old, respectively) relative to 16 matched sighted controls. Each subject's structural MRI was fluidly registered to a common template. Anatomical differences between groups were mapped based on statistical analysis of the resulting deformation fields revealing profound deficits in primary and secondary visual cortices for both blind groups. Regions outside the occipital lobe showed significant hypertrophy, suggesting widespread compensatory adaptations. EBs but not LBs showed deficits in the splenium and the isthmus. Gains in the non-occipital white matter were more widespread in the EBs. These differences may reflect regional alterations in late neurodevelopmental processes, such as myelination, that continue into adulthood. © 2009 Elsevier Inc. All rights reserved. The central nervous system is remarkably adaptive to changes in sensory input. Cortical plasticity following visual deprivation was first observed in kittens (Wiesel and Hubel, 1965a,b) and extensive reorganizations of cortical representational maps have been ob- served in humans after limb amputation (Flor et al., 1995). This is manifested also in cases of greater sensory use in normal subjects such as musicians, who exhibit increased auditory cortical repre- sentations (Pantev et al., 1998). In professional string players, the cortical representation of the fingers of the left hand is greatly increased (Elbert et al., 1995). Such findings illustrate how the brain may re-organize functionally to adapt to changes in sensory demands. Blindness provides a rare model of crossmodal neuroplasticity. Cortical structures normally specialized for visual processing may be used by blind individuals for auditory and tactile purposes (see Theoret et al. (2004), for a review). Extensive neuroanatomical differences – even outside the occipital cortex – have been observed in those blind from an early age (early-onset blind or EB individuals). Elbert et al. (2002) found that the area of the tonotopic region of the auditory cortex is almost twice the size of its counterpart in sighted individuals. Hippocampal volumes are abnormally enlarged in both EB and LB (late-onset blind) individuals, perhaps offering an anatomical substrate for their enhanced navigational skills (Fortin et al., 2008). White matter connectivity between primary somatosen- sory and visual areas is also increased in EB individuals; Wittenberg et al. (2004) applied repetitive transcranial magnetic simulation (rTMS) over the primary somatosensory cortex and observed significant occipital cortex activity using positron emission tomography. This effect was noted only in EB, but not in sighted or LB individuals. Using voxel-based morphometry to measure anatomical integrity more directly, Noppeney et al. (2005) found that EB individuals had decreased white matter volume in the optic radiation and sensori- motor system, and reduced gray and white matter volume in primary visual areas. The optic radiation showed no detectable deficit in a small group of LB individuals assessed with diffusion tensor imaging (Schoth et al., 2006). Using diffusion tensor tractography (DTT), Shimony et al. (2006) found atrophied geniculocalcarine tracts in the EB, while connections between the visual cortex and the orbital frontal and temporal cortices were relatively preserved. Yu et al. (2007) also observed increased fractional anisotropy of the corticosp- inal tract in early-blind men using DTT, perhaps reflecting increased myelination. Here we examined whole-brain volumetric changes in both EB and LB compared to sighted individuals using tensor-based morphometry (TBM) with fast fluid registration. We aimed to create a 3D map of the level of voxelwise volumetric gains and losses in EB and LB subjects. The purpose of the current study was two-fold. First, to explore in blind individuals new cerebral regions that have not specifically been examined in previous studies, as well as to confirm differences found by previous studies using other methods. And secondly, to offer a straightforward comparison between EB and LB individuals, which is NeuroImage 49 (2010) 134–140 ⁎ Corresponding author. Laboratory of Neuro Imaging, Dept. of Neurology, UCLA School of Medicine, 635, Charles E. Young Drive South, Suite 225, Los Angeles, CA 90095-7332, USA. Fax: +1 310 206 5518. E-mail address: [email protected] (N. Leporé). 1053-8119/$ – see front matter © 2009 Elsevier Inc. All rights reserved. doi:10.1016/j.neuroimage.2009.07.048 Contents lists available at ScienceDirect NeuroImage journal homepage: www.elsevier.com/locate/ynimg
Transcript of Brain structure changes visualized in early- and late...

NeuroImage 49 (2010) 134–140
Contents lists available at ScienceDirect
NeuroImage
j ourna l homepage: www.e lsev ie r.com/ locate /yn img
Brain structure changes visualized in early- and late-onset blind subjects
Natasha Leporé a,⁎, Patrice Voss b, Franco Lepore b, Yi-Yu Chou a, Madeleine Fortin b, Frédéric Gougoux b,Agatha D. Lee a, Caroline Brun a, Maryse Lassonde b, Sarah K. Madsen a, Arthur W. Toga a, Paul M. Thompson a
a Laboratory of Neuro Imaging, Department of Neurology, David Geffen School of Medicine at UCLA, Los Angeles, CA 90095, USAb Department of Psychology, University of Montreal, Montreal, QC, Canada
⁎ Corresponding author. Laboratory of Neuro ImagiSchool of Medicine, 635, Charles E. Young Drive Sout90095-7332, USA. Fax: +1 310 206 5518.
E-mail address: [email protected] (N. Leporé).
1053-8119/$ – see front matter © 2009 Elsevier Inc. Adoi:10.1016/j.neuroimage.2009.07.048
a b s t r a c t
a r t i c l e i n f oArticle history:Received 20 August 2008Revised 3 July 2009Accepted 21 July 2009Available online 28 July 2009
Keywords:BlindnessBrain imagingCorpus callosumMRIPlasticityTensor-based morphometry
We examined 3D patterns of volume differences in the brain associated with blindness, in subjects groupedaccording to early and late onset. Using tensor-based morphometry, we mapped volume reductions andgains in 16 early-onset (EB) and 16 late-onset (LB) blind adults (onset b5 and N14 years old, respectively)relative to 16 matched sighted controls. Each subject's structural MRI was fluidly registered to a commontemplate. Anatomical differences between groups were mapped based on statistical analysis of the resultingdeformation fields revealing profound deficits in primary and secondary visual cortices for both blind groups.Regions outside the occipital lobe showed significant hypertrophy, suggesting widespread compensatoryadaptations. EBs but not LBs showed deficits in the splenium and the isthmus. Gains in the non-occipitalwhite matter were more widespread in the EBs. These differences may reflect regional alterations in lateneurodevelopmental processes, such as myelination, that continue into adulthood.
© 2009 Elsevier Inc. All rights reserved.
The central nervous system is remarkably adaptive to changes insensory input. Cortical plasticity following visual deprivation wasfirst observed in kittens (Wiesel and Hubel, 1965a,b) and extensivereorganizations of cortical representational maps have been ob-served in humans after limb amputation (Flor et al., 1995). This ismanifested also in cases of greater sensory use in normal subjectssuch as musicians, who exhibit increased auditory cortical repre-sentations (Pantev et al., 1998). In professional string players, thecortical representation of the fingers of the left hand is greatlyincreased (Elbert et al., 1995). Such findings illustrate how the brainmay re-organize functionally to adapt to changes in sensorydemands.
Blindness provides a rare model of crossmodal neuroplasticity.Cortical structures normally specialized for visual processing may beused by blind individuals for auditory and tactile purposes (seeTheoret et al. (2004), for a review). Extensive neuroanatomicaldifferences – even outside the occipital cortex – have been observed inthose blind from an early age (early-onset blind or EB individuals).Elbert et al. (2002) found that the area of the tonotopic region of theauditory cortex is almost twice the size of its counterpart in sightedindividuals. Hippocampal volumes are abnormally enlarged in bothEB and LB (late-onset blind) individuals, perhaps offering ananatomical substrate for their enhanced navigational skills (Fortin et
ng, Dept. of Neurology, UCLAh, Suite 225, Los Angeles, CA
ll rights reserved.
al., 2008). White matter connectivity between primary somatosen-sory and visual areas is also increased in EB individuals; Wittenberg etal. (2004) applied repetitive transcranial magnetic simulation (rTMS)over the primary somatosensory cortex and observed significantoccipital cortex activity using positron emission tomography. Thiseffect was noted only in EB, but not in sighted or LB individuals. Usingvoxel-based morphometry to measure anatomical integrity moredirectly, Noppeney et al. (2005) found that EB individuals haddecreased white matter volume in the optic radiation and sensori-motor system, and reduced gray and white matter volume in primaryvisual areas. The optic radiation showed no detectable deficit in asmall group of LB individuals assessed with diffusion tensor imaging(Schoth et al., 2006). Using diffusion tensor tractography (DTT),Shimony et al. (2006) found atrophied geniculocalcarine tracts in theEB, while connections between the visual cortex and the orbitalfrontal and temporal cortices were relatively preserved. Yu et al.(2007) also observed increased fractional anisotropy of the corticosp-inal tract in early-blind men using DTT, perhaps reflecting increasedmyelination.
Here we examinedwhole-brain volumetric changes in both EB andLB compared to sighted individuals using tensor-based morphometry(TBM)with fast fluid registration. We aimed to create a 3Dmap of thelevel of voxelwise volumetric gains and losses in EB and LB subjects.The purpose of the current study was two-fold. First, to explore inblind individuals new cerebral regions that have not specifically beenexamined in previous studies, as well as to confirm differences foundby previous studies using other methods. And secondly, to offer astraightforward comparison between EB and LB individuals, which is

135N. Leporé et al. / NeuroImage 49 (2010) 134–140
often lacking in studies of crossmodal plasticity.We hypothesized thatthere would be deficits in primary visual cortices and the occipitallobes generally, but we predicted hypertrophy in extra-occipital brainregions, and in the corresponding callosal sectors carrying interhemi-spheric fibers, due to compensation from other senses. We alsohypothesized that the pattern of gains and losses might beaccentuated in the early-blind, as plasticity is expected to be greaterwhile the occipital lobes are still rapidly developing, shedding light onthe time-courses and possible substrates of the changes (e.g., latemyelination).
Methods
Data acquisition
Subjects with no history of neurological, cognitive or sensori-motor deficits other than blindness participated in the study andwere divided into two groups. The first group consisted of 16 early-onset blind individuals (with loss of vision before 5 years of age),aged between 19 and 55 years (mean age 36.2±9.8 years; medianage 36.0 years; 10 men, 6 women). The second group consisted of16 late-onset blind subjects (i.e., with loss of vision after 14 years ofage) aged between 22 and 56 years (mean age 38.2±10.2 years;median age 36.5 years; 10 men, 6 women). Each of these groupswas compared with healthy groups of 16 age- and gender-matchedcontrols (controls for the EB group: 35.3±9.5 years; min age: 22;max age: 44; 10 males, 6 females; controls for the LB group: 38.2±10.3 years; min age: 22; max age: 57; 10 males, 6 females). In allcases, blindness was attributable to bilateral peripheral damage(including: lenticular fibroplasia, retinoblastoma, tumors restrictedto the eyes, retinal detachment, Leber's congenital amaurosis,Retinis pigmentosa, accidents affecting the eyes and glaucoma)and led to either total blindness, or at most light perception in 5 ofthe EBs and 6 of the LBs. For brevity, we refer to early-onset andlate-onset blind subjects as early-blind and late-blind (EB or LB) forthe rest of the paper.
The research protocol was approved by the ethics committees ofthe Center for Interdisciplinary Research in Rehabilitation, whichcoordinates research with blind subjects in the Province of Quebec.MRI scans were collected at the Centre Hospitalier de l'Université deMontreal (CHUM). All subjects provided written informed consentprior to testing.
For each participant, high-resolution volumetric MRI scans of thebrain were acquired on a Siemens 1.5 TMagnetomVisionMRI scanner(Siemens Electric, Erlangen, Germany). The scanning protocol wasidentical for all participants. Each subject was scanned with avolumetric high-resolution (T1-weighted 3D, 1 mm3 resolution, 256slices) sagittally-orientedMRI gradient echo sequence with repetitiontime (TR): 1100 ms; echo time (TE): 4.38 ms; flip angle, 15°;256×256 matrix, and field of view (FOV): 250 mm.
Preprocessing of data
Extracerebral tissues (scalp, meninges and brainstem) wereremoved from the scans using the BSE software program (BrainSurface Extractor; Shattuck and Leahy, 2002); images were manuallyedited tomake additional corrections. Images were aligned and scaledto the ICBM-53 brain template (International Consortium for BrainMapping) with the ANIMAL software program (Collins et al., 1994),using a 9-parameter linear transformation (3 translations, 3 rotationsand 3 scales). In the midsagittal plane, each subject's corpus callosum(cc) was manually traced using the MultiTracer program (Woods,2003) following anatomical criteria with established reliability(Thompson et al., 1998). Voxels were then classified into gray matter,white matter and cerebrospinal fluid using the software BrainSuite(Shattuck and Leahy, 2002).
Tensor-based morphometry (TBM)
Each 3D whole-brain image (including gray and white matter, andCSF) was then non-linearly aligned to an anatomical template, basedon an arbitrarily selected control subject in the standard ICBM space,using a fully 3D fluid registration algorithm to reconfigure theanatomy into the shape of the target brain (Christensen et al., 1996,Leporé et al., 2008a). The image template was treated as beingembedded in a viscous fluid that follows a linearized version of theNavier–Stokes equation (Christensen et al., 1996):
0 = F + μj2v x; tð Þ + μ + λð Þj jT � v x; tð Þ� �
:
The force term F that drives the images into agreement is thegradient of the summed squared difference in intensities between thetemplate and the target image, and v is the velocity of the fluidparticles. The parameters μ and λ are manually set by the user, buthave been shown to give similar results for a wide range of values(Leporé et al., 2008a).
In practice, solving this equation is very time consuming. Thus weuse a filter based on the Green's function of the governing operator ofthe fluid equation that was proposed by Bro-Nielsen and Gramkow(1996), and Gramkow (1996) to speed up the registration.
We chose registration to a single subject's image here rather thanan average atlas template constructed frommultiple subjects, as it hassharper, more well resolved features, which can be beneficial forregistration (Chiang et al., 2007, Leporé et al., 2007). The controlsubject was selected randomly, but was visually checked to ensurethat the image did not have any very strongly distinguishing features(e.g., enlarged ventricles, etc.). In previous work (Leporé et al., 2008c),we showed that results do not depend strongly on the choice of thecontrol subject.
In the deformation mappings transforming each subject's imageonto the control template, the determinant of the local Jacobianmatrix- or “expansion factor”- at each point in the image indicateslocal volume differences between each subject and the target image.Voxels with JN1 and Jb1 indicate that the subject has respectivelygreater or lesser anatomical volumes than corresponding regions ofthe template.
To adjust for age and sex effects, we first covaried the logarithms ofthe determinants at each voxel with these variables. The new adjustedstatistic, Jcov was computed by fitting the following general linearmodel to the data at each image voxel:
Log Jð Þ = β0 + β1Tage + β2Tsex + β3Tdiagnosis + error;
where Log(J) is the logarithm of the Jacobian determinant, and theβi are estimated regression coefficients at that specific voxel. Sexand diagnosis were coded as binary dummy variables (that is,sex=0 (males) or 1 (females) and diagnosis=0 (sighted) and 1(blind)), so that Jcov=β3⁎diagnosis+error=Log(J)−β0−β1⁎age−β2⁎sex. While we did not expect an age⁎diagnosis interaction, westill decided to verify that this had no detectable influence.Computations were performed on the logarithm of the Jacobiandeterminants as these are expected to be closer to a normaldistribution than the J's (Leow et al., 2007). A Student's t-test wasthen performed on Jcov, at each voxel, and permutation statistics(Nichols and Holmes, 2001) were obtained at each voxel to assessthe significance of the differences in each blind subject group versuscontrols. The labels of the subjects were randomly permuted and at-test was performed at each voxel. The procedure was repeated5000 times, and the t-value from the real data was compared to thepermutation distribution to assess the significance of the data.Permutation testing was used to avoid assuming a parametricdistribution for the log-transformed Jacobian statistics, which wehave shown to be advantageous (Leow et al., 2007). We also

Fig. 1. Structural differences and Brodmann areas. Occipital brain regions show highlysignificant structural differences associated with blindness for the EB (top) and LB(bottom) groups, after adjusting for individual differences in brain scale. Numbers onthe map represent approximate Brodmann areas. The color bar shows the localsignificance of the group differences.
136 N. Leporé et al. / NeuroImage 49 (2010) 134–140
computed the permutation (corrected) p-values from 1-tailed t-tests for each of the lobes in the scaled data.
A 2D version of the fluid registration algorithm was used toregister the segmented and binarized corpus callosum images to thecorpus callosum of the same control subject. The same analysis wasthen repeated in order to examine local area differences in thosestructures.
Results
Early-onset blindness: 3D maps
Early-blind subjects showed significant volume deficits in dorsalvisual cortices, spanning both primary (BA 17) and secondary visualareas (BA 18, BA 19; Figs. 1, 2). Volumes were lower in occipitalregions in both hemispheres, withmore widespread deficits in the left
Fig. 2. Ratio of the mean volume in the EBs relative to that of the sighted controls at each vox
hemisphere (asymmetry was not significant). Occipital regionsshowed large volume reductions, but differences were also detectedelsewhere. Most notably, the cingulate region showed significantvolume decreases, in both anterior and posterior regions (BA 24, BA25, BA 31). In the frontal lobes, the left supplementary motor area(SMA, medial BA 6) and the premotor area (PMA, lateral BA 6) werealso decreased. However, subcortical prefrontal (below the previouslymentioned areas) and frontal white matter were larger in the blindsubjects. Furthermore, in the parietal lobes, significant reductionswere seen in the superior parietal lobule (BA 7), while the parietalsubcortical white matter was increased. Volume excesses were alsoseen in the volume of the cerebellum.
To assess whether these results were influenced by total brainvolume, we re-analyzed the data after removing the global scalingfactor from each of the images by dividing each image by thedeterminant of the scaling factors from the 9-parameter registration(Figs. 3 and 4). All the significant differences were still present in theunscaled images.
From the 1-tailed t-tests, we found that volume reductions weresignificant in the occipital lobes for both the EB and LB (p=0.016 andp=0.049, respectively), but not significant in other lobes (frontal EB:p=0.59, frontal LB: p=0.97, limbic EB: p=0.98, limbic LB: p=0.96,parietal EB: p=0.23, parietal LB: p=0.93, temporal EB: p=0.94,temporal LB: p=0.08). Both gray matter and white matter wereincluded. Differences in the occipital lobes were hypothesized a prioriand were therefore not subjected to a Bonferroni correction. ABonferroni correction was however applied to the 4 other lobes tested(i.e., p-values for the other lobeswere considered to be significant onlyif theywere smaller than p=0.05/4 lobes). None of the 1-tailed t-testsfor volume increases were significant: occipital EB: p=0.28, occipitalLB: p=28, frontal EB: p=0.22, frontal LB: p=0.079, limbic EB:p=0.48, limbic LB: p=0.68, parietal EB: p=0.25, parietal LB:p=0.32, temporal EB: p=0.16, temporal LB: p=0.078.
Late-onset blindness: 3D maps
Significant but less widespread differences were found in the LB, asexpected. Greatest volumetric differences were found in the visualcortices (see Figs. 1, 5 and 6). These differences weremainly restrictedto regions that approximately corresponded to BA 17 and 18bilaterally, but more so in the right hemisphere, and were locatedless dorsally than for the EB. In the parietal lobes, BA 7 and the right BA40 showed significant decreases in volume in the late blind. Theoverall corrected p-value over the whole brain for the unscaled case
el. The color bar displays the percentage difference in average volume between groups.
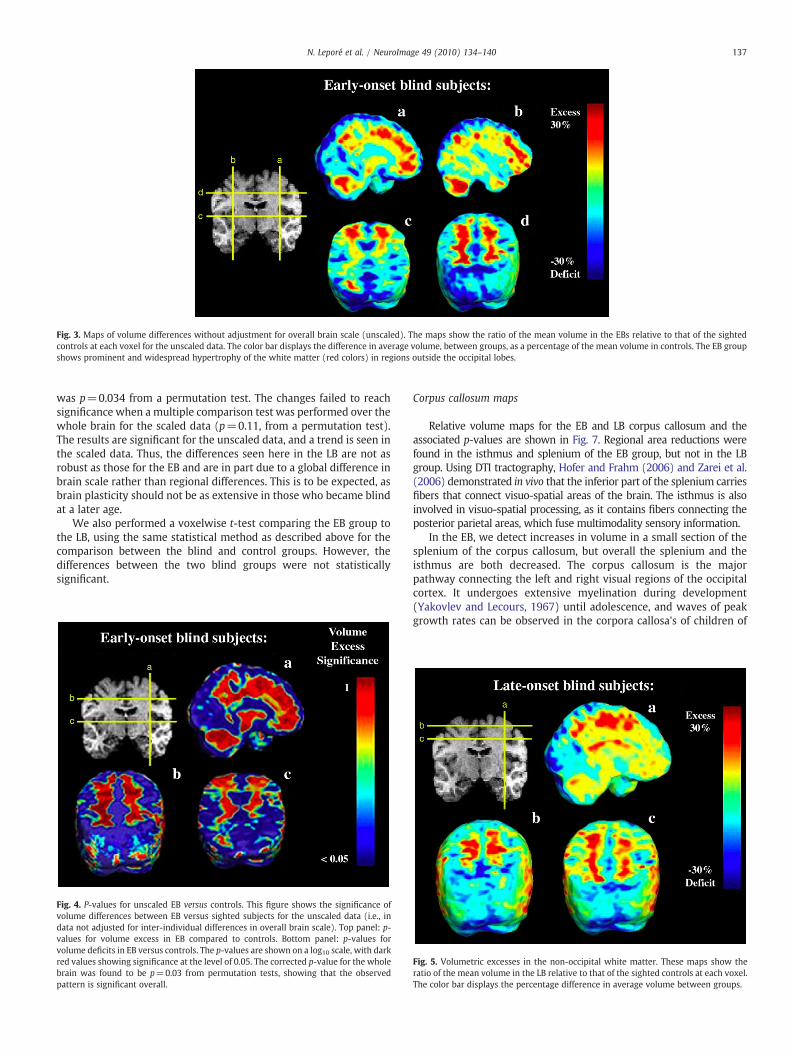
Fig. 3. Maps of volume differences without adjustment for overall brain scale (unscaled). The maps show the ratio of the mean volume in the EBs relative to that of the sightedcontrols at each voxel for the unscaled data. The color bar displays the difference in average volume, between groups, as a percentage of the mean volume in controls. The EB groupshows prominent and widespread hypertrophy of the white matter (red colors) in regions outside the occipital lobes.
137N. Leporé et al. / NeuroImage 49 (2010) 134–140
was p=0.034 from a permutation test. The changes failed to reachsignificance when a multiple comparison test was performed over thewhole brain for the scaled data (p=0.11, from a permutation test).The results are significant for the unscaled data, and a trend is seen inthe scaled data. Thus, the differences seen here in the LB are not asrobust as those for the EB and are in part due to a global difference inbrain scale rather than regional differences. This is to be expected, asbrain plasticity should not be as extensive in those who became blindat a later age.
We also performed a voxelwise t-test comparing the EB group tothe LB, using the same statistical method as described above for thecomparison between the blind and control groups. However, thedifferences between the two blind groups were not statisticallysignificant.
Fig. 4. P-values for unscaled EB versus controls. This figure shows the significance ofvolume differences between EB versus sighted subjects for the unscaled data (i.e., indata not adjusted for inter-individual differences in overall brain scale). Top panel: p-values for volume excess in EB compared to controls. Bottom panel: p-values forvolume deficits in EB versus controls. The p-values are shown on a log10 scale, with darkred values showing significance at the level of 0.05. The corrected p-value for the wholebrain was found to be p=0.03 from permutation tests, showing that the observedpattern is significant overall.
Corpus callosum maps
Relative volume maps for the EB and LB corpus callosum and theassociated p-values are shown in Fig. 7. Regional area reductions werefound in the isthmus and splenium of the EB group, but not in the LBgroup. Using DTI tractography, Hofer and Frahm (2006) and Zarei et al.(2006) demonstrated in vivo that the inferior part of the splenium carriesfibers that connect visuo-spatial areas of the brain. The isthmus is alsoinvolved in visuo-spatial processing, as it contains fibers connecting theposterior parietal areas, which fuse multimodality sensory information.
In the EB, we detect increases in volume in a small section of thesplenium of the corpus callosum, but overall the splenium and theisthmus are both decreased. The corpus callosum is the majorpathway connecting the left and right visual regions of the occipitalcortex. It undergoes extensive myelination during development(Yakovlev and Lecours, 1967) until adolescence, and waves of peakgrowth rates can be observed in the corpora callosa's of children of
Fig. 5. Volumetric excesses in the non-occipital white matter. These maps show theratio of the mean volume in the LB relative to that of the sighted controls at each voxel.The color bar displays the percentage difference in average volume between groups.

Fig. 6. Significance of volumetric excesses and deficits in the unscaled late blind group.Top panel: p-values for volume excesses in LB compared to controls. Bottom panel: p-values for volume deficits in LB versus controls. The p-values are shown on a log10 scale,with dark red values showing significance at the level of 0.05. The corrected p-value forthe whole brain was found to be p=0.034 from permutation tests, confirming thatthere is evidence for a volume difference.
Fig. 7. Percent reductions and excesses in cross-sectional area, and their significance, forthe corpus callosum in (A, B) the EB, and (C, D) the LB groups. Subjects with early-onsetblindness showmean deficits (in cross-sectional area) of up to 20%, relative to controls,in the isthmus and splenium (A). Regional differences in the late-onset blind subjects,however, are not significant (D) after multiple comparison correction: the globalp-value, corrected, for the EB group difference is p=0.027, while that for the LB isp=0.215 (not significant).
138 N. Leporé et al. / NeuroImage 49 (2010) 134–140
different ages (Thompson et al., 2000; Chung et al., 2001; Hua et al.,2009). The lack of vision probably results in a reduced activation in theneurons of the corpus callosum in these regions. The fibers of thecorpus callosum contain the axons of cortical pyramidal cells(Innocenti and Frost, 1980), which undergo impaired developmentbecause the cells in the visual cortex are not as active in blind subjects.
A volume excess was also detected in the genu of the corpuscallosum, though the results failed to reach significance. The genuconnects the left and right prefrontal areas (Zarei et al., 2006), aregion that we found to be increased in volume in our 3D whole-brainresults.
Discussion
Here we examined the 3D pattern of voxelwise volume differencesin the brain associated with blindness, in groups of subjects stratifiedaccording to early and late onset. Widespread differences were foundnot only in brain regions closely associated with vision, but significanthypertrophy was detected in non-occipital areas.
Corpus callosum
In the corpus callosum, only the EB differed significantly fromcontrols, with focal reductions in the splenium and the isthmus. Ourresults are consistent with a recent DTI tractography study (Yu et al.,2007), which found that the fractional anisotropy was significantlyreduced in the splenium of EB subjects. The splenium is primarilycomposed of fibers connecting the visuo-spatial areas of the brain. Thedifferences seen here may be due to reduced myelination of thesefibers in the absence of visual input.When onset of blindness occurs inadolescence – or later, as is the case for some of the late blind subjects– the process of myelination is relatively complete, so that thestructure of the corpus callosum may not be strongly influenced bythe loss of visual perception, at least at a gross anatomic level.
Whole brain
In the 3D maps, extensive differences were found in both blindgroups in the occipital lobes, as expected, as well as in several non-

139N. Leporé et al. / NeuroImage 49 (2010) 134–140
occipital regions (left SMA, PMC, sub parietal lobule and cingulate).These differences reached significance only in the occipital lobes ofthe EB group when multiple comparisons corrections were appliedto adjust for the many statistical tests performed over the brain.Widespread hypertrophy was also observed in non-occipital WM,particularly in the prefrontal and frontal areas, and in thecerebellum, though these results failed to reach significance whencorrected for multiple comparisons.
The greater deficits in EB may reflect a reduction in myelination,which may depend on the age of onset — in the early-blind, occipitalneurons receive less sensory input than in sighted subjects. This issupported by the fact that the splenium of the corpus callosum, asubregion carrying fibers interconnect the visual cortices, andwhich isheavilymyelinated by age 14, is reduced in size in our blind subjects. Amore direct technique to assess white matter microstructure is to usediffusion tensor imaging to show that diffusion-sensitive measures offiber integrity are altered in the axons connecting the two visualcortices. In Lee et al. (submitted for publication), we performed a TBM-like analysis on diffusion tensor data from a dataset of 12 blind adultsubjects and 14matched controls, and showed that thiswas indeed thecase. Among the potential consequences, there may be reducedsynaptogenesis, as there is a reduced need for functional relationshipsbetween neurons in those regions.
Many studies have found that the visual cortices are recruited forother sensory modalities (see e.g., Theoret et al., 2004), hence oncemight wonder whether the visual cortices should be reduced in size asthey are still used. As vision is themost important sense in humans, it isto be expected that occipital areas will be affected by the lack of inputof visual information. However, even though these areas are reducedin size, what is left of them can still contribute to the processing ofother types of sensory information, perhaps explaining the enhancedperformance of blind subjects in reading other sensory inputs.
While the reductions in the occipital regions were expected apriori, our results show decreases in several non-occipital areas, whichperform higher-order visual processing and integrate visual informa-tion with information from other sensory and motor systems. Forinstance, the SMA integrates visual and motor information.
In the parietal lobes, the right supramarginal gyrus (BA 40) isinvolved in 3D processing of visual orientation (Faillenot et al., 1997).Furthermore, a volume reduction in superior parietal cortex (BA 7),which is involved in spatial attention (Shafritz et al., 2002), may bedue to the absence of the need to calibrate and coordinate primaryvisual and motor functions in the blind.
We found widespread hypertrophy in non-occipital WM through-out the brain, particularly in the prefrontal and frontal regions. Theseresults are in line with those found when comparing deaf subjects tohearing ones with TBM (Leporé et al., submitted for publication). Asthe frontal lobes control executive function, increases in those areasmay be related to a reorganization of those functions that now need tobe generated using information from one less sense. The Supplemen-tary Motor Area (medial BA 6) and the premotor cortex (lateral BA 6)are both thought to play a role in the planning of complex, coordinatedmovements (Rizzolatti and Luppino, 2001).
The maps also show some significant volume increases in thecerebellum, which coordinates sensory-motor interactions. Changesmight occur in the cerebellum to compensate for the lack of visualinformation, as the blind subjects have good motor performance, andtheir other sensory modalities are intact. In a related TBM study, wefound that the cerebellar volume of deaf people was significantlyincreased compared to normal hearing subjects (Leporé et al.,submitted for publication).
Relationship to other modalities
Functional studies have shown that blind individuals' occipitalcortices may also be recruited to perform higher-order functions
elicited by memory (Amedi et al., 2003, Bliss et al., 2004, Roder andRosler, 2003, Raz et al., 2005) and language tasks (Amedi et al., 2004,Burton et al., 2002, Noppeney et al., 2003, Roder et al., 2003). Somehave suggested that activation of visual cortices by non-visual tasksdoes not necessarily mean that these regions are functionally engagedby the task, but more recent findings suggest otherwise. Visual cortexactivity is correlated with behavioral performance under numeroustask conditions: processing of auditory stimuli (Gougoux et al., 2005),verbal memory (Amedi et al., 2003), episodic retrieval (Raz et al.,2005) and during semantic/syntactic processing (Roder et al., 2003).Virtual lesions of the occipital cortex induced by repetitive transcra-nial magnetic stimulation (rTMS) result in increased error rates forverbal memory tasks (Amedi et al., 2004), Braille identification(Cohen et al., 1997), and sound localization (Collignon et al., 2007).
Future work
In this study, we focused solely on neuroanatomical volumedifferences between blind and sighted individuals. However, inLeporé et al. (2008b), a method was developed to simultaneouslystudy voxelwise shape and volume changes. While we chose to focushere on the volume changes only, as these already showed substantialdifferences between groups, future work could include applying thesemethods to understand further morphometric differences betweenblind and sighted individuals. The method in Leporé et al., (2008b)uses both shape and volume information andmay improve the resultsdescribed here. A TBM analysis that only considers differences involume is known to performwell on smaller samples analogous to thesample studied here, whereas the type of TBM analysis that considersboth local volume and shape (multivariate TBM; Leporé et al., 2008b)is better suited for larger samples, as it computes multivariatestatistics on 6 variables per voxel (requiring the estimation of morefree parameters). Furthermore, studies with animal models wouldalso be informative, to understand the extent of myelination anddendritic arborization in the regions with volumetric deficits.
Acknowledgments
This study was supported by grants from the Canadian Institutes ofHealth Research and by the Canada Research Chairs awarded to FrancoLepore and Maryse Lassonde. Madeleine Fortin was funded by theFond de la Recherche en Santé du Québec and the Réseau de rechercheen santé de la vision and Patrice Voss by the Natural Sciences andEngineering Research Council of Canada. Additional support foralgorithm development was provided by the National Institute onAging, the National Library of Medicine, the National Institute forBiomedical Imaging and Bioengineering, the National Center forResearch Resources, and the National Institute for Child Health andDevelopment (AG016570, LM05639, EB01651, RR019771 andHD050735 to P.M.T.) and by the National Institute of Health Grant(U54 RR021813, UCLA Center for Computational Biology).
References
Amedi, A., Raz, N., Pianka, P., Malach, R., Zohary, E., 2003. Early 'visual' cortex activationcorrelates with superior verbal memory in the blind. Nat. Neurosci. 6, 758–766.
Amedi, A., Floel, A., Knecht, S., Zohary, E., Cohen, L.G., 2004. Transcranial magneticstimulation of the occipital pole interferes with verbal processing in blind subjects.Nat. Neurosci. 7, 1266–1270.
Bliss, I., Kujala, T., Hamalainen, H., 2004. Comparison of blind and sighted participantsperformance in a letter recognition working memory task. Brain Res. Cogn. BrainRes. 18, 273–277.
Bro-Nielsen, M., Gramkow, C., 1996. Fast fluid registration of medical images.Proceedings of the 4th International Conference on Visualization in BiomedicalComputing. Hamburg, Germany, September 22–25:267–276.
Burton, H., Snyder, A.Z., Diamond, J., Raichle, M.E., 2002. Adaptive changes in early andlate blind: a fMRI study of verb generation to heard nouns. J. Neurophysiol. 88,3359–3371.

140 N. Leporé et al. / NeuroImage 49 (2010) 134–140
Chiang, M.C., Dutton, R.A., Hayashi, K.M., Lopez, O.L., Aizenstein, H.J., Toga, A.W., Becker,J.T., Thompson, P.M., 2007. 3D pattern of brain atrophy in HIV/AIDS visualizedusing tensor-based morphometry. NeuroImage 34, 44–60.
Christensen, E.G., Rabbitt, R.D., Miller, M.I., 1996. Deformable templates using largedeformation kinematics. IEEE Trans. Image Process. 5, 1435–1447.
Chung, M.K., Worsley, K.J., Paus, T., Cherif, C., Collins, D.L., Giedd, J.N., Rapoport, J.L.,Evans, A.C., 2001. A unified statistical approach to deformation-based morphom-etry. NeuroImage 14, 595–606.
Cohen, L.G., Celnick, P., Pascual-Leone, A., Corwell, B., Faiz, L., Dambrosia, J., Honda, M.,Sadato, N., Gerloff, C., Catala, M.D., Hallett, M., 1997. Functional relevance of cross-modal plasticity in blind humans. Nature 389, 180–183.
Collignon, O., Lassonde, M., Lepore, F., Bastien, D., Veraart, C., 2007. Functional cerebralreorganization for auditory spatial processing and auditory substitution of vision inearly blind subjects. Cereb. Cortex 17 (2), 457–465.
Collins, D.L., Neelin, P., Peters, T.M., Evans, A.C., 1994. Automatic 3D intersubjectregistration of MR volumetric data in standardized Talairach space. J. Comput.Assist. Tomogr. 18, 192–205.
Elbert, T., Pantev, C., Wienbruch, C., Rockstroh, B., Taub, E., 1995. Increased corticalrepresentation of the fingers of the left hand in string players. Science 270, 205–207.
Elbert, T., Sterr, A., Rockstroh, B., Pantev, C., Müller, M.M., Taub, E., 2002. Expansion ofthe tonotopic area in the auditory cortex of the blind. J. Neurosci. 22, 3439–3445.
Faillenot, I., Sakata, H., Costes, N., Decety, J., Jeannerod, M., 1997. Visual workingmemory for shape and 3D-orientation: a PET study. NeuroReport 8, 859–862.
Flor, H., Elbert, T., Knecht, S., Wienbruch, C., Pantev, C., Birbaumer, N., Larbig, W., Taub,E., 1995. Phantom-limb pain as a perceptual correlate of cortical reorganizationfollowing arm amputation. Nature 375, 482–484.
Fortin, M., Voss, P., Lord, C., Lassonde, M., Pruessner, J., Saint-Amour, D., Lepore, F., 2008.Wayfinding in the blind: larger hippocampal volume and supranormal spatialnavigation. Brain 131, 2995–3005.
Gougoux, F., Zatorre, R.J., Lassonde, M., Voss, P., Lepore, F., 2005. A functionalneuroimaging study of sound localization: visual cortex activity predicts perfor-mance in early-blind individuals. PLOS Biol. 3, 324–333.
Gramkow, C., 1996. Registration of 2D and 3D medical images. Master's thesis, DanishTechnical University, Copenhagen, Denmark.
Hofer, S., Frahm, J., 2006. Topography of the human corpus callosum revisited—comprehensive fiber tractography using diffusion tensor magnetic resonanceimaging. NeuroImage 32, 989–994.
Hua, X., Leow, A.D., Levitt, J.G., Caplan, R., Thompson, P.M., Toga, A.W., 2009. Detectingbrain growth patterns in normal children using tensor-based morphometry. Hum.Brain Mapp. 30, 209–219.
Innocenti, G.M., Frost, D.O., 1980. The postnatal development of visual callosal connectionsin the absence of visual experience or of the eyes. Exp. Brain Res. 39, 365–375.
Lee, A.D., Leporé, N., Lepore, F., Voss, P., Alary, F., Chou, Y.-Y., Brun, C., Barysheva, M.,Toga, A.W., Thompson, P.M., submitted for publication. Fiber architecturedifferences in the blind visualized using diffusion tensor imaging. Cerebral Cortex.
Leow, A.D., Chiang, M.C., Yanovsky, I., Lee, A.D., Lu, A., Klunder, A.D., Becker, J.T., Davis,S.W., Toga, A.W., Thompson, P.M., 2007. Statistical properties of Jacobian maps andinverse-consistent deformations in non-linear image registration. IEEE Trans. Med.Imaging 27, 822–832.
Leporé, N., Brun, C., Pennec, X., Chou, Y.-Y., Lopez, O.L., Aizeinstein, H.J., Becker, J.T.,Toga, A.W., Thompson, P.M., 2007. Mean template for tensor-based morphometryusing deformation tensors. Proceedings, 10th International Conference on MedicalImage Computing and Computer Assisted Intervention (MICCAI). Brisbane,Australia, Oct 29 – Nov 2.
Leporé, N., Chou, Y.-Y., Lopez, O.L., Aizenstein, H.J., Becker, J.T., Toga, A.W., Thompson, P.M., 2008a. Fast 3D fluid registration of brain magnetic resonance images.Proceedings, SPIE Conference on Physiology, Function and Structure from MedicalImages. San Diego, CA, February 16–21.
Leporé, N., Brun, C., Chou, Y.-Y., Chiang, M.C., Dutton, R.A., Hayashi, K.M., Luders, E.,Lopez, O.L., Aizenstein, H.J., Toga, A.W., Becker, J.T., Thompson, P.M., 2008b.Generalized Tensor-Based Morphometry of HIV/AIDS using multivariate statisticson deformation tensors. IEEE Trans. Med. Imaging 27, 129–141.
Leporé, N., Brun, C., Chou, Y.-Y., Lee, A.D., Barysheva, M., Pennec, X., McMahon, K.,Meredith, M., de Zubicaray, G.I., Wright, M., Toga, A.W., Thompson, P.M., 2008c.Best individual template selection from deformation tensor minimization.Proceedings, International Workshop on Biomedical Imaging (ISBI), Paris, France,April 14–17.
Leporé, N., Vachon, P., Chou, Y.-Y., Lepore, F., Voss, P., Brun, C., Lee, A.D., Lassonde, M.,Toga, A.W., Thompson, P.M., submitted for publication. Mapping of braindifferences in native signing congenitally and prelingually deaf subjects, Hum.Brain Mapp.
Nichols, T.E., Holmes, A.P., 2001. Nonparametric permutation tests for functionalneuroimaging: a primer with examples. Hum. Brain Mapp. 15, 1–25.
Noppeney, U., Friston, K.J., Price, C.J., 2003. Effects of visual deprivation on theorganization of the semantic system. Brain 126, 1620–1627.
Noppeney, U., Friston, K., Ashburner, J., Frackowiak, R., Price, C., 2005. Early visualdeprivation induces structural plasticity in gray and white matter. Curr. Biol. 15,R488–R490.
Pantev, C., Oostenveld, R., Engelien, A., Ross, B., Roberts, L.E., Hoke, M., 1998. Increasedauditory cortical representation in musicians. Nature 392, 811–814.
Raz, N., Amedi, A., Zohary, E., 2005. V1 activation in congenitally blind humans isassociated with episodic retrieval. Cereb. Cortex 15, 1459–1468.
Rizzolatti, G., Luppino, G., 2001. The motor cortical system. Neuron 31, 889–901.Roder, B., Stock, O., Bien, S., Neville, H.J., Rosler, F., 2003. Speech processing activates
visual cortex in congenitally blind humans. Eur. J. Neurosci. 16, 930–936.Roder, B., Rosler, F., 2003. Memory for environmental sounds in sighted, congenitally
and late blind adults: evidence for crossmodal compensation. Int. J. Psychophysiol.50, 27–39.
Schoth, F., Burgel, U., Dorsch, R., Reinges, M.H., Krings, T., 2006. Diffusion tensor imagingin acquired blind humans. Neurosci. Lett. 398, 178–182.
Shafritz, K.M., Gore, J.C., Marois, R., 2002. The role of the parietal cortex in visual featurebinding. Proc. Natl. Acad. Sci. U. S. A. 99, 10917–10922.
Shattuck, D.W., Leahy, R.M., 2002. BrainSuite: an automated cortical surfaceidentification tool. Med. Image Anal. 8, 129–141.
Shimony, J.S., Burton, H., Epstein, A.A., McLaren, D.G., Sun, S.W., Snyder, A.Z., 2006.Diffusion tensor imaging reveals white matter reorganization in early blindhumans. Cereb. Cortex 16, 1653–1661.
Theoret, H., Merabet, L., Pascual-Leone, A., 2004. Behavioral and neuroplastic changes inthe blind: evidence for functionally relevant cross-modal interactions. J. Physiol.Paris 98, 221–233.
Thompson, P.M., Moussai, J., Khan, A.A., Zohoori, S., Goldkom, A., Mega, M.S., Small, G.W.,Cummings, J.L., Toga, A.W., 1998. Cortical variability and asymmetry in normal agingand Alzheimer's disease. Cereb. Cortex 8, 492–509.
Thompson, P.M., Giedd, J.N., Woods, R.P., MacDonald, D., Evans, A.C., Toga, A.W., 2000.Growth patterns in the developing brain detected by using continuum-mechanicaltensor maps. Nature 404, 190–193.
Wiesel, T.N., Hubel, D.H., 1965a. Comparison of the effects of unilateral and bilateral eyeclosure on cortical unit responses in kittens. J. Neurophysiol. 28, 1029–1040.
Wiesel, T.N., Hubel, D.H., 1965b. Extent of recovery from the effects of visualdeprivation in kittens. J. Neurophysiol. 28, 1060–1072.
Wittenberg, G.F., Werhahn, K.J., Wassermann, E.M., Herscovitch, P., Cohen, L.G., 2004.Functional connectivity between somatosensory and visual cortex in early blindhumans. Eur. J. Neurosci. 20, 1923–1927.
Woods, R.P., 2003. MultiTracer: a Java-based tool for anatomic delineation of grayscalevolumetric images. NeuroImage 19, 1829–1834.
Yakovlev, P.I., Lecours, A.R., 1967. The myelogenetic cycles of regional maturation of thebrain. In: Minkowski, A. (Ed.), Regional Development of the Brain in Early Life.Blackwell, Oxford, pp. 3–70.
Yu, C., Shu, N., Li, J., Qin, W., Jiang, T., Li, K., 2007. Plasticity of the corticospinal tract inearly blindness revealed by quantitative analysis of fractional anisotropy based ondiffusion tensor tractography. NeuroImage 36, 411–417.
Zarei, M., Johansen-Berg, H., Smith, S., Ciccarelli, O., Thompson, A.J., Matthews, P.M.,2006. Functional anatomy of interhemispheric cortical connections in the humanbrain. J. Anat. 209, 311–320.