
Bradley Cowie Supervised by Barry Irwin Security and Networks Research Group Department of Computer...
33
Bradley Cowie Supervised by Barry Irwin Security and Networks Research Group Department of Computer Science Rhodes University MATHEMATICAL ANALYSIS OF NETWORK TELESCOPE TRAFFIC FOR AUTOMATED SECURITY METRIC GENERATION
Transcript of Bradley Cowie Supervised by Barry Irwin Security and Networks Research Group Department of Computer...

Bradley Cowie
Supervised by Barry Irwin
Security and Networks Research Group
Department of Computer Science
Rhodes University
MATHEMATICAL ANALYSIS OF NETWORK TELESCOPE TRAFFICFOR AUTOMATED SECURITY METRIC GENERATION
OU
TLIN
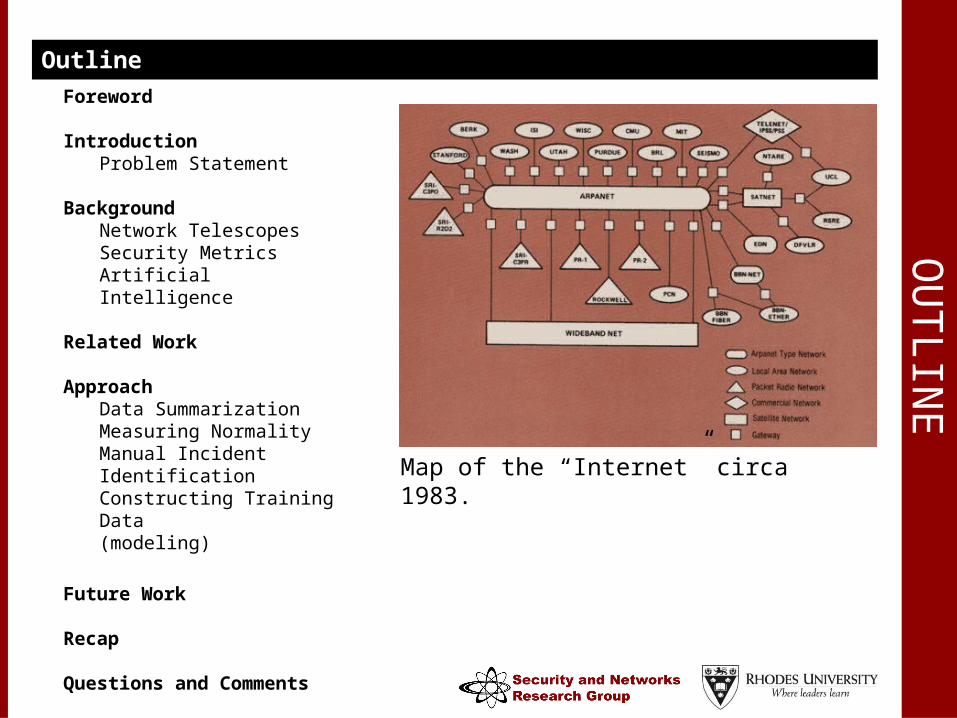
EOutline
Foreword
IntroductionProblem Statement
BackgroundNetwork TelescopesSecurity MetricsArtificial Intelligence
Related Work
Approach Data SummarizationMeasuring NormalityManual Incident IdentificationConstructing Training Data(modeling)
Future Work
Recap
Questions and Comments
Map of the “Internet” circa 1983.

FOR
EW
OR
DForeword
“Fundamental characteristics of the Internet are perpetually challenging to research and analyze, and we must admit we know little about what keeps the system stable. As a result, researchers and policy makers currently analyze what is literally a trillion-dollar ecosystem [the Internet] essentially in the dark, and agencies charged with infrastructure protection have little situational awareness regarding global dynamics and operational threats”
From : Internet Mapping: from Art to Science by K. Claffy, Y. Hyun et. al. (CAIDA)
Graphic of global internet traffic. Each line
represents the path of sample data sent out to
one of 20,000 pre- selected locations using a
system called Skitter. Developed during
research at CAIDA

INTR
OD
UC
TIO
NProblem Statement
• An enormous amount of network traffic is generated on a daily basis, requiring a significant analysis.
• It is noted that while this sort of data is often logged, it is not often that it is closely considered.
• ISPs/Organizations are interested in traffic that is anomalous relative to regular traffic received.
• It would be useful if there were intelligent and automated techniques to identify “Network Incidents” in a vast amount of data in a relatively short period of time.

BA
CK
GR
OU
ND
Network Telescopes
• The idea of a Network Telescope has been around for a number of years now (since about the early 2000’s)
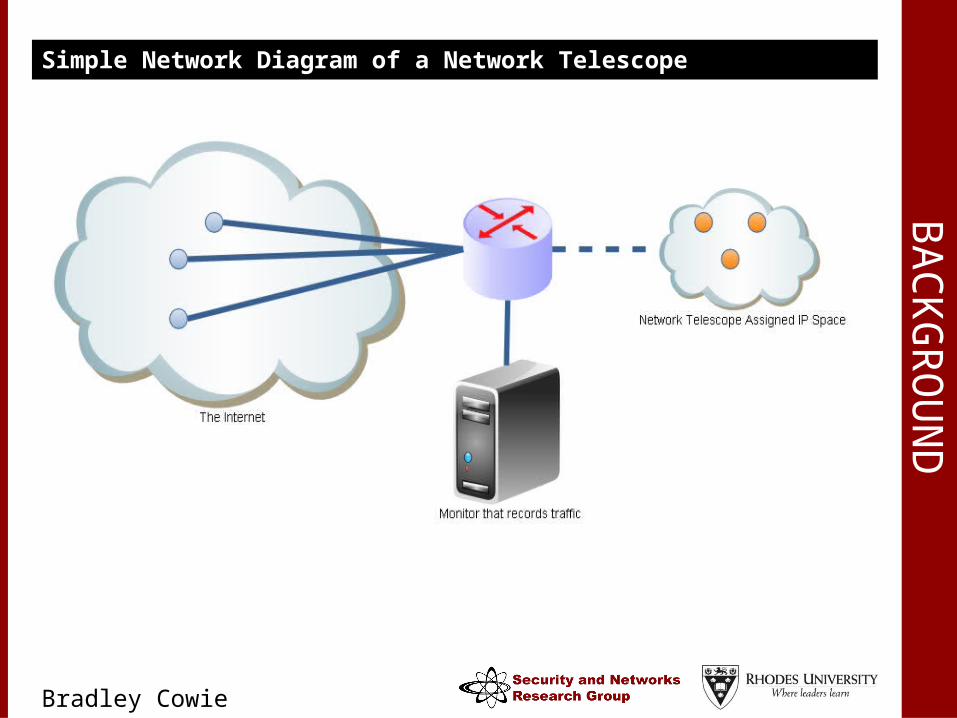
• Fundamentally, a (Passive) Network Telescope is assigned an area of IP Space on which there are no nodes.
• This implies that all traffic received is either malicious or due misconfiguration (class this sort of traffic as anomalous)
• Being passive implies that the TCP handshake cannot be completed.
• This provides a window into the nature of events occurring on the Internet
Bradley Cowie
BA
CK
GR
OU
ND
Simple Network Diagram of a Network Telescope

BA
CK
GR
OU
ND
Security Metrics
• A security metric is the analysis provided by considering some measurable quantity related to the security of a system.
• Logs of the number of machines that have received and applied patches over a period of time provides a useful measure of the effectiveness of patching systems put in place by an organization’s IT department

BA
CK
GR
OU
ND
Security Metrics
When you can measure what you are speaking about, and express it in numbers, you know something about it; but when you cannot measure it, when you cannot express it in numbers, your knowledge is of a meager and unsatisfactory kind: it may be the beginning of knowledge, but you have scarcely, in your thoughts, advanced to the state of science.
William Thompson, Lord Kelvin, Popular Lectures and Addresses [1891-1894], in Bartlett's Familiar Quotations, Fourteenth Edition, 1968, p. 723a.
BA
CK
GR
OU
ND
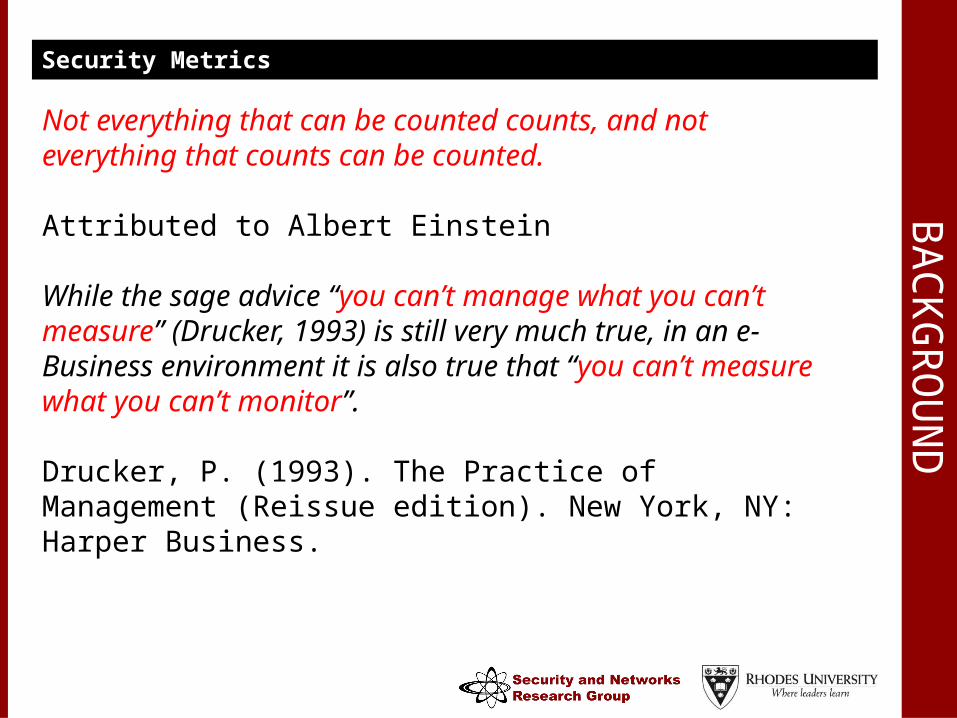
Security Metrics
Not everything that can be counted counts, and not everything that counts can be counted.
Attributed to Albert Einstein
While the sage advice “you can’t manage what you can’t measure” (Drucker, 1993) is still very much true, in an e-Business environment it is also true that “you can’t measure what you can’t monitor”.
Drucker, P. (1993). The Practice of Management (Reissue edition). New York, NY: Harper Business.

BA
CK
GR
OU
ND
Artificial Intelligence
It is the science and engineering of making intelligent machines, especially intelligent computer programs. It is related to the similar task of using computers to understand human intelligence, but AI does not have to confine itself to methods that are biologically observable.
WHAT IS ARTIFICIAL INTELLIGENCE?, John McCarthy, Stanford University, 2007

Bradley Cowie
BA
CK
GR
OU
ND
Potential techniques to be explored
• Simple Neural Networks
• Complex Neural Networks
• Bayesian Networks
• Genetic Algorithms (for rule optimization)
∑ F
W1
W3
W2
P1
P2
P3
B

RE
LATED
WO
RK
SCAIDA
The Cooperative Association for Internet Data Analysis (CAIDA) is a research body that together with the American government, commercial interest and academic intuitions (UCSD). They have produced a lot of work relating to network telescopes and analysis including papers such as :
• Internet Mapping: from Art to Science
• Code-Red: a case study on the spread and victims of an Internet worm
• A Day at the Root of the Internet
• The Internet Measurement Data Catalog
• A Robust System for Accurate Real-time Summaries of Internet Traffic: Technical Report
• The Spread of the Witty Worm
• Network Telescopes: Technical Report (fundamental reading in network telescopes)

Bradley Cowie
RE
LATED
WO
RK
SOther Work
There is large volume of work consisting of numerical and statistical analysis of the data entering and leaving a networks with the goal of this analysis to detect malicious activity. These models tend to be
• Extremely heavy and complex
• Fairly rigid
• Consider a typical network (not data from a Network Telescope)
• Generally aren’t implemented in the real world
Some of these techniques include
• Classification of nodes allowing for statistical clustering (K - clustering)

APPR
OA
CH
Data Summarization
• Reduces the data set into more manageable components from which more meaningful analysis can be made
• A database of packet headers can be reduced into a number of numerical measures for a given time period.
• Consider variations in measures at the yearly, monthly, quarterly, daily and hourly (maybe) level.
Types of measures :• Mean• Median • Sliding average• Standard deviation• Simple counts• Ratios

APPR
OA
CH
Data Summarization
“Interesting” measures relating to a network packet header :
• Total Packet Count • Mean Packet Count • Median Packet Count • Standard Deviation in Packet Size • Counts by IP grouped at /24 /16 /8 • Counts by Top Ports • Ratio by Top Ports etc.
• “Sufficiently” large changes in these values we could assume that there has been a significant change in the composition of anomalous traffic on the Internet.
• This may be indicative of a Network Incident.
APPR
OA
CH
Normality
It is important to measure “new” readings relative to a previously known norm.
This raises three key issues
• How do we even begin to define what measures are appropriate to define normality of network traffic (and for a network telescope at that)
• Previous normality may be skewed significantly by previous incidents
• Normality may vary significantly depending on the time interval considered

APPR
OA
CH
Normality

APPR
OA
CH
Normality

APPR
OA
CH
Constructing training data
In order to train Artificial Intelligence constructs, training data is required. In this context we need data with markings showing where known incidents have occurred. While there is a large amount of data is available, most/all of it is currently inappropriate to act as training data.
Three possible solutions to this problem may be considered.
• Manually marking data sets by considering heuristics that point to possible network events. Confirm using trusted websites such as CERT.org and SANS.org
• Creating simulated data sets using existing models of virus propagation and other modeling of other events such as DDoS
• WebCrawler of trusted sites (challenging)

APPR
OA
CH
Manual Marking
• As all of the data is already stored in a database, it is relatively easy to write queries to “manually” evaluate data in hopes of finding events.
• This relies on being able to experimentally or theoretically derive useful “heuristics”/rules. When these rules are met or broken that an event has likely occurred.
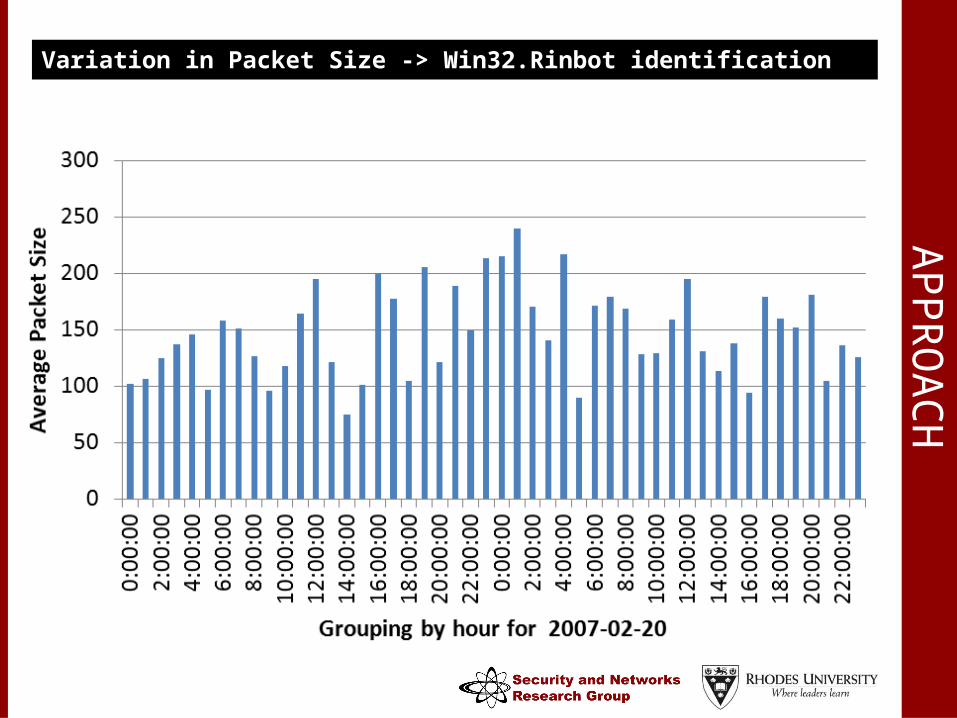
• Large variation in packet sizes (some viruses do this as a protection mechanism against filtering)
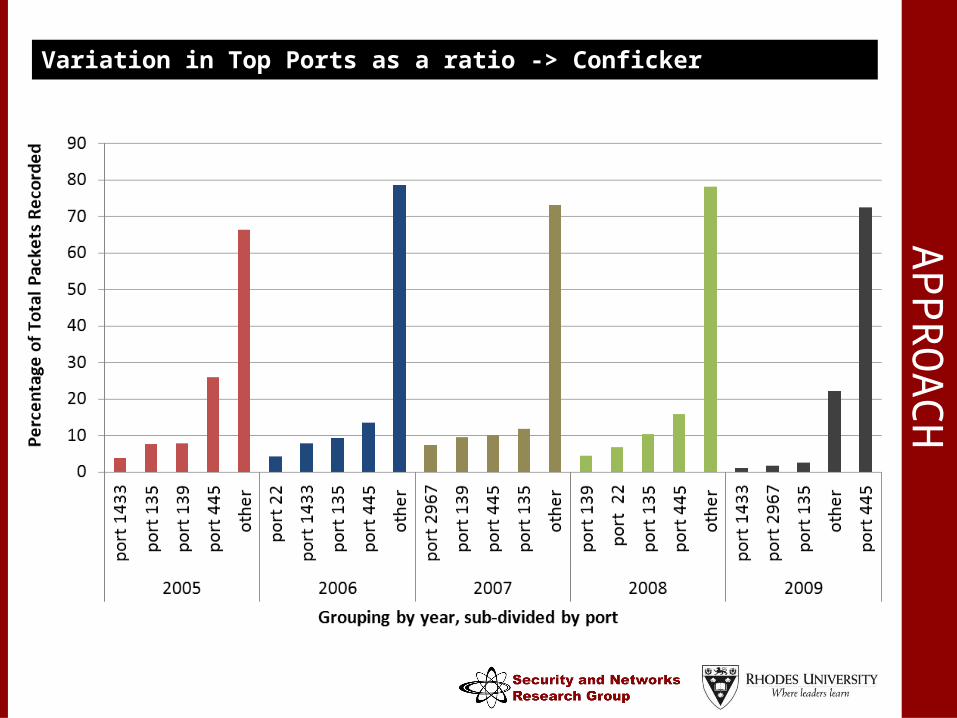
• Change in Top Port Ratio of Total Traffic
• Sudden increase in packet counts for a specific port
APPR
OA
CH
Variation in Packet Size -> Win32.Rinbot identification

APPR
OA
CH
Variation in Packet Size -> Win32.Rinbot identification
APPR
OA
CH
Variation in Top Ports as a ratio -> Conficker

APPR
OA
CH
Variation in Top Ports as a ratio -> Conficker

APPR
OA
CH
Sudden increase in packet count -> DDoS

APPR
OA
CH
Sudden increase in packet count -> DDoS
APPR
OA
CH
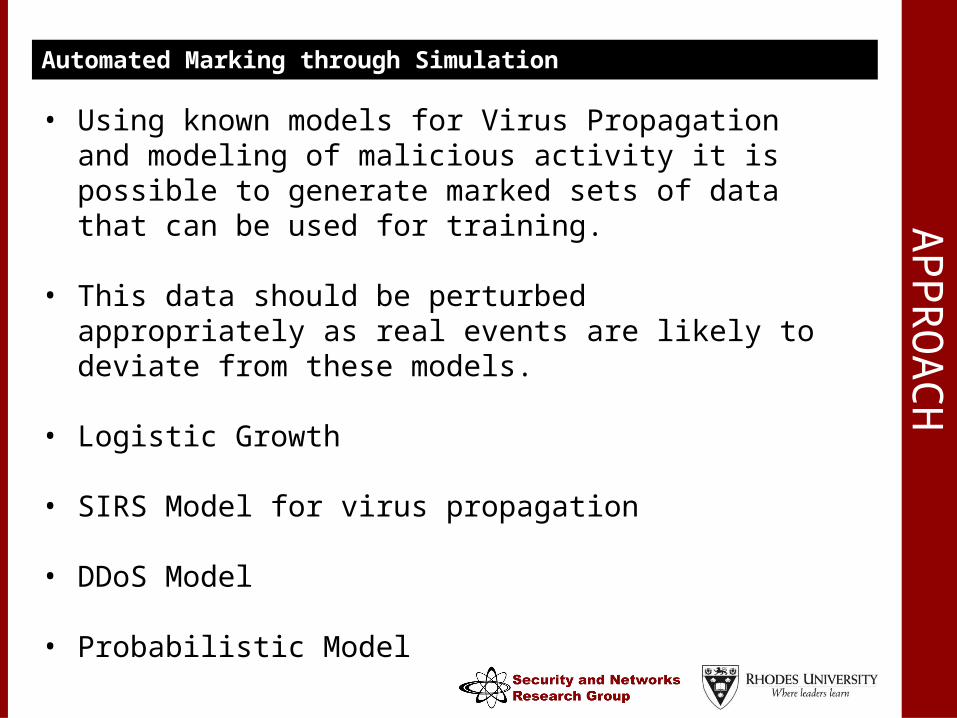
Automated Marking through Simulation
• Using known models for Virus Propagation and modeling of malicious activity it is possible to generate marked sets of data that can be used for training.
• This data should be perturbed appropriately as real events are likely to deviate from these models.
• Logistic Growth
• SIRS Model for virus propagation
• DDoS Model
• Probabilistic Model

SC
OPE
Early Project Scope
SC
OPE
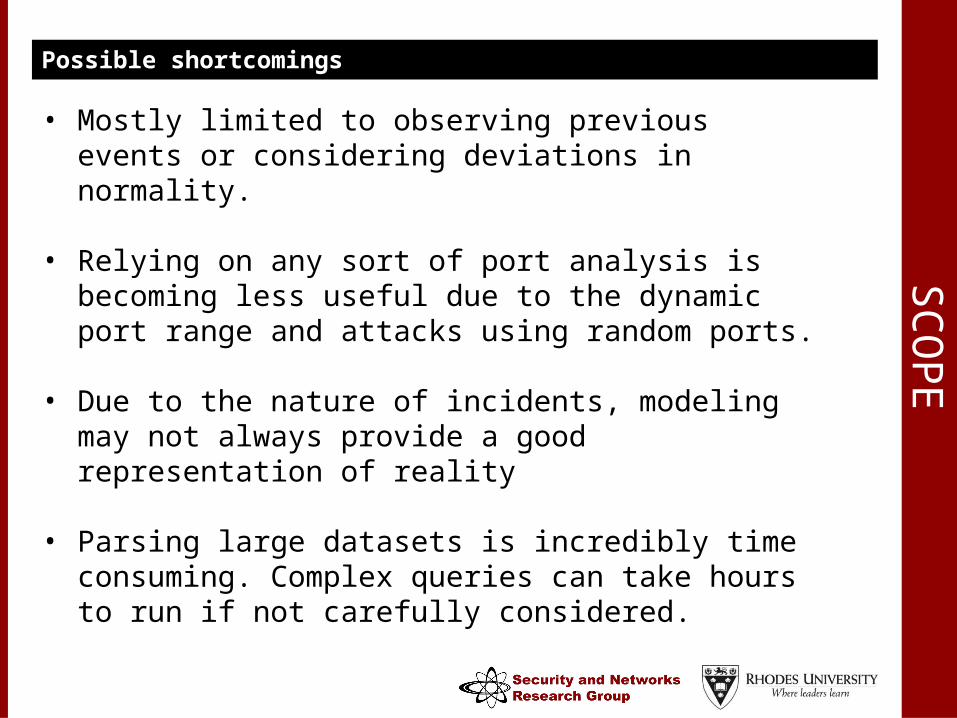
Possible shortcomings
• Mostly limited to observing previous events or considering deviations in normality.
• Relying on any sort of port analysis is becoming less useful due to the dynamic port range and attacks using random ports.
• Due to the nature of incidents, modeling may not always provide a good representation of reality
• Parsing large datasets is incredibly time consuming. Complex queries can take hours to run if not carefully considered.

FUTU
RE
WO
RK
The future !
Next couple of months will involve mainly literature review and basic implementation.
Things I plan to investigate/do !
• Build a large neural network for Network Incident Detection trained off simulated data
• Manually mark datasets (for known incidents) to evaluate the effectiveness of the trained neural network
• Consider a set of simplistic rules for incident identification. Using a GA maximize the number of incidents identified while minimizing the number of false-positives
• Investigate other AI structures (Bayesian networks)

RE
CA
PRECAP
What am I doing ?
• Using mathematical techniques such as artificial intelligence to aid in the identification of network incidents using Network Telescope data.
Why ?
• There is too much data to reliably perform manual analysis • This sort of information is important to people who need to make
high level management decisions• The Internet is a complex system and further research is required
How ?
• Using modeling techniques to simulate training data sets• Manual marking to build data sets for evaluation• Constructing artificial intelligence structures for identification • Exploring mathematical techniques that provide possible solutions

QU
ESTIO
NS
QUESTIONS AND COMMENT ?

QU
ESTIO
NS
COMMENTS ON THE QUALITY OF THE PRESENTATION ?
What did I do wrong ?
What did I do right ?