BRAC to the Future: An Analysis of Past Savings from Base ...
100
Air Force Institute of Technology Air Force Institute of Technology AFIT Scholar AFIT Scholar Theses and Dissertations Student Graduate Works 3-2001 BRAC to the Future: An Analysis of Past Savings from Base BRAC to the Future: An Analysis of Past Savings from Base Closings Closings Charles S. Tapp II Follow this and additional works at: https://scholar.afit.edu/etd Recommended Citation Recommended Citation Tapp, Charles S. II, "BRAC to the Future: An Analysis of Past Savings from Base Closings" (2001). Theses and Dissertations. 4704. https://scholar.afit.edu/etd/4704 This Thesis is brought to you for free and open access by the Student Graduate Works at AFIT Scholar. It has been accepted for inclusion in Theses and Dissertations by an authorized administrator of AFIT Scholar. For more information, please contact richard.mansfield@afit.edu.
Transcript of BRAC to the Future: An Analysis of Past Savings from Base ...
Air Force Institute of Technology Air Force Institute of Technology
AFIT Scholar AFIT Scholar
Theses and Dissertations Student Graduate Works
3-2001
BRAC to the Future: An Analysis of Past Savings from Base BRAC to the Future: An Analysis of Past Savings from Base
Closings Closings
Charles S. Tapp II
Follow this and additional works at: https://scholar.afit.edu/etd
Recommended Citation Recommended Citation Tapp, Charles S. II, "BRAC to the Future: An Analysis of Past Savings from Base Closings" (2001). Theses and Dissertations. 4704. https://scholar.afit.edu/etd/4704
This Thesis is brought to you for free and open access by the Student Graduate Works at AFIT Scholar. It has been accepted for inclusion in Theses and Dissertations by an authorized administrator of AFIT Scholar. For more information, please contact [email protected].

^%&M
BRAC TO THE FUTURE: AN ANALYSIS OF
PAST SAVINGS FROM BASE CLOSINGS
THESIS
Charles S. Tapp II, Captain, USAF
AFIT/GAQ/ENS/01M-02
DEPARTMENT OF THE AIR FORCE AIR UNIVERSITY
AIR FORCE INSTITUTE OF TECHNOLOGY
Wright-Patterson Air Force Base, Ohio
APPROVED FOR PUBLIC RELEASE; DISTRIBUTION UNLIMITED.

The views expressed in this thesis are those of the author and do not reflect the official policy or position of the United States Air Force, Department of Defense, or the U. S. Government.

AFIT/GAQ/ENS/01M-02
BRAC TO THE FUTURE: AN ANALYSIS OF
PAST SAVINGS FROM BASE CLOSINGS
THESIS
Presented to the Faculty
Department of Operational Sciences
Graduate School of Engineering and Management
Air Force Institute of Technology
Air University
Air Education and Training Command
In Partial Fulfillment of the Requirements for the
Degree of Master of Science in Acquisition Management
Charles S. Tapp II, B.S.
Captain, USAF
March 2001
APPROVED FOR PUBLIC RELEASE; DISTRIBUTION UNLIMITED.

AFU/GAQ/ENS/01M-02
Approved:
BRAC TO THE FUTURE: AN ANALYSIS OF
PAST SAVINGS FROM BASE CLOSINGS
Charles S. Tapp H, B.S. Captain, USAF
Mark A. Gallagher, Lt jKol, USAF (Chairman)
'Raymond R. Hill, Lt <Col, Raymond (Member)
USAF
William K. Stockman, Lt Col, USAF (Member)
//?7*r 0/ date
date
date

Acknowledgments
First of all, I would like to give honor to God and thank Him for blessing me over
the last year and a half as I pressed my way through this thesis effort. Undoubtedly, His
direction and favor were the key components behind my success.
I would like to express my sincere appreciation to my faculty advisor, Lt Col
Mark Gallagher, for his exceptional support and guidance throughout the course of this
thesis endeavor. His willingness to make time to answer my endless questions and his
insight to address such an obscure thesis topic was invaluable. I would also like to thank
my readers, Lt Col Raymond Hill and Lt Col William Stockman, for their input and
diligence in reviewing my work. Even with their demanding schedules, they read my
thesis with great detail and promptness, resulting in increased clarity and quality of my
analysis.
I am also indebted the Office of the Secretary of Defense, Program Analysis and
Evaluation and the Air Force Studies and Analyses Agency for sponsoring my thesis and
for providing me with data. Special thanks also goes to Ms. Janice Pruitt from the
Headquarters Air Force Materiel Command's Financial Management & Comptroller
office; her help and cooperation to obtain historical Air Force budget data was critical to
my research.
Last, but not least, I would like to express my heartfelt appreciation to my wife
for her support and prayers over the last eighteen months. Your love, understanding, and
sacrifice, particularly after the birth of our precious son, have made a seemingly daunting
task a lot more manageable. Thank you for being a Proverbs 31 kind of wife.
Charles S. Tapp II
IV

Table of Contents
Page
Acknowledgments 1V
List of Figures vu
List of Tables viii
Abstract .' 1X
1. Introduction 1
1.1. The Reality of Base Closings 1 1.2. Research Problem 2 1.3. Research Objective 4 1.4. Thesis Outline 5
2. Effects of the Cold War 6
2.1. Introduction 6 2.2. Cold War 6 2.3. Effects on the US Military Force Structure 7
3. BRAC Overview 10
3.1. Introduction 10 3.2. Base Realignment and Closure: The DoD Perspective 10
3.2.1. Overview of BRAC Implementation Costs 12 3.2.2. Overview of BRAC Savings 14
3.3. The Need for Additional Closures 15 3.4. The GAO Perspective on BRAC Savings 16 3.5. Cost Savings Versus Cost Avoidance 20 3.6. Analysis of Air Force BRAC Savings 21 3.7. Summary 23
4. Analysis of BRAC Savings 25
4.1. Introduction 25 4.2. Statistical Analysis 25
4.2.1. Regression Variables 26 4.2.2. Data • 27
4.3. Final Results 29 4.3.1. Operations and Maintenance Appropriation 30 4.3.2. Military Construction Appropriation 33 4.3.3. Military Personnel Appropriation 35

Page
4.3.4. Military Family Housing Appropriation 38 4.3.5. Research and Development Appropriation 41 4.3.6. Procurement Appropriation 44 4.3.7. Total Air Force Appropriation 47
4.4. Summary 50
5. Conclusions 53
5.1. Summary of Research 53 5.2. Suggestions for Further Research 53
5.2.1. Effects of Other Variables. 54 5.2.2. Impact of Competitive Sourcing 54 5.2.3. Impact of Interservice BRAC Actions 54 5.2.4. Facility Thinning 56
Appendix A: Master Facilities Closure List 57
Appendix B: Reclassification of Air Force Installations 59
Appendix C: Regression Database 60
Appendix D: Operations & Maintenance Regression Data 63
Appendix E: Military Construction Regression Data 66
Appendix F: Military Personnel Regression Data 69
Appendix G: Military Family Housing Regression Data 72
Appendix H: Research & Development Regression Data 75
Appendix I: Procurement Regression Data 78
Appendix J: Total Air Force Regression Data 81
Appendix K: Active Duty Personnel versus Major Installations Data 84
Bibliography 86
Vita 88
VI

List of Figures
Figure Pa§e
1. Why BRAC Savings are Difficult to Track and Estimates Change Over Time 18
2. O&M Appropriation regressed by FY and Major Installations 30
3. O&M Appropriation regressed by FY and ADAF 32
4. MILCON Appropriation regressed by FY and Major Installations 33
5. MILCON Appropriation regressed by FY and ADAF 35
6. Mil Pers Appropriation regressed by FY and Major Installations 36
7. Mil Pers Appropriation regressed by FY and ADAF 37
8. Family Housing Appropriation regressed by FY and Major Installations 39
9. Family Housing Appropriation regressed by FY and ADAF 40
10. R&D Appropriation regressed by FY and Major Installations 42
11. R&D Appropriation regressed by FY and ADAF 43
12. Procurement Appropriation regressed by FY and Major Installations 45
13. Procurement Appropriation regressed by FY and ADAF 46
14. Total Air Force Appropriation regressed by FY and Major Installations 48
15. Total Air Force Appropriation regressed by FY and ADAF 49
16. Major Installations regressed by ADAF 52
Vll

List of Tables
Table Page
1. DoD FY 1999 BRAC Budget Submission 21
2. Financial Summary of all four BRAC rounds US Department of the Air Force 22
3. Correlation of Independent Variables 28
4. O&M Regression Results (FY-Major Installations) 30
5. O&M Regression Results (FY-ADAF) 31
6. MILCON Regression Results (FY-Major Installations) 33
7. MILCON Regression Results (FY-ADAF) 34
8. Mil Pers Regression Results (FY-Major Installations) 36
9. Mil Pers Regression Results (FY-ADAF) 37
10. Family Housing Regression Results (FY-Major Installations) 38
11. Family Housing Regression Results (FY-ADAF) 40
12. R&D Regression Results (FY-Major Installations) 41
13. R&D Regression Results (FY-ADAF) 43
14. Procurement Regression Results (FY-Major Installations) 44
15. Procurement Regression Results (FY-ADAF) 46
16. Total Air Force Regression Results (FY-Major Installations) 47
17. Total Air Force Regression Results (FY-ADAF) 49
18. Summary of Regression Analyses 50
19. ADAF and Major Installation Regression Results 51
Vlll
AFIT/GAQ/ENS/01M-02
Abstract
This thesis uses regression to analyze the savings resulting from the previous four
rounds of BRAC in terms of their affect on each of the Air Force budget appropriations.
For each appropriation, while the number of major installations initially appears to be a
significant determinant in explaining the change in the budget, the number of bases
becomes insignificant if a surrogate for Air Force mission requirements is included as the
explanatory variable. We tested three surrogate measures for mission requirements:
number of flying hours, number of aircraft, and number of active duty personnel. In each
case, we found the number of active duty Air Force members to be a better predictor of
the budget level than the regression model that included the number of major
installations. We conclude that mission requirements are a better indicator of the
required funding than the number of major installations.
IX

BRAC TO THE FUTURE: AN ANALYSIS OF
PAST SAVINGS FROM BASE CLOSINGS
1. Introduction
1.1. The Reality of Base Closings
It is a rare spectacle that takes place in the corridors of the Pentagon the day the Defense Department releases the list of bases it intends to close. People gather outside room 2E765, the public affairs office. They're not reporters; they're employees and officials from potentially affected bases trying to discover if their bases will survive. The reporters march into the grey and blue newsroom in a solemn procession, sign a paper, and are handed the thick, yellow-covered list of recommended closings. Once out in the hallway, the anxious onlookers descend on the reporters bearing the lists. It's like the scene from the short story The Lottery, as each clamors to discover whether the draw will let him live or die. There is wild rejoicing as some discover their bases have been spared. And there is also deep dejection—indeed, to the point of tears—when some bases are targeted. Few other things so vividly drive home the consequences of the base realignment and closure process and its human impact than this Pentagon scene...
- David Silverberg, "BRAC Attach!" [17:40]
Since the end of the Cold War in the late 1980s, the Department of Defense has
had the daunting task of paring down the nation's military infrastructure commensurate
with the reductions in the mission, personnel, and defense budget. Under the authority
granted by Congress, an independent Base Realignment and Closure (BRAC)
Commission has worked with the Defense Department on four separate occasions to
provide the Executive and Legislative branches with a list of installations recommended
for closure. Subsequently, approval was granted to close 97 of 495 major domestic
installations, as shown in Appendix A [15:12].
As a result of these necessary actions, the dissemination of the recommendations
from the independent BRAC Commissions have resulted in several iterations of the
aforementioned scenario of dejection. And undoubtedly, as Congress considers the
Defense Department's request for the authority to initiate two additional rounds of
closure and realignment actions, the image of disheartenment and disappointment will
weigh heavy on their minds as they weigh the costs and benefits of subsequent rounds.
1.2. Research Problem
Following the end of the Cold War, the United States military has been able to
significantly reduce its alert posture. For example, the Minutemen II operation was
cancelled in 1991 and bomber crews are no longer maintained within minutes of
executing their missions. With current views that economic competition is more
important than military readiness, the military budgets have been significantly reduced.
Thus, the military services are continually in search for means to be more efficient with
the budgets prescribed by the civilian leadership.
"Since the height of the Cold War, the defense budget has been reduced by about
40 percent, overall force structure has been reduced by 36 percent, and procurement has
decreased by almost 70 percent; yet, during the same period, the number of bases in the
United States has dropped by only 21 percent (26 percent world-wide)" [7]. The
reductions in the budget, force structure, and procurement strongly suggest the need for
further reductions in base infrastructure, as DoD contends there should be a one-to-one

ratio between percentage changes in force structure and infrastructure. Additional base
closings may afford the Defense Department the means to reduce infrastructure costs and
reallocate resources for more efficient use.
In the 1997 Quadrennial Defense Review (QDR) and 1998 Report of the
Department of Defense on Base Realignment and Closure (BRAC Report), the Honorable
William Cohen, Secretary of Defense (SECDEF), expressed the need for two additional
rounds of BRAC. The need for the two additional rounds is predicated on the concept of
eliminating excess installations to achieve a proper balance between our military
infrastructure and force structure. Furthermore, DoD contends that the savings generated
by BRAC could be used to fund future readiness and weapons modernization and
acquisition programs, if Congress were to fund the Defense Department in accordance
with the Future Years Defense Plan (FYDP).
In spite of the anticipated benefits resulting from the elimination of excess
infrastructure, the ensuing economies of scale, and extensive long-term savings as touted
by the BRAC Report, the Defense Department has received major opposition from
civilian leadership on Capitol Hill. "Many members of Congress have been reluctant to
support additional base closure rounds because they were concerned about the costs and
savings from prior base closure rounds, their economic impact, and executive branch
implementation of the 1995 BRAC Commission's recommendations regarding
McClelland and Kelly Air Force bases in California and Texas, respectively" [11:34].
The consternation of Congress has resulted in the rejection of several proposed
amendments to the National Defense Authorization to establish additional rounds, the
most recent in June 2000.
The biggest point of contention, however, rests on the costs and savings attributed
to the first four rounds. Current accounting systems make it extremely difficult to track
detailed cost in budget data because the financial data is so aggregated. When costs are
identified, it is difficult to determine if these costs attributed to BRAC would have
occurred in its absence [13:4]. For instances, would the permanent change of station
costs attributed to base closures occurred due to normal military transfers, or is the
reduced personnel cost derived from the decreased mission with the end of the Cold War
or from base closures? More difficult than determining costs, it is impossible to track
savings in the budget data. The accounting systems used by the Defense Department do
not have the capability to assess savings, therefore, DoD uses estimates from the Cost of
Base Realignment Actions (COBRA) model—a model designed specifically to compare
BRAC options as opposed to measuring specific cost and savings estimates.
As DoD postures itself for a new administration, a possible recession, and the
potential for more budget cuts, a decision about the need for additional base closings is
crucial. In the absence of definitive cost and savings information, this research attempts
to substantiate savings attributed to BRAC based on changes in the aggregate budget.
1.3. Research Objective
This research tests whether the number of major installations drives the Air Force
budgets and expenditures, or if surrogate measures for Air Force mission requirements
provide a more reasonable explanation. We accomplish this by developing descriptive
models using Air Force budget data to illustrate the impact of the number of major
installations versus surrogate measures of Air Force mission requirements.

The Defense Department financial community, particularly as it prepares for the
Quadrennial Defense Review, may find this analysis insightful. We believe this research
may serve as a foundation for subsequent analyses on the effects base closures have on
the aggregate budget and may provide insight for similar analyses for the other services.
1.4. Thesis Outline
This thesis is organized into four major chapters. Chapter 2 provides an overview
of the Cold War and its impact on the posture of the US military. Chapter 3 presents an
overview of BRAC, the costs and savings associated with its implementation, and items
for consideration for future rounds. The objective of Chapters 2 and 3 is to provide a
synopsis of the events that led to the US to maintain its largest standing military force
during peacetime, and the actions implemented to reduce the infrastructure during the
subsequent draw down at the end of the Cold War. Chapter 4 provides an explanation of
the research methodology used to address the research problem and results of the
analysis. The final chapter, Chapter 5, presents the conclusions of this thesis and
recommendations for future studies.

2. Effects of the Cold War
2.1. Introduction
"From the rise of the Iron Curtain in 1946 to the collapse of the Soviet empire in
1991," the nuclear arms race between the world's two superpowers had a looming impact
across the world [4]. Far-reaching political alliances and stringent economic sanctions
against communist countries resulted from this confrontation between military giants, but
perhaps the most significant effect of the war was the establishment of a large-standing
US military force during peacetime.
This chapter provides a brief overview of the Cold War, its effects on the US
military, and the transition of the armed forces to a post-Cold War posture after the
toppling of communism in Eastern Europe in 1989 and the subsequent dissolve of the
USSR in 1991.
2.2. Cold War [3]
"Cold War", a term popularized by American journalist Walter Lippman, labels
the post-World War II struggle between the United States and its allies and the Union of
Soviet Socialist Republics (USSR) and its allies from the mid-1940s until the late 1980s.
During this period, international politics were heavily shaped by the intense rivalry
between these two superpowers and the political ideologies they represented: democracy
and capitalism in the case of the United States and its allies, and communism in the case
of the Soviet bloc.
As victory in World War II was imminent for the Grand Alliance, the American-
British-Soviet coalition, the United States and Soviets had a vast disagreement on the

make-up of the postwar world, particularly concerning the future of Poland. The USSR
believed Poland was vital to the security of the Soviet Union, and in 1946 and 1947
helped bring communist governments to power in Poland and the neighboring states of
Romania, Bulgaria, and Hungary.
As the impetus for the Cold War, this spread of communism under the leadership
of Josef Stalin caused relations between the USSR and its World War U allies (primarily
the United States, Britain, and France) to deteriorate to the point of war, although an
actual occurrence of warfare did not occur. Over the next few years, the emerging rivalry
between these two camps hardened into a mutual and permanent preoccupation. It
dominated the foreign policy agendas of both sides and led to the formation of two vast
military alliances: the North Atlantic Treaty Organization (NATO), created by the
Western powers in 1949; and the Soviet-dominated Warsaw Pact, established in 1955.
Although centered originally in Europe, the Cold War enmity eventually drew the US and
the USSR into local conflicts in almost every quarter of the globe. It also produced what
became known as the "Cold War arms race", an intense competition between the two
superpowers to accumulate nuclear weapons.
2.3. Effects on the US Military Force Structure [8]
Throughout the Cold War, the US was guided by a national security strategy of
containment. It was a simple concept based on the idea that the centers of power for
communism were the Soviet Union, its satellites, and China. In the late 1940s and early
1950s, when this strategy was put into effect, the goal was to contain communism by
forming alliances and building military bases around these centers of power to prevent

them from physically expanding. This strategy forced a change in the familiar security
paradigm of the United States. When these installations were built around the world,
they could not be staffed them with people from the Guard and Reserve. For the first
time in peacetime, the US had to maintain a large-standing military force. The Defense
Department had to field large numbers of active-duty people—soldiers, sailors, airmen
and Marines—and have them forward deployed. These forces also required a large
support base and rotation pool in the United States.
The US military, however, has changed rather dramatically since the end of the
Cold War. In the late 1980s and early 1990s when we saw the Berlin Wall come down
(1989), the Warsaw Pact disintegrate (1991), and, eventually, the Soviet Union come
apart (1991), the US political leaders were far out in front of the military in recognizing
the momentous nature of these changes and the need to restructure the American military.
These events caused a shift in America's national priorities. Most notable to those
in the military were the decreases in the defense budgets and the beginning of what many
people called "downsizing". Some contend that these steps should have been
characterized as "demobilization". As a nation, the US has always had a militia mind-
set—we mobilize and use whatever resources are necessary to meet a challenge or to win
a war; and, when it's over, we demobilize (or in other words, significantly reduce our
standing military) and that's what really happened at the end of the Cold War.
Many Americans grew up with the massive military structure during the Cold
War. Many people came to believe the United States always had a large-standing
military force that was forward deployed, and this was the way things would always be.
However, this structure had to change because of the political shifts in Europe and the

Soviet Union that started in the late 1980s. President George H. W. Bush recognized the
nation needed a new national security strategy, and in the fall of 1990 he charged the
National Security Council with developing a post-Cold War strategy.
As this strategy was being developed, we began to bring troops back from
overseas bases. As we did so, we looked at several aspects of our forward presence
policy. First, we asked whether the function or mission the troops performed was still
required in the post-Cold War environment. If it was not required, then we disbanded the
units and demobilized those troops; if we thought the function or mission was required,
but could be placed with the Guard or Reserve because of a longer mobilization time,
then we did so. Troops would only be kept on active duty as a last resort. In the end, the
majority of these active units would be part of a contingency force based in the United
States. The military would have just enough forward presence to facilitate the
reintroduction of troops if they were required to provide humanitarian assistance, to aid
an ally, or to unilaterally defend some vital US interest.
As a result of this approach, the United States made some dramatic reductions in
the numbers of people in the armed forces. At the end of the Cold War, the US had 2.1
million men and women under arms in the active force. After this strategy development
process, the force was reduced to 1.4 million service members by October 1, 1995.
3. BRAC Overview
3.1. Introduction
As the Department of Defense postures itself to meet the fiscal and operational
challenges in the post-Cold War era, Joint Vision 2020, the 1997 Quadrennial Defense
Review (QDR), and the Defense Reform Initiative (DRI) all point to the need for drastic,
continuous transformation in the Defense Department [5:5-11]. The Defense Department
firmly believes a major component of this period of transformation is its ability to close
installations that no longer hold value in the national defense strategy—a task
accomplished through the Base Realignment and Closure (BRAC) process. Specifically,
DoD contends that the ability to initiate two additional rounds of BRAC will promote the
effective and efficient use of the scarce fiscal resources prescribed by our civilian
leadership and provide savings to further sustain readiness and bolster a force of aging
weapons systems.
This chapter outlines the BRAC process, as well as the costs and savings reported
by DoD resulting from the initial four rounds. Additionally, this chapter provides an
overview of issues for consideration as DoD and Congress contemplate future rounds of
base closures.
3.2. Base Realignment and Closure: The DoD Perspective [5:3]
From the end of Vietnam until the late 1980s, congressional concern about the
potential loss of jobs in local communities resulted in very few bases being studied or
recommended for closure. These circumstances prevented DoD from adapting its base
10

structure to the significant changes in forces, technologies, organizational structures, and
military doctrine. However, the end of he Cold War and the associated reductions in the
size of the military increased the number of installations that were candidates for closure
and realignment to a point where they could no longer be ignored.
To address this problem, Congress created the BRAC process, which works as
follows: DoD carefully evaluates and ranks each base according to a published plan for
the size of future military forces and to a published criteria, adopted through a rule-
making process prior to each round, starting with the 1991 round. The criteria have been
the same for each round and have included military value, return on investment,
environmental impact, and economic impact on the surrounding communities. The
Secretary of Defense then recommends to an independent BRAC Commission bases for
closure and realignment. The Commission, aided by the General Accounting Office,
performs a parallel, public review of these recommendations to ensure that they are,
indeed, consistent with the Department's force structure plan and selection criteria. The
Commission then submits its recommendations to the President. The President and
Congress must either accept these recommendations in total or reject the entire package.
Through its attributes of transparency, auditability, and independence, the BRAC
process has permitted both Congress and the President to support important but politically
painful adjustments in DoD's base structure.
The Defense Authorization Amendments and Base Closure and Realignment Act
of 1988 (BCRA 88, Title II of Pub. L. 100-526, 10 U.S.C. Section 2687 note), and the
Defense Base Closure and Realignment Act of 1990 (DBCRA 90, Part A of Title XXIX
11

of Pub. L. 101-510, 10 U.S.C. Section 2687 note) list the requirements for identifying and
implementing domestic military base closures and realignments.
3.2.1. Overview of BRAC Implementation Costs [5]
BRAC implementation costs consist of the one-time expenses associated with the
overall base closure and realignment effort. The key characteristics of such costs are that
they are directly related to implementing a BRAC action; for example, they would not be
incurred except for the BRAC action. These costs represent the near-term investments
required to generate long-term BRAC savings. The Defense Department currently
estimates that implementing the four prior BRAC rounds will cost approximately $23
billion from 1988 through 2001.
Two separate budget accounts have been established for BRAC implementation
costs. The DoD Base Closure Account provides funding to implement BRAC 88 actions;
the DoD Base Closure Account 1990 provides funding to implement BRAC 91, 93, and
95 actions. Both accounts are part of DoD's overall budget for military construction,
though they pay for many BRAC-related activities in addition to construction, such as
relocating personnel and equipment and performing environmental remediation. The
BRAC budget accounts include the following categories of spending:
• Military construction: New facilitates or alterations to existing facilities at the gaining installations to accommodate the influx of equipment and personnel
• Family Housing: Construction of new housing units • Operations and Maintenance: Established to pay for a variety of operation
and maintenance costs, such as severance pay for civilian employees, moving costs for civilian employees who relocate, transportation of equipment, some real property maintenance, and program management. BRAC accounts pay for caretaker costs, but not facility-related operation and maintenance activities prior to closure and the establishment of a caretaker regime
• Military Personnel, Permanent Change of Station: BRAC accounts pay for moving personnel and their dependents from closing and realigning bases to
12
•

other installations. They also pay for travel, subsistence, and related costs of temporary duty for these military personnel
• Environmental Restoration: BRAC accounts fund environmental restoration.
The law requires DoD to complete implementation of each BRAC action within
six years of the date on which the President transmitted to the Congress the report that
approved the action. The Department begins to implement each BRAC round, and
therefore begins to incur the one-time implementation costs in the fiscal year immediately
following approval of the round, and continues to incur costs, until the end of the six-year
period. For example, DoD will incur costs for BRAC 95 from fiscal year 1996 to fiscal
year 2001.
In addition to the aforementioned costs, there are expenses incurred in support of
BRAC actions that are funded outside of the BRAC accounts. The categories of
expenses would include:
• Economic assistance ■ DoD's Office of Economic Adjustment: Issues grants to help
communities affected by BRAC establish local organizations to plan base reuse and to assist with their economic adjustment
■ Department of Labor: Assists displaced workers through counseling, retraining, and job search assistance
■ Commerce Department's Economic Development Administration: Provides grants to improve former bases' infrastructure as a means to facilitate base reuse
■ Federal Aviation Administration: Issues grants to fund capital improvements to convert former military airfields into new civilian airports
• Unemployment compensation • Early retirement and voluntary separation costs • Health care
These one-time costs indirectly associated with BRAC are considered to be small. As
noted in the Defense Department's 1998 BRAC Report, the costs imposed on other
government programs are less than five percent of BRAC implementation costs.
13

3.2.2. Overview of BRAC Savings [5]
DoD defines savings as the difference between (1) what the Department would
have spent in the absence of the BRAC process to operate its base structure and (2) what
the Department actually spent (or plans to spend) for this function, plus gains in
efficiency that would not have been possible without BRAC.
BRAC creates savings because it permits DoD to avoid costs that it would have
incurred were it not for BRAC. First, BRAC saves base operating support costs, such as
the costs to "open the doors and turn on the lights". Second, BRAC saves other costs
because consolidation tends to increase efficiency. In the absence of the BRAC process,
the Department is effectively prohibited from gaining efficiencies through relocating and
consolidating major functions.
BRAC savings can be grouped into two categories: those that recur and those that
are one-time savings. Recurring savings would be those that represent permanent, on-
going reductions in planned spending, for example, personnel positions eliminated would
represent recurring savings. One-time savings include savings that do not recur year after
year, for example, cancelled military construction projects; one-time savings also take the
form of revenues generated from the lease or sale of properties.
Savings derived from BRAC do not represent direct reductions in DoD's annual
spending. Neither are they accumulated assets to be spent at some future time. Rather,
the reduction in expenditures associated with the realignment or closure of military
installations gives the Defense Department a way to meet budget targets and to fund
priority functions that it could not accommodate in the absence of BRAC-related
economies. Furthermore, budgetary adjustments for expected BRAC savings are made as
14

part of the normal planning, program, and budgeting system (PPBS) process. No audit
trail, single document, or budget account exists for tracking the end use of each dollar
saved through BRAC.
It has been DoD's policy to allow the Military Departments to retain and
reallocate their BRAC savings. After BRAC recommendations are approved, each
Military Department applies the estimated savings to its long-term spending plans and
uses them to fund higher priorities.
3.3. The Need for Additional Closures
"Today, the US military finds itself operating at an intense pace around the
globe—more so than at any peacetime in our history. But defense spending has been
declining in real terms every year since 1985, and military planners assume that this
decline will continue for the foreseeable future" [10]. Since the height of the Cold War,
the defense budget has been reduced by approximately 40 percent, overall force structure
has been reduced by 36 percent, and procurement had decreased by almost 70 percent;
yet, during the same period, the number of domestic bases has dropped only 21 percent
[2; 7].
Based on the findings in the DoD BRAC Report, after the on-going closure and
realignment efforts resulting from the four previous rounds of BRAC are complete in
2001, the Department will still have more bases than are needed to support our nation's
military forces [5:i]. Moreover, maintaining and operating an inert base structure that is
larger than necessary has broad consequences for the Department; these consequences
fall into two categories [5:ii, 2]:
15

Strategie. New BRAC rounds are of fundamental importance to our defense strategy. Without new BRAC rounds, DoD will not be able to implement the strategy outlined in the Quadrennial Defense Review. In the absence of BRAC, DoD will have to decide whether to reduce force structure, delay the introduction of more modern weapons for our troops, or reduce funding for quality of life.
Financial. DoD wastes money operating and maintaining bases that are not essential to national defense. Future BRAC rounds will enable the Department to generate savings by eliminating existing excess capacity and use those resources to maintain readiness and modernize our forces. BRAC will also help eliminate the additional excess capacity created as DoD reengineers business practices and consolidates organizations.
3.4. The GAO Perspective on BRAC Savings
As the investigative arm of Congress, the General Accounting Office (GAO) has
reviewed the costs and savings reported by DoD. Upon review of DoD's claims, GAO
suggests that ambiguous costs and savings estimates, inferior accounting systems, and
mounting environmental cleanup costs have tainted DoD's ability to present more
accurate cost and savings information as they apply to BRAC.
Changes and uncertainties regarding BRAC implementation costs and savings
have been caused by a variety of factors, beginning with how the estimates were initially
calculated and later updated or tracked.
DoD derived initial BRAC cost and savings estimates from the Cost of Base Realignment Actions (COBRA) model, which was used in each of the past four BRAC rounds to develop comparative costs of alternative actions. This model, while useful for initial BRAC decision-making, was not intended to produce budget quality data and was not used to develop the cost estimates in the budgets for implementing BRAC decisions [14:24-25].
Data developed for the budget submissions differ from those in COBRA for a
variety of reasons, including the following [15:38-39]:
16

• Some factors in COBRA estimates are averages, where budget data are more specific.
• COBRA costs are expressed in constant-year dollars; budgets are expressed in inflated dollars.
• Environmental restoration costs are not included in COBRA estimates, but these costs are included in BRAC implementation budgets.
• COBRA estimates show costs and savings pertinent to a given installation even if multiple tenants are involved; BRAC implementation budgets represent only a single component's costs.
Furthermore, the estimates for savings have not been developed consistently across the
services. "The Army and the Navy did not use the model to develop the savings
estimates that were reported in DoD's budget justifications for the BRAC accounts, while
the Air Force used the COBRA estimates, with adjustments for inflation and recurring
cost increases at gaining bases, as the basis for developing its savings estimates" [14:24-
25].
Figure 1 further illustrates the factors that have made it difficult to fully identify
and track savings from closures or led to changing estimates of costs over time which
affected when savings would begin to offset the costs [14:24].
17

Figure 1. Why BRAC Savings are Difficult to Track and Estimates Change Over Time
A fundamental limitation in DoD's ability to identify and track savings from BRAC closures and realignments is that DoD's accounting systems, like all accounting systems, are oriented to tracking expenses and disbursements, not savings. Savings estimates are developed by the services at the time they are developing their initial BRAC implementation budgets and are reported in DoD's BRAC budget justifications. Because the accounting systems do not track savings, updating these estimates requires a separate data tracking system. The lack of updates is problematic because the initial estimates are based on forecasted data that
18

can change during actual implementation, thereby increasing or decreasing the amount of savings [14:25-26].
Moreover, "DoD cannot provide accurate information on the actual savings because (1)
information on base support cost was not retained for some closing bases and (2) the
services' accounting systems cannot isolate the effect on support costs at gaining bases"
[13:4]. In spite of the criticism the Department has received from its inability to
accurately identify and track savings from BRAC actions, DoD officials state that
designing and implementing a system for collecting actual savings information would be
difficult and extremely expensive, and they questioned the value of such a system [13:4].
In addition to the nebulous estimates and inferior accounting systems, the costs of
implementing BRAC recommendations have been greater than DoD originally estimated.
Land sale revenues were less than projected, particularly in the earlier rounds, and
environmental cleanup costs are significantly higher—by the end of the legislated BRAC
implementation period, it is expected that DoD will have spent over $7.2 billion dollars in
environmental costs, with an additional estimate of $2.4 billion to continue beyond fiscal
year 2001 [15:6]. The key factors contributing to the mounting cost of cleanup are (1)
the number of contaminated sites and difficulties associated with certain types of
contamination, (2) the requirements of federal and state laws and regulations, (3) the lack
of cost-effective cleanup technology, and (4) the intended property reuse [12:9].
Additionally, as DoD retains hundreds of thousands of acres until the property is able to
meet transfer requirements, costs associated with a caretaker force continue to
accumulate for the Department, ultimately lessening overall BRAC savings.
19

3.5. Cost Savings Versus Cost Avoidance
The General Accounting Office claims, "despite the imprecision associated with
DoD's cost and savings estimates, our analysis continues to show that BRAC actions will
result in substantial long-term savings after the cost of closing and realigning bases are
incurred" [15:43]. As reported by the General Accounting Office, there is evidence
indicating that the long-term savings that BRAC will generate, as a result of creating
economies through the reduction of excess infrastructure, should be substantial. Though,
it must be noted that the "savings" claimed by DoD are cost avoidance. It is important to
note the distinction between cost savings and cost avoidance: cost savings are simply
cost reductions from an approved budget that result in program funds being recouped or
used elsewhere, and cost avoidances are the avoidance of costs that have not been
budgeted [14:6].
As reported in the DoD fiscal year 1999 BRAC budget submission, the net
cumulative savings from all four rounds through fiscal year 2001 should be
approximately $14 billion, as shown in Table 1; however, because a majority of the
savings occur after the six-year BRAC/FYDP implementation period, they would be
more along the lines of cost avoidance as opposed to direct FYDP adjustments [1:8;
15:37].
20

Table 1. DoD FY 1999 BRAC Budget Submission
Round
BRAC 95 1996-2001 Total
$ Billions Total
Net annual savings Net savings 6-Year recurring through through Period Costs Savings savings 2001 2001
BRAC 88 1990-1995 $2.7 BRAC 91 1992-1997 5.2
$2.4 6.4
$0.8 1.5
BRAC 93 1994-1999 7.7 7.5 2.1 7.3 5.9 1.3
$22.9 $22.2 $5.7
$6.9 12.4 11.7 5.9
$36.9
$4.2 7.2 4.0
(1.4) $14.0
In the absence of a definitive explanation of the savings generated by the first four
rounds, Congress is wary of authorizing the additional rounds requested by the SECDEF
and the services.
3.6. Analysis of Air Force BRAC Savings
There have been many inferences about the savings within DoD being tied
directly to the number of installations. However, previous studies on the savings,
specifically the Air Force savings illustrated in the report for the Deputy Assistant
Secretary (Cost and Economics), Financial Management, SAF/FMC, indicate a majority
of the savings have been related to personnel cuts that resulted from decreased mission
requirements. Of the Air Force savings attributed to BRAC, 86.7 percent of the total
savings were resultant of reduction in personnel (53.79 percent from military personnel
and 32.96 percent from civilian personnel), as highlighted by Table 2 [1:11].
21

Table 2. Financial Summary of all four BRAC rounds US Department of the Air Force
$ Millions
FY90-FY01
COSTS
One time implementation costs $5,811
Implementation costs outside of BRAC account 310
Sub-total $6,121
SAVINGS
Military construction $504
Family Housing Construction 70
Family Housing Operation 242
Operations & Maintenance 2,030
Military Personnel 3,313
Sub-total $6,159
NET IMPLEMENTATION COSTS (+); SAVLNGS(-) $-38
Personnel-related Savings (O&M/ MilPers) $5,343
Total Savings Credited to BRAC $6,159
Personnel Savings/ Total Savings 86.7%
Based on this analysis presented in the SAF/FMC report, it would appear logical
to evaluate the impact of the service members on the budget, in addition to the other
surrogate measures for the Air Force mission requirements—number of aircraft and
number of flying hours.
22
3.7. Summary
Undoubtedly, as the Defense Department prepares itself for the challenges of
addressing new threats and retaining its posture as a dominant military power in the post-
Cold War era, it is presumed that base closures will play a major role in reshaping our
domestic infrastructure to eliminate installations that no longer hold military value, thus
promoting more efficient use of military resources. Former Defense Secretary William
Cohen emphasizes this in his cover letter in the April 1998 Office of the Secretary of
Defense report, The Report of the Department of Defense on Base Closure:
BRAC is critical to the success of our defense strategy. Without BRAC, we will not have the resources needed to maintain high readiness and buy the next generation of equipment needed to ensure our dominance in future conflicts [5].
In the absence of viable cost and savings data, however, it is difficult to
substantiate the savings attributed to BRAC and provide definitive data to Congress as
they consider future rounds. "Key requirements for calculating actual BRAC savings
include information on decreased support costs at closing bases and the offsetting
increases at gaining bases" [13:4]. (Note: The February 1992 DoD Base Structure
Report defined base support costs as "the overhead cost of providing, operating, and
maintaining the defense base structure, including real property, base operations costs, and
family housing costs" [13:24].) As noted by GAO, DoD's inferior accounting systems,
coupled with highly aggregated fiscal data, make it difficult to determine savings with
any degree of certainty. Therefore this study will conduct research to determine whether
changes in the aggregate budgets support the claim that closing major installations
produces significant savings. Air Force data will be used for this research.
23

To evaluate the impact of each major installation, we will use regression to
determine if a statistically significant relationship could be modeled between the number
of installations and the budgets for the six appropriations. Subsequently, surrogate
measures for the Air Force mission requirements will be used to determine if a
mathematical relationship exists and if it provides a better measure than the number of
installations.
24

4. Analysis of BRAC Savings
4.1. Introduction
To evaluate the potential savings of closing major installations, one should
evaluate the monetary contribution of the number of installations to the budget. This
research tests whether the number of major installations drives the Air Force budgets.
We test the impact of the number of installations alone and along with measures of Air
Force mission requirements. Ultimately, we compare the results of the individual
analyses to determine which measure provides a more reasonable and justifiable
statistical relationship with regards to claimed savings.
4.2. Statistical Analysis
This study employs regression using the Excel Data Analysis (Analysis ToolPak)
add-in to evaluate the hypothesis that the budgets of the six Air Force appropriations can
be explained with the number of major installations and surrogate variables for the Air
Force mission level. The resulting descriptive models should provide insight into how
the number of major installations and the Air Force mission requirements, as explained
by the surrogate measures, can explain the appropriation budgets.
There are several overarching assumptions that were imposed for this analysis:
1. The number of active duty personnel, total number of aircraft, or flying hours is a surrogate measure for Air Force mission requirements.
2. Significant post-Cold War active duty personnel reductions are the result of reducing the Air Force mission level, as opposed to being driven by BRAC actions.
25

To test the research assumptions, we use major installations and three surrogate measures
for Air Force mission requirements.
4.2.1. Regression Variables
As the Defense Department continues to contemplate two additional rounds of
base closings, the focus continues to be on closing major installations. The Air Force
defines major installations as Air Force Bases, Air Bases, Air Reserves Bases, and Air
Guard Bases, that are self-supporting centers of operations for actions of importance to
Air Force combat, combat support, or training. Each of the major installations is
occupied by a unit of group size or larger with all land, facilities, and organic support
needed to accomplish the unit mission.
Consistent with DoD objectives, we focused our research on identifying the
impact of major installations on the Air Force budget. We did consider using minor
installations for further analysis, however, we were unable to find a source for the
number of minor installations using the current Air Force criteria for base classifications
as discussed in Appendix B.
To test whether major installations or mission level drives the Air Force budgets,
this research also considers the impact of surrogate measures for Air Force mission
requirements:
This research hypothesizes that the conclusion of the Cold War led to the decline
in the Air Force mission level, which subsequently led to significant reductions in the
number of personnel on active duty. Moreover, the S AF/FMC report implies a causal
link between the mission level and the number of active duty personnel and that the
overwhelming majority of savings attributed to BRAC are actually from personnel
26

reductions [1:7]. To test this theory, we use active duty Air Force members as a
surrogate measure of the mission requirements.
Air Force mission requirements also dictate the operations tempo. DoD defines
operations tempo as "a measure of the pace of an operation or operations in terms of
equipment usage—aircraft 'flying hours,' ship 'steaming days,' or 'tank (driving)
miles'" [9]. Consistent with the Defense Department's definition, this research uses both
the number of aircraft and the number of flying hours as surrogate measures of Air Force
mission requirements.
This research also uses fiscal years based on the supposition that each subsequent
budget is based primarily from previous year's requirements.
4.2.2. Data
To accomplish the task of building descriptive models, historical budgets for
fiscal years 1960 - 2000 were obtained from the Automated Budget Interactive Data
Environment System (ABIDES) database. To overcome current-year dollar distortion
and to allow for year-to-year comparisons, the fiscal data was recalculated into constant
fiscal year 2001 dollars.
In the absence of an all inclusive database for both fiscal and explanatory
variables, the annual Almanac editions of the Air Force Magazine, from May 1973 -
2000, were used to create a database of major installations, active duty Air Force
members, number of aircraft, and number of flying hours. In the five instances where
data were missing (4 years for flying hours and 1 year for number of aircraft), we used
mathematical interpolation to estimate the values.
27
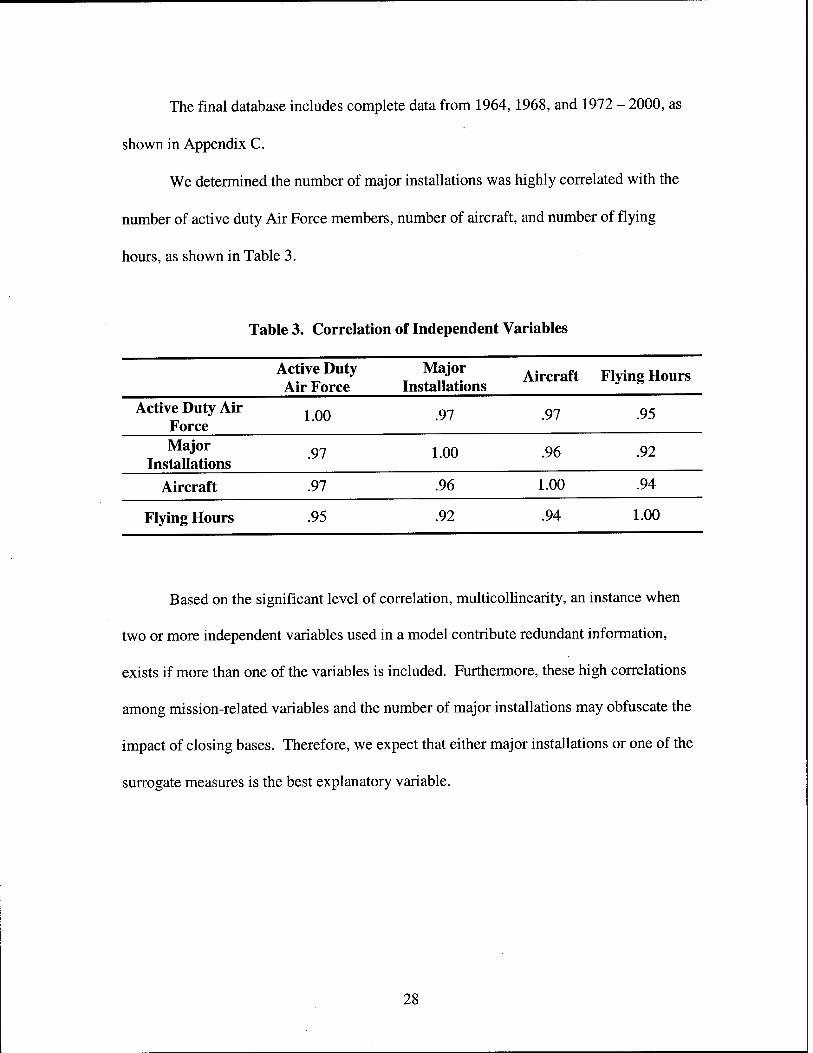
The final database includes complete data from 1964, 1968, and 1972 - 2000, as
shown in Appendix C.
We determined the number of major installations was highly correlated with the
number of active duty Air Force members, number of aircraft, and number of flying
hours, as shown in Table 3.
Table 3. Correlation of Independent Variables
Active Duty Major Aircraft F1 t Hours
Air Force Installations Active Duty Air
Force 1.00 .97 .97 .95
Major Installations
.97 1.00 .96 .92
Aircraft .97 .96 1.00 .94
Flying Hours .95 .92 .94 1.00
Based on the significant level of correlation, multicollinearity, an instance when
two or more independent variables used in a model contribute redundant information,
exists if more than one of the variables is included. Furthermore, these high correlations
among mission-related variables and the number of major installations may obfuscate the
impact of closing bases. Therefore, we expect that either major installations or one of the
surrogate measures is the best explanatory variable.
28

Based on the identified variables and the available data, the proposed model
relating the appropriation budgets to the independent variable, major installations or one
of the mission level surrogate variables, is
y = ßo + ßiXi + ß2x2+£
where
y = appropriation for the respective budget
xi = fiscal year
x2 = number of major installations or surrogate mission requirement variable
s = error term
4.3. Final Results
For each of Air Force's appropriations, to include the overall total, the budgets
were regressed on major installations. Subsequently, the appropriations were regressed
with each of the surrogate measures—active duty Air Force members, number of aircraft,
and number of flying hours—to determine which one provided the best fit; "best" defined
as the highest coefficient of determination, or R2 statistic. Finally, we compare the
regression of the respective budgets based on major installations and the best regression
based on surrogate mission-level variable to determine which model provides a better fit
to the budget data.
It is important to note that variables with negative coefficients or those with a p-
value of more than .05 were determined to be "statistically insignificant."
29

4.3.1. Operations and Maintenance Appropriation
We regressed the Operations and Maintenance (O&M) appropriation
budget with fiscal years and major installations. The Excel regression routine produced
the results shown in Table 4 and Figure 2.
Table 4. O&M Regression Results (FY-Major Installations)
Regression Statistics Multiple R 0.7346586
R Square 0.5397233 Adjusted R Square 0.5068463 Standard Error 2.312E+09 Observations 31
Coefficients Standard Error P-value Intercept -1.05E+12 1.97E+11 1.07E-05 FY 533906490 97470776 7.53E-06 Major 176971606 31326628 4.72E-06
$40,000,000,000
$35,000,000,000
$30,000,000,000
</>■ $25,000,000,000
O $20,000,000,000
U. $15,000,000,000
$10,000,000,000
$5,000,000,000
$0 •<tcM-'*coa>oc'a->tcD929£'2t-_~,_ CDh-h*r^h-OOCOCOGOCOO)05050)050 0>0>0)00><J>0>00><J>0>0)0>0>0>0
Fiscal Year
•Actual FY-MAJ
Figure 2. O&M Appropriation regressed by FY and Major Installations
30

As indicated by the R2 statistic, this model accounts for 54.0 percent of the
variability within the O&M budget. The coefficients indicate that each fiscal year the
O&M budget increases by $533.9 million (in fiscal year 2001 dollars) and the average
budget per major installation is $177.0 million (in fiscal year 2001 dollars). Based on
these results, an argument could be made that closing bases saves fiscal resources.
We also regressed the O&M appropriation budget with fiscal years and all of the
surrogate measures for the Air Force mission—active duty Air Force members provided
the best fit as indicated by the R2 statistic. The Excel regression routine produced the
results shown in Table 5 and Figure 3.
Table 5. O&M Regression Results (FY-ADAF)
Regression Statistics Multiple R 0.7978287 R Square 0.6365306 Adjusted R Square 0.6105685 Standard Error 2.054E+09 Observations 31
Coefficients Standard Error P-value Intercept -1.3E+12 1.95E+11 3.36E-07 FY 653766989 96607532 2.38E-07 ADAF 48986.641 7080.094 1.61E-07
31

$40,000,000,000
$35,000,000,000
$30,000,000,000
<ä- $25,000,000,000
O $20,000,000,000
LL $15,000,000,000
$10,000,000,000
$5,000,000,000
$0
^^^^^J^k^t
■*c\i"*cocooc\i-'*coooo2J'tfcgcog coNi^-h-r^coooa3coooo505cn030)0 0)0>0>0>0>050>CDO>0>0503CnO>0)0
Fiscal Year
Actual FY-ADAF FY-MAJ
Figure 3. O&M Appropriation regressed by FY and ADAF
As indicated by the R2 statistic, this model accounts for 63.7 percent of the
variability within the O&M budget. The coefficients indicate that each fiscal year the
O&M budget increases by $653.8 million (in fiscal year 2001 dollars) and each Air Force
member contributes an average of $49.0 thousand (in fiscal year 2001 dollars) to the
budget.
The results illustrate a stronger correlation between the O&M budget and the
number of active duty Air Force members when compared to the relation between the
numbers of major installations. Furthermore, this analysis supports the idea that reducing
the number of active duty Air Force members, as opposed to closing major installations,
is the impetus for saving O&M expenses.
32

4.3.2. Military Construction Appropriation
We regressed the Military Construction (MILCON) appropriation budget with
fiscal years and major installations. The Excel regression routine produced the results
shown in Table 6 and Figure 4.
Table 6. MILCON Regression Results (FY-Major Installations)
Regression Statistics Multiple R 0.500899 R Square 0.2509 Adjusted R Square 0.197393 Standard Error 4.95E+08 Observations 31
Coefficients Standard Error P-value Intercept -5.7E+10 4.23E+10 0.191972 FY 28177578 20889770 0.188188 Major 16384385 6713869 0.021256
$3,000,000,000
$2,500,000,000
^ $2,000,000,000
O $1,500,000,000
"■ $1,000,000,000
$500,000,000
$0 TfCM-tCOOOOCg^tDCOOOjTfCDOOO cDNi^h-h-oocooocococnoirocnroo O)0)0)0)0)0)0)0)0)0)0)0>0)0}0>0
Fiscal Year
■Actual FY-MAJ
Figure 4. MILCON Appropriation regressed by FY and Major Installations
33
As indicated by the R2 statistic, this model accounts for 25.1 percent of the
variability within the MILCON budget. The coefficients indicate that each fiscal year the
MILCON budget increases by $28.2 million (in fiscal year 2001 dollars) and the average
budget per major installation is $16.4 million (in fiscal year 2001 dollars). Based on
these results, an argument could be made that closing bases saves fiscal resources. (Note:
As indicated by the p-values for the intercept and fiscal year, this regression model is
significantly insignificant; however, it is presented to compare with the results of the
model using the surrogate measure.)
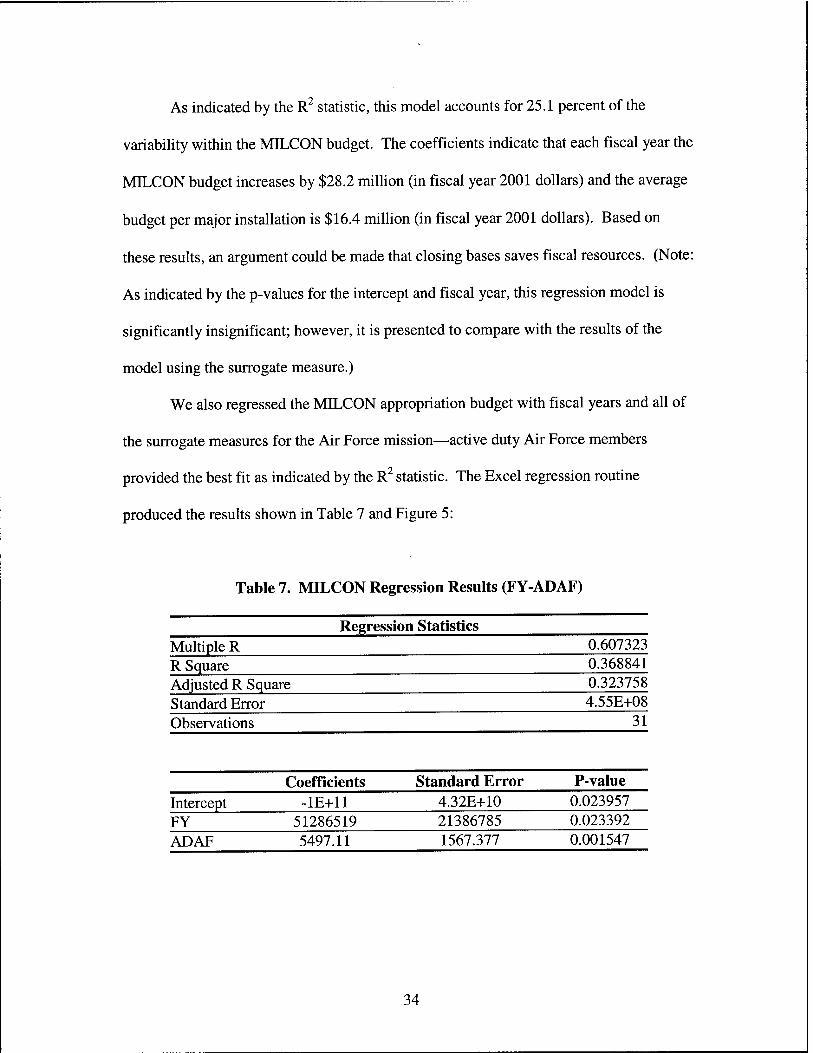
We also regressed the MILCON appropriation budget with fiscal years and all of
the surrogate measures for the Air Force mission—active duty Air Force members
provided the best fit as indicated by the R2 statistic. The Excel regression routine
produced the results shown in Table 7 and Figure 5:
Table 7. MILCON Regression Results (FY-ADAF)
Regression Statistics Multiple R 0.607323 R Square 0.368841 Adjusted R Square 0.323758 Standard Error 4.55E+08 Observations 31
Coefficients Standard Error P-value Intercept -1E+11 4.32E+10 0.023957 FY 51286519 21386785 0.023392 ADAF 5497.11 1567.377 0.001547
34

$3,000,000,000
$2,500,000,000
in $2,000,000,000
O $1,500,000,000
^ $1,000,000,000
$500,000,000
$0 1 V i—i—i—r"~i—i ii—rr i i—i—r- -r-T—l'""'"l 'i—i—r- *tC\l"*COCDOOU''*COCOOOJ'*COCOO (Oi^h-r^.r^-oooococoooo5a>05cng>o o>o)o>a>o>c)050>coo505cno>050)o
Fiscal Year
■ Actual FY-ADAF FY-MAJ
Figure 5. MILCON Appropriation regressed by FY and ADAF
As indicated by the R2 statistic, this model accounts for 36.9 percent of the
variability within the MILCON budget. The coefficients indicate that each fiscal year the
MILCON budget increases by $51.3 million (in fiscal year 2001 dollars) and each Air
Force member contributes an average of $5.5 thousand (in fiscal year 2001 dollars) to the
budget. Ultimately, this analysis supports the assumption that BRAC does not save
MILCON expenses; reducing the number of active duty Air Force members does.
4.3.3. Military Personnel Appropriation
We regressed the Military Personnel (Mil Pers) appropriation budget with fiscal
years and major installations. The Excel regression routine produced the results shown in
Table 8 and Figure 6.
35
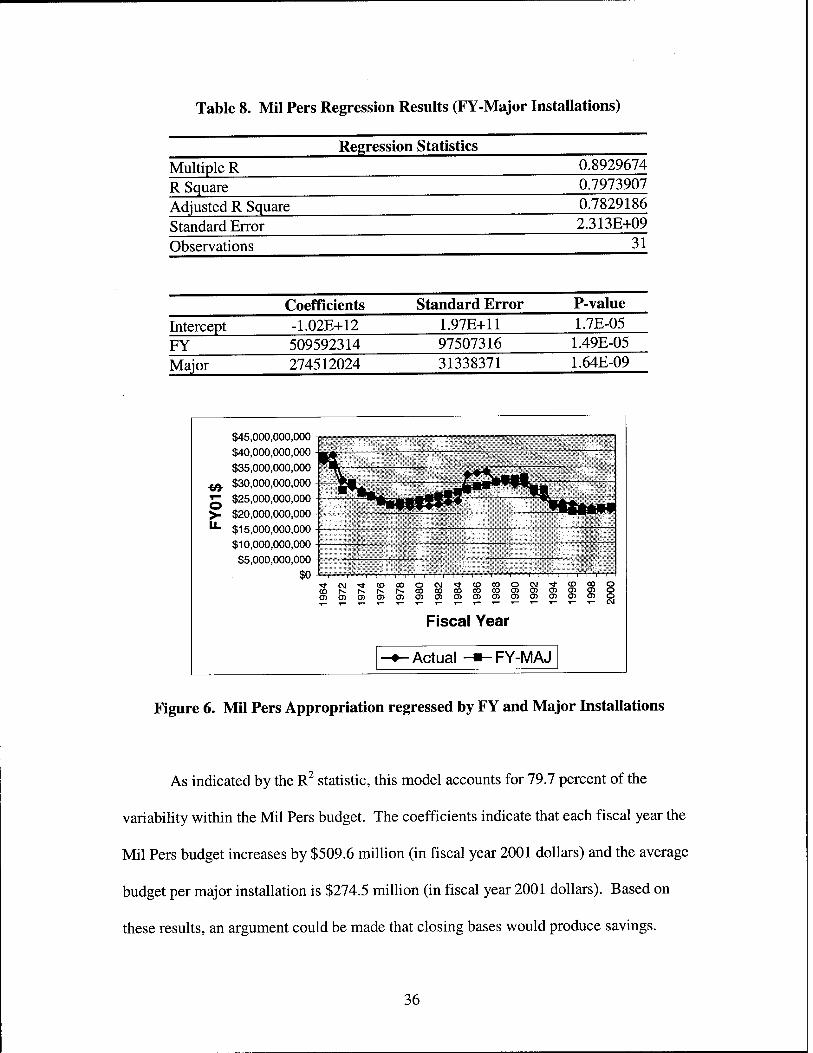
Table 8. Mil Pers Regression Results (FY-Major Installations)
Regression i Statistics Multiple R 0.8929674
R Square 0.7973907
Adiusted R Square 0.7829186
Standard Error 2.313E+09
Observations 31
Coefficients Standard Error P-value Intercept -1.02E+12 1.97E+11 1.7E-05 FY 509592314 97507316 1.49E-05
Major 274512024 31338371 1.64E-09
$45,000:
$40,000:
$35,000:
M $30,000
g $25,000
>- $20,000
"- $15,000
$10,000
$5,000
,000,000
000,000
000,000
000,000
000,000
000,000
000,000
,000,000
,000,000
$0 ■<tcM'sttDoooc\i'*coooocg'*CDooo cDh-h-h-r^-oococococoooaiooo o5050)o>aicno5cno5cna)05CDO>050
Fiscal Year
Actual -«-FY-MAJ
Figure 6. Mil Pers Appropriation regressed by FY and Major Installations
As indicated by the R2 statistic, this model accounts for 79.7 percent of the
variability within the Mil Pers budget. The coefficients indicate that each fiscal year the
Mil Pers budget increases by $509.6 million (in fiscal year 2001 dollars) and the average
budget per major installation is $274.5 million (in fiscal year 2001 dollars). Based on
these results, an argument could be made that closing bases would produce savings.
36
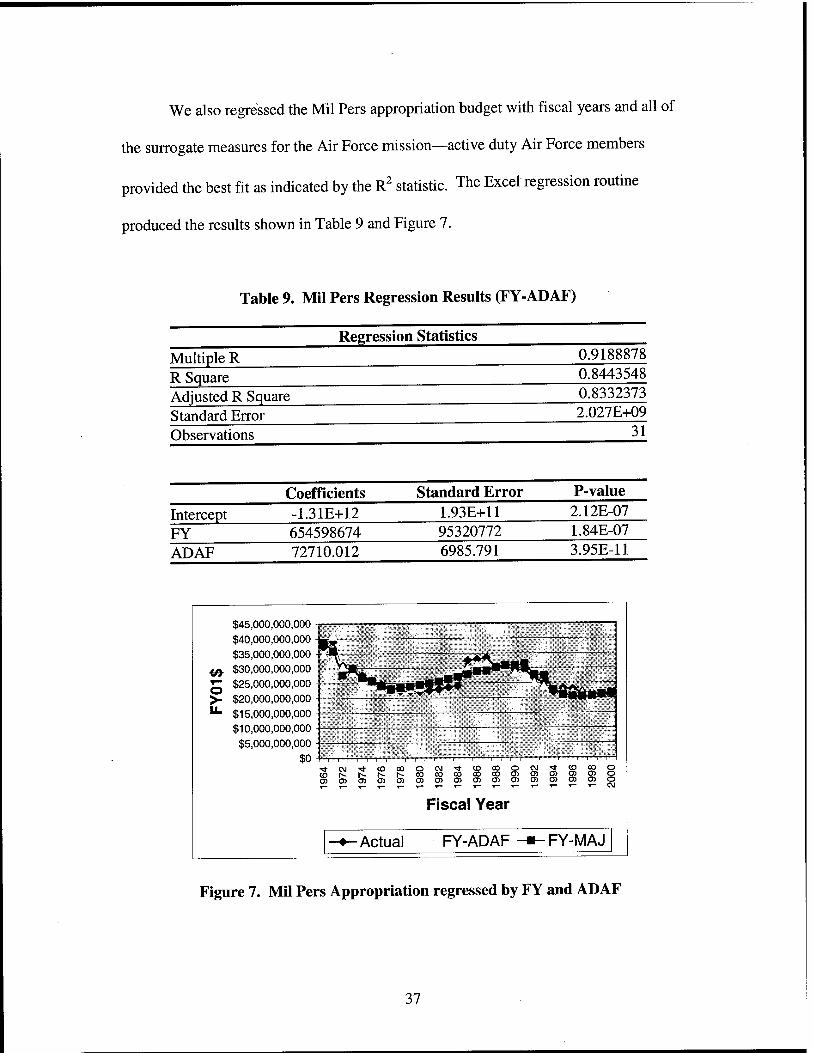
We also regressed the Mil Pers appropriation budget with fiscal years and all of
the surrogate measures for the Air Force mission—active duty Air Force members
provided the best fit as indicated by the R2 statistic. The Excel regression routine
produced the results shown in Table 9 and Figure 7.
Table 9. Mil Pers Regression Results (FY-ADAF)
Multiple R R Square Adjusted R Square Standard Error Observations
Regression Statistics 0.9188878 0.8443548 0.8332373 2.027E+09
31
Intercept FY ADAF
Coefficients -1.31E+12 654598674 72710.012
Standard Error 1.93E+11 95320772 6985.791
P-value 2.12E-07 1.84E-07 3.95E-11
$45,000,000,000
$40,000,000,000
$35,000,000,000
<ß. $30,000,000,000 5 $25,000,000,000
>- $20,000,000,000
"" $15,000,000,000
$10,000,000,000
$5,000,000,000 $0
\
Ttcvi'tfcocoocM-tftDcgocy^cDcog
0)0)0)0)0)0)010)010)0)010)0)0)0
Fiscal Year
■Actual FY-ADAF -m- FY-MAJ
Figure 7. Mil Pers Appropriation regressed by FY and ADAF
37

As indicated by the R2 statistic, this model accounts for 84.4 percent of the
variability within the Mil Pers budget. The coefficients indicate that each fiscal year the
Mil Pers budget increases by $654.6 million (in fiscal year 2001 dollars) and each Air
Force member contributes an average of $72.7 thousand (in fiscal year 2001 dollars) to
the budget. Our analysis supports the premise that reducing the number of active duty
Air Force members, as opposed to BRAC, saves Mil Pers expenses.
4.3.4. Military Family Housing Appropriation
We regressed the Military Family Housing appropriation budget with fiscal years
and major installations. The Excel regression routine produced the results shown in
Table 10 and Figure 8.
Table 10. Family Housing Regression Results (FY-Major Installations)
Multiple R R Square
Standard Error Observations
Regression Statistics
Adjusted R Square
0.909255 0.826744 0.814369 1.73E+08
31
Coefficients Standard Error P-value Intercept -1.2E+11 1.48E+10 1.58E-08 FY 58270119 7313738 1.12E-08 Major 7885578 2350599 0.002295
38

$1,600,000,000 -,
$1,400,000,000
$1,200,000,000
<a- $1,000,000,000
O $800,000,000
U. $600,000,000
$400,000,000
$200,000,000
$0 ""I" I 'I I I" I
Ttc\i'«tcDcoocM^,ioeooe\i5£toogo cor^-h-h-i^-oooooocococncDCBcngjo o>050)0500)cno>050505aiO)05CDo
Fiscal Year
■ Actual FY-MAJ
Figure 8. Family Housing Appropriation regressed by FY and Major Installations
As indicated by the R2 statistic, this model accounts for 82.7 percent of the
variability within the Family Housing budget. The coefficients indicate that each fiscal
year the Family Housing budget increases by $58.3 million (in fiscal year 2001 dollars)
and the average budget per major installation is $7.9 million (in fiscal year 2001 dollars).
Based on these results, an argument could be made that closing bases saves fiscal
resources.
We also regressed the Family Housing appropriation budget with fiscal years and
all of the surrogate measures for the Air Force mission—active duty Air Force members
provided the best fit as indicated by the R2 statistic. The Excel regression routine
produced the results shown in Table 11 and Figure 9.
39
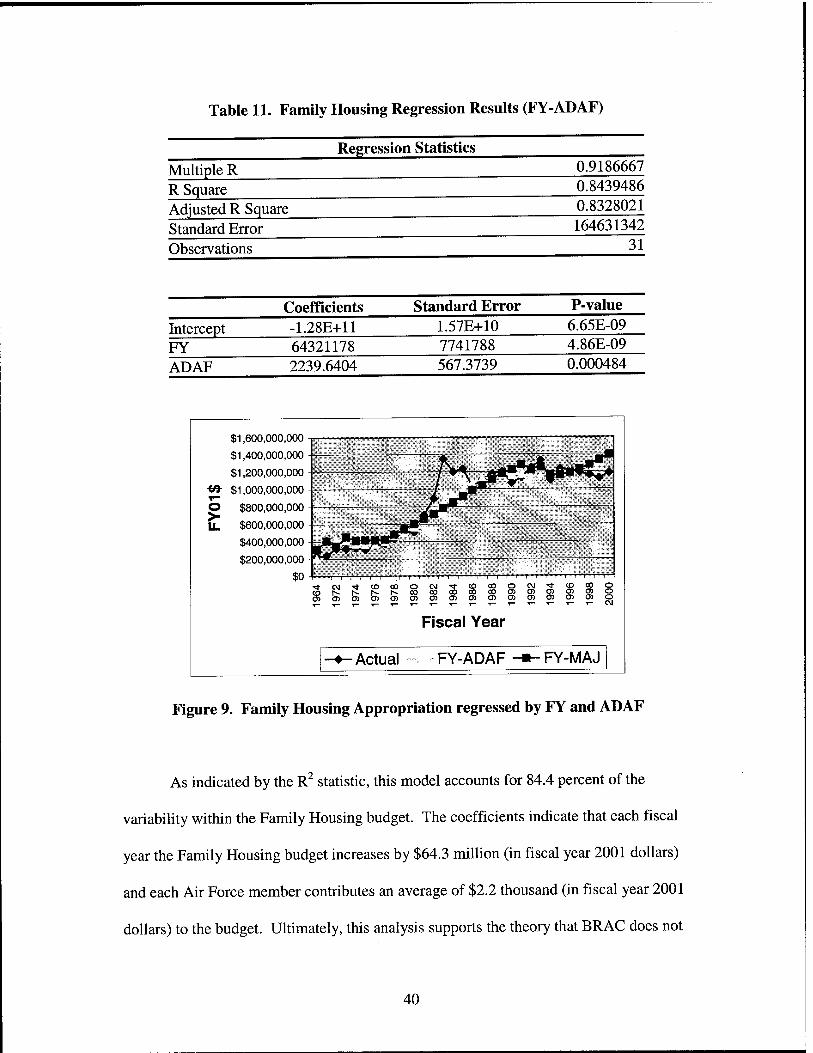
Table 11. Family Housing Regression Results (FY-ADAF)
Multiple R R Square
Standard Error Observations
Regression Statistics
Adjusted R Square
0.9186667 0.8439486 0.8328021 164631342
31
Intercept FY ADAF
Coefficients -1.28E+11 64321178 2239.6404
Standard Error 1.57E+10 7741788 567.3739
P-value 6.65E-09 4.86E-09 0.000484
$1,600,000,000
$1,400,000,000
$1,200,000,000
<& $1,000,000,000
O $800,000,000
U_ $600,000,000
$400,000,000
$200,000,000
tJ-CMTtCDOOOCJtCDOOOCy^ftgCOO O)o>05cno50>0)05050>0505cncoo>o
Fiscal Year
■Actual FY-ADAF FY-MAJ
Figure 9. Family Housing Appropriation regressed by FY and ADAF
As indicated by the R2 statistic, this model accounts for 84.4 percent of the
variability within the Family Housing budget. The coefficients indicate that each fiscal
year the Family Housing budget increases by $64.3 million (in fiscal year 2001 dollars)
and each Air Force member contributes an average of $2.2 thousand (in fiscal year 2001
dollars) to the budget. Ultimately, this analysis supports the theory that BRAC does not
40

save Family Housing expenses, reducing the number of active duty Air Force members
does.
4.3.5. Research and Development Appropriation
We regressed the Research and Development (R&D) appropriation budget with
fiscal years and major installations. The Excel regression routine produced the results
shown in Table 12 and Figure 10.
Table 12. R&D Regression Results (FY-Major Installations)
Regression Statistics Multiple R 0.776318 R Square 0.60267 Adjusted R Square 0.57429 Standard Error 2.27E+09 Observations 31
Coefficients Standard Error P-value Intercept -1.2E+12 1.93E+11 5.73E-07 FY 6.21E+08 95525092 4.77E-07 Major 1.84E+08 30701294 1.86E-06
41

1— o >
$25,000,000,000
$20,000,000,000
$15,000,000,000
$10,000,000,000
$5,000,000,000
"T i i i'T'i i i i—r ( i i i i—r-r—i TtCM-tfCOCOOCM'tfCOCOOOJ^COOOO
050>CDOJO>a30>cno3cncncncno>cno
Fiscal Year
•Actual -«-FY-MAJ
Figure 10. R&D Appropriation regressed by FY and Major Installations
As indicated by the R2 statistic, this model accounts for 60.3 percent of the
variability within the R&D budget. The coefficients indicate that each fiscal year the
R&D budget increases by $621.3 million (in fiscal year 2001 dollars) and the average
budget per major installation is $184.0 million (in fiscal year 2001 dollars). Based on
these results, an argument could be made that closing bases saves fiscal resources.
We also regressed the R&D appropriation budget with fiscal years and all of the
surrogate measures for the Air Force mission—active duty Air Force members provided
the best fit as indicated by the R2 statistic. The Excel regression routine produced the
results shown in Table 13 and Figure 11.
42

Table 13. R&D Regression Results (FY-ADAF)
Multiple R R Square
Standard Error Observations
Regression Statistics
Adjusted R Square
0.865066 0.748339 0.730364 1.8E+09
31
Intercept FY ADAF
Coefficients -1.5E+12 7.73E+08 53067.07
Standard Error 1.71E+11 84793339 6214.265
P-value 8.66E-10 7.21E-10 2.78E-09
$25,000,000,000
$20,000,000,000
%£ $15,000,000,000 o ^ $10,000,000,000
$5,000,000,000
$0 ■"tc\j--*<ocooc\i"*(Dcooc\!2tg>coo (Ds.i^.i^h-cocococococnroocngjo o>cno>05C7>0505cncnc)a5030>cno50
Fiscal Year
■ Actual FY-ADAF FY-MAJ
Figure 11. R&D Appropriation regressed by FY and ADAF
As indicated by the R2 statistic, this model accounts for 74.8 percent of the
variability within the R&D budget. The coefficients indicate that each fiscal year the
R&D budget increases by $772.6 million (in fiscal year 2001 dollars) and each Air Force
member contributes an average of $53.1 thousand (in fiscal year 2001 dollars) to the
budget. Consistent with the results from the other appropriations, this analysis supports
43

the idea that reducing the Air Force mission, as defined by the surrogate measure, saves
R&D expenses rather than closing major installations.
4.3.6. Procurement Appropriation
We regressed the Procurement appropriation budget with fiscal years and major
installations. The Excel regression routine produced the results shown in Table 14 and
Figure 12.
Table 14. Procurement Regression Results (FY-Major Installations)
Regression t Statistics Multiple R 0.5964457 R Square 0.3557474 Adjusted R Square 0.3097294 Standard Error 9.728E+09 Observations 31
Coefficients Standard Error P-value Intercept -2.22E+12 8.3E+11 0.012372 FY 1.1E+09 4.1E+08 0.012141 Major 486120971 1.32E+08 0.000964
44

$60,000,000,000
$50,000,000,000
$40,000,000,000 <fr O $30,000,000,000
"" $20,000,000,000 - —
$10,000,000,000
$0 TtC\l''*COOOOC\l'tCOCOO(NTf-<0000 CDt^c-r^-h-cooocooococncncncDgjo O>0>00>0>0>0)050>050>0>05050>0 T-Y-T-T-T-T-T-l-T-T-l-T-T-T-f-CM
Fiscal Year
■Actual FY-MAJ
Figure 12. Procurement Appropriation regressed by FY and Major Installations
As indicated by the R2 statistic, this model accounts for 35.6 percent of the
variability within the Procurement budget. The coefficients indicate that each fiscal year
the Procurement budget increases by $1.1 billion (in fiscal year 2001 dollars) and the
average budget per major installation is $486.1 million (in fiscal year 2001 dollars).
Based on these results, an argument could be made that closing bases saves fiscal
resources.
We also regressed the Procurement appropriation budget with fiscal years and all
of the surrogate measures for the Air Force mission—active duty Air Force members
provided the best fit as indicated by the R2 statistic. The Excel regression routine
produced the results shown in Table 15 and Figure 13.
45

Table 15. Procurement Regression Results (FY-ADAF)
Regression t Statistics Multiple R 0.75049717
R Square 0.56324601
Adjusted R Square 0.53204929
Standard Error 8009329955
Observations 31
Coefficients Standard Error P-value
Intercept -3.513E+12 7.62E+11 8E-05
FY 1739855078 3.77E+08 7.85E-05
ADAF 159440.649 27602.79 3.35E-06
$60,000,000,000 - Jk
$50,000,000,000 - «* A ^ $40,000,000,000 -
> /->•% O $30,000,000,000 -
r^^v**«-™11^ ""-i11«-™«»" °- $20,000,000,000 - *%^**^ ^ip**
$10,000,000,000 -
Tj-CM^COOOOOJ^CDOOOOJ-tfCDCOO <or^h-i^-r^cooocococoo)o>a>a>a>o
Fiscal Year
-♦-Actual FY-ADAF -«-FY-MAJ
Figure 13. Procurement Appropriation regressed by FY and ADAF
As indicated by the R2 statistic, this model accounts for 56.3 percent of the
variability within the Procurement budget. The coefficients indicate that each fiscal year
the Procurement budget increases by $1.7 billion (in fiscal year 2001 dollars) and each
Air Force member contributes an average of $159.4 thousand (in fiscal year 2001 dollars)
46

to the budget. This analysis supports our claim that BRAC does not save Procurement
expenses, reducing the Air Force mission does.
4.3.7. Total Air Force Appropriation
We regressed the total Air Force appropriation budget with fiscal years and major
installations. The Excel regression routine produced the results shown in Table 16 and
Figure 14.
Table 16. Total Air Force Regression Results (FY-Major Installations)
Regression i Statistics Multiple R 0.739483 R Square 0.546835 Adjusted R Square 0.514466 Standard Error 1.32E+10 Observations 31
Coefficients Standard Error P-value Intercept -6.2E+12 1.13E+12 7.43E-06 FY 3.1E+09 5.57E+08 6.02E-06 Major 1.03E+09 1.79E+08 3.81E-06
47

$160,000,000,000
$140,000,000,000
$120,000,000,000
</>■ $100,000,000,000
O $80,000,000,000 >- U_ $60,000,000,000
$40,000,000,000
$20,000,000,000
$0 ^■CM"«t(OCOOCM^<OeoOCM^,<Oogo cDr^-r^h-r^oocooococoo>o>o>0505o O5050>050>0)0>030)0>0>0>050)050 1--I-f-1-T-T-^--*-1-T-^-1-T-1-1-OJ
Fiscal Year
■ Actual FY-MAJ
Figure 14. Total Air Force Appropriation regressed by FY and Major Installations
As indicated by the R2 statistic, this model accounts for 54.9 percent of the
variability within the total Air Force budget. The coefficients indicate that each fiscal
year the Total budget increases by $3.1 billion (in fiscal year 2001 dollars) and the
average budget per major installation is $1.0 billion (in fiscal year 2001 dollars). Based
on these results, an argument could be made that closing bases saves fiscal resources.
We also regressed the total Air Force appropriation budget with fiscal years and
all of the surrogate measures for the Air Force mission—active duty Air Force members
provided the best fit as indicated by the R2 statistic. The Excel regression routine
produced the results shown in Table 17 and Figure 15.
48

Table 17. Total Air Force Regression Results (FY-ADAF)
Regression Statistics Multiple R 0.898113
R Square 0.806607
Adjusted R Square 0.792793
Standard Error 8.64E+09 Observations 31
Coefficients Standard Error P-value Intercept -8.5E+12 8.21E+11 5.03E-11 FY 4.22E+09 4.06E+08 4.01E-11 ADAF 318481 29761.37 2.11E-11
$160,000,000,000
$140,000,000,000
$120,000,000,000
</> $100,000,000,000
O $80,000,000,000
U. $60,000,000,000
$40,000,000,000
$20,000,000,000
$0-f
%^^>-^
Tl-CM^tCOCOOOJ^ttDOOOOJTj-CDOOO cor^h*-h*r^oooooocoooo>a)a>a>o>o T-^T-I-I-I-I-I-T-I-I-T-T-I-T-CM
Fiscal Year
• Actual FY-ADAF FY-MAJ
Figure 15. Total Air Force Appropriation regressed by FY and ADAF
As indicated by the R2 statistic, this model accounts for 80.7 percent of the
variability within the total Air Force budget. The coefficients indicate that each fiscal
year the Total budget increases by $4.2 billion (in fiscal year 2001 dollars) and each Air
Force member contributes an average of $318.5 thousand (in fiscal year 2001 dollars) to
the budget. Ultimately, this analysis supports the theory that curtailing the Air Force
mission is the driving factor behind reducing the budget rather than BRAC.
49

4.4. Summary
Based on the results of the regression models, summarized in Table 18 and
presented in detail in Appendices D-J, there is significant evidence that the mission
requirement surrogate measure, active duty Air Force members, serves as a better
explanatory variable for the respective appropriation budgets and the overall Air Force
budget when compared to the number of major installations. This conclusion would
refute the idea that closing bases, in and of themselves, is the impetus for generating
substantial savings.
Table 18. Summary of Regression Analyses
MAJOR INSTALLATION MODEL Coefficients (in millions)
Appropriation Intercept FY Major R2
O&M -$1,054,762.0 $533.9 $177.0 54.0%
MILCON -$56,500.1 $28.2 $16.4 25.1% Mil Pers -$1,021,363.9 $509.6 $274.5 79.7% Family Housing -$115,830.9 $58.3 $7.9 82.7% R&D -$1,243,340.5 $621.3 $184.0 60.3% Procurement -$2,218,359.4 $1,099.9 $486.1 35.6%
Total .-$6,181,316.8 $3,098.8 $1,026.2 54.7%
ACTIVE DUTY AIR FORCE MODEL Coefficients (in millions)
Appropriation Intercept FY ADAF R2
O&M -$1,296,390.0 $653.8 $0.0490 63.7% MILCON -$103,245.2 $51.3 $0.0055 36.9% Mil Pers -$1,313,140.2 $654.6 $0.0727 84.4% Family Housing -$128,038.8 $64.3 $0.0022 84.4%
R&D -$1,548,604.6 $772.6 $0.0531 74.8% Procurement -$3,512,591.0 $1,739.9 $0.1594 56.3% Total -$8,454,866.8 $4,223.8 $0.3185 80.7%
50

We further deduce that substantial savings can be generated when the Air Force
reduces its mission, and the reduction in mission requirements promotes reducing the
number of active duty Air Force members; we do not expect transferring requirements to
civilian employees or contractors would constitute a reduction in the mission. This
reduction in the number of active duty Air Force members due to a scaled-down mission
would support the argument for additional rounds of BRAC. We test this supposition by
regressing major installations with the number of active duty Air Force members. Tne
Excel regression routine produced the results shown in Table 19 and Figure 16; the
detailed results are presented in Appendix K.
Table 19. ADAF and Major Installation Regression Results
Regression Statistics Multiple R 0.968159 R Square 0.937333 Adjusted R Square 0.903999 Standard Error 7.506573 Observations 31
Coefficients Standard Error P-value Intercept 0 #N/A #N/A ADAF 0.000238 2.36E-06 1.64E-39
51

250
(A 200 C o V 150
« 100 CO c — 50
(0 0
V ■"tca^tCD00O(M->tCDC0O2ISCD00O cor>-h-r--r>-cooooooocoo50)o>gjg30 C7>050>050>o>o>cna>c3>03050>o)cno
Fiscal Year
■Actual -»-Predicted
Figure 16. Major Installations regressed by ADAF
As indicated by the R2 statistic, this model accounts for 93.7 percent of the
variability within the number of major installations. The coefficient indicates that each
active duty Air Force member accounts for .000238 of a major installation—in other
words, approximately 4202 active duty Air Force members would make up one major
installation. We can conclude that a reduction in the mission resulting in the elimination
of approximately 4202 active duty Air Force members would support the closure of one
major installation.
The Air Force decreased from 576,446 active duty members in fiscal year 1988 to
357,777 airmen in fiscal year 2000. This reduction of 218,669 members constitutes a
37.9 percent decrease. During this same period, the number of major installations
decreased from 140 to 87, which is also a 37.9 percent reduction. Under the assumption
that the number of active duty Air Force members determines the number of major
installations, the Air Force has already closed the appropriate number of major
installations.
52

5. Conclusions
5.1. Summary of Research
We analyzed the savings resulting from the previous four rounds of BRAC in
terms of their affect on each of the budget appropriations. For each appropriation, while
the number of major installations initially appears to be a significant determinant in
explaining the change in the budget, the number of bases becomes insignificant if a
surrogate for Air Force mission requirements is included as the explanatory variable. We
tested three surrogate measures for mission requirements: number of flying hours,
number of aircraft, and number of active duty personnel. In each case, we found the
number of active duty Air Force members to be a better predictor of the budget level than
the regression model that included the number of major installations. We conclude that
mission requirements are a better indicator of the required funding than the number of
major installations.
Additionally, we analyzed the statistical relationship between the number of
major installations and the number of active duty Air Force members. We found that the
number of active duty Air Force members is an excellent predictor for the number of
major installations—on average, 4,202 active duty Air Force members would equate to
one major installation.
5.2. Suggestions for Further Research
We present four topics for potential future investigation.
53

5.2.1. Effects of Other Variables
Subsequent research on the costs and savings derived from BRAC may consider
other dependent variables. Some additional potential influences may be the effects of
flying vs. non-flying wings (particularly space oriented units), major vs. minor
installations, the number of aircraft by type (fighter, bomber, cargo), and the number of
Guard and Reserve Personnel. These mission-related variables, or a combination of
them, may provide better indications of the Air Force mission requirements.
5.2.2. Impact of Competitive Sourcing
The 1999 FYDP was the first to reflect savings from DoD's Defense Reform Initiative (DRI). The intention of the DRI was to change how DoD does business internally and with the private sector. The DRI has four basic tenets: (1) reduce excess infrastructure and redundancies, (2) adopt modern business practices to achieve world class standards of performance and continue to reform the acquisition process, (3) streamline organizations to remove redundancies and maximize synergy, and (4) expand the use of competition between the public and private sectors to improve performance and reduce the cost of DoD business and support activities. Quantifiable long-term savings to pay for future modernization have been estimated for only two initiatives: public/private competitions (competitive sourcing) and base realignment and closures [11:32-33].
It is conceivable that as DoD exercises the option to competitively source
traditionally organic functions, and those functions are carried out at the contractors'
facilities, military and civilian positions may be eliminated and provide additional
opportunities to close military installations.
5.2.3. Impact of Interservice BRAC Actions
As noted by the SAF/FMC report, savings attributed to Air Force personnel cuts
averaged 86.7 percent of the total BRAC savings—the ratio increased from 78 percent in
BRAC 88 to 99 percent in BRAC 95 [1:7]. "By contrast actual dollar amounts for non-
personnel savings in each BRAC round decline from a high of $403 million in BRAC 91
54
to just $7 million in BRAC 95. Should relatively large personnel savings of the past not
reoccur in the future, then it would remain to be seen how the Air Force would achieve
necessary savings to offset likely closure costs" [1:7]. The report further argues "future
rounds of BRAC are more likely to be concentrated in areas other than operational and
training activities, and may be less likely to be accompanied by significant personnel
reductions even in support areas" [1:8].
In line with the SAF/FMC report, the GAO believes future rounds of BRAC will
focus on non-operational installations and savings will have to be attained in the absence
of intraservice personnel cuts. In its 1997 compilation of lessons learned from prior
rounds, the GAO emphasizes the need for interservice BRAC actions in order realize
significant savings from the elimination of any additional excess infrastructure:
Despite these recent BRAC rounds, DoD continues to maintain large amounts of excess infrastructure, especially in its support functions, such as maintenance depots, research and development laboratories, and test and evaluation centers. Each service maintains its own facilities and capabilities for performing many common support functions and, as a result, DoD has overlapping, redundant, and underutilized infrastructure. DoD has taken some steps to demolish unneeded buildings on various operational and support bases; consolidate certain functions; privatize, outsource, and reengineer certain workloads; and encourage interservicing agreements—however, these are not expected to offset the need for additional actions. At the same time, DoD officials recognize that significant additional reductions in excess infrastructure requirements in common support areas could come from consolidating workloads and restructuring functions on a cross-service basis, something that has not been accomplished to any great extent in prior BRAC rounds. [97-151:3]
At the very least, consideration needs to be given to the development of a joint
service position outlining how the services will determine the installations to close and
realign, and the development of a uniform methodology to estimate costs and savings.
55

5.2.4. Facility Thinning
Since the draw down in the 1990s, there has been inverse effect between the
number of people on active duty and the amount of space allocated to per capita within
military units. As the size of the military has decreased, units have spread out and now
consume more space then previously used.
Facility thinning is an initiative to minimize the buildings supported only to those
necessary to accomplish the mission. This effort would identify the amount of space
needed by each unit based on its mission requirements and propose a strategy to eliminate
excess capacity. This would prevent units from sprawling out into vacant spaces that
they do not really need and could result in savings by reducing the financial outlay to
maintain unnecessary buildings.
56
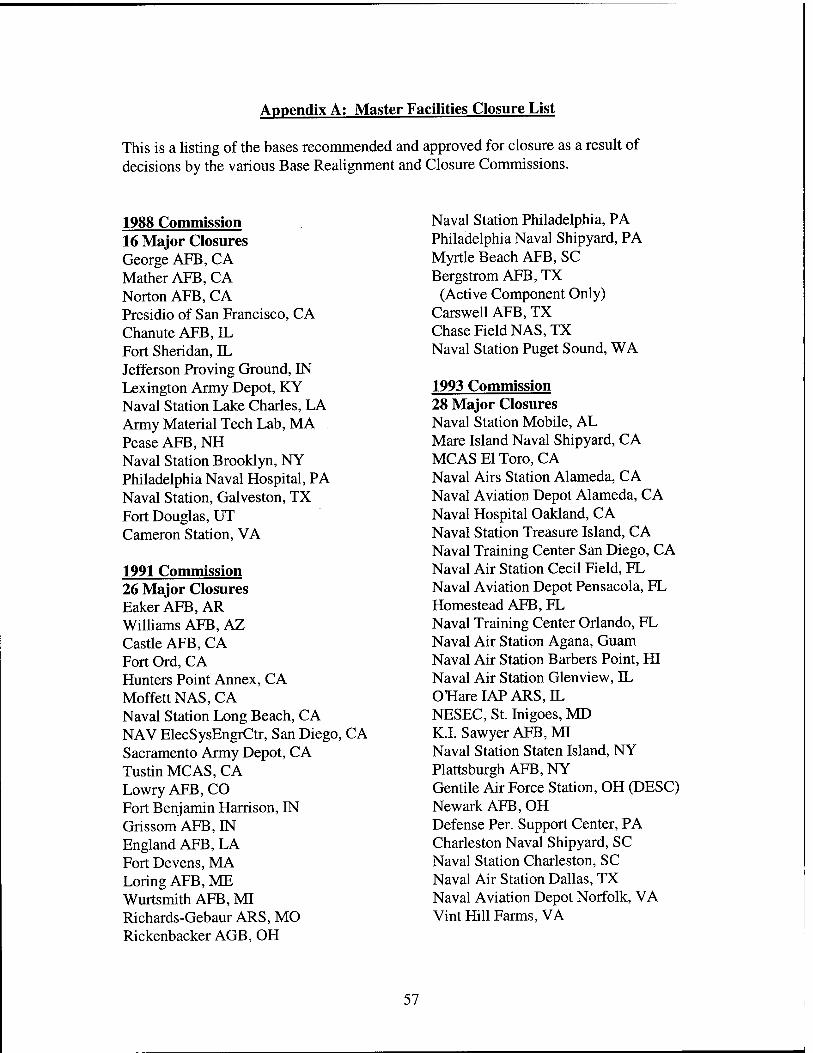
Appendix A: Master Facilities Closure List
This is a listing of the bases recommended and approved for closure as a result of decisions by the various Base Realignment and Closure Commissions.
1988 Commission 16 Major Closures George AFB, CA Mather AFB, CA Norton AFB, CA Presidio of San Francisco, CA Chanute AFB, IL Fort Sheridan, IL Jefferson Proving Ground, IN Lexington Army Depot, KY Naval Station Lake Charles, LA Army Material Tech Lab, MA Pease AFB, NH Naval Station Brooklyn, NY Philadelphia Naval Hospital, PA Naval Station, Galveston, TX Fort Douglas, UT Cameron Station, VA
1991 Commission 26 Major Closures Eaker AFB, AR Williams AFB, AZ Castle AFB, CA Fort Ord, CA Hunters Point Annex, CA Moffett NAS, CA Naval Station Long Beach, CA NAV ElecSysEngrCtr, San Diego, CA Sacramento Army Depot, CA Tustin MCAS, CA Lowry AFB, CO Fort Benjamin Harrison, IN GrissomAFB,IN England AFB, LA Fort Devens, MA Loring AFB, ME Wurtsmith AFB, MI Richards-Gebaur ARS, MO Rickenbacker AGB, OH
Naval Station Philadelphia, PA Philadelphia Naval Shipyard, PA Myrtle Beach AFB, SC Bergstrom AFB, TX
(Active Component Only) Carswell AFB, TX Chase Field NAS, TX Naval Station Puget Sound, WA
1993 Commission 28 Major Closures Naval Station Mobile, AL Mare Island Naval Shipyard, CA MCAS El Toro, CA Naval Airs Station Alameda, CA Naval Aviation Depot Alameda, CA Naval Hospital Oakland, CA Naval Station Treasure Island, CA Naval Training Center San Diego, CA Naval Air Station Cecil Field, FL Naval Aviation Depot Pensacola, FL Homestead AFB, FL Naval Training Center Orlando, FL Naval Air Station Agana, Guam Naval Air Station Barbers Point, HI Naval Air Station Glen view, IL OHare IAP ARS, IL NESEC, St. Inigoes, MD K.I. Sawyer AFB, MI Naval Station Staten Island, NY Plattsburgh AFB, NY Gentile Air Force Station, OH (DESC) Newark AFB, OH Defense Per. Support Center, PA Charleston Naval Shipyard, SC Naval Station Charleston, SC Naval Air Station Dallas, TX Naval Aviation Depot Norfolk, VA Vint Hill Farms, VA
57

1995 Commission 27 Major Closures Naval Air Facility, Adak, AK Fort McClellan, AL Fort Chaffee, AR Fleet Industrial SU Center, Oakland, CA Naval Shipyard, Long Beach, CA McClellan AFB, CA Oakland Army Base, CA Ontario IAP Air Guard Station, CA Fitzsimoms Army Medical Center, CO Ship Repair Facility, Guam Savanna Army Depot Activitym, IL Naval Air Warfare Center, Aircraft Division, Indianapolis, IN NAWC, Crane Division Detachment, Louisville, KY
Naval Air Station, South Weymoth, MA Fort Holabird, MD Fort Ritchie, MD NSWC, Dahlgren Division Detachment, White Oak, MD Bayonne Military Ocean Terminal, NJ Roslyn Air Guard Station, NY Seneca Army Depot, NY Fort Indiantown Gap, PA NAWC, Aircraft Div., Warminster, PA Defense Dist. Depot Memphis, TN Bergstrom Air Reserve Base, TX Resse AFB, TX Defense Distribution Depot Ogden, UT Fort Pickett, VA
Source: http://www.afbca.hq.af.mil/
58

Appendix B: Reclassification of Air Force Installations
The May 1988 Almanac Edition of the Air Force Magazine provides an overview
of the reclassification of Air Force installations:
During 1986, the Air Force undertook a major project to redefine and categorize all Air Force properties and activities to reflect more accurately actual installation posture. The new definitions reclassified all Air Force activities into one of four categories: major installations, minor installations, support sites, and other activities. For an installation to be categorized as "major," it must be operated by an active, Guard, or Reserve unit of group size or larger and have all the organic support to accomplish the unit's mission. Minor installations are facilities operated by active, Guard, or Reserve unit of at least squadron size that do not satisfy all of the criteria for a major installation. Examples of minor installations are Guard and Reserve flying operations that are located at civilian-owned airports. A support site is a detached piece of real property that provides general support to the Air Force mission as opposed to supporting a particular installation. Examples of support sites are missile tracking sites, radar bomb-scoring sites, and radio relay sites. The fourth classification category, other activities, includes Air Force unites that have little or not real-property accountability over the real estate that they occupy. Examples include units that are located on installations belonging to other services or in leased office space that supports recruiting detachments, Civil Air Patrol, etc. The new Air Force classification system is designed to describe accurately the Air Force installation posture. Previously, the Air Force reported more than 2,800 installations worldwide. In reality, the number of independent installations totals only 262: 140 major and 122 minor [6].
59

Appendix C: Regression Database
FY MILPERS O&M Procurement RDT&E 1964 $37,215,906,000 $26,647,748,000 $35,886,820,000 $18,019,293,000 1968 $39,092,780,000 $30,502,299,000 $41,492,628,000 $14,969,920,000 1972 $30,921,673,000 $27,163,356,000 $23,363,788,000 $10,589,253,000 1973 $28,755,657,000 $26,745,299,000 $22,115,232,000 $10,707,981,000 1974 $27,610,967,000 $25,962,312,000 $18,637,627,000 $9,715,385,000 1975 $26,015,162,000 $25,248,013,000 $18,150,296,000 $9,536,990,000 1976 $24,634,324,000 $24,907,580,000 $20,201,298,000 $9,599,185,000 1977 $23,043,264,000 $24,971,361,000 $23,749,846,000 $9,661,179,000 1978 $22,243,234,000 $24,397,199,000 $23,840,116,000 $9,808,748,000 1979 $22,224,196,000 $24,368,006,000 $22,730,159,000 $9,550,275,000 1980 $22,220,006,000 $26,925,996,000 $24,082,380,000 $9,873,948,000 1981 $22,453,190,000 $28,712,300,000 $28,959,506,000 $12,707,086,000 1982 $22,936,378,000 $29,150,632,000 $38,539,190,000 $14,731,775,000" 1983 $23,585,890,000 $30,853,563,000 $42,473,697,000 $16,760,822,000 1984 $24,064,549,000 $31,514,048,000 $52,466,041,000 $18,642,135,000 1985 $32,578,759,000 $32,929,850,000 $56,259,026,000 $19,264,253,000 1986 $32,970,096,000 $32,578,158,000 $50,197,043,000 $18,819,378,000 1987 $33,448,954,000 $31,827,945,000 $44,735,721,000 $20,451,616,000 1988 $30,184,120,000 $33,388,346,000 $35,876,788,000 $19,973,883,000 1989 $30,143,906,000 $34,823,905,000 $38,483,771,000 $18,462,452,000" 1990 $29,227,316,000 $33,410,104,000 $36,444,036,000 $16,701,653,000" 1991 $29,404,567,000 $34,439,792,000 $28,919,019,000 $14,102,189,000" 1992 $26,625,831,000 $26,883,728,000 $26,941,851,000 $15,047,677,000" 1993 $24,933,189,000 $25,942,830,000 $24,168,594,000 $14,448,136,000" 1994 $21,909,736,000 $27,484,712,000 $19,396,263,000 $13,497,356,000 1995 $23,171,517,000 $27,196,084,000 $17,105,493,000 $12,626,141,000 1996 $22,861,516,000 $25,388,936,000 $17,823,062,000 $13,365,262,000 1997 $21,766,355,000 $24,352,930,000 $15,143,239,000 $14,765,572,000 1998 $21,409,451,000 $26,198,275,000 $15,930,479,000 $14,942,030,000 1999 $20,972,712,000 $27,942,990,000 $18,812,967,000 $14,179,402,000 2000 $21,064,642,000 $26,357,344,000 $18,933,160,000 $14,567,219,000
Notes: (1) Shaded cell indicates mathematical interpolation was used to estimate the values. (2) Dollars in constant FY2001
60

FY MILCON Farn. Housing Total 1964 $2,610,949,000 $232,613,000 $120,613,329,000 1968 $2,179,450,000 $239,052,000 $128,476,129,000 1972 $1,082,510,000 $318,279,000 $93,438,859,000
1973 $1,072,636,000 $317,769,000 $89,714,574,000
1974 $1,076,230,000 $327,608,000 $83,330,129,000
1975 $1,260,468,000 $308,772,000 $80,519,701,000
1976 $1,637,654,000 $355,962,000 $81,351,003,000
1977 $1,976,327,000 $376,271,000 $83,837,048,000
1978 $1,240,043,000 $431,718,000 $81,995,658,000
1979 $1,036,763,000 $518,784,000 $80,454,983,000
1980 $1,121,568,000 $507,733,000 $84,731,631,000
1981 $1,760,855,000 $702,317,000 $95,323,554,000
1982 $2,640,790,000 $893,810,000 $108,971,375,000
1983 $2,428,104,000 $1,345,201,000 $117,608,877,000
1984 $2,392,758,000 $1,199,180,000 $131,567,436,000
1985 $2,450,324,000 $1,234,204,000 $145,265,009,000
1986 $2,307,375,000 $1,029,150,000 $138,296,721,000
1987 $1,921,362,000 $1,107,451,000 $133,633,029,000
1988 $1,922,176,000 $1,175,980,000 $122,747,300,000
1989 $1,771,608,000 $1,203,594,000 $125,076,136,000
1990 $1,561,604,000 $1,069,297,000 $118,525,110,000
1991 $1,326,286,000 $1,132,151,000 $110,268,904,000
1992 $1,390,732,000 $1,244,600,000 $113,720,918,000
1993 $1,159,157,000 $1,328,795,000 $93,290,579,000
1994 $1,441,759,000 $1,099,995,000 $101,606,758,000
1995 $889,208,000 $1,228,563,000 $96,580,285,000
1996 $821,654,000 $1,213,935,000 $95,904,943,000
1997 $1,054,673,000 $1,187,609,000 $92,181,565,000
1998 $961,763,000 $1,158,383,000 $100,805,618,000
1999 $1,441,145,000 $1,121,585,000 $104,039,573,000
2000 $1,583,921,000 $1,183,191,000 $103,333,525,000
61

FY Major ADAF # Aircraft Flying Hours 1964 216 855,802 15,380 6,662
1968 198
161
904,759 15,327 7,697
1972 725,635 13,498 5,102
1973 167 690,999 12,910 4,454
1974 154
148
643,795 12,132 3,805
1975 612,551 11,196 3,477
1976 140 585,207 9,287 3,149
1977 134 570,479 9,256 3,167
1978 134 569,491 9,138 3,103
1979 134 559,450 9,037 3,208
1980 134 557,969 9,069 3,125
1981 134 570,302 9,180 3,201
1982 134 582,845 9,213 3,341
1983 135 592,044 9,355 3,389
1984 136 597,125 9,401 3,422
1985 137 601,515 9,443 3,477
1986 139 608,199 9,591 3,555
1987 138 607,035 9,447 3,463
1988 140 576,446 9,416 3,340
1989 141 570,880 9,279 3,412
1990 139 535,233 9,032 3,366
1991 139 510,432 8,510 3,166
1992 124 470,315 7,640 2,790
1993 121 444,351 7,182 2,584
1994 102 426,327 6,815 2,317
1995 94 400,409 6,633 2,253
1996 90 389,001 6,294 2,181
1997 88 377,385 6,330 2,205
1998 87 367,470 6,228 2,154
1999 87 360,590 6,203 2,132
2000 87 357,777 6,178 2,110
Notes: (1) Shaded cell indicates mathematical interpolation was used to estimate the values. (2) Dollars in constant FY2001 (3) "Major" is the number of major Air Force installations (4) "ADAF" is the number of active duty Air Force members (5) "# Aircraft" is the number of Air Force aircraft (6) "Flying Hours" is the number of flying hours flown each fiscal year
62

Appendix D; Operations & Maintenance Regression Data
Multiple R R Square
Regression Statistics 0.7346586 0.5397233
Adjusted R Square Standard Error Observations
0.5068463 2.312E+09
31
Total
ANOVA df SS MS F Significance F
Regression 2 1.75E+20 8.77E+19 16.41648 1.92E-05 Residual 28 1.5E+20 5.34E+18
30 3.25E+20
Coefficients Standard Error P-value Intercept -1.05E+12 1.97E+11 1.07E-05 FY 533906490 97470776 7.53E-06 Major 176971606 31326628 4.72E-06
$40,000,000,000 -,
$35,000,000,000
$30,000,000,000
<fr $25,000,000,000
© $20,000,000,000
U_ $15,000,000,000
$10,000,000,000
$5,000,000,000
$0 Tt(N^fCD00O<M'"tCD00OCM'*CDC0O coh-h-h-h-cococococoOTOCBCDcno O>0>0>05050>0>050)0>05050)0>0)0 T-T-T-T-1-T-T-1-T-T-T-1-T-T-T-CN
Fiscal Year
•Actual FY-MAJ
63

Regression Statistics Multiple R 0.7978287 R Square 0.6365306 Adjusted R Sqi aare 0.6105685
Standard Error 2.054E+09 Observations 31
ANOVA df SS MS F Significance F
Regression 2 2.07E+20 1.03E+20 24.51769 7.02E-07 Residual 28 1.18E+20 4.22E+18 Total 30 3.25E+20
Coefficients Standard Error P-value Intercept -1.3E+12 1.95E+11 3.36E-07 FY 653766989 96607532 2.38E-07 ADAF 48986.641 7080.094 1.61E-07
$40,000,000,000 -i
$30,000,000,000 -
O $20,000,000,000 - —»■?",■ ▼
$10,000,000,000 -
$0- Tt(N^tCDCOOCM^t<DOOOCM^|-CDCOO CDh*h-I^-r^COCOCOOOOOO>0)a)050>0 o>a)0)0)0)CDO>a>o>o>o>a)0)0>CT>o
Fiscal Year
-•-Actual FY-ADAF-«-FY-MAJ
64

1964 $26,647,748,000 $29,531,194,990 $32,056,203,398
1968 $30,502,299,000 $34,544,501,931 $31,006,340,443
1972 $27,163,356,000 $28,384,886,793 $26,594,016,964
1973 $26,745,299,000 $27,341,952,481 $28,189,753,094
1974 $25,962,312,000 $25,683,354,066 $26,423,028,700
1975 $25,248,013,000 $24,806,582,441 $25,895,105,551
1976 $24,907,580,000 $24,120,858,716 $25,013,239,190 1977 $24,971,361,000 $24,053,150,456 $24,485,316,041
1978 $24,397,199,000 $24,658,518,643 $25,019,222,532
1979 $24,368,006,000 $24,820,410,769 $25,553,129,022 1980 $26,925,996,000 $25,401,628,542 $26,087,035,512
1981 $28,712,300,000 $26,659,547,774 $26,620,942,003
1982 $29,150,632,000 $27,927,754,202 $27,154,848,493
1983 $30,853,563,000 $29,032,149,301 $27,865,726,590
1984 $31,514,048,000 $29,934,817,413 $28,576,604,687
1985 $32,929,850,000 $30,803,635,756 $29,287,482,783
1986 $32,578,158,000 $31,784,829,454 $30,175,332,487
1987 $31,827,945,000 $32,381,575,992 $30,532,267,371
1988 $33,388,346,000 $31,536,890,617 $31,420,117,074
1989 $34,823,905,000 $31,917,997,962 $32,130,995,171
1990 $33,410,104,000 $30,825,538,157 $32,310,958,448
1991 $34,439,792,000 $30,264,387,460 $32,844,864,939
1992 $26,883,728,000 $28,952,957,370 $30,724,197,332
1993 $25,942,830,000 $28,334,835,210 $30,727,189,003
1994 $27,484,712,000 $28,105,666,980 $27,898,634,970
1995 $27,196,084,000 $27,489,798,206 $27,016,768,608
1996 $25,388,936,000 $27,584,725,593 $26,842,788,673
1997 $24,352,930,000 $27,669,463,759 $27,022,751,950
1998 $26,198,275,000 $27,837,528,202 $27,379,686,834
1999 $27,942,990,000 $28,154,267,100 $27,913,593,324
2000 $26,357,344,000 $28,670,234,667 $28,447,499,815
Notes: (1) "FY-ADAF" is the result of regressing the budget by fiscal year and active duty Air Force members. (2) "FY-MAJ" " is the result of regressing the budget by fiscal year and major installations.
65

Appendix E: Military Construction Regression Data
Regression Statistics Multiple R 0.500899 R Square 0.2509 Adjusted R Square 0.197393 Standard Erroi 4.95E+08 Observations 31
ANOVA df SS MS F Significance F
Regression 2 2.3E+18 1.15E+18 4.689097 0.017521 Residual 28 6.87E+18 2.45E+17 Total 30 9.18E+18
Coefficients Standard Error P-value Intercept -5.7E+10 4.23E+10 0.191972 FY 28177578 20889770 0.188188 Major 16384385 6713869 0.021256
$3,000,000,000
$2,500,000,000
iA. $2,000,000,000
O $1,500,000,000
"" $1,000,000,000
$500,000,000
$0
*^>f^&- ■«frCNTrCDCOOCM^COCOOCJTl-CDCOO coh*h-r^h-cococococoo)a>a>0)o>o o>a>o>a>a>C)a>a>o>a>a>oa>o>a>o T-!-T--*--»-l-f-T-T-T-T-!--I-T-T-C\J
Fiscal Year
■Actual FY-MAJ
Note: As indicated by the p-values for the intercept and fiscal year, this regression model is significantly insignificant; however, it is presented to compare with the results of the model using the surrogate measure.
66

Multiple R Regression Statistics
R Square Adjusted R Square Standard Error Observations
0.607323 0.368841 0.323758 4.55E+08
31
Total
ANOVA df SS MS F Significance F
Regression 2 3.38E+18 1.69E+18 8.181402 0.001592
Residual 28 5.79E+18 2.07E+17 30 9.18E+18
ADAF 5497.11 1567.377
Coefficients Standard Error P-value Intercept -1E+11 4.32E+10 0.023957
FY 51286519 21386785 0.023392 0.001547
</*
$3,000,000,000
$2,500,000,000
$2,000,000,000
O $1,500,000,000 ff
"" $1,000,000,000
$500,000,000
$0 ^fCMTtCOCOOCM^CDCOOCOTfCDCOO cor^-t^r^-h-cococococoo^ooocBo 0>0>0)0050>0>050)0>05OT050>C)0 T-T-l-l-l-l-T-f-T-T-l-f-l-l-f-CM
Fiscal Year
■Actual FY-ADAF FY-MAJ
67

FY Actual FY-ADAF FY-MAJ 1964 $2,610,949,000 $2,185,911,397 $2,379,648,343 1968 $2,179,450,000 $2,660,179,510 $2,197,439,719 1972 $1,082,510,000 $1,880,661,165 $1,703,927,775 1973 $1,072,636,000 $1,741,549,765 $1,830,411,665 1974 $1,076,230,000 $1,533,350,680 $1,645,592,234 1975 $1,260,468,000 $1,412,885,479 $1,575,463,500 1976 $1,637,654,000 $1,313,859,008 $1,472,565,996 1977 $1,976,327,000 $1,284,184,084 $1,402,437,262 1978 $1,240,043,000 $1,330,039,457 $1,430,614,839 1979 $1,036,763,000 $1,326,129,489 $1,458,792,417 1980 $1,121,568,000 $1,369,274,788 $1,486,969,995 1981 $1,760,855,000 $1,488,357,170 $1,515,147,573 1982 $2,640,790,000 $1,608,593,946 $1,543,325,150 1983 $2,428,104,000 $1,710,448,384 $1,587,887,113 1984 $2,392,758,000 $1,789,665,721 $1,632,449,076 1985 $2,450,324,000 $1,865,084,555 $1,677,011,039 1986 $2,307,375,000 $1,953,113,760 $1,737,957,387 1987 $1,921,362,000 $1,998,001,642 $1,749,750,580 1988 $1,922,176,000 $1,881,137,048 $1,810,696,928 1989 $1,771,608,000 $1,901,826,650 $1,855,258,891 1990 $1,561,604,000 $1,757,157,671 $1,850,667,698 1991 $1,326,286,000 $1,672,110,352 $1,878,845,276 1992 $1,390,732,000 $1,502,869,289 $1,661,257,074 1993 $1,159,157,000 $1,411,428,831 $1,640,281,496 1994 $1,441,759,000 $1,363,635,430 $1,357,155,754 1995 $889,208,000 $1,272,447,839 $1,254,258,250 1996 $821,654,000 $1,261,023,322 $1,216,898,286 1997 $1,054,673,000 $1,248,455,405 $1,212,307,094 1998 $961,763,000 $1,245,238,073 $1,224,100,286 1999 $1,441,145,000 $1,258,704,472 $1,252,277,864 2000 $1,583,921,000 $1,294,527,619 $1,280,455,441
Notes: (1) "FY-ADAF" is the result of regressing the budget by fiscal year and active duty Air Force members. (2) "FY-MAJ" " is the result of regressing the budget by fiscal year and major installations.
68

Appendix F: Military Personnel Regression Data
Regression Statistics Multiple R 0.8929674
R Square 0.7973907
Adjusted R Sq uare 0.7829186
Standard Error 2.313E+09 Observations 31
ANOVA df SS MS F Significance F
Regression 2 5.89E+20 2.95E+20 55.09851 1.96E-10 Residual 28 1.5E+20 5.35E+18 Total 30 7.39E+20
Coefficients Standard Error P-value Intercept -1.02E+12 1.97E+11 1.7E-05 FY 509592314 97507316 1.49E-05 Major 274512024 31338371 1.64E-09
o >-
$45,000,
$40,000,
$35,000,
$30,000,
$25,000,
$20,000,
$15,000,
$10,000,
$5,000,
000,000
000,000
000,000
000,000
000,000
000,000
000,000
000,000
000,000
$0 ^•CM^tDOOOCM^-CDOOOCM^COCOO cor^-h-h-h-cococooocooc^oooo O>05050>050>0)05050>0>0>0>0)050 1— T— f— 1— T-1— 1— T— T-f-T-f— T-T-f— C\J
Fiscal Year
■Actual FY-MAJ
69

Regression Statistics Multiple R 0.9188878
R Square 0.8443548
Adjusted R Square k 0.8332373
Standard Erroi 2.027E+09
Observations 31
ANOVA df SS MS F Significance F
Regression 2 28 30
6.24E+20 3.12E+20 75.94818 4.9E-12 Residual 1.15E+20 4.11E+18 Total 7.39E+20
Coefficients Standard Error P-value Intercept -1.31E+12 1.93E+11 2.12E-07 FY 654598674 95320772 1.84E-07 ADAF 72710.012 6985.791 3.95E-11
$45,000,000,000 -i $40,000,000,000 -L_ $35,000,000,000 - ̂ " ♦*A —_
i/J. $30,000,000,000 - W, ..JA»"***- g $25,000,000,000 - ^"»■■■■ifi? ^kftA., >- $20,000,000,000 - ■ ■■■*'« U- $15,000,000,000 - |1II1M^^
$10,000,000,000 • SS^M»Q3iSt^^lSi^» '':il^b;1MMilltell| $5,000,000,000 -
- — — — ■— ~ ~|
W f—i—i—i—i—r~T i i i"" i i i i Ttc\l'*t<OOOOC\J'<t<OCOOC\J*t<OCOO CQr^-l^t^h-COCOCOCOCOOO^OCDO^O 050)00>cnro05CBO)050>050>cno>o
Fiscal Year
A Ai-tn-il PV A RAP ■ PV MA 1 —*—Actual ri-AUAr —■--r Y-IVIMJ
70

FY Actual FY-ADAF FY-MAJ
1964 $37,215,906,000 $34,716,951,076 $38,770,020,899
1968 $39,092,780,000 $40,895,009,823 $35,867,173,720
1972 $30,921,673,000 $30,489,296,362 $27,748,598,083
1973 $28,755,657,000 $28,625,511,067 $29,905,262,541
1974 $27,610,967,000 $25,847,906,343 $26,846,198,542
1975 $26,015,162,000 $24,230,753,408 $25,708,718,711
1976 $24,634,324,000 $22,897,169,519 $24,022,214,832
1977 $23,043,264,000 $22,480,895,139 $22,884,735,001
1978 $22,243,234,000 $23,063,656,322 $23,394,327,315
1979 $22,224,196,000 $22,988,173,767 $23,903,919,629
1980 $22,220,006,000 $23,535,088,914 $24,413,511,942
1981 $22,453,190,000 $25,086,420,164 $24,923,104,256
1982 $22,936,378,000 $26,653,020,517 $25,432,696,570
1983 $23,585,890,000 $27,976,478,590 $26,216,800,907
1984 $24,064,549,000 $29,000,516,835 $27,000,905,245
1985 $32,578,759,000 $29,974,312,461 $27,785,009,583
1986 $32,970,096,000 $31,114,904,854 $28,843,625,945
1987 $33,448,954,000 $31,684,869,075 $29,078,706,235
1988 $30,184,120,000 $30,115,341,198 $30,137,322,597
1989 $30,143,906,000 $30,365,235,946 $30,921,426,934
1990 $29,227,316,000 $28,427,940,829 $30,881,995,200
1991 $29,404,567,000 $27,279,258,500 $31,391,587,514
1992 $26,625,831,000 $25,016,949,630 $27,783,499,466
1993 $24,933,189,000 $23,783,705,557 $27,469,555,707
1994 $21,909,736,000 $23,127,778,979 $22,763,419,563
1995 $23,171,517,000 $21,897,879,567 $21,076,915,684
1996 $22,861,516,000 $21,723,002,426 $20,488,459,901
1997 $21,766,355,000 $21,533,001,603 $20,449,028,167
1998 $21,409,451,000 $21,466,680,510 $20,684,108,457
1999 $20,972,712,000 $21,621,034,303 $21,193,700,770
2000 $21,064,642,000 $22,071,099,714 $21,703,293,084
Notes: (1) "FY-ADAF" is the result of regressing the budget by fiscal year and active duty Air Force members. (2) "FY-MAJ" " is the result of regressing the budget by fiscal year and major installations.
71

Appendix G: Military Family Housing Regression Data
Regression Statistics Multiple R
uare
0.909255
R Square 0.826744
Adjusted R Sq 0.814369
Standard Error 1.73E+08 Observations 31
ANOVA df SS MS F Significance F
Regression 2 28
4.02E+18 2.01E+18 66.8053 2.2E-11
Residual 8.43E+17 3.01E+16 Total 30 4.86E+18
Coefficients Standard Error P-value Intercept -1.2E+11 1.48E+10 1.58E-08 FY 58270119 7313738 1.12E-08 Major 7885578 2350599 0.002295
$1,600,000,000
$1,400,000,000
$1,200,000,000
«9- $1,000,000,000
O $800,000,000
U. $600,000,000
$400,000,000 H
$200,000,000
$0 ■^tCM-'tCOCOOOJ^tCOCOOCVJ'^COCpO CDK.r^h-h-COGOCOCOCOO>050505050 O>0)0}0>00)050}00>0>0)00)0)0
Fiscal Year
■Actual FY-MAJ
72
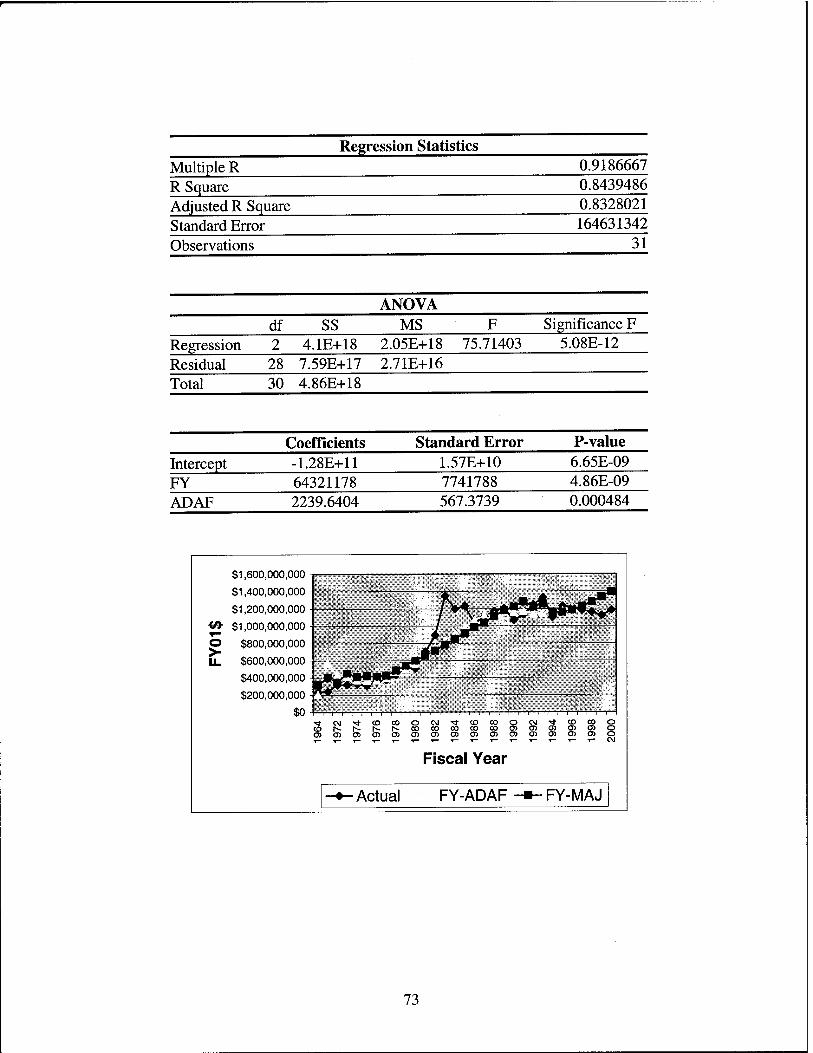
Regression Statistics Multiple R 0.9186667 R Square 0.8439486 Adjusted R Square 0.8328021 Standard Erroi 164631342 Observations 31
ANOVA df SS MS F Significance F
Regression 2 4.1E+18 2.05E+18 75.71403 5.08E-12 Residual 28 7.59E+17 2.71E+16 Total 30 4.86E+18
Coefficients Standard Error P-value Intercept -1.28E+11 1.57E+10 6.65E-09 FY 64321178 7741788 4.86E-09 ADAF 2239.6404 567.3739 0.000484
$1,600,000,000
$1,400,000,000
$1,200,000,000-
«a- $1,000,000,000
O $800,000,000
U_ $600,000,000
$400,000,000
$200,000,000
$0 TtCMTfCDCOOCM^tCDOOOCVJ^CDOOO cDr^-S-h-h-cococooocoooosooo 0)0>050)0>05050>05050>a>05050>0 ^-T-i-f-T-^-i--*-^-^--*-T-'-'-T-CM
Fiscal Year
•Actual FY-ADAF FY-MAJ
73

FY Actual FY-ADAF FY-MAJ 1964 $232,613,000 $204,710,539 $314,853,808
1968 $239,052,000 $571,641,326 $405,993,888
1972 $318,279,000 $427,752,696 $347,307,994
1973 $317,769,000 $414,501,690 $452,891,578
1974 $327,608,000 $373,102,884 $408,649,189
1975 $308,772,000 $367,448,738 $419,605,842
1976 $355,962,000 $370,529,190 $414,791,341
1977 $376,271,000 $401,864,945 $425,747,994
1978 $431,718,000 $463,973,359 $484,018,113
1979 $518,784,000 $505,806,308 $542,288,232
1980 $507,733,000 $566,810,579 $600,558,351
1981 $702,317,000 $658,753,242 $658,828,470
1982 $893,810,000 $751,166,230 $717,098,589
1983 $1,345,201,000 $836,089,860 $783,254,286
1984 $1,199,180,000 $911,790,651 $849,409,982
1985 $1,234,204,000 $985,943,851 $915,565,679
1986 $1,029,150,000 $1,065,234,785 $989,606,953
1987 $1,107,451,000 $1,126,949,022 $1,039,991,494
1988 $1,175,980,000 $1,122,761,841 $1,114,032,769
1989 $1,203,594,000 $1,174,617,181 $1,180,188,465
1990 $1,069,297,000 $1,159,101,899 $1,222,687,429
1991 $1,132,151,000 $1,167,877,756 $1,280,957,548
1992 $1,244,600,000 $1,142,351,281 $1,220,944,003
1993 $1,328,795,000 $1,148,522,437 $1,255,557,390
1994 $1,099,995,000 $1,172,476,337 $1,164,001,535
1995 $1,228,563,000 $1,178,750,516 $1,159,187,033
1996 $1,213,935,000 $1,217,521,877 $1,185,914,842
1997 $1,187,609,000 $1,255,827,393 $1,228,413,806
1998 $1,158,383,000 $1,297,942,537 $1,278,798,347
1999 $1,121,585,000 $1,346,854,989 $1,337,068,466
2000 $1,183,191,000 $1,404,876,059 $1,395,338,585
Notes: (1) "FY-ADAF" is the result of regressing the budget by fiscal year and active duty Air Force members. (2) "FY-MAJ" " is the result of regressing the budget by fiscal year and major installations.
74

Appendix H: Research & Development Regression Data
Regression Statistics Multiple R R Square Adjusted R Square Standard Error Observations
0.776318 0.60267 0.57429
2.27E+09 31
Residual Total
df ANOVA
SS MS Significance F Regression 2 2.18E+20 1.09E+20 21.23522 2.44E-06
28 1.44E+20 5.13E+18 30 3.62E+20
Coefficients Standard Error P-value Intercept -1.2E+12 1.93E+11 5.73E-07 FY 6.21E+08 95525092 4.77E-07 Major 1.84E+08 30701294 1.86E-06
$25,000,000,000
$20,000,000,000
o >-
$15,000,000,000
$10,000,000,000
$5,000,000,000
$0 '" T^T '""i"""'"r"' T vl'v""\ r-'r'"r~Tr 7 i r'-|"'""rr"i i ' i r""'i ' I"'VT i i i1"') i "«■CM^-toooocM^tooooeM^coogo cDh-h-r^h-oocococococnoocnoio o>oio)0)G>mo>iioiaio>o>oioioio !-■»— f--»— T-1—T-T-T— T-T-T— 1— T-f— OJ
Fiscal Year
•Actual FY-MAJ
75
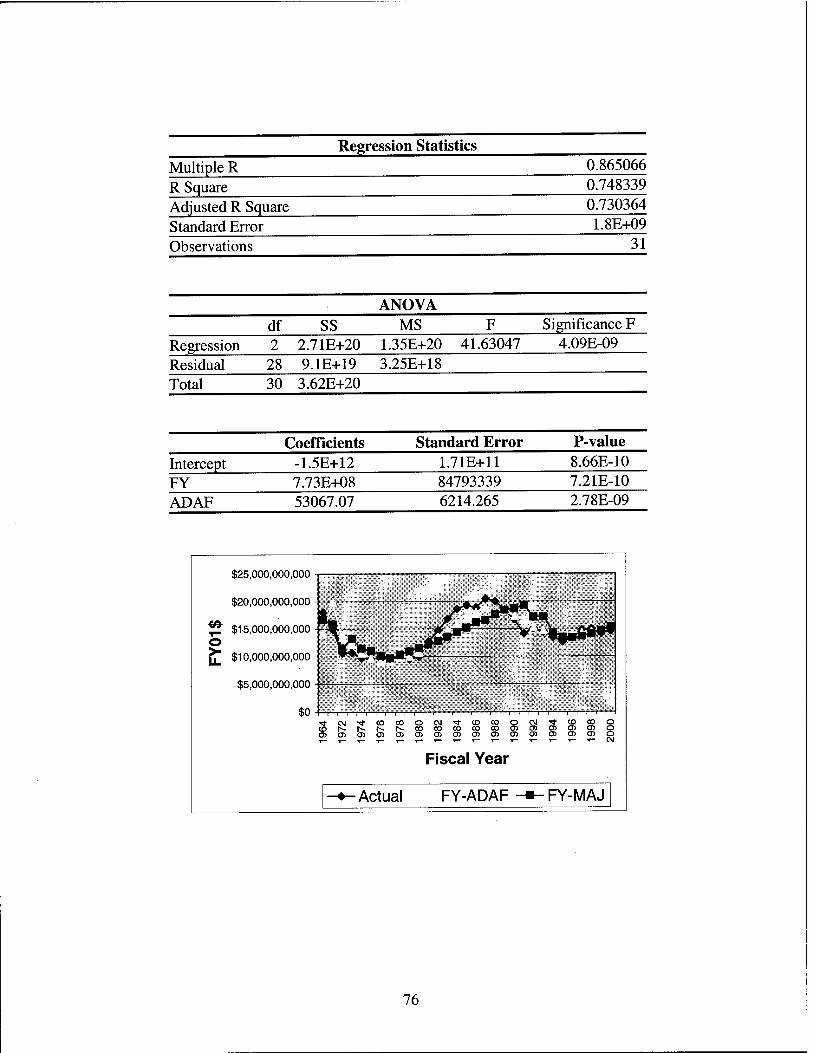
Regression Statistics Multiple R 0.865066 R Square 0.748339 Adjusted R Square 0.730364 Standard Erroi 1.8E+09 Observations 31
ANOVA df SS MS F Significance F
Regression 2 2.71E+20 1.35E+20 41.63047 4.09E-09 Residual 28 9.1E+19 3.25E+18 Total 30 3.62E+20
Coefficients Standard Error P-value Intercept -1.5E+12 1.71E+11 8.66E-10 FY 7.73E+08 84793339 7.21E-10 ADAF 53067.07 6214.265 2.78E-09
$25,000,000,000
$20,000,000,000
^ $15,000,000,000 o j£ $10,000,000,000
$5,000,000,000
$0
V3
TtCVJ^CDOOOCNTl-CDCOOCM^CDCOO cor^i^r^h-cococooocoooocnroo 0)C3)0)0)0)0)0)0)0)0)0)a)0)£3)0)0 1_T_^1-T-T-1-1-T--^-I-T-T-T-T-CM
Fiscal Year
■Actual FY-ADAF FY-MAJ
76

FY 1964
Actual FY-ADAF FY-MAJ $18,019,293,000 $14,130,685,015 $16,667,404,218
1968 $14,969,920,000 $19,818,955,133 $15,840,458,546
1972 $10,589,253,000 $13,403,634,284 $11,517,298,361
1973 $10,707,981,000 $12,338,169,522 $13,242,680,490
1974 $9,715,385,000 $10,605,757,793 $11,471,848,106
1975 1976 1977
$9,536,990,000 $9,599,185,000 $9,661,179,000
$9,720,296,541 $9,041,796,872 $9,032,791,390
$10,989,094,753 $10,138,318,819 $9,655,565,466
1978 $9,808,748,000 $9,752,927,485 $10,276,879,854
1979 $9,550,275,000 $9,992,647,372 $10,898,194,242
1980 $9,873,948,000 $10,686,621,400 $11,519,508,630 1981 $12,707,086,000 $12,113,663,967 $12,140,823,018 1982 $14,731,775,000 $13,551,850,620 $12,762,137,406 1983 $16,760,822,000 $14,812,580,982 $13,567,463,084
1984 $18,642,135,000 $15,854,781,140 $14,372,788,763
1985 $19,264,253,000 $16,860,311,950 $15,178,114,441
1986 $18,819,378,000 $17,987,578,625 $16,167,451,409
1987 $20,451,616,000 $18,698,374,915 $16,604,754,507
1988 $19,973,883,000 $17,847,672,596 $17,594,091,476 1989 $18,462,452,000 $18,324,867,632 $18,399,417,154
1990 $16,701,653,000 $17,205,752,060 $18,652,708,962
1991 $14,102,189,000 $16,662,201,957 $19,274,023,350
1992 $15,047,677,000 $15,305,876,571 $17,135,168,385 1993 $14,448,136,000 $14,700,609,462 $17,204,448,902
1994 $13,497,356,000 $14,516,694,909 $14,329,548,776
1995 $12,626,141,000 $13,913,868,886 $13,478,772,843
1996 $13,365,262,000 $14,081,046,084 $13,364,042,070
1997 $14,765,572,000 $14,237,185,332 $13,617,333,878 1998 $14,942,030,000 $14,483,591,670 $14,054,636,976
1999 $14,179,402,000 $14,891,056,573 $14,675,951,364
2000 $14,567,219,000 $15,514,345,261 $15,297,265,752
Notes: (1) "FY-ADAF" is the result of regressing the budget by fiscal year and active duty Air Force members. (2) "FY-MAJ" " is the result of regressing the budget by fiscal year and major installations.
77

Appendix I: Procurement Regression Data
Regression Statistics Multiple R 0.5964457 R Square 0.3557474 Adjusted R Square 0.3097294 Standard Error 9.728E+09 Observations 31
ANOVA df SS MS F Significance F
Regression 2 1.46E+21 7.32E+20 7.730608 0.002122 Residual 28 2.65E+21 9.46E+19 Total 30 4.11E+21
Coefficients Standard Error P-value Intercept -2.22E+12 8.3E+11 0.012372 FY 1.1E+09 4.1E+08 0.012141 Major 486120971 1.32E+08 0.000964
$60,000,000,000
$50,000,000,000
w. $40,000,000,000
O $30,000,000,000
U- $20,000,000,000
$10,000,000,000
$0 '>*C\1'*CDOOOC\I'*COCOOCM'*CDCOO co^-r^h-r^cocooococoOTo^ooOTo o>o>o>o>05cncno>cno30>05cna50>o T-T-f-f-l-T-T-T-f-l-f-T-l-l-T-CJ
Fiscal Year
■Actual -»-FY-MAJ
78

Regression Statistics Multiple R R Square Adjusted R Square Standard Error Observations
0.75049717 0.56324601 0.53204929 8009329955
31
Residual Total
df SS ANOVA
MS Significance F Regression 2 2.32E+21 1.16E+21 18.05466 9.19E-06
28 1.8E+21 6.41E+19 30 4.11E+21
Intercept FY ADAF
Coefficients -3.513E+12 1739855078
159440.649
Standard Error 7.62E+11 3.77E+08 27602.79
P-value 8E-05
7.85E-05 3.35E-06
i&
$60,000,000,000
$50,000,000,000
$40,000,000,000
© $30,000,000,000
U- $20,000,000,000
$10,000,000,000
$0 '*Ca'*CDCOOPJ'<t<DOOO<M^tCDOOO coh-h-h-h-cococococoa^ooosojo .r-,-T-T-T-f-T-i-T-T-'*--*--'-'»-T-CM
Fiscal Year
■Actual FY-ADAF FY-MAJ
79

FY Actual FY-ADAF FY-MAJ 1964 $35,886,820,000 $40,933,959,689 $46,834,317,964 1968 $41,492,628,000 $55,699,115,845 $42,483,715,989 1972 $23,363,788,000 $34,098,889,380 $28,896,815,570 1973 $22,115,232,000 $30,316,358,146 $32,913,435,269 1974 $18,637,627,000 $24,529,976,838 $27,693,756,524 1975 $18,150,296,000 $21,288,268,284 $25,876,924,574 1976 $20,201,298,000 $18,668,378,261 $23,087,850,683 1977 $23,749,846,000 $18,059,991,464 $21,271,018,733 1978 $23,840,116,000 $19,642,319,181 $22,370,912,608
1979 $22,730,159,000 $24,082,380,000
$19,781,230,704 $23,470,806,483
1980 $21,284,954,182 $24,570,700,357
1981 $28,959,506,000 $24,991,190,782 $25,670,594,232
1982 $38,539,190,000 $28,730,909,918 $26,770,488,106
1983 $42,473,697,000 $31,937,459,524 $28,356,502,952
1984 $52,466,041,000 $34,487,432,539 $29,942,517,797
1985 $56,259,026,000 $36,927,232,066 $31,528,532,643
1986 $50,197,043,000 $39,732,788,440 $33,600,668,459
1987 $44,735,721,000 $41,287,054,603 $34,214,441,363
1988 $35,876,788,000 $38,149,779,675 $36,286,577,179
1989 $38,483,771,000 $39,002,188,102 $37,872,592,024
1990 $36,444,036,000 $35,058,462,372 $38,000,243,957
1991 $28,919,019,000 $32,844,029,919 $39,100,137,832
1992 $26,941,851,000 $28,187,604,489 $32,908,217,145
1993 $24,168,594,000 $25,787,742,561 $32,549,748,108
1994 $19,396,263,000 $24,653,839,385 $24,413,343,538
1995 $17,105,493,000 $22,261,311,727 $21,624,269,647
1996 $17,823,062,000 $22,182,267,884 $20,779,679,639
1997 $15,143,239,000 $22,070,060,385 $20,907,331,572
1998 $15,930,479,000 $22,229,061,431 $21,521,104,476
1999 $18,812,967,000 $22,871,964,845 $22,620,998,350
2000 $18,933,160,000 $24,163,313,378 $23,720,892,225
Notes: (1) "FY-ADAF" is the result of regressing the budget by fiscal year and active duty Air Force members. (2) "FY-MAJ" " is the result of regressing the budget by fiscal year and major installations.
80

Appendix .T: Total Air Force Regression Data
Regression Statistics Multiple R R Square Adjusted R Square Standard Error Observations
0.739483 0.546835 0.514466 1.32E+10
31
Major
ANOVA df SS MS F Significance F
Regression 2 5.9E+21 2.95E+21 16.89384 1.54E-05 Residual 28 4.89E+21 1.75E+20 Total 30 1.08E+22
Coefficients Standard Error P-value Intercept -6.2E+12 1.13E+12 7.43E-06 FY 3.1E+09 5.57E+08 6.02E-06
1.03E+09 1.79E+08 3.81E-06
$160,000,000,000
$140,000,000,000
$120,000,000,000
<& $100,000,000,000
O $80,000,000,000
U. $60,000,000,000
$40,000,000,000
$20,000,000,000
$0
^^^-
■<*CMT|-COOOOCVJ*<tCOCOOCM'<frCOCOO C0h-h-r^r^00C0C000C0a)0)0)0)0)O 0)0)0)0)0)0)0)0)0)0)0)0)0)0)0)0 T-T-T-T-f-!-T--r-t-1--|-T-1-f-l-C\l
Fiscal Year
■Actual FY-MAJ
81

Regression Statistics Multiple R 0.898113
R Square uare
0.806607
Adjusted R Sq 0.792793
Standard Error 8.64E+09 Observations 31
ANOVA df SS MS F Significance F
Regression 2 28 30
8.71E+21 4.35E+21 58.39137 1.02E-10
Residual 2.09E+21 7.46E+19 Total 1.08E+22
Coefficients Standard Error P-value Intercept -8.5E+12 8.21E+11 5.03E-11
FY 4.22E+09 4.06E+08 4.01E-11
ADAF 318481 29761.37 2.11E-11
$160,000,000,000
$140,000,000,000
$120,000,000,000
V> $100,000,000,000
O $80,000,000,000
U. $60,000,000,000
$40,000,000,000
$20,000,000,000
$0
p*"*""*^1^^
Tj-CM^COOOOCM-^COCOOOJ^frCOCgO cDr^r^.|^i^.cooooooooo(ji050>a)0>o
T-!-T-T-1-T-!-1-T-!-1--T-T-T-'»-C\l
Fiscal Year
■Actual FY-ADAF FY-MAJ
82

FY Actual FY-ADAF FY-MAJ
1964 $120,613,329,000 $113,224,791,114 $126,433,403,483
1968 $128,476,129,000 $145,711,848,637 $120,357,311,492
1972 $93,438,859,000 $105,559,441,080 $94,783,636,557
1973 $89,714,574,000 $98,752,328,941 $104,039,593,607
1974 $83,330,129,000 $87,942,547,588 $93,797,967,713
1975 $80,519,701,000 $82,215,723,003 $90,739,661,851
1976 $81,351,003,000 $77,730,974,319 $85,628,978,837
1977 $83,837,048,000 $77,264,181,939 $82,570,672,976
1978 $81,995,658,000 $81,173,318,506 $85,669,498,570
1979 $80,454,983,000 $82,199,246,575 $88,768,324,163
1980 $84,731,631,000 $85,951,372,008 $91,867,149,757
1981 $95,323,554,000 $94,102,993,983 $94,965,975,351
1982 $108,971,375,000 $102,321,496,967 $98,064,800,945
1983 $117,608,877,000 $109,474,999,486 $102,189,815,115
1984 $131,567,436,000 $115,316,997,245 $106,314,829,285
1985 $145,265,009,000 $120,938,924,632 $110,439,843,455
1986 $138,296,721,000 $127,291,447,435 $115,591,046,201
1987 $133,633,029,000 $131,144,531,346 $117,663,683,219
1988 $122,747,300,000 $125,626,311,816 $122,814,885,964
1989 $125,076,136,000 $128,077,442,362 $126,939,900,134
1990 $118,525,110,000 $120,948,345,932 $127,986,348,576
1991 $110,268,904,000 $117,273,494,433 $131,085,174,170
1992 $113,720,918,000 $108,720,787,930 $118,791,171,125
1993 $93,290,579,000 $104,675,543,028 $118,811,430,991
1994 $101,606,758,000 $103,159,037,270 $102,412,673,642
1995 $96,580,285,000 $99,128,442,493 $97,301,990,628
1996 $95,904,943,000 $99,719,007,034 $96,296,061,918
1997 $92,181,565,000 $100,243,327,528 $97,342,510,360
1998 $100,805,618,000 $101,309,384,203 $99,415,147,378
1999 $104,039,573,000 $103,342,030,714 $102,513,972,972
2000 $103,333,525,000 $106,669,939,455 $105,612,798,566
Notes: (1) "FY-ADAF" is the result of regressing the budget by fiscal year and active duty Air Force members. (2) "FY-MAJ" " is the result of regressing the budget by fiscal year and major installations.
83

Appendix K: Active Dutv Personnel versus Major Installations Data
Regression Statistics Multiple R 0.968159 R Square 0.937333 Adjusted R Sq uare 0.903999 Standard Erroi 7.506573 Observations 31
ANOVA df SS MS F Significance F
Regression 1 25284.64 25284.64 448.7178 3.44E-19 Residual 30 1690.459 56.34864 Total 31 26975.1
Coefficients Standard Error t Stat P-value Intercept 0 #N/A #N/A #N/A ADAF 0.000238 2.36E-06 100.64 1.64E-39
Note: When you exclude the intercept (which forces it to zero), there are no significance statistics, therefore, Excel prints N/A for "not applicable".
250
(0 200 C o
•iS 150 W
« 100 (0 c — 50
(0
*»*»*»
■>.. .... . . ,r,,T,,,ri „„, T T ( | | T . , ,-i-l-l-l-1- ■ r, i--...r.,.„r.„l1„ll,„|..,. . | . ■■ r ■ r, , -Y-i-i-j | rn-T;- -f . , -
Tj-CM^tCDCOOC\jTf<DCOOOjT|-CDOOO CDI^-r^h-h-COOOOOCOCOO>050)0)050
T-l-l-T-T-T-l-T-T-l-l-T-T-r-'I-CJ
Fiscal Year
■Actual Predicted
84

FY Actual Predicted
1964 216 204 1968 198 215 1972 161 173 1973 167 164 1974 154 153 1975 148 146 1976 140 139 1977 134 136 1978 134 135 1979 134 133 1980 134 133 1981 134 136 1982 134 139 1983 135 141 1984 136 142 1985 137 143 1986 139 145 1987 138 144 1988 140 137 1989 141 136 1990 139 127 1991 139 121 1992 124 112 1993 121 106 1994 102 101 1995 94 95 1996 90 93 1997 88 90 1998 87 87 1999 87 86 2000 87 85
85

Bibliography
1. Beach, John W. "Planning Today for a More Effective Analysis of Air Force Base Closures Tomorrow." Report to SAF/FMC, Washington DC. June 1999.
2. Berthoud, John E. "Congress Should Approve New Round of Base Closures," The Portsmouth (NH) Herald, Article, n. pag. http://www.adti.net/html_files/defense/base.html. 13 July 1997.
3. "Cold War." Microsoft® Encarta® Online Encyclopedia 2000. n. pag. http://encarta.msn.com/find/Concise.asp?z=l&pg=2&ti=761569374. Excerpt from article. 3 January 2001.
4. "Cold War Memories." Excerpt from community archive, n. pag. http://www.cnn.com/SPECIALS/cold.war/episodes/24/. 10 February 2001.
5. Department of Defense (DoD). The Report of the Department on Base Realignment and Closure. Requirement by Section 2824, National Defense Authorization Act, 1998, Public Law No. 105-85. Washington: GPO, April 1998.
6. Editor. Air Force Magazine, Almanac edition. (May 1973 - 2000).
7. FM: CHINFO WASHINGTON DC. "Public Affairs Guidance for Two Proposed BRAC Rounds." Electronic Message. 211201Z, April 1999.
8. Fogleman, General Ronald R., Chief of Staff, U.S. Air Force. "A Vision for the 21st Century Air Force." Address to the Heritage Foundation, Washington DC, 13 December 1996.
9. Garamone, Jim. "Optempo, Perstempo: What They Mean." Article, n. pag. http://www.defenselink.mil/news/Augl999/n08181999_9908181 .html. 24 January 2001.
10. Garrity, Patrick J. "The Quadrennial Defense Review Tries to be All Things for All People," n. pag. http://www.comw.org/qdr/pgarrity.htm. The Claremont Institute, 1997.
11. General Accounting Office (GAO). Future Years Defense Program: Funding Increase and Planned Savings in Fiscal Year 2000 Program Are at Risk. GAO/NSIAD-00-11. Washington: GPO, 1999.
12. General Accounting Office (GAO). Military Base Closures: Reducing High Costs of Environmental Cleanup Requires Difficult Choices. GAO/NSIAD-96- 172. Washington: GPO, 1996.
86

13. General Accounting Office (GAO). Military Bases: Closure and Realignment Savings Are Significant, but Not Easily Quantified. GAO/NSIAD-96-67. Washington: GPO, 1996.
14. General Accounting Office (GAO). Military Bases: Lessons Learned From Prior Base Closure Rounds (Chapter Report). GAO/NSIAD-97-151. Washington: GPO, 1997.
15. General Accounting Office (GAO). Military Bases: Status of Prior Base Realignment and Closure Rounds. GAO/NSIAD-99-36. Washington: GPO, 1998.
16. "Master Facilities Closures List." Excerpt from facts sheet, n. pag. http://www.afbca.hq.af.mil/. 1 January 2001.
17. Silverberg, David. "BRAC Attach!" Armed Forces Journal International: 40-41, March 1995.
87

Vita
Captain Charles S. Tapp II graduated from Deep Creek High School in
Chesapeake, Virginia in June 1992. He entered undergraduate studies at North Carolina
Agricultural and Technical State University in Greensboro, North Carolina where he
graduated with a Bachelor of Science degree in Accounting in May 1996 with summa
cum laude honors. He was commissioned through the Detachment 605 Air Force ROTC
at North Carolina Agricultural and Technical State University where he was recognized
as a Distinguished Graduate and nominated for a Regular Commission.
His first assignment was to the 354th Comptroller Flight, Eielson AFB, Alaska
where he worked as the Chief of the Financial Services branch, and subsequently as the
Deputy Chief of the Financial Analysis branch. While stationed at Eielson, he deployed
in January 1999 for six months to serve as the Financial Services Officer and Central Air
Force Disbursing Agent, Joint Task Force-Southwest Asia, Riyadh, Kingdom of Saudi
Arabia, in support of Operation SOUTHERN WATCH. In August 1999, he entered the
Graduate School of Engineering and Management, Air Force Institute of Technology.
Upon graduation, he will be assigned to the Air Force Cost Analysis Agency.
88

REPORT DOCUMENTATION PAGE Form Approved OMB No. 074-0188
The public reporting burden for this collection of information is estimated to average 1 hour per response, including the time for reviewing instructions, searching existing data sources, gathenng and maintaining the data needed, and completing and reviewing the collection of information. Send comments regarding this burden estimate or any other aspect of the collection of information, including suggestions for reducing this burden to Department of Defense, Washington Headquarters Services, Directorate for Information Operations and Reports (0704-0188), 1215 Jefferson Davis Highway Suite 1204, Arlington, VA 22202-4302. Respondents should be aware that notwithstanding any other provision of law, no person shall be subject to an penalty for failing to comply with a collection of information if it does not display a currently valid OMB control number. PLEASE DO NOT RETURN YOUR FORM TO THE ABOVE ADDRESS. 1. REPORT DATE (DD-MM-YYYY)
20-03-2001 .REPORT TYPE Master's Thesis
4. TITLE AND SUBTITLE
BRAC TO THE FUTURE: AN ANALYSIS OF PAST SAVINGS FROM BASE CLOSINGS
6. AUTHOR(S)
Tapp, Charles S. n, Captain, USAF
7. PERFORMING ORGANIZATION NAMES(S) AND ADDRESS(S)
Air Force Institute of Technology Graduate School of Engineering and Management (AFIT/EN) 2950 P Street, Building 640 WPAFB OH 45433-7765
3. DATES COVERED (From - To) Jan 2000 - Mar 2001
5a. CONTRACT NUMBER
5b. GRANT NUMBER
5c. PROGRAM ELEMENT NUMBER
5d. PROJECT NUMBER ENR#00-73
5e. TASK NUMBER
5f. WORK UNIT NUMBER
9. SPONSORING/MONITORING AGENCY NAME(S) AND ADDRESS(ES)
OSD PA&E (RA) Attn: Dr. R. P. Burke, Director of Operations Analysis & Procurement Planning Division 1800 Defense Pentagon Washington D.C. 20301-1800 Commercial: 703-697-5056 Email: [email protected]
8. PERFORMING ORGANIZATION REPORT NUMBER
AF1T/GAQ/ENS/01M-02
10. SPONSOR/MONITOR'S ACRONYM(S)
11. SPONSOR/MONITOR'S REPORT NUMBER(S)
12. DISTRIBUTION/AVAILABILITY STATEMENT
APPROVED FOR PUBLIC RELEASE; DISTRIBUTION UNLIMITED.
13. SUPPLEMENTARY NOTES
14. ABSTRACT
This thesis uses regression to analyze the savings resulting from the previous four rounds of BRAC in terms of their affect on each of the Air Force budget appropriations. For each appropriation, while the number of major installations initially appears to be a significant determinant in explaining the change in the budget, the number of bases becomes insignificant if a surrogate for Air Force mission requirements is included as the explanatory variable. We tested three surrogate measures for mission requirements: number of flying hours, number of aircraft, and number of active duty personnel. In each case, we found the number of active duty Air Force members to be a better predictor of the budget level than the regression model that included the number of major installations. We conclude that mission requirements are a better indicator of the required funding than the number of major installations.
15. SUBJECT TERMS Base Closures, Infrastructure, Military Budgets, Military Personnel
16. SECURITY CLASSIFICATION OF:
REPOR T
ABSTR ACT
c. THIS PAGE
17. LIMITATION OF ABSTRACT
UU
18. NUMBER OF PAGES
99
19a. NAME OF RESPONSIBLE PERSON Lt Col Mark A. Gallagher, ENS
19b. TELEPHONE NUMBER (Include area code) (937) 255-3636, ext. 4335 [email protected]
Standard Form 298 (Rev. 8-98) Prescribed by ANSI Std. Z39-18
Form Approved OMB No. 074-0188