BR CTF submission workbook - UNFCCC · BR CTF submission workbook ... N 2 O emissions ......
45
Submission Year 2014 Party CZECH REPUBLIC Submission Version v1.0 Submission Level Submitted Submission Key CZE_2014_V1.0 Submission Status Closed Submitted By Michal Danhelka Workbook Created 31.01.2014 11:58:36 Submitted Date 31.01.2014 11:58:26 Table 1s1 Table 1s2 Table 1s3 Table 1(a)s1 Table 1(a)s2 Table 1(a)s3 Table 1(b)s1 Table 1(b)s2 Table 1(b)s3 Table 1(c)s1 Table 1(c)s2 Table 1(c)s3 Table 1(d)s1 Table 1(d)s2 Table 1(d)s3 Table 2(a) Table 2(b) Table 2(c) Table 2(d) Table 2(e)I Table 2(e)II Table 2(f) Table 3 Table 4 Table 4(a)I_2011 Table 4(a)I_2012 Table 4(a)II Table 4(b) Table 5 Table 6(a) Table 6(b) Greenhouse gas projections: Scenario 'without measures' was not included. Table 6(c) Table 7_2011 Table 7_2012 Table 7(a)_2011 Table 7(a)_2012 Table 7(b)_2011 Table 7(b)_2012 Table 8 Table 9 BR CTF submission workbook Contents
Transcript of BR CTF submission workbook - UNFCCC · BR CTF submission workbook ... N 2 O emissions ......

Submission Year 2014 Party CZECH REPUBLIC
Submission Version v1.0 Submission Level Submitted
Submission Key CZE_2014_V1.0 Submission Status Closed
Submitted By Michal Danhelka Workbook Created 31.01.2014 11:58:36
Submitted Date 31.01.2014 11:58:26
Table 1s1
Table 1s2
Table 1s3
Table 1(a)s1
Table 1(a)s2
Table 1(a)s3
Table 1(b)s1
Table 1(b)s2
Table 1(b)s3
Table 1(c)s1
Table 1(c)s2
Table 1(c)s3
Table 1(d)s1
Table 1(d)s2
Table 1(d)s3
Table 2(a)
Table 2(b)
Table 2(c)
Table 2(d)
Table 2(e)I
Table 2(e)II
Table 2(f)
Table 3
Table 4
Table 4(a)I_2011
Table 4(a)I_2012
Table 4(a)II
Table 4(b)
Table 5
Table 6(a)
Table 6(b)
Greenhouse gas projections:
Scenario 'without measures' was
not included.
Table 6(c)
Table 7_2011
Table 7_2012
Table 7(a)_2011
Table 7(a)_2012
Table 7(b)_2011
Table 7(b)_2012
Table 8
Table 9
BR CTF submission workbook
Contents
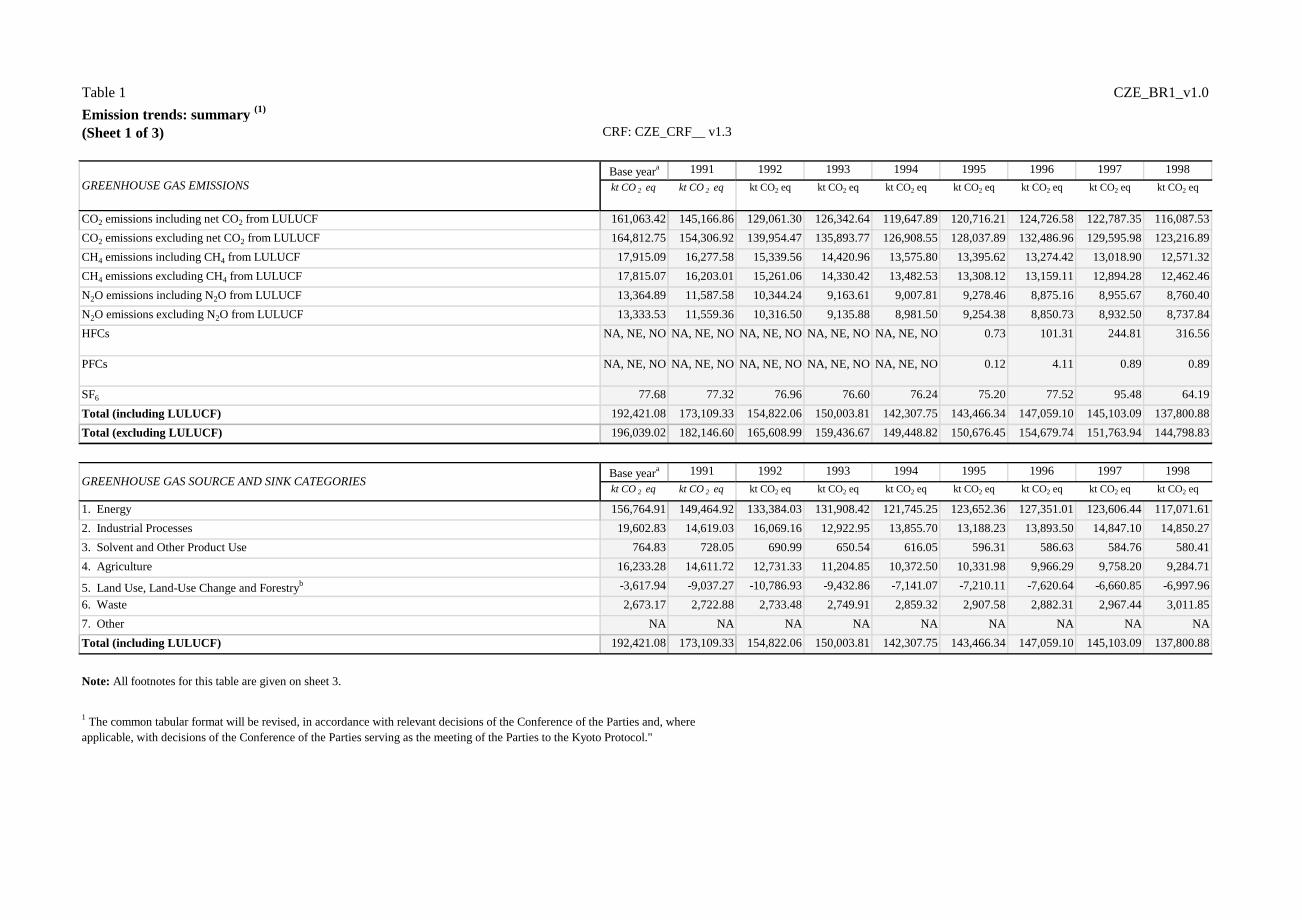
Table 1 CZE_BR1_v1.0
Emission trends: summary (1) Source: Submission 2014 v1.3, CZECH REPUBLIC
(Sheet 1 of 3) CRF: CZE_CRF__ v1.3
Base yeara 1991 1992 1993 1994 1995 1996 1997 1998
kt CO 2 eq kt CO 2 eq kt CO2 eq kt CO2 eq kt CO2 eq kt CO2 eq kt CO2 eq kt CO2 eq kt CO2 eq
CO2 emissions including net CO2 from LULUCF 161,063.42 145,166.86 129,061.30 126,342.64 119,647.89 120,716.21 124,726.58 122,787.35 116,087.53
CO2 emissions excluding net CO2 from LULUCF 164,812.75 154,306.92 139,954.47 135,893.77 126,908.55 128,037.89 132,486.96 129,595.98 123,216.89
CH4 emissions including CH4 from LULUCF 17,915.09 16,277.58 15,339.56 14,420.96 13,575.80 13,395.62 13,274.42 13,018.90 12,571.32
CH4 emissions excluding CH4 from LULUCF 17,815.07 16,203.01 15,261.06 14,330.42 13,482.53 13,308.12 13,159.11 12,894.28 12,462.46
N2O emissions including N2O from LULUCF 13,364.89 11,587.58 10,344.24 9,163.61 9,007.81 9,278.46 8,875.16 8,955.67 8,760.40
N2O emissions excluding N2O from LULUCF 13,333.53 11,559.36 10,316.50 9,135.88 8,981.50 9,254.38 8,850.73 8,932.50 8,737.84
HFCs NA, NE, NO NA, NE, NO NA, NE, NO NA, NE, NO NA, NE, NO 0.73 101.31 244.81 316.56
PFCs NA, NE, NO NA, NE, NO NA, NE, NO NA, NE, NO NA, NE, NO 0.12 4.11 0.89 0.89
SF6 77.68 77.32 76.96 76.60 76.24 75.20 77.52 95.48 64.19
Total (including LULUCF) 192,421.08 173,109.33 154,822.06 150,003.81 142,307.75 143,466.34 147,059.10 145,103.09 137,800.88
Total (excluding LULUCF) 196,039.02 182,146.60 165,608.99 159,436.67 149,448.82 150,676.45 154,679.74 151,763.94 144,798.83
Base yeara 1991 1992 1993 1994 1995 1996 1997 1998
kt CO 2 eq kt CO 2 eq kt CO2 eq kt CO2 eq kt CO2 eq kt CO2 eq kt CO2 eq kt CO2 eq kt CO2 eq
1. Energy 156,764.91 149,464.92 133,384.03 131,908.42 121,745.25 123,652.36 127,351.01 123,606.44 117,071.61
2. Industrial Processes 19,602.83 14,619.03 16,069.16 12,922.95 13,855.70 13,188.23 13,893.50 14,847.10 14,850.27
3. Solvent and Other Product Use 764.83 728.05 690.99 650.54 616.05 596.31 586.63 584.76 580.41
4. Agriculture 16,233.28 14,611.72 12,731.33 11,204.85 10,372.50 10,331.98 9,966.29 9,758.20 9,284.71
5. Land Use, Land-Use Change and Forestryb -3,617.94 -9,037.27 -10,786.93 -9,432.86 -7,141.07 -7,210.11 -7,620.64 -6,660.85 -6,997.96
6. Waste 2,673.17 2,722.88 2,733.48 2,749.91 2,859.32 2,907.58 2,882.31 2,967.44 3,011.85
7. Other NA NA NA NA NA NA NA NA NA
Total (including LULUCF) 192,421.08 173,109.33 154,822.06 150,003.81 142,307.75 143,466.34 147,059.10 145,103.09 137,800.88
Note: All footnotes for this table are given on sheet 3.
GREENHOUSE GAS EMISSIONS
1 The common tabular format will be revised, in accordance with relevant decisions of the Conference of the Parties and, where
applicable, with decisions of the Conference of the Parties serving as the meeting of the Parties to the Kyoto Protocol."
GREENHOUSE GAS SOURCE AND SINK CATEGORIES

Table 1 CZE_BR1_v1.0
Emission trends: summary (1) Source: Submission 2014 v1.3, CZECH REPUBLIC
(Sheet 2 of 3) CRF: CZE_CRF__ v1.3
1999 2000 2001 2002 2003 2004 2005 2006 2007 2008
kt CO 2 eq kt CO 2 eq kt CO2 eq kt CO2 eq kt CO2 eq kt CO2 eq kt CO2 eq kt CO2 eq kt CO2 eq kt CO2 eq
CO2 emissions including net CO2 from LULUCF 108,360.14 118,075.11 117,473.69 114,371.25 119,617.89 120,188.53 118,926.93 123,501.76 126,412.32 117,067.00
CO2 emissions excluding net CO2 from LULUCF 115,636.37 125,711.08 125,466.64 122,126.15 125,510.87 126,509.64 125,744.39 127,127.71 127,346.27 122,004.67
CH4 emissions including CH4 from LULUCF 11,975.71 11,176.34 10,886.27 10,501.16 10,445.75 10,155.47 10,513.46 10,816.51 10,470.03 10,532.74
CH4 emissions excluding CH4 from LULUCF 11,875.05 11,083.87 10,789.99 10,397.68 10,316.49 10,036.85 10,400.20 10,676.46 10,288.20 10,389.11
N2O emissions including N2O from LULUCF 8,593.51 8,697.13 8,859.36 8,561.65 8,060.21 8,753.05 8,443.31 8,277.19 8,313.75 8,436.79
N2O emissions excluding N2O from LULUCF 8,572.98 8,677.87 8,840.60 8,542.76 8,039.14 8,733.51 8,424.61 8,255.95 8,288.47 8,415.61
HFCs 267.47 262.50 393.37 391.29 590.14 600.30 594.21 872.35 1,605.85 1,262.45
PFCs 2.55 8.81 12.35 13.72 24.53 17.33 10.08 22.56 20.16 27.48
SF6 76.98 141.92 168.73 67.72 101.25 51.89 85.88 83.07 75.85 47.04
Total (including LULUCF) 129,276.37 138,361.80 137,793.77 133,906.79 138,839.78 139,766.55 138,573.86 143,573.44 146,897.96 137,373.51
Total (excluding LULUCF) 136,431.41 145,886.05 145,671.68 141,539.32 144,582.43 145,949.52 145,259.37 147,038.10 147,624.79 142,146.37
1999 2000 2001 2002 2003 2004 2005 2006 2007 2008
kt CO 2 eq kt CO 2 eq kt CO2 eq kt CO2 eq kt CO2 eq kt CO2 eq kt CO2 eq kt CO2 eq kt CO2 eq kt CO2 eq
1. Energy 111,370.65 119,603.41 119,901.74 116,255.36 118,757.78 119,162.73 120,084.32 120,767.73 120,111.99 115,470.97
2. Industrial Processes 12,102.86 13,561.11 12,885.78 12,546.46 13,656.01 14,239.70 12,979.24 14,156.44 15,264.70 14,085.39
3. Solvent and Other Product Use 578.49 568.56 549.96 539.65 525.16 519.28 513.77 512.93 512.17 515.27
4. Agriculture 9,350.12 9,094.86 9,220.88 8,955.86 8,314.94 8,750.49 8,385.03 8,249.77 8,403.04 8,583.06
5. Land Use, Land-Use Change and Forestryb -7,155.04 -7,524.24 -7,877.91 -7,632.54 -5,742.66 -6,182.96 -6,685.51 -3,464.66 -726.83 -4,772.86
6. Waste 3,029.28 3,058.11 3,113.32 3,242.00 3,328.53 3,277.31 3,297.01 3,351.23 3,332.89 3,491.67
7. Other NA NA NA NA NA NA NA NA NA NA
Total (including LULUCF) 129,276.37 138,361.80 137,793.77 133,906.79 138,839.78 139,766.55 138,573.86 143,573.44 146,897.96 137,373.51
Note: All footnotes for this table are given on sheet 3.
GREENHOUSE GAS EMISSIONS
GREENHOUSE GAS SOURCE AND SINK CATEGORIES
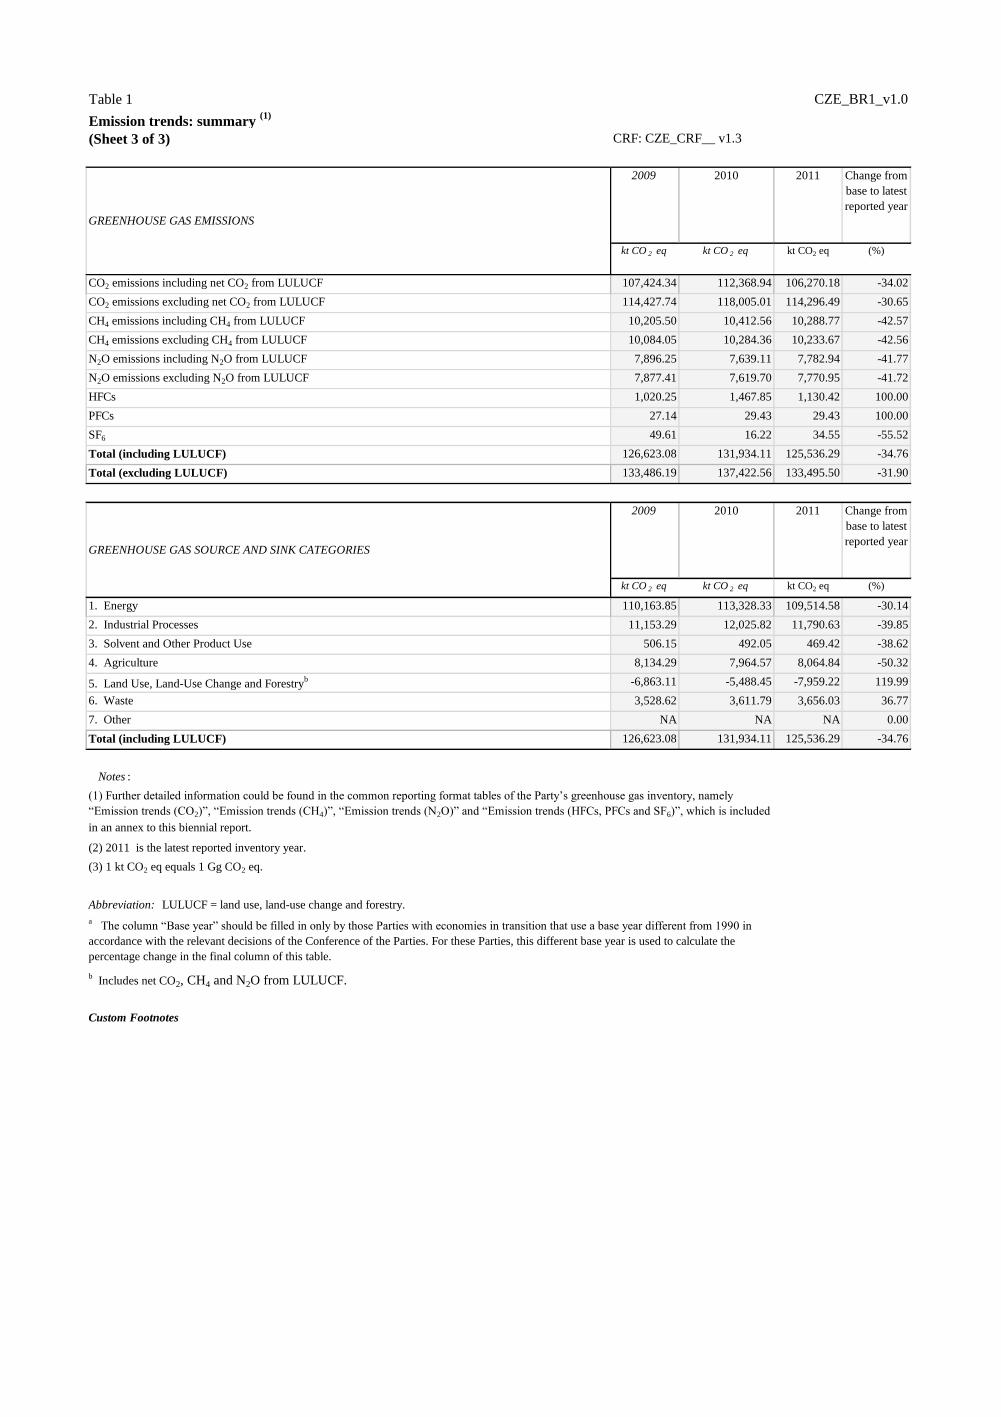
Table 1 CZE_BR1_v1.0
Emission trends: summary (1) Source: Submission 2014 v1.3, CZECH REPUBLIC
(Sheet 3 of 3) CRF: CZE_CRF__ v1.3
2009 2010 2011 Change from
base to latest
reported year
kt CO 2 eq kt CO 2 eq kt CO2 eq (%)
CO2 emissions including net CO2 from LULUCF 107,424.34 112,368.94 106,270.18 -34.02
CO2 emissions excluding net CO2 from LULUCF 114,427.74 118,005.01 114,296.49 -30.65
CH4 emissions including CH4 from LULUCF 10,205.50 10,412.56 10,288.77 -42.57
CH4 emissions excluding CH4 from LULUCF 10,084.05 10,284.36 10,233.67 -42.56
N2O emissions including N2O from LULUCF 7,896.25 7,639.11 7,782.94 -41.77
N2O emissions excluding N2O from LULUCF 7,877.41 7,619.70 7,770.95 -41.72
HFCs 1,020.25 1,467.85 1,130.42 100.00
PFCs 27.14 29.43 29.43 100.00
SF6 49.61 16.22 34.55 -55.52
Total (including LULUCF) 126,623.08 131,934.11 125,536.29 -34.76
Total (excluding LULUCF) 133,486.19 137,422.56 133,495.50 -31.90
2009 2010 2011 Change from
base to latest
reported year
kt CO 2 eq kt CO 2 eq kt CO2 eq (%)
1. Energy 110,163.85 113,328.33 109,514.58 -30.14
2. Industrial Processes 11,153.29 12,025.82 11,790.63 -39.85
3. Solvent and Other Product Use 506.15 492.05 469.42 -38.62
4. Agriculture 8,134.29 7,964.57 8,064.84 -50.32
5. Land Use, Land-Use Change and Forestryb -6,863.11 -5,488.45 -7,959.22 119.99
6. Waste 3,528.62 3,611.79 3,656.03 36.77
7. Other NA NA NA 0.00
Total (including LULUCF) 126,623.08 131,934.11 125,536.29 -34.76
Notes :
(3) 1 kt CO2 eq equals 1 Gg CO2 eq.
Custom Footnotes
a The column “Base year” should be filled in only by those Parties with economies in transition that use a base year different from 1990 in
accordance with the relevant decisions of the Conference of the Parties. For these Parties, this different base year is used to calculate the
percentage change in the final column of this table.
b Includes net CO2, CH4 and N2O from LULUCF.
GREENHOUSE GAS EMISSIONS
(1) Further detailed information could be found in the common reporting format tables of the Party’s greenhouse gas inventory, namely
“Emission trends (CO2)”, “Emission trends (CH4)”, “Emission trends (N2O)” and “Emission trends (HFCs, PFCs and SF6)”, which is included
in an annex to this biennial report.
Abbreviation: LULUCF = land use, land-use change and forestry.
(2) 2011 is the latest reported inventory year.
GREENHOUSE GAS SOURCE AND SINK CATEGORIES
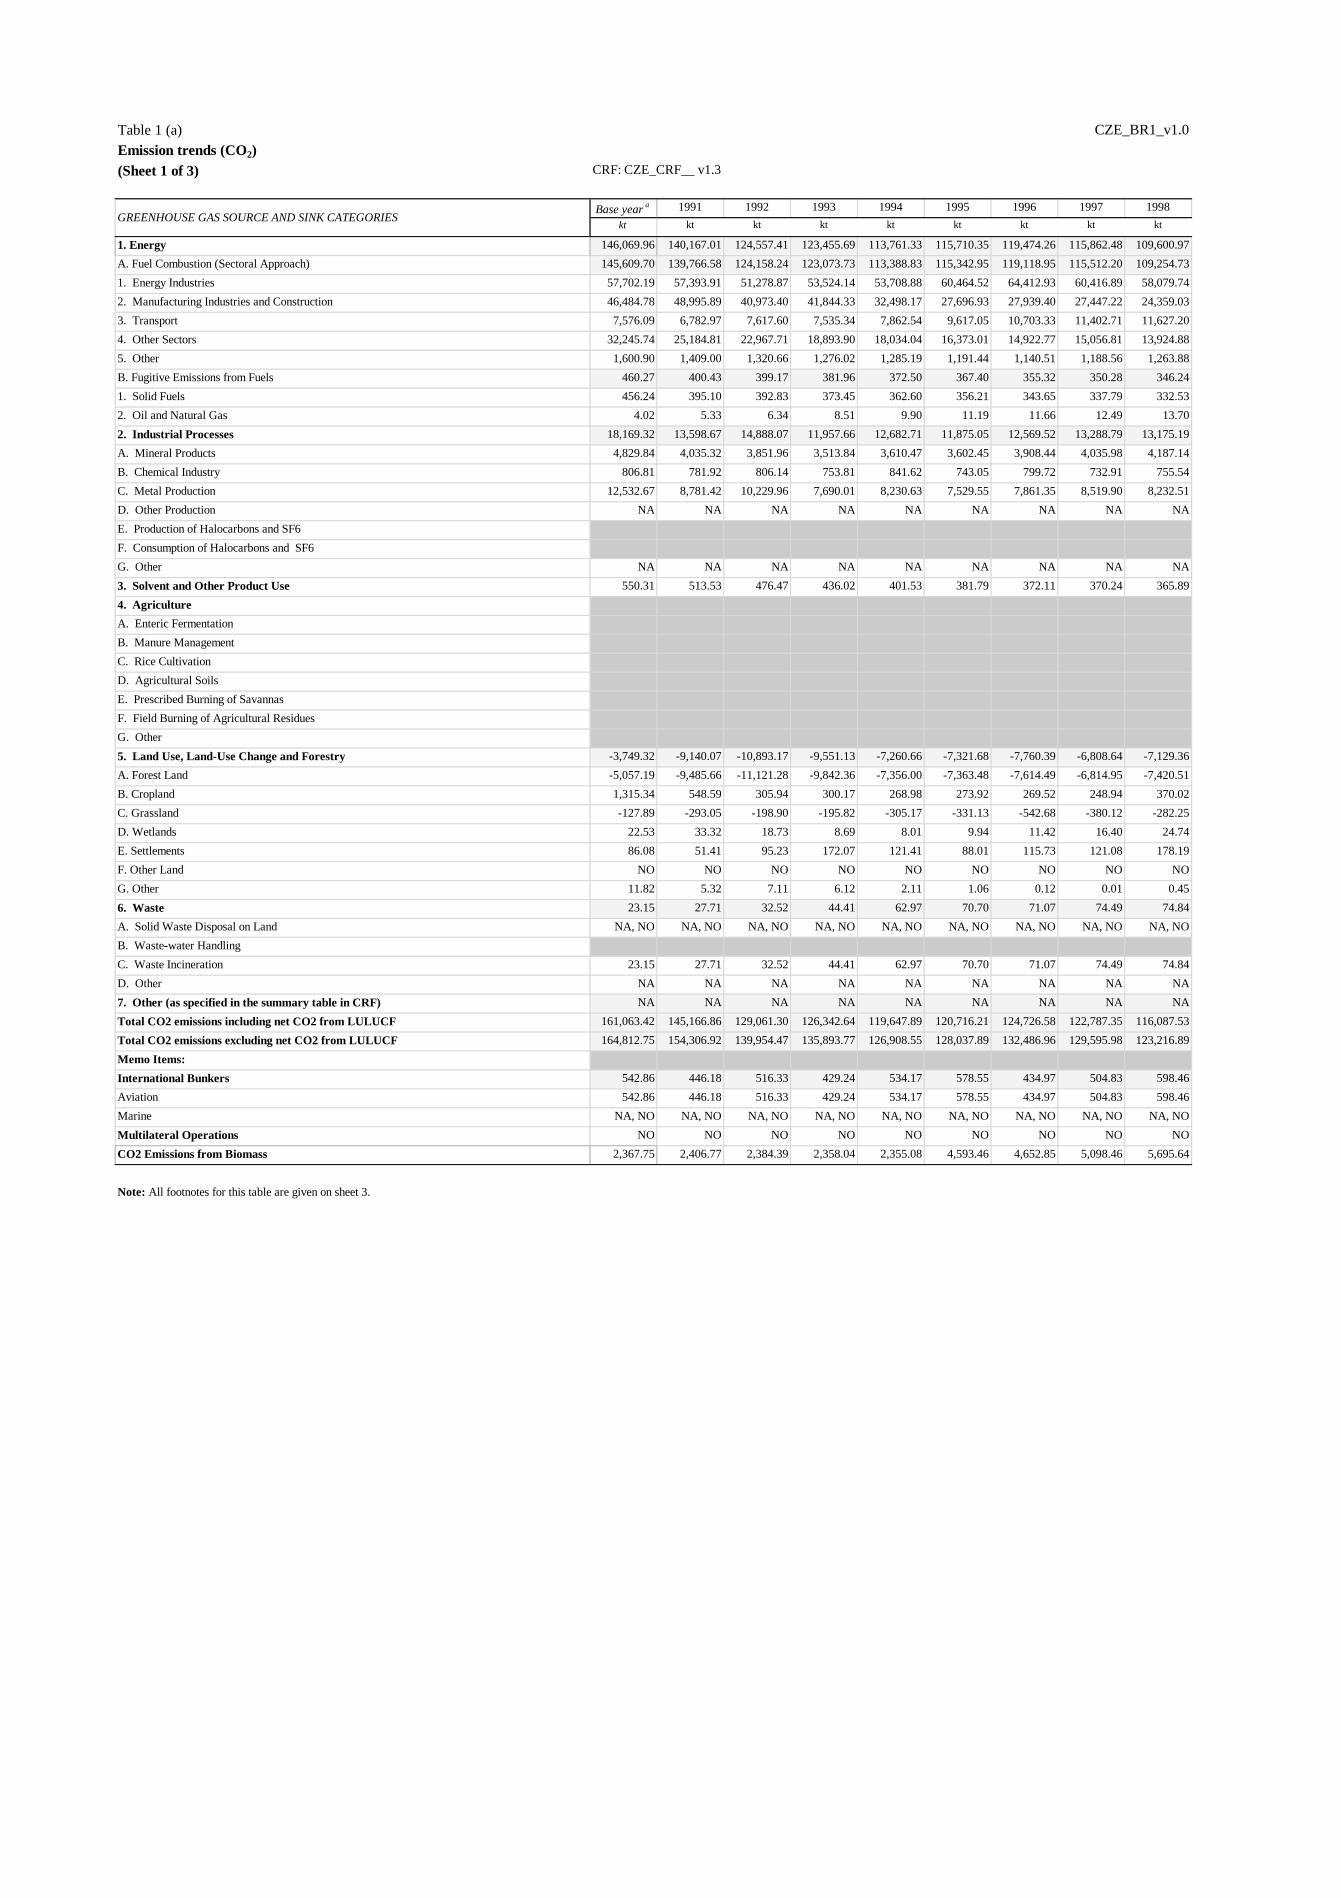
Table 1 (a) CZE_BR1_v1.0
Emission trends (CO2) Source: Submission 2014 v1.3, CZECH REPUBLIC
(Sheet 1 of 3) CRF: CZE_CRF__ v1.3
Base yeara 1991 1992 1993 1994 1995 1996 1997 1998
kt kt kt kt kt kt kt kt kt
1. Energy 146,069.96 140,167.01 124,557.41 123,455.69 113,761.33 115,710.35 119,474.26 115,862.48 109,600.97
A. Fuel Combustion (Sectoral Approach) 145,609.70 139,766.58 124,158.24 123,073.73 113,388.83 115,342.95 119,118.95 115,512.20 109,254.73
1. Energy Industries 57,702.19 57,393.91 51,278.87 53,524.14 53,708.88 60,464.52 64,412.93 60,416.89 58,079.74
2. Manufacturing Industries and Construction 46,484.78 48,995.89 40,973.40 41,844.33 32,498.17 27,696.93 27,939.40 27,447.22 24,359.03
3. Transport 7,576.09 6,782.97 7,617.60 7,535.34 7,862.54 9,617.05 10,703.33 11,402.71 11,627.20
4. Other Sectors 32,245.74 25,184.81 22,967.71 18,893.90 18,034.04 16,373.01 14,922.77 15,056.81 13,924.88
5. Other 1,600.90 1,409.00 1,320.66 1,276.02 1,285.19 1,191.44 1,140.51 1,188.56 1,263.88
B. Fugitive Emissions from Fuels 460.27 400.43 399.17 381.96 372.50 367.40 355.32 350.28 346.24
1. Solid Fuels 456.24 395.10 392.83 373.45 362.60 356.21 343.65 337.79 332.53
2. Oil and Natural Gas 4.02 5.33 6.34 8.51 9.90 11.19 11.66 12.49 13.70
2. Industrial Processes 18,169.32 13,598.67 14,888.07 11,957.66 12,682.71 11,875.05 12,569.52 13,288.79 13,175.19
A. Mineral Products 4,829.84 4,035.32 3,851.96 3,513.84 3,610.47 3,602.45 3,908.44 4,035.98 4,187.14
B. Chemical Industry 806.81 781.92 806.14 753.81 841.62 743.05 799.72 732.91 755.54
C. Metal Production 12,532.67 8,781.42 10,229.96 7,690.01 8,230.63 7,529.55 7,861.35 8,519.90 8,232.51
D. Other Production NA NA NA NA NA NA NA NA NA
E. Production of Halocarbons and SF6
F. Consumption of Halocarbons and SF6
G. Other NA NA NA NA NA NA NA NA NA
3. Solvent and Other Product Use 550.31 513.53 476.47 436.02 401.53 381.79 372.11 370.24 365.89
4. Agriculture
A. Enteric Fermentation
B. Manure Management
C. Rice Cultivation
D. Agricultural Soils
E. Prescribed Burning of Savannas
F. Field Burning of Agricultural Residues
G. Other
5. Land Use, Land-Use Change and Forestry -3,749.32 -9,140.07 -10,893.17 -9,551.13 -7,260.66 -7,321.68 -7,760.39 -6,808.64 -7,129.36
A. Forest Land -5,057.19 -9,485.66 -11,121.28 -9,842.36 -7,356.00 -7,363.48 -7,614.49 -6,814.95 -7,420.51
B. Cropland 1,315.34 548.59 305.94 300.17 268.98 273.92 269.52 248.94 370.02
C. Grassland -127.89 -293.05 -198.90 -195.82 -305.17 -331.13 -542.68 -380.12 -282.25
D. Wetlands 22.53 33.32 18.73 8.69 8.01 9.94 11.42 16.40 24.74
E. Settlements 86.08 51.41 95.23 172.07 121.41 88.01 115.73 121.08 178.19
F. Other Land NO NO NO NO NO NO NO NO NO
G. Other 11.82 5.32 7.11 6.12 2.11 1.06 0.12 0.01 0.45
6. Waste 23.15 27.71 32.52 44.41 62.97 70.70 71.07 74.49 74.84
A. Solid Waste Disposal on Land NA, NO NA, NO NA, NO NA, NO NA, NO NA, NO NA, NO NA, NO NA, NO
B. Waste-water Handling
C. Waste Incineration 23.15 27.71 32.52 44.41 62.97 70.70 71.07 74.49 74.84
D. Other NA NA NA NA NA NA NA NA NA
7. Other (as specified in the summary table in CRF) NA NA NA NA NA NA NA NA NA
Total CO2 emissions including net CO2 from LULUCF 161,063.42 145,166.86 129,061.30 126,342.64 119,647.89 120,716.21 124,726.58 122,787.35 116,087.53
Total CO2 emissions excluding net CO2 from LULUCF 164,812.75 154,306.92 139,954.47 135,893.77 126,908.55 128,037.89 132,486.96 129,595.98 123,216.89
Memo Items:
International Bunkers 542.86 446.18 516.33 429.24 534.17 578.55 434.97 504.83 598.46
Aviation 542.86 446.18 516.33 429.24 534.17 578.55 434.97 504.83 598.46
Marine NA, NO NA, NO NA, NO NA, NO NA, NO NA, NO NA, NO NA, NO NA, NO
Multilateral Operations NO NO NO NO NO NO NO NO NO
CO2 Emissions from Biomass 2,367.75 2,406.77 2,384.39 2,358.04 2,355.08 4,593.46 4,652.85 5,098.46 5,695.64
Note: All footnotes for this table are given on sheet 3.
GREENHOUSE GAS SOURCE AND SINK CATEGORIES

Table 1 (a) CZE_BR1_v1.0
Emission trends (CO2) Source: Submission 2014 v1.3, CZECH REPUBLIC
(Sheet 2 of 3) CRF: CZE_CRF__ v1.3
1999 2000 2001 2002 2003 2004 2005 2006 2007 2008
kt kt kt kt kt kt kt kt kt kt
1. Energy 104,525.20 113,364.08 113,941.04 110,671.96 113,134.49 113,653.92 114,118.67 114,510.23 114,181.79 109,584.07
A. Fuel Combustion (Sectoral Approach) 104,204.76 113,035.44 113,602.92 110,328.59 112,800.53 113,328.62 113,793.84 114,165.05 113,869.73 109,277.45
1. Energy Industries 56,022.65 59,287.69 61,555.98 59,942.45 59,891.14 59,919.14 60,866.72 60,319.79 63,914.45 58,766.58
2. Manufacturing Industries and Construction 22,184.89 27,126.45 24,645.31 23,805.06 23,305.89 23,455.69 23,150.65 22,547.22 20,272.50 20,476.73
3. Transport 11,817.01 11,931.81 12,771.81 13,344.93 15,129.28 15,891.71 17,220.94 17,548.71 18,470.60 18,321.07
4. Other Sectors 12,934.80 13,454.70 13,436.15 12,096.22 13,413.66 12,955.45 11,461.51 12,675.34 10,127.34 10,579.96
5. Other 1,245.41 1,234.79 1,193.67 1,139.94 1,060.56 1,106.63 1,094.02 1,073.99 1,084.84 1,133.10
B. Fugitive Emissions from Fuels 320.43 328.64 338.12 343.37 333.97 325.30 324.83 345.18 312.07 306.62
1. Solid Fuels 306.33 315.13 324.03 322.98 309.65 301.87 300.85 324.80 293.09 288.00
2. Oil and Natural Gas 14.10 13.50 14.09 20.39 24.32 23.43 23.98 20.39 18.98 18.62
2. Industrial Processes 10,670.75 11,929.93 11,104.03 11,005.01 11,873.66 12,370.50 11,151.25 12,128.39 12,665.02 11,897.10
A. Mineral Products 4,082.17 4,166.32 3,859.10 3,602.97 3,685.61 3,874.20 3,855.38 3,974.79 4,364.06 4,130.05
B. Chemical Industry 643.56 736.48 619.87 540.77 703.91 698.65 609.30 581.10 544.38 616.13
C. Metal Production 5,945.01 7,027.13 6,625.06 6,861.28 7,484.13 7,797.64 6,686.57 7,572.50 7,756.59 7,150.92
D. Other Production NA NA NA NA NA NA NA NA NA NA
E. Production of Halocarbons and SF6
F. Consumption of Halocarbons and SF6
G. Other NA NA NA NA NA NA NA NA NA NA
3. Solvent and Other Product Use 363.97 354.04 335.44 325.13 310.64 304.76 299.25 298.41 297.65 282.77
4. Agriculture
A. Enteric Fermentation
B. Manure Management
C. Rice Cultivation
D. Agricultural Soils
E. Prescribed Burning of Savannas
F. Field Burning of Agricultural Residues
G. Other
5. Land Use, Land-Use Change and Forestry -7,276.24 -7,635.97 -7,992.95 -7,754.90 -5,892.98 -6,321.11 -6,817.47 -3,625.95 -933.95 -4,937.68
A. Forest Land -7,342.05 -7,592.77 -7,910.17 -7,673.45 -5,882.05 -6,271.43 -6,750.22 -3,508.06 -795.02 -4,840.68
B. Cropland 200.64 200.40 180.03 155.41 161.75 141.95 144.77 134.27 127.23 165.09
C. Grassland -361.07 -418.60 -399.58 -395.66 -379.60 -393.06 -388.33 -394.01 -383.09 -384.39
D. Wetlands 24.03 27.70 11.69 33.71 22.75 19.19 20.44 19.89 19.55 22.26
E. Settlements 201.76 126.78 112.83 112.23 181.29 175.50 154.74 114.56 94.22 94.62
F. Other Land NO NO NO NO NO NO NO NO NO NO
G. Other 0.44 20.53 12.24 12.85 2.87 6.73 1.13 7.41 3.15 5.42
6. Waste 76.46 63.04 86.13 124.05 192.08 180.46 175.22 190.66 201.80 240.74
A. Solid Waste Disposal on Land NA, NO NA, NO NA, NO NA, NO NA, NO NA, NO NA, NO NA, NO NA, NO NA, NO
B. Waste-water Handling
C. Waste Incineration 76.46 63.04 86.13 124.05 192.08 180.46 175.22 190.66 201.80 240.74
D. Other NA NA NA NA NA NA NA NA NA NA
7. Other (as specified in the summary table in CRF) NA NA NA NA NA NA NA NA NA NA
Total CO2 emissions including net CO2 from LULUCF 108,360.14 118,075.11 117,473.69 114,371.25 119,617.89 120,188.53 118,926.93 123,501.76 126,412.32 117,067.00
Total CO2 emissions excluding net CO2 from LULUCF 115,636.37 125,711.08 125,466.64 122,126.15 125,510.87 126,509.64 125,744.39 127,127.71 127,346.27 122,004.67
Memo Items:
International Bunkers 563.22 615.42 657.05 567.40 763.13 980.81 1,019.22 1,044.31 1,095.74 1,161.28
Aviation 563.22 615.42 657.05 567.40 763.13 980.81 1,019.22 1,044.31 1,095.74 1,161.28
Marine NA, NO NA, NO NA, NO NA, NO NA, NO NA, NO NA, NO NA, NO NA, NO NA, NO
Multilateral Operations NO NO NO NO NO NO NO NO NO NO
CO2 Emissions from Biomass 5,788.24 5,353.62 5,900.00 6,108.53 6,377.73 7,070.48 7,180.62 7,755.42 8,821.97 8,885.86
Note: All footnotes for this table are given on sheet 3.
GREENHOUSE GAS SOURCE AND SINK CATEGORIES

Table 1(a) CZE_BR1_v1.0
Emission trends (CO2) Source: Submission 2014 v1.3, CZECH REPUBLIC
(Sheet 3 of 3) CRF: CZE_CRF__ v1.3
2009 2010 2011 Change
from base to
latest
reported
yearkt kt kt %
1. Energy 104,573.83 107,603.34 103,872.26 -28.89
A. Fuel Combustion (Sectoral Approach) 104,306.51 107,330.28 103,603.96 -28.85
1. Energy Industries 55,907.25 58,602.52 58,119.62 0.72
2. Manufacturing Industries and Construction 19,271.09 19,298.51 17,804.88 -61.70
3. Transport 17,761.96 16,728.75 16,564.58 118.64
4. Other Sectors 10,248.73 11,617.31 10,023.42 -68.92
5. Other 1,117.48 1,083.19 1,091.45 -31.82
B. Fugitive Emissions from Fuels 267.32 273.06 268.31 -41.71
1. Solid Fuels 250.22 259.30 255.45 -44.01
2. Oil and Natural Gas 17.10 13.76 12.86 219.64
2. Industrial Processes 9,381.36 9,962.44 9,999.94 -44.96
A. Mineral Products 3,449.11 3,425.23 3,823.69 -20.83
B. Chemical Industry 634.42 617.82 552.95 -31.47
C. Metal Production 5,297.83 5,919.38 5,623.30 -55.13
D. Other Production NA NA NA 0.00
E. Production of Halocarbons and SF6
F. Consumption of Halocarbons and SF6
G. Other NA NA NA 0.00
3. Solvent and Other Product Use 273.65 259.55 236.92 -56.95
4. Agriculture
A. Enteric Fermentation
B. Manure Management
C. Rice Cultivation
D. Agricultural Soils
E. Prescribed Burning of Savannas
F. Field Burning of Agricultural Residues
G. Other
5. Land Use, Land-Use Change and Forestry -7,003.40 -5,636.07 -8,026.31 114.07
A. Forest Land -6,869.63 -5,551.27 -7,964.19 57.48
B. Cropland 113.93 132.50 147.70 -88.77
C. Grassland -371.00 -371.32 -328.93 157.19
D. Wetlands 20.48 34.25 31.62 40.31
E. Settlements 102.79 117.51 87.48 1.63
F. Other Land NO NO NO 0.00
G. Other 0.04 2.25 0.01 -99.89
6. Waste 198.91 179.67 187.37 709.41
A. Solid Waste Disposal on Land NA, NO NA, NO NA, NO 0.00
B. Waste-water Handling
C. Waste Incineration 198.91 179.67 187.37 709.41
D. Other NA NA NA 0.00
7. Other (as specified in the summary table in CRF) NA NA NA 0.00
Total CO2 emissions including net CO2 from LULUCF 107,424.34 112,368.94 106,270.18 -34.02
Total CO2 emissions excluding net CO2 from LULUCF 114,427.74 118,005.01 114,296.49 -30.65
Memo Items:
International Bunkers 1,062.23 993.63 985.06 81.46
Aviation 1,062.23 993.63 985.06 81.46
Marine NA, NO NA, NO NA, NO 0.00
Multilateral Operations NO NO NO 0.00
CO2 Emissions from Biomass 9,464.47 10,692.28 11,258.62 375.50
Abbreviations : CRF = common reporting format, LULUCF = land use, land-use change and forestry.
Custom Footnotes
GREENHOUSE GAS SOURCE AND SINK CATEGORIES
a The column “Base year” should be filled in only by those Parties with economies in transition that use a base
year different from 1990 in accordance with the relevant decisions of the Conference of the Parties. For these
Parties, this different base year is used to calculate the percentage change in the final column of this table.
b Fill in net emissions/removals as reported in CRF table Summary 1.A of the latest reported inventory year.
For the purposes of reporting, the signs for removals are always negative (-) and for emissions positive (+).

Table 1(b) CZE_BR1_v1.0
Emission trends (CH4) Source: Submission 2014 v1.3, CZECH REPUBLIC
(Sheet 1 of 3) CRF: CZE_CRF__ v1.3
Base yeara 1991 1992 1993 1994 1995 1996 1997 1998
kt kt kt kt kt kt kt kt kt
1. Energy 474.33 409.52 389.15 371.09 349.36 344.15 339.16 332.34 318.57
A. Fuel Combustion (Sectoral Approach) 69.66 52.08 49.63 40.49 35.47 35.64 36.13 34.93 29.82
1. Energy Industries 0.67 0.68 0.60 0.64 0.63 0.72 0.81 0.81 0.81
2. Manufacturing Industries and Construction 4.31 4.88 3.91 4.22 3.34 2.88 2.85 2.91 2.61
3. Transport 1.38 1.19 1.41 1.41 1.51 1.67 1.83 1.91 1.88
4. Other Sectors 62.97 45.03 43.44 33.96 29.73 30.12 30.42 29.11 24.37
5. Other 0.34 0.29 0.27 0.26 0.26 0.24 0.22 0.19 0.14
B. Fugitive Emissions from Fuels 404.67 357.45 339.52 330.61 313.90 308.52 303.03 297.41 288.75
1. Solid Fuels 361.93 321.01 306.00 298.03 282.02 276.64 268.51 263.50 253.10
2. Oil and Natural Gas 42.74 36.43 33.52 32.58 31.87 31.87 34.52 33.90 35.65
2. Industrial Processes 6.93 5.95 4.67 4.76 4.88 5.10 5.20 4.76 4.63
A. Mineral Products 0.14 0.12 0.12 0.13 0.14 0.14 0.16 0.18 0.20
B. Chemical Industry 0.73 0.63 0.67 0.68 0.74 0.70 0.73 0.74 0.79
C. Metal Production 6.06 5.20 3.88 3.95 4.00 4.26 4.30 3.84 3.64
D. Other Production
E. Production of Halocarbons and SF6
F. Consumption of Halocarbons and SF6
G. Other NA NA NA NA NA NA NA NA NA
3. Solvent and Other Product Use
4. Agriculture 248.60 235.43 211.97 185.42 162.35 157.11 156.12 146.87 138.11
A. Enteric Fermentation 200.92 189.53 169.90 147.06 128.79 125.33 124.20 115.99 108.76
B. Manure Management 47.68 45.91 42.07 38.37 33.56 31.78 31.92 30.89 29.34
C. Rice Cultivation NO NO NO NO NO NO NO NO NO
D. Agricultural Soils NA, NE NA, NE NA, NE NA, NE NA, NE NA, NE NA, NE NA, NE NA, NE
E. Prescribed Burning of Savannas NO NO NO NO NO NO NO NO NO
F. Field Burning of Agricultural Residues NO NO NO NO NO NO NO NO NO
G. Other NA NA NA NA NA NA NA NA NA
5. Land Use, Land-Use Change and Forestry 4.76 3.55 3.74 4.31 4.44 4.17 5.49 5.93 5.18
A. Forest Land 4.76 3.55 3.74 4.31 4.44 4.17 5.49 5.93 5.18
B. Cropland NO NO NO NO NO NO NO NO NO
C. Grassland NO NO NO NO NO NO NO NO NO
D. Wetlands NA, NO NA, NO NA, NO NA, NO NA, NO NA, NO NA, NO NA, NO NA, NO
E. Settlements NA, NO NA, NO NA, NO NA, NO NA, NO NA, NO NA, NO NA, NO NA, NO
F. Other Land NA, NO NA, NO NA, NO NA, NO NA, NO NA, NO NA, NO NA, NO NA, NO
G. Other NA, NE NA, NE NA, NE NA, NE NA, NE NA, NE NA, NE NA, NE NA, NE
6. Waste 118.48 120.66 120.93 121.12 125.43 127.36 126.15 130.04 132.15
A. Solid Waste Disposal on Land 79.17 82.79 85.97 89.48 92.95 96.20 97.12 99.89 102.65
B. Waste-water Handling 39.31 37.88 34.96 31.64 32.48 31.16 29.02 30.16 29.50
C. Waste Incineration 0.00 0.00 0.00 0.00 0.00 0.00 0.00 0.00 0.00
D. Other NA NA NA NA NA NA NA NA NA
7. Other (as specified in the summary table in CRF) NA NA NA NA NA NA NA NA NA
Total CH4 emissions including CH4 from LULUCF 853.10 775.12 730.46 686.71 646.47 637.89 632.12 619.95 598.63
Total CH4 emissions excluding CH4 from LULUCF 848.34 771.57 726.72 682.40 642.03 633.72 626.62 614.01 593.45
Memo Items:
International Bunkers 0.09 0.07 0.08 0.07 0.09 0.10 0.07 0.08 0.10
Aviation 0.09 0.07 0.08 0.07 0.09 0.10 0.07 0.08 0.10
Marine NA, NO NA, NO NA, NO NA, NO NA, NO NA, NO NA, NO NA, NO NA, NO
Multilateral Operations NO NO NO NO NO NO NO NO NO
CO2 Emissions from Biomass
Note: All footnotes for this table are given on sheet 3.
GREENHOUSE GAS SOURCE AND SINK CATEGORIES
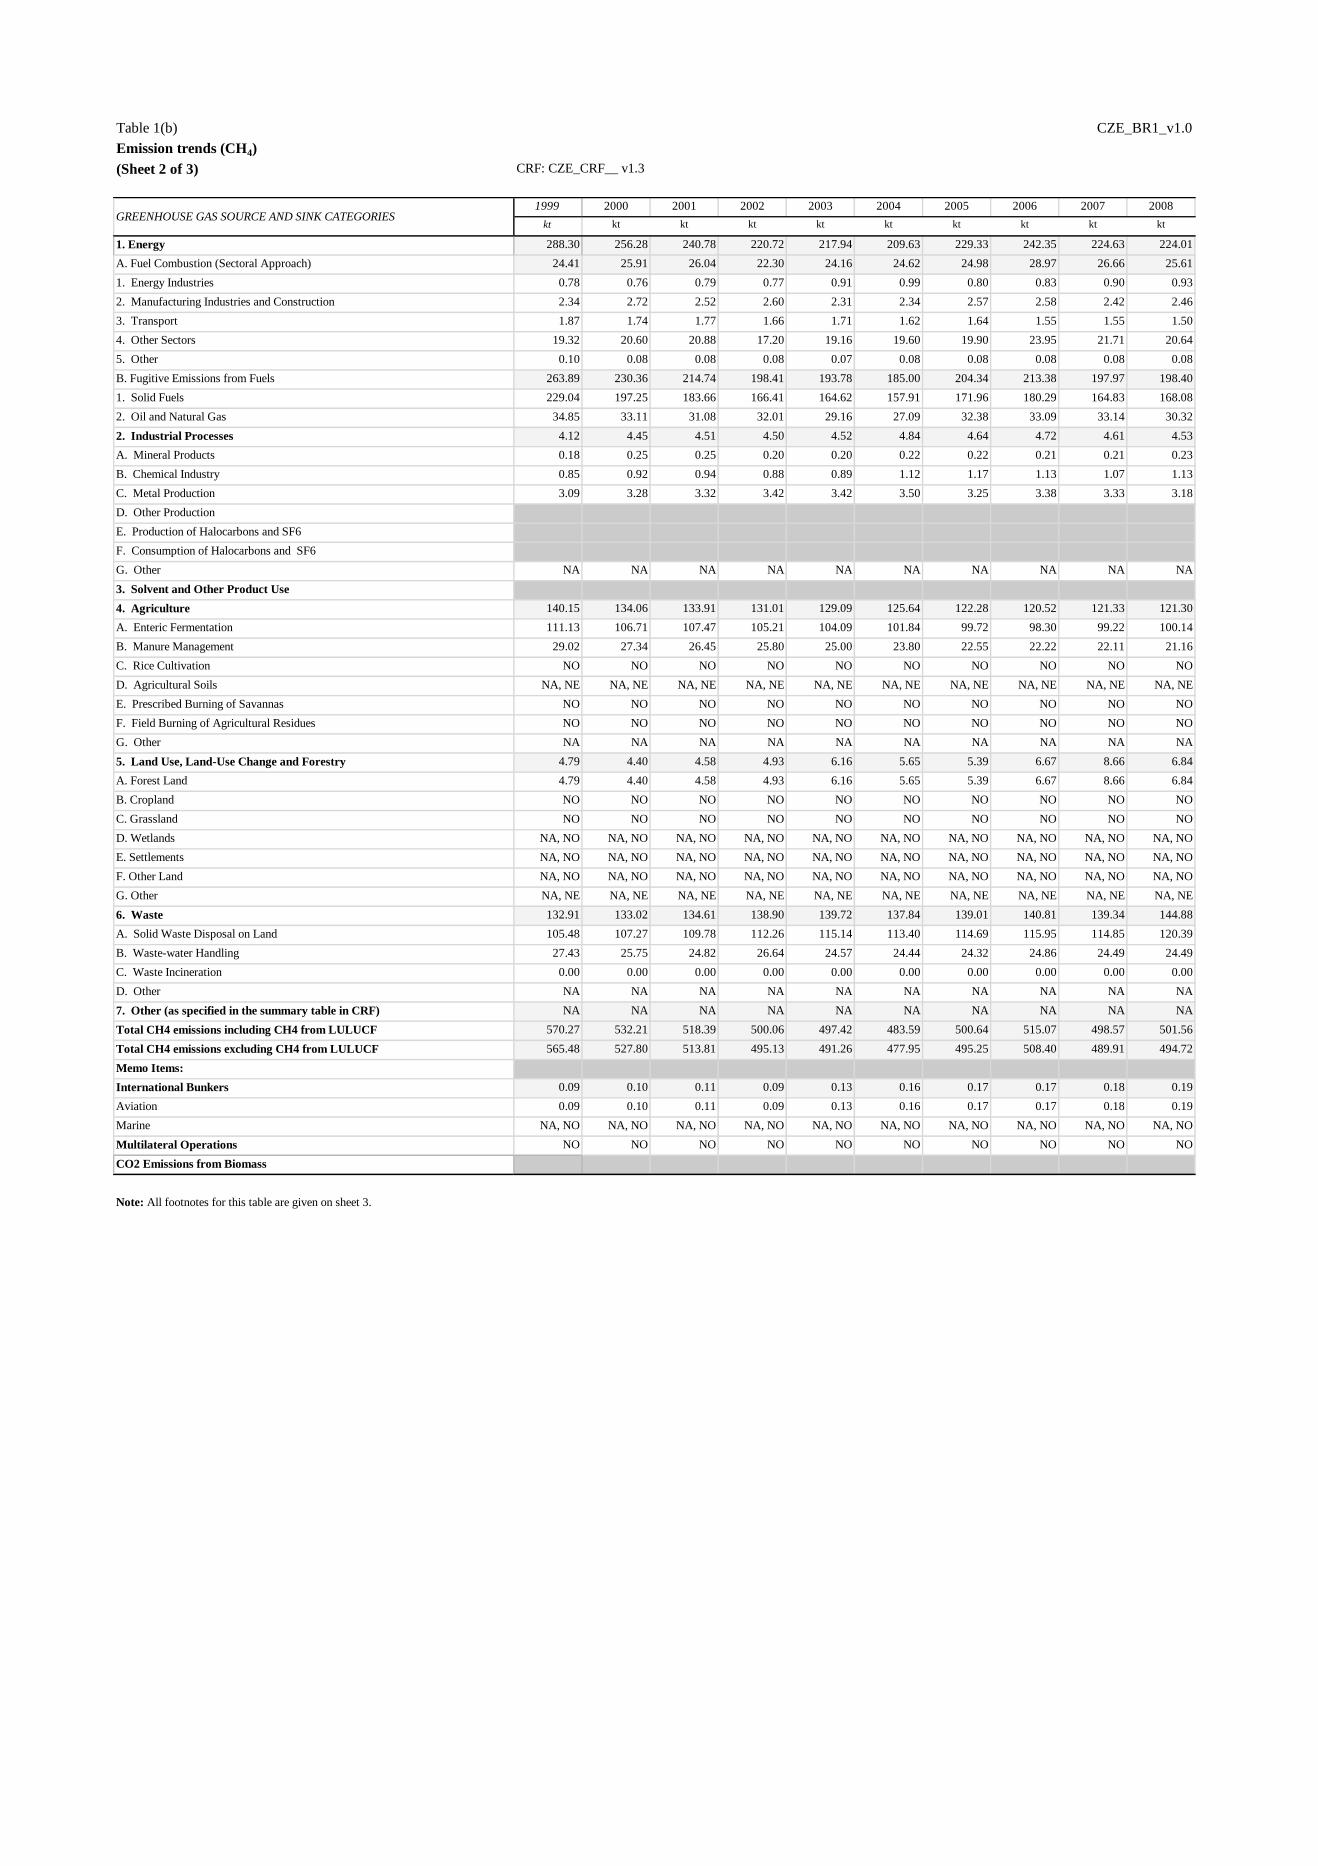
Table 1(b) CZE_BR1_v1.0
Emission trends (CH4) Source: Submission 2014 v1.3, CZECH REPUBLIC
(Sheet 2 of 3) CRF: CZE_CRF__ v1.3
1999 2000 2001 2002 2003 2004 2005 2006 2007 2008
kt kt kt kt kt kt kt kt kt kt
1. Energy 288.30 256.28 240.78 220.72 217.94 209.63 229.33 242.35 224.63 224.01
A. Fuel Combustion (Sectoral Approach) 24.41 25.91 26.04 22.30 24.16 24.62 24.98 28.97 26.66 25.61
1. Energy Industries 0.78 0.76 0.79 0.77 0.91 0.99 0.80 0.83 0.90 0.93
2. Manufacturing Industries and Construction 2.34 2.72 2.52 2.60 2.31 2.34 2.57 2.58 2.42 2.46
3. Transport 1.87 1.74 1.77 1.66 1.71 1.62 1.64 1.55 1.55 1.50
4. Other Sectors 19.32 20.60 20.88 17.20 19.16 19.60 19.90 23.95 21.71 20.64
5. Other 0.10 0.08 0.08 0.08 0.07 0.08 0.08 0.08 0.08 0.08
B. Fugitive Emissions from Fuels 263.89 230.36 214.74 198.41 193.78 185.00 204.34 213.38 197.97 198.40
1. Solid Fuels 229.04 197.25 183.66 166.41 164.62 157.91 171.96 180.29 164.83 168.08
2. Oil and Natural Gas 34.85 33.11 31.08 32.01 29.16 27.09 32.38 33.09 33.14 30.32
2. Industrial Processes 4.12 4.45 4.51 4.50 4.52 4.84 4.64 4.72 4.61 4.53
A. Mineral Products 0.18 0.25 0.25 0.20 0.20 0.22 0.22 0.21 0.21 0.23
B. Chemical Industry 0.85 0.92 0.94 0.88 0.89 1.12 1.17 1.13 1.07 1.13
C. Metal Production 3.09 3.28 3.32 3.42 3.42 3.50 3.25 3.38 3.33 3.18
D. Other Production
E. Production of Halocarbons and SF6
F. Consumption of Halocarbons and SF6
G. Other NA NA NA NA NA NA NA NA NA NA
3. Solvent and Other Product Use
4. Agriculture 140.15 134.06 133.91 131.01 129.09 125.64 122.28 120.52 121.33 121.30
A. Enteric Fermentation 111.13 106.71 107.47 105.21 104.09 101.84 99.72 98.30 99.22 100.14
B. Manure Management 29.02 27.34 26.45 25.80 25.00 23.80 22.55 22.22 22.11 21.16
C. Rice Cultivation NO NO NO NO NO NO NO NO NO NO
D. Agricultural Soils NA, NE NA, NE NA, NE NA, NE NA, NE NA, NE NA, NE NA, NE NA, NE NA, NE
E. Prescribed Burning of Savannas NO NO NO NO NO NO NO NO NO NO
F. Field Burning of Agricultural Residues NO NO NO NO NO NO NO NO NO NO
G. Other NA NA NA NA NA NA NA NA NA NA
5. Land Use, Land-Use Change and Forestry 4.79 4.40 4.58 4.93 6.16 5.65 5.39 6.67 8.66 6.84
A. Forest Land 4.79 4.40 4.58 4.93 6.16 5.65 5.39 6.67 8.66 6.84
B. Cropland NO NO NO NO NO NO NO NO NO NO
C. Grassland NO NO NO NO NO NO NO NO NO NO
D. Wetlands NA, NO NA, NO NA, NO NA, NO NA, NO NA, NO NA, NO NA, NO NA, NO NA, NO
E. Settlements NA, NO NA, NO NA, NO NA, NO NA, NO NA, NO NA, NO NA, NO NA, NO NA, NO
F. Other Land NA, NO NA, NO NA, NO NA, NO NA, NO NA, NO NA, NO NA, NO NA, NO NA, NO
G. Other NA, NE NA, NE NA, NE NA, NE NA, NE NA, NE NA, NE NA, NE NA, NE NA, NE
6. Waste 132.91 133.02 134.61 138.90 139.72 137.84 139.01 140.81 139.34 144.88
A. Solid Waste Disposal on Land 105.48 107.27 109.78 112.26 115.14 113.40 114.69 115.95 114.85 120.39
B. Waste-water Handling 27.43 25.75 24.82 26.64 24.57 24.44 24.32 24.86 24.49 24.49
C. Waste Incineration 0.00 0.00 0.00 0.00 0.00 0.00 0.00 0.00 0.00 0.00
D. Other NA NA NA NA NA NA NA NA NA NA
7. Other (as specified in the summary table in CRF) NA NA NA NA NA NA NA NA NA NA
Total CH4 emissions including CH4 from LULUCF 570.27 532.21 518.39 500.06 497.42 483.59 500.64 515.07 498.57 501.56
Total CH4 emissions excluding CH4 from LULUCF 565.48 527.80 513.81 495.13 491.26 477.95 495.25 508.40 489.91 494.72
Memo Items:
International Bunkers 0.09 0.10 0.11 0.09 0.13 0.16 0.17 0.17 0.18 0.19
Aviation 0.09 0.10 0.11 0.09 0.13 0.16 0.17 0.17 0.18 0.19
Marine NA, NO NA, NO NA, NO NA, NO NA, NO NA, NO NA, NO NA, NO NA, NO NA, NO
Multilateral Operations NO NO NO NO NO NO NO NO NO NO
CO2 Emissions from Biomass
Note: All footnotes for this table are given on sheet 3.
GREENHOUSE GAS SOURCE AND SINK CATEGORIES
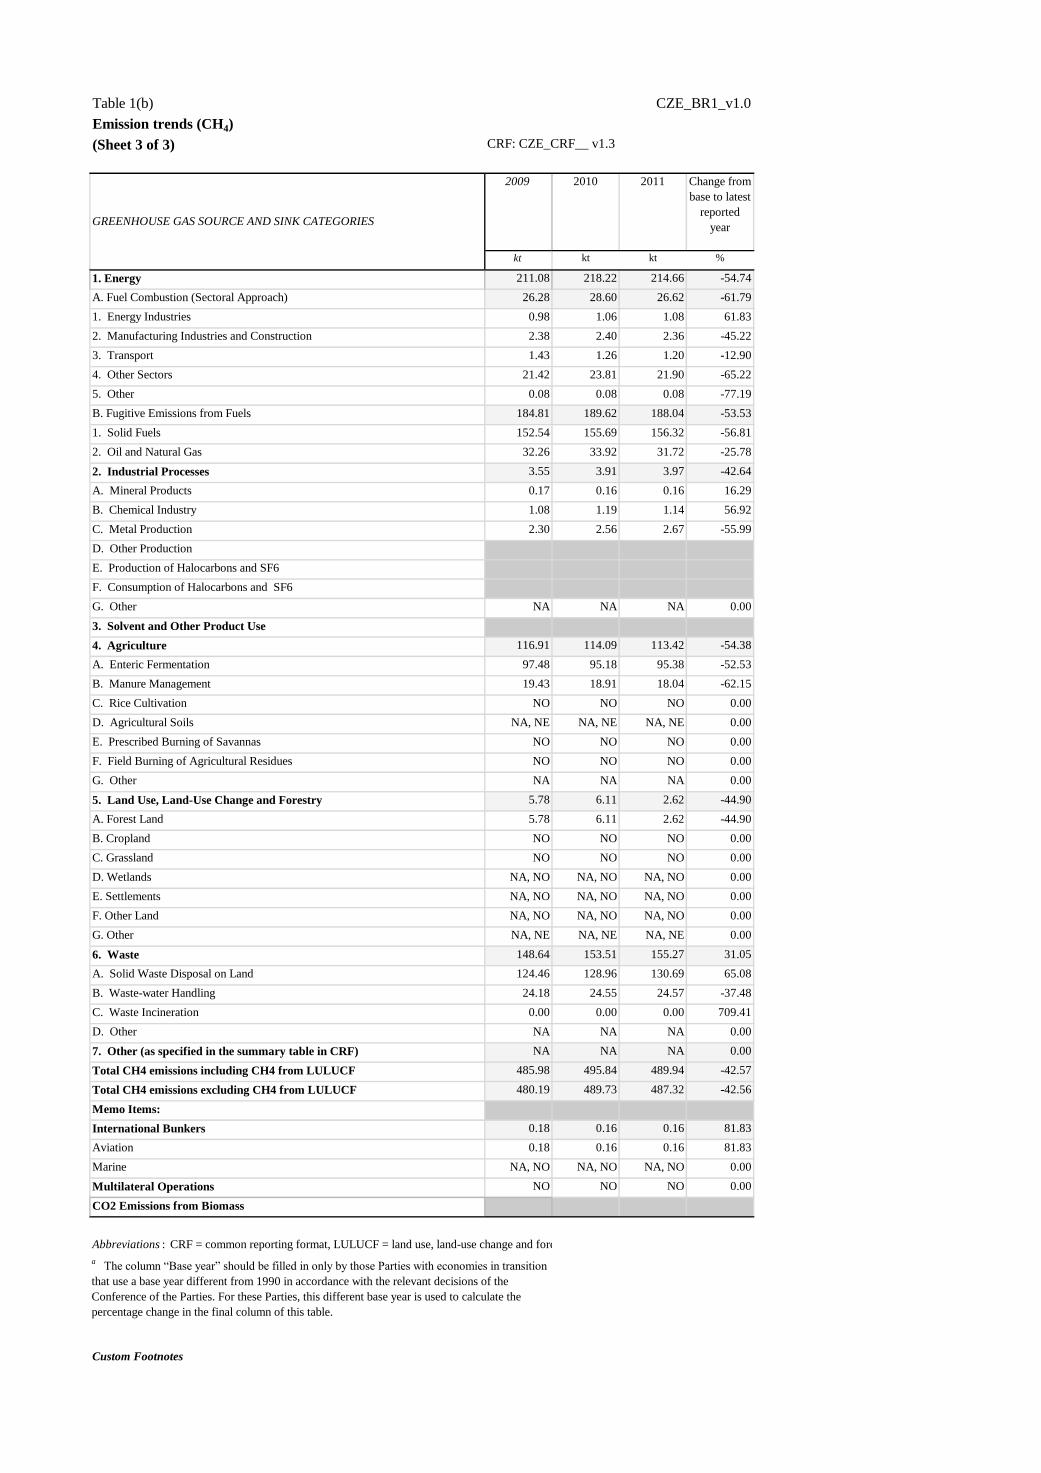
Table 1(b) CZE_BR1_v1.0
Emission trends (CH4) Source: Submission 2014 v1.3, CZECH REPUBLIC
(Sheet 3 of 3) CRF: CZE_CRF__ v1.3
2009 2010 2011 Change from
base to latest
reported
year
kt kt kt %
1. Energy 211.08 218.22 214.66 -54.74
A. Fuel Combustion (Sectoral Approach) 26.28 28.60 26.62 -61.79
1. Energy Industries 0.98 1.06 1.08 61.83
2. Manufacturing Industries and Construction 2.38 2.40 2.36 -45.22
3. Transport 1.43 1.26 1.20 -12.90
4. Other Sectors 21.42 23.81 21.90 -65.22
5. Other 0.08 0.08 0.08 -77.19
B. Fugitive Emissions from Fuels 184.81 189.62 188.04 -53.53
1. Solid Fuels 152.54 155.69 156.32 -56.81
2. Oil and Natural Gas 32.26 33.92 31.72 -25.78
2. Industrial Processes 3.55 3.91 3.97 -42.64
A. Mineral Products 0.17 0.16 0.16 16.29
B. Chemical Industry 1.08 1.19 1.14 56.92
C. Metal Production 2.30 2.56 2.67 -55.99
D. Other Production
E. Production of Halocarbons and SF6
F. Consumption of Halocarbons and SF6
G. Other NA NA NA 0.00
3. Solvent and Other Product Use
4. Agriculture 116.91 114.09 113.42 -54.38
A. Enteric Fermentation 97.48 95.18 95.38 -52.53
B. Manure Management 19.43 18.91 18.04 -62.15
C. Rice Cultivation NO NO NO 0.00
D. Agricultural Soils NA, NE NA, NE NA, NE 0.00
E. Prescribed Burning of Savannas NO NO NO 0.00
F. Field Burning of Agricultural Residues NO NO NO 0.00
G. Other NA NA NA 0.00
5. Land Use, Land-Use Change and Forestry 5.78 6.11 2.62 -44.90
A. Forest Land 5.78 6.11 2.62 -44.90
B. Cropland NO NO NO 0.00
C. Grassland NO NO NO 0.00
D. Wetlands NA, NO NA, NO NA, NO 0.00
E. Settlements NA, NO NA, NO NA, NO 0.00
F. Other Land NA, NO NA, NO NA, NO 0.00
G. Other NA, NE NA, NE NA, NE 0.00
6. Waste 148.64 153.51 155.27 31.05
A. Solid Waste Disposal on Land 124.46 128.96 130.69 65.08
B. Waste-water Handling 24.18 24.55 24.57 -37.48
C. Waste Incineration 0.00 0.00 0.00 709.41
D. Other NA NA NA 0.00
7. Other (as specified in the summary table in CRF) NA NA NA 0.00
Total CH4 emissions including CH4 from LULUCF 485.98 495.84 489.94 -42.57
Total CH4 emissions excluding CH4 from LULUCF 480.19 489.73 487.32 -42.56
Memo Items:
International Bunkers 0.18 0.16 0.16 81.83
Aviation 0.18 0.16 0.16 81.83
Marine NA, NO NA, NO NA, NO 0.00
Multilateral Operations NO NO NO 0.00
CO2 Emissions from Biomass
Custom Footnotes
GREENHOUSE GAS SOURCE AND SINK CATEGORIES
Abbreviations : CRF = common reporting format, LULUCF = land use, land-use change and forestry.
a The column “Base year” should be filled in only by those Parties with economies in transition
that use a base year different from 1990 in accordance with the relevant decisions of the
Conference of the Parties. For these Parties, this different base year is used to calculate the
percentage change in the final column of this table.

Table 1(c) CZE_BR1_v1.0
Emission trends (N2O) Source: Submission 2014 v1.3, CZECH REPUBLIC
(Sheet 1 of 3) CRF: CZE_CRF__ v1.3
Base yeara 1991 1992 1993 1994 1995 1996 1997 1998
kt kt kt kt kt kt kt kt kt
1. Energy 2.37 2.25 2.11 2.13 2.09 2.31 2.43 2.47 2.52
A. Fuel Combustion (Sectoral Approach) 2.37 2.25 2.11 2.13 2.09 2.31 2.43 2.47 2.52
1. Energy Industries 0.81 0.81 0.73 0.76 0.75 0.86 0.91 0.86 0.84
2. Manufacturing Industries and Construction 0.58 0.65 0.52 0.54 0.43 0.36 0.35 0.35 0.31
3. Transport 0.49 0.42 0.52 0.55 0.64 0.78 0.90 0.97 1.07
4. Other Sectors 0.43 0.32 0.29 0.22 0.21 0.26 0.23 0.23 0.22
5. Other 0.06 0.06 0.05 0.05 0.05 0.05 0.04 0.05 0.08
B. Fugitive Emissions from Fuels 0.00 0.00 0.00 0.00 0.00 0.00 0.00 0.00 0.00
1. Solid Fuels NA, NO NA, NO NA, NO NA, NO NA, NO NA, NO NA, NO NA, NO NA, NO
2. Oil and Natural Gas 0.00 0.00 0.00 0.00 0.00 0.00 0.00 0.00 0.00
2. Industrial Processes 3.90 2.64 3.25 2.54 3.21 3.64 3.33 3.60 3.86
A. Mineral Products NA NA NA NA NA NA NA NA NA
B. Chemical Industry 3.90 2.64 3.25 2.54 3.21 3.64 3.33 3.60 3.86
C. Metal Production NA NA NA NA NA NA NA NA NA
D. Other Production
E. Production of Halocarbons and SF6
F. Consumption of Halocarbons and SF6
G. Other NA NA NA NA NA NA NA NA NA
3. Solvent and Other Product Use 0.69 0.69 0.69 0.69 0.69 0.69 0.69 0.69 0.69
4. Agriculture 35.52 31.19 26.71 23.58 22.46 22.69 21.57 21.53 20.60
A. Enteric Fermentation
B. Manure Management 5.51 5.23 4.71 4.19 3.73 3.47 3.65 3.54 3.35
C. Rice Cultivation
D. Agricultural Soils 30.01 25.96 22.00 19.39 18.73 19.22 17.92 17.99 17.25
E. Prescribed Burning of Savannas NO NO NO NO NO NO NO NO NO
F. Field Burning of Agricultural Residues NO NO NO NO NO NO NO NO NO
G. Other NA NA NA NA NA NA NA NA NA
5. Land Use, Land-Use Change and Forestry 0.10 0.09 0.09 0.09 0.08 0.08 0.08 0.07 0.07
A. Forest Land 0.03 0.02 0.03 0.03 0.03 0.03 0.04 0.04 0.04
B. Cropland 0.07 0.07 0.06 0.06 0.05 0.05 0.04 0.03 0.04
C. Grassland NO NO NO NO NO NO NO NO NO
D. Wetlands NA, NO NA, NO NA, NO NA, NO NA, NO NA, NO NA, NO NA, NO NA, NO
E. Settlements NA, NO NA, NO NA, NO NA, NO NA, NO NA, NO NA, NO NA, NO NA, NO
F. Other Land NA, NO NA, NO NA, NO NA, NO NA, NO NA, NO NA, NO NA, NO NA, NO
G. Other NA, NE NA, NE NA, NE NA, NE NA, NE NA, NE NA, NE NA, NE NA, NE
6. Waste 0.52 0.52 0.52 0.52 0.52 0.52 0.52 0.52 0.52
A. Solid Waste Disposal on Land
B. Waste-water Handling 0.52 0.52 0.52 0.52 0.52 0.52 0.52 0.52 0.52
C. Waste Incineration 0.00 0.00 0.00 0.00 0.00 0.00 0.00 0.00 0.00
D. Other NA NA NA NA NA NA NA NA NA
7. Other (as specified in the summary table in CRF) NA NA NA NA NA NA NA NA NA
Total N2O emissions including N2O from LULUCF 43.11 37.38 33.37 29.56 29.06 29.93 28.63 28.89 28.26
Total N2O emissions excluding N2O from LULUCF 43.01 37.29 33.28 29.47 28.97 29.85 28.55 28.81 28.19
Memo Items:
International Bunkers 0.07 0.06 0.07 0.06 0.07 0.08 0.06 0.07 0.08
Aviation 0.07 0.06 0.07 0.06 0.07 0.08 0.06 0.07 0.08
Marine NA, NO NA, NO NA, NO NA, NO NA, NO NA, NO NA, NO NA, NO NA, NO
Multilateral Operations NO NO NO NO NO NO NO NO NO
CO2 Emissions from Biomass
Note: All footnotes for this table are given on sheet 3.
GREENHOUSE GAS SOURCE AND SINK CATEGORIES
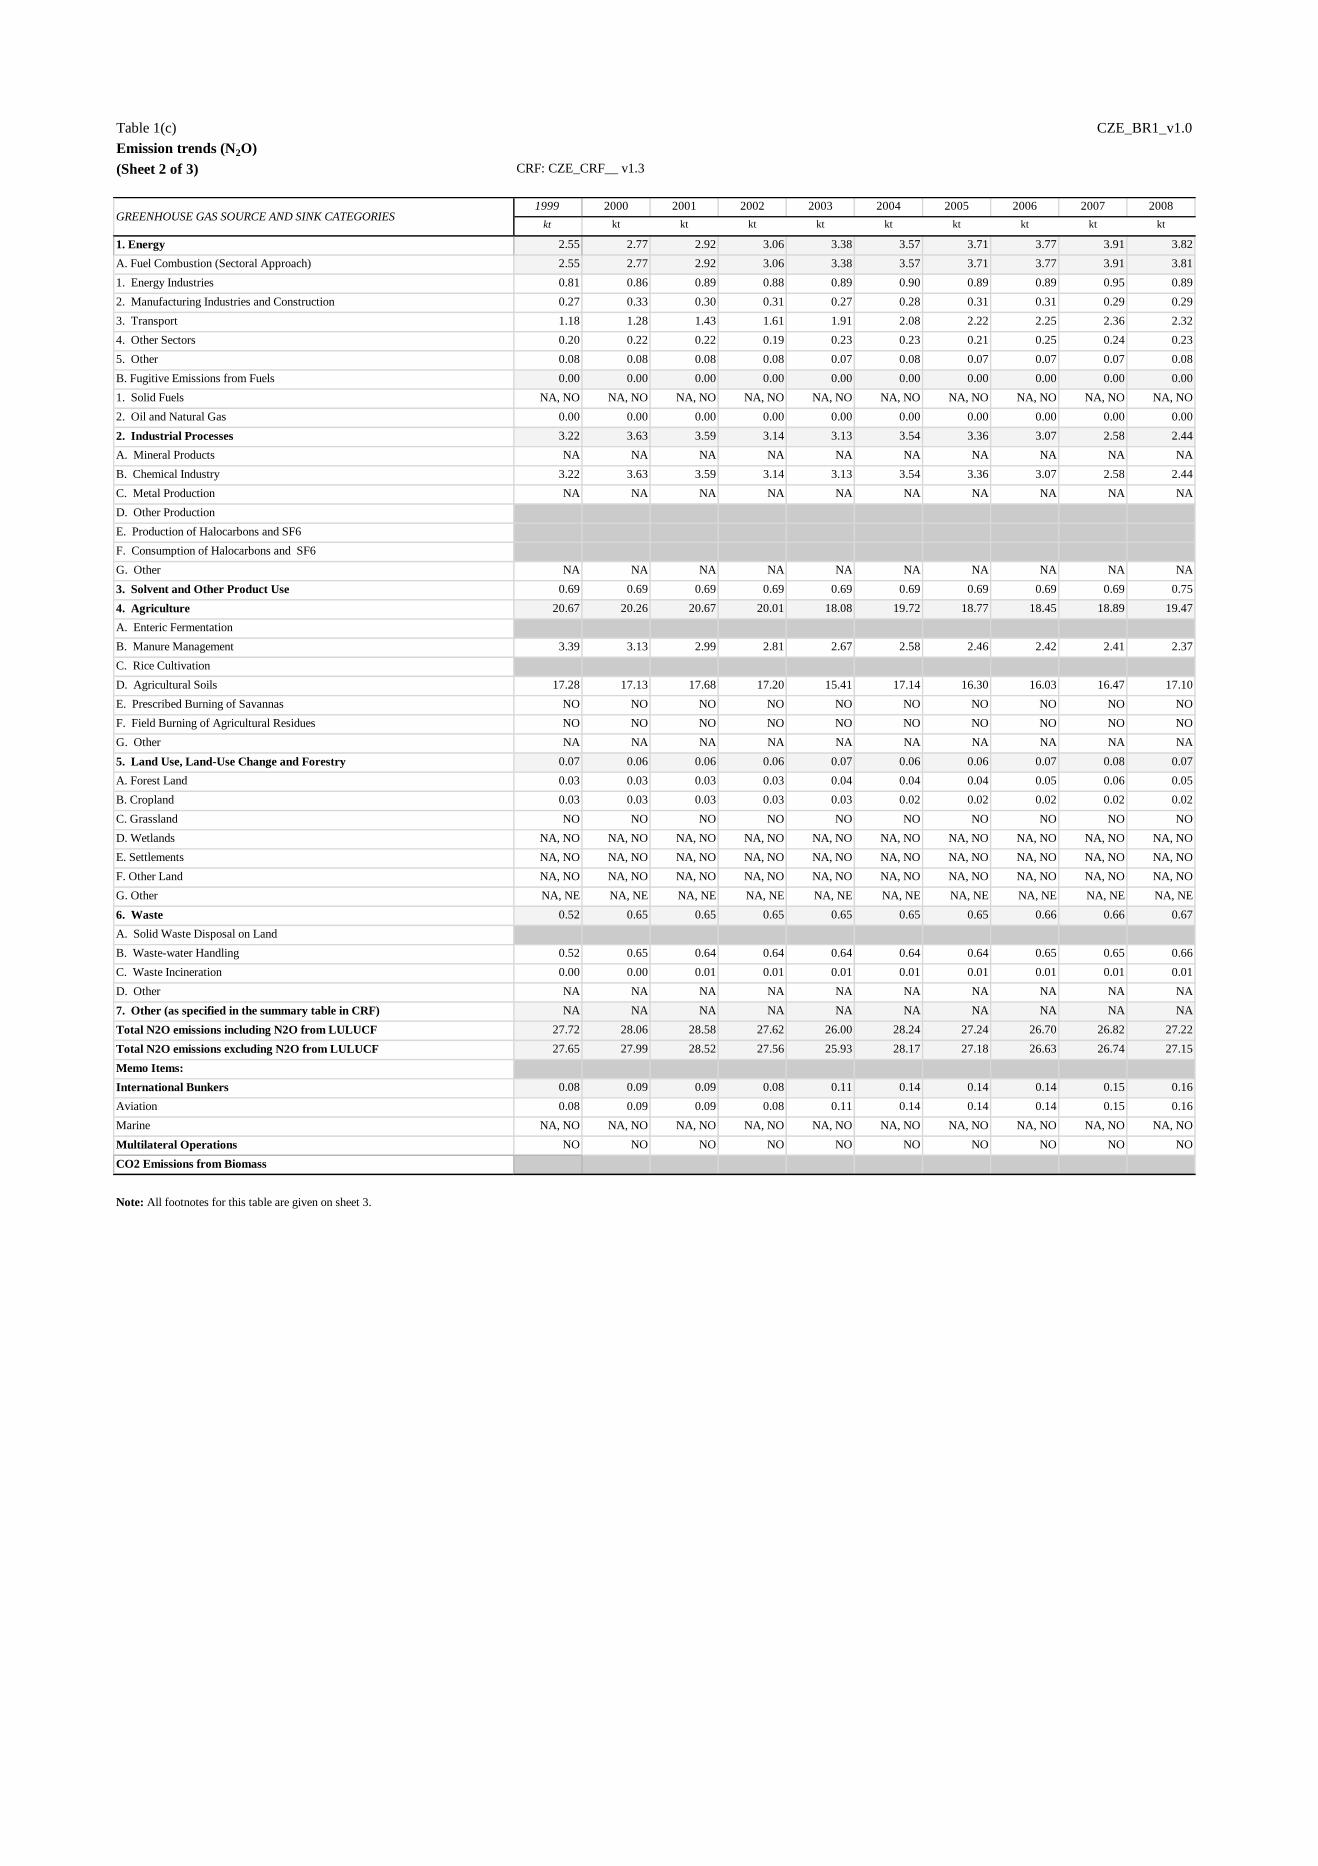
Table 1(c) CZE_BR1_v1.0
Emission trends (N2O) Source: Submission 2014 v1.3, CZECH REPUBLIC
(Sheet 2 of 3) CRF: CZE_CRF__ v1.3
1999 2000 2001 2002 2003 2004 2005 2006 2007 2008
kt kt kt kt kt kt kt kt kt kt
1. Energy 2.55 2.77 2.92 3.06 3.38 3.57 3.71 3.77 3.91 3.82
A. Fuel Combustion (Sectoral Approach) 2.55 2.77 2.92 3.06 3.38 3.57 3.71 3.77 3.91 3.81
1. Energy Industries 0.81 0.86 0.89 0.88 0.89 0.90 0.89 0.89 0.95 0.89
2. Manufacturing Industries and Construction 0.27 0.33 0.30 0.31 0.27 0.28 0.31 0.31 0.29 0.29
3. Transport 1.18 1.28 1.43 1.61 1.91 2.08 2.22 2.25 2.36 2.32
4. Other Sectors 0.20 0.22 0.22 0.19 0.23 0.23 0.21 0.25 0.24 0.23
5. Other 0.08 0.08 0.08 0.08 0.07 0.08 0.07 0.07 0.07 0.08
B. Fugitive Emissions from Fuels 0.00 0.00 0.00 0.00 0.00 0.00 0.00 0.00 0.00 0.00
1. Solid Fuels NA, NO NA, NO NA, NO NA, NO NA, NO NA, NO NA, NO NA, NO NA, NO NA, NO
2. Oil and Natural Gas 0.00 0.00 0.00 0.00 0.00 0.00 0.00 0.00 0.00 0.00
2. Industrial Processes 3.22 3.63 3.59 3.14 3.13 3.54 3.36 3.07 2.58 2.44
A. Mineral Products NA NA NA NA NA NA NA NA NA NA
B. Chemical Industry 3.22 3.63 3.59 3.14 3.13 3.54 3.36 3.07 2.58 2.44
C. Metal Production NA NA NA NA NA NA NA NA NA NA
D. Other Production
E. Production of Halocarbons and SF6
F. Consumption of Halocarbons and SF6
G. Other NA NA NA NA NA NA NA NA NA NA
3. Solvent and Other Product Use 0.69 0.69 0.69 0.69 0.69 0.69 0.69 0.69 0.69 0.75
4. Agriculture 20.67 20.26 20.67 20.01 18.08 19.72 18.77 18.45 18.89 19.47
A. Enteric Fermentation
B. Manure Management 3.39 3.13 2.99 2.81 2.67 2.58 2.46 2.42 2.41 2.37
C. Rice Cultivation
D. Agricultural Soils 17.28 17.13 17.68 17.20 15.41 17.14 16.30 16.03 16.47 17.10
E. Prescribed Burning of Savannas NO NO NO NO NO NO NO NO NO NO
F. Field Burning of Agricultural Residues NO NO NO NO NO NO NO NO NO NO
G. Other NA NA NA NA NA NA NA NA NA NA
5. Land Use, Land-Use Change and Forestry 0.07 0.06 0.06 0.06 0.07 0.06 0.06 0.07 0.08 0.07
A. Forest Land 0.03 0.03 0.03 0.03 0.04 0.04 0.04 0.05 0.06 0.05
B. Cropland 0.03 0.03 0.03 0.03 0.03 0.02 0.02 0.02 0.02 0.02
C. Grassland NO NO NO NO NO NO NO NO NO NO
D. Wetlands NA, NO NA, NO NA, NO NA, NO NA, NO NA, NO NA, NO NA, NO NA, NO NA, NO
E. Settlements NA, NO NA, NO NA, NO NA, NO NA, NO NA, NO NA, NO NA, NO NA, NO NA, NO
F. Other Land NA, NO NA, NO NA, NO NA, NO NA, NO NA, NO NA, NO NA, NO NA, NO NA, NO
G. Other NA, NE NA, NE NA, NE NA, NE NA, NE NA, NE NA, NE NA, NE NA, NE NA, NE
6. Waste 0.52 0.65 0.65 0.65 0.65 0.65 0.65 0.66 0.66 0.67
A. Solid Waste Disposal on Land
B. Waste-water Handling 0.52 0.65 0.64 0.64 0.64 0.64 0.64 0.65 0.65 0.66
C. Waste Incineration 0.00 0.00 0.01 0.01 0.01 0.01 0.01 0.01 0.01 0.01
D. Other NA NA NA NA NA NA NA NA NA NA
7. Other (as specified in the summary table in CRF) NA NA NA NA NA NA NA NA NA NA
Total N2O emissions including N2O from LULUCF 27.72 28.06 28.58 27.62 26.00 28.24 27.24 26.70 26.82 27.22
Total N2O emissions excluding N2O from LULUCF 27.65 27.99 28.52 27.56 25.93 28.17 27.18 26.63 26.74 27.15
Memo Items:
International Bunkers 0.08 0.09 0.09 0.08 0.11 0.14 0.14 0.14 0.15 0.16
Aviation 0.08 0.09 0.09 0.08 0.11 0.14 0.14 0.14 0.15 0.16
Marine NA, NO NA, NO NA, NO NA, NO NA, NO NA, NO NA, NO NA, NO NA, NO NA, NO
Multilateral Operations NO NO NO NO NO NO NO NO NO NO
CO2 Emissions from Biomass
Note: All footnotes for this table are given on sheet 3.
GREENHOUSE GAS SOURCE AND SINK CATEGORIES

Table 1(c) CZE_BR1_v1.0
Emission trends (N2O) Source: Submission 2014 v1.3, CZECH REPUBLIC
(Sheet 3 of 3) CRF: CZE_CRF__ v1.3
2009 2010 2011 Change from
base to latest
reported
year
kt kt kt %
1. Energy 3.73 3.69 3.66 54.57
A. Fuel Combustion (Sectoral Approach) 3.73 3.68 3.66 54.57
1. Energy Industries 0.85 0.90 0.91 12.34
2. Manufacturing Industries and Construction 0.29 0.29 0.28 -50.60
3. Transport 2.28 2.16 2.15 341.16
4. Other Sectors 0.23 0.26 0.25 -43.34
5. Other 0.08 0.07 0.07 17.18
B. Fugitive Emissions from Fuels 0.00 0.00 0.00 230.38
1. Solid Fuels NA, NO NA, NO NA, NO 0.00
2. Oil and Natural Gas 0.00 0.00 0.00 230.38
2. Industrial Processes 1.94 1.51 1.65 -57.63
A. Mineral Products NA NA NA 0.00
B. Chemical Industry 1.94 1.51 1.65 -57.63
C. Metal Production NA NA NA 0.00
D. Other Production
E. Production of Halocarbons and SF6
F. Consumption of Halocarbons and SF6
G. Other NA NA NA 0.00
3. Solvent and Other Product Use 0.75 0.75 0.75 8.38
4. Agriculture 18.32 17.96 18.33 -48.40
A. Enteric Fermentation
B. Manure Management 2.26 2.20 2.14 -61.14
C. Rice Cultivation
D. Agricultural Soils 16.06 15.76 16.19 -46.06
E. Prescribed Burning of Savannas NO NO NO 0.00
F. Field Burning of Agricultural Residues NO NO NO 0.00
G. Other NA NA NA 0.00
5. Land Use, Land-Use Change and Forestry 0.06 0.06 0.04 -61.78
A. Forest Land 0.04 0.04 0.02 -44.90
B. Cropland 0.02 0.02 0.02 -69.85
C. Grassland NO NO NO 0.00
D. Wetlands NA, NO NA, NO NA, NO 0.00
E. Settlements NA, NO NA, NO NA, NO 0.00
F. Other Land NA, NO NA, NO NA, NO 0.00
G. Other NA, NE NA, NE NA, NE 0.00
6. Waste 0.67 0.67 0.67 28.45
A. Solid Waste Disposal on Land
B. Waste-water Handling 0.66 0.66 0.66 26.61
C. Waste Incineration 0.01 0.01 0.01 709.41
D. Other NA NA NA 0.00
7. Other (as specified in the summary table in CRF) NA NA NA 0.00
Total N2O emissions including N2O from LULUCF 25.47 24.64 25.11 -41.77
Total N2O emissions excluding N2O from LULUCF 25.41 24.58 25.07 -41.72
Memo Items:
International Bunkers 0.15 0.14 0.14 81.83
Aviation 0.15 0.14 0.14 81.83
Marine NA, NO NA, NO NA, NO 0.00
Multilateral Operations NO NO NO 0.00
CO2 Emissions from Biomass
Custom Footnotes
GREENHOUSE GAS SOURCE AND SINK CATEGORIES
Abbreviations : CRF = common reporting format, LULUCF = land use, land-use change and forestry.
a The column “Base year” should be filled in only by those Parties with economies in transition
that use a base year different from 1990 in accordance with the relevant decisions of the
Conference of the Parties. For these Parties, this different base year is used to calculate the
percentage change in the final column of this table.

Table 1(d) CZE_BR1_v1.0
Emission trends (HFCs, PFCs and SF6) Source: Submission 2014 v1.3, CZECH REPUBLIC
(Sheet 1 of 3) CRF: CZE_CRF__ v1.3
Base yeara 1991 1992 1993 1994 1995 1996 1997 1998
kt kt kt kt kt kt kt kt kt
Emissions of HFCsc - (kt CO2 eq) NA, NE, NO NA, NE, NO NA, NE, NO NA, NE, NO NA, NE, NO 0.73 101.31 244.81 316.56
HFC-23 NA, NO NA, NO NA, NO NA, NO NA, NO NA, NO NA, NO 0.00 0.00
HFC-32 NA, NO NA, NO NA, NO NA, NO NA, NO NA, NO NA, NO 0.00 0.00
HFC-41 NA, NO NA, NO NA, NO NA, NO NA, NO NA, NO NA, NO NA, NO NA, NO
HFC-43-10mee NA, NO NA, NO NA, NO NA, NO NA, NO NA, NO NA, NO NA, NO NA, NO
HFC-125 NA, NO NA, NO NA, NO NA, NO NA, NO NA, NO 0.00 0.01 0.00
HFC-134 NA, NO NA, NO NA, NO NA, NO NA, NO NA, NO NA, NO NA, NO NA, NO
HFC-134a NA, NO NA, NO NA, NO NA, NO NA, NO 0.00 0.07 0.16 0.23
HFC-152a NA, NO NA, NO NA, NO NA, NO NA, NO NA, NO 0.00 0.00 0.00
HFC-143 NA, NO NA, NO NA, NO NA, NO NA, NO NA, NO NA, NO NA, NO NA, NO
HFC-143a NA, NO NA, NO NA, NO NA, NO NA, NO NA, NO 0.00 0.00 0.00
HFC-227ea NA, NO NA, NO NA, NO NA, NO NA, NO NA, NO 0.00 IE, NA, NO IE, NA, NO
HFC-236fa NA, NO NA, NO NA, NO NA, NO NA, NO NA, NO NA, NO 0.00 0.00
HFC-245ca NA, NO NA, NO NA, NO NA, NO NA, NO NA, NO NA, NO NA, NO NA, NO
Unspecified mix of listed HFCsd - (kt CO2 eq) NA, NO NA, NO NA, NO NA, NO NA, NO NA, NO NA, NO NA, NO NA, NO
Emissions of PFCsc - (kt CO2 eq) NA, NE, NO NA, NE, NO NA, NE, NO NA, NE, NO NA, NE, NO 0.12 4.11 0.89 0.89
CF4 NA, NO NA, NO NA, NO NA, NO NA, NO NA, NO NA, NO 0.00 0.00
C2F6 NA, NO NA, NO NA, NO NA, NO NA, NO NA, NO NA, NO NA, NO NA, NO
C 3F8 NA, NO NA, NO NA, NO NA, NO NA, NO 0.00 0.00 IE, NA, NO IE, NA, NO
C4F10 NA, NO NA, NO NA, NO NA, NO NA, NO NA, NO NA, NO NA, NO NA, NO
c-C4F8 NA, NO NA, NO NA, NO NA, NO NA, NO NA, NO NA, NO NA, NO NA, NO
C5F12 NA, NO NA, NO NA, NO NA, NO NA, NO NA, NO NA, NO NA, NO NA, NO
C6F14 NA, NO NA, NO NA, NO NA, NO NA, NO NA, NO NA, NO NA, NO NA, NO
Unspecified mix of listed PFCs(4) - (Gg CO2 equivalent) NA, NO NA, NO NA, NO NA, NO NA, NO NA, NO NA, NO NA, NO NA, NO
Emissions of SF6(3) - (Gg CO2 equivalent) 77.68 77.32 76.96 76.60 76.24 75.20 77.52 95.48 64.19
SF6 0.00 0.00 0.00 0.00 0.00 0.00 0.00 0.00 0.00
Note: All footnotes for this table are given on sheet 3.
GREENHOUSE GAS SOURCE AND SINK CATEGORIES
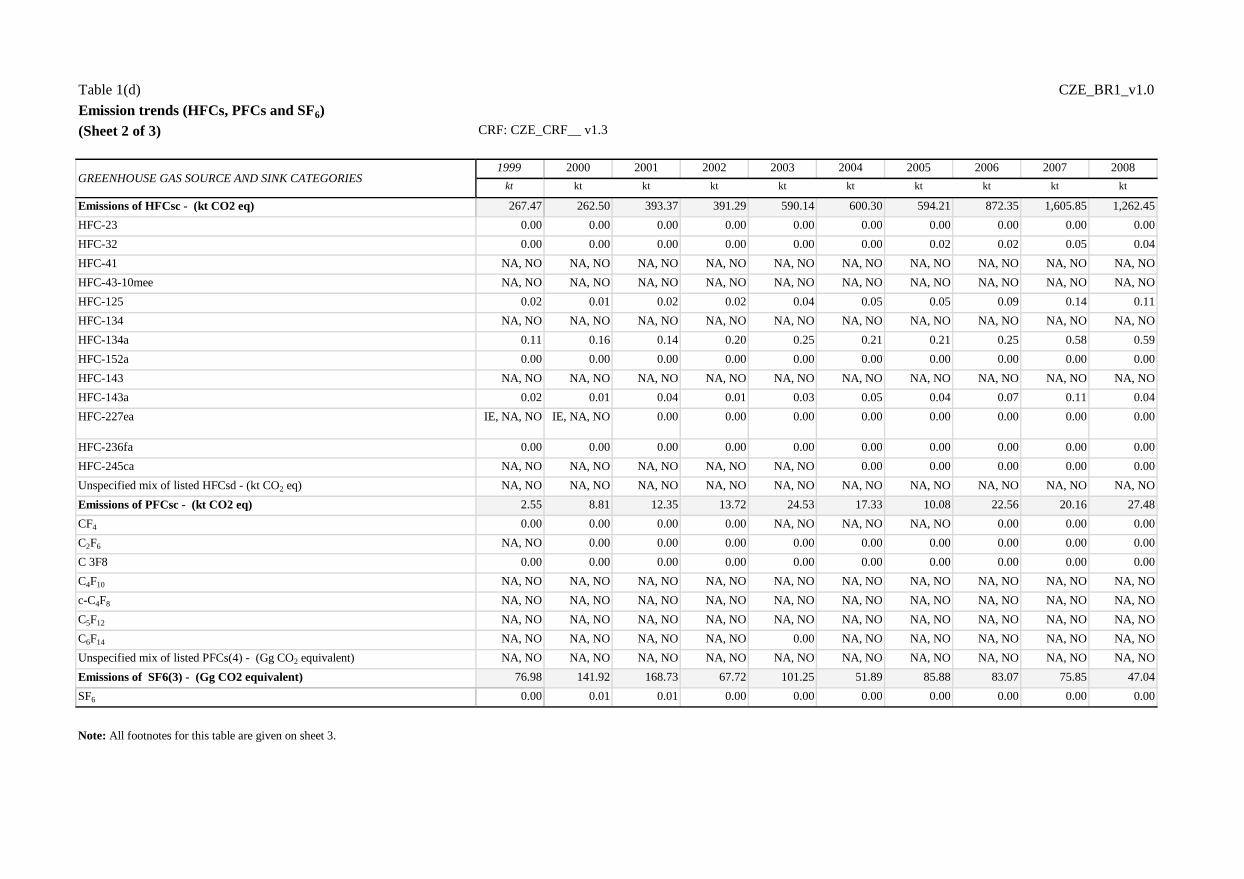
Table 1(d) CZE_BR1_v1.0
Emission trends (HFCs, PFCs and SF6) Source: Submission 2014 v1.3, CZECH REPUBLIC
(Sheet 2 of 3) CRF: CZE_CRF__ v1.3
1999 2000 2001 2002 2003 2004 2005 2006 2007 2008
kt kt kt kt kt kt kt kt kt kt
Emissions of HFCsc - (kt CO2 eq) 267.47 262.50 393.37 391.29 590.14 600.30 594.21 872.35 1,605.85 1,262.45
HFC-23 0.00 0.00 0.00 0.00 0.00 0.00 0.00 0.00 0.00 0.00
HFC-32 0.00 0.00 0.00 0.00 0.00 0.00 0.02 0.02 0.05 0.04
HFC-41 NA, NO NA, NO NA, NO NA, NO NA, NO NA, NO NA, NO NA, NO NA, NO NA, NO
HFC-43-10mee NA, NO NA, NO NA, NO NA, NO NA, NO NA, NO NA, NO NA, NO NA, NO NA, NO
HFC-125 0.02 0.01 0.02 0.02 0.04 0.05 0.05 0.09 0.14 0.11
HFC-134 NA, NO NA, NO NA, NO NA, NO NA, NO NA, NO NA, NO NA, NO NA, NO NA, NO
HFC-134a 0.11 0.16 0.14 0.20 0.25 0.21 0.21 0.25 0.58 0.59
HFC-152a 0.00 0.00 0.00 0.00 0.00 0.00 0.00 0.00 0.00 0.00
HFC-143 NA, NO NA, NO NA, NO NA, NO NA, NO NA, NO NA, NO NA, NO NA, NO NA, NO
HFC-143a 0.02 0.01 0.04 0.01 0.03 0.05 0.04 0.07 0.11 0.04
HFC-227ea IE, NA, NO IE, NA, NO 0.00 0.00 0.00 0.00 0.00 0.00 0.00 0.00
HFC-236fa 0.00 0.00 0.00 0.00 0.00 0.00 0.00 0.00 0.00 0.00
HFC-245ca NA, NO NA, NO NA, NO NA, NO NA, NO 0.00 0.00 0.00 0.00 0.00
Unspecified mix of listed HFCsd - (kt CO2 eq) NA, NO NA, NO NA, NO NA, NO NA, NO NA, NO NA, NO NA, NO NA, NO NA, NO
Emissions of PFCsc - (kt CO2 eq) 2.55 8.81 12.35 13.72 24.53 17.33 10.08 22.56 20.16 27.48
CF4 0.00 0.00 0.00 0.00 NA, NO NA, NO NA, NO 0.00 0.00 0.00
C2F6 NA, NO 0.00 0.00 0.00 0.00 0.00 0.00 0.00 0.00 0.00
C 3F8 0.00 0.00 0.00 0.00 0.00 0.00 0.00 0.00 0.00 0.00
C4F10 NA, NO NA, NO NA, NO NA, NO NA, NO NA, NO NA, NO NA, NO NA, NO NA, NO
c-C4F8 NA, NO NA, NO NA, NO NA, NO NA, NO NA, NO NA, NO NA, NO NA, NO NA, NO
C5F12 NA, NO NA, NO NA, NO NA, NO NA, NO NA, NO NA, NO NA, NO NA, NO NA, NO
C6F14 NA, NO NA, NO NA, NO NA, NO 0.00 NA, NO NA, NO NA, NO NA, NO NA, NO
Unspecified mix of listed PFCs(4) - (Gg CO2 equivalent) NA, NO NA, NO NA, NO NA, NO NA, NO NA, NO NA, NO NA, NO NA, NO NA, NO
Emissions of SF6(3) - (Gg CO2 equivalent) 76.98 141.92 168.73 67.72 101.25 51.89 85.88 83.07 75.85 47.04
SF6 0.00 0.01 0.01 0.00 0.00 0.00 0.00 0.00 0.00 0.00
Note: All footnotes for this table are given on sheet 3.
GREENHOUSE GAS SOURCE AND SINK CATEGORIES

Table 1(d) CZE_BR1_v1.0
Emission trends (HFCs, PFCs and SF6) Source: Submission 2014 v1.3, CZECH REPUBLIC
(Sheet 3 of 3) CRF: CZE_CRF__ v1.3
2009 2010 2011 Change from
base to latest
reported year
kt kt kt %
Emissions of HFCsc - (kt CO2 eq) 1,020.25 1,467.85 1,130.42 100.00
HFC-23 0.00 0.00 0.00 100.00
HFC-32 0.03 0.04 0.04 100.00
HFC-41 NA, NO NA, NO NA, NO 0.00
HFC-43-10mee NA, NO NA, NO NA, NO 0.00
HFC-125 0.11 0.14 0.13 100.00
HFC-134 NA, NO NA, NO NA, NO 0.00
HFC-134a 0.27 0.36 0.27 100.00
HFC-152a NA, NO 0.00 0.00 100.00
HFC-143 NA, NO NA, NO NA, NO 0.00
HFC-143a 0.08 0.14 0.10 100.00
HFC-227ea 0.00 0.00 0.00 100.00
HFC-236fa 0.01 0.01 0.00 100.00
HFC-245ca 0.00 0.00 0.00 100.00
Unspecified mix of listed HFCsd - (kt CO2 eq) NA, NO NA, NO NA, NO 0.00
Emissions of PFCsc - (kt CO2 eq) 27.14 29.43 29.43 100.00
CF4 0.00 NA, NO NA, NO 0.00
C2F6 0.00 0.00 0.00 100.00
C 3F8 0.00 IE, NA, NO IE, NA, NO 0.00
C4F10 NA, NO NA, NO NA, NO 0.00
c-C4F8 NA, NO NA, NO NA, NO 0.00
C5F12 NA, NO NA, NO NA, NO 0.00
C6F14 NA, NO NA, NO NA, NO 0.00
Unspecified mix of listed PFCs(4) - (Gg CO2 equivalent) NA, NO NA, NO NA, NO 0.00
Emissions of SF6(3) - (Gg CO2 equivalent) 49.61 16.22 34.55 -55.52
SF6 0.00 0.00 0.00 -55.52
cEnter actual emissions estimates. If only potential emissions estimates are
available, these should be reported in this table and an indication for this be
provided in the documentation box. Only in these rows are the emissions
expressed as CO2 equivalent emissions.
dIn accordance with the “Guidelines for the preparation of national
communications by Parties included in Annex I to the Convention, Part I:
UNFCCC reporting guidelines on annual inventories”, HFC and PFC emissions
should be reported for each relevant chemical. However, if it is not possible to
report values for each chemical (i.e. mixtures, confidential data, lack of
disaggregation), this row could be used for reporting aggregate figures for HFCs
and PFCs, respectively. Note that the unit used for this row is kt of CO2 equivalent
and that appropriate notation keys should be entered in the cells for the individual
chemicals.)
Custom Footnotes
GREENHOUSE GAS SOURCE AND SINK CATEGORIES
Abbreviations : CRF = common reporting format, LULUCF = land use, land-use change and
forestry.
a The column “Base year” should be filled in only by those Parties with economies in transition
that use a base year different from 1990 in accordance with the relevant decisions of the
Conference of the Parties. For these Parties, this different base year is used to calculate the
percentage change in the final column of this table.
Documentation Box:
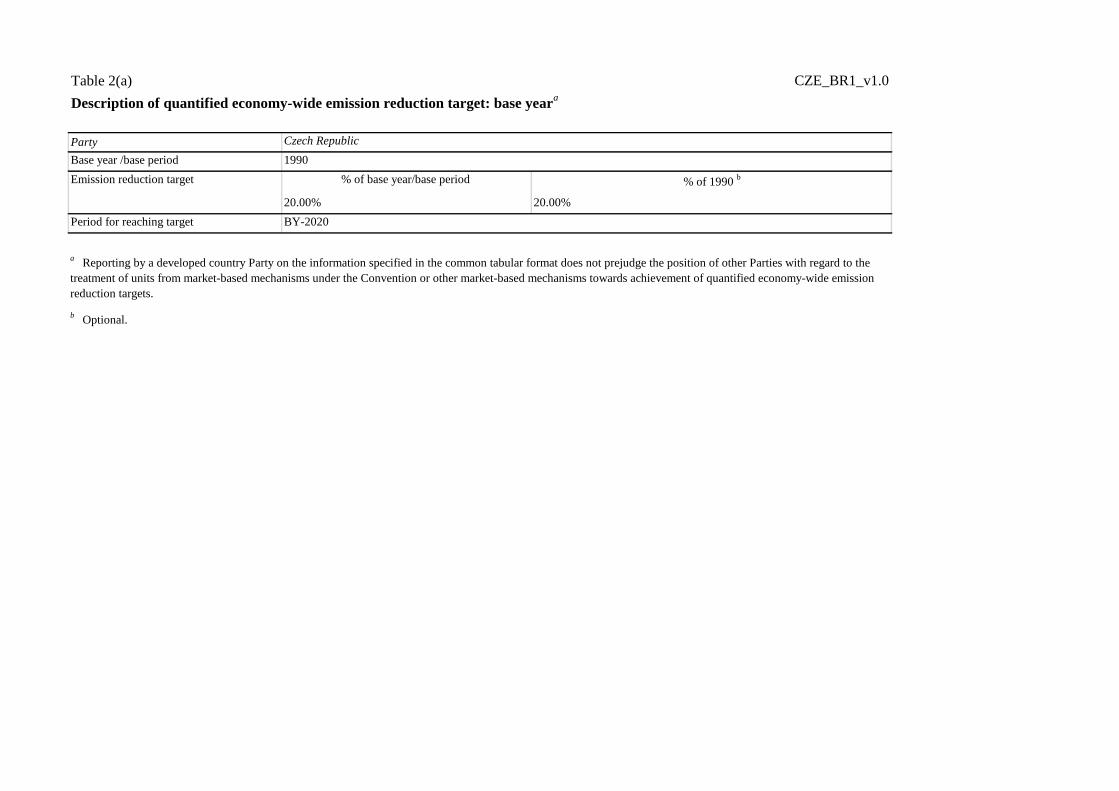
Table 2(a) CZE_BR1_v1.0
Description of quantified economy-wide emission reduction target: base yeara
Party
Base year /base period
% of base year/base period % of 1990 b
20.00% 20.00%
Period for reaching target
b Optional.
Czech Republic
1990
BY-2020
a Reporting by a developed country Party on the information specified in the common tabular format does not prejudge the position of other Parties with regard to the
treatment of units from market-based mechanisms under the Convention or other market-based mechanisms towards achievement of quantified economy-wide emission
reduction targets.
Emission reduction target

Table 2(b) CZE_BR1_v1.0
Base year for each gas (year):
1990
1990
1990
1995
1995
1995
To be decided
Energy Yes
Transportf Yes
Industrial processesg Yes
Agriculture Yes
LULUCF No
Waste Yes
Abbreviations : LULUCF = land use, land-use change and forestry.
Description of quantified economy-wide emission reduction target: gases
and sectors covereda
Gases covered
CO2
CH4
N2O
HFCs
PFCs
SF6
NF3
Other Sectors (specify)
Other Gases (specify)
Sectors coveredb
b More than one selection will be allowed. If Parties use sectors other than those indicated
above, the explanation of how these sectors relate to the sectors defined by the IPCC should be
provided.
g Industrial processes refer to the industrial processes and solvent and other product use sectors.
a Reporting by a developed country Party on the information specified in the common tabular
format does not prejudge the position of other Parties with regard to the treatment of units from
market-based mechanisms under the Convention or other market-based mechanisms towards
achievement of quantified economy-wide emission reduction targets.
f Transport is reported as a subsector of the energy sector.

Table 2(c) CZE_BR1_v1.0
Gases GWP values b
CO2 4nd AR
CH4 4nd AR
N2O 4nd AR
HFCs 4nd AR
PFCs 4nd AR
SF6 4nd AR
NF3 4nd AR
Abbreviations : GWP = global warming potential
Description of quantified economy-wide emission reduction target: global
warming potential values (GWP)a
a Reporting by a developed country Party on the information specified in the common tabular format
does not prejudge the position of other Parties with regard to the treatment of units from market-based
mechanisms under the Convention or other market-based mechanisms towards achievement of
quantified economy-wide emission reduction targets.b
Please specify the reference for the GWP: Second Assessment Report of the Intergovernmental
Panel on Climate Change (IPCC) or the Fourth Assessment Report of the IPCC.
Other Gases (specify)
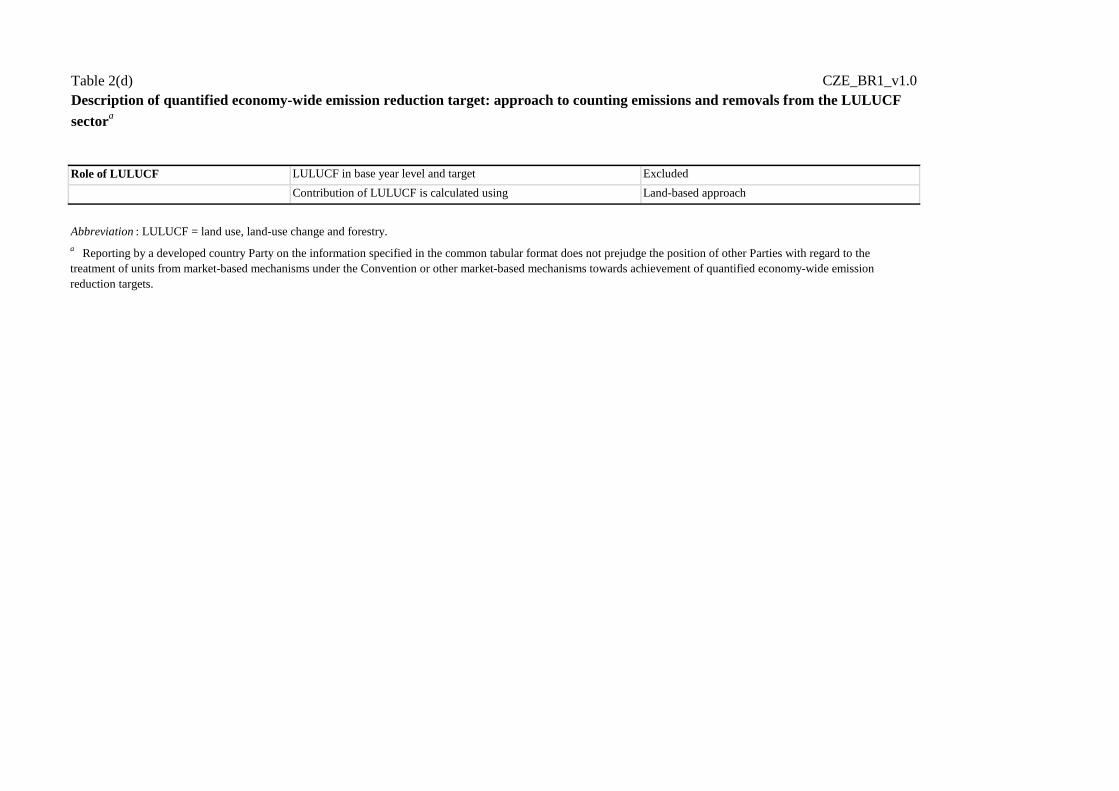
Table 2(d) CZE_BR1_v1.0
Role of LULUCF LULUCF in base year level and target Excluded
Contribution of LULUCF is calculated using Land-based approach
Abbreviation : LULUCF = land use, land-use change and forestry.
a Reporting by a developed country Party on the information specified in the common tabular format does not prejudge the position of other Parties with regard to the
treatment of units from market-based mechanisms under the Convention or other market-based mechanisms towards achievement of quantified economy-wide emission
reduction targets.
Description of quantified economy-wide emission reduction target: approach to counting emissions and removals from the LULUCF
sectora

Table 2(e)I CZE_BR1_v1.0
Market-based mechanisms Possible scale of contributions
under the Convention (estimated kt CO 2 eq)
CERs NE
ERUs NE
AAUsi NE
Carry-over unitsj NE
Abbreviations : AAU = assigned amount unit, CER = certified emission reduction, ERU = emission reduction unit.
i AAUs issued to or purchased by a Party.
j Units carried over from the first to the second commitment periods of the Kyoto Protocol, as described in decision 13/CMP.1
and consistent with decision 1/CMP.8.
a Reporting by a developed country Party on the information specified in the common tabular format does not prejudge the
position of other Parties with regard to the treatment of units from market-based mechanisms under the Convention or other
market-based mechanisms towards achievement of quantified economy-wide emission reduction targets.
d As indicated in paragraph 5(e) of the guidelines contained in annex I of decision 2/CP.17 .
Description of quantified economy-wide emission reduction target: market-based mechanisms
under the Conventiona
Other mechanism units under the Convention (specify)d

Table 2(e)II CZE_BR1_v1.0
Other market-based mechanisms Possible scale of contributions
(Specify) (estimated kt CO 2 eq)
a Reporting by a developed country Party on the information specified in the common tabular format does not prejudge the position of
other Parties with regard to the treatment of units from market-based mechanisms under the Convention or other market-based
mechanisms towards achievement of quantified economy-wide emission reduction targets.
Description of quantified economy-wide emission reduction target: other market-based mechanismsa

Table 2(f) CZE_BR1_v1.0
Description of quantified economy-wide emission reduction target: any other informationa,b
Custom Footnotes
a Reporting by a developed country Party on the information specified in the common tabular format does not prejudge the position of other Parties with regard to the treatment of units from
market-based mechanisms under the Convention or other market-based mechanisms towards achievement of quantified economy-wide emission reduction targets.
b This information could include information on the domestic legal status of the target or the total assigned amount of emission units for the period for reaching a target. Some of this information is
presented in the narrative part of the biennial report.
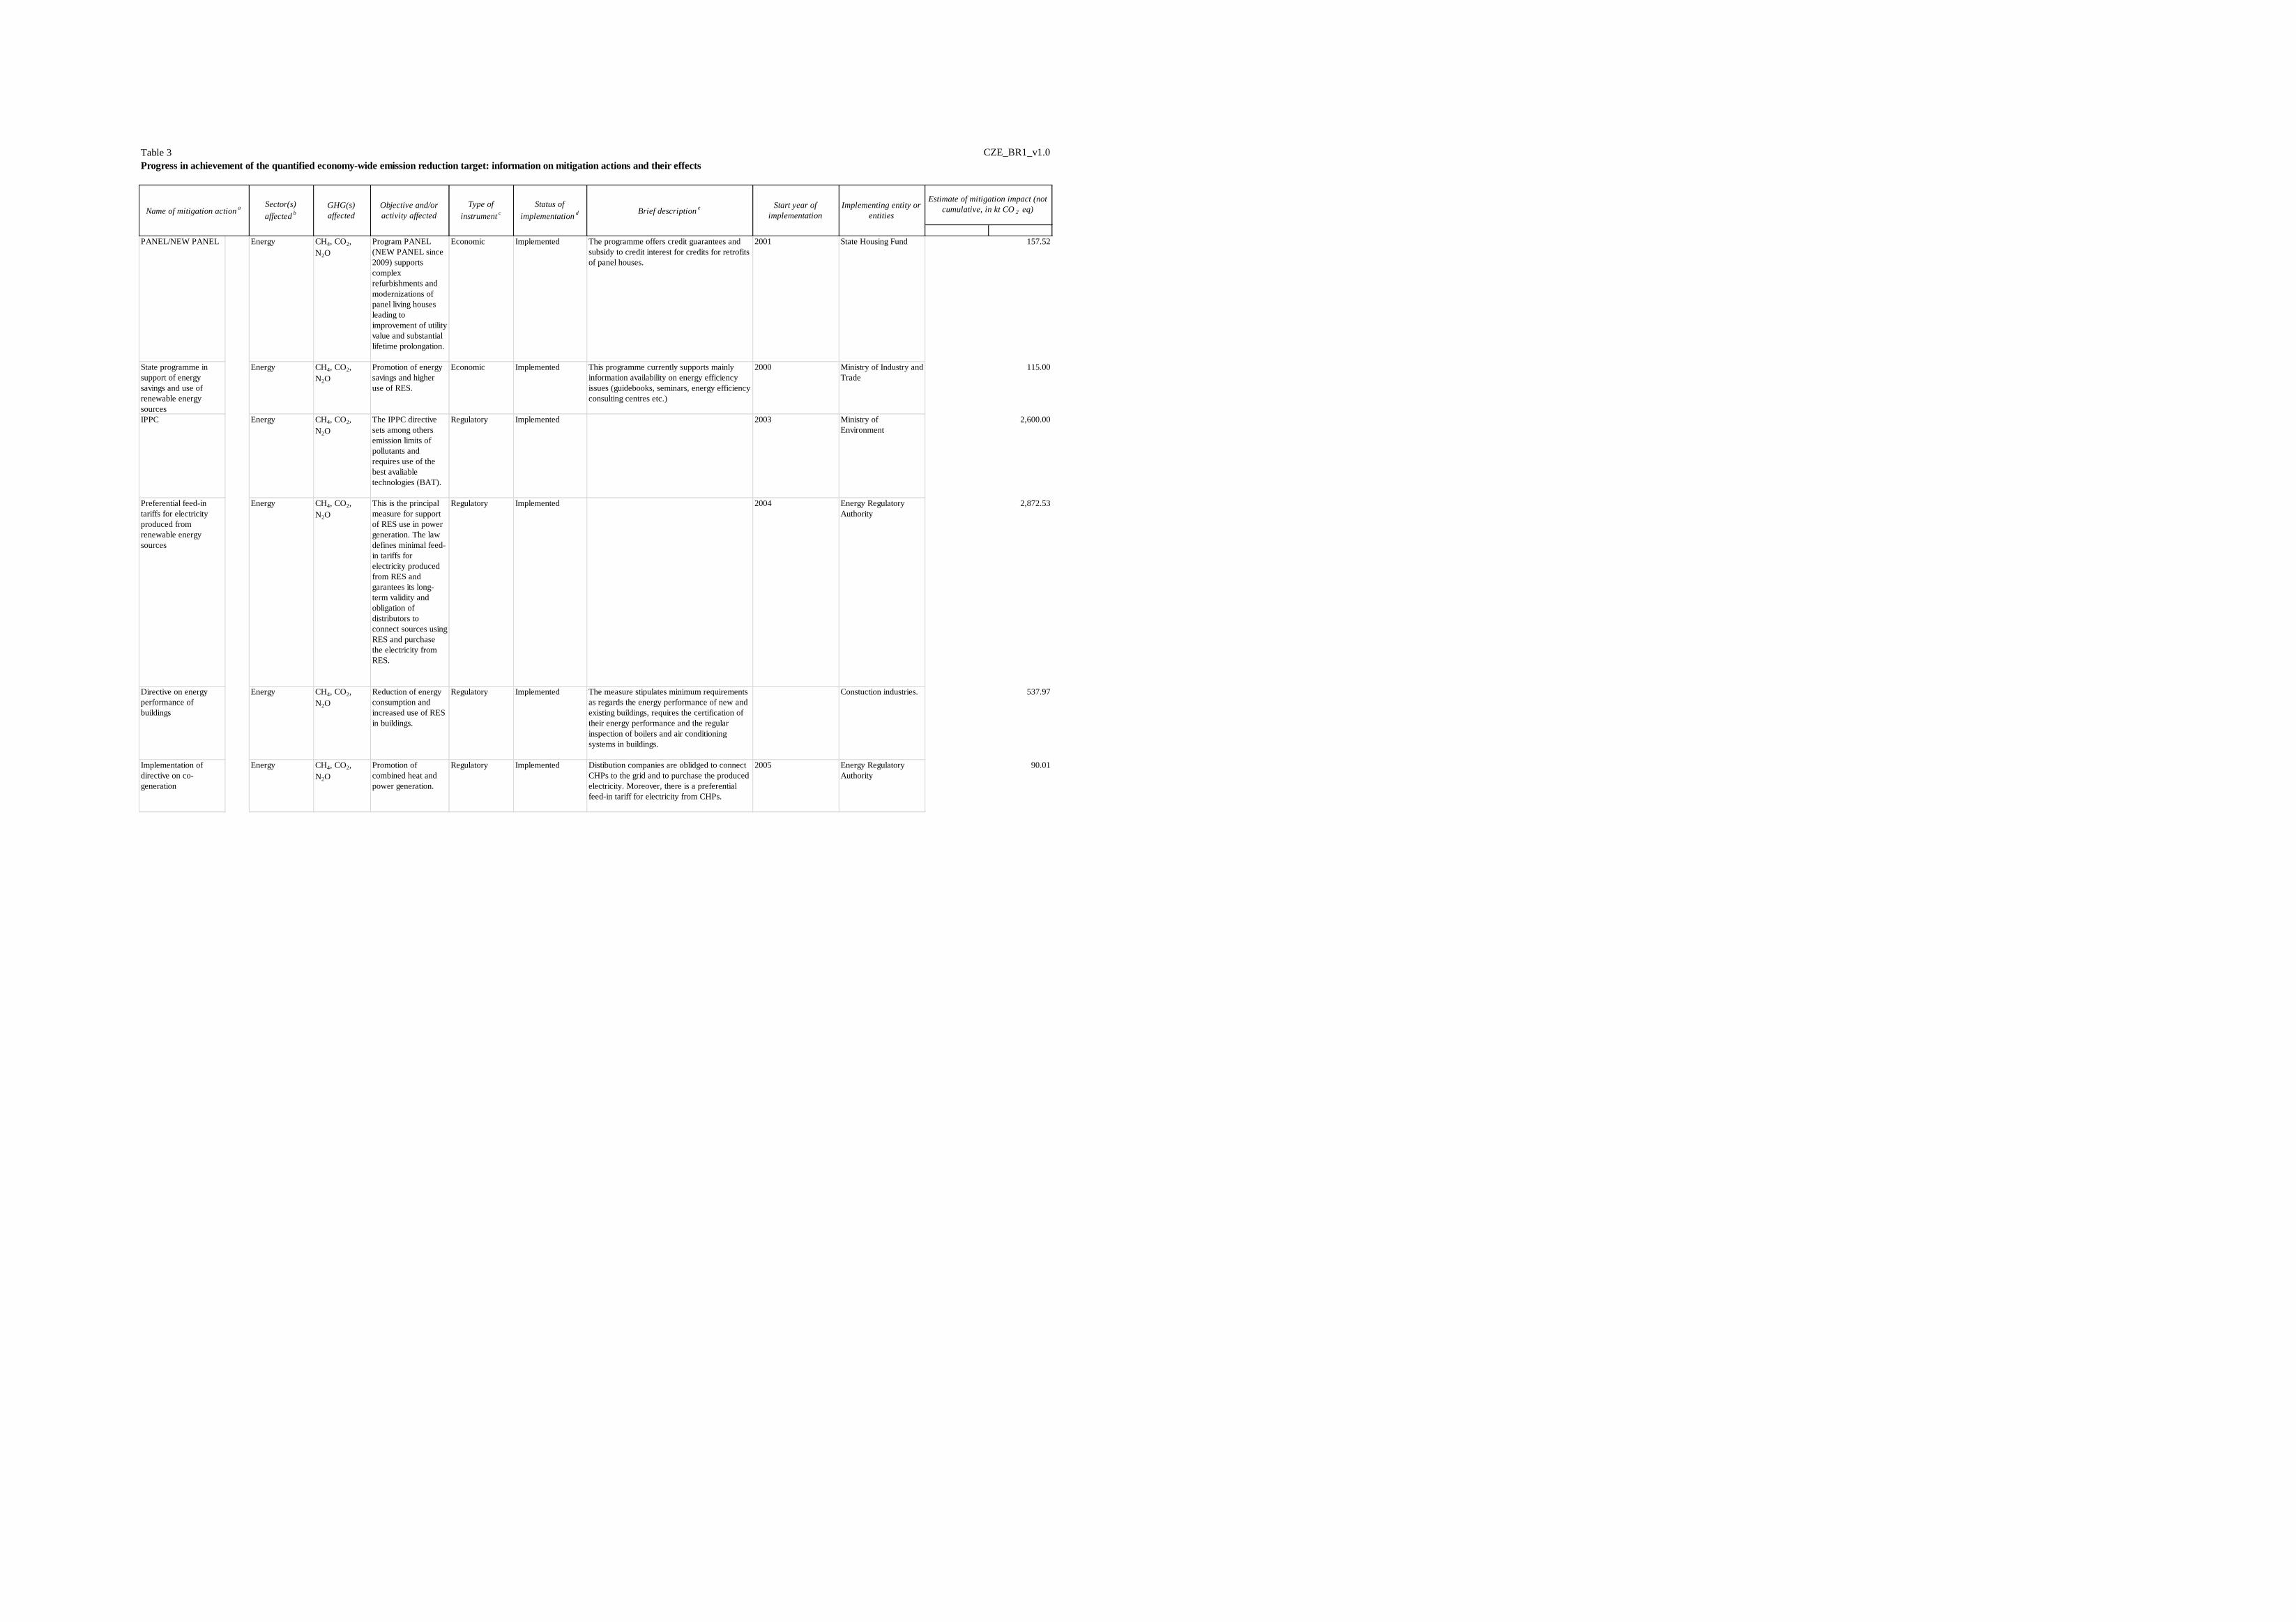
Table 3 CZE_BR1_v1.0
Progress in achievement of the quantified economy-wide emission reduction target: information on mitigation actions and their effects
PANEL/NEW PANEL Energy CH4, CO2,
N2O
Program PANEL
(NEW PANEL since
2009) supports
complex
refurbishments and
modernizations of
panel living houses
leading to
improvement of utility
value and substantial
lifetime prolongation.
Economic Implemented The programme offers credit guarantees and
subsidy to credit interest for credits for retrofits
of panel houses.
2001 State Housing Fund 157.52
State programme in
support of energy
savings and use of
renewable energy
sources
Energy CH4, CO2,
N2O
Promotion of energy
savings and higher
use of RES.
Economic Implemented This programme currently supports mainly
information availability on energy efficiency
issues (guidebooks, seminars, energy efficiency
consulting centres etc.)
2000 Ministry of Industry and
Trade
115.00
IPPC Energy CH4, CO2,
N2O
The IPPC directive
sets among others
emission limits of
pollutants and
requires use of the
best avaliable
technologies (BAT).
Regulatory Implemented 2003 Ministry of
Environment
2,600.00
Preferential feed-in
tariffs for electricity
produced from
renewable energy
sources
Energy CH4, CO2,
N2O
This is the principal
measure for support
of RES use in power
generation. The law
defines minimal feed-
in tariffs for
electricity produced
from RES and
garantees its long-
term validity and
obligation of
distributors to
connect sources using
RES and purchase
the electricity from
RES.
Regulatory Implemented 2004 Energy Regulatory
Authority
2,872.53
Directive on energy
performance of
buildings
Energy CH4, CO2,
N2O
Reduction of energy
consumption and
increased use of RES
in buildings.
Regulatory Implemented The measure stipulates minimum requirements
as regards the energy performance of new and
existing buildings, requires the certification of
their energy performance and the regular
inspection of boilers and air conditioning
systems in buildings.
Constuction industries. 537.97
Implementation of
directive on co-
generation
Energy CH4, CO2,
N2O
Promotion of
combined heat and
power generation.
Regulatory Implemented Distibution companies are oblidged to connect
CHPs to the grid and to purchase the produced
electricity. Moreover, there is a preferential
feed-in tariff for electricity from CHPs.
2005 Energy Regulatory
Authority
90.01
Brief descriptione Start year of
implementation
Implementing entity or
entitiesName of mitigation action
a
Estimate of mitigation impact (not
cumulative, in kt CO 2 eq)Objective and/or
activity affected
Type of
instrumentc
Status of
implementationd
Sector(s)
affectedb
GHG(s)
affected

Table 3 CZE_BR1_v1.0
Progress in achievement of the quantified economy-wide emission reduction target: information on mitigation actions and their effects
Brief descriptione Start year of
implementation
Implementing entity or
entitiesName of mitigation action
a
Estimate of mitigation impact (not
cumulative, in kt CO 2 eq)Objective and/or
activity affected
Type of
instrumentc
Status of
implementationd
Sector(s)
affectedb
GHG(s)
affected
Operational Programme
Industry and Enterprise
(OPIE)
Industry/industria
l processes
CH4, CO2,
N2O
Promotion of energy
savings and RES use
within the measure
"2.3 Decreasing the
energy intensity and
higher utilisation of
RES". The measure is
targeted to small and
medium industrial
enterprises.
Economic Implemented The programme which was offering subsidies
enterprises and industries. It comprised
promotion of energy efficiency and use of RES
in enterprises. It is superseded by the
Operational programme Enterprise and
innovation.
2004 Ministry of Industry and
Trade
17.32
Operational Programme
Enterprise and
Innovation
Industry/industria
l processes
CH4, CO2,
N2O
Promotion of energy
savings and RES use
within the priority axe
3 - Effective energy
Economic|Resear
ch|Education
Implemented The main programme offering subsidies
enterprises and industries. It comprises
promotion of energy efficiency and use of RES
in enterprises. It replaces the Operational
programme Industry and enterprise.
2007 Ministry of Industry and
Trade
1,194.75
Operational Programme
Environment
Energy,
Industry/industria
l processes,
Waste
management/was
te
CH4, CO2,
HFCs, N2O,
NF3, PFCs, SF6
Promotion of energy
savings and use of
RES.
Economic Implemented The main programme offering subsidies for
environment protection. It comprises promotion
of energy efficiency and use of RES, mainly
for the municipal sector.
2007 State Environmental
Fund
244.60
Green savings
programme
Energy CO2, CH4,
N2O
This measure
introduces subsidies
for housholds in order
to decrease energy
consumption of
mainly family houses
and to promote
higher use of
renewable energy
sources. It was
partially opened also
for panel houses and
public buildings.
Other
(Regulatory)
Implemented The programme is financed from sold emission
allowances. It supports, through investment
subsidies, construction of low-energy family
houses in passive standard, full or partial
insulation of existing houses and introduction of
RES for water heating.
2010 State Environmental
Fund
860.00
Improvement of the fuel
quality
Transport,
Energy
N2O, CO2,
CH4
To reduce air
pollution by the
decrease of harmful
pollutants content in
fuels.
Regulatory Implemented Ban on leaded petrol, reduction of sulphur
content in petrol and diesel.
2000 Ministry of
Environment
265.52
Emission limits on new
cars
Transport CO2, N2O,
CH4
To decrease to
decrease CO2
emissions from cars
Regulatory Implemented New vehicles must meet European emission
starndards.
2000 Ministry of
Environment
151.72
Rural Development
Program (2007-2013)
Agriculture,
Forestry/LULUC
F
CH4, N2O,
CO2
A basic strategic and
program documents
specifying in detail
the measures for
meeting the objectives
of the development of
rural areas of the
Czech Republic
Other
(Regulatory)
Implemented Improving the competitiveness of the
agricultural, food and forestry sectors falls
within the first group of measures;Increasing
biodiversity, water and soil protection and
mitigating climate change is a joint objective of
the second group of measures; Improving the
quality of life in rural areas and to encourage
the diversification of economic activities there;
Helping the residents of rural micro-regions
(applying the “from bottom to top” principle) to
work out their local development strategy and
to support the projects concerning development
of the region they live in, the so called
LEADER method.
2007 Ministry of Agriculture 325.00
Horizontal Rural
Development
Agriculture,
Forestry/LULUC
F
CH4, N2O To ensure the
sustainable
development of
agriculture, the
countryside and its
natural resources
Regulatory Implemented The main goals: i) preservation and support of
the agricultural system with low inputs, ii)
protection and support of sustainable
agriculture meeting environmental demands
and iii) preservation and strengthening of a
viable social structure in rural areas
2004 Ministry of Agriculture 150.00

Table 3 CZE_BR1_v1.0
Progress in achievement of the quantified economy-wide emission reduction target: information on mitigation actions and their effects
Brief descriptione Start year of
implementation
Implementing entity or
entitiesName of mitigation action
a
Estimate of mitigation impact (not
cumulative, in kt CO 2 eq)Objective and/or
activity affected
Type of
instrumentc
Status of
implementationd
Sector(s)
affectedb
GHG(s)
affected
Action Plan for
Development of
Organic farming
Agriculture CH4, N2O To product quality
bio-foodstuffs
environmentally
friendly influence on
nature contributes
Economic Implemented Environmentally friendly influence on nature
contributes
2011 Ministry of Agriculture 250.00
Measures on vehicles -
devices for gas
adjustment
Transport N2O, CH4,
CO2
To decrease air
pollution from traffic
Other
(Regulatory)
Implemented This measure involves: 3-way controlled
catalytic converters, oxidation catalysts,
recirculation of the exhaust gases, snatcher of
the elements
2000 Ministry of
Environment
265.52
Economic and tax tools Cross-cutting CO2, CH4,
HFCs, N2O,
NF3, PFCs, SF6
To encourage the
usage of less polluting
vehicles
Other (Fiscal) Implemented Charging the use of the transport infrastructure,
road tax reduction for the "purer" vehicles,
excise tax on fuel.
2000 Ministry of Finance 208.62
Increase of the public
transport attractiveness
Transport N2O, CH4,
CO2
To increase public
transport share in
modal split in the
Czech Republic.
Economic Implemented Introduction of the integrated transport system
(IDS), increasing comfort for travellers,
preference of the public transport vehicles.
2000 Municipalities 189.65
Combined
transportation support
Transport N2O, CH4,
CO2
To increase public
transport share in
modal split in the
Czech Republic.
Regulatory Planned Introduction of "Park and Ride" systém,
introduction of "Bike and Ride" systém,
combined freight systems.
2000 Ministry of transport,
State Fund of Transport
Infrastructure
113.79
Mobility management Transport N2O, CH4,
CO2
To decresase car
traffic volumes
namely in urban
agglomerations.
Regulatory Planned The tools of the management mobility are
based on information, communication,
organization and coordination. The constitution
of the mobility management responded to the
need of such approaches in the solution of the
oppressive problem of considerably increasing
mobility demand which simply do not rely on
new road construction or introduction of the
advanced technologies.
2000 Ministry of transport,
State Fund of Transport
Infrastructure
94.83
Environmental
education, education
and enlightenment at
primary and secondary
schools on "ecological
transport"
To bring the
"ecological"
education to a
broader group of
people.
Education Implemented Ecological education has been already
established as a subject at primary schools.
Unfortunately, it is still rather a marginal
subject and its content is often still inadequate
to the issue which should be solved by it. It is
caused by the fact that there is no sufficient
education of the ecological subjects at faculties
of education where the so called environmental
minimum has failed to be enforced.
2000 Municipalities 94.83
Eco-labelling Agriculture,
Industry/industria
l processes,
Waste
management/was
te
CO2, CH4,
N2O
To provide with
information about
CO2 emissions of
new cars in the sale
point.
Other
(Regulatory)
Implemented All sales point in the Czech Republic are
equipped with cards with detailed informations
about CO2 emissions including coloured
labelling.
2000 Ministry of
Environment
75.86
Integration of public in
the transport projects
Transport N2O, CO2,
CH4
Improve function of
transport systems by
wider involvment of
public in the decision
making process.
Information Planned 2000 Ministry of
transport/Municipalities
75.86
Eco-driving Transport N2O, CO2,
CH4
Organisation of an
international
campaign in order to
learn drivers to drive
more economically
and safely.
Education Planned 2000 Ministry of transport 170.69
Territorial planned
measures
With help of the
quality of territorial
plans it is possible to
achieve the reduction
of travelling needs
and length of
journeys by the
automobile transport
(by building
residential locations
with job
opportunities),
changes transported
labour division in
favour of ecologically
more friendly types
of transport (for
example quick line
construction of public
transport) and last but
not least, traffic
diversion from places
where the population
is directly exposed to
emissions and noise
from automobiles
(planning of new
roads, city and
community bypasses,
etc.).
Other
(Economic)
Implemented 2000 Ministry of transport,
State Fund of Transport
Infrastructure
189.65
Waste management
plan (2003)
Government Regulation
No. 197/2003
Waste
management/was
te
Integrated framework
document for waste
management in the
country
Regulatory Implemented This is the main programme document of the
Czech Republic regarding the waste sector.
Since it is already outdated, a new version of
the programme is under preparation now.
2003 Ministry of
Environment
6.00
Waste management
plan (2003)
Government Regulation
No. 197/2003
Energy Integrated framework
document for waste
management in the
country
Regulatory Implemented This is the main programme document of the
Czech Republic regarding the waste sector.
Since it is already outdated, a new version of
the programme is under preparation now.
2003 Ministry of
Environment
130.00
Waste management
plan (2011)
Waste
management/was
te, Energy
Integrated framework
document for waste
management in the
country
Regulatory Implemented This is a document under preparation and it
will supersede the current Wastew
management plan from they year 2003.
2013 Ministry of
Environment
388.00
EU ETS Energy,
Transport,
Industry/industria
l processes
CO2 The decisive
instrument to
decrease emissions of
greenhouse gases
from big sources.
Other (Fiscal) Implemented This measure is implementation of the most
important EU-level measure.
2005 Ministry of
Environment
3,230.00

Table 3 CZE_BR1_v1.0
Progress in achievement of the quantified economy-wide emission reduction target: information on mitigation actions and their effects
Brief descriptione Start year of
implementation
Implementing entity or
entitiesName of mitigation action
a
Estimate of mitigation impact (not
cumulative, in kt CO 2 eq)Objective and/or
activity affected
Type of
instrumentc
Status of
implementationd
Sector(s)
affectedb
GHG(s)
affected
Support of voluntary
commitments to energy
savings
Energy CH4, CO2,
N2O
Tax allowances,
where applicable,
possibility to draw the
grants for energy end-
users, who commit
themselves to meet a
certain reduction in
energy efficiency (or
absolute reduction in
energy consumption
or CO2 emissions).
Implemented 2011 Ministry of Industry and
Trade
457.54
Energy labelling of
household electrical
appliances
Energy CO2, CH4,
N2O
Convincing
consumers to buy
more energy efficient
household appliances
through offering
necessary information
for desisions on
purchases.
Information Implemented A thorough inspection of energy labelling of
appliances in shops, checking the information
content of labels by testing the electrical
appliances; Financial support for information
campaigns promoting energy-saving electrical
appliances
2001 Ministry of Industry and
Trade
952.37
Support to housing fund
modernization using the
building saving
Energy CO2, CH4,
N2O
Offer of
advantageous method
of state-subsidised
savings and the
possibility of
obtaining a soft loan
(or bridging loan) for
housing needs of
natural persons
Economic Planned 1995 Ministry of Finance 512.67
Energy Star Energy CH4, CO2,
N2O
Promoting the
selection of office
appliances in bulk
purchases;
information support
for all categories of
consumers
Regulatory Planned 2006 Ministry of Industry and
Trade
1,172.35
Eco-design Energy CO2, CH4,
N2O
The directive imposes
among others energy
efficiency
requirements to
products from the
early stage on the
design phase in order
to decrease energy
consumption and
impacts on the
climate and
environment.
Education Implemented The whole product life cycle should be
regarded in an integrated perspective. Among
others, energy consumption of the whole
product's life cycle should be taken into
consideration.
2007 Ministry of Industry and
Trade
165.66

Table 3 CZE_BR1_v1.0
Progress in achievement of the quantified economy-wide emission reduction target: information on mitigation actions and their effects
Brief descriptione Start year of
implementation
Implementing entity or
entitiesName of mitigation action
a
Estimate of mitigation impact (not
cumulative, in kt CO 2 eq)Objective and/or
activity affected
Type of
instrumentc
Status of
implementationd
Sector(s)
affectedb
GHG(s)
affected
Minimum share of
biofuels
Transport,
Energy
CH4, CO2,
N2O
Reduction of CO2
emissions using
biofuels in transport.
Regulatory Planned The measure stipulates minimal shares of
biofuels on the marketwith automotive fuels.
2006 Ministry of Industry and
Trade
912.00
Recast of the Directive
on energy performance
of buildings
Energy CH4, CO2,
N2O
Reduction of energy
consumption and the
use of energy from
renewable sources in
the buildings.
Regulatory Implemented The measure stipulates minimum requirements
as regards the energy performance of new and
existing buildings, requires the certification of
their energy performance and the regular
inspection of boilers and air conditioning
systems in buildings.
2011 Ministry of Industry and
Trade
409.77
Regulation on CO2
from light-commercial
vehicles
Transport CO2 To decrease
emissions from vans
Regulatory Planned 2011 Ministry of environment 485.71
Ecological Tax Reform Energy,
Transport
CO2 The measure
objective is to
decrease
consumption of fossil
fuels and CO2
emissions making
energy carriers with
higher carbon content
less attractive.
Fiscal Implemented The measure stipulates consumers’ tax on
energy carriers more or less exactly equal to
minimal levels required by the EU directive.
2007 Ministry of Finance 4.00
Clean air act Cross-cutting CO2, CH4,
N2O
The law introduces
National programme
for abatement of
climate change of
Earth. The law sets
among other things
emission bounds and
reduction targets and
deadlines for
substances
influencing the
climate system. There
is also an obligation
of operators of large
plants above 5 MW to
keep emission bounds
and to submit data on
substances
influencing climate
system.
Regulatory Implemented This act sets the basic principles of the air
protection. It is accompanied by a row of
decreases dealing with specific issues.
2002 Ministry of
Environment
NA
Cross Compliance Agriculture CH4, N2O Cross Compliance Other
(Education)
Implemented The subsidies can be granted only on the
condition that a beneficiary meets the statutory
management requirements addressing
environment, public health, the health of
animals and plants, and animal welfar, the
standards of good agricultural and
environmental conditions (GAEC); and
minimum requirements for fertilizer and plant
protection product use as part of agro-
environmental measures.
2009 Ministry of Agriculture NA
Energy act Energy CO2 The law establishes
the obligation of
electricity distributors
to buy electricity
from combined heat
and power plants and
from renewable
energy sources. It
also opens the market
with electricity.
Regulatory Implemented This act establishes the rules for operating
energy enterprises and energy markets. It is
accompanied by a row of decreases dealing
with specific issues.
2000 Ministry of Industry and
Trade
NA

Table 3 CZE_BR1_v1.0
Progress in achievement of the quantified economy-wide emission reduction target: information on mitigation actions and their effects
Brief descriptione Start year of
implementation
Implementing entity or
entitiesName of mitigation action
a
Estimate of mitigation impact (not
cumulative, in kt CO 2 eq)Objective and/or
activity affected
Type of
instrumentc
Status of
implementationd
Sector(s)
affectedb
GHG(s)
affected
Energy management act Energy,
Transport
CO2 This law covers more
topics: 1. Sets the
obligation for regional
authorities to
elaborate Regional
energy concept which
should define rules
for efficient use of
energe and for
introduction of RES.
2. Establishes the
National programme
for effective use of
energy and utilisation
of renewable and
secondary energy
sources. 3. Defines
minimal efficiencies
for electricity and
heat production,
maximum losses for
energy transmission
and distribution and
sets minimal technical
requirements for
buildings and
appliances. 4. Defines
measures for support
of RES. 5. Introduces
labeling of
appliances. 6. Sets
obligation to perform
energy audits of
defined categories of
buildings.
Regulatory Implemented This act sets the basic rules for efficient use of
energy. It is accompanied by a row of
decreases dealing with specific issues.
2000 Ministry of Industry and
Trade
NA
National Energy
Efficiency Action Plan
Energy CO2 Plan of measures to
be implemented in
order to fulfill the
required energy
savings in the period
2008 - 2016
Regulatory|Econo
mic|Fiscal|Inform
ation|Research|V
oluntary
Agreement
Implemented This policy includes measures from both
versions of NAPEE elaborated so far. Since it
is a complex measure, its impacts are reported
under many other measures.
2008 Ministry of Industry and
Trade
NA
National programme for
mitigation of
consequences of
climate change in the
CR
Cross-cutting CH4, CO2,
HFCs, N2O,
PFCs, SF6
Reduction of
greenhouse gas
emissions and
ensuring of meeting
the obligations
resulting from Kyoto
protocol
Other (Other) Implemented This is the main programme document of the
Czech Republic defining main targets and paths
in the field of climate protection.
2004 Ministry of
Environment
NA
National Renewable
Energy Resources Plan
Energy CO2 Ensure the share of
RES in accordance
with the RES
directive 2009/28/EC.
Economic|Fiscal|
Regulatory
Adopted 2010 Ministry of Industry and
Trade
NA
Nitrate Directive
(1991/676/EEC) - 3rd
Action Plan
Agriculture N2O Water protection
against pollution
caused by nitrates
from agricultural
sources
Regulatory Adopted Remarcation of vulnerable areas and setting of
rules for management
2012 Ministry of Agriculture NA
OP Rural development
and Multifunctional
Agriculture
Agriculture CH4, N2O To support
agricultural primary
production and the
processing of
agricultural products,
to support forest and
water management
and to ensure the
continually
sustainable
development of the
countryside
Economic Implemented 2007 Ministry of Agriculture NA
Note : The two final columns specify the year identified by the Party for estimating impacts (based on the status of the measure and whether an ex post or ex ante estimation is available).
Abbreviations : GHG = greenhouse gas; LULUCF = land use, land-use change and forestry.
Custom Footnotes
a Parties should use an asterisk (*) to indicate that a mitigation action is included in the ‘with measures’ projection.
b To the extent possible, the following sectors should be used: energy, transport, industry/industrial processes, agriculture, forestry/LULUCF, waste management/waste, other sectors, cross-cutting, as appropriate.
c To the extent possible, the following types of instrument should be used: economic, fiscal, voluntary agreement, regulatory, information, education, research, other.
d To the extent possible, the following descriptive terms should be used to report on the status of implementation: implemented, adopted, planned.
e Additional information may be provided on the cost of the mitigation actions and the relevant timescale.
f Optional year or years deemed relevant by the Party.
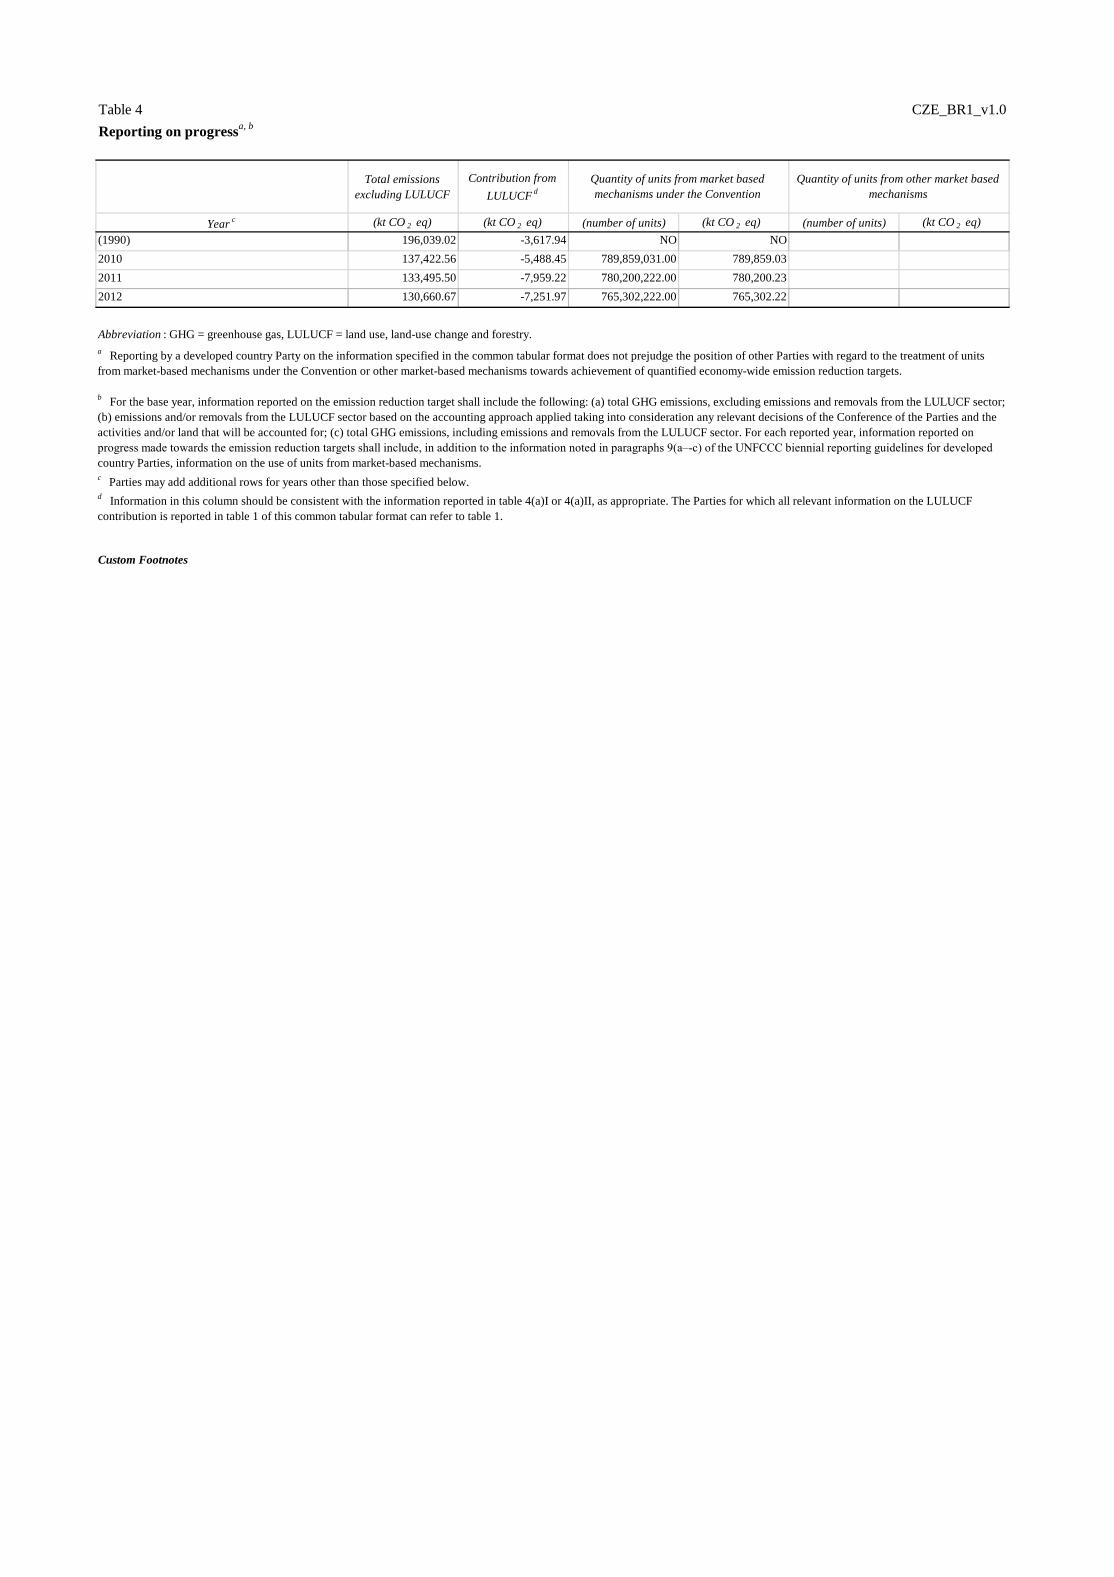
Table 4 CZE_BR1_v1.0
Reporting on progressa, b
Total emissions
excluding LULUCF
Contribution from
LULUCFd
Yearc (kt CO 2 eq) (kt CO 2 eq) (number of units) (kt CO 2 eq) (number of units) (kt CO 2 eq)
(1990) 196,039.02 -3,617.94 NO NO
2010 137,422.56 -5,488.45 789,859,031.00 789,859.03
2011 133,495.50 -7,959.22 780,200,222.00 780,200.23
2012 130,660.67 -7,251.97 765,302,222.00 765,302.22
Abbreviation : GHG = greenhouse gas, LULUCF = land use, land-use change and forestry.
Custom Footnotes
d Information in this column should be consistent with the information reported in table 4(a)I or 4(a)II, as appropriate. The Parties for which all relevant information on the LULUCF
contribution is reported in table 1 of this common tabular format can refer to table 1.
Quantity of units from other market based
mechanisms
Quantity of units from market based
mechanisms under the Convention
a Reporting by a developed country Party on the information specified in the common tabular format does not prejudge the position of other Parties with regard to the treatment of units
from market-based mechanisms under the Convention or other market-based mechanisms towards achievement of quantified economy-wide emission reduction targets.
b For the base year, information reported on the emission reduction target shall include the following: (a) total GHG emissions, excluding emissions and removals from the LULUCF sector;
(b) emissions and/or removals from the LULUCF sector based on the accounting approach applied taking into consideration any relevant decisions of the Conference of the Parties and the
activities and/or land that will be accounted for; (c) total GHG emissions, including emissions and removals from the LULUCF sector. For each reported year, information reported on
progress made towards the emission reduction targets shall include, in addition to the information noted in paragraphs 9(a–c) of the UNFCCC biennial reporting guidelines for developed
country Parties, information on the use of units from market-based mechanisms.c
Parties may add additional rows for years other than those specified below.

Table 4(a)I CZE_BR1_v1.0
Net GHG
emissions/removals from
LULUCF categories c
Base year/period or
reference level value d
Contribution from
LULUCF for
reported year
Cumulative
contribution from
LULUCF e
Total LULUCF Land-based approach
A. Forest land Land-based approach
1. Forest land remaining forest land Land-based approach
2. Land converted to forest land Land-based approach
3. Other g Land-based approach
B. Cropland Land-based approach
1. Cropland remaining cropland Land-based approach
2. Land converted to cropland Land-based approach
3. Other g Land-based approach
C. Grassland Land-based approach
1. Grassland remaining grassland Land-based approach
2. Land converted to grassland Land-based approach
3. Other g Land-based approach
D. Wetlands Land-based approach
1. Wetland remaining wetland Land-based approach
2. Land converted to wetland Land-based approach
3. Other g Land-based approach
E. Settlements Land-based approach
1. Settlements remaining settlements Land-based approach
2. Land converted to settlements Land-based approach
3. Other g Land-based approach
F. Other land Land-based approach
1. Other land remaining other land Land-based approach
2. Land converted to other land Land-based approach
3. Other g Land-based approach
Harvested wood products Land-based approach
Abbreviations : GHG = greenhouse gas, LULUCF = land use, land-use change and forestry.
Custom Footnotes
Progress in achieving the quantified economy-wide emission reduction targets – further information on mitigation actions relevant to the
contribution of the land use, land-use change and forestry sector in 2011 a,b
Accounting
approach f
(kt CO 2 eq)
f Label each accounting approach and indicate where additional information is provided within this biennial report explaining how it was implemented, including all relevant accounting
parameters (i.e. natural disturbances, caps).g
Specify what was used for the category “other”. Explain in this biennial report how each was defined and how it relates to the categories used for reporting under the Convention or its Kyoto
Protocol.
a Reporting by a developed country Party on the information specified in the common tabular format does not prejudge the position of other Parties with regard to the treatment of units from
market-based mechanisms under the Convention or other market-based mechanisms towards achievement of quantified economy-wide emission reduction targets.b
Parties that use the LULUCF approach that is based on table 1 do not need to complete this table, but should indicate the approach in table 2. Parties should fill in a separate table for each year,
namely 2011 and 2012, where 2014 is the reporting year.
c For each category, enter the net emissions or removals reported in the most recent inventory submission for the corresponding inventory year. If a category differs from that used for the
reporting under the Convention or its Kyoto Protocol, explain in the biennial report how the value was derived.d
Enter one reference level or base year/period value for each category. Explain in the biennial report how these values have been calculated.e
If applicable to the accounting approach chosen. Explain in this biennial report to which years or period the cumulative contribution refers to.

Table 4(a)I CZE_BR1_v1.0
Net GHG
emissions/removals from
LULUCF categories c
Base year/period or
reference level value d
Contribution from
LULUCF for
reported year
Cumulative
contribution from
LULUCF e
Total LULUCF Land-based approach
A. Forest land Land-based approach
1. Forest land remaining forest land Land-based approach
2. Land converted to forest land Land-based approach
3. Other g Land-based approach
B. Cropland Land-based approach
1. Cropland remaining cropland Land-based approach
2. Land converted to cropland Land-based approach
3. Other g Land-based approach
C. Grassland Land-based approach
1. Grassland remaining grassland Land-based approach
2. Land converted to grassland Land-based approach
3. Other g Land-based approach
D. Wetlands Land-based approach
1. Wetland remaining wetland Land-based approach
2. Land converted to wetland Land-based approach
3. Other g Land-based approach
E. Settlements Land-based approach
1. Settlements remaining settlements Land-based approach
2. Land converted to settlements Land-based approach
3. Other g Land-based approach
F. Other land Land-based approach
1. Other land remaining other land Land-based approach
2. Land converted to other land Land-based approach
3. Other g Land-based approach
Harvested wood products Land-based approach
Abbreviations : GHG = greenhouse gas, LULUCF = land use, land-use change and forestry.
Custom Footnotes
Progress in achieving the quantified economy-wide emission reduction targets – further information on mitigation actions relevant to the
contribution of the land use, land-use change and forestry sector in 2012 a, b
d Enter one reference level or base year/period value for each category. Explain in the biennial report how these values have been calculated.
e If applicable to the accounting approach chosen. Explain in this biennial report to which years or period the cumulative contribution refers to.
f Label each accounting approach and indicate where additional information is provided within this biennial report explaining how it was implemented, including all relevant accounting
parameters (i.e. natural disturbances, caps).g
Specify what was used for the category “other”. Explain in this biennial report how each was defined and how it relates to the categories used for reporting under the Convention or its Kyoto
Protocol.
Accounting
approach f
(kt CO 2 eq)
a Reporting by a developed country Party on the information specified in the common tabular format does not prejudge the position of other Parties with regard to the treatment of units from
market-based mechanisms under the Convention or other market-based mechanisms towards achievement of quantified economy-wide emission reduction targets.b
Parties that use the LULUCF approach that is based on table 1 do not need to complete this table, but should indicate the approach in table 2. Parties should fill in a separate table for each year,
namely 2011 and 2012, where 2014 is the reporting year.
c For each category, enter the net emissions or removals reported in the most recent inventory submission for the corresponding inventory year. If a category differs from that used for the
reporting under the Convention or its Kyoto Protocol, explain in the biennial report how the value was derived.

Table 4(a)II CZE_BR1_v1.0
Source: CZE_CRF__ v1.3
2008 2009 2010 2011 Totalg
A. Article 3.3 activities
A.1. Afforestation and Reforestation -1'245.81
A.1.1. Units of land not harvested since the beginning of the commitment periodj -271.99 -294.68 -322.26 -356.88 -1,245.81 -1'245.81
A.1.2. Units of land harvested since the beginning of the commitment periodj NO
A.2. Deforestation 160.20 170.19 206.87 163.70 700.97 700.97187
B. Article 3.4 activities
B.1. Forest Management (if elected) -4,403.99 -6,441.15 -5,096.22 -7,568.71 -23,510.07 -5866.66667
3.3 offsetk 0 0
FM capl 5866.66667 -5866.66667
B.2. Cropland Management (if elected) 0 NA NA NA NA NA 0 0
B.3. Grazing Land Management (if elected) 0 NA NA NA NA NA 0 0
B.4. Revegetation (if elected) 0 NA NA NA NA NA 0 0
Note: 1 kt CO2 eq equals 1 Gg CO2 eq.
Abbreviations : CRF = common reporting format, LULUCF = land use, land-use change and forestry.
Custom Footnotes
Accounting
parametersh
Accounting
quantityi
(kt CO2 eq)
Documentation Box:
l In accordance with paragraph 11 of the annex to decision 16/CMP.1, for the first commitment period of the Kyoto Protocol only, additions to and subtractions from the assigned amount of a Party resulting
from Forest management under Article 3, paragraph 4, after the application of paragraph 10 of the annex to decision 16/CMP.1 and resulting from forest management project activities undertaken under
Article 6, shall not exceed the value inscribed in the appendix of the annex to decision 16/CMP.1, times five.
f Additional columns for relevant years should be added, if applicable.
g Cumulative net emissions and removals for all years of the commitment period reported in the current submission.
h The values in the cells “3.3 offset” and “Forest management cap” are absolute values.
i The accounting quantity is the total quantity of units to be added to or subtracted from a Party’s assigned amount for a particular activity in accordance with the provisions of Article 7, paragraph 4, of the
Kyoto Protocol.
j In accordance with paragraph 4 of the annex to decision 16/CMP.1, debits resulting from harvesting during the first commitment period following afforestation and reforestation since 1990 shall not be
greater than the credits accounted for on that unit of land.
k In accordance with paragraph 10 of the annex to decision 16/CMP.1, for the first commitment period a Party included in Annex I that incurs a net source of emissions under the provisions of Article 3
paragraph 3, may account for anthropogenic greenhouse gas emissions by sources and removals by sinks in areas under forest management under Article 3, paragraph 4, up to a level that is equal to the net
source of emissions under the provisions of Article 3, paragraph 3, but not greater than 9.0 megatonnes of carbon times five, if the total anthropogenic greenhouse gas emissions by sources and removals by
sinks in the managed forest since 1990 is equal to, or larger than, the net source of emissions incurred under Article 3, paragraph 3.
Progress in achievement of the quantified economy-wide emission reduction targets – further information on mitigation actions relevant
to the counting of emissions and removals from the land use, land-use change and forestry sector in relation to activities under Article 3,
paragraphs 3 and 4, of the Kyoto Protocola,b, c
GREENHOUSE GAS SOURCE AND SINK ACTIVITIESBase year
d
d Net emissions and removals in the Party’s base year, as established by decision 9/CP.2.
e All values are reported in the information table on accounting for activities under Article 3, paragraphs 3 and 4, of the Kyoto Protocol, of the CRF for the relevant inventory year as reported in the current
submission and are automatically entered in this table.
a Reporting by a developed country Party on the information specified in the common tabular format does not prejudge the position of other Parties with regard to the treatment of units from market-based
mechanisms under the Convention or other market-based mechanisms towards achievement of quantified economy-wide emission reduction targets.
b Developed country Parties with a quantified economy-wide emission reduction target as communicated to the secretariat and contained in document FCCC/SB/2011/INF.1/Rev.1 or any update to that
document, that are Parties to the Kyoto Protocol, may use table 4(a)II for reporting of accounting quantities if LULUCF is contributing to the attainment of that target.
c Parties can include references to the relevant parts of the national inventory report, where accounting methodologies regarding LULUCF are further described in the documentation box or in the biennial
reports.
Net emissions/removalse

Table 4(b) CZE_BR1_v1.0
Reporting on progressa, b, c
2011 2012
(number of units) 780,200,222.00 765,302,222.00
(kt CO 2 eq) 780,200.23 765,302.22
(number of units) 766,345,459.00 747,756,091.00
(kt CO2 eq) 766,345.46 747,756.09
(number of units) 1,813,118.00 4,063,078.00
(kt CO2 eq) 1,813.12 4,063.08
(number of units) 12,041,645.00 13,483,053.00
(kt CO2 eq) 12,041.65 13,483.05
(number of units) NO NO
(kt CO2 eq) NO NO
(number of units) NO NO
(kt CO2 eq) NO NO
(number of units)
(kt CO 2 eq)
(number of units)
(kt CO 2 eq)
(number of units) 780,200,222.00 765,302,222.00
(kt CO 2 eq) 780,200.23 765,302.22
c Parties may include this information, as appropriate and if relevant to their target.
d Units surrendered by that Party for that year that have not been previously surrendered by that or any other Party.
e Additional rows for each market-based mechanism should be added, if applicable.
Custom Footnotes
b For each reported year, information reported on progress made towards the emission reduction target shall include, in addition to the
information noted in paragraphs 9(a-c) of the reporting guidelines, on the use of units from market-based mechanisms.
Abbreviations : AAUs = assigned amount units, CERs = certified emission reductions, ERUs = emission reduction units, lCERs = long-term
certified emission reductions, tCERs = temporary certified emission reductions.
a Reporting by a developed country Party on the information specified in the common tabular format does not prejudge the position of other
Parties with regard to the treatment of units from market-based mechanisms under the Convention or other market-based mechanisms towards
achievement of quantified economy-wide emission reduction targets.
Total
Note: 2011 is the latest reporting year.
Other units d,e
Units of market based mechanismsYear
Units from market-based mechanisms under the
Convention
Units from other market-based mechanisms
Kyoto
Protocol
unitsd
Kyoto Protocol units
AAUs
ERUs
CERs
tCERs
lCERs
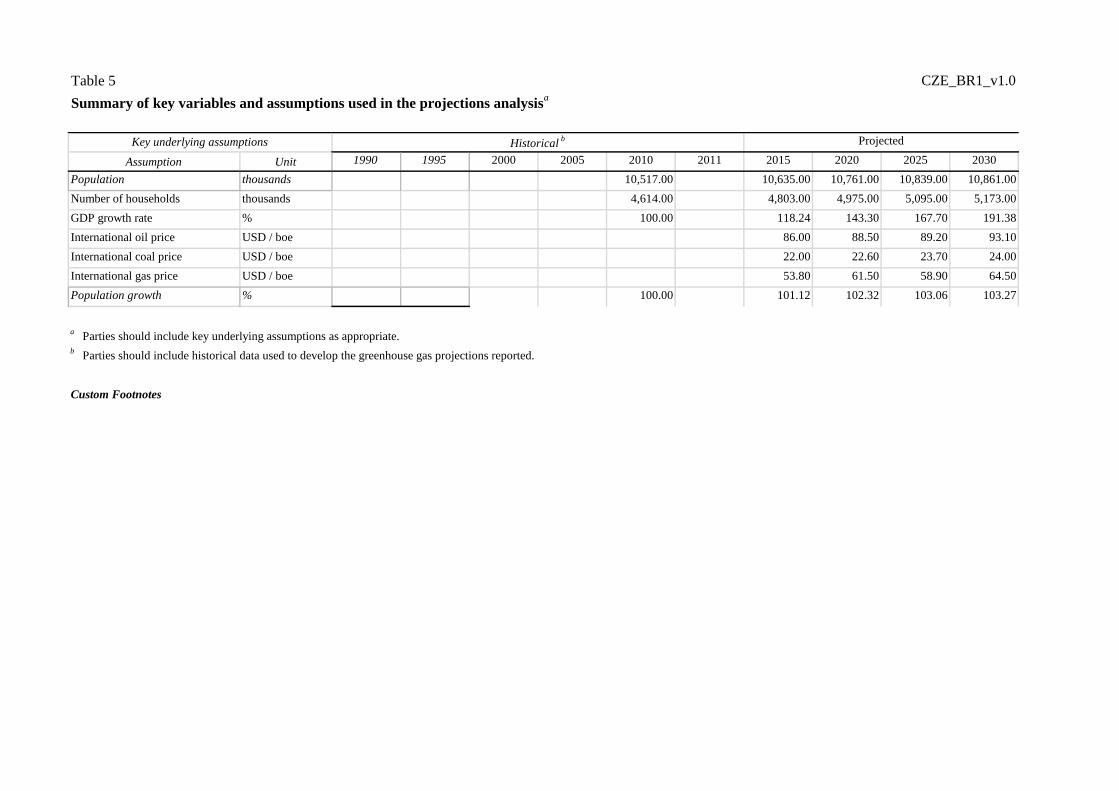
Table 5 CZE_BR1_v1.0
Summary of key variables and assumptions used in the projections analysisa
Assumption Unit 1990 1995 2000 2005 2010 2011 2015 2020 2025 2030
Population thousands 10,517.00 10,635.00 10,761.00 10,839.00 10,861.00
Number of households thousands 4,614.00 4,803.00 4,975.00 5,095.00 5,173.00
GDP growth rate % 100.00 118.24 143.30 167.70 191.38
International oil price USD / boe 86.00 88.50 89.20 93.10
International coal price USD / boe 22.00 22.60 23.70 24.00
International gas price USD / boe 53.80 61.50 58.90 64.50
Population growth % 100.00 101.12 102.32 103.06 103.27
b Parties should include historical data used to develop the greenhouse gas projections reported.
Custom Footnotes
Key underlying assumptions
a Parties should include key underlying assumptions as appropriate.
Historicalb Projected

Table 6(a) CZE_BR1_v1.0
Information on updated greenhouse gas projections under a ‘with measures’ scenarioa
Base Year 1990 1995 2000 2005 2010 2011 2020 2030
Sectord,e
Energy 147,381.47 147,381.47 112,546.55 105,976.97 101,021.23 94,796.27 91,143.18 79,611.50 67,777.30
Transport 9,383.44 9,383.44 11,105.81 13,626.44 19,063.09 18,532.06 18,371.41 18,754.00 17,931.00
Industry/industrial processes 20,367.66 20,367.66 13,784.54 14,129.67 13,493.01 12,517.87 12,260.05 12,783.70 12,690.70
Agriculture 16,233.28 16,233.28 10,331.98 9,094.86 8,385.03 7,964.57 8,064.84 7,809.50 7,648.60
Forestry/LULUCF -3,617.94 -3,617.94 -7,210.11 -7,524.24 -6,685.51 -5,488.45 -7,959.22 -459.00 -2,042.00
Waste management/waste 2,673.17 2,673.17 2,907.58 3,058.11 3,297.01 3,611.79 3,656.03 3,738.80 3,608.30
Other (specify)
Gas
CO2 emissions including net CO2 from LULUCF 161,063.42 161,063.42 120,716.21 118,075.11 118,926.93 112,368.94 106,270.18 103,446.00 90,237.20
CO2 emissions excluding net CO2 from LULUCF 164,812.75 164,812.75 128,037.89 125,711.08 125,744.39 118,005.01 114,296.49 104,134.90 92,511.40
CH4 emissions including CH4 from LULUCF 17,915.09 17,915.09 13,395.62 11,176.34 10,513.46 10,412.56 10,288.77 9,506.70 8,295.00
CH4 emissions excluding CH4 from LULUCF 17,815.07 17,815.07 13,308.12 11,083.87 10,400.20 10,284.36 10,233.67 9,378.60 8,164.80
N2O emissions including N2O from LULUCF 13,364.89 13,364.89 9,278.46 8,697.13 8,443.31 7,639.11 7,782.94 7,626.00 7,378.00
N2O emissions excluding N2O from LULUCF 13,333.53 13,333.53 9,254.38 8,677.87 8,424.61 7,619.70 7,770.95 7,595.00 7,347.00
HFCs NO NO 0.73 262.50 594.21 1,467.85 1,130.42 1,534.30 1,569.10
PFCs NO NO 0.12 8.81 10.08 29.43 29.43 29.40 29.40
SF6 77.68 77.68 75.20 141.92 85.88 16.22 34.55 24.60 24.60
Other (specify)
Total with LULUCFf 192,421.08 192,421.08 143,466.34 138,361.81 138,573.87 131,934.11 125,536.29 122,167.00 107,533.30
Total without LULUCF 196,039.03 196,039.03 150,676.44 145,886.05 145,259.37 137,422.57 133,495.51 122,696.80 109,646.30
Abbreviations : GHG = greenhouse gas, LULUCF = land use, land-use change and forestry.
Custom Footnotes
(kt CO2 eq)
GHG emission projections
d In accordance with paragraph 34 of the “Guidelines for the preparation of national communications by Parties included in Annex I to the
Convention, Part II: UNFCCC reporting guidelines on national communications”, projections shall be presented on a sectoral basis, to the
extent possible, using the same sectoral categories used in the policies and measures section. This table should follow, to the extent possible,
the same sectoral categories as those listed in paragraph 17 of those guidelines, namely, to the extent appropriate, the following sectors should
be considered: energy, transport, industry, agriculture, forestry and waste management. e
To the extent possible, the following sectors should be used: energy, transport, industry/industrial processes, agriculture, forestry/LULUCF,
waste management/waste, other sectors (i.e. cross-cutting), as appropriate.
f Parties may choose to report total emissions with or without LULUCF, as appropriate.
c 20XX is the reporting due-date year (i.e. 2014 for the first biennial report).
a In accordance with the “Guidelines for the preparation of national communications by Parties included in Annex I to the Convention, Part II:
UNFCCC reporting guidelines on national communications”, at a minimum Parties shall report a ‘with measures’ scenario, and may report
‘without measures’ and ‘with additional measures’ scenarios. If a Party chooses to report ‘without measures’ and/or ‘with additional measures’
scenarios they are to use tables 6(b) and/or 6(c), respectively. If a Party does not choose to report ‘without measures’ or ‘with additional
measures’ scenarios then it should not include tables 6(b) or 6(c) in the biennial report.
b Emissions and removals reported in these columns should be as reported in the latest GHG inventory and consistent with the emissions and
removals reported in the table on GHG emissions and trends provided in this biennial report. Where the sectoral breakdown differs from that
reported in the GHG inventory Parties should explain in their biennial report how the inventory sectors relate to the sectors reported in this
table.
(kt CO 2 eq)
GHG emissions and removalsb
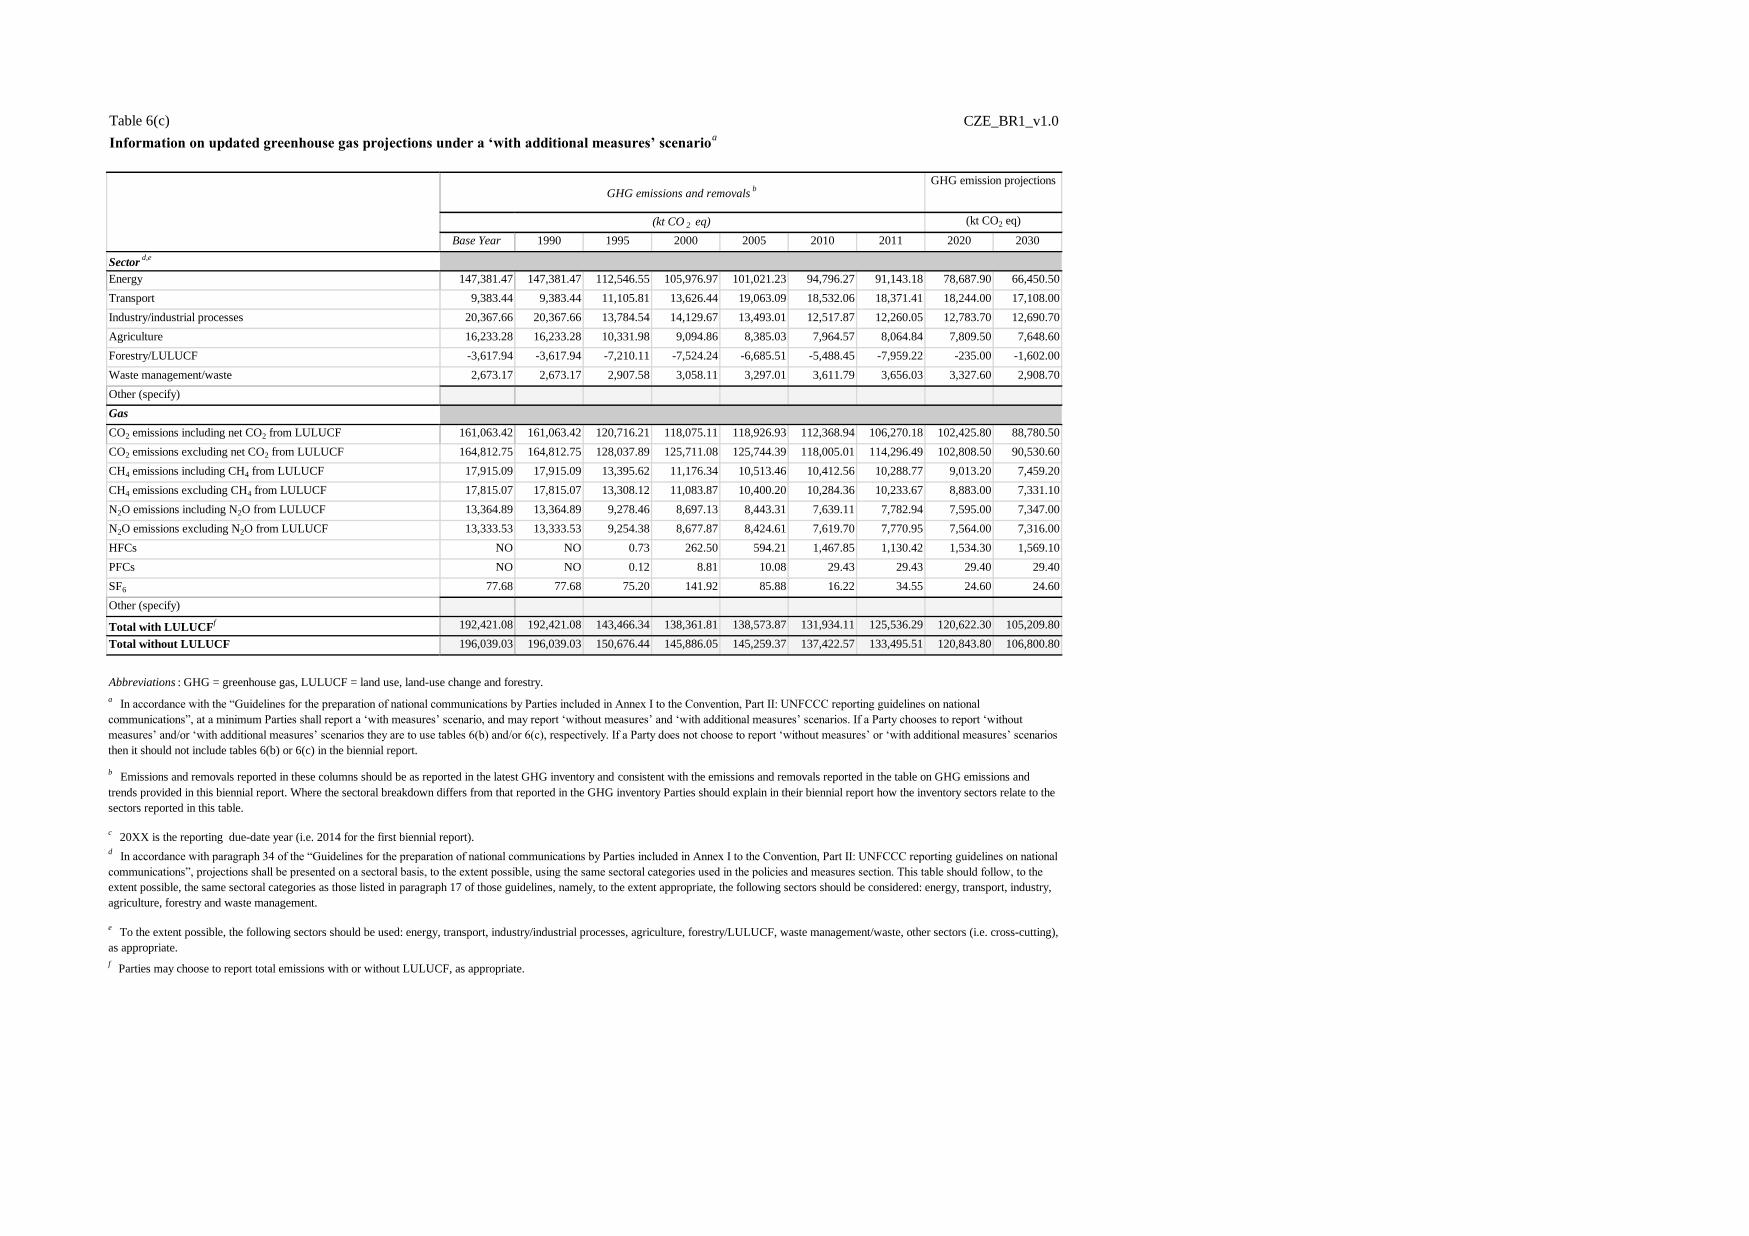
Table 6(c) CZE_BR1_v1.0
Information on updated greenhouse gas projections under a ‘with additional measures’ scenarioa
Base Year 1990 1995 2000 2005 2010 2011 2020 2030
Sectord,e
Energy 147,381.47 147,381.47 112,546.55 105,976.97 101,021.23 94,796.27 91,143.18 78,687.90 66,450.50
Transport 9,383.44 9,383.44 11,105.81 13,626.44 19,063.09 18,532.06 18,371.41 18,244.00 17,108.00
Industry/industrial processes 20,367.66 20,367.66 13,784.54 14,129.67 13,493.01 12,517.87 12,260.05 12,783.70 12,690.70
Agriculture 16,233.28 16,233.28 10,331.98 9,094.86 8,385.03 7,964.57 8,064.84 7,809.50 7,648.60
Forestry/LULUCF -3,617.94 -3,617.94 -7,210.11 -7,524.24 -6,685.51 -5,488.45 -7,959.22 -235.00 -1,602.00
Waste management/waste 2,673.17 2,673.17 2,907.58 3,058.11 3,297.01 3,611.79 3,656.03 3,327.60 2,908.70
Other (specify)
Gas
CO2 emissions including net CO2 from LULUCF 161,063.42 161,063.42 120,716.21 118,075.11 118,926.93 112,368.94 106,270.18 102,425.80 88,780.50
CO2 emissions excluding net CO2 from LULUCF 164,812.75 164,812.75 128,037.89 125,711.08 125,744.39 118,005.01 114,296.49 102,808.50 90,530.60
CH4 emissions including CH4 from LULUCF 17,915.09 17,915.09 13,395.62 11,176.34 10,513.46 10,412.56 10,288.77 9,013.20 7,459.20
CH4 emissions excluding CH4 from LULUCF 17,815.07 17,815.07 13,308.12 11,083.87 10,400.20 10,284.36 10,233.67 8,883.00 7,331.10
N2O emissions including N2O from LULUCF 13,364.89 13,364.89 9,278.46 8,697.13 8,443.31 7,639.11 7,782.94 7,595.00 7,347.00
N2O emissions excluding N2O from LULUCF 13,333.53 13,333.53 9,254.38 8,677.87 8,424.61 7,619.70 7,770.95 7,564.00 7,316.00
HFCs NO NO 0.73 262.50 594.21 1,467.85 1,130.42 1,534.30 1,569.10
PFCs NO NO 0.12 8.81 10.08 29.43 29.43 29.40 29.40
SF6 77.68 77.68 75.20 141.92 85.88 16.22 34.55 24.60 24.60
Other (specify)
Total with LULUCFf 192,421.08 192,421.08 143,466.34 138,361.81 138,573.87 131,934.11 125,536.29 120,622.30 105,209.80
Total without LULUCF 196,039.03 196,039.03 150,676.44 145,886.05 145,259.37 137,422.57 133,495.51 120,843.80 106,800.80
Abbreviations : GHG = greenhouse gas, LULUCF = land use, land-use change and forestry.
f Parties may choose to report total emissions with or without LULUCF, as appropriate.
a In accordance with the “Guidelines for the preparation of national communications by Parties included in Annex I to the Convention, Part II: UNFCCC reporting guidelines on national
communications”, at a minimum Parties shall report a ‘with measures’ scenario, and may report ‘without measures’ and ‘with additional measures’ scenarios. If a Party chooses to report ‘without
measures’ and/or ‘with additional measures’ scenarios they are to use tables 6(b) and/or 6(c), respectively. If a Party does not choose to report ‘without measures’ or ‘with additional measures’ scenarios
then it should not include tables 6(b) or 6(c) in the biennial report.
b Emissions and removals reported in these columns should be as reported in the latest GHG inventory and consistent with the emissions and removals reported in the table on GHG emissions and
trends provided in this biennial report. Where the sectoral breakdown differs from that reported in the GHG inventory Parties should explain in their biennial report how the inventory sectors relate to the
sectors reported in this table.
c 20XX is the reporting due-date year (i.e. 2014 for the first biennial report).
d In accordance with paragraph 34 of the “Guidelines for the preparation of national communications by Parties included in Annex I to the Convention, Part II: UNFCCC reporting guidelines on national
communications”, projections shall be presented on a sectoral basis, to the extent possible, using the same sectoral categories used in the policies and measures section. This table should follow, to the
extent possible, the same sectoral categories as those listed in paragraph 17 of those guidelines, namely, to the extent appropriate, the following sectors should be considered: energy, transport, industry,
agriculture, forestry and waste management.
e To the extent possible, the following sectors should be used: energy, transport, industry/industrial processes, agriculture, forestry/LULUCF, waste management/waste, other sectors (i.e. cross-cutting),
as appropriate.
(kt CO 2 eq)
GHG emissions and removalsb
(kt CO2 eq)
GHG emission projections

Table 7 CZE_BR1_v1.0
Provision of public financial support: summary information in 2011a
Mitigation AdaptationCross-
cuttinge Other
f Mitigation AdaptationCross-
cuttinge Other
f
Total contributions through multilateral channels: 386,640.00 25,000.00 21,857.00 1,413.00
Multilateral climate change fundsg 25,000.00 1,413.00
Other multilateral climate change fundsh
Multilateral financial institutions, including regional
development banks
375,740.00 21,241.00
Specialized United Nations bodies 10,900.00 616.00
Total contributions through bilateral, regional and other
channels
1,259,070.00 38,809.00 62,001.00 71,174.00 2,194.00 3,505.00
Total 1,645,710.00 38,809.00 62,001.00 25,000.00 93,031.00 2,194.00 3,505.00 1,413.00
Abbreviation: USD = United States dollars.
a Parties should fill in a separate table for each year, namely 2011 and 2012, where 2014 is the reporting year.
b Parties should provide an explanation on methodology used for currency exchange for the information provided in table 7, 7(a) and 7(b) in the box below.
c This refers to support to multilateral institutions that Parties cannot specify as climate-specific.
d Parties should explain in their biennial reports how they define funds as being climate-specific.
e This refers to funding for activities which are cross-cutting across mitigation and adaptation.
f Please specify.
g Multilateral climate change funds listed in paragraph 17(a) of the “UNFCCC biennial reporting guidelines for developed country Parties” in decision 2/CP.17.
h Other multilateral climate change funds as referred in paragraph 17(b) of the “UNFCCC biennial reporting guidelines for developed country Parties” in decision 2/CP.17.
Custom Footnotes
Documentation Box:
Each Party shall provide an indication of what new and additional financial resources they have provided, and clarify how they have determined that such resources are new and additional. Please
provide this information in relation to table 7(a) and table 7(b).
Czech koruna - CZK
Climate-specificd
USDb
Allocation channels
Year
Climate-specificd
Core/
generalc
Core/
generalc
All finacial values in thousands units (CZK resp. USD)
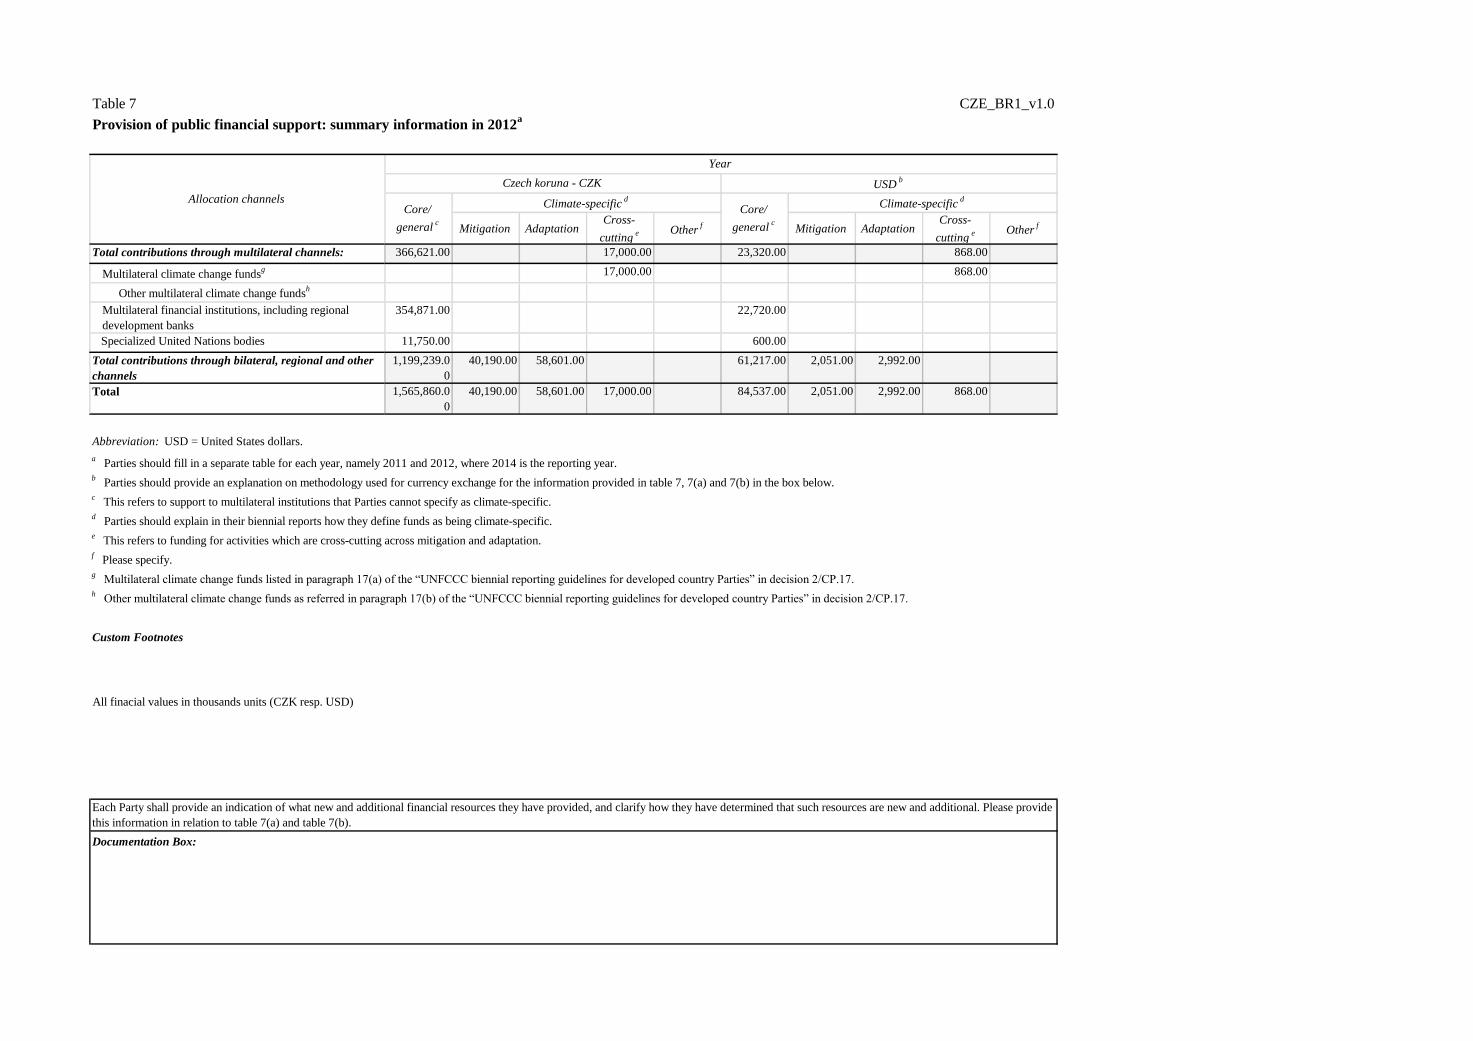
Table 7 CZE_BR1_v1.0
Provision of public financial support: summary information in 2012a
Mitigation AdaptationCross-
cuttinge Other
f Mitigation AdaptationCross-
cuttinge Other
f
Total contributions through multilateral channels: 366,621.00 17,000.00 23,320.00 868.00
Multilateral climate change fundsg 17,000.00 868.00
Other multilateral climate change fundsh
Multilateral financial institutions, including regional
development banks
354,871.00 22,720.00
Specialized United Nations bodies 11,750.00 600.00
Total contributions through bilateral, regional and other
channels
1,199,239.0
0
40,190.00 58,601.00 61,217.00 2,051.00 2,992.00
Total 1,565,860.0
0
40,190.00 58,601.00 17,000.00 84,537.00 2,051.00 2,992.00 868.00
Abbreviation: USD = United States dollars.
a Parties should fill in a separate table for each year, namely 2011 and 2012, where 2014 is the reporting year.
b Parties should provide an explanation on methodology used for currency exchange for the information provided in table 7, 7(a) and 7(b) in the box below.
c This refers to support to multilateral institutions that Parties cannot specify as climate-specific.
d Parties should explain in their biennial reports how they define funds as being climate-specific.
e This refers to funding for activities which are cross-cutting across mitigation and adaptation.
f Please specify.
g Multilateral climate change funds listed in paragraph 17(a) of the “UNFCCC biennial reporting guidelines for developed country Parties” in decision 2/CP.17.
h Other multilateral climate change funds as referred in paragraph 17(b) of the “UNFCCC biennial reporting guidelines for developed country Parties” in decision 2/CP.17.
Custom Footnotes
Documentation Box:
Each Party shall provide an indication of what new and additional financial resources they have provided, and clarify how they have determined that such resources are new and additional. Please provide
this information in relation to table 7(a) and table 7(b).
Year
Czech koruna - CZK USDb
Core/
generalc
Climate-specificd
Core/
generalc
Climate-specificdAllocation channels
All finacial values in thousands units (CZK resp. USD)
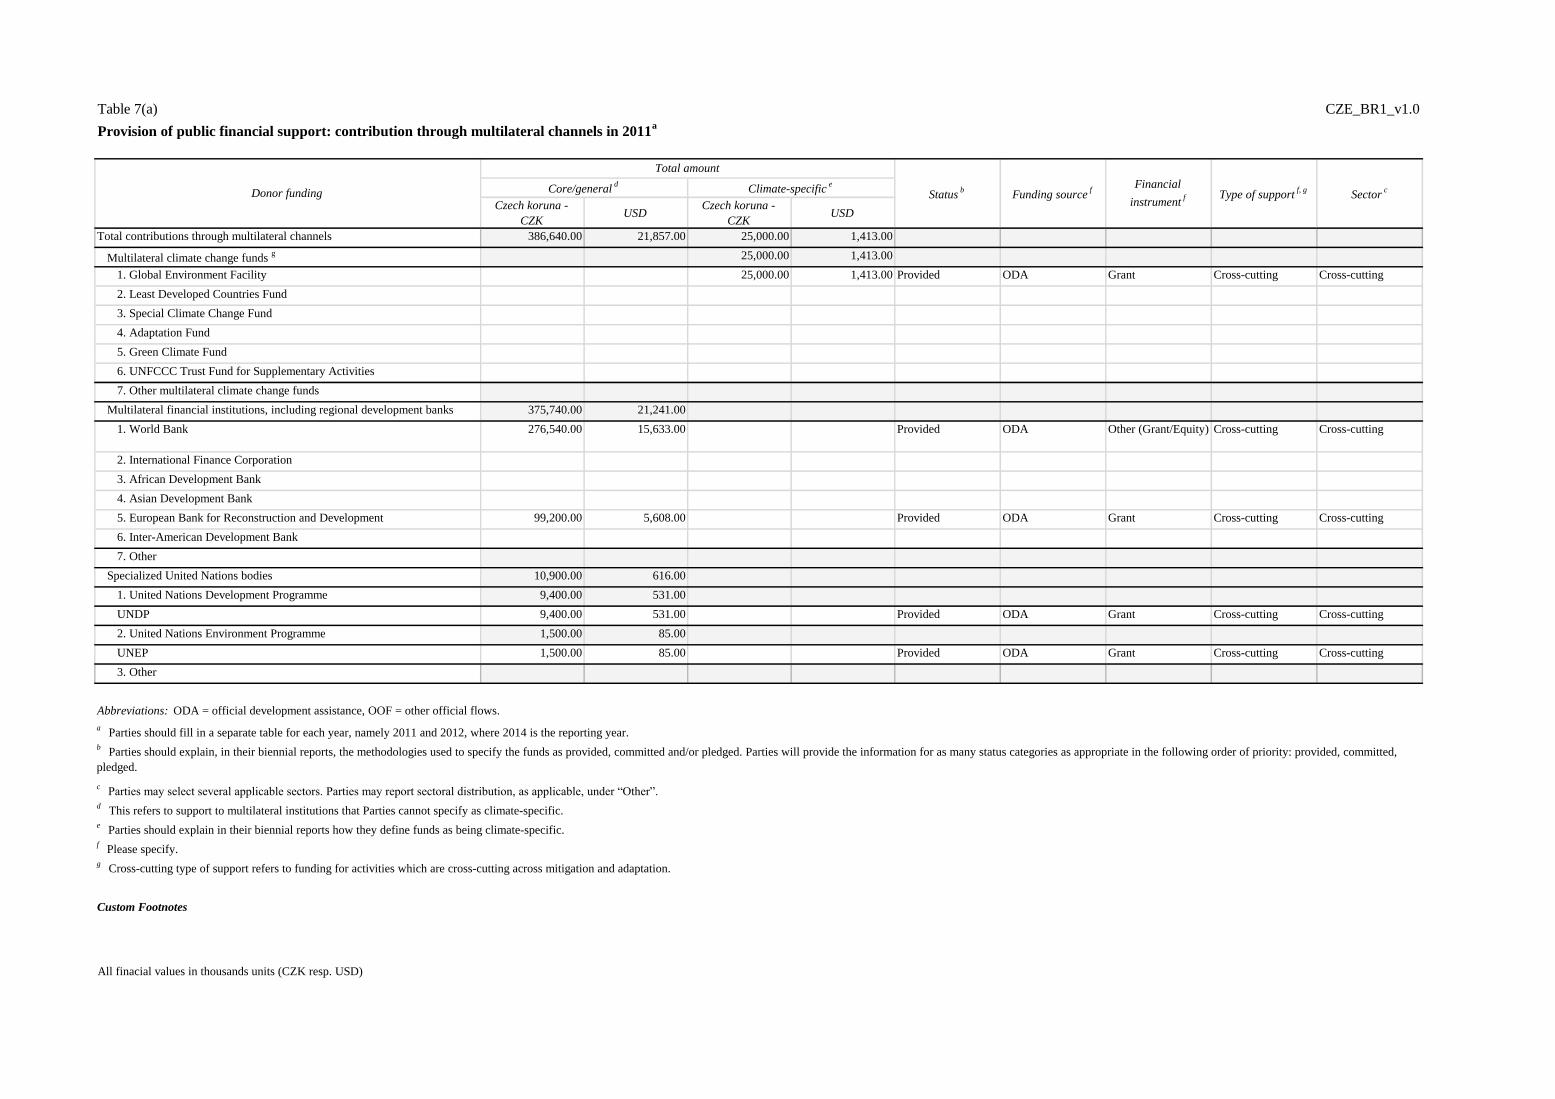
Table 7(a) CZE_BR1_v1.0
Provision of public financial support: contribution through multilateral channels in 2011a
Czech koruna -
CZKUSD
Czech koruna -
CZKUSD
Total contributions through multilateral channels 386,640.00 21,857.00 25,000.00 1,413.00
Multilateral climate change funds g 25,000.00 1,413.00
1. Global Environment Facility 25,000.00 1,413.00 Provided ODA Grant Cross-cutting Cross-cutting
2. Least Developed Countries Fund
3. Special Climate Change Fund
4. Adaptation Fund
5. Green Climate Fund
6. UNFCCC Trust Fund for Supplementary Activities
7. Other multilateral climate change funds
Multilateral financial institutions, including regional development banks 375,740.00 21,241.00
1. World Bank 276,540.00 15,633.00 Provided ODA Other (Grant/Equity) Cross-cutting Cross-cutting
2. International Finance Corporation
3. African Development Bank
4. Asian Development Bank
5. European Bank for Reconstruction and Development 99,200.00 5,608.00 Provided ODA Grant Cross-cutting Cross-cutting
6. Inter-American Development Bank
7. Other
Specialized United Nations bodies 10,900.00 616.00
1. United Nations Development Programme 9,400.00 531.00
UNDP 9,400.00 531.00 Provided ODA Grant Cross-cutting Cross-cutting
2. United Nations Environment Programme 1,500.00 85.00
UNEP 1,500.00 85.00 Provided ODA Grant Cross-cutting Cross-cutting
3. Other
Custom Footnotes
All finacial values in thousands units (CZK resp. USD)
Donor funding Core/generald
c Parties may select several applicable sectors. Parties may report sectoral distribution, as applicable, under “Other”.
Total amount
Climate-specifice
Statusb
Funding sourcef
Financial
instrumentf Type of support
f, gSector
c
Abbreviations: ODA = official development assistance, OOF = other official flows.
a Parties should fill in a separate table for each year, namely 2011 and 2012, where 2014 is the reporting year.
b Parties should explain, in their biennial reports, the methodologies used to specify the funds as provided, committed and/or pledged. Parties will provide the information for as many status categories as appropriate in the following order of priority: provided, committed,
pledged.
f Please specify.
g Cross-cutting type of support refers to funding for activities which are cross-cutting across mitigation and adaptation.
d This refers to support to multilateral institutions that Parties cannot specify as climate-specific.
e Parties should explain in their biennial reports how they define funds as being climate-specific.
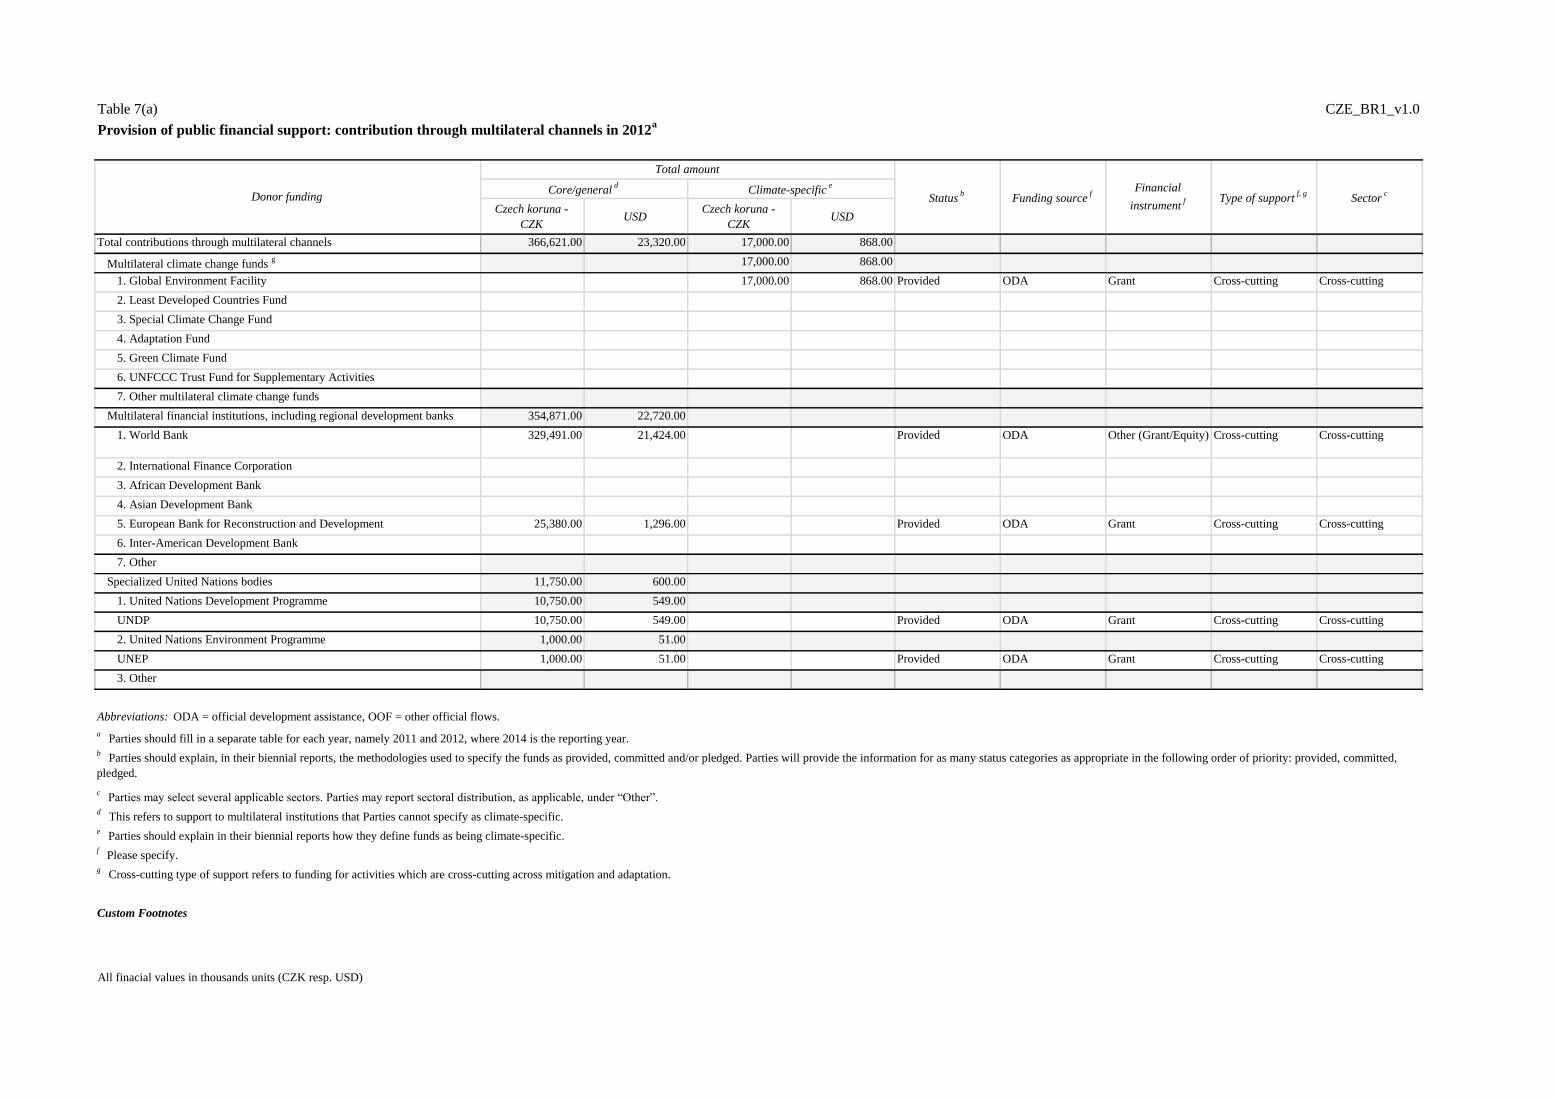
Table 7(a) CZE_BR1_v1.0
Provision of public financial support: contribution through multilateral channels in 2012a
Czech koruna -
CZKUSD
Czech koruna -
CZKUSD
Total contributions through multilateral channels 366,621.00 23,320.00 17,000.00 868.00
Multilateral climate change funds g 17,000.00 868.00
1. Global Environment Facility 17,000.00 868.00 Provided ODA Grant Cross-cutting Cross-cutting
2. Least Developed Countries Fund
3. Special Climate Change Fund
4. Adaptation Fund
5. Green Climate Fund
6. UNFCCC Trust Fund for Supplementary Activities
7. Other multilateral climate change funds
Multilateral financial institutions, including regional development banks 354,871.00 22,720.00
1. World Bank 329,491.00 21,424.00 Provided ODA Other (Grant/Equity) Cross-cutting Cross-cutting
2. International Finance Corporation
3. African Development Bank
4. Asian Development Bank
5. European Bank for Reconstruction and Development 25,380.00 1,296.00 Provided ODA Grant Cross-cutting Cross-cutting
6. Inter-American Development Bank
7. Other
Specialized United Nations bodies 11,750.00 600.00
1. United Nations Development Programme 10,750.00 549.00
UNDP 10,750.00 549.00 Provided ODA Grant Cross-cutting Cross-cutting
2. United Nations Environment Programme 1,000.00 51.00
UNEP 1,000.00 51.00 Provided ODA Grant Cross-cutting Cross-cutting
3. Other
Custom Footnotes
All finacial values in thousands units (CZK resp. USD)
c Parties may select several applicable sectors. Parties may report sectoral distribution, as applicable, under “Other”.
Donor funding
Total amount
Statusb
Funding sourcef
Financial
instrumentf Type of support
f, gCore/generald
SectorcClimate-specific
e
Abbreviations: ODA = official development assistance, OOF = other official flows.
a Parties should fill in a separate table for each year, namely 2011 and 2012, where 2014 is the reporting year.
b Parties should explain, in their biennial reports, the methodologies used to specify the funds as provided, committed and/or pledged. Parties will provide the information for as many status categories as appropriate in the following order of priority: provided, committed,
pledged.
f Please specify.
g Cross-cutting type of support refers to funding for activities which are cross-cutting across mitigation and adaptation.
e Parties should explain in their biennial reports how they define funds as being climate-specific.
d This refers to support to multilateral institutions that Parties cannot specify as climate-specific.
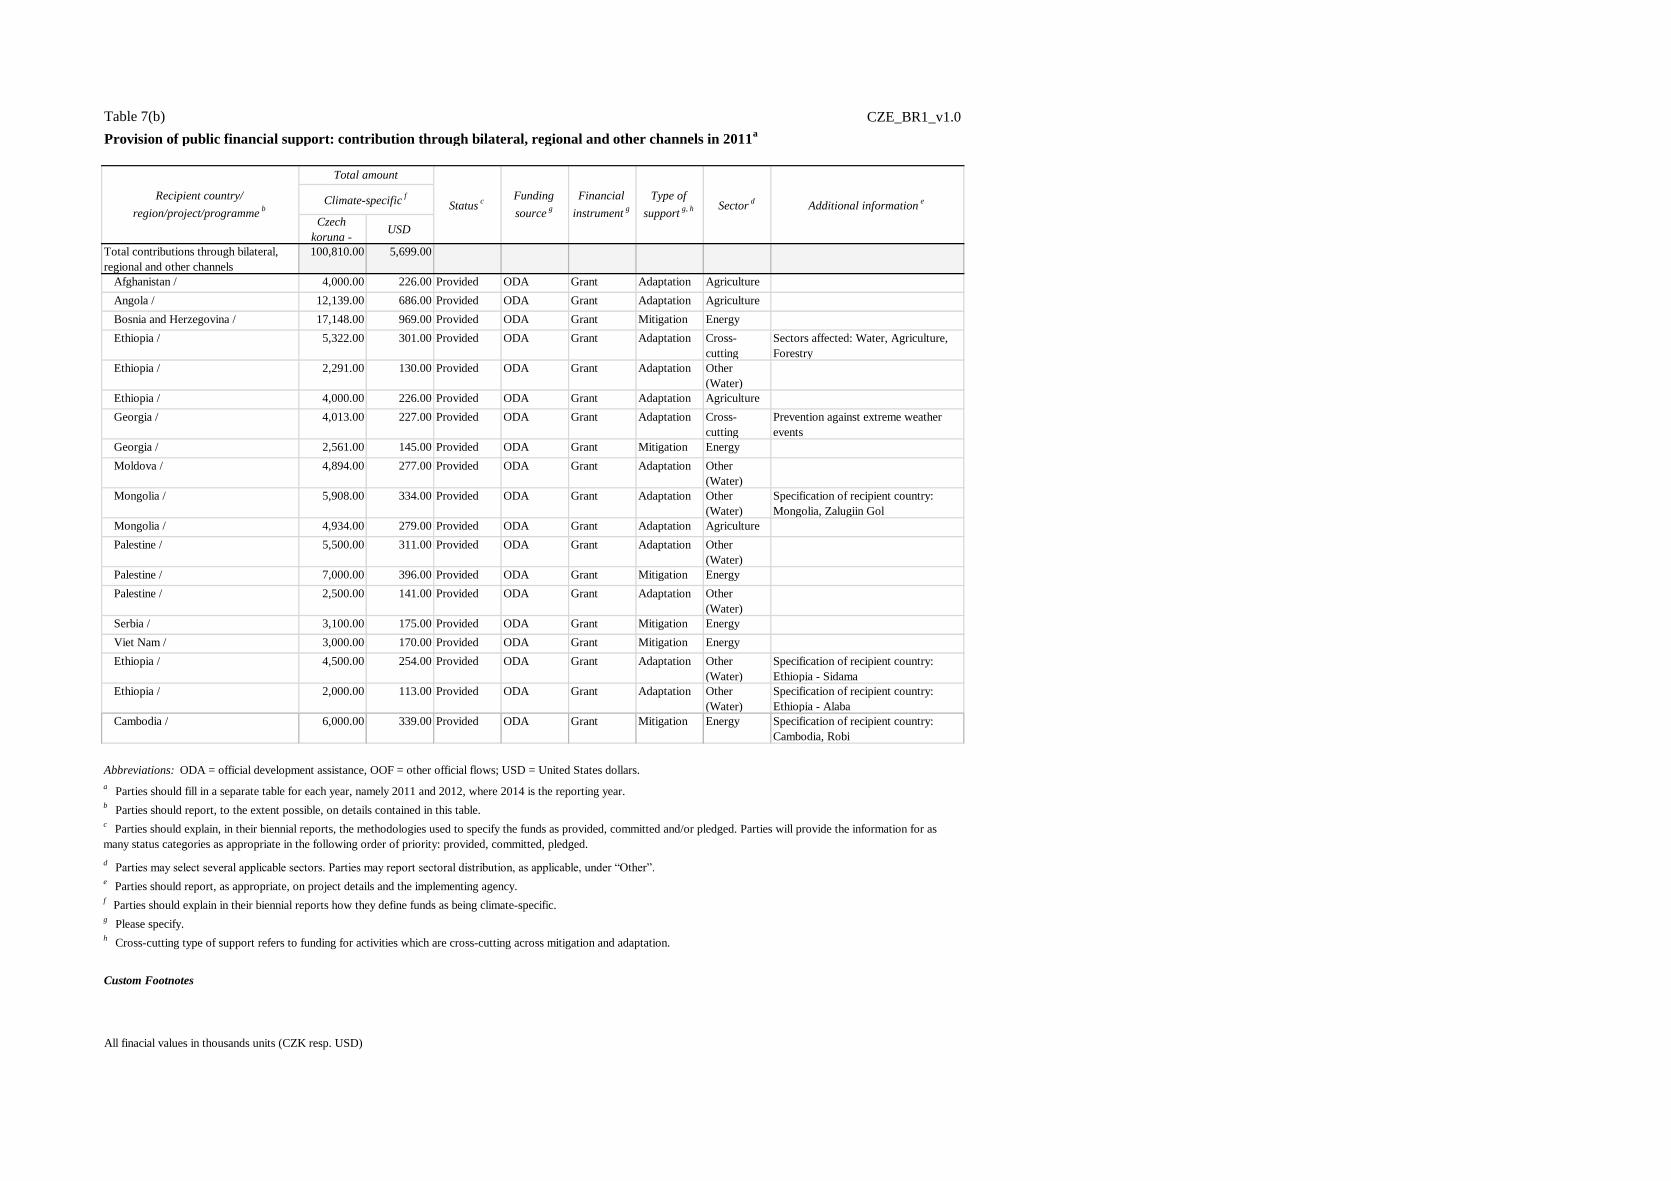
Table 7(b) CZE_BR1_v1.0
Provision of public financial support: contribution through bilateral, regional and other channels in 2011a
Czech
koruna - USD
Total contributions through bilateral,
regional and other channels
100,810.00 5,699.00
Afghanistan / 4,000.00 226.00 Provided ODA Grant Adaptation Agriculture
Angola / 12,139.00 686.00 Provided ODA Grant Adaptation Agriculture
Bosnia and Herzegovina / 17,148.00 969.00 Provided ODA Grant Mitigation Energy
Ethiopia / 5,322.00 301.00 Provided ODA Grant Adaptation Cross-
cutting
Sectors affected: Water, Agriculture,
Forestry
Ethiopia / 2,291.00 130.00 Provided ODA Grant Adaptation Other
(Water)
Ethiopia / 4,000.00 226.00 Provided ODA Grant Adaptation Agriculture
Georgia / 4,013.00 227.00 Provided ODA Grant Adaptation Cross-
cutting
Prevention against extreme weather
events
Georgia / 2,561.00 145.00 Provided ODA Grant Mitigation Energy
Moldova / 4,894.00 277.00 Provided ODA Grant Adaptation Other
(Water)
Mongolia / 5,908.00 334.00 Provided ODA Grant Adaptation Other
(Water)
Specification of recipient country:
Mongolia, Zalugiin Gol
Mongolia / 4,934.00 279.00 Provided ODA Grant Adaptation Agriculture
Palestine / 5,500.00 311.00 Provided ODA Grant Adaptation Other
(Water)
Palestine / 7,000.00 396.00 Provided ODA Grant Mitigation Energy
Palestine / 2,500.00 141.00 Provided ODA Grant Adaptation Other
(Water)
Serbia / 3,100.00 175.00 Provided ODA Grant Mitigation Energy
Viet Nam / 3,000.00 170.00 Provided ODA Grant Mitigation Energy
Ethiopia / 4,500.00 254.00 Provided ODA Grant Adaptation Other
(Water)
Specification of recipient country:
Ethiopia - Sidama
Ethiopia / 2,000.00 113.00 Provided ODA Grant Adaptation Other
(Water)
Specification of recipient country:
Ethiopia - Alaba
Cambodia / 6,000.00 339.00 Provided ODA Grant Mitigation Energy Specification of recipient country:
Cambodia, Robi
Abbreviations: ODA = official development assistance, OOF = other official flows; USD = United States dollars.
Custom Footnotes
All finacial values in thousands units (CZK resp. USD)
d Parties may select several applicable sectors. Parties may report sectoral distribution, as applicable, under “Other”.
e Parties should report, as appropriate, on project details and the implementing agency.
f Parties should explain in their biennial reports how they define funds as being climate-specific.
g Please specify.
h Cross-cutting type of support refers to funding for activities which are cross-cutting across mitigation and adaptation.
a Parties should fill in a separate table for each year, namely 2011 and 2012, where 2014 is the reporting year.
b Parties should report, to the extent possible, on details contained in this table.
c Parties should explain, in their biennial reports, the methodologies used to specify the funds as provided, committed and/or pledged. Parties will provide the information for as
many status categories as appropriate in the following order of priority: provided, committed, pledged.
Sectord
Additional informatione
Total amount
Recipient country/
region/project/programmeb
Climate-specificf
Statusc
Funding
sourceg
Financial
instrumentg
Type of
supportg, h
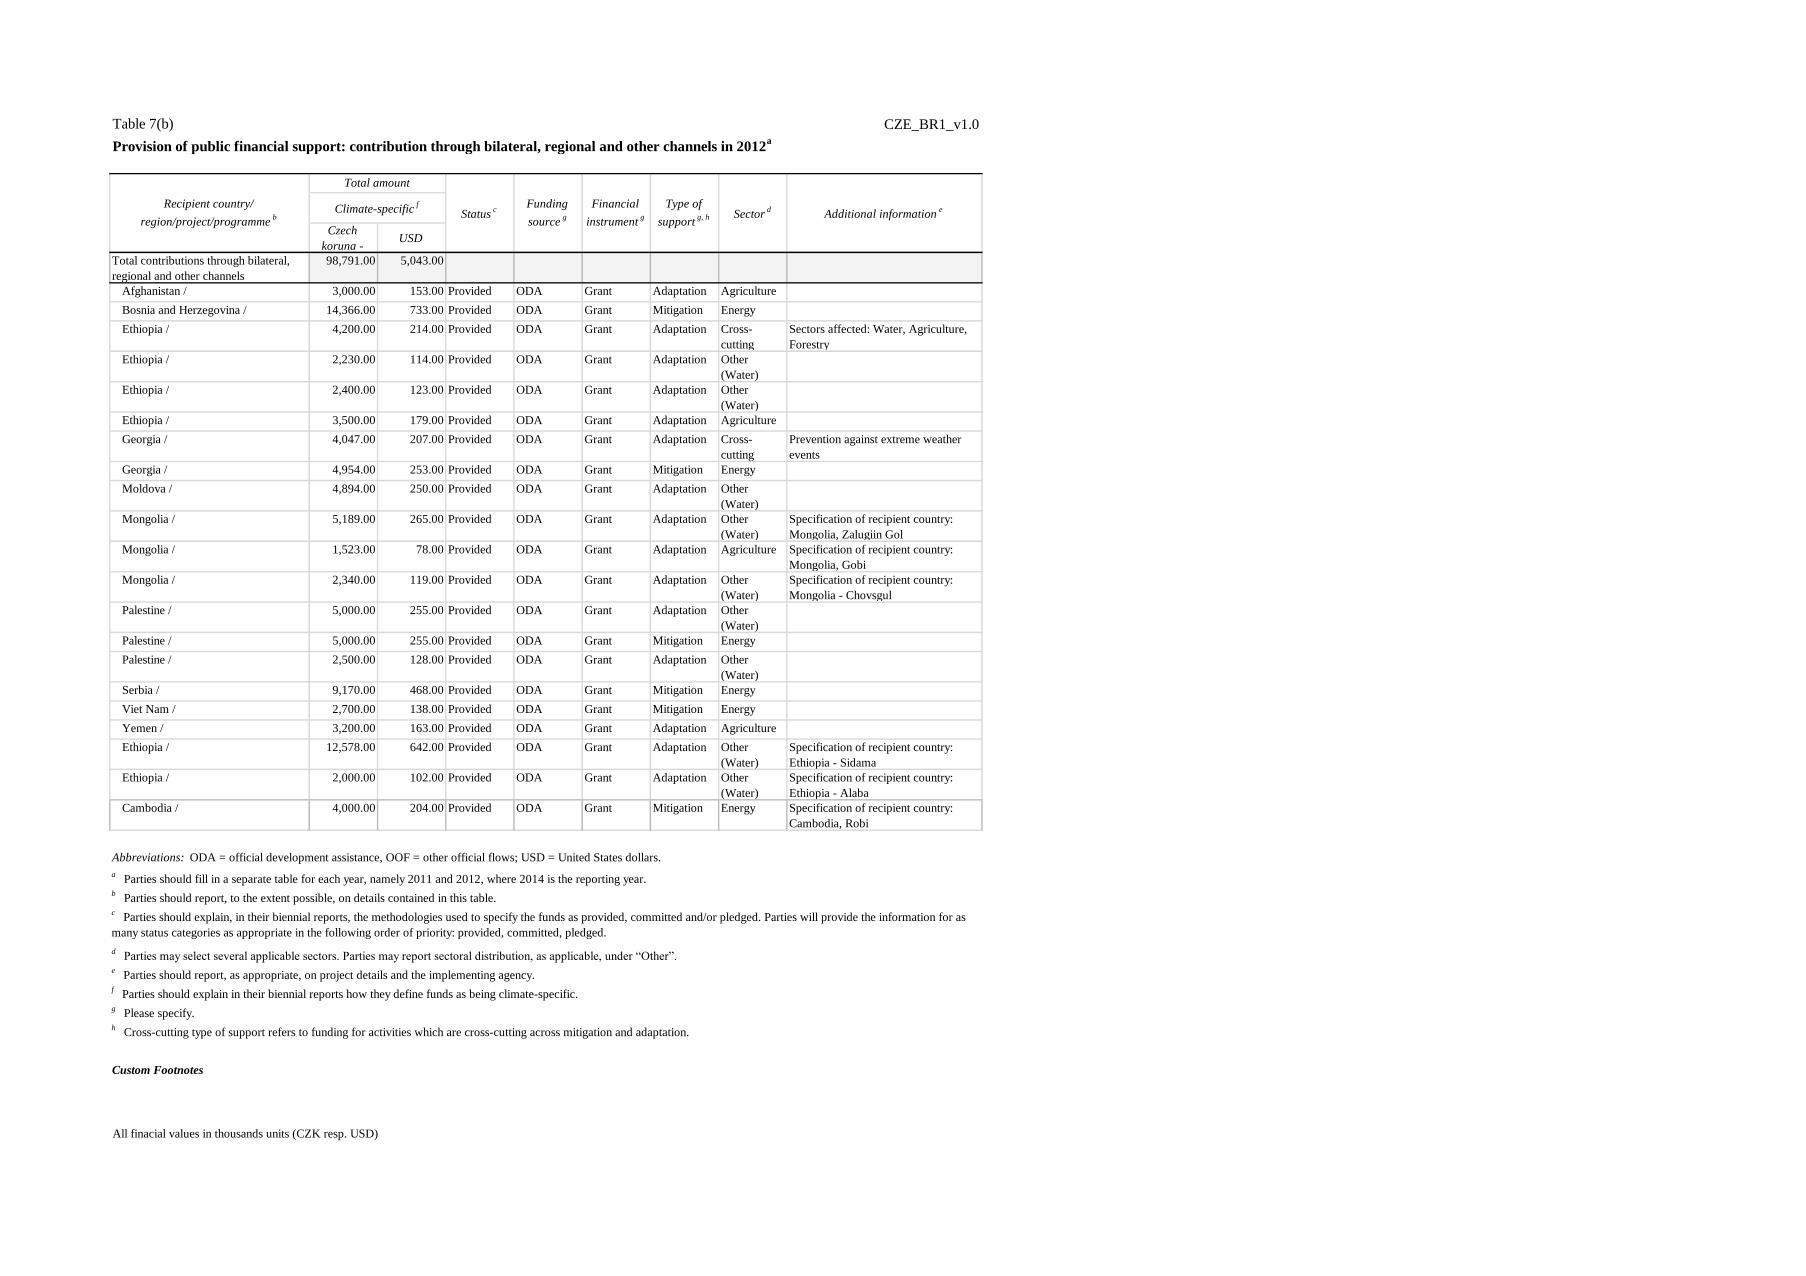
Table 7(b) CZE_BR1_v1.0
Provision of public financial support: contribution through bilateral, regional and other channels in 2012a
Czech
koruna - USD
Total contributions through bilateral,
regional and other channels
98,791.00 5,043.00
Afghanistan / 3,000.00 153.00 Provided ODA Grant Adaptation Agriculture
Bosnia and Herzegovina / 14,366.00 733.00 Provided ODA Grant Mitigation Energy
Ethiopia / 4,200.00 214.00 Provided ODA Grant Adaptation Cross-
cutting
Sectors affected: Water, Agriculture,
Forestry
Ethiopia / 2,230.00 114.00 Provided ODA Grant Adaptation Other
(Water)
Ethiopia / 2,400.00 123.00 Provided ODA Grant Adaptation Other
(Water)
Ethiopia / 3,500.00 179.00 Provided ODA Grant Adaptation Agriculture
Georgia / 4,047.00 207.00 Provided ODA Grant Adaptation Cross-
cutting
Prevention against extreme weather
events
Georgia / 4,954.00 253.00 Provided ODA Grant Mitigation Energy
Moldova / 4,894.00 250.00 Provided ODA Grant Adaptation Other
(Water)
Mongolia / 5,189.00 265.00 Provided ODA Grant Adaptation Other
(Water)
Specification of recipient country:
Mongolia, Zalugiin Gol
Mongolia / 1,523.00 78.00 Provided ODA Grant Adaptation Agriculture Specification of recipient country:
Mongolia, Gobi
Mongolia / 2,340.00 119.00 Provided ODA Grant Adaptation Other
(Water)
Specification of recipient country:
Mongolia - Chovsgul
Palestine / 5,000.00 255.00 Provided ODA Grant Adaptation Other
(Water)
Palestine / 5,000.00 255.00 Provided ODA Grant Mitigation Energy
Palestine / 2,500.00 128.00 Provided ODA Grant Adaptation Other
(Water)
Serbia / 9,170.00 468.00 Provided ODA Grant Mitigation Energy
Viet Nam / 2,700.00 138.00 Provided ODA Grant Mitigation Energy
Yemen / 3,200.00 163.00 Provided ODA Grant Adaptation Agriculture
Ethiopia / 12,578.00 642.00 Provided ODA Grant Adaptation Other
(Water)
Specification of recipient country:
Ethiopia - Sidama
Ethiopia / 2,000.00 102.00 Provided ODA Grant Adaptation Other
(Water)
Specification of recipient country:
Ethiopia - Alaba
Cambodia / 4,000.00 204.00 Provided ODA Grant Mitigation Energy Specification of recipient country:
Cambodia, Robi
Abbreviations: ODA = official development assistance, OOF = other official flows; USD = United States dollars.
Custom Footnotes
All finacial values in thousands units (CZK resp. USD)
d Parties may select several applicable sectors. Parties may report sectoral distribution, as applicable, under “Other”.
e Parties should report, as appropriate, on project details and the implementing agency.
f Parties should explain in their biennial reports how they define funds as being climate-specific.
g Please specify.
h Cross-cutting type of support refers to funding for activities which are cross-cutting across mitigation and adaptation.
c Parties should explain, in their biennial reports, the methodologies used to specify the funds as provided, committed and/or pledged. Parties will provide the information for as
many status categories as appropriate in the following order of priority: provided, committed, pledged.
Recipient country/
region/project/programmeb
Total amount
Statusc
Funding
sourceg
Financial
instrumentg
Type of
supportg, h Sector
dAdditional information
eClimate-specificf
a Parties should fill in a separate table for each year, namely 2011 and 2012, where 2014 is the reporting year.
b Parties should report, to the extent possible, on details contained in this table.

Table 8 CZE_BR1_v1.0
Provision of technology development and transfer supporta,b
Recipient country and/or region Targeted area
Measures and activities
related to technology
transfer
Sectorc Source of the funding
for technology transferActivities undertaken by Status Additional information
d
a To be reported to the extent possible.
Custom Footnotes
b The tables should include measures and activities since the last national communication or biennial report.
c Parties may report sectoral disaggregation, as appropriate.
d Additional information may include, for example, funding for technology development and transfer provided, a short description of the measure or activity and co-financing arrangements.

Table 9 CZE_BR1_v1.0
Provision of capacity-building supporta
Recipient country/region Targeted area Programme or project title Description of programme or project b,c
a To be reported to the extent possible.
c Additional information may be provided on, for example, the measure or activity and co-financing arrangements.
Custom Footnotes
b Each Party included in Annex II to the Convention shall provide information, to the extent possible, on how it has provided capacity-building support that responds
to the existing and emerging capacity-building needs identified by Parties not included in Annex I to the Convention in the areas of mitigation, adaptation and
technology development and transfer.