BR CTF submission workbook -...
66
Submission Year 2016 Party UNITED STATES OF AMERICA Submission Version v1.0 Submission Level Submitted Submission Key USA_2016_V1.0 Submission Status Closed Submitted By Andrew Rakes Workbook Created 31.12.2015 07:04:11 Submitted Date 31.12.2015 07:03:54 Table 1s1 Table 1s2 Table 1s3 Table 1(a)s1 Table 1(a)s2 Table 1(a)s3 Table 1(b)s1 Table 1(b)s2 Table 1(b)s3 Table 1(c)s1 Table 1(c)s2 Table 1(c)s3 Table 1(d)s1 Table 1(d)s2 Table 1(d)s3 Table 2(a) Table 2(b) Table 2(c) Table 2(d) Table 2(e)I Table 2(e)II Table 2(f) Table 3 Table 4 Table 4(a)I_2013 Table 4(a)I_2014 Table 4(a)II No data was imported from KP- LULUCF CRF table 10 from the latest official GHG inventory submission. Table 4(b) Table 5 Table 6(a) Table 6(b) Greenhouse gas projections: Scenario 'without measures' was not included. Table 6(c) Greenhouse gas projections: Scenario 'with additional measures' was not included. Table 7_2013 Table 7_2014 Table 7(a)_2013 Table 7(a)_2014 Table 7(b)_2013 Table 7(b)_2014 Table 8 Table 9 BR CTF submission workbook Contents
Transcript of BR CTF submission workbook -...

Submission Year 2016 Party UNITED STATES OF
AMERICA
Submission Version v1.0 Submission Level Submitted
Submission Key USA_2016_V1.0 Submission Status Closed
Submitted By Andrew Rakes Workbook Created 31.12.2015 07:04:11
Submitted Date 31.12.2015 07:03:54
Table 1s1
Table 1s2
Table 1s3
Table 1(a)s1
Table 1(a)s2
Table 1(a)s3
Table 1(b)s1
Table 1(b)s2
Table 1(b)s3
Table 1(c)s1
Table 1(c)s2
Table 1(c)s3
Table 1(d)s1
Table 1(d)s2
Table 1(d)s3
Table 2(a)
Table 2(b)
Table 2(c)
Table 2(d)
Table 2(e)I
Table 2(e)II
Table 2(f)
Table 3
Table 4
Table 4(a)I_2013
Table 4(a)I_2014
Table 4(a)II
No data was imported from KP-
LULUCF CRF table 10 from the
latest official GHG inventory
submission.
Table 4(b)
Table 5
Table 6(a)
Table 6(b)
Greenhouse gas projections:
Scenario 'without measures' was
not included.
Table 6(c)
Greenhouse gas projections:
Scenario 'with additional
measures' was not included.
Table 7_2013
Table 7_2014
Table 7(a)_2013
Table 7(a)_2014
Table 7(b)_2013
Table 7(b)_2014
Table 8
Table 9
BR CTF submission workbook
Contents

Table 1 USA_BR2_v1.0
Emission trends: summary (1) Source: Submission 2016 v1, UNITED STATES OF AMERICA
(Sheet 1 of 3) #REF!
Base yeara 1990 1991 1992 1993 1994 1995 1996 1997
kt CO 2 eq
CO2 emissions without net CO2 from LULUCF 5,115,556.75 5,115,556.75 5,065,778.93 5,171,192.96 5,285,719.19 5,378,413.80 5,442,434.79 5,630,873.10 5,705,849.90
CO2 emissions with net CO2 from LULUCF 4,347,860.00 4,347,860.00 4,305,484.00 4,421,097.13 4,557,490.11 4,598,190.46 4,695,651.67 4,871,889.14 5,001,017.83
CH4 emissions without CH4 from LULUCF 742,961.83 742,961.83 746,757.40 750,132.28 741,771.56 752,216.39 746,704.05 740,741.22 729,501.24
CH4 emissions with CH4 from LULUCF 745,492.94 745,492.94 748,959.95 753,471.64 743,816.64 758,480.74 750,170.93 750,778.45 731,404.04
N2O emissions without N2O from LULUCF 326,786.96 326,786.96 351,954.51 341,734.82 363,298.59 346,575.22 367,179.27 385,125.69 373,204.85
N2O emissions with N2O from LULUCF 329,899.45 329,899.45 354,880.61 345,569.90 366,548.72 352,811.19 371,463.89 393,900.32 376,659.73
HFCs 46,582.02 46,582.02 42,185.31 48,002.08 49,055.29 55,945.40 77,079.24 88,625.81 100,710.55
PFCs 24,255.67 24,255.67 20,912.46 19,481.09 19,484.62 17,964.99 18,640.43 19,867.14 18,266.15
Unspecified mix of HFCs and PFCs NA NA NA NA NA NA NA NA NA
SF6 31,080.41 31,080.41 29,764.56 29,949.82 29,432.65 28,004.25 26,638.17 25,919.91 24,168.02
NF3 47.92 47.92 47.92 47.92 59.90 65.89 83.24 92.43 97.68
Total (without LULUCF) 6,287,271.56 6,287,271.56 6,257,401.10 6,360,540.97 6,488,821.80 6,579,185.94 6,678,759.18 6,891,245.30 6,951,798.39
Total (with LULUCF) 5,525,218.40 5,525,218.40 5,502,234.82 5,617,619.58 5,765,887.94 5,811,462.92 5,939,727.57 6,151,073.20 6,252,324.00
Total (without LULUCF, with indirect) 6,287,271.56 6,287,271.56 6,257,401.10 6,360,540.97 6,488,821.80 6,579,185.94 6,678,759.18 6,891,245.30 6,951,798.39
Total (with LULUCF, with indirect) 5,525,218.40 5,525,218.40 5,502,234.82 5,617,619.58 5,765,887.94 5,811,462.92 5,939,727.57 6,151,073.20 6,252,324.00
Base yeara 1990 1991 1992 1993 1994 1995 1996 1997
kt CO 2 eq
1. Energy 5,290,461.89 5,290,461.89 5,251,304.17 5,353,798.89 5,459,865.41 5,549,913.59 5,602,464.04 5,790,405.83 5,860,475.38
2. Industrial processes and product use 342,119.85 342,119.85 322,927.02 328,702.37 329,259.41 341,240.44 373,336.45 388,903.16 393,539.25
3. Agriculture 448,703.83 448,703.83 474,207.27 466,984.86 487,583.92 475,609.86 495,662.85 509,039.00 502,240.76
4. Land Use, Land-Use Change and Forestryb -762,053.16 -762,053.16 -755,166.28 -742,921.39 -722,933.86 -767,723.03 -739,031.62 -740,172.09 -699,474.39
5. Waste 205,985.98 205,985.98 208,962.64 211,054.86 212,113.05 212,422.05 207,295.84 202,897.31 195,543.00
6. Other NA NA NA NA NA NA NA NA NA
Total (including LULUCF) 5,525,218.40 5,525,218.40 5,502,234.82 5,617,619.58 5,765,887.94 5,811,462.92 5,939,727.57 6,151,073.20 6,252,324.00
Note: All footnotes for this table are given on sheet 3.
GREENHOUSE GAS EMISSIONS
1 The common tabular format will be revised, in accordance with relevant decisions of the Conference of the Parties and, where
applicable, with decisions of the Conference of the Parties serving as the meeting of the Parties to the Kyoto Protocol."
GREENHOUSE GAS SOURCE AND SINK CATEGORIES
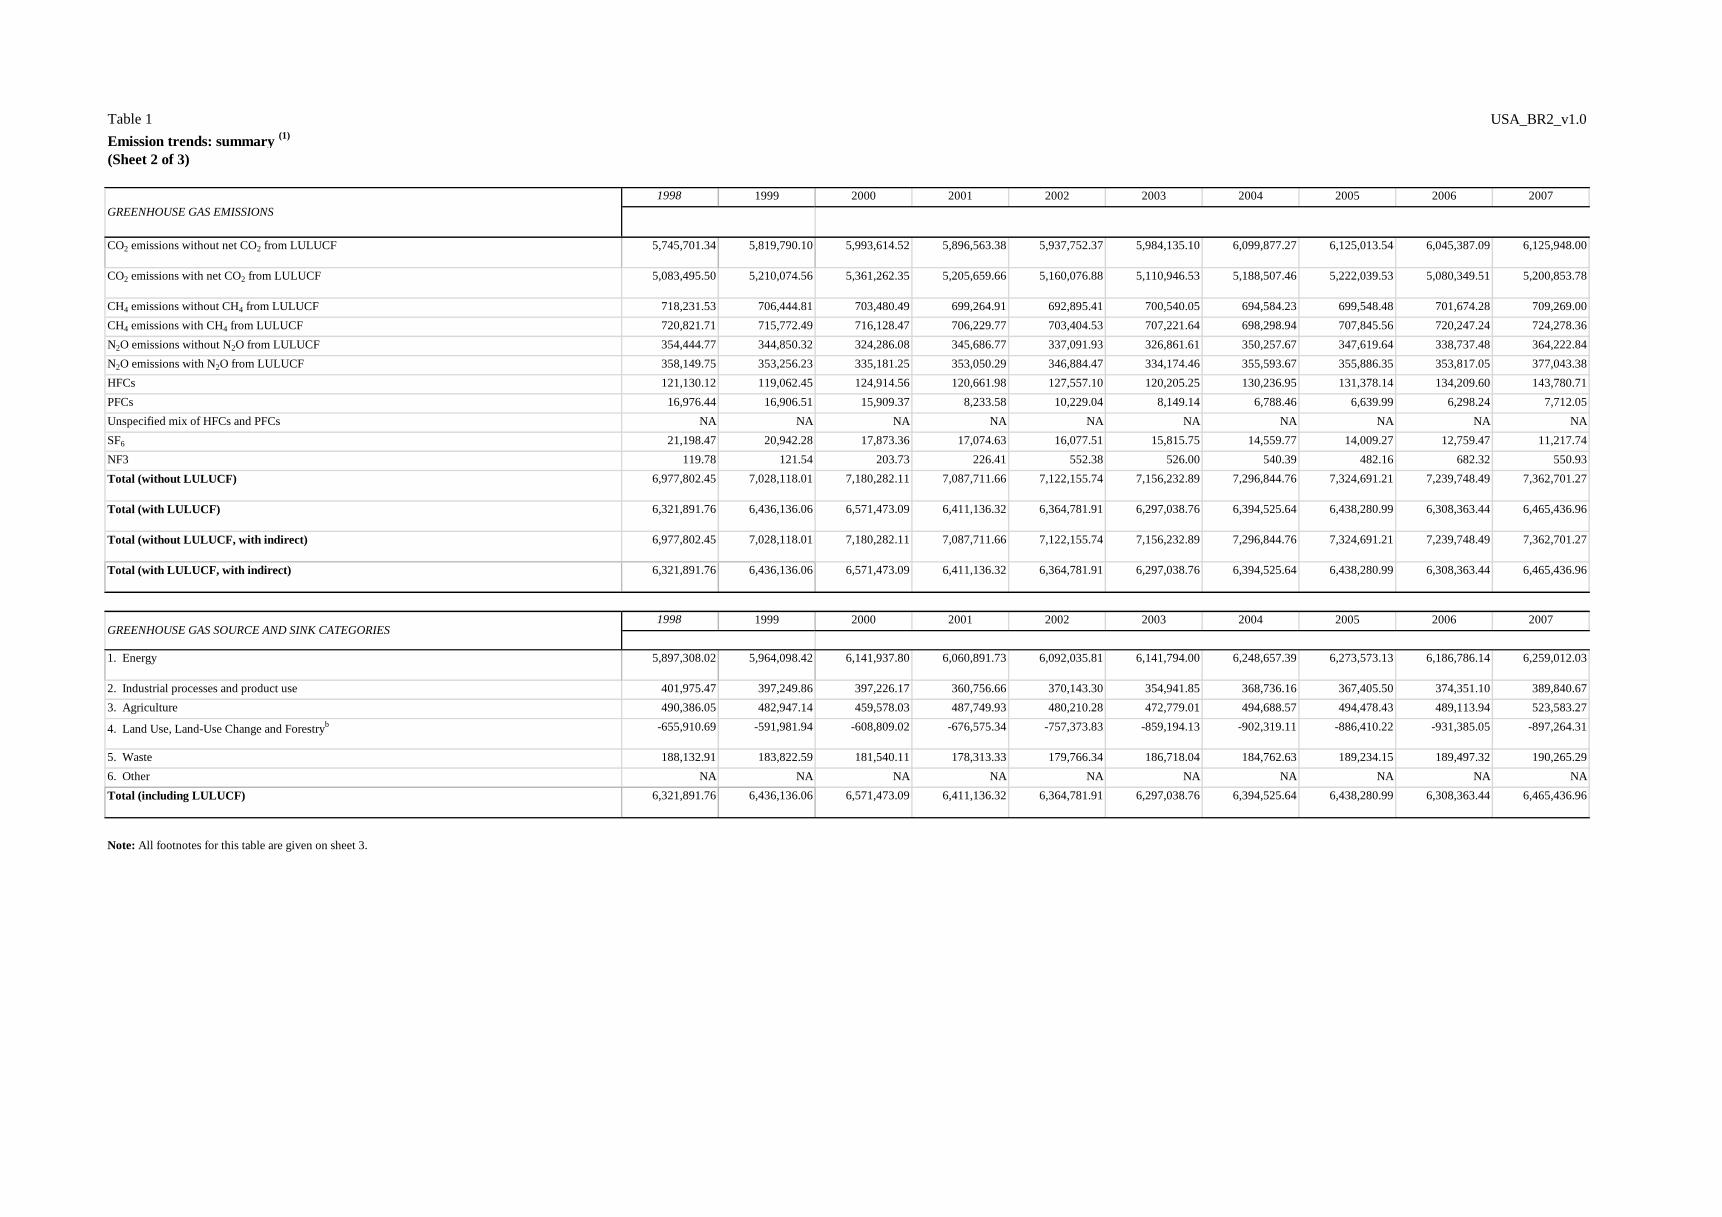
Table 1 USA_BR2_v1.0
Emission trends: summary (1) Source: Submission 2016 v1, UNITED STATES OF AMERICA
(Sheet 2 of 3) #REF!
1998 1999 2000 2001 2002 2003 2004 2005 2006 2007
CO2 emissions without net CO2 from LULUCF 5,745,701.34 5,819,790.10 5,993,614.52 5,896,563.38 5,937,752.37 5,984,135.10 6,099,877.27 6,125,013.54 6,045,387.09 6,125,948.00
CO2 emissions with net CO2 from LULUCF 5,083,495.50 5,210,074.56 5,361,262.35 5,205,659.66 5,160,076.88 5,110,946.53 5,188,507.46 5,222,039.53 5,080,349.51 5,200,853.78
CH4 emissions without CH4 from LULUCF 718,231.53 706,444.81 703,480.49 699,264.91 692,895.41 700,540.05 694,584.23 699,548.48 701,674.28 709,269.00
CH4 emissions with CH4 from LULUCF 720,821.71 715,772.49 716,128.47 706,229.77 703,404.53 707,221.64 698,298.94 707,845.56 720,247.24 724,278.36
N2O emissions without N2O from LULUCF 354,444.77 344,850.32 324,286.08 345,686.77 337,091.93 326,861.61 350,257.67 347,619.64 338,737.48 364,222.84
N2O emissions with N2O from LULUCF 358,149.75 353,256.23 335,181.25 353,050.29 346,884.47 334,174.46 355,593.67 355,886.35 353,817.05 377,043.38
HFCs 121,130.12 119,062.45 124,914.56 120,661.98 127,557.10 120,205.25 130,236.95 131,378.14 134,209.60 143,780.71
PFCs 16,976.44 16,906.51 15,909.37 8,233.58 10,229.04 8,149.14 6,788.46 6,639.99 6,298.24 7,712.05
Unspecified mix of HFCs and PFCs NA NA NA NA NA NA NA NA NA NA
SF6 21,198.47 20,942.28 17,873.36 17,074.63 16,077.51 15,815.75 14,559.77 14,009.27 12,759.47 11,217.74
NF3 119.78 121.54 203.73 226.41 552.38 526.00 540.39 482.16 682.32 550.93
Total (without LULUCF) 6,977,802.45 7,028,118.01 7,180,282.11 7,087,711.66 7,122,155.74 7,156,232.89 7,296,844.76 7,324,691.21 7,239,748.49 7,362,701.27
Total (with LULUCF) 6,321,891.76 6,436,136.06 6,571,473.09 6,411,136.32 6,364,781.91 6,297,038.76 6,394,525.64 6,438,280.99 6,308,363.44 6,465,436.96
Total (without LULUCF, with indirect) 6,977,802.45 7,028,118.01 7,180,282.11 7,087,711.66 7,122,155.74 7,156,232.89 7,296,844.76 7,324,691.21 7,239,748.49 7,362,701.27
Total (with LULUCF, with indirect) 6,321,891.76 6,436,136.06 6,571,473.09 6,411,136.32 6,364,781.91 6,297,038.76 6,394,525.64 6,438,280.99 6,308,363.44 6,465,436.96
1998 1999 2000 2001 2002 2003 2004 2005 2006 2007
1. Energy 5,897,308.02 5,964,098.42 6,141,937.80 6,060,891.73 6,092,035.81 6,141,794.00 6,248,657.39 6,273,573.13 6,186,786.14 6,259,012.03
2. Industrial processes and product use 401,975.47 397,249.86 397,226.17 360,756.66 370,143.30 354,941.85 368,736.16 367,405.50 374,351.10 389,840.67
3. Agriculture 490,386.05 482,947.14 459,578.03 487,749.93 480,210.28 472,779.01 494,688.57 494,478.43 489,113.94 523,583.27
4. Land Use, Land-Use Change and Forestryb -655,910.69 -591,981.94 -608,809.02 -676,575.34 -757,373.83 -859,194.13 -902,319.11 -886,410.22 -931,385.05 -897,264.31
5. Waste 188,132.91 183,822.59 181,540.11 178,313.33 179,766.34 186,718.04 184,762.63 189,234.15 189,497.32 190,265.29
6. Other NA NA NA NA NA NA NA NA NA NA
Total (including LULUCF) 6,321,891.76 6,436,136.06 6,571,473.09 6,411,136.32 6,364,781.91 6,297,038.76 6,394,525.64 6,438,280.99 6,308,363.44 6,465,436.96
Note: All footnotes for this table are given on sheet 3.
GREENHOUSE GAS EMISSIONS
GREENHOUSE GAS SOURCE AND SINK CATEGORIES

Table 1 USA_BR2_v1.0
Emission trends: summary (1) Source: Submission 2016 v1, UNITED STATES OF AMERICA
(Sheet 3 of 3) #REF!
2008 2009 2010 2011 2012 2013 Change from base
to latest reported
year
(%)
CO2 emissions without net CO2 from LULUCF 5,927,349.32 5,492,354.29 5,694,946.80 5,559,994.62 5,347,462.83 5,494,472.63 0.07
CO2 emissions with net CO2 from LULUCF 5,042,425.22 4,629,723.71 4,832,921.69 4,687,891.87 4,477,882.52 4,623,446.72 0.06
CH4 emissions without CH4 from LULUCF 718,847.17 703,649.28 662,415.02 646,329.83 631,967.14 630,477.65 -0.15
CH4 emissions with CH4 from LULUCF 727,913.21 709,489.51 667,167.41 660,929.40 647,632.62 636,312.81 -0.15
N2O emissions without N2O from LULUCF 355,539.25 349,551.43 354,101.78 359,311.48 352,301.49 348,480.46 0.07
N2O emissions with N2O from LULUCF 364,308.92 356,100.34 360,062.41 371,876.49 365,608.21 355,193.85 0.08
HFCs 145,736.68 142,937.10 152,611.21 157,372.78 159,238.61 162,950.14 2.50
PFCs 6,048.40 3,858.82 4,427.12 6,879.86 5,983.86 5,821.05 -0.76
Unspecified mix of HFCs and PFCs NA NA NA NA NA NA NA
SF6 10,305.02 9,301.94 9,489.73 10,030.87 7,719.90 6,938.46 -0.78
NF3 564.92 446.56 521.89 666.94 638.63 560.71 10.70
Total (without LULUCF) 7,164,390.75 6,702,099.41 6,878,513.55 6,740,586.36 6,505,312.45 6,649,701.10 0.06
Total (with LULUCF) 6,297,302.36 5,851,857.98 6,027,201.45 5,895,648.20 5,664,704.35 5,791,223.73 0.05
Total (without LULUCF, with indirect) 7,164,390.75 6,702,099.41 6,878,513.55 6,740,586.36 6,505,312.45 6,649,701.10 0.06
Total (with LULUCF, with indirect) 6,297,302.36 5,851,857.98 6,027,201.45 5,895,648.20 5,664,704.35 5,791,223.73 0.05
2008 2009 2010 2011 2012 2013 Change from base
to latest reported
year
(%)
1. Energy 6,082,297.35 5,682,059.71 5,854,631.00 5,702,618.30 5,482,175.58 5,636,633.61 0.07
2. Industrial processes and product use 364,328.67 314,856.27 353,588.60 370,974.85 361,181.13 359,101.75 0.05
3. Agriculture 527,885.82 523,340.18 524,807.49 522,108.39 523,017.10 515,658.18 0.15
4. Land Use, Land-Use Change and Forestryb -867,088.38 -850,241.43 -851,312.10 -844,938.16 -840,608.11 -858,477.36 0.13
5. Waste 189,878.90 181,843.25 145,486.45 144,884.82 138,938.65 138,307.55 -0.33
6. Other NA NA NA NA NA NA NA
Total (including LULUCF) 6,297,302.36 5,851,857.98 6,027,201.45 5,895,648.20 5,664,704.35 5,791,223.73 0.05
Notes :
(3) 1 kt CO2 eq equals 1 Gg CO2 eq.
Custom Footnotes
a The column “Base year” should be filled in only by those Parties with economies in transition that use a base year different from 1990 in
accordance with the relevant decisions of the Conference of the Parties. For these Parties, this different base year is used to calculate the percentage
change in the final column of this table.
b Includes net CO2, CH4 and N2O from LULUCF.
GREENHOUSE GAS EMISSIONS
(1) Further detailed information could be found in the common reporting format tables of the Party’s greenhouse gas inventory, namely “Emission
trends (CO2)”, “Emission trends (CH4)”, “Emission trends (N2O)” and “Emission trends (HFCs, PFCs and SF6)”, which is included in an annex to
this biennial report.
Abbreviation: LULUCF = land use, land-use change and forestry.
(2) 2011 is the latest reported inventory year.
GREENHOUSE GAS SOURCE AND SINK CATEGORIES
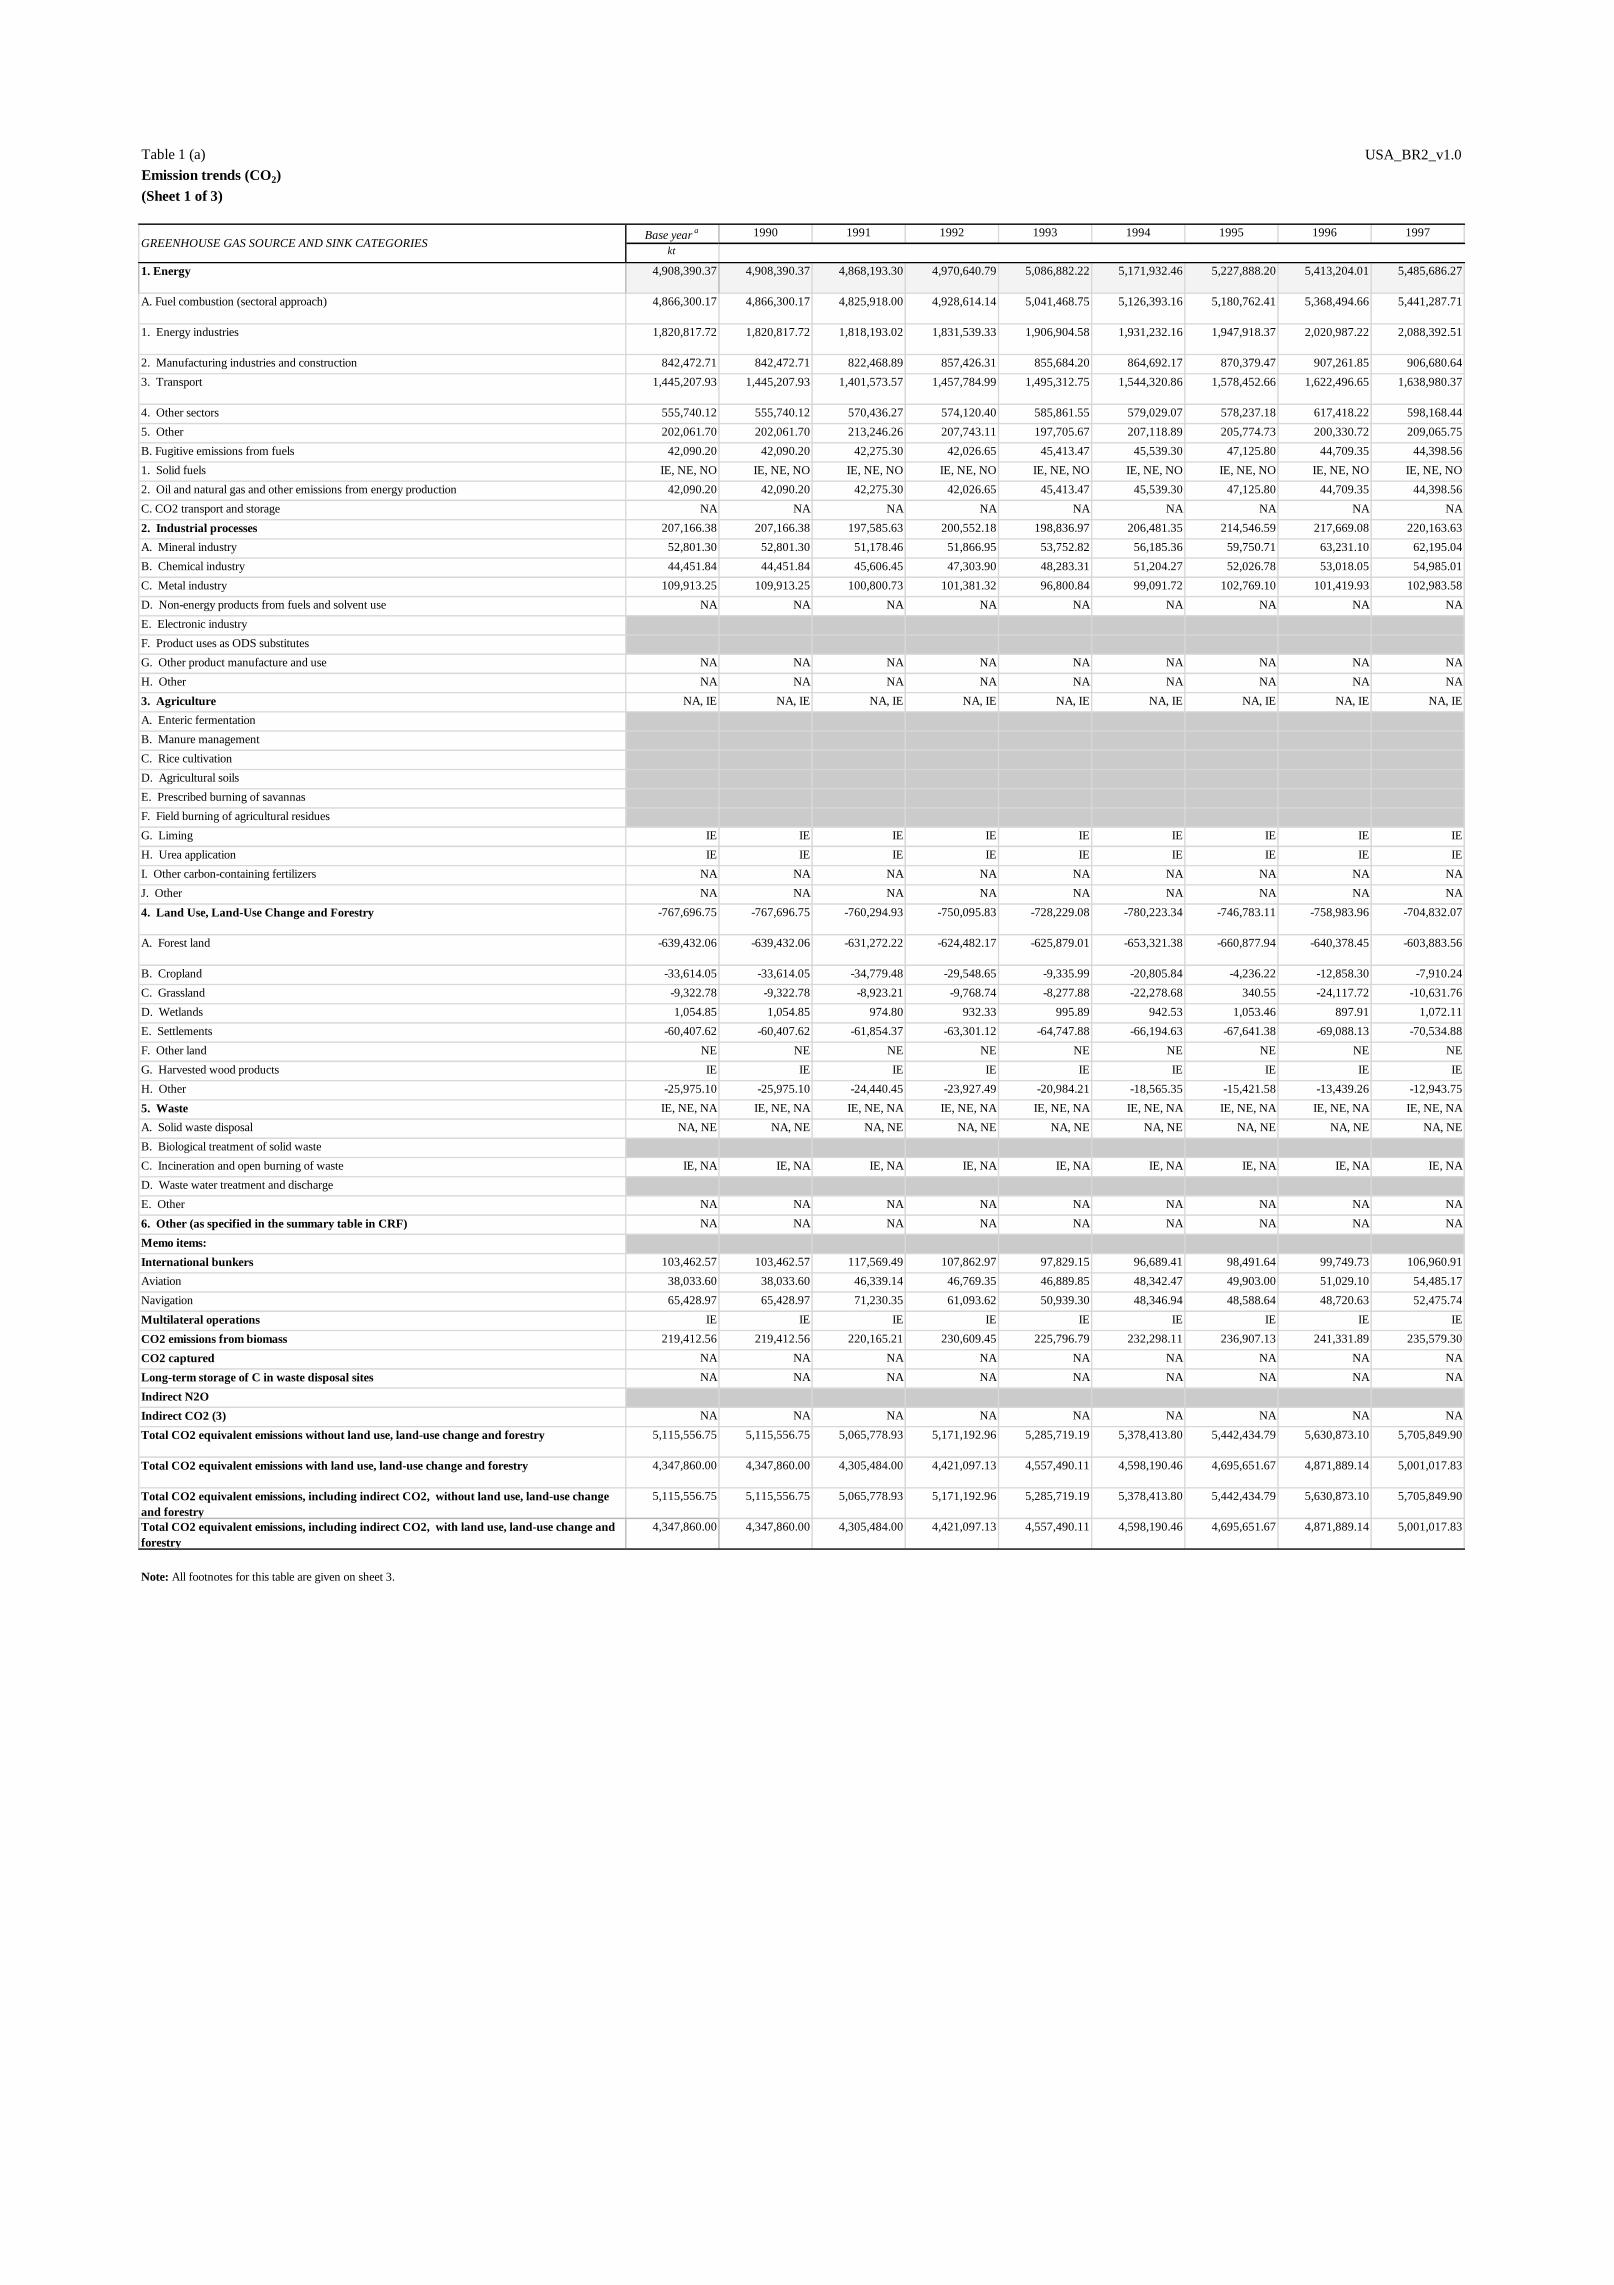
Table 1 (a) USA_BR2_v1.0
Emission trends (CO2) Source: Submission 2016 v1, UNITED STATES OF AMERICA
(Sheet 1 of 3) #REF!
Base yeara 1990 1991 1992 1993 1994 1995 1996 1997
kt
1. Energy 4,908,390.37 4,908,390.37 4,868,193.30 4,970,640.79 5,086,882.22 5,171,932.46 5,227,888.20 5,413,204.01 5,485,686.27
A. Fuel combustion (sectoral approach) 4,866,300.17 4,866,300.17 4,825,918.00 4,928,614.14 5,041,468.75 5,126,393.16 5,180,762.41 5,368,494.66 5,441,287.71
1. Energy industries 1,820,817.72 1,820,817.72 1,818,193.02 1,831,539.33 1,906,904.58 1,931,232.16 1,947,918.37 2,020,987.22 2,088,392.51
2. Manufacturing industries and construction 842,472.71 842,472.71 822,468.89 857,426.31 855,684.20 864,692.17 870,379.47 907,261.85 906,680.64
3. Transport 1,445,207.93 1,445,207.93 1,401,573.57 1,457,784.99 1,495,312.75 1,544,320.86 1,578,452.66 1,622,496.65 1,638,980.37
4. Other sectors 555,740.12 555,740.12 570,436.27 574,120.40 585,861.55 579,029.07 578,237.18 617,418.22 598,168.44
5. Other 202,061.70 202,061.70 213,246.26 207,743.11 197,705.67 207,118.89 205,774.73 200,330.72 209,065.75
B. Fugitive emissions from fuels 42,090.20 42,090.20 42,275.30 42,026.65 45,413.47 45,539.30 47,125.80 44,709.35 44,398.56
1. Solid fuels IE, NE, NO IE, NE, NO IE, NE, NO IE, NE, NO IE, NE, NO IE, NE, NO IE, NE, NO IE, NE, NO IE, NE, NO
2. Oil and natural gas and other emissions from energy production 42,090.20 42,090.20 42,275.30 42,026.65 45,413.47 45,539.30 47,125.80 44,709.35 44,398.56
C. CO2 transport and storage NA NA NA NA NA NA NA NA NA
2. Industrial processes 207,166.38 207,166.38 197,585.63 200,552.18 198,836.97 206,481.35 214,546.59 217,669.08 220,163.63
A. Mineral industry 52,801.30 52,801.30 51,178.46 51,866.95 53,752.82 56,185.36 59,750.71 63,231.10 62,195.04
B. Chemical industry 44,451.84 44,451.84 45,606.45 47,303.90 48,283.31 51,204.27 52,026.78 53,018.05 54,985.01
C. Metal industry 109,913.25 109,913.25 100,800.73 101,381.32 96,800.84 99,091.72 102,769.10 101,419.93 102,983.58
D. Non-energy products from fuels and solvent use NA NA NA NA NA NA NA NA NA
E. Electronic industry
F. Product uses as ODS substitutes
G. Other product manufacture and use NA NA NA NA NA NA NA NA NA
H. Other NA NA NA NA NA NA NA NA NA
3. Agriculture NA, IE NA, IE NA, IE NA, IE NA, IE NA, IE NA, IE NA, IE NA, IE
A. Enteric fermentation
B. Manure management
C. Rice cultivation
D. Agricultural soils
E. Prescribed burning of savannas
F. Field burning of agricultural residues
G. Liming IE IE IE IE IE IE IE IE IE
H. Urea application IE IE IE IE IE IE IE IE IE
I. Other carbon-containing fertilizers NA NA NA NA NA NA NA NA NA
J. Other NA NA NA NA NA NA NA NA NA
4. Land Use, Land-Use Change and Forestry -767,696.75 -767,696.75 -760,294.93 -750,095.83 -728,229.08 -780,223.34 -746,783.11 -758,983.96 -704,832.07
A. Forest land -639,432.06 -639,432.06 -631,272.22 -624,482.17 -625,879.01 -653,321.38 -660,877.94 -640,378.45 -603,883.56
B. Cropland -33,614.05 -33,614.05 -34,779.48 -29,548.65 -9,335.99 -20,805.84 -4,236.22 -12,858.30 -7,910.24
C. Grassland -9,322.78 -9,322.78 -8,923.21 -9,768.74 -8,277.88 -22,278.68 340.55 -24,117.72 -10,631.76
D. Wetlands 1,054.85 1,054.85 974.80 932.33 995.89 942.53 1,053.46 897.91 1,072.11
E. Settlements -60,407.62 -60,407.62 -61,854.37 -63,301.12 -64,747.88 -66,194.63 -67,641.38 -69,088.13 -70,534.88
F. Other land NE NE NE NE NE NE NE NE NE
G. Harvested wood products IE IE IE IE IE IE IE IE IE
H. Other -25,975.10 -25,975.10 -24,440.45 -23,927.49 -20,984.21 -18,565.35 -15,421.58 -13,439.26 -12,943.75
5. Waste IE, NE, NA IE, NE, NA IE, NE, NA IE, NE, NA IE, NE, NA IE, NE, NA IE, NE, NA IE, NE, NA IE, NE, NA
A. Solid waste disposal NA, NE NA, NE NA, NE NA, NE NA, NE NA, NE NA, NE NA, NE NA, NE
B. Biological treatment of solid waste
C. Incineration and open burning of waste IE, NA IE, NA IE, NA IE, NA IE, NA IE, NA IE, NA IE, NA IE, NA
D. Waste water treatment and discharge
E. Other NA NA NA NA NA NA NA NA NA
6. Other (as specified in the summary table in CRF) NA NA NA NA NA NA NA NA NA
Memo items:
International bunkers 103,462.57 103,462.57 117,569.49 107,862.97 97,829.15 96,689.41 98,491.64 99,749.73 106,960.91
Aviation 38,033.60 38,033.60 46,339.14 46,769.35 46,889.85 48,342.47 49,903.00 51,029.10 54,485.17
Navigation 65,428.97 65,428.97 71,230.35 61,093.62 50,939.30 48,346.94 48,588.64 48,720.63 52,475.74
Multilateral operations IE IE IE IE IE IE IE IE IE
CO2 emissions from biomass 219,412.56 219,412.56 220,165.21 230,609.45 225,796.79 232,298.11 236,907.13 241,331.89 235,579.30
CO2 captured NA NA NA NA NA NA NA NA NA
Long-term storage of C in waste disposal sites NA NA NA NA NA NA NA NA NA
Indirect N2O
Indirect CO2 (3) NA NA NA NA NA NA NA NA NA
Total CO2 equivalent emissions without land use, land-use change and forestry 5,115,556.75 5,115,556.75 5,065,778.93 5,171,192.96 5,285,719.19 5,378,413.80 5,442,434.79 5,630,873.10 5,705,849.90
Total CO2 equivalent emissions with land use, land-use change and forestry 4,347,860.00 4,347,860.00 4,305,484.00 4,421,097.13 4,557,490.11 4,598,190.46 4,695,651.67 4,871,889.14 5,001,017.83
Total CO2 equivalent emissions, including indirect CO2, without land use, land-use change
and forestry
5,115,556.75 5,115,556.75 5,065,778.93 5,171,192.96 5,285,719.19 5,378,413.80 5,442,434.79 5,630,873.10 5,705,849.90
Total CO2 equivalent emissions, including indirect CO2, with land use, land-use change and
forestry
4,347,860.00 4,347,860.00 4,305,484.00 4,421,097.13 4,557,490.11 4,598,190.46 4,695,651.67 4,871,889.14 5,001,017.83
Note: All footnotes for this table are given on sheet 3.
GREENHOUSE GAS SOURCE AND SINK CATEGORIES

Table 1 (a) USA_BR2_v1.0
Emission trends (CO2) Source: Submission 2016 v1, UNITED STATES OF AMERICA
(Sheet 2 of 3) #REF!
1998 1999 2000 2001 2002 2003 2004 2005 2006 2007
1. Energy 5,528,723.36 5,604,134.50 5,780,064.15 5,703,307.12 5,744,169.69 5,795,857.49 5,903,440.02 5,933,912.08 5,849,941.31 5,928,139.86
A. Fuel combustion (sectoral approach) 5,494,247.58 5,568,666.17 5,745,381.74 5,669,155.79 5,709,296.07 5,762,044.45 5,869,838.47 5,899,013.01 5,814,960.90 5,892,359.83
1. Energy industries 2,177,378.35 2,190,513.42 2,296,877.13 2,257,912.89 2,272,671.30 2,304,157.90 2,335,886.27 2,400,873.67 2,345,280.93 2,411,896.46
2. Manufacturing industries and construction 868,874.62 845,734.15 853,897.35 842,568.87 829,422.71 829,237.67 852,134.42 827,807.89 852,378.32 847,720.62
3. Transport 1,674,911.98 1,730,807.75 1,776,166.88 1,760,466.45 1,802,867.21 1,792,518.39 1,836,471.98 1,860,232.36 1,860,336.94 1,864,328.27
4. Other sectors 546,980.35 569,131.78 601,489.32 586,921.69 584,758.82 613,863.77 601,653.96 581,279.60 529,853.58 560,047.05
5. Other 226,102.28 232,479.06 216,951.05 221,285.89 219,576.02 222,266.73 243,691.83 228,819.51 227,111.13 208,367.42
B. Fugitive emissions from fuels 34,475.78 35,468.33 34,682.41 34,151.33 34,873.62 33,813.03 33,601.55 34,899.07 34,980.41 35,780.03
1. Solid fuels IE, NE, NO IE, NE, NO IE, NE, NO IE, NE, NO IE, NE, NO IE, NE, NO IE, NE, NO IE, NE, NO IE, NE, NO IE, NE, NO
2. Oil and natural gas and other emissions from energy production 34,475.78 35,468.33 34,682.41 34,151.33 34,873.62 33,813.03 33,601.55 34,899.07 34,980.41 35,780.03
C. CO2 transport and storage NA NA NA NA NA NA NA NA NA NA
2. Industrial processes 216,977.98 215,655.60 213,550.37 193,256.26 193,582.68 188,277.61 196,437.25 191,101.46 195,445.78 197,808.14
A. Mineral industry 63,629.06 64,651.02 63,157.15 62,489.03 64,289.18 63,657.10 68,750.21 70,025.19 72,406.75 70,103.81
B. Chemical industry 56,506.36 56,179.80 54,504.72 47,588.67 49,778.42 47,975.82 51,805.44 47,290.07 46,723.38 49,035.34
C. Metal industry 96,842.56 94,824.78 95,888.50 83,178.56 79,515.08 76,644.70 75,881.60 73,786.20 76,315.65 78,668.98
D. Non-energy products from fuels and solvent use NA NA NA NA NA NA NA NA NA NA
E. Electronic industry
F. Product uses as ODS substitutes
G. Other product manufacture and use NA NA NA NA NA NA NA NA NA NA
H. Other NA NA NA NA NA NA NA NA NA NA
3. Agriculture NA, IE NA, IE NA, IE NA, IE NA, IE NA, IE NA, IE NA, IE NA, IE NA, IE
A. Enteric fermentation
B. Manure management
C. Rice cultivation
D. Agricultural soils
E. Prescribed burning of savannas
F. Field burning of agricultural residues
G. Liming IE IE IE IE IE IE IE IE IE IE
H. Urea application IE IE IE IE IE IE IE IE IE IE
I. Other carbon-containing fertilizers NA NA NA NA NA NA NA NA NA NA
J. Other NA NA NA NA NA NA NA NA NA NA
4. Land Use, Land-Use Change and Forestry -662,205.84 -609,715.53 -632,352.17 -690,903.72 -777,675.49 -873,188.57 -911,369.82 -902,974.01 -965,037.58 -925,094.22
A. Forest land -562,988.29 -509,472.61 -489,364.56 -573,589.25 -673,690.11 -774,554.36 -815,329.71 -807,074.71 -841,792.36 -830,262.25
B. Cropland -1,127.33 -7,531.15 -15,542.16 -7,659.76 7,375.00 9,820.58 9.77 -351.30 -3,889.49 -5,668.99
C. Grassland -15,526.20 -8,351.64 -40,512.89 -21,467.36 -21,708.85 -19,438.79 -6,589.97 -4,765.70 -27,265.07 3,227.72
D. Wetlands 1,123.37 1,197.18 1,271.25 1,179.30 1,034.16 1,014.44 1,150.85 1,101.26 889.53 1,028.67
E. Settlements -71,981.64 -73,428.39 -74,917.52 -76,038.69 -77,159.85 -78,281.02 -79,402.19 -80,523.36 -81,644.52 -82,765.69
F. Other land NE NE NE NE NE NE NE NE NE NE
G. Harvested wood products IE IE IE IE IE IE IE IE IE IE
H. Other -11,705.75 -12,128.92 -13,286.29 -13,327.96 -13,525.83 -11,749.42 -11,208.57 -11,360.20 -11,335.68 -10,653.66
5. Waste IE, NE, NA IE, NE, NA IE, NE, NA IE, NE, NA IE, NE, NA IE, NE, NA IE, NE, NA IE, NE, NA IE, NE, NA IE, NE, NA
A. Solid waste disposal NA, NE NA, NE NA, NE NA, NE NA, NE NA, NE NA, NE NA, NE NA, NE NA, NE
B. Biological treatment of solid waste
C. Incineration and open burning of waste IE, NA IE, NA IE, NA IE, NA IE, NA IE, NA IE, NA IE, NA IE, NA IE, NA
D. Waste water treatment and discharge
E. Other NA NA NA NA NA NA NA NA NA NA
6. Other (as specified in the summary table in CRF) NA NA NA NA NA NA NA NA NA NA
Memo items:
International bunkers 110,490.71 102,733.04 101,726.18 93,731.32 94,442.98 98,309.91 108,391.00 113,139.25 114,115.98 115,345.34
Aviation 54,080.46 57,557.15 62,029.31 56,384.52 54,626.24 55,196.36 56,239.23 60,125.45 60,283.69 61,489.49
Navigation 56,410.25 45,175.90 39,696.86 37,346.80 39,816.74 43,113.55 52,151.77 53,013.80 53,832.30 53,855.85
Multilateral operations IE IE IE IE IE IE IE IE IE IE
CO2 emissions from biomass 218,235.65 221,492.50 227,434.90 203,330.57 204,549.27 209,807.98 225,166.23 229,843.78 233,840.11 241,241.39
CO2 captured NA NA NA NA NA NA NA NA NA NA
Long-term storage of C in waste disposal sites NA NA NA NA NA NA NA NA NA NA
Indirect N2O
Indirect CO2 (3) NA NA NA NA NA NA NA NA NA NA
Total CO2 equivalent emissions without land use, land-use change and forestry 5,745,701.34 5,819,790.10 5,993,614.52 5,896,563.38 5,937,752.37 5,984,135.10 6,099,877.27 6,125,013.54 6,045,387.09 6,125,948.00
Total CO2 equivalent emissions with land use, land-use change and forestry 5,083,495.50 5,210,074.56 5,361,262.35 5,205,659.66 5,160,076.88 5,110,946.53 5,188,507.46 5,222,039.53 5,080,349.51 5,200,853.78
Total CO2 equivalent emissions, including indirect CO2, without land use, land-use change
and forestry
5,745,701.34 5,819,790.10 5,993,614.52 5,896,563.38 5,937,752.37 5,984,135.10 6,099,877.27 6,125,013.54 6,045,387.09 6,125,948.00
Total CO2 equivalent emissions, including indirect CO2, with land use, land-use change and
forestry
5,083,495.50 5,210,074.56 5,361,262.35 5,205,659.66 5,160,076.88 5,110,946.53 5,188,507.46 5,222,039.53 5,080,349.51 5,200,853.78
Note: All footnotes for this table are given on sheet 3.
GREENHOUSE GAS SOURCE AND SINK CATEGORIES
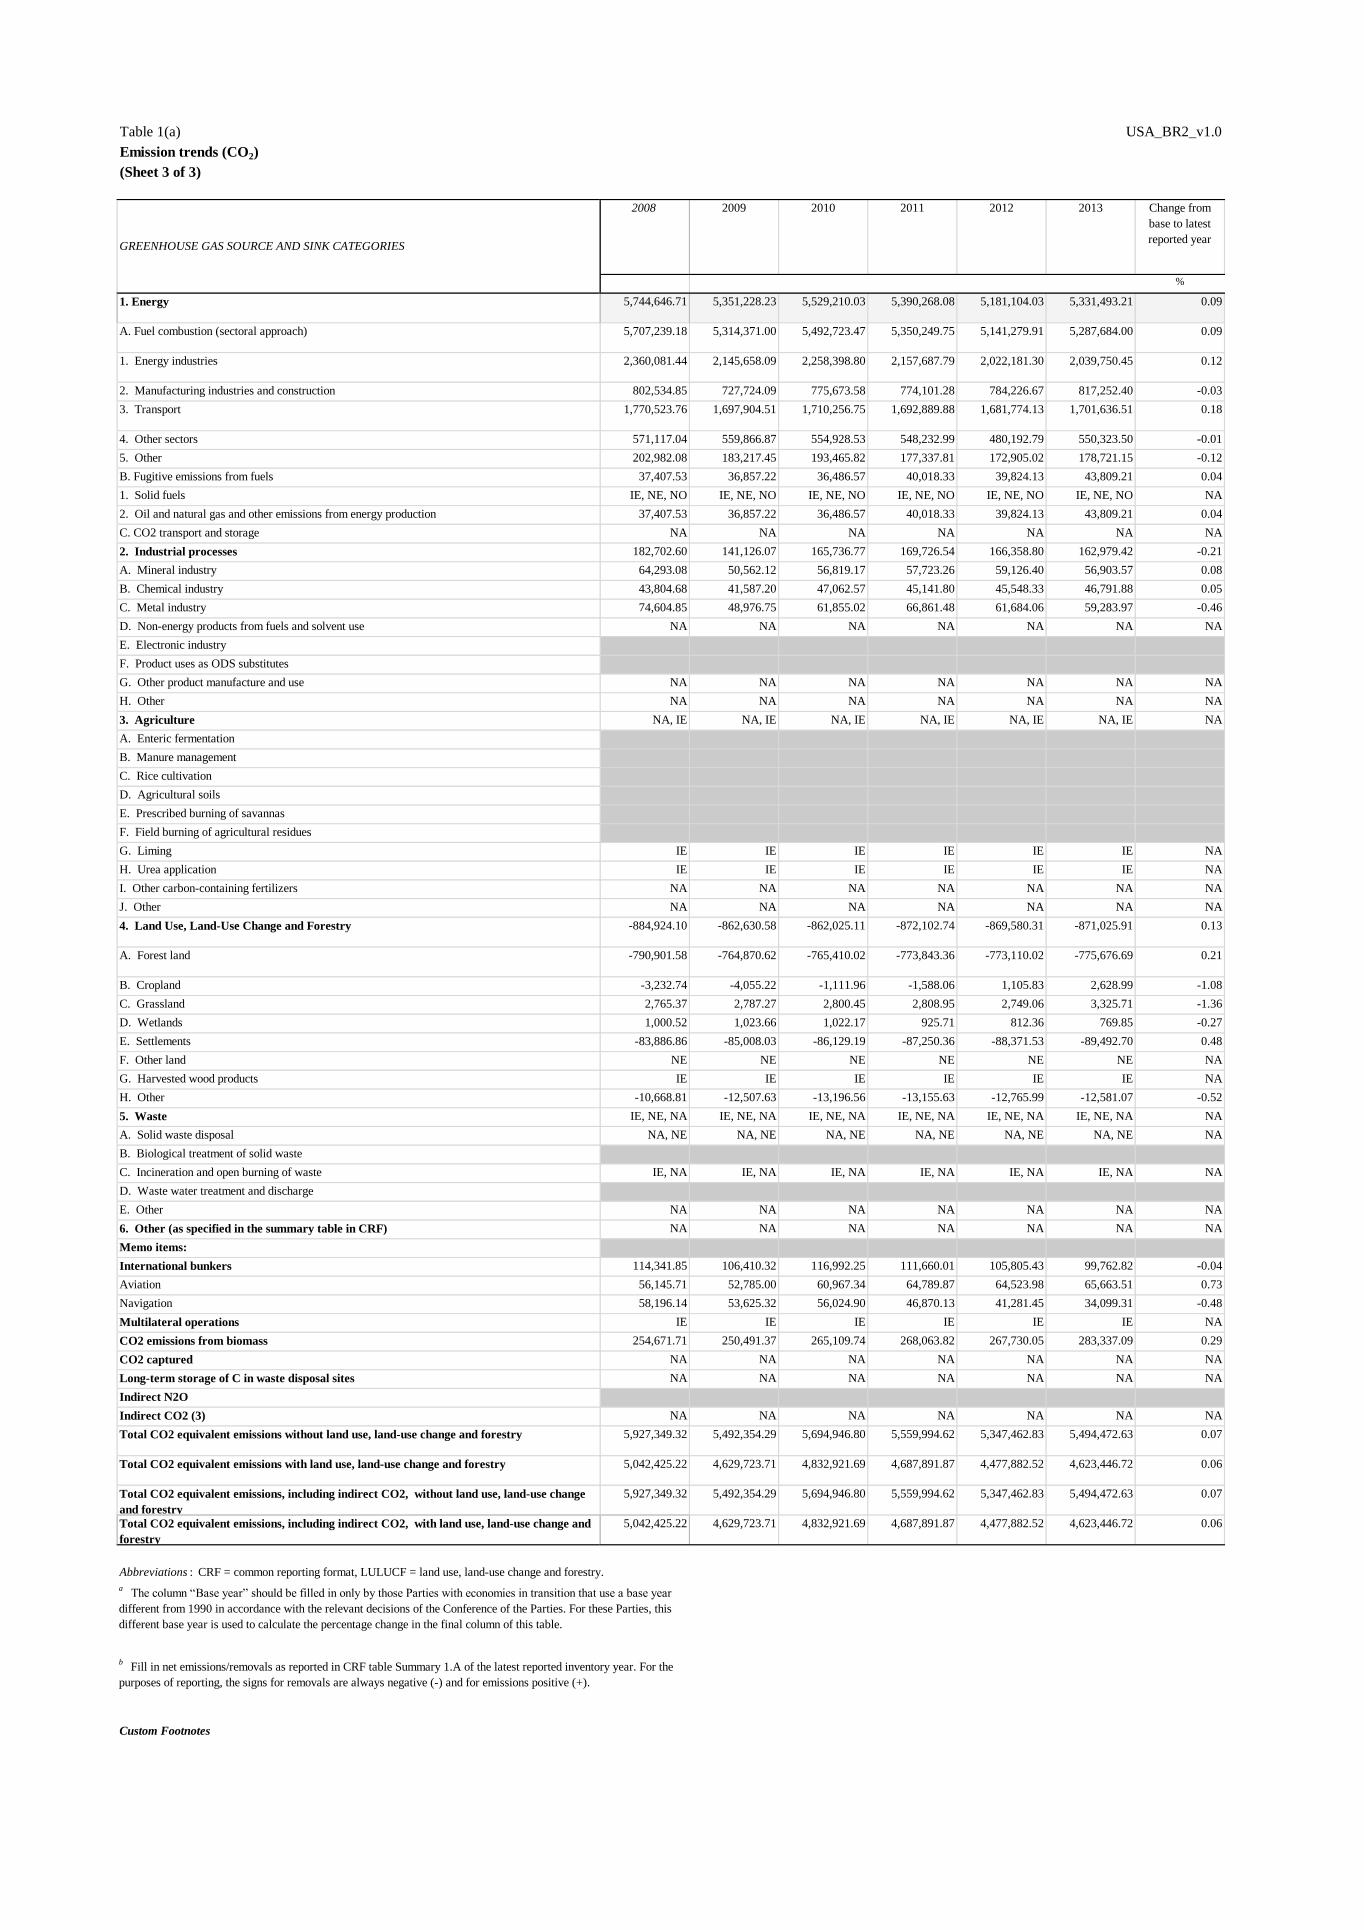
Table 1(a) USA_BR2_v1.0
Emission trends (CO2) Source: Submission 2016 v1, UNITED STATES OF AMERICA
(Sheet 3 of 3) #REF!
2008 2009 2010 2011 2012 2013 Change from
base to latest
reported year
%
1. Energy 5,744,646.71 5,351,228.23 5,529,210.03 5,390,268.08 5,181,104.03 5,331,493.21 0.09
A. Fuel combustion (sectoral approach) 5,707,239.18 5,314,371.00 5,492,723.47 5,350,249.75 5,141,279.91 5,287,684.00 0.09
1. Energy industries 2,360,081.44 2,145,658.09 2,258,398.80 2,157,687.79 2,022,181.30 2,039,750.45 0.12
2. Manufacturing industries and construction 802,534.85 727,724.09 775,673.58 774,101.28 784,226.67 817,252.40 -0.03
3. Transport 1,770,523.76 1,697,904.51 1,710,256.75 1,692,889.88 1,681,774.13 1,701,636.51 0.18
4. Other sectors 571,117.04 559,866.87 554,928.53 548,232.99 480,192.79 550,323.50 -0.01
5. Other 202,982.08 183,217.45 193,465.82 177,337.81 172,905.02 178,721.15 -0.12
B. Fugitive emissions from fuels 37,407.53 36,857.22 36,486.57 40,018.33 39,824.13 43,809.21 0.04
1. Solid fuels IE, NE, NO IE, NE, NO IE, NE, NO IE, NE, NO IE, NE, NO IE, NE, NO NA
2. Oil and natural gas and other emissions from energy production 37,407.53 36,857.22 36,486.57 40,018.33 39,824.13 43,809.21 0.04
C. CO2 transport and storage NA NA NA NA NA NA NA
2. Industrial processes 182,702.60 141,126.07 165,736.77 169,726.54 166,358.80 162,979.42 -0.21
A. Mineral industry 64,293.08 50,562.12 56,819.17 57,723.26 59,126.40 56,903.57 0.08
B. Chemical industry 43,804.68 41,587.20 47,062.57 45,141.80 45,548.33 46,791.88 0.05
C. Metal industry 74,604.85 48,976.75 61,855.02 66,861.48 61,684.06 59,283.97 -0.46
D. Non-energy products from fuels and solvent use NA NA NA NA NA NA NA
E. Electronic industry
F. Product uses as ODS substitutes
G. Other product manufacture and use NA NA NA NA NA NA NA
H. Other NA NA NA NA NA NA NA
3. Agriculture NA, IE NA, IE NA, IE NA, IE NA, IE NA, IE NA
A. Enteric fermentation
B. Manure management
C. Rice cultivation
D. Agricultural soils
E. Prescribed burning of savannas
F. Field burning of agricultural residues
G. Liming IE IE IE IE IE IE NA
H. Urea application IE IE IE IE IE IE NA
I. Other carbon-containing fertilizers NA NA NA NA NA NA NA
J. Other NA NA NA NA NA NA NA
4. Land Use, Land-Use Change and Forestry -884,924.10 -862,630.58 -862,025.11 -872,102.74 -869,580.31 -871,025.91 0.13
A. Forest land -790,901.58 -764,870.62 -765,410.02 -773,843.36 -773,110.02 -775,676.69 0.21
B. Cropland -3,232.74 -4,055.22 -1,111.96 -1,588.06 1,105.83 2,628.99 -1.08
C. Grassland 2,765.37 2,787.27 2,800.45 2,808.95 2,749.06 3,325.71 -1.36
D. Wetlands 1,000.52 1,023.66 1,022.17 925.71 812.36 769.85 -0.27
E. Settlements -83,886.86 -85,008.03 -86,129.19 -87,250.36 -88,371.53 -89,492.70 0.48
F. Other land NE NE NE NE NE NE NA
G. Harvested wood products IE IE IE IE IE IE NA
H. Other -10,668.81 -12,507.63 -13,196.56 -13,155.63 -12,765.99 -12,581.07 -0.52
5. Waste IE, NE, NA IE, NE, NA IE, NE, NA IE, NE, NA IE, NE, NA IE, NE, NA NA
A. Solid waste disposal NA, NE NA, NE NA, NE NA, NE NA, NE NA, NE NA
B. Biological treatment of solid waste
C. Incineration and open burning of waste IE, NA IE, NA IE, NA IE, NA IE, NA IE, NA NA
D. Waste water treatment and discharge
E. Other NA NA NA NA NA NA NA
6. Other (as specified in the summary table in CRF) NA NA NA NA NA NA NA
Memo items:
International bunkers 114,341.85 106,410.32 116,992.25 111,660.01 105,805.43 99,762.82 -0.04
Aviation 56,145.71 52,785.00 60,967.34 64,789.87 64,523.98 65,663.51 0.73
Navigation 58,196.14 53,625.32 56,024.90 46,870.13 41,281.45 34,099.31 -0.48
Multilateral operations IE IE IE IE IE IE NA
CO2 emissions from biomass 254,671.71 250,491.37 265,109.74 268,063.82 267,730.05 283,337.09 0.29
CO2 captured NA NA NA NA NA NA NA
Long-term storage of C in waste disposal sites NA NA NA NA NA NA NA
Indirect N2O
Indirect CO2 (3) NA NA NA NA NA NA NA
Total CO2 equivalent emissions without land use, land-use change and forestry 5,927,349.32 5,492,354.29 5,694,946.80 5,559,994.62 5,347,462.83 5,494,472.63 0.07
Total CO2 equivalent emissions with land use, land-use change and forestry 5,042,425.22 4,629,723.71 4,832,921.69 4,687,891.87 4,477,882.52 4,623,446.72 0.06
Total CO2 equivalent emissions, including indirect CO2, without land use, land-use change
and forestry
5,927,349.32 5,492,354.29 5,694,946.80 5,559,994.62 5,347,462.83 5,494,472.63 0.07
Total CO2 equivalent emissions, including indirect CO2, with land use, land-use change and
forestry
5,042,425.22 4,629,723.71 4,832,921.69 4,687,891.87 4,477,882.52 4,623,446.72 0.06
Abbreviations : CRF = common reporting format, LULUCF = land use, land-use change and forestry.
Custom Footnotes
GREENHOUSE GAS SOURCE AND SINK CATEGORIES
a The column “Base year” should be filled in only by those Parties with economies in transition that use a base year
different from 1990 in accordance with the relevant decisions of the Conference of the Parties. For these Parties, this
different base year is used to calculate the percentage change in the final column of this table.
b Fill in net emissions/removals as reported in CRF table Summary 1.A of the latest reported inventory year. For the
purposes of reporting, the signs for removals are always negative (-) and for emissions positive (+).

Table 1(b) USA_BR2_v1.0
Emission trends (CH4) Source: Submission 2016 v1, UNITED STATES OF AMERICA
(Sheet 1 of 3) #REF!
Base yeara 1990 1991 1992 1993 1994 1995 1996 1997
kt
1. Energy 13,139.19 13,139.19 13,111.64 12,984.70 12,488.84 12,606.48 12,415.00 12,467.72 12,339.55
A. Fuel combustion (sectoral approach) 564.86 564.86 566.36 577.51 551.66 539.59 533.80 538.33 498.58
1. Energy industries 13.25 13.25 13.23 13.33 13.89 14.17 14.30 14.68 15.19
2. Manufacturing industries and construction 82.91 82.91 80.94 83.41 84.14 87.57 89.11 90.83 92.35
3. Transport 215.70 215.70 209.88 208.80 205.29 201.11 195.08 187.11 179.58
4. Other sectors 251.11 251.11 260.16 269.73 246.01 234.18 232.98 243.52 209.21
5. Other 1.89 1.89 2.14 2.24 2.32 2.55 2.33 2.19 2.25
B. Fugitive emissions from fuels 12,574.33 12,574.33 12,545.28 12,407.18 11,937.18 12,066.90 11,881.20 11,929.39 11,840.97
1. Solid fuels 4,147.46 4,147.46 4,020.16 3,942.81 3,418.44 3,491.12 3,448.17 3,441.85 3,377.06
2. Oil and natural gas and other emissions from energy production 8,426.87 8,426.87 8,525.12 8,464.37 8,518.75 8,575.78 8,433.03 8,487.54 8,463.91
C. CO2 transport and storage
2. Industrial processes 56.38 56.38 51.26 53.68 56.87 58.40 59.90 59.21 60.36
A. Mineral industry NA NA NA NA NA NA NA NA NA
B. Chemical industry 10.14 10.14 10.21 9.64 12.07 12.51 12.62 13.27 14.27
C. Metal industry 46.24 46.24 41.04 44.05 44.79 45.90 47.28 45.93 46.09
D. Non-energy products from fuels and solvent use NA NA NA NA NA NA NA NA NA
E. Electronic industry NA NA NA NA NA NA NA NA NA
F. Product uses as ODS substitutes NA NA NA NA NA NA NA NA NA
G. Other product manufacture and use NA NA NA NA NA NA NA NA NA
H. Other NA NA NA NA NA NA NA NA NA
3. Agriculture 8,431.45 8,431.45 8,502.03 8,684.97 8,806.27 9,102.52 9,281.32 9,173.66 9,149.44
A. Enteric fermentation 6,566.15 6,566.15 6,575.92 6,767.08 6,864.27 6,988.55 7,146.17 7,099.62 6,965.27
B. Manure management 1,486.18 1,486.18 1,555.20 1,500.35 1,569.07 1,678.67 1,731.38 1,703.56 1,786.47
C. Rice cultivation 366.37 366.37 360.37 405.45 361.20 422.92 392.44 357.74 385.32
D. Agricultural soils NA NA NA NA NA NA NA NA NA
E. Prescribed burning of savannas NA NA NA NA NA NA NA NA NA
F. Field burning of agricultural residues 12.74 12.74 10.55 12.10 11.74 12.39 11.33 12.74 12.38
G. Liming
H. Urea application
I. Other carbon-containing fertilizers
J. Other NA NA NA NA NA NA NA NA NA
4. Land use, land-use change and forestry 101.24 101.24 88.10 133.57 81.80 250.57 138.68 401.49 76.11
A. Forest land 101.01 101.01 87.88 133.37 81.59 250.38 138.46 401.31 75.89
B. Cropland NA NA NA NA NA NA NA NA NA
C. Grassland NA NA NA NA NA NA NA NA NA
D. Wetlands 0.24 0.24 0.22 0.21 0.21 0.20 0.22 0.18 0.22
E. Settlements NE NE NE NE NE NE NE NE NE
F. Other land NE NE NE NE NE NE NE NE NE
G. Harvested wood products
H. Other NA NA NA NA NA NA NA NA NA
5. Waste 8,091.46 8,091.46 8,205.37 8,281.94 8,318.88 8,321.25 8,111.95 7,929.06 7,630.70
A. Solid waste disposal 7,449.89 7,449.89 7,551.93 7,614.40 7,646.77 7,636.64 7,421.74 7,235.59 6,928.21
B. Biological treatment of solid waste 15.24 15.24 17.42 19.60 25.04 30.77 34.84 39.59 43.80
C. Incineration and open burning of waste IE, NE IE, NE IE, NE IE, NE IE, NE IE, NE IE, NE IE, NE IE, NE
D. Waste water treatment and discharge 626.33 626.33 636.02 647.95 647.07 653.83 655.37 653.88 658.69
E. Other NA NA NA NA NA NA NA NA NA
6. Other (as specified in the summary table in CRF) NA NA NA NA NA NA NA NA NA
Total CH4 emissions without CH4 from LULUCF 29,718.47 29,718.47 29,870.30 30,005.29 29,670.86 30,088.66 29,868.16 29,629.65 29,180.05
Total CH4 emissions with CH4 from LULUCF 29,819.72 29,819.72 29,958.40 30,138.87 29,752.67 30,339.23 30,006.84 30,031.14 29,256.16
Memo items:
International bunkers 6.53 6.53 7.11 6.10 5.08 4.82 4.85 4.86 5.24
Aviation NO NO NO NO NO NO NO NO NO
Navigation 6.53 6.53 7.11 6.10 5.08 4.82 4.85 4.86 5.24
Multilateral operations IE IE IE IE IE IE IE IE IE
CO2 emissions from biomass
CO2 captured
Long-term storage of C in waste disposal sites
Indirect N2O
Indirect CO2 (3)
Note: All footnotes for this table are given on sheet 3.
GREENHOUSE GAS SOURCE AND SINK CATEGORIES

Table 1(b) USA_BR2_v1.0
Emission trends (CH4) Source: Submission 2016 v1, UNITED STATES OF AMERICA
(Sheet 2 of 3) #REF!
1998 1999 2000 2001 2002 2003 2004 2005 2006 2007
1. Energy 12,083.23 11,749.66 11,817.40 11,725.89 11,397.24 11,392.24 11,385.66 11,236.94 11,235.03 11,185.33
A. Fuel combustion (sectoral approach) 463.04 457.55 463.15 441.56 422.63 422.72 422.31 416.27 388.97 393.10
1. Energy industries 16.18 16.31 17.19 17.09 17.26 17.35 17.76 18.50 18.24 19.03
2. Manufacturing industries and construction 87.47 86.80 87.39 83.03 80.55 80.17 84.73 83.55 85.28 82.70
3. Transport 171.35 159.46 150.91 149.46 130.54 120.66 113.98 106.14 99.04 89.34
4. Other sectors 185.80 192.66 205.27 188.78 191.45 201.36 202.51 204.90 183.24 199.21
5. Other 2.25 2.33 2.39 3.20 2.83 3.18 3.33 3.18 3.17 2.82
B. Fugitive emissions from fuels 11,620.19 11,292.11 11,354.25 11,284.33 10,974.61 10,969.52 10,963.35 10,820.67 10,846.06 10,792.24
1. Solid fuels 3,358.33 3,180.47 3,080.63 3,038.58 2,845.72 2,845.14 2,887.37 2,828.72 2,883.10 2,844.74
2. Oil and natural gas and other emissions from energy production 8,261.86 8,111.64 8,273.62 8,245.75 8,128.88 8,124.38 8,075.97 7,991.95 7,962.96 7,947.50
C. CO2 transport and storage
2. Industrial processes 59.34 56.24 57.20 51.31 49.52 49.10 50.94 40.48 38.27 36.72
A. Mineral industry NA NA NA NA NA NA NA NA NA NA
B. Chemical industry 14.54 13.20 12.81 12.33 12.30 11.54 11.93 6.02 3.23 3.09
C. Metal industry 44.80 43.04 44.39 38.98 37.22 37.56 39.01 34.46 35.03 33.63
D. Non-energy products from fuels and solvent use NA NA NA NA NA NA NA NA NA NA
E. Electronic industry NA NA NA NA NA NA NA NA NA NA
F. Product uses as ODS substitutes NA NA NA NA NA NA NA NA NA NA
G. Other product manufacture and use NA NA NA NA NA NA NA NA NA NA
H. Other NA NA NA NA NA NA NA NA NA NA
3. Agriculture 9,260.20 9,309.02 9,221.45 9,278.99 9,301.25 9,344.20 9,197.61 9,374.89 9,460.05 9,790.34
A. Enteric fermentation 6,891.22 6,896.90 6,823.69 6,783.65 6,793.81 6,801.49 6,674.00 6,754.76 6,863.11 6,979.13
B. Manure management 1,948.90 1,971.59 2,000.51 2,088.41 2,141.46 2,174.86 2,122.18 2,253.50 2,278.08 2,480.42
C. Rice cultivation 407.62 428.54 384.91 395.54 355.23 356.23 390.89 357.86 307.80 319.53
D. Agricultural soils NA NA NA NA NA NA NA NA NA NA
E. Prescribed burning of savannas NA NA NA NA NA NA NA NA NA NA
F. Field burning of agricultural residues 12.46 11.99 12.34 11.38 10.74 11.62 10.54 8.77 11.06 11.26
G. Liming
H. Urea application
I. Other carbon-containing fertilizers
J. Other NA NA NA NA NA NA NA NA NA NA
4. Land use, land-use change and forestry 103.61 373.11 505.92 278.59 420.36 267.26 148.59 331.88 742.92 600.37
A. Forest land 103.38 372.86 505.66 278.35 420.15 267.05 148.35 331.65 742.73 600.16
B. Cropland NA NA NA NA NA NA NA NA NA NA
C. Grassland NA NA NA NA NA NA NA NA NA NA
D. Wetlands 0.23 0.24 0.26 0.24 0.21 0.21 0.24 0.23 0.19 0.21
E. Settlements NE NE NE NE NE NE NE NE NE NE
F. Other land NE NE NE NE NE NE NE NE NE NE
G. Harvested wood products
H. Other NA NA NA NA NA NA NA NA NA NA
5. Waste 7,326.49 7,142.87 7,043.17 6,914.41 6,967.81 7,236.06 7,149.16 7,329.63 7,333.62 7,358.36
A. Solid waste disposal 6,619.60 6,426.86 6,324.07 6,206.90 6,259.76 6,527.35 6,441.31 6,619.80 6,623.14 6,644.84
B. Biological treatment of solid waste 47.68 53.42 59.69 60.06 60.75 69.24 74.28 74.57 75.41 78.78
C. Incineration and open burning of waste IE, NE IE, NE IE, NE IE, NE IE, NE IE, NE IE, NE IE, NE IE, NE IE, NE
D. Waste water treatment and discharge 659.21 662.60 659.41 647.46 647.30 639.47 633.57 635.26 635.07 634.73
E. Other NA NA NA NA NA NA NA NA NA NA
6. Other (as specified in the summary table in CRF) NA NA NA NA NA NA NA NA NA NA
Total CH4 emissions without CH4 from LULUCF 28,729.26 28,257.79 28,139.22 27,970.60 27,715.82 28,021.60 27,783.37 27,981.94 28,066.97 28,370.76
Total CH4 emissions with CH4 from LULUCF 28,832.87 28,630.90 28,645.14 28,249.19 28,136.18 28,288.87 27,931.96 28,313.82 28,809.89 28,971.13
Memo items:
International bunkers 5.63 4.51 3.96 3.73 3.98 4.31 5.21 5.29 5.38 5.38
Aviation NO NO NO NO NO NO NO NO NO NO
Navigation 5.63 4.51 3.96 3.73 3.98 4.31 5.21 5.29 5.38 5.38
Multilateral operations IE IE IE IE IE IE IE IE IE IE
CO2 emissions from biomass
CO2 captured
Long-term storage of C in waste disposal sites
Indirect N2O
Indirect CO2 (3)
Note: All footnotes for this table are given on sheet 3.
GREENHOUSE GAS SOURCE AND SINK CATEGORIES

Table 1(b) USA_BR2_v1.0
Emission trends (CH4) Source: Submission 2016 v1, UNITED STATES OF AMERICA
(Sheet 3 of 3) #REF!
2008 2009 2010 2011 2012 2013 Change from
base to latest
reported
year
%
1. Energy 11,600.55 11,419.32 11,167.87 10,729.34 10,366.35 10,540.93 -0.20
A. Fuel combustion (sectoral approach) 393.56 388.67 375.20 373.77 352.17 403.71 -0.29
1. Energy industries 18.59 17.37 18.35 17.30 16.93 17.05 0.29
2. Manufacturing industries and construction 78.15 69.98 74.74 75.12 75.64 75.20 -0.09
3. Transport 81.34 78.30 76.90 75.30 72.02 69.37 -0.68
4. Other sectors 212.97 220.29 202.29 203.57 185.24 240.20 -0.04
5. Other 2.52 2.73 2.91 2.47 2.33 1.87 -0.01
B. Fugitive emissions from fuels 11,206.99 11,030.65 10,792.67 10,355.58 10,014.18 10,137.22 -0.19
1. Solid fuels 3,278.80 3,448.73 3,556.56 3,106.05 2,906.69 2,832.99 -0.32
2. Oil and natural gas and other emissions from energy production 7,928.19 7,581.92 7,236.11 7,249.53 7,107.49 7,304.23 -0.13
C. CO2 transport and storage
2. Industrial processes 33.72 20.17 27.41 30.28 32.75 31.86 -0.43
A. Mineral industry NA NA NA NA NA NA NA
B. Chemical industry 2.45 2.39 2.42 2.19 2.96 3.70 -0.63
C. Metal industry 31.27 17.78 24.98 28.10 29.79 28.16 -0.39
D. Non-energy products from fuels and solvent use NA NA NA NA NA NA NA
E. Electronic industry NA NA NA NA NA NA NA
F. Product uses as ODS substitutes NA NA NA NA NA NA NA
G. Other product manufacture and use NA NA NA NA NA NA NA
H. Other NA NA NA NA NA NA NA
3. Agriculture 9,779.67 9,685.16 9,736.20 9,557.72 9,585.40 9,381.04 0.11
A. Enteric fermentation 6,953.22 6,908.22 6,843.90 6,749.71 6,653.42 6,581.18 0.00
B. Manure management 2,443.25 2,387.51 2,436.85 2,456.88 2,548.35 2,455.57 0.65
C. Rice cultivation 370.34 377.68 443.98 338.99 371.60 331.82 -0.09
D. Agricultural soils NA NA NA NA NA NA NA
E. Prescribed burning of savannas NA NA NA NA NA NA NA
F. Field burning of agricultural residues 12.85 11.75 11.47 12.14 12.03 12.46 -0.02
G. Liming
H. Urea application
I. Other carbon-containing fertilizers
J. Other NA NA NA NA NA NA NA
4. Land use, land-use change and forestry 362.64 233.61 190.10 583.98 626.62 233.41 1.31
A. Forest land 362.43 233.39 189.88 583.79 626.45 233.25 1.31
B. Cropland NA NA NA NA NA NA NA
C. Grassland NA NA NA NA NA NA NA
D. Wetlands 0.21 0.21 0.21 0.19 0.17 0.16 -0.33
E. Settlements NE NE NE NE NE NE NA
F. Other land NE NE NE NE NE NE NA
G. Harvested wood products
H. Other NA NA NA NA NA NA NA
5. Waste 7,339.95 7,021.32 5,565.13 5,535.84 5,294.19 5,265.28 -0.35
A. Solid waste disposal 6,624.74 6,323.50 4,872.83 4,850.92 4,610.65 4,585.45 -0.38
B. Biological treatment of solid waste 80.20 75.30 73.19 74.64 77.40 78.53 4.15
C. Incineration and open burning of waste IE, NE IE, NE IE, NE IE, NE IE, NE IE, NE NA
D. Waste water treatment and discharge 635.01 622.52 619.11 610.28 606.13 601.29 -0.04
E. Other NA NA NA NA NA NA NA
6. Other (as specified in the summary table in CRF) NA NA NA NA NA NA NA
Total CH4 emissions without CH4 from LULUCF 28,753.89 28,145.97 26,496.60 25,853.19 25,278.69 25,219.11 -0.15
Total CH4 emissions with CH4 from LULUCF 29,116.53 28,379.58 26,686.70 26,437.18 25,905.30 25,452.51 -0.15
Memo items:
International bunkers 5.81 5.36 5.59 4.68 4.12 3.17 -0.51
Aviation NO NO NO NO NO NO NA
Navigation 5.81 5.36 5.59 4.68 4.12 3.17 -0.51
Multilateral operations IE IE IE IE IE IE NA
CO2 emissions from biomass
CO2 captured
Long-term storage of C in waste disposal sites
Indirect N2O
Indirect CO2 (3)
Custom Footnotes
GREENHOUSE GAS SOURCE AND SINK CATEGORIES
Abbreviations : CRF = common reporting format, LULUCF = land use, land-use change and forestry.
a The column “Base year” should be filled in only by those Parties with economies in transition
that use a base year different from 1990 in accordance with the relevant decisions of the
Conference of the Parties. For these Parties, this different base year is used to calculate the
percentage change in the final column of this table.

Table 1(c) USA_BR2_v1.0
Emission trends (N2O) Source: Submission 2016 v1, UNITED STATES OF AMERICA
(Sheet 1 of 3) #REF!
Base yeara 1990 1991 1992 1993 1994 1995 1996 1997
kt
1. Energy 179.84 179.84 185.64 196.45 203.90 210.80 215.44 219.83 222.48
A. Fuel combustion (sectoral approach) 179.84 179.84 185.64 196.45 203.90 210.80 215.44 219.83 222.48
1. Energy industries 24.72 24.72 24.67 24.86 25.92 26.44 26.67 27.38 27.90
2. Manufacturing industries and construction 13.52 13.52 13.23 13.65 13.74 14.28 14.48 14.80 15.03
3. Transport 135.11 135.11 141.33 151.25 157.95 163.86 168.12 171.26 173.75
4. Other sectors 4.72 4.72 4.86 4.94 4.61 4.44 4.39 4.63 4.12
5. Other 1.77 1.77 1.54 1.74 1.68 1.78 1.78 1.76 1.67
B. Fugitive emissions from fuels IE, NA, NE IE, NA, NE IE, NA, NE IE, NA, NE IE, NA, NE IE, NA, NE IE, NA, NE IE, NA, NE IE, NA, NE
1. Solid fuels NA NA NA NA NA NA NA NA NA
2. Oil and natural gas and other emissions from energy production IE, NA, NE IE, NA, NE IE, NA, NE IE, NA, NE IE, NA, NE IE, NA, NE IE, NA, NE IE, NA, NE IE, NA, NE
C. CO2 transport and storage
2. Industrial processes 105.97 105.97 104.53 98.41 103.92 105.10 116.95 118.28 96.05
A. Mineral industry NA NA NA NA NA NA NA NA NA
B. Chemical industry 91.64 91.64 90.60 85.27 88.97 90.13 101.95 103.27 80.05
C. Metal industry NA NA NA NA NA NA NA NA NA
D. Non-energy products from fuels and solvent use NA NA NA NA NA NA NA NA NA
E. Electronic industry 0.12 0.12 0.12 0.12 0.15 0.17 0.20 0.22 0.27
F. Product uses as ODS substitutes NA NA NA NA NA NA NA NA NA
G. Other product manufacture and use 14.21 14.21 13.81 13.02 14.80 14.80 14.80 14.80 15.74
H. Other NA NA NA NA NA NA NA NA NA
3. Agriculture 798.38 798.38 878.04 838.46 897.41 832.37 884.66 938.58 917.80
A. Enteric fermentation
B. Manure management 46.32 46.32 47.04 47.16 46.49 48.93 50.22 50.04 50.68
C. Rice cultivation
D. Agricultural soils 751.73 751.73 830.72 790.98 850.61 783.11 834.15 888.21 866.79
E. Prescribed burning of savannas NA NA NA NA NA NA NA NA NA
F. Field burning of agricultural residues 0.33 0.33 0.28 0.32 0.30 0.33 0.30 0.34 0.33
G. Liming
H. Urea application
I. Other carbon containing fertlizers
J. Other NA NA NA NA NA NA NA NA NA
4. Land use, land-use change and forestry 10.44 10.44 9.82 12.87 10.91 20.93 14.38 29.45 11.59
A. Forest land 5.86 5.86 5.13 7.77 5.08 14.42 8.51 23.42 5.53
B. Cropland NA NA NA NA NA NA NA NA NA
C. Grassland NA NA NA NA NA NA NA NA NA
D. Wetlands 0.00 0.00 0.00 0.00 0.00 0.00 0.00 0.00 0.00
E. Settlements 4.58 4.58 4.69 5.10 5.83 6.50 5.86 6.02 6.06
F. Other land NE NE NE NE NE NE NE NE NE
G. Harvested wood products
H. Other NA NA NA NA NA NA NA NA NA
5. Waste 12.41 12.41 12.85 13.44 13.90 14.73 15.09 15.67 16.03
A. Solid waste disposal
B. Biological treatment of solid waste 1.14 1.14 1.31 1.47 1.88 2.31 2.61 2.97 3.28
C. Incineration and open burning of waste IE IE IE IE IE IE IE IE IE
D. Waste water treatment and discharge 11.27 11.27 11.54 11.97 12.02 12.43 12.48 12.70 12.74
E. Other NA NA NA NA NA NA NA NA NA
6. Other (as specified in the summary table in CRF) NA NA NA NA NA NA NA NA NA
Total direct N2O emissions without N2O from LULUCF 1,096.88 1,096.88 1,181.33 1,147.15 1,219.69 1,163.58 1,233.00 1,293.59 1,253.70
Total direct N2O emissions with N2O from LULUCF 1,107.05 1,107.05 1,190.87 1,159.63 1,230.03 1,183.93 1,246.52 1,321.81 1,263.96
Memo items:
International bunkers 2.88 2.88 3.29 3.04 2.79 2.77 2.83 2.87 3.04
Aviation 1.22 1.22 1.48 1.49 1.50 1.55 1.60 1.63 1.71
Navigation 1.66 1.66 1.81 1.55 1.29 1.22 1.23 1.23 1.33
Multilateral operations IE IE IE IE IE IE IE IE IE
CO2 emissions from biomass
CO2 captured
Long-term storage of C in waste disposal sites
Indirect N2O NA NA NA NA NA NA NA NA NA
Indirect CO2 (3)
Note: All footnotes for this table are given on sheet 3.
GREENHOUSE GAS SOURCE AND SINK CATEGORIES

Table 1(c) USA_BR2_v1.0
Emission trends (N2O) Source: Submission 2016 v1, UNITED STATES OF AMERICA
(Sheet 2 of 3) #REF!
1998 1999 2000 2001 2002 2003 2004 2005 2006 2007
1. Energy 223.17 222.22 222.95 216.23 211.19 205.14 203.28 197.11 187.82 171.94
A. Fuel combustion (sectoral approach) 223.17 222.22 222.95 216.23 211.19 205.14 203.28 197.11 187.82 171.94
1. Energy industries 29.13 29.75 32.29 34.11 40.25 44.33 49.47 53.68 54.41 56.07
2. Manufacturing industries and construction 14.33 14.27 14.39 14.10 13.78 13.83 14.56 14.46 14.81 14.41
3. Transport 174.47 172.85 170.58 162.45 151.67 141.17 133.38 123.17 113.24 95.96
4. Other sectors 3.67 3.84 4.09 3.89 3.84 4.08 4.12 4.07 3.63 3.87
5. Other 1.56 1.51 1.60 1.69 1.64 1.72 1.75 1.72 1.72 1.63
B. Fugitive emissions from fuels IE, NA, NE IE, NA, NE IE, NA, NE IE, NA, NE IE, NA, NE IE, NA, NE IE, NA, NE IE, NA, NE IE, NA, NE IE, NA, NE
1. Solid fuels NA NA NA NA NA NA NA NA NA NA
2. Oil and natural gas and other emissions from energy production IE, NA, NE IE, NA, NE IE, NA, NE IE, NA, NE IE, NA, NE IE, NA, NE IE, NA, NE IE, NA, NE IE, NA, NE IE, NA, NE
C. CO2 transport and storage
2. Industrial processes 80.84 77.70 78.34 67.18 70.16 69.60 63.42 76.45 80.53 93.47
A. Mineral industry NA NA NA NA NA NA NA NA NA NA
B. Chemical industry 64.85 61.68 62.27 51.21 55.77 55.15 48.92 61.89 65.85 78.66
C. Metal industry NA NA NA NA NA NA NA NA NA NA
D. Non-energy products from fuels and solvent use NA NA NA NA NA NA NA NA NA NA
E. Electronic industry 0.24 0.28 0.33 0.24 0.24 0.30 0.35 0.41 0.53 0.66
F. Product uses as ODS substitutes NA NA NA NA NA NA NA NA NA NA
G. Other product manufacture and use 15.74 15.74 15.74 15.74 14.15 14.15 14.15 14.15 14.15 14.15
H. Other NA NA NA NA NA NA NA NA NA NA
3. Agriculture 868.73 839.67 768.60 858.31 831.14 802.60 888.42 872.84 847.69 935.65
A. Enteric fermentation
B. Manure management 51.44 53.44 54.85 54.50 55.71 56.16 54.10 55.08 57.60 57.96
C. Rice cultivation
D. Agricultural soils 816.96 785.91 713.42 803.50 775.14 746.15 834.03 817.50 789.79 877.37
E. Prescribed burning of savannas NA NA NA NA NA NA NA NA NA NA
F. Field burning of agricultural residues 0.33 0.32 0.33 0.31 0.29 0.29 0.29 0.26 0.30 0.33
G. Liming
H. Urea application
I. Other carbon containing fertlizers
J. Other NA NA NA NA NA NA NA NA NA NA
4. Land use, land-use change and forestry 12.43 28.21 36.56 24.71 32.86 24.54 17.91 27.74 50.60 43.02
A. Forest land 7.19 22.64 29.71 17.14 25.12 16.54 9.74 19.88 42.62 34.73
B. Cropland NA NA NA NA NA NA NA NA NA NA
C. Grassland NA NA NA NA NA NA NA NA NA NA
D. Wetlands 0.00 0.00 0.00 0.00 0.00 0.00 0.00 0.00 0.00 0.00
E. Settlements 5.24 5.56 6.85 7.57 7.74 8.00 8.17 7.86 7.98 8.29
F. Other land NE NE NE NE NE NE NE NE NE NE
G. Harvested wood products
H. Other NA NA NA NA NA NA NA NA NA NA
5. Waste 16.68 17.62 18.32 18.30 18.70 19.52 20.25 20.11 20.66 21.16
A. Solid waste disposal
B. Biological treatment of solid waste 3.58 4.01 4.48 4.50 4.56 5.19 5.57 5.59 5.66 5.91
C. Incineration and open burning of waste IE IE IE IE IE IE IE IE IE IE
D. Waste water treatment and discharge 13.10 13.61 13.85 13.79 14.14 14.33 14.68 14.52 15.01 15.25
E. Other NA NA NA NA NA NA NA NA NA NA
6. Other (as specified in the summary table in CRF) NA NA NA NA NA NA NA NA NA NA
Total direct N2O emissions without N2O from LULUCF 1,190.88 1,159.24 1,089.95 1,161.76 1,133.06 1,098.62 1,176.90 1,168.04 1,138.24 1,223.76
Total direct N2O emissions with N2O from LULUCF 1,201.84 1,185.42 1,124.77 1,184.73 1,164.04 1,121.39 1,193.27 1,194.25 1,187.31 1,265.25
Memo items:
International bunkers 3.13 2.95 3.01 2.76 2.77 2.87 3.13 3.28 3.31 3.35
Aviation 1.70 1.81 2.00 1.82 1.76 1.78 1.81 1.94 1.94 1.98
Navigation 1.43 1.14 1.01 0.95 1.01 1.09 1.32 1.34 1.37 1.37
Multilateral operations IE IE IE IE IE IE IE IE IE IE
CO2 emissions from biomass
CO2 captured
Long-term storage of C in waste disposal sites
Indirect N2O NA NA NA NA NA NA NA NA NA NA
Indirect CO2 (3)
Note: All footnotes for this table are given on sheet 3.
GREENHOUSE GAS SOURCE AND SINK CATEGORIES

Table 1(c) USA_BR2_v1.0
Emission trends (N2O) Source: Submission 2016 v1, UNITED STATES OF AMERICA
(Sheet 3 of 3) #REF!
2008 2009 2010 2011 2012 2013 Change from
base to latest
reported
year
%
1. Energy 159.86 152.18 155.12 148.04 140.65 139.66 -0.22
A. Fuel combustion (sectoral approach) 159.86 152.18 155.12 148.04 140.65 139.66 -0.22
1. Energy industries 56.46 56.39 61.94 59.08 59.77 64.13 1.59
2. Manufacturing industries and construction 13.71 12.56 13.31 13.35 13.42 13.50 0.00
3. Transport 84.08 77.57 74.51 70.39 62.70 56.51 -0.58
4. Other sectors 4.07 4.14 3.87 3.85 3.40 4.21 -0.11
5. Other 1.54 1.51 1.49 1.38 1.37 1.31 -0.26
B. Fugitive emissions from fuels IE, NA, NE IE, NA, NE IE, NA, NE IE, NA, NE IE, NA, NE IE, NA, NE NA
1. Solid fuels NA NA NA NA NA NA NA
2. Oil and natural gas and other emissions from energy production IE, NA, NE IE, NA, NE IE, NA, NE IE, NA, NE IE, NA, NE IE, NA, NE NA
C. CO2 transport and storage
2. Industrial processes 60.83 55.98 67.51 85.71 68.53 63.94 -0.40
A. Mineral industry NA NA NA NA NA NA NA
B. Chemical industry 46.09 41.38 52.86 70.77 53.73 49.19 -0.46
C. Metal industry NA NA NA NA NA NA NA
D. Non-energy products from fuels and solvent use NA NA NA NA NA NA NA
E. Electronic industry 0.59 0.45 0.49 0.79 0.65 0.61 4.04
F. Product uses as ODS substitutes NA NA NA NA NA NA NA
G. Other product manufacture and use 14.15 14.15 14.15 14.15 14.15 14.15 0.00
H. Other NA NA NA NA NA NA NA
3. Agriculture 950.99 943.66 944.30 950.22 950.95 943.40 0.18
A. Enteric fermentation
B. Manure management 57.29 57.09 57.22 57.96 58.15 58.10 0.25
C. Rice cultivation
D. Agricultural soils 893.35 886.24 886.75 891.92 892.46 884.94 0.18
E. Prescribed burning of savannas NA NA NA NA NA NA NA
F. Field burning of agricultural residues 0.35 0.34 0.33 0.33 0.33 0.35 0.07
G. Liming
H. Urea application
I. Other carbon containing fertlizers
J. Other NA NA NA NA NA NA NA
4. Land use, land-use change and forestry 29.43 21.98 20.00 42.16 44.65 22.53 1.16
A. Forest land 21.58 14.44 12.04 33.83 36.19 14.43 1.46
B. Cropland NA NA NA NA NA NA NA
C. Grassland NA NA NA NA NA NA NA
D. Wetlands 0.00 0.00 0.00 0.00 0.00 0.00 -0.30
E. Settlements 7.85 7.53 7.96 8.34 8.47 8.09 0.77
F. Other land NE NE NE NE NE NE NA
G. Harvested wood products
H. Other NA NA NA NA NA NA NA
5. Waste 21.41 21.18 21.34 21.77 22.09 22.40 0.80
A. Solid waste disposal
B. Biological treatment of solid waste 6.01 5.65 5.49 5.60 5.81 5.89 4.15
C. Incineration and open burning of waste IE IE IE IE IE IE NA
D. Waste water treatment and discharge 15.40 15.53 15.85 16.18 16.29 16.51 0.46
E. Other NA NA NA NA NA NA NA
6. Other (as specified in the summary table in CRF) NA NA NA NA NA NA NA
Total direct N2O emissions without N2O from LULUCF 1,194.62 1,174.53 1,189.79 1,207.28 1,183.75 1,170.93 0.07
Total direct N2O emissions with N2O from LULUCF 1,222.51 1,194.97 1,208.26 1,247.91 1,226.87 1,191.93 0.08
Memo items:
International bunkers 3.29 3.06 3.39 3.28 3.13 2.92 0.01
Aviation 1.81 1.70 1.97 2.09 2.08 2.12 0.73
Navigation 1.48 1.36 1.42 1.19 1.05 0.80 -0.51
Multilateral operations IE IE IE IE IE IE NA
CO2 emissions from biomass
CO2 captured
Long-term storage of C in waste disposal sites
Indirect N2O NA NA NA NA NA NA NA
Indirect CO2 (3)
Custom Footnotes
GREENHOUSE GAS SOURCE AND SINK CATEGORIES
Abbreviations : CRF = common reporting format, LULUCF = land use, land-use change and forestry.
a The column “Base year” should be filled in only by those Parties with economies in
transition that use a base year different from 1990 in accordance with the relevant decisions of
the Conference of the Parties. For these Parties, this different base year is used to calculate the
percentage change in the final column of this table.

Table 1(d) USA_BR2_v1.0
Emission trends (HFCs, PFCs and SF6) Source: Submission 2016 v1, UNITED STATES OF AMERICA
(Sheet 1 of 3) #REF!
Base yeara 1990 1991 1992 1993 1994 1995 1996 1997
kt
Emissions of HFCs and PFCs - (kt CO2 equivalent) 70,837.69 70,837.69 63,097.77 67,483.16 68,539.91 73,910.39 95,719.66 108,492.96 118,976.69
Emissions of HFCs - (kt CO2 equivalent) 46,582.02 46,582.02 42,185.31 48,002.08 49,055.29 55,945.39 77,079.19 88,625.42 100,709.45
HFC-23 3.13 3.13 2.81 3.12 2.85 2.72 2.84 2.69 2.60
HFC-32 C, IE, NA, NE, NO C, IE, NA, NE, NO C, IE, NA, NE, NO C, IE, NA, NE, NO C, IE, NA, NE, NO C, IE, NA, NE, NO C, IE, NA, NE, NO 0.00 0.00
HFC-41 IE, NA, NO IE, NA, NO IE, NA, NO IE, NA, NO IE, NA, NO IE, NA, NO IE, NA, NO IE, NA, NO IE, NA, NO
HFC-43-10mee C, IE, NA, NO C, IE, NA, NO C, IE, NA, NO C, IE, NA, NO C, IE, NA, NO C, IE, NA, NO C, IE, NA, NO C, IE, NA, NO C, IE, NA, NO
HFC-125 0.00 0.00 0.00 0.00 0.18 0.36 0.73 1.13 1.56
HFC-134 C, IE, NA, NO C, IE, NA, NO C, IE, NA, NO C, IE, NA, NO C, IE, NA, NO C, IE, NA, NO C, IE, NA, NO C, IE, NA, NO C, IE, NA, NO
HFC-134a 0.00 0.00 0.00 0.83 3.71 9.06 20.26 27.36 34.55
HFC-143 C, IE, NA, NO C, IE, NA, NO C, IE, NA, NO C, IE, NA, NO C, IE, NA, NO C, IE, NA, NO C, IE, NA, NO C, IE, NA, NO C, IE, NA, NO
HFC-143a 0.00 0.00 0.00 0.00 0.08 0.17 0.30 0.46 0.65
HFC-152 NA NA NA NA NA NA NA NA NA
HFC-152a NA NA NA NA NA NA NA NA NA
HFC-161 NA NA NA NA NA NA NA NA NA
HFC-227ea C, IE, NA, NO C, IE, NA, NO C, IE, NA, NO C, IE, NA, NO C, IE, NA, NO C, IE, NA, NO C, IE, NA, NO C, IE, NA, NO C, IE, NA, NO
HFC-236cb NA NA NA NA NA NA NA NA NA
HFC-236ea NA NA NA NA NA NA NA NA NA
HFC-236fa IE, NA, NO IE, NA, NO IE, NA, NO IE, NA, NO 0.01 0.02 0.04 0.04 0.05
HFC-245ca C, IE, NA, NO C, IE, NA, NO C, IE, NA, NO C, IE, NA, NO C, IE, NA, NO C, IE, NA, NO C, IE, NA, NO C, IE, NA, NO C, IE, NA, NO
HFC-245fa NA NA NA NA NA NA NA NA NA
HFC-365mfc NA NA NA NA NA NA NA NA NA
Unspecified mix of HFCs(4) - (kt CO2 equivalent) 293.21 293.21 566.90 574.41 583.19 586.05 1,755.73 3,226.70 3,893.47
Emissions of PFCs - (kt CO2 equivalent) 24,255.67 24,255.67 20,912.46 19,481.09 19,484.62 17,965.00 18,640.47 19,867.54 18,267.24
CF4 2.54 2.54 2.16 1.99 1.96 1.75 1.76 1.87 1.69
C2F6 0.45 0.45 0.40 0.39 0.41 0.41 0.46 0.50 0.47
C3F8 0.00 0.00 0.00 0.00 0.00 0.00 0.00 0.00 0.00
C4F10 C, IE, NA, NE, NO C, IE, NA, NE, NO C, IE, NA, NE, NO C, IE, NA, NE, NO C, IE, NA, NE, NO C, IE, NA, NE, NO C, IE, NA, NE, NO C, IE, NA, NE, NO C, IE, NA, NE, NO
c-C4F8 C, IE, NA, NE, NO C, IE, NA, NE, NO C, IE, NA, NE, NO C, IE, NA, NE, NO C, IE, NA, NE, NO C, IE, NA, NE, NO C, IE, NA, NE, NO C, IE, NA, NE, NO C, IE, NA, NE, NO
C5F12 C, IE, NA, NE, NO C, IE, NA, NE, NO C, IE, NA, NE, NO C, IE, NA, NE, NO C, IE, NA, NE, NO C, IE, NA, NE, NO C, IE, NA, NE, NO C, IE, NA, NE, NO C, IE, NA, NE, NO
C6F14 C, IE, NA, NE, NO C, IE, NA, NE, NO C, IE, NA, NE, NO C, IE, NA, NE, NO C, IE, NA, NE, NO C, IE, NA, NE, NO C, IE, NA, NE, NO C, IE, NA, NE, NO C, IE, NA, NE, NO
C10F18 NA NA NA NA NA NA NA NA NA
c-C3F6 NA NA NA NA NA NA NA NA NA
Unspecified mix of PFCs(4) - (kt CO2 equivalent) NA, NE, NO NA, NE, NO NA, NE, NO NA, NE, NO NA, NE, NO NA, NE, NO NA, NE, NO NA, NE, NO NA, NE, NO
Unspecified mix of HFCs and PFCs - (kt CO2 equivalent) NA NA NA NA NA NA NA NA NA
Emissions of SF6 - (kt CO2 equivalent) 31,080.41 31,080.41 29,764.56 29,949.82 29,432.65 28,004.25 26,638.17 25,919.91 24,168.02
SF6 1.36 1.36 1.31 1.31 1.29 1.23 1.17 1.14 1.06
Emissions of NF3 - (kt CO2 equivalent) 47.92 47.92 47.92 47.92 59.90 65.89 83.24 92.43 97.68
NF3 0.00 0.00 0.00 0.00 0.00 0.00 0.00 0.01 0.01
Note: All footnotes for this table are given on sheet 3.
GREENHOUSE GAS SOURCE AND SINK CATEGORIES
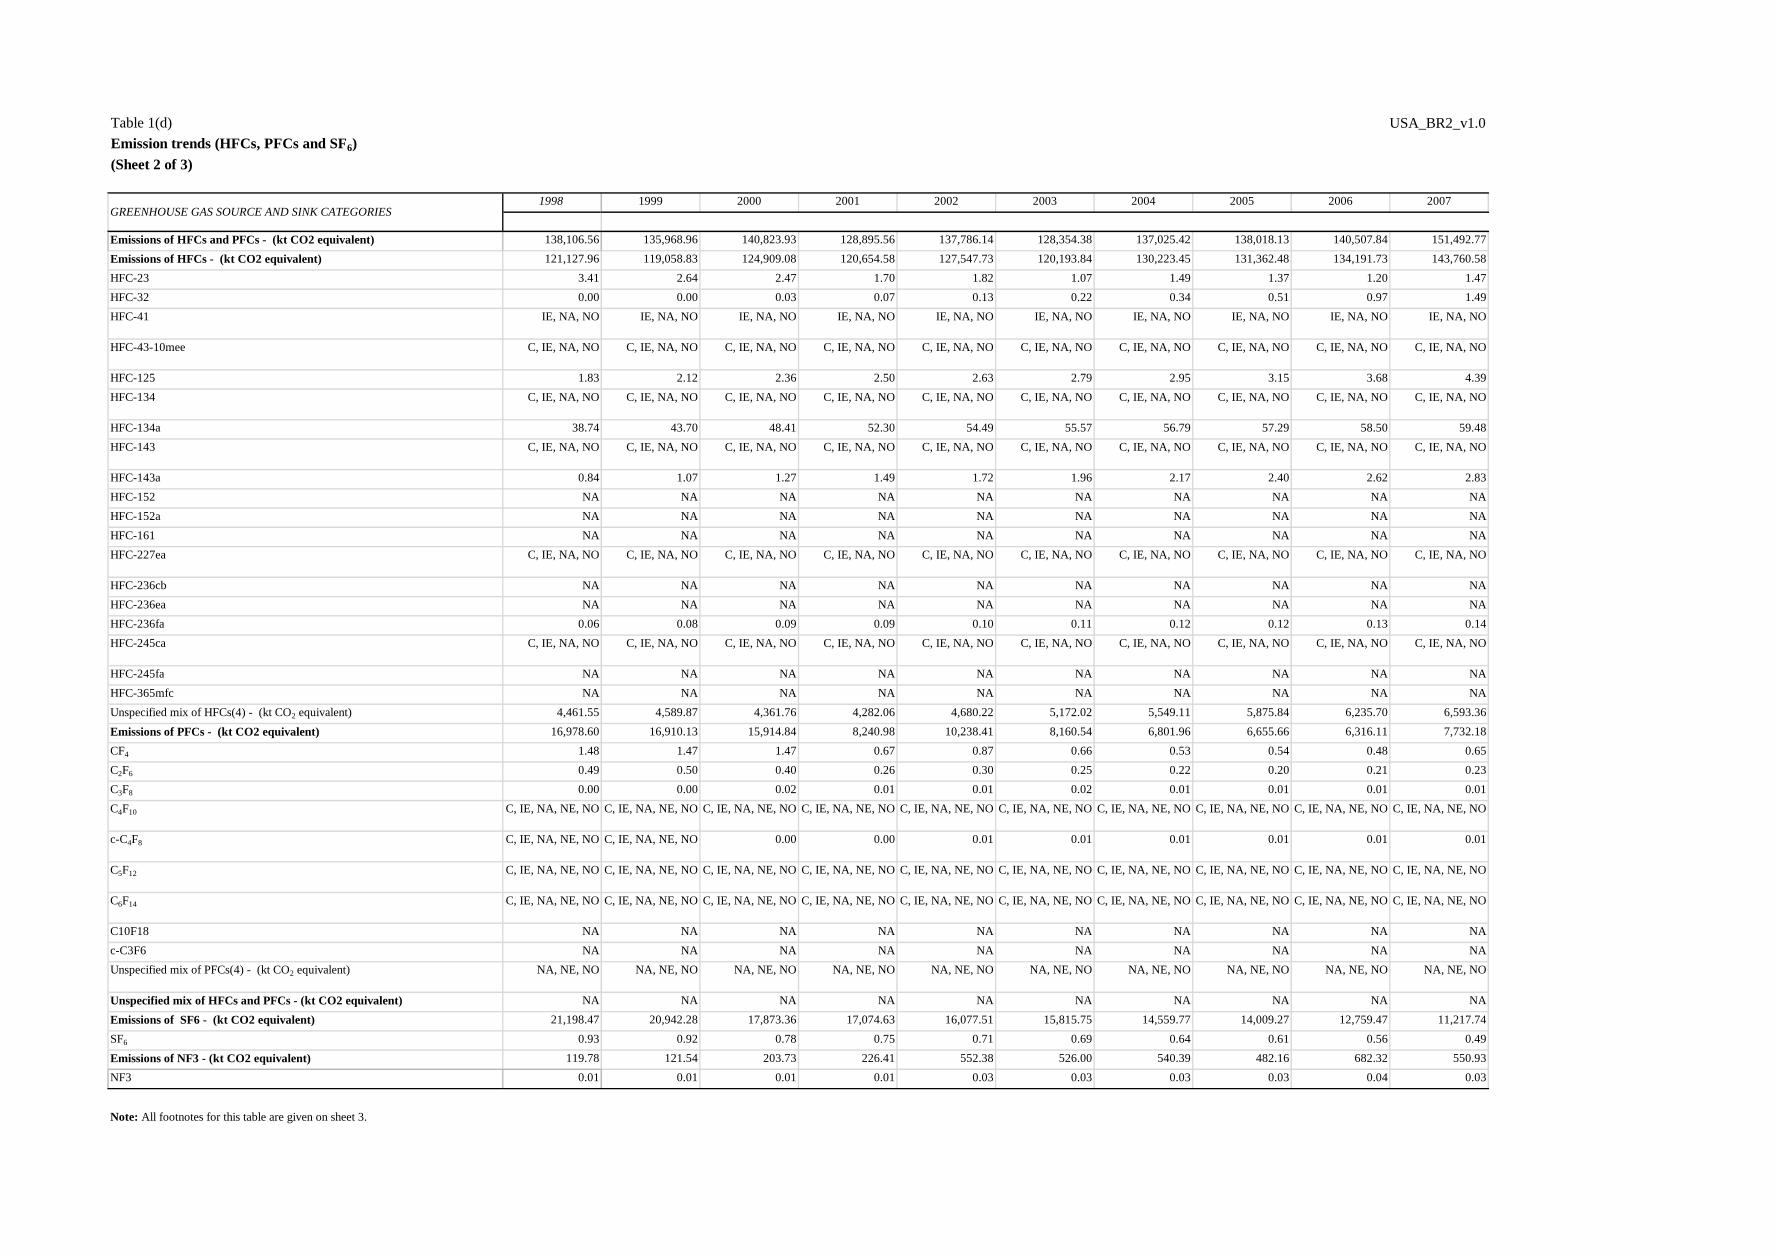
Table 1(d) USA_BR2_v1.0
Emission trends (HFCs, PFCs and SF6) Source: Submission 2016 v1, UNITED STATES OF AMERICA
(Sheet 2 of 3) #REF!
1998 1999 2000 2001 2002 2003 2004 2005 2006 2007
Emissions of HFCs and PFCs - (kt CO2 equivalent) 138,106.56 135,968.96 140,823.93 128,895.56 137,786.14 128,354.38 137,025.42 138,018.13 140,507.84 151,492.77
Emissions of HFCs - (kt CO2 equivalent) 121,127.96 119,058.83 124,909.08 120,654.58 127,547.73 120,193.84 130,223.45 131,362.48 134,191.73 143,760.58
HFC-23 3.41 2.64 2.47 1.70 1.82 1.07 1.49 1.37 1.20 1.47
HFC-32 0.00 0.00 0.03 0.07 0.13 0.22 0.34 0.51 0.97 1.49
HFC-41 IE, NA, NO IE, NA, NO IE, NA, NO IE, NA, NO IE, NA, NO IE, NA, NO IE, NA, NO IE, NA, NO IE, NA, NO IE, NA, NO
HFC-43-10mee C, IE, NA, NO C, IE, NA, NO C, IE, NA, NO C, IE, NA, NO C, IE, NA, NO C, IE, NA, NO C, IE, NA, NO C, IE, NA, NO C, IE, NA, NO C, IE, NA, NO
HFC-125 1.83 2.12 2.36 2.50 2.63 2.79 2.95 3.15 3.68 4.39
HFC-134 C, IE, NA, NO C, IE, NA, NO C, IE, NA, NO C, IE, NA, NO C, IE, NA, NO C, IE, NA, NO C, IE, NA, NO C, IE, NA, NO C, IE, NA, NO C, IE, NA, NO
HFC-134a 38.74 43.70 48.41 52.30 54.49 55.57 56.79 57.29 58.50 59.48
HFC-143 C, IE, NA, NO C, IE, NA, NO C, IE, NA, NO C, IE, NA, NO C, IE, NA, NO C, IE, NA, NO C, IE, NA, NO C, IE, NA, NO C, IE, NA, NO C, IE, NA, NO
HFC-143a 0.84 1.07 1.27 1.49 1.72 1.96 2.17 2.40 2.62 2.83
HFC-152 NA NA NA NA NA NA NA NA NA NA
HFC-152a NA NA NA NA NA NA NA NA NA NA
HFC-161 NA NA NA NA NA NA NA NA NA NA
HFC-227ea C, IE, NA, NO C, IE, NA, NO C, IE, NA, NO C, IE, NA, NO C, IE, NA, NO C, IE, NA, NO C, IE, NA, NO C, IE, NA, NO C, IE, NA, NO C, IE, NA, NO
HFC-236cb NA NA NA NA NA NA NA NA NA NA
HFC-236ea NA NA NA NA NA NA NA NA NA NA
HFC-236fa 0.06 0.08 0.09 0.09 0.10 0.11 0.12 0.12 0.13 0.14
HFC-245ca C, IE, NA, NO C, IE, NA, NO C, IE, NA, NO C, IE, NA, NO C, IE, NA, NO C, IE, NA, NO C, IE, NA, NO C, IE, NA, NO C, IE, NA, NO C, IE, NA, NO
HFC-245fa NA NA NA NA NA NA NA NA NA NA
HFC-365mfc NA NA NA NA NA NA NA NA NA NA
Unspecified mix of HFCs(4) - (kt CO2 equivalent) 4,461.55 4,589.87 4,361.76 4,282.06 4,680.22 5,172.02 5,549.11 5,875.84 6,235.70 6,593.36
Emissions of PFCs - (kt CO2 equivalent) 16,978.60 16,910.13 15,914.84 8,240.98 10,238.41 8,160.54 6,801.96 6,655.66 6,316.11 7,732.18
CF4 1.48 1.47 1.47 0.67 0.87 0.66 0.53 0.54 0.48 0.65
C2F6 0.49 0.50 0.40 0.26 0.30 0.25 0.22 0.20 0.21 0.23
C3F8 0.00 0.00 0.02 0.01 0.01 0.02 0.01 0.01 0.01 0.01
C4F10 C, IE, NA, NE, NO C, IE, NA, NE, NO C, IE, NA, NE, NO C, IE, NA, NE, NO C, IE, NA, NE, NO C, IE, NA, NE, NO C, IE, NA, NE, NO C, IE, NA, NE, NO C, IE, NA, NE, NO C, IE, NA, NE, NO
c-C4F8 C, IE, NA, NE, NO C, IE, NA, NE, NO 0.00 0.00 0.01 0.01 0.01 0.01 0.01 0.01
C5F12 C, IE, NA, NE, NO C, IE, NA, NE, NO C, IE, NA, NE, NO C, IE, NA, NE, NO C, IE, NA, NE, NO C, IE, NA, NE, NO C, IE, NA, NE, NO C, IE, NA, NE, NO C, IE, NA, NE, NO C, IE, NA, NE, NO
C6F14 C, IE, NA, NE, NO C, IE, NA, NE, NO C, IE, NA, NE, NO C, IE, NA, NE, NO C, IE, NA, NE, NO C, IE, NA, NE, NO C, IE, NA, NE, NO C, IE, NA, NE, NO C, IE, NA, NE, NO C, IE, NA, NE, NO
C10F18 NA NA NA NA NA NA NA NA NA NA
c-C3F6 NA NA NA NA NA NA NA NA NA NA
Unspecified mix of PFCs(4) - (kt CO2 equivalent) NA, NE, NO NA, NE, NO NA, NE, NO NA, NE, NO NA, NE, NO NA, NE, NO NA, NE, NO NA, NE, NO NA, NE, NO NA, NE, NO
Unspecified mix of HFCs and PFCs - (kt CO2 equivalent) NA NA NA NA NA NA NA NA NA NA
Emissions of SF6 - (kt CO2 equivalent) 21,198.47 20,942.28 17,873.36 17,074.63 16,077.51 15,815.75 14,559.77 14,009.27 12,759.47 11,217.74
SF6 0.93 0.92 0.78 0.75 0.71 0.69 0.64 0.61 0.56 0.49
Emissions of NF3 - (kt CO2 equivalent) 119.78 121.54 203.73 226.41 552.38 526.00 540.39 482.16 682.32 550.93
NF3 0.01 0.01 0.01 0.01 0.03 0.03 0.03 0.03 0.04 0.03
Note: All footnotes for this table are given on sheet 3.
GREENHOUSE GAS SOURCE AND SINK CATEGORIES

Table 1(d) USA_BR2_v1.0
Emission trends (HFCs, PFCs and SF6) Source: Submission 2016 v1, UNITED STATES OF AMERICA
(Sheet 3 of 3) #REF!
2008 2009 2010 2011 2012 2013 Change from base
to latest reported
year
%
Emissions of HFCs and PFCs - (kt CO2 equivalent) 151,785.08 146,795.92 157,038.32 164,252.64 165,222.47 168,771.19 1.38
Emissions of HFCs - (kt CO2 equivalent) 145,714.55 142,913.24 152,585.91 157,346.36 159,211.39 162,922.11 2.50
HFC-23 1.18 0.47 0.56 0.61 0.39 0.29 -0.91
HFC-32 2.03 2.61 3.85 4.92 6.31 7.73 NA
HFC-41 IE, NA, NO IE, NA, NO IE, NA, NO IE, NA, NO IE, NA, NO IE, NA, NO NA
HFC-43-10mee C, IE, NA, NO C, IE, NA, NO C, IE, NA, NO C, IE, NA, NO C, IE, NA, NO C, IE, NA, NO NA
HFC-125 5.24 6.29 8.04 9.62 11.42 13.24 752,024.74
HFC-134 C, IE, NA, NO C, IE, NA, NO C, IE, NA, NO C, IE, NA, NO C, IE, NA, NO C, IE, NA, NO NA
HFC-134a 60.56 61.47 60.51 56.94 53.49 49.89 31,183,260.41
HFC-143 C, IE, NA, NO C, IE, NA, NO C, IE, NA, NO C, IE, NA, NO C, IE, NA, NO C, IE, NA, NO NA
HFC-143a 3.05 3.46 4.00 4.55 5.09 5.65 271,694.50
HFC-152 NA NA NA NA NA NA NA
HFC-152a NA NA NA NA NA NA NA
HFC-161 NA NA NA NA NA NA NA
HFC-227ea C, IE, NA, NO C, IE, NA, NO C, IE, NA, NO C, IE, NA, NO C, IE, NA, NO C, IE, NA, NO NA
HFC-236cb NA NA NA NA NA NA NA
HFC-236ea NA NA NA NA NA NA NA
HFC-236fa 0.14 0.14 0.15 0.15 0.15 0.15 NA
HFC-245ca C, IE, NA, NO C, IE, NA, NO C, IE, NA, NO C, IE, NA, NO C, IE, NA, NO C, IE, NA, NO NA
HFC-245fa NA NA NA NA NA NA NA
HFC-365mfc NA NA NA NA NA NA NA
Unspecified mix of HFCs(4) - (kt CO2 equivalent) 6,960.29 7,362.38 7,761.98 8,178.47 8,584.42 8,993.78 29.67
Emissions of PFCs - (kt CO2 equivalent) 6,070.53 3,882.68 4,452.41 6,906.28 6,011.08 5,849.08 -0.76
CF4 0.49 0.31 0.33 0.55 0.48 0.48 -0.81
C2F6 0.19 0.12 0.15 0.21 0.19 0.18 -0.61
C3F8 0.02 0.01 0.01 0.02 0.01 0.01 29.69
C4F10 C, IE, NA, NE, NO C, IE, NA, NE, NO C, IE, NA, NE, NO C, IE, NA, NE, NO C, IE, NA, NE, NO C, IE, NA, NE, NO NA
c-C4F8 0.01 0.00 0.00 0.01 0.01 0.01 NA
C5F12 C, IE, NA, NE, NO C, IE, NA, NE, NO C, IE, NA, NE, NO C, IE, NA, NE, NO C, IE, NA, NE, NO C, IE, NA, NE, NO NA
C6F14 C, IE, NA, NE, NO C, IE, NA, NE, NO C, IE, NA, NE, NO C, IE, NA, NE, NO C, IE, NA, NE, NO C, IE, NA, NE, NO NA
C10F18 NA NA NA NA NA NA NA
c-C3F6 NA NA NA NA NA NA NA
Unspecified mix of PFCs(4) - (kt CO2 equivalent) NA, NE, NO NA, NE, NO NA, NE, NO NA, NE, NO NA, NE, NO NA, NE, NO NA
Unspecified mix of HFCs and PFCs - (kt CO2 equivalent) NA NA NA NA NA NA NA
Emissions of SF6 - (kt CO2 equivalent) 10,305.02 9,301.94 9,489.73 10,030.87 7,719.90 6,938.46 -0.78
SF6 0.45 0.41 0.42 0.44 0.34 0.30 -0.78
Emissions of NF3 - (kt CO2 equivalent) 564.92 446.56 521.89 666.94 638.63 560.71 10.70
NF3 0.03 0.03 0.03 0.04 0.04 0.03 10.70
cEnter actual emissions estimates. If only potential emissions estimates are
available, these should be reported in this table and an indication for this be
provided in the documentation box. Only in these rows are the emissions expressed
as CO2 equivalent emissions.
dIn accordance with the “Guidelines for the preparation of national communications
by Parties included in Annex I to the Convention, Part I: UNFCCC reporting
guidelines on annual inventories”, HFC and PFC emissions should be reported for
each relevant chemical. However, if it is not possible to report values for each
chemical (i.e. mixtures, confidential data, lack of disaggregation), this row could be
used for reporting aggregate figures for HFCs and PFCs, respectively. Note that the
unit used for this row is kt of CO2 equivalent and that appropriate notation keys
should be entered in the cells for the individual chemicals.)
Custom Footnotes
GREENHOUSE GAS SOURCE AND SINK CATEGORIES
Abbreviations : CRF = common reporting format, LULUCF = land use, land-use change and forestry.
a The column “Base year” should be filled in only by those Parties with economies in transition that use
a base year different from 1990 in accordance with the relevant decisions of the Conference of the
Parties. For these Parties, this different base year is used to calculate the percentage change in the final
column of this table.
Documentation Box:
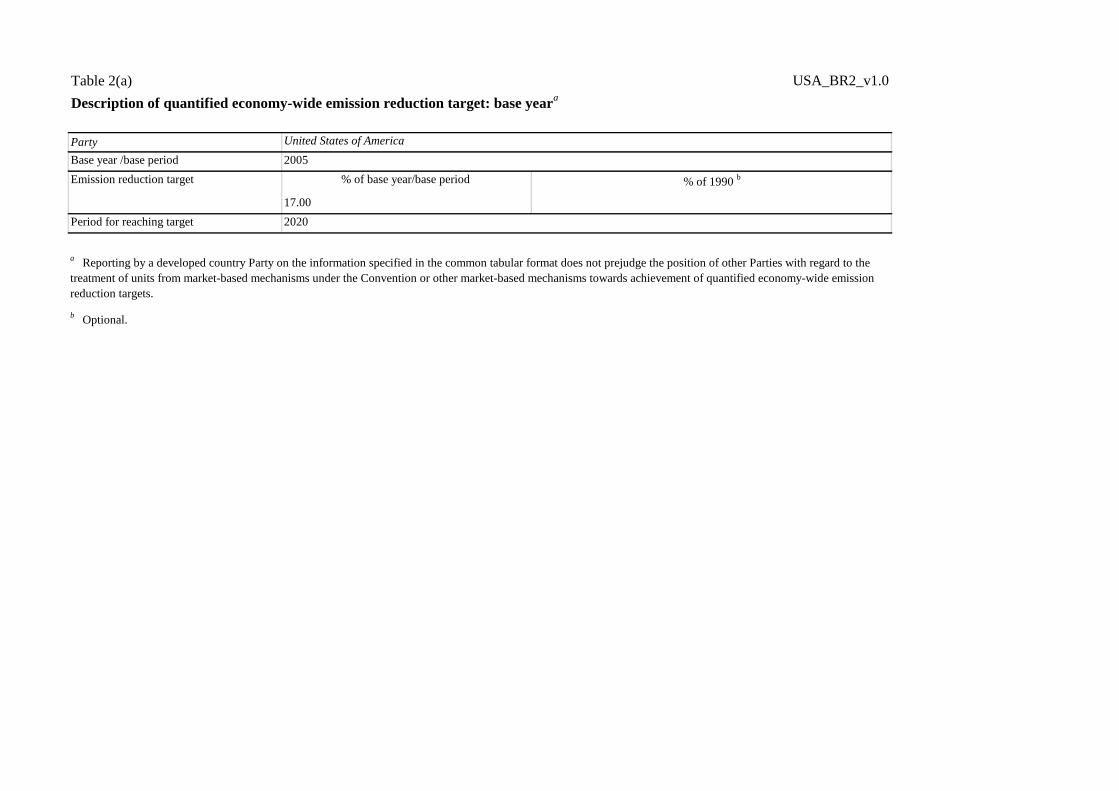
Table 2(a) USA_BR2_v1.0
Description of quantified economy-wide emission reduction target: base yeara
Party
Base year /base period
% of base year/base period % of 1990 b
17.00
Period for reaching target
b Optional.
United States of America
2005
2020
a Reporting by a developed country Party on the information specified in the common tabular format does not prejudge the position of other Parties with regard to the
treatment of units from market-based mechanisms under the Convention or other market-based mechanisms towards achievement of quantified economy-wide emission
reduction targets.
Emission reduction target
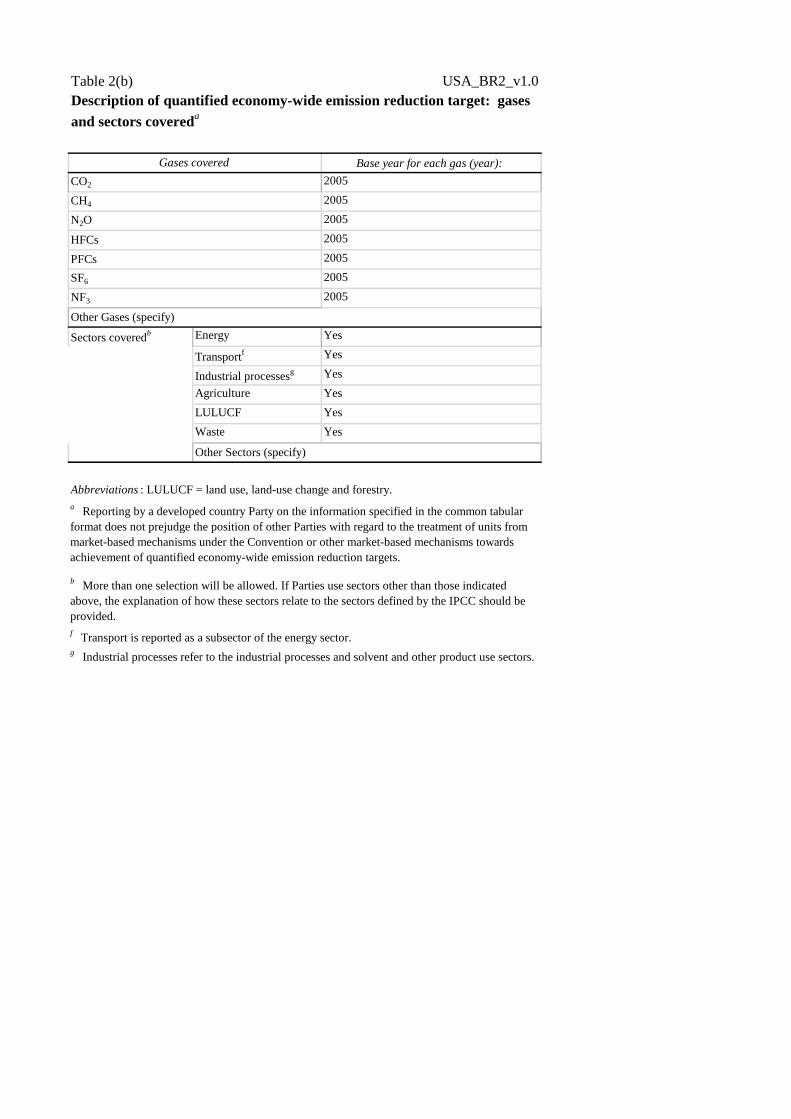
Table 2(b) USA_BR2_v1.0
Base year for each gas (year):
2005
2005
2005
2005
2005
2005
2005
Energy Yes
Transportf Yes
Industrial processesg Yes
Agriculture Yes
LULUCF Yes
Waste Yes
Abbreviations : LULUCF = land use, land-use change and forestry.
Sectors coveredb
b More than one selection will be allowed. If Parties use sectors other than those indicated
above, the explanation of how these sectors relate to the sectors defined by the IPCC should be
provided.
g Industrial processes refer to the industrial processes and solvent and other product use sectors.
a Reporting by a developed country Party on the information specified in the common tabular
format does not prejudge the position of other Parties with regard to the treatment of units from
market-based mechanisms under the Convention or other market-based mechanisms towards
achievement of quantified economy-wide emission reduction targets.
f Transport is reported as a subsector of the energy sector.
Description of quantified economy-wide emission reduction target: gases
and sectors covereda
Gases covered
CO2
CH4
N2O
HFCs
PFCs
SF6
NF3
Other Gases (specify)
Other Sectors (specify)

Table 2(c) USA_BR2_v1.0
Gases GWP values b
CO2 4th AR
CH4 4th AR
N2O 4th AR
HFCs 4th AR
PFCs 4th AR
SF6 4th AR
NF3 4th AR
Abbreviations : GWP = global warming potential
Description of quantified economy-wide emission reduction target: global
warming potential values (GWP)a
a Reporting by a developed country Party on the information specified in the common tabular format
does not prejudge the position of other Parties with regard to the treatment of units from market-based
mechanisms under the Convention or other market-based mechanisms towards achievement of
quantified economy-wide emission reduction targets.b
Please specify the reference for the GWP: Second Assessment Report of the Intergovernmental
Panel on Climate Change (IPCC) or the Fourth Assessment Report of the IPCC.
Other Gases (specify)

Table 2(d) USA_BR2_v1.0
Role of LULUCF LULUCF in base year level and target Included
Contribution of LULUCF is calculated using Land-based approach
Abbreviation : LULUCF = land use, land-use change and forestry.
a Reporting by a developed country Party on the information specified in the common tabular format does not prejudge the position of other Parties with regard to the
treatment of units from market-based mechanisms under the Convention or other market-based mechanisms towards achievement of quantified economy-wide emission
reduction targets.
Description of quantified economy-wide emission reduction target: approach to counting emissions and removals from the LULUCF
sectora
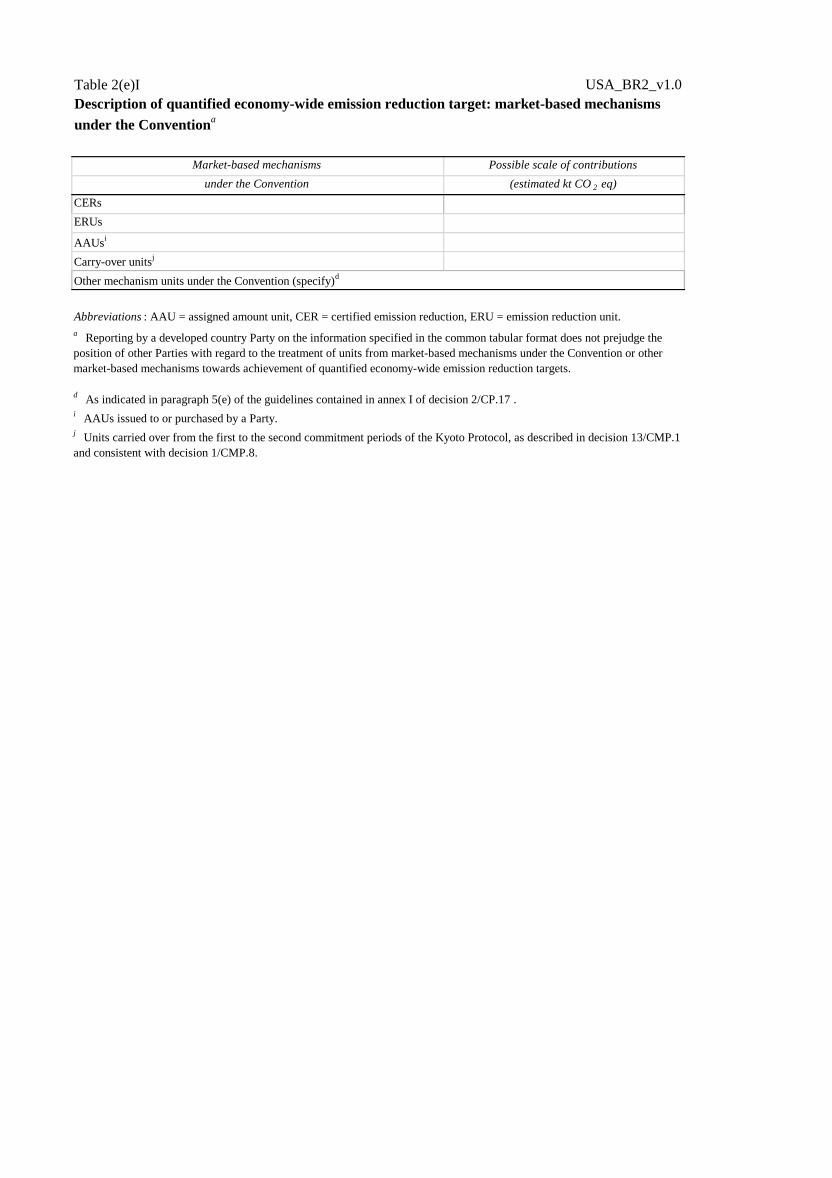
Table 2(e)I USA_BR2_v1.0
Market-based mechanisms Possible scale of contributions
under the Convention (estimated kt CO 2 eq)
CERs
ERUs
AAUsi
Carry-over unitsj
Abbreviations : AAU = assigned amount unit, CER = certified emission reduction, ERU = emission reduction unit.
i AAUs issued to or purchased by a Party.
j Units carried over from the first to the second commitment periods of the Kyoto Protocol, as described in decision 13/CMP.1
and consistent with decision 1/CMP.8.
a Reporting by a developed country Party on the information specified in the common tabular format does not prejudge the
position of other Parties with regard to the treatment of units from market-based mechanisms under the Convention or other
market-based mechanisms towards achievement of quantified economy-wide emission reduction targets.
d As indicated in paragraph 5(e) of the guidelines contained in annex I of decision 2/CP.17 .
Description of quantified economy-wide emission reduction target: market-based mechanisms
under the Conventiona
Other mechanism units under the Convention (specify)d
Table 2(e)II USA_BR2_v1.0
Other market-based mechanisms Possible scale of contributions
(Specify) (estimated kt CO 2 eq)
a Reporting by a developed country Party on the information specified in the common tabular format does not prejudge the position of
other Parties with regard to the treatment of units from market-based mechanisms under the Convention or other market-based
mechanisms towards achievement of quantified economy-wide emission reduction targets.
Description of quantified economy-wide emission reduction target: other market-based mechanismsa
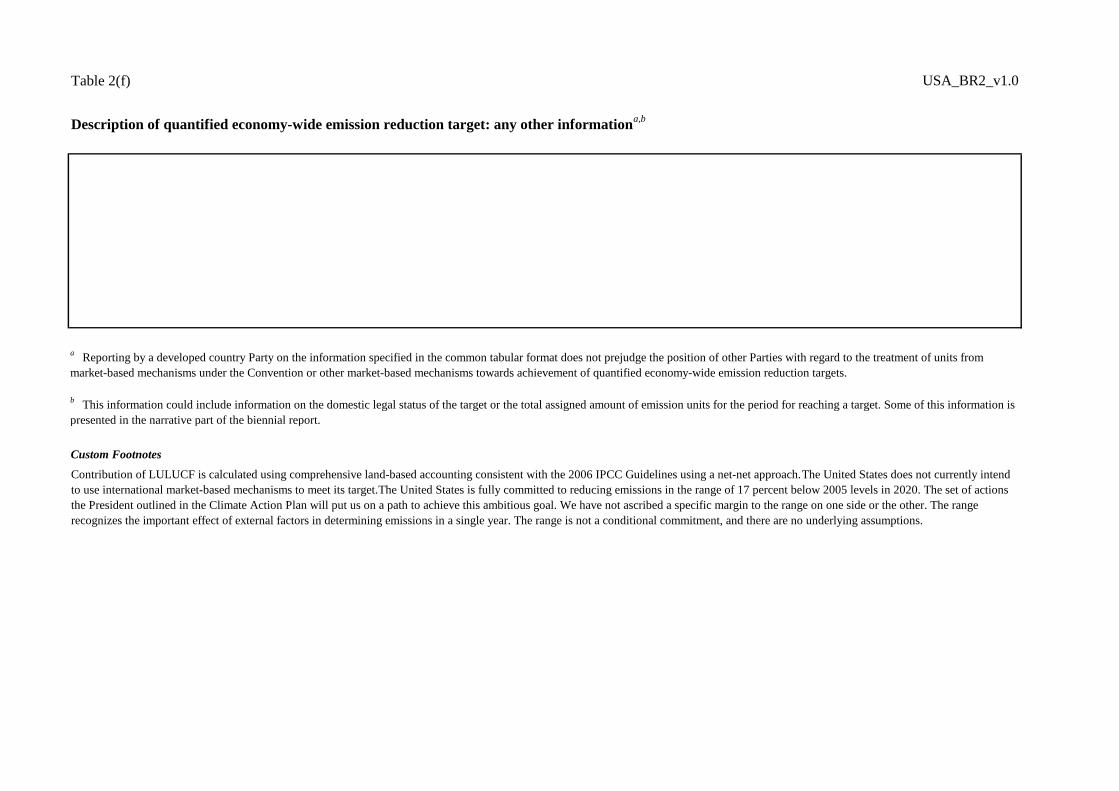
Table 2(f) USA_BR2_v1.0
Description of quantified economy-wide emission reduction target: any other informationa,b
Custom Footnotes
a Reporting by a developed country Party on the information specified in the common tabular format does not prejudge the position of other Parties with regard to the treatment of units from
market-based mechanisms under the Convention or other market-based mechanisms towards achievement of quantified economy-wide emission reduction targets.
b This information could include information on the domestic legal status of the target or the total assigned amount of emission units for the period for reaching a target. Some of this information is
presented in the narrative part of the biennial report.
Contribution of LULUCF is calculated using comprehensive land-based accounting consistent with the 2006 IPCC Guidelines using a net-net approach.The United States does not currently intend
to use international market-based mechanisms to meet its target.The United States is fully committed to reducing emissions in the range of 17 percent below 2005 levels in 2020. The set of actions
the President outlined in the Climate Action Plan will put us on a path to achieve this ambitious goal. We have not ascribed a specific margin to the range on one side or the other. The range
recognizes the important effect of external factors in determining emissions in a single year. The range is not a conditional commitment, and there are no underlying assumptions.

Table 3 USA_BR2_v1.0
Progress in achievement of the quantified economy-wide emission reduction target: information on mitigation actions and their effects
National Program for
Light-Duty Vehicle
GHG Emissions and
CAFE Standards*
Transport CO2, N2O,
CH4, HFCs
Reduce GHG emissions
from vehicles.
Regulatory Implemented Establishes corporate emissions fuel economy and GHG
emission standards for new light-duty vehicles (LDVs)
produced for sale in the U.S.
2010 DOT/EPA 236,000
Renewable Fuel
Standard*
Transport CO2 Increase use of renewable
fuels.
Regulatory Implemented Increases the share of renewable fuels used in
transportation via implementation of the Renewable Fuel
Standard Program.
2010 EPA 138,400
National Program for
Heavy-Duty Vehicle
GHG Emissions and
Fuel Efficiency
Standards*
Transport CO2, N2O,
CH4, HFCs
Reduce GHG emissions
from vehicles.
Regulatory Implemented Establishes fuel efficiency and GHG emission standards
for work trucks, buses, and other heavy-duty vehicles
(HDVs).
2011 DOT/EPA 37,700
SmartWay Transport
Partnership
Transport CO2 Reduce GHG emissions
from movement of goods.
Voluntary Agreement Implemented Promotes collaboration with businesses and other
stakeholders to decrease climate-related and other
emissions from movement of goods.
2004 EPA 43,000
Light-Duty Vehicle
Fuel Economy and
Environment Label
Transport CO2 Provide information to
vehicle buyers.
Other (Information) Implemented Provides comparable information on new LDVs’ fuel
economy, energy use, fuel costs, and environmental
impacts.
2011 EPA/DOT/DOE n/a
National Clean Diesel
Campaign
Transport CO2 Reduce diesel emissions. Other (Other
(Negotiated
Agreements))
Implemented Reduces diesel emissions through the implementation of
proven emission control technologies and innovative
strategies.
2008 EPA n/a
Advanced Technology
Vehicle Manufacturing
Loan Program
Transport CO2 Provide loans to
advanced vehicle
technology
manufacturers,
Economic Implemented Provides direct loans to qualifying U.S. advanced
technology vehicles or component and engineering
integration projects.
2008 DOE 2,500
Next Generation Air
Transportation Systems
Transport CO2 Reduce GHG emissions
from the aviation sector.
Other (Research) Implemented Achieves more efficient aircraft operations and reduced
GHG emissions through airspace, operational, and
infrastructure improvements. The Continuous Lower
Energy, Emissions, and Noise Program is an element of
NextGen.
2004 DOT 1,500
Other Aviation Low-
Emission, Fuel
Efficiency, and
Renewable Fuels
Measures
Transport CO2 Reduce GHG emissions
from the aviation sector.
Economic|Voluntary
Agreement|Research
Implemented Implements strategies that reduce GHG emissions from the
aviation sector.
2004– 2006 DOT n/a
State and Alternative
Fuel Provider Fleet
Program*
Transport CO2 Require fleets to purchase
alternative fuel vehicles
(AFVs).
Regulatory Implemented Requires covered fleets either to acquire AFVs as a
percentage of their annual LDV acquisitions or to employ
other petroleumreduction methods.
1992 DOE n/a
Federal Transit,
Highway, and Railway
Programs
Transport CO2 Reduce GHG emissions
from the transit and
railway sectors.
Fiscal|Voluntary
Agreement|Research
Implemented Helps public transportation providers, railways, and other
key stakeholders to implement strategies that reduce
GHGs.
1991– 2012 DOT n/a
Brief descriptione Start year of
implementation
Implementing entity or
entitiesName of mitigation action
a
Estimate of mitigation impact (not
cumulative, in kt CO 2 eq)Objective and/or activity
affectedType of instrument
cStatus of
implementationd
Sector(s)
affectedb
GHG(s)
affected
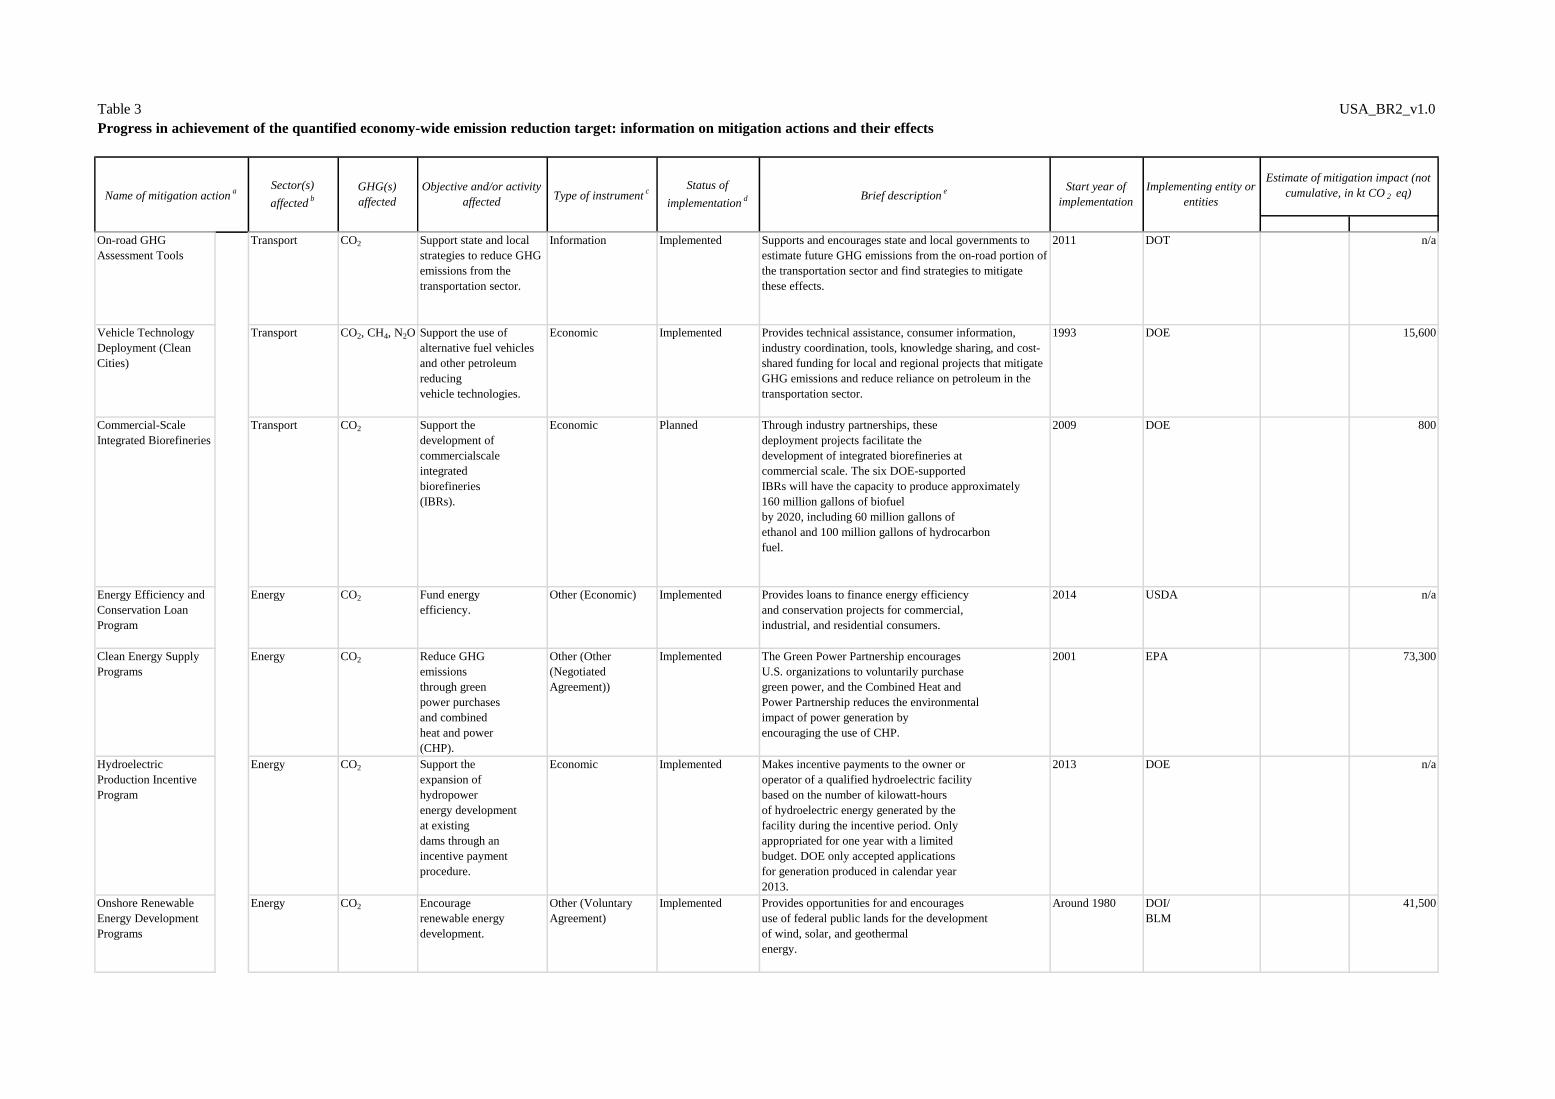
Table 3 USA_BR2_v1.0
Progress in achievement of the quantified economy-wide emission reduction target: information on mitigation actions and their effects
Brief descriptione Start year of
implementation
Implementing entity or
entitiesName of mitigation action
a
Estimate of mitigation impact (not
cumulative, in kt CO 2 eq)Objective and/or activity
affectedType of instrument
cStatus of
implementationd
Sector(s)
affectedb
GHG(s)
affected
On-road GHG
Assessment Tools
Transport CO2 Support state and local
strategies to reduce GHG
emissions from the
transportation sector.
Information Implemented Supports and encourages state and local governments to
estimate future GHG emissions from the on-road portion of
the transportation sector and find strategies to mitigate
these effects.
2011 DOT n/a
Vehicle Technology
Deployment (Clean
Cities)
Transport CO2, CH4, N2O Support the use of
alternative fuel vehicles
and other petroleum
reducing
vehicle technologies.
Economic Implemented Provides technical assistance, consumer information,
industry coordination, tools, knowledge sharing, and cost-
shared funding for local and regional projects that mitigate
GHG emissions and reduce reliance on petroleum in the
transportation sector.
1993 DOE 15,600
Commercial-Scale
Integrated Biorefineries
Transport CO2 Support the
development of
commercialscale
integrated
biorefineries
(IBRs).
Economic Planned Through industry partnerships, these
deployment projects facilitate the
development of integrated biorefineries at
commercial scale. The six DOE-supported
IBRs will have the capacity to produce approximately
160 million gallons of biofuel
by 2020, including 60 million gallons of
ethanol and 100 million gallons of hydrocarbon
fuel.
2009 DOE 800
Energy Efficiency and
Conservation Loan
Program
Energy CO2 Fund energy
efficiency.
Other (Economic) Implemented Provides loans to finance energy efficiency
and conservation projects for commercial,
industrial, and residential consumers.
2014 USDA n/a
Clean Energy Supply
Programs
Energy CO2 Reduce GHG
emissions
through green
power purchases
and combined
heat and power
(CHP).
Other (Other
(Negotiated
Agreement))
Implemented The Green Power Partnership encourages
U.S. organizations to voluntarily purchase
green power, and the Combined Heat and
Power Partnership reduces the environmental
impact of power generation by
encouraging the use of CHP.
2001 EPA 73,300
Hydroelectric
Production Incentive
Program
Energy CO2 Support the
expansion of
hydropower
energy development
at existing
dams through an
incentive payment
procedure.
Economic Implemented Makes incentive payments to the owner or
operator of a qualified hydroelectric facility
based on the number of kilowatt-hours
of hydroelectric energy generated by the
facility during the incentive period. Only
appropriated for one year with a limited
budget. DOE only accepted applications
for generation produced in calendar year
2013.
2013 DOE n/a
Onshore Renewable
Energy Development
Programs
Energy CO2 Encourage
renewable energy
development.
Other (Voluntary
Agreement)
Implemented Provides opportunities for and encourages
use of federal public lands for the development
of wind, solar, and geothermal
energy.
Around 1980 DOI/
BLM
41,500

Table 3 USA_BR2_v1.0
Progress in achievement of the quantified economy-wide emission reduction target: information on mitigation actions and their effects
Brief descriptione Start year of
implementation
Implementing entity or
entitiesName of mitigation action
a
Estimate of mitigation impact (not
cumulative, in kt CO 2 eq)Objective and/or activity
affectedType of instrument
cStatus of
implementationd
Sector(s)
affectedb
GHG(s)
affected
Rural Energy for
America Program
Energy CO2, CH4 Fund energy
efficiency and
renewable energy
systems.
Other (Economic) Implemented Provides grants and loan guarantees
to various rural residents, agricultural
producers, and rural businesses for energy
efficiency and renewable energy systems.
2008 USDA 17,500
CCS Demonstration
and Large-Scale
Geologic Storage
Cooperative
Agreements
Energy CO2 Fund expansion of
biofuels.
Economic Implemented Supports expansion of biofuels by providing
payments to biorefineries and biofuel
producers, and providing loan guarantees
for biorefineries. Programs include the
Bioenergy Program for Advanced Biofuels,
Biorefinery Assistance Program, and
Repowering Assistance Program.
2009 USDA 17,250
Biofuel Regional
Feedstock Partnerships
Energy CO2 Support supply
of biomass feedstocks.
Economic Implemented Identifies and analyzes feedstock supply
and regional logistics, and conducts crop
field trials to address barriers to the development
of a sustainable and predictable
supply of biomass feedstocks.
2002 DOE n/a
Offshore Renewable
Energy
Program—Bureau of
Ocean Energy
Management*
Energy CO2 Encourage
renewable energy
development.
Regulatory Implemented Advances a sustainable Outer Continental
Shelf renewable energy future through site
planning and environmentally responsible
operations and energy generation.
2009 DOI/
BOEM
n/a
Enhanced Geothermal
Systems Demonstration
Projects
Energy CO2 Support the
development
and deployment
of enhanced
geothermal
systems through
demonstration
project funding.
Other (Deployment) Implemented Shares implementation models among
participants, including state and local governments,
as a part of its broader efforts.
n/a DOE n/a
Clean Power Plan* Energy CO2 Reduce carbon
pollution from
new and existing
power plants.
Regulatory Adopted Sets GHG standards for existing and new
fossil fuel-fired electric generating units
(under section 111 of the Clean Air Act),
and for existing plants also sets forth
state-specific emission goals reflecting the
emission standards, along with guidelines
for the development, submittal, and
implementation of state plans to achieve
the CO2 emission standards.
2022 EPA, states,
and tribal
lands
n/a

Table 3 USA_BR2_v1.0
Progress in achievement of the quantified economy-wide emission reduction target: information on mitigation actions and their effects
Brief descriptione Start year of
implementation
Implementing entity or
entitiesName of mitigation action
a
Estimate of mitigation impact (not
cumulative, in kt CO 2 eq)Objective and/or activity
affectedType of instrument
cStatus of
implementationd
Sector(s)
affectedb
GHG(s)
affected
Offshore Wind
Demonstration Projects
Energy CO2 Support the
development
and deployment
of offshore wind
energy systems
through demonstration
project
funding.
Other (Deployment) Implemented Designed to reduce the cost of offshore
wind energy through the development
and deployment of innovative technologies,
in order to develop offshore wind
systems ready for commercial operation in
U.S. waters. The demonstrations will help
address key challenges associated with
installing full-scale offshore wind turbines,
connecting offshore turbines to the power
grid, and navigating new permitting and
approval processes.
2012 DOE n/a
Regional Carbon
Sequestration
Partnerships (RCSPs)
Energy CO2 Support largescale
field tests
for validating
basic science
approaches to
geologic carbon
storage.
Economic Implemented RCSPs are tasked to determine the best
geologic storage approaches and apply
technologies to safely and permanently
store CO2 for their specific regions.
Geographical differences in fossil fuel use
and storage opportunities across North
America dictate regional approaches
to storage of CO2 and other GHGs. The
RCSPs are focusing on the carbon capture
and storage opportunities within their specific
regions, while collectively building an
effective and robust nationwide initiative.
2008 DOE n/a
Appliance, Equipment,
and Lighting Energy
Efficiency Standards*
Energy CO2 Establish
minimum energy
conservation
requirements.
Regulatory Implemented Establishes minimum energy conservation
standards for more than 60 categories of
appliances and equipment.
1987 DOE 216,000
ENERGY STAR
Labeled Products
Energy CO2 Reduce GHG
emissions
through energy efficient
products.
Voluntary Agreement Implemented Labels distinguish energy-efficient products
in the marketplace.
1992 EPA/
DOE
141,200
ENERGY STAR
Commercial Buildings
Energy CO2 Reduce GHG
emissions
through energy efficient
buildings.
Voluntary Agreement Implemented Promotes improvement in energy performance
in commercial buildings.
1995 EPA 93,500
ENERGY STAR for
Industry
Energy CO2 Reduce GHG
emissions
through energy efficient
industrial
plants.
Voluntary Agreement Implemented Promotes improvement in energy performance
across industry.
1995 EPA 36,600
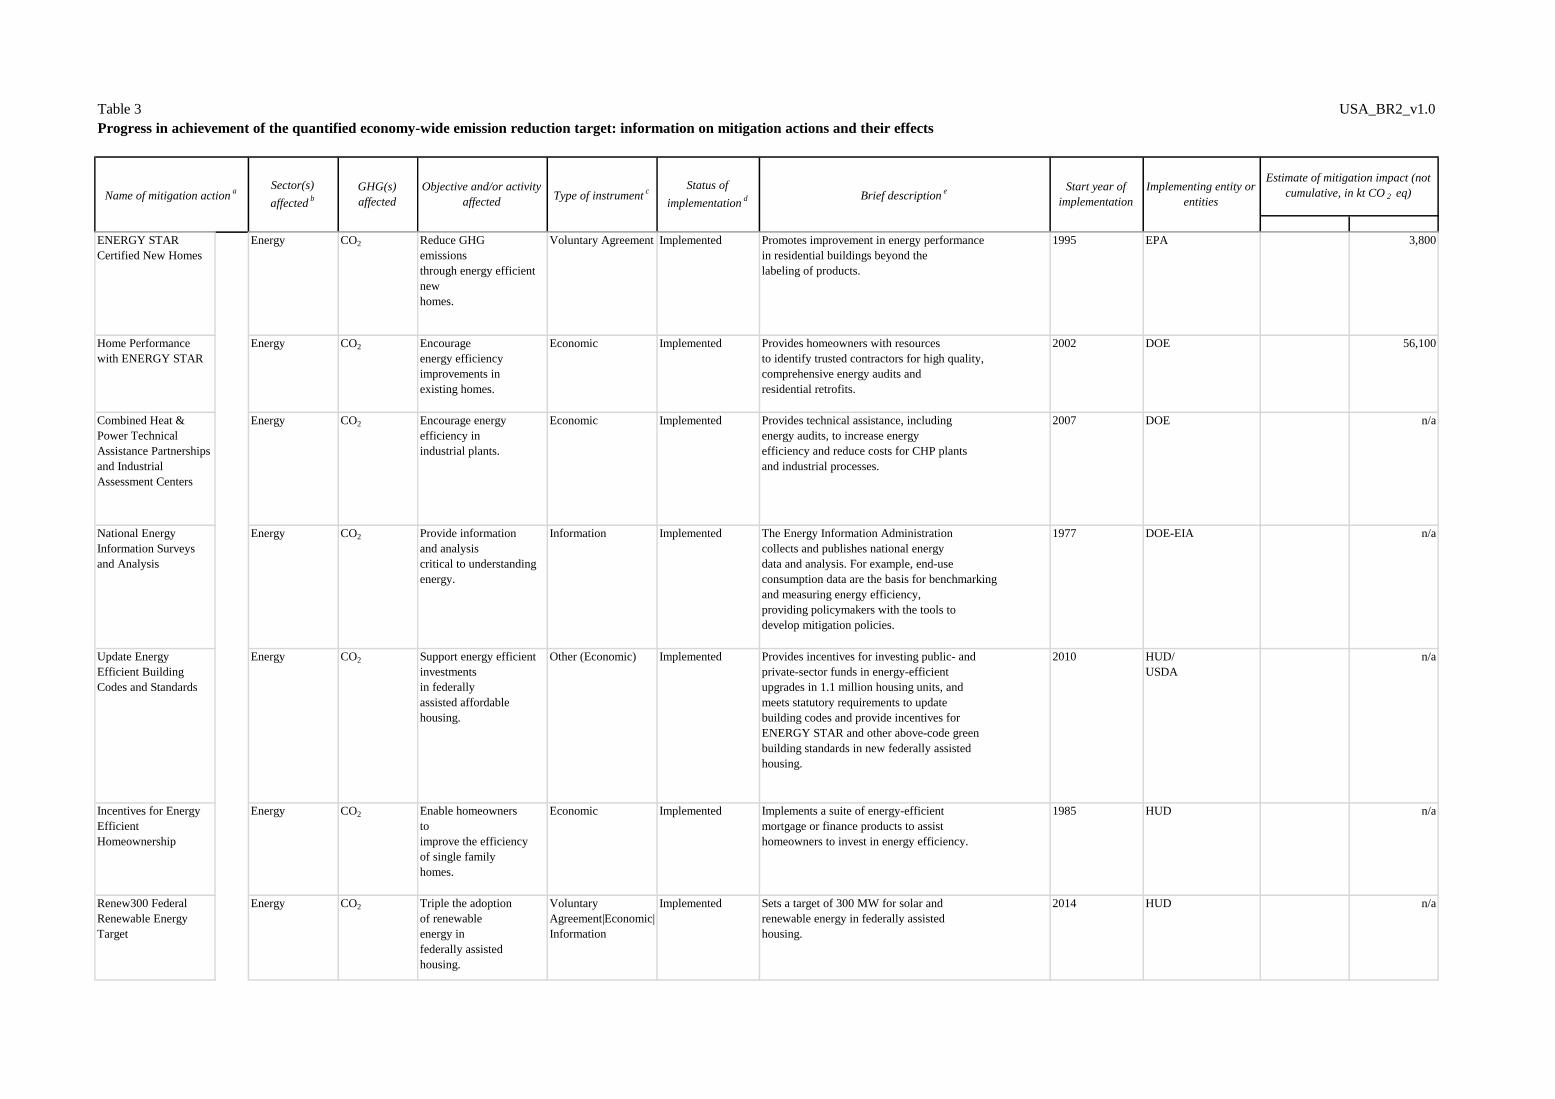
Table 3 USA_BR2_v1.0
Progress in achievement of the quantified economy-wide emission reduction target: information on mitigation actions and their effects
Brief descriptione Start year of
implementation
Implementing entity or
entitiesName of mitigation action
a
Estimate of mitigation impact (not
cumulative, in kt CO 2 eq)Objective and/or activity
affectedType of instrument
cStatus of
implementationd
Sector(s)
affectedb
GHG(s)
affected
ENERGY STAR
Certified New Homes
Energy CO2 Reduce GHG
emissions
through energy efficient
new
homes.
Voluntary Agreement Implemented Promotes improvement in energy performance
in residential buildings beyond the
labeling of products.
1995 EPA 3,800
Home Performance
with ENERGY STAR
Energy CO2 Encourage
energy efficiency
improvements in
existing homes.
Economic Implemented Provides homeowners with resources
to identify trusted contractors for high quality,
comprehensive energy audits and
residential retrofits.
2002 DOE 56,100
Combined Heat &
Power Technical
Assistance Partnerships
and Industrial
Assessment Centers
Energy CO2 Encourage energy
efficiency in
industrial plants.
Economic Implemented Provides technical assistance, including
energy audits, to increase energy
efficiency and reduce costs for CHP plants
and industrial processes.
2007 DOE n/a
National Energy
Information Surveys
and Analysis
Energy CO2 Provide information
and analysis
critical to understanding
energy.
Information Implemented The Energy Information Administration
collects and publishes national energy
data and analysis. For example, end-use
consumption data are the basis for benchmarking
and measuring energy efficiency,
providing policymakers with the tools to
develop mitigation policies.
1977 DOE-EIA n/a
Update Energy
Efficient Building
Codes and Standards
Energy CO2 Support energy efficient
investments
in federally
assisted affordable
housing.
Other (Economic) Implemented Provides incentives for investing public- and
private-sector funds in energy-efficient
upgrades in 1.1 million housing units, and
meets statutory requirements to update
building codes and provide incentives for
ENERGY STAR and other above-code green
building standards in new federally assisted
housing.
2010 HUD/
USDA
n/a
Incentives for Energy
Efficient
Homeownership
Energy CO2 Enable homeowners
to
improve the efficiency
of single family
homes.
Economic Implemented Implements a suite of energy-efficient
mortgage or finance products to assist
homeowners to invest in energy efficiency.
1985 HUD n/a
Renew300 Federal
Renewable Energy
Target
Energy CO2 Triple the adoption
of renewable
energy in
federally assisted
housing.
Voluntary
Agreement|Economic|
Information
Implemented Sets a target of 300 MW for solar and
renewable energy in federally assisted
housing.
2014 HUD n/a
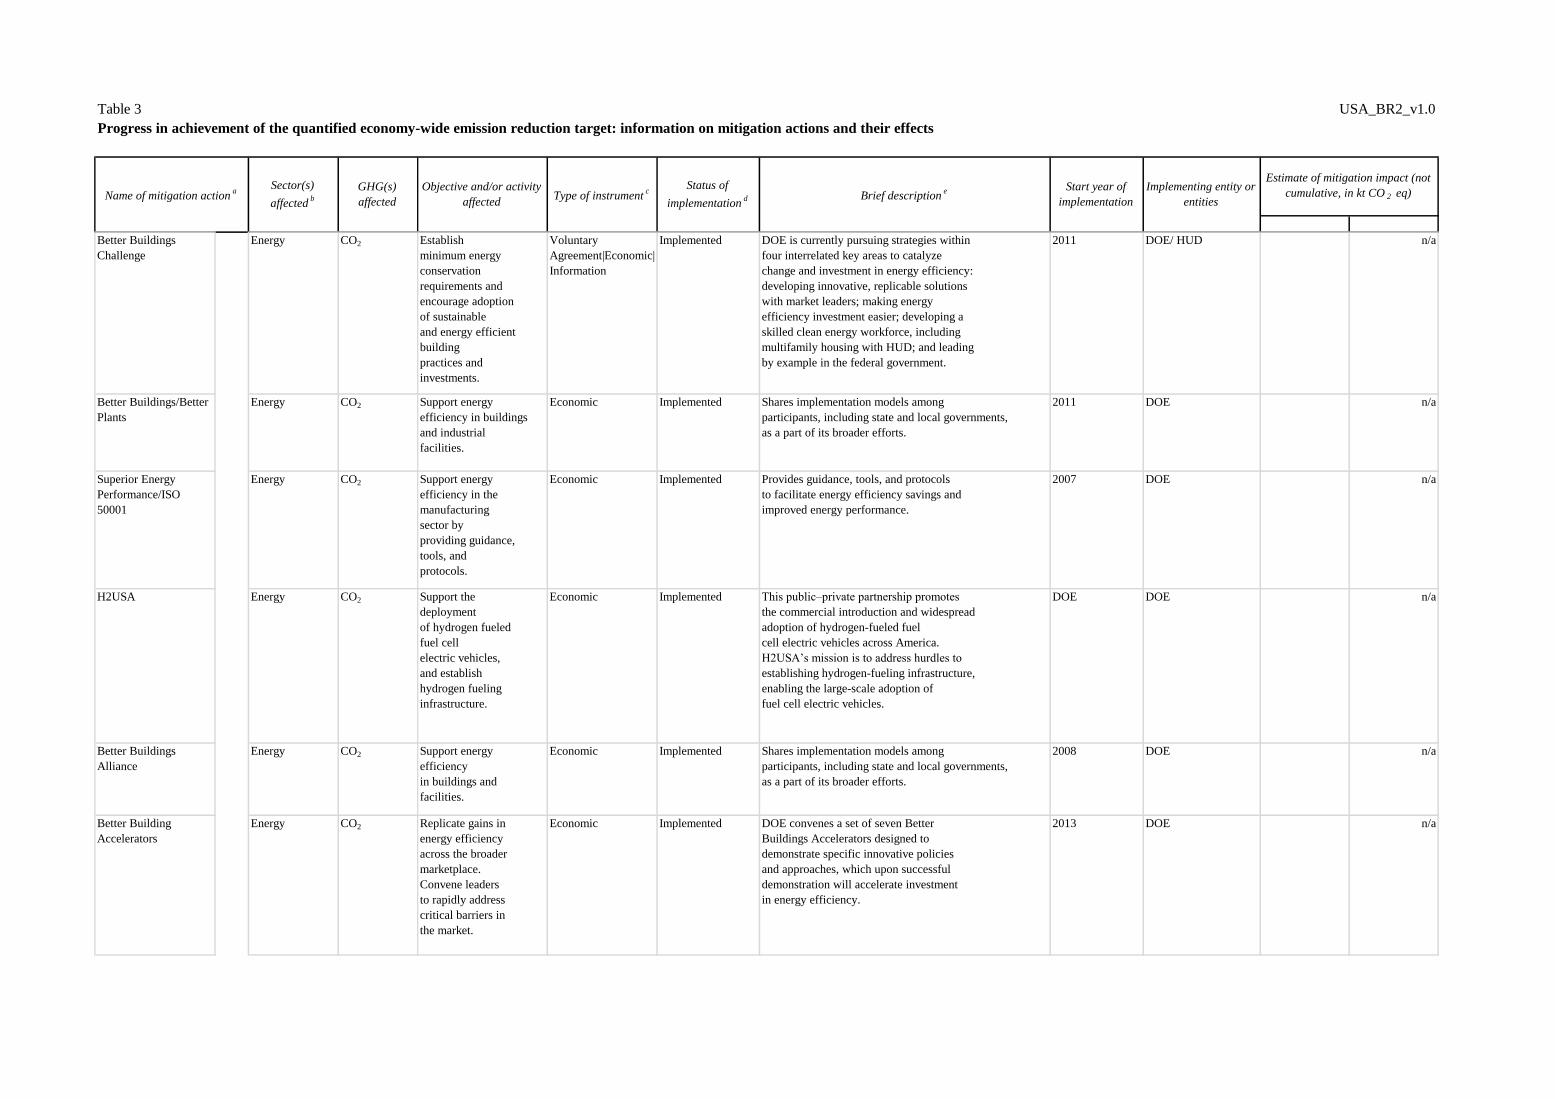
Table 3 USA_BR2_v1.0
Progress in achievement of the quantified economy-wide emission reduction target: information on mitigation actions and their effects
Brief descriptione Start year of
implementation
Implementing entity or
entitiesName of mitigation action
a
Estimate of mitigation impact (not
cumulative, in kt CO 2 eq)Objective and/or activity
affectedType of instrument
cStatus of
implementationd
Sector(s)
affectedb
GHG(s)
affected
Better Buildings
Challenge
Energy CO2 Establish
minimum energy
conservation
requirements and
encourage adoption
of sustainable
and energy efficient
building
practices and
investments.
Voluntary
Agreement|Economic|
Information
Implemented DOE is currently pursuing strategies within
four interrelated key areas to catalyze
change and investment in energy efficiency:
developing innovative, replicable solutions
with market leaders; making energy
efficiency investment easier; developing a
skilled clean energy workforce, including
multifamily housing with HUD; and leading
by example in the federal government.
2011 DOE/ HUD n/a
Better Buildings/Better
Plants
Energy CO2 Support energy
efficiency in buildings
and industrial
facilities.
Economic Implemented Shares implementation models among
participants, including state and local governments,
as a part of its broader efforts.
2011 DOE n/a
Superior Energy
Performance/ISO
50001
Energy CO2 Support energy
efficiency in the
manufacturing
sector by
providing guidance,
tools, and
protocols.
Economic Implemented Provides guidance, tools, and protocols
to facilitate energy efficiency savings and
improved energy performance.
2007 DOE n/a
H2USA Energy CO2 Support the
deployment
of hydrogen fueled
fuel cell
electric vehicles,
and establish
hydrogen fueling
infrastructure.
Economic Implemented This public–private partnership promotes
the commercial introduction and widespread
adoption of hydrogen-fueled fuel
cell electric vehicles across America.
H2USA’s mission is to address hurdles to
establishing hydrogen-fueling infrastructure,
enabling the large-scale adoption of
fuel cell electric vehicles.
DOE DOE n/a
Better Buildings
Alliance
Energy CO2 Support energy
efficiency
in buildings and
facilities.
Economic Implemented Shares implementation models among
participants, including state and local governments,
as a part of its broader efforts.
2008 DOE n/a
Better Building
Accelerators
Energy CO2 Replicate gains in
energy efficiency
across the broader
marketplace.
Convene leaders
to rapidly address
critical barriers in
the market.
Economic Implemented DOE convenes a set of seven Better
Buildings Accelerators designed to
demonstrate specific innovative policies
and approaches, which upon successful
demonstration will accelerate investment
in energy efficiency.
2013 DOE n/a
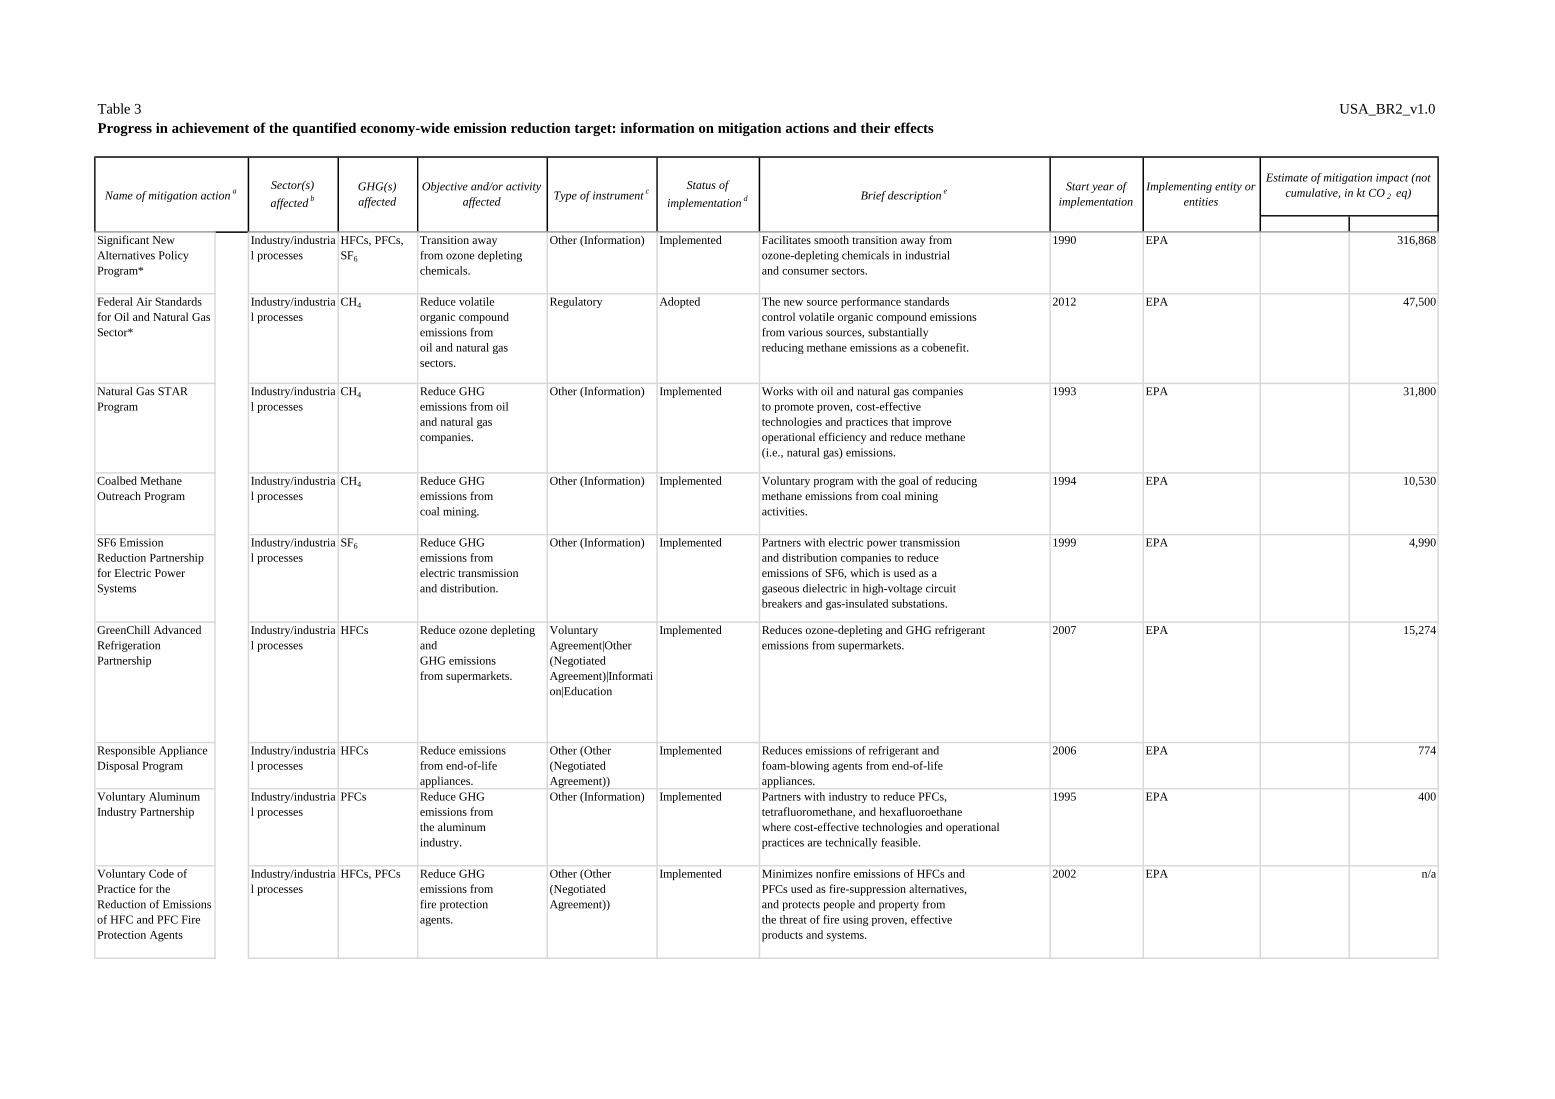
Table 3 USA_BR2_v1.0
Progress in achievement of the quantified economy-wide emission reduction target: information on mitigation actions and their effects
Brief descriptione Start year of
implementation
Implementing entity or
entitiesName of mitigation action
a
Estimate of mitigation impact (not
cumulative, in kt CO 2 eq)Objective and/or activity
affectedType of instrument
cStatus of
implementationd
Sector(s)
affectedb
GHG(s)
affected
Significant New
Alternatives Policy
Program*
Industry/industria
l processes
HFCs, PFCs,
SF6
Transition away
from ozone depleting
chemicals.
Other (Information) Implemented Facilitates smooth transition away from
ozone-depleting chemicals in industrial
and consumer sectors.
1990 EPA 316,868
Federal Air Standards
for Oil and Natural Gas
Sector*
Industry/industria
l processes
CH4 Reduce volatile
organic compound
emissions from
oil and natural gas
sectors.
Regulatory Adopted The new source performance standards
control volatile organic compound emissions
from various sources, substantially
reducing methane emissions as a cobenefit.
2012 EPA 47,500
Natural Gas STAR
Program
Industry/industria
l processes
CH4 Reduce GHG
emissions from oil
and natural gas
companies.
Other (Information) Implemented Works with oil and natural gas companies
to promote proven, cost-effective
technologies and practices that improve
operational efficiency and reduce methane
(i.e., natural gas) emissions.
1993 EPA 31,800
Coalbed Methane
Outreach Program
Industry/industria
l processes
CH4 Reduce GHG
emissions from
coal mining.
Other (Information) Implemented Voluntary program with the goal of reducing
methane emissions from coal mining
activities.
1994 EPA 10,530
SF6 Emission
Reduction Partnership
for Electric Power
Systems
Industry/industria
l processes
SF6 Reduce GHG
emissions from
electric transmission
and distribution.
Other (Information) Implemented Partners with electric power transmission
and distribution companies to reduce
emissions of SF6, which is used as a
gaseous dielectric in high-voltage circuit
breakers and gas-insulated substations.
1999 EPA 4,990
GreenChill Advanced
Refrigeration
Partnership
Industry/industria
l processes
HFCs Reduce ozone depleting
and
GHG emissions
from supermarkets.
Voluntary
Agreement|Other
(Negotiated
Agreement)|Informati
on|Education
Implemented Reduces ozone-depleting and GHG refrigerant
emissions from supermarkets.
2007 EPA 15,274
Responsible Appliance
Disposal Program
Industry/industria
l processes
HFCs Reduce emissions
from end-of-life
appliances.
Other (Other
(Negotiated
Agreement))
Implemented Reduces emissions of refrigerant and
foam-blowing agents from end-of-life
appliances.
2006 EPA 774
Voluntary Aluminum
Industry Partnership
Industry/industria
l processes
PFCs Reduce GHG
emissions from
the aluminum
industry.
Other (Information) Implemented Partners with industry to reduce PFCs,
tetrafluoromethane, and hexafluoroethane
where cost-effective technologies and operational
practices are technically feasible.
1995 EPA 400
Voluntary Code of
Practice for the
Reduction of Emissions
of HFC and PFC Fire
Protection Agents
Industry/industria
l processes
HFCs, PFCs Reduce GHG
emissions from
fire protection
agents.
Other (Other
(Negotiated
Agreement))
Implemented Minimizes nonfire emissions of HFCs and
PFCs used as fire-suppression alternatives,
and protects people and property from
the threat of fire using proven, effective
products and systems.
2002 EPA n/a
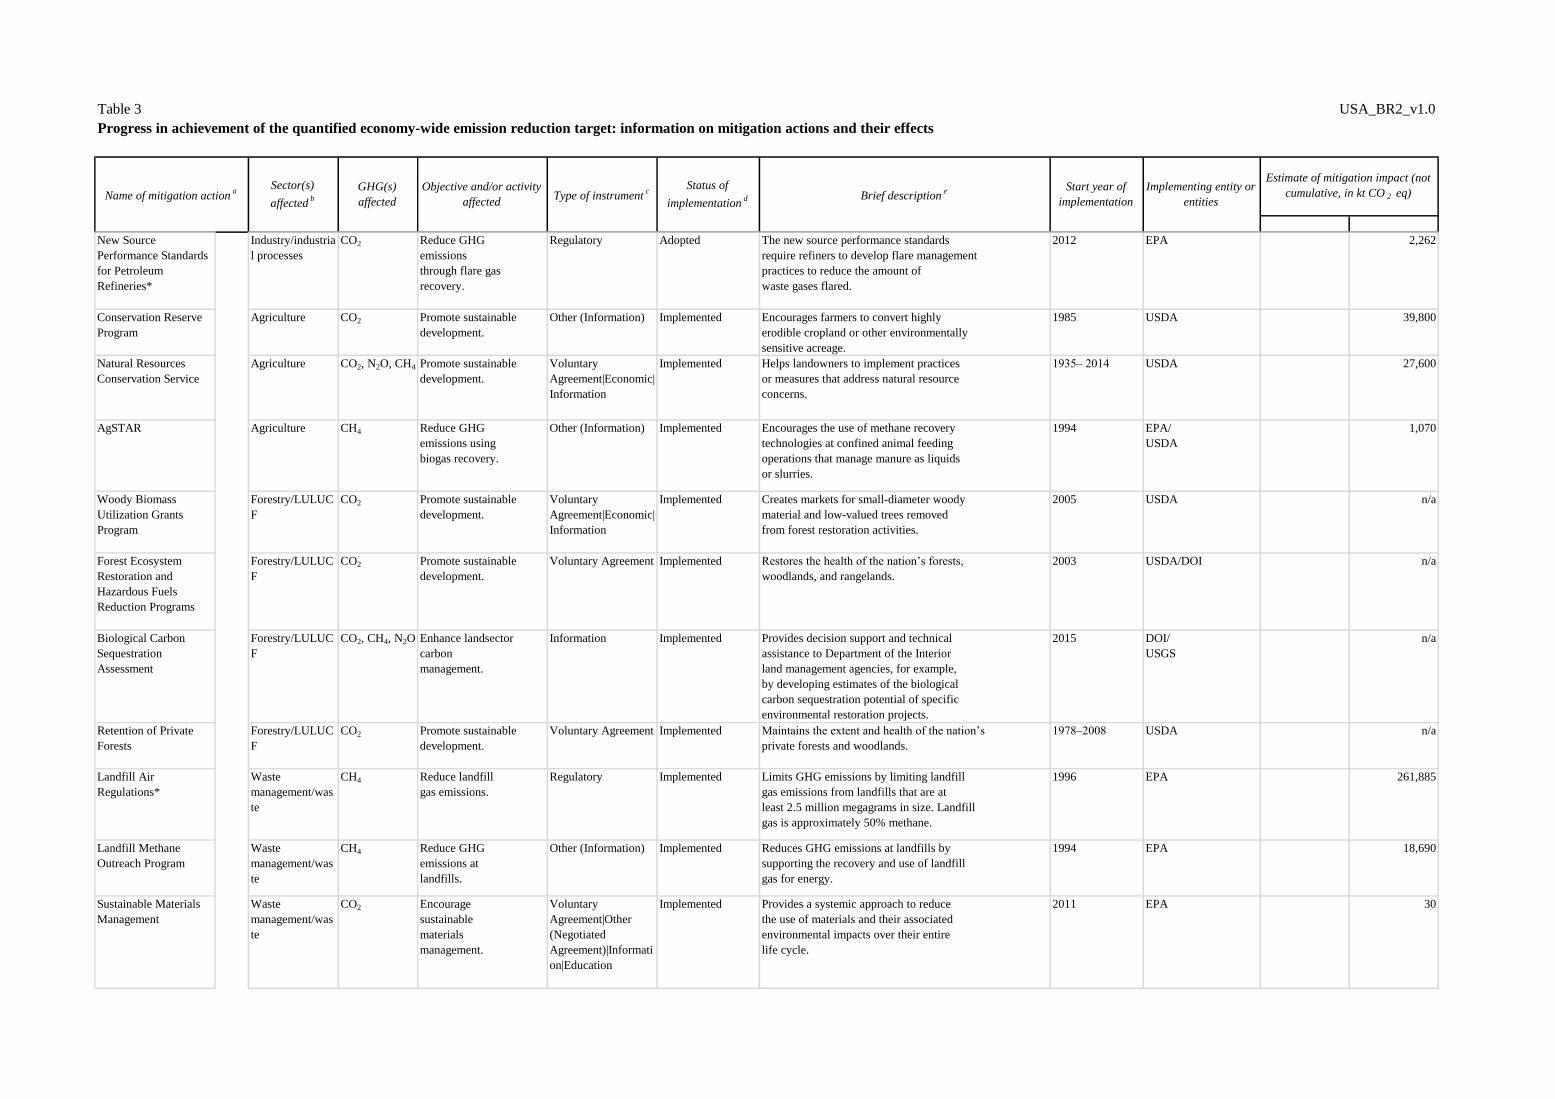
Table 3 USA_BR2_v1.0
Progress in achievement of the quantified economy-wide emission reduction target: information on mitigation actions and their effects
Brief descriptione Start year of
implementation
Implementing entity or
entitiesName of mitigation action
a
Estimate of mitigation impact (not
cumulative, in kt CO 2 eq)Objective and/or activity
affectedType of instrument
cStatus of
implementationd
Sector(s)
affectedb
GHG(s)
affected
New Source
Performance Standards
for Petroleum
Refineries*
Industry/industria
l processes
CO2 Reduce GHG
emissions
through flare gas
recovery.
Regulatory Adopted The new source performance standards
require refiners to develop flare management
practices to reduce the amount of
waste gases flared.
2012 EPA 2,262
Conservation Reserve
Program
Agriculture CO2 Promote sustainable
development.
Other (Information) Implemented Encourages farmers to convert highly
erodible cropland or other environmentally
sensitive acreage.
1985 USDA 39,800
Natural Resources
Conservation Service
Agriculture CO2, N2O, CH4 Promote sustainable
development.
Voluntary
Agreement|Economic|
Information
Implemented Helps landowners to implement practices
or measures that address natural resource
concerns.
1935– 2014 USDA 27,600
AgSTAR Agriculture CH4 Reduce GHG
emissions using
biogas recovery.
Other (Information) Implemented Encourages the use of methane recovery
technologies at confined animal feeding
operations that manage manure as liquids
or slurries.
1994 EPA/
USDA
1,070
Woody Biomass
Utilization Grants
Program
Forestry/LULUC
F
CO2 Promote sustainable
development.
Voluntary
Agreement|Economic|
Information
Implemented Creates markets for small-diameter woody
material and low-valued trees removed
from forest restoration activities.
2005 USDA n/a
Forest Ecosystem
Restoration and
Hazardous Fuels
Reduction Programs
Forestry/LULUC
F
CO2 Promote sustainable
development.
Voluntary Agreement Implemented Restores the health of the nation’s forests,
woodlands, and rangelands.
2003 USDA/DOI n/a
Biological Carbon
Sequestration
Assessment
Forestry/LULUC
F
CO2, CH4, N2O Enhance landsector
carbon
management.
Information Implemented Provides decision support and technical
assistance to Department of the Interior
land management agencies, for example,
by developing estimates of the biological
carbon sequestration potential of specific
environmental restoration projects.
2015 DOI/
USGS
n/a
Retention of Private
Forests
Forestry/LULUC
F
CO2 Promote sustainable
development.
Voluntary Agreement Implemented Maintains the extent and health of the nation’s
private forests and woodlands.
1978–2008 USDA n/a
Landfill Air
Regulations*
Waste
management/was
te
CH4 Reduce landfill
gas emissions.
Regulatory Implemented Limits GHG emissions by limiting landfill
gas emissions from landfills that are at
least 2.5 million megagrams in size. Landfill
gas is approximately 50% methane.
1996 EPA 261,885
Landfill Methane
Outreach Program
Waste
management/was
te
CH4 Reduce GHG
emissions at
landfills.
Other (Information) Implemented Reduces GHG emissions at landfills by
supporting the recovery and use of landfill
gas for energy.
1994 EPA 18,690
Sustainable Materials
Management
Waste
management/was
te
CO2 Encourage
sustainable
materials
management.
Voluntary
Agreement|Other
(Negotiated
Agreement)|Informati
on|Education
Implemented Provides a systemic approach to reduce
the use of materials and their associated
environmental impacts over their entire
life cycle.
2011 EPA 30

Table 3 USA_BR2_v1.0
Progress in achievement of the quantified economy-wide emission reduction target: information on mitigation actions and their effects
Brief descriptione Start year of
implementation
Implementing entity or
entitiesName of mitigation action
a
Estimate of mitigation impact (not
cumulative, in kt CO 2 eq)Objective and/or activity
affectedType of instrument
cStatus of
implementationd
Sector(s)
affectedb
GHG(s)
affected
Wastewise Waste
management/was
te
CO2 Encourage
sustainable
materials
management.
Voluntary
Agreement|Other
(Negotiated
Agreement)|Informati
on|Education
Implemented Helps organizations and businesses
apply sustainable material management
practices to reduce municipal and select
industrial wastes.
1994 EPA n/a
Federal Energy
Management Program*
Other (Federal
Government)
CO2 Promote energy
efficiency and
renewable energy
in federal facilities.
Regulatory Implemented Promotes energy efficiency and renewable
energy use in federal buildings, facilities,
and operations.
2008 DOE 14,400
National Park Service
Programs
Other (Federal
Government)
CO2 Promote climate
mitigation and
sustainable
practices at
national parks.
Economic|Voluntary
Agreement|Education
Implemented Supports efforts to mitigate the effects of
climate change and integrate sustainable
practices.
2003–2012 DOI/
NPS
200
State Energy Program Cross-cutting CO2 Fund energy
efficiency and
renewable energy
state programs.
Economic Implemented Provides funding to state energy offices
to reduce market barriers to the costeffective
adoption of renewable energy
and energy efficiency technologies.
1977 DOE 16,200
Energy Efficiency and
Conservation Block
Grants
Cross-cutting CO2 Fund energy
efficiency and
renewable energy
local programs.
Economic Implemented Assists eligible entities in implementing
strategies that will improve energy
efficiency in the transportation, building,
and other sectors, and reduce fossil fuel
emissions and total energy use.
2009 DOE 4,400
Section 1703/1705
Loan Guarantee
Program
Cross-cutting CO2 Mitigate risks
related to innovative
advanced
technology
investments.
Economic Implemented Mitigates the financing risks associated
with innovative and, in the case of the
Section 1705 Program, some commercial
energy projects.
2009 DOE 14,000
Weatherization
Assistance Program
Cross-cutting CO2, CH4, N2O Fund weatherization
services
for low-income
households.
Economic Implemented Provides funding and technical support to
states, U.S. territories, and tribes, which
in turn work with a network of about 900
local agencies to provide trained crews
to perform residential weatherization
services for income-eligible households.
1977 DOE 2,200
Indian Energy Policy
and Programs/Tribal
Energy Program
Cross-cutting CO2 Fund energy
efficiency and
renewable
energy produced
by tribes.
Economic Implemented Provides financial and technical assistance
that enables American Indian and Alaska
Native tribes to deploy renewable energy
resources, reduce their energy costs through
efficiency and weatherization, and increase
energy security for tribes and villages.
2002 DOE 400

Table 3 USA_BR2_v1.0
Progress in achievement of the quantified economy-wide emission reduction target: information on mitigation actions and their effects
Brief descriptione Start year of
implementation
Implementing entity or
entitiesName of mitigation action
a
Estimate of mitigation impact (not
cumulative, in kt CO 2 eq)Objective and/or activity
affectedType of instrument
cStatus of
implementationd
Sector(s)
affectedb
GHG(s)
affected
Climate Showcase
Communities Program
Cross-cutting CO2, CH4 Support local
and tribal GHG
emissionreduction
projects.
Information Implemented EPA helps local and tribal governments
take steps to reduce GHG emissions by
leveraging lessons learned and best practices
from the $20 million grants awarded
in 2009 and 2010.
2009 EPA 400
Community Renewable
Energy Deployment
Grants
Cross-cutting CO2 Fund small
renewable energy
projects.
Economic Implemented Creates up to a 50% matching grant
for the construction of small renewable
energy projects that will have commercial
electrical generation capacity of less
than 15 MW. Types of renewable energy
sources include solar, wind, geothermal,
ocean, biomass, and landfill gas.
2009 DOE n/a
Tax Provisions* Cross-cutting CO2 Provide incentives
for investments
that may reduce
GHG emissions.
Economic Adopted Provides incentives for AFVs and renewable/
alternative energy production. Encourages
energy conservation, production
of renewable energy and energy efficiency
manufacturing projects, and carbon sequestration.
These provisions include the
Production Tax Credit and Investment Tax
Credit, which provide support for deployment
of renewable energy supply.
1992 Treasury n/a
Interagency Partnership
for Sustainable
Communities
Cross-cutting CO2, CH4,
HFCs, N2O,
NF3, PFCs, SF6
Support energyefficient
land use
and sustainability
through
cross-agency
coordination.
Voluntary
Agreement|Economic|
Information
Implemented Helps communities create walkable,
healthy, economically vibrant neighborhoods
by aligning federal policies for housing,
transportation, and the environment.
2009 EPA/DOT/
HUD
n/a
Center for Corporate
Climate Leadership
Cross-cutting CO2, CH4,
HFCs, N2O,
NF3, PFCs, SF6
Support organization-
wide GHG
measurement and
management.
Information Implemented Serves as a resource center for organizations
interested in GHG measurement and
management.
2012 EPA n/a
Mandatory Greenhouse
Gas Reporting Program
Cross-cutting CO2, CH4,
HFCs, N2O,
PFCs, SF6
Collect accurate
and timely GHG
emissions data at
the facility level.
Other (Information) Implemented The GHG Reporting Rule requires reporting
of GHG emissions from 41 U.S. industry
groups that, in general, emit 25,000
metric tons or more of CO2e per year. The
reporting program covers 85–90% of total
U.S. emissions from approximately 8,000
facilities.
2009 EPA n/a

Table 3 USA_BR2_v1.0
Progress in achievement of the quantified economy-wide emission reduction target: information on mitigation actions and their effects
Brief descriptione Start year of
implementation
Implementing entity or
entitiesName of mitigation action
a
Estimate of mitigation impact (not
cumulative, in kt CO 2 eq)Objective and/or activity
affectedType of instrument
cStatus of
implementationd
Sector(s)
affectedb
GHG(s)
affected
Building Energy
Codes*
Energy CO2 Support energyefficient
building
codes.
Regulatory Implemented Develops cost-effective building energy
codes with adoption and compliance
strategies.
1992 DOE 56,100
Note : The two final columns specify the year identified by the Party for estimating impacts (based on the status of the measure and whether an ex post or ex ante estimation is available).
Abbreviations : GHG = greenhouse gas; LULUCF = land use, land-use change and forestry.
Custom Footnotes
f Optional year or years deemed relevant by the Party.
a Parties should use an asterisk (*) to indicate that a mitigation action is included in the ‘with measures’ projection.
b To the extent possible, the following sectors should be used: energy, transport, industry/industrial processes, agriculture, forestry/LULUCF, waste management/waste, other sectors, cross-cutting, as appropriate.
c To the extent possible, the following types of instrument should be used: economic, fiscal, voluntary agreement, regulatory, information, education, research, other.
d To the extent possible, the following descriptive terms should be used to report on the status of implementation: implemented, adopted, planned.
e Additional information may be provided on the cost of the mitigation actions and the relevant timescale.

Table 4 USA_BR2_v1.0
Reporting on progressa, b
Total emissions
excluding LULUCF
Contribution from
LULUCFd
Yearc (kt CO 2 eq) (kt CO 2 eq) (number of units) (kt CO 2 eq) (number of units) (kt CO 2 eq)
(2005)
2010
2011
2012
2013
2014
Abbreviation : GHG = greenhouse gas, LULUCF = land use, land-use change and forestry.
Custom Footnotes
All relevant information on the LULUCF contribution for the United States is contained in Biennial Report Table 1.
d Information in this column should be consistent with the information reported in table 4(a)I or 4(a)II, as appropriate. The Parties for which all relevant information on the LULUCF
contribution is reported in table 1 of this common tabular format can refer to table 1.
Quantity of units from other market based
mechanisms
Quantity of units from market based
mechanisms under the Convention
a Reporting by a developed country Party on the information specified in the common tabular format does not prejudge the position of other Parties with regard to the treatment of units
from market-based mechanisms under the Convention or other market-based mechanisms towards achievement of quantified economy-wide emission reduction targets.
b For the base year, information reported on the emission reduction target shall include the following: (a) total GHG emissions, excluding emissions and removals from the LULUCF sector;
(b) emissions and/or removals from the LULUCF sector based on the accounting approach applied taking into consideration any relevant decisions of the Conference of the Parties and the
activities and/or land that will be accounted for; (c) total GHG emissions, including emissions and removals from the LULUCF sector. For each reported year, information reported on
progress made towards the emission reduction targets shall include, in addition to the information noted in paragraphs 9(a–c) of the UNFCCC biennial reporting guidelines for developed
country Parties, information on the use of units from market-based mechanisms.c
Parties may add additional rows for years other than those specified below.

Table 4(a)I USA_BR2_v1.0
Net GHG
emissions/removals from
LULUCF categories c
Base year/period or
reference level value d
Contribution from
LULUCF for
reported year
Cumulative
contribution from
LULUCF e
Total LULUCF Land-based approach
A. Forest land Land-based approach
1. Forest land remaining forest land Land-based approach
2. Land converted to forest land Land-based approach
3. Other g Land-based approach
B. Cropland Land-based approach
1. Cropland remaining cropland Land-based approach
2. Land converted to cropland Land-based approach
3. Other g Land-based approach
C. Grassland Land-based approach
1. Grassland remaining grassland Land-based approach
2. Land converted to grassland Land-based approach
3. Other g Land-based approach
D. Wetlands Land-based approach
1. Wetland remaining wetland Land-based approach
2. Land converted to wetland Land-based approach
3. Other g Land-based approach
E. Settlements Land-based approach
1. Settlements remaining settlements Land-based approach
2. Land converted to settlements Land-based approach
3. Other g Land-based approach
F. Other land Land-based approach
1. Other land remaining other land Land-based approach
2. Land converted to other land Land-based approach
3. Other g Land-based approach
Harvested wood products Land-based approach
Abbreviations : GHG = greenhouse gas, LULUCF = land use, land-use change and forestry.
Custom Footnotes
All relevant information on the LULUCF contribution for the United States is contained in Biennial Report Table 1.
Progress in achieving the quantified economy-wide emission reduction targets – further information on mitigation actions relevant to the
contribution of the land use, land-use change and forestry sector in 2013 a,b
Accounting
approach f
(kt CO 2 eq)
f Label each accounting approach and indicate where additional information is provided within this biennial report explaining how it was implemented, including all relevant accounting
parameters (i.e. natural disturbances, caps).g
Specify what was used for the category “other”. Explain in this biennial report how each was defined and how it relates to the categories used for reporting under the Convention or its Kyoto
Protocol.
a Reporting by a developed country Party on the information specified in the common tabular format does not prejudge the position of other Parties with regard to the treatment of units from
market-based mechanisms under the Convention or other market-based mechanisms towards achievement of quantified economy-wide emission reduction targets.b
Parties that use the LULUCF approach that is based on table 1 do not need to complete this table, but should indicate the approach in table 2. Parties should fill in a separate table for each year,
namely 2011 and 2012, where 2014 is the reporting year.
c For each category, enter the net emissions or removals reported in the most recent inventory submission for the corresponding inventory year. If a category differs from that used for the
reporting under the Convention or its Kyoto Protocol, explain in the biennial report how the value was derived.d
Enter one reference level or base year/period value for each category. Explain in the biennial report how these values have been calculated.e
If applicable to the accounting approach chosen. Explain in this biennial report to which years or period the cumulative contribution refers to.

Table 4(a)I USA_BR2_v1.0
Net GHG
emissions/removals from
LULUCF categories c
Base year/period or
reference level value d
Contribution from
LULUCF for
reported year
Cumulative
contribution from
LULUCF e
Total LULUCF Land-based approach
A. Forest land Land-based approach
1. Forest land remaining forest land Land-based approach
2. Land converted to forest land Land-based approach
3. Other g Land-based approach
B. Cropland Land-based approach
1. Cropland remaining cropland Land-based approach
2. Land converted to cropland Land-based approach
3. Other g Land-based approach
C. Grassland Land-based approach
1. Grassland remaining grassland Land-based approach
2. Land converted to grassland Land-based approach
3. Other g Land-based approach
D. Wetlands Land-based approach
1. Wetland remaining wetland Land-based approach
2. Land converted to wetland Land-based approach
3. Other g Land-based approach
E. Settlements Land-based approach
1. Settlements remaining settlements Land-based approach
2. Land converted to settlements Land-based approach
3. Other g Land-based approach
F. Other land Land-based approach
1. Other land remaining other land Land-based approach
2. Land converted to other land Land-based approach
3. Other g Land-based approach
Harvested wood products Land-based approach
Abbreviations : GHG = greenhouse gas, LULUCF = land use, land-use change and forestry.
Custom Footnotes
All relevant information on the LULUCF contribution for the United States is contained in Biennial Report Table 1.
Progress in achieving the quantified economy-wide emission reduction targets – further information on mitigation actions relevant to the
contribution of the land use, land-use change and forestry sector in 2014 a, b
d Enter one reference level or base year/period value for each category. Explain in the biennial report how these values have been calculated.
e If applicable to the accounting approach chosen. Explain in this biennial report to which years or period the cumulative contribution refers to.
f Label each accounting approach and indicate where additional information is provided within this biennial report explaining how it was implemented, including all relevant accounting
parameters (i.e. natural disturbances, caps).g
Specify what was used for the category “other”. Explain in this biennial report how each was defined and how it relates to the categories used for reporting under the Convention or its Kyoto
Protocol.
Accounting
approach f
(kt CO 2 eq)
a Reporting by a developed country Party on the information specified in the common tabular format does not prejudge the position of other Parties with regard to the treatment of units from
market-based mechanisms under the Convention or other market-based mechanisms towards achievement of quantified economy-wide emission reduction targets.b
Parties that use the LULUCF approach that is based on table 1 do not need to complete this table, but should indicate the approach in table 2. Parties should fill in a separate table for each year,
namely 2011 and 2012, where 2014 is the reporting year.
c For each category, enter the net emissions or removals reported in the most recent inventory submission for the corresponding inventory year. If a category differs from that used for the
reporting under the Convention or its Kyoto Protocol, explain in the biennial report how the value was derived.

Table 4(b) USA_BR2_v1.0
Reporting on progressa, b, c
2013 2014
(number of units)
(kt CO 2 eq)
(number of units)
(kt CO2 eq)
(number of units)
(kt CO2 eq)
(number of units)
(kt CO2 eq)
(number of units)
(kt CO2 eq)
(number of units)
(kt CO2 eq)
(number of units)
(kt CO 2 eq)
(number of units)
(kt CO 2 eq)
(number of units)
(kt CO 2 eq)
c Parties may include this information, as appropriate and if relevant to their target.
d Units surrendered by that Party for that year that have not been previously surrendered by that or any other Party.
e Additional rows for each market-based mechanism should be added, if applicable.
Custom Footnotes
Other units d,e
Units of market based mechanismsYear
Units from market-based mechanisms under the
Convention
Units from other market-based mechanisms
Kyoto
Protocol
unitsd
Kyoto Protocol units
AAUs
ERUs
CERs
tCERs
lCERs
b For each reported year, information reported on progress made towards the emission reduction target shall include, in addition to the
information noted in paragraphs 9(a-c) of the reporting guidelines, on the use of units from market-based mechanisms.
Abbreviations : AAUs = assigned amount units, CERs = certified emission reductions, ERUs = emission reduction units, lCERs = long-term
certified emission reductions, tCERs = temporary certified emission reductions.
a Reporting by a developed country Party on the information specified in the common tabular format does not prejudge the position of other
Parties with regard to the treatment of units from market-based mechanisms under the Convention or other market-based mechanisms towards
achievement of quantified economy-wide emission reduction targets.
Total
Note: 2011 is the latest reporting year.

Table 5 USA_BR2_v1.0
Summary of key variables and assumptions used in the projections analysisa
Assumption Unit 1990 1995 2000 2005 2010 2011 2013 2015 2020 2025 2030
Population Millions 250.00 266.00 282.00 296.00 309.00 312.00 317.00 321.00 334.00 347.00 359.00
Real GDP Billion 2009
dollars
8,955.00 10,175.00 12,560.00 14,234.00 14,784.00 15,021.00 15,710.00 16,553.00 18,801.00 21,295.00 23,894.00
Total primary energy
consumption
Quadrillion Btu 84.50 91.00 98.80 100.20 97.50 96.80 97.10 97.90 100.50 100.80 100.30
Energy intensity Btu per chain-
weighted dollar
of GDP
9.40 8.90 7.90 7.00 6.60 6.40 6.20 5.90 5.40 4.80 4.20
Natural gas consumption Dry gas,
quadrillion Btu
19.60 22.70 23.80 22.60 24.60 25.00 26.80 27.30 26.10 27.30 29.80
Petroleum consumption Quadrillion Btu 33.60 34.40 38.30 40.30 35.50 35.90 34.60 36.10 37.00 36.70 36.10
Coal consumption Quadrillion Btu 19.20 20.10 22.60 22.80 20.80 19.60 18.00 18.10 17.00 15.80 12.80
Vehicle miles travelled, all
vehicles
Billion miles 2,144.00 2,423.00 2,747.00 2,989.00 2,967.00 2,863.00 2,979.00 3,086.00 3,305.00 3,506.00 3,721.00
b Parties should include historical data used to develop the greenhouse gas projections reported.
Custom Footnotes
Key underlying assumptions
a Parties should include key underlying assumptions as appropriate.
Historicalb Projected

Table 6(a) USA_BR2_v1.0
Information on updated greenhouse gas projections under a ‘with measures’ scenarioa
Base year
(2005)
1990 1995 2000 2005 2010 2013 2020 2030
Sectord,e
Energy 4,345,000.00 3,750,000.00 3,936,000.00 4,280,000.00 4,345,000.00 4,097,000.00 3,898,000.00 3,860,000.00 3,657,000.00
Transport 1,929,000.00 1,541,000.00 1,667,000.00 1,862,000.00 1,929,000.00 1,758,000.00 1,739,000.00 1,680,000.00 1,578,000.00
Industry/industrial processes 367,000.00 342,000.00 374,000.00 397,000.00 367,000.00 354,000.00 359,000.00 430,000.00 497,000.00
Agriculture 494,000.00 449,000.00 496,000.00 460,000.00 494,000.00 525,000.00 516,000.00 504,000.00 494,000.00
Forestry/LULUCF -887,000.00 -762,000.00 -739,000.00 -609,000.00 -887,000.00 -851,000.00 -859,000.00 -1,163,000.00 -1,090,000.00
Waste management/waste 189,000.00 206,000.00 207,000.00 182,000.00 189,000.00 145,000.00 138,000.00 138,000.00 137,000.00
Other (specify)
Gas
CO2 emissions including net CO2 from LULUCF 5,222,000.00 4,348,000.00 4,696,000.00 5,361,000.00 5,222,000.00 4,833,000.00 4,624,000.00 4,218,000.00 3,976,000.00
CO2 emissions excluding net CO2 from LULUCF 6,125,000.00 5,116,000.00 5,442,000.00 5,994,000.00 6,125,000.00 5,695,000.00 5,495,000.00 5,399,000.00 5,084,000.00
CH4 emissions including CH4 from LULUCF 708,000.00 745,000.00 750,000.00 716,000.00 708,000.00 667,000.00 636,000.00 670,000.00 682,000.00
CH4 emissions excluding CH4 from LULUCF 700,000.00 743,000.00 747,000.00 704,000.00 700,000.00 662,000.00 630,000.00 661,000.00 673,000.00
N2O emissions including N2O from LULUCF 356,000.00 330,000.00 372,000.00 335,000.00 356,000.00 360,000.00 355,000.00 338,000.00 334,000.00
N2O emissions excluding N2O from LULUCF 348,000.00 327,000.00 367,000.00 324,000.00 348,000.00 354,000.00 349,000.00 329,000.00 325,000.00
HFCs 131,000.00 47,000.00 77,000.00 125,000.00 131,000.00 153,000.00 163,000.00 211,000.00 265,000.00
PFCs 7,000.00 24,000.00 19,000.00 16,000.00 7,000.00 5,000.00 6,000.00 5,000.00 7,000.00
SF6 14,000.00 31,000.00 27,000.00 18,000.00 14,000.00 10,000.00 7,000.00 9,000.00 10,000.00
Other (specify)
Total with LULUCFf 6,438,000.00 5,525,000.00 5,941,000.00 6,571,000.00 6,438,000.00 6,028,000.00 5,791,000.00 5,451,000.00 5,274,000.00
Total without LULUCF 7,325,000.00 6,288,000.00 6,679,000.00 7,181,000.00 7,325,000.00 6,879,000.00 6,650,000.00 6,614,000.00 6,364,000.00
Abbreviations : GHG = greenhouse gas, LULUCF = land use, land-use change and forestry.
a In accordance with the “Guidelines for the preparation of national communications by Parties included in Annex I to the Convention, Part II: UNFCCC
reporting guidelines on national communications”, at a minimum Parties shall report a ‘with measures’ scenario, and may report ‘without measures’ and ‘with
additional measures’ scenarios. If a Party chooses to report ‘without measures’ and/or ‘with additional measures’ scenarios they are to use tables 6(b) and/or
6(c), respectively. If a Party does not choose to report ‘without measures’ or ‘with additional measures’ scenarios then it should not include tables 6(b) or 6(c) in
the biennial report.
(kt CO 2 eq) (kt CO2 eq)
GHG emission projectionsGHG emissions and removals
b
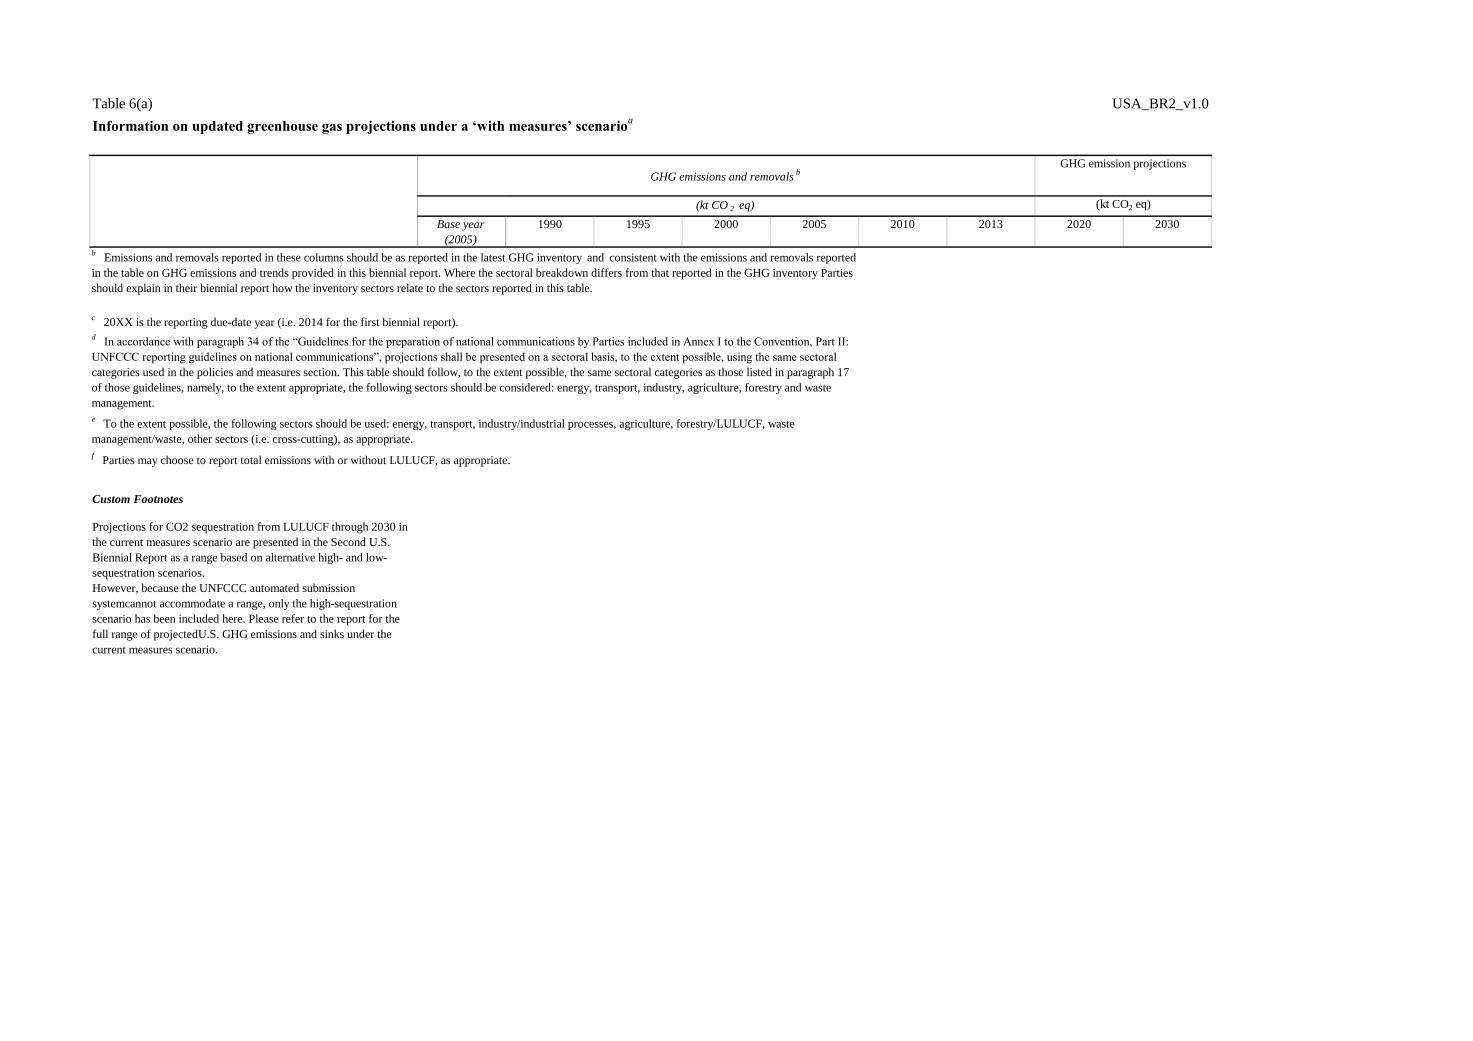
Table 6(a) USA_BR2_v1.0
Information on updated greenhouse gas projections under a ‘with measures’ scenarioa
Base year
(2005)
1990 1995 2000 2005 2010 2013 2020 2030
(kt CO 2 eq) (kt CO2 eq)
GHG emission projectionsGHG emissions and removals
b
Custom Footnotes
Projections for CO2 sequestration from LULUCF through 2030 in
the current measures scenario are presented in the Second U.S.
Biennial Report as a range based on alternative high- and low-
sequestration scenarios.
However, because the UNFCCC automated submission
systemcannot accommodate a range, only the high-sequestration
scenario has been included here. Please refer to the report for the
full range of projectedU.S. GHG emissions and sinks under the
current measures scenario.
c 20XX is the reporting due-date year (i.e. 2014 for the first biennial report).
b Emissions and removals reported in these columns should be as reported in the latest GHG inventory and consistent with the emissions and removals reported
in the table on GHG emissions and trends provided in this biennial report. Where the sectoral breakdown differs from that reported in the GHG inventory Parties
should explain in their biennial report how the inventory sectors relate to the sectors reported in this table.
d In accordance with paragraph 34 of the “Guidelines for the preparation of national communications by Parties included in Annex I to the Convention, Part II:
UNFCCC reporting guidelines on national communications”, projections shall be presented on a sectoral basis, to the extent possible, using the same sectoral
categories used in the policies and measures section. This table should follow, to the extent possible, the same sectoral categories as those listed in paragraph 17
of those guidelines, namely, to the extent appropriate, the following sectors should be considered: energy, transport, industry, agriculture, forestry and waste
management.
e To the extent possible, the following sectors should be used: energy, transport, industry/industrial processes, agriculture, forestry/LULUCF, waste
management/waste, other sectors (i.e. cross-cutting), as appropriate.
f Parties may choose to report total emissions with or without LULUCF, as appropriate.
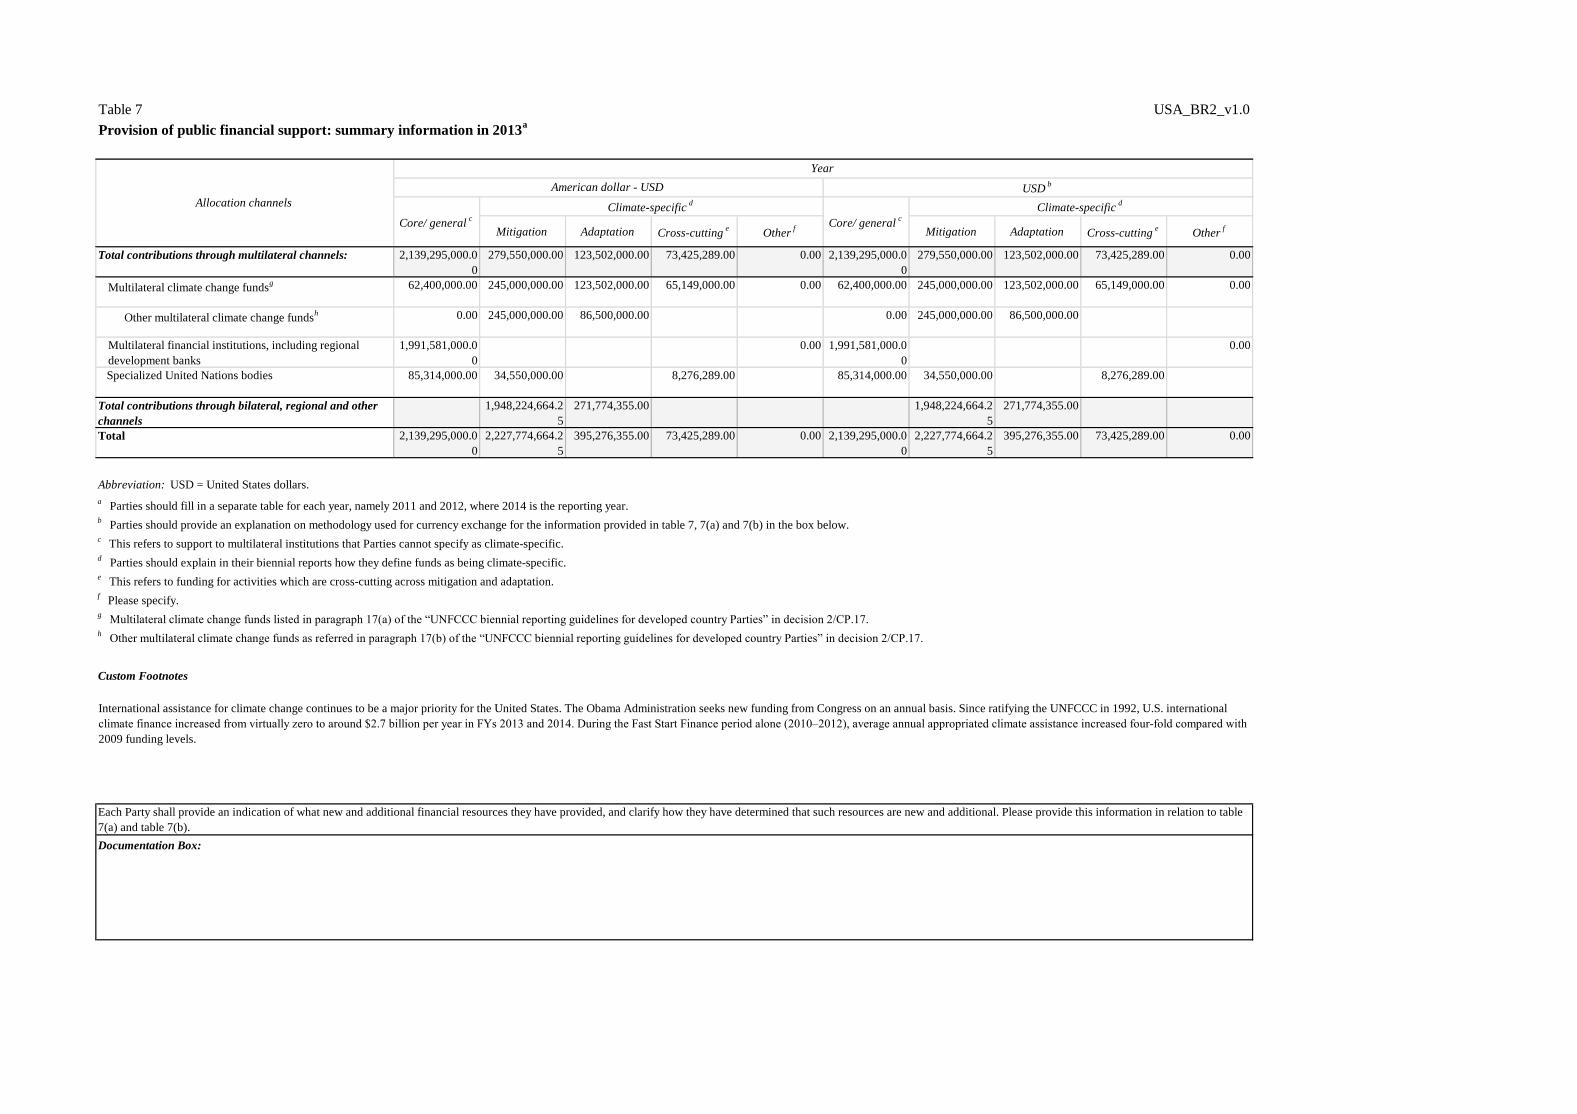
Table 7 USA_BR2_v1.0
Provision of public financial support: summary information in 2013a
Mitigation Adaptation Cross-cuttinge
Otherf Mitigation Adaptation Cross-cutting
eOther
f
Total contributions through multilateral channels: 2,139,295,000.0
0
279,550,000.00 123,502,000.00 73,425,289.00 0.00 2,139,295,000.0
0
279,550,000.00 123,502,000.00 73,425,289.00 0.00
Multilateral climate change fundsg 62,400,000.00 245,000,000.00 123,502,000.00 65,149,000.00 0.00 62,400,000.00 245,000,000.00 123,502,000.00 65,149,000.00 0.00
Other multilateral climate change fundsh 0.00 245,000,000.00 86,500,000.00 0.00 245,000,000.00 86,500,000.00
Multilateral financial institutions, including regional
development banks
1,991,581,000.0
0
0.00 1,991,581,000.0
0
0.00
Specialized United Nations bodies 85,314,000.00 34,550,000.00 8,276,289.00 85,314,000.00 34,550,000.00 8,276,289.00
Total contributions through bilateral, regional and other
channels
1,948,224,664.2
5
271,774,355.00 1,948,224,664.2
5
271,774,355.00
Total 2,139,295,000.0
0
2,227,774,664.2
5
395,276,355.00 73,425,289.00 0.00 2,139,295,000.0
0
2,227,774,664.2
5
395,276,355.00 73,425,289.00 0.00
Abbreviation: USD = United States dollars.
a Parties should fill in a separate table for each year, namely 2011 and 2012, where 2014 is the reporting year.
b Parties should provide an explanation on methodology used for currency exchange for the information provided in table 7, 7(a) and 7(b) in the box below.
c This refers to support to multilateral institutions that Parties cannot specify as climate-specific.
d Parties should explain in their biennial reports how they define funds as being climate-specific.
e This refers to funding for activities which are cross-cutting across mitigation and adaptation.
f Please specify.
g Multilateral climate change funds listed in paragraph 17(a) of the “UNFCCC biennial reporting guidelines for developed country Parties” in decision 2/CP.17.
h Other multilateral climate change funds as referred in paragraph 17(b) of the “UNFCCC biennial reporting guidelines for developed country Parties” in decision 2/CP.17.
Custom Footnotes
Documentation Box:
Each Party shall provide an indication of what new and additional financial resources they have provided, and clarify how they have determined that such resources are new and additional. Please provide this information in relation to table
7(a) and table 7(b).
American dollar - USD
Climate-specificd
USDb
Allocation channels
Year
Climate-specificd
Core/ generalc
Core/ generalc
International assistance for climate change continues to be a major priority for the United States. The Obama Administration seeks new funding from Congress on an annual basis. Since ratifying the UNFCCC in 1992, U.S. international
climate finance increased from virtually zero to around $2.7 billion per year in FYs 2013 and 2014. During the Fast Start Finance period alone (2010–2012), average annual appropriated climate assistance increased fourfold compared with
2009 funding levels.

Table 7 USA_BR2_v1.0
Provision of public financial support: summary information in 2014a
Mitigation Adaptation Cross-cuttinge
Otherf Mitigation Adaptation Cross-cutting
eOther
f
Total contributions through multilateral channels: 2,367,599,000.00 258,548,000.00 101,075,000.00 82,720,579.00 0.00 2,367,599,000.00 258,548,000.00 101,075,000.00 82,720,579.00 0.00
Multilateral climate change fundsg 71,900,000.00 224,048,000.00 101,075,000.00 74,649,000.00 0.00 71,900,000.00 224,048,000.00 101,075,000.00 74,649,000.00 0.00
Other multilateral climate change fundsh 0.00 224,048,000.00 74,900,000.00 0.00 224,048,000.00 74,900,000.00
Multilateral financial institutions, including regional
development banks
2,208,449,000.00 0.00 2,208,449,000.00 0.00
Specialized United Nations bodies 87,250,000.00 34,500,000.00 8,071,579.00 87,250,000.00 34,500,000.00 8,071,579.00
Total contributions through bilateral, regional and other
channels
2,002,873,694.00 325,721,261.00 2,002,873,694.00 325,721,261.00
Total 2,367,599,000.00 2,261,421,694.00 426,796,261.00 82,720,579.00 0.00 2,367,599,000.00 2,261,421,694.00 426,796,261.00 82,720,579.00 0.00
Abbreviation: USD = United States dollars.
a Parties should fill in a separate table for each year, namely 2011 and 2012, where 2014 is the reporting year.
b Parties should provide an explanation on methodology used for currency exchange for the information provided in table 7, 7(a) and 7(b) in the box below.
c This refers to support to multilateral institutions that Parties cannot specify as climate-specific.
d Parties should explain in their biennial reports how they define funds as being climate-specific.
e This refers to funding for activities which are cross-cutting across mitigation and adaptation.
f Please specify.
g Multilateral climate change funds listed in paragraph 17(a) of the “UNFCCC biennial reporting guidelines for developed country Parties” in decision 2/CP.17.
h Other multilateral climate change funds as referred in paragraph 17(b) of the “UNFCCC biennial reporting guidelines for developed country Parties” in decision 2/CP.17.
Custom Footnotes
Documentation Box:
Each Party shall provide an indication of what new and additional financial resources they have provided, and clarify how they have determined that such resources are new and additional. Please provide this information in relation to table 7(a) and table 7(b).
Year
American dollar - USD USDb
Core/ generalc
Climate-specificd
Core/ generalc
Climate-specificdAllocation channels
International assistance for climate change continues to be a major priority for the United States. The Obama Administration seeks new funding from Congress on an annual basis. Since ratifying the UNFCCC in 1992, U.S. international climate finance increased from virtually zero to
around $2.7 billion per year in FYs 2013 and 2014. During the Fast Start Finance period alone (2010–2012), average annual appropriated climate assistance increased fourfold compared with 2009 funding levels.

Table 7(a) USA_BR2_v1.0
Provision of public financial support: contribution through multilateral channels in 2013a
American dollar -
USDUSD
American dollar -
USDUSD
Total contributions through multilateral channels 2,139,295,000.00 2,139,295,000.00 476,477,289.00 476,477,289.00
Multilateral climate change funds g 62,400,000.00 62,400,000.00 433,651,000.00 433,651,000.00
1. Global Environment Facility 62,400,000.00 62,400,000.00 62,400,000.00 62,400,000.00 Committed ODA Grant Cross-cutting Cross-cutting
2. Least Developed Countries Fund 0.00 0.00 27,002,000.00 27,002,000.00 Committed ODA Grant Adaptation Cross-cutting
3. Special Climate Change Fund 0.00 0.00 10,000,000.00 10,000,000.00 Committed ODA Grant Adaptation Cross-cutting
4. Adaptation Fund 0.00 0.00 0.00 0.00
5. Green Climate Fund 0.00 0.00 0.00 0.00
6. UNFCCC Trust Fund for Supplementary Activities 0.00 0.00 2,749,000.00 2,749,000.00 Committed ODA Grant Cross-cutting Cross-cutting
7. Other multilateral climate change funds 0.00 0.00 331,500,000.00 331,500,000.00
Clean Technology Fund 0.00 0.00 196,200,000.00 196,200,000.00 Committed ODA Grant Mitigation Energy
Scaling-Up Renewable Energy Program in Low-Income Countries 0.00 0.00 11,900,000.00 11,900,000.00 Committed ODA Grant Mitigation Energy
Pilot Program for Climate Resilience 0.00 0.00 86,500,000.00 86,500,000.00 Committed ODA Grant Adaptation Cross-cutting
Forest Investment Program 0.00 0.00 11,900,000.00 11,900,000.00 Committed ODA Grant Mitigation Forestry, Agriculture
Initiative for Sustainable Forest Landscapes 0.00 0.00 25,000,000.00 25,000,000.00 Committed ODA Grant Mitigation Forestry, Agriculture
Multilateral financial institutions, including regional development banks 1,991,581,000.00 1,991,581,000.00 0.00 0.00
1. World Bank 1,351,018,000.00 1,351,018,000.00 0.00 0.00 Committed ODA Grant
2. International Finance Corporation 0.00 0.00 0.00 0.00
3. African Development Bank 194,166,000.00 194,166,000.00 0.00 0.00 Committed ODA Grant
4. Asian Development Bank 196,127,000.00 196,127,000.00 0.00 0.00 Committed ODA Grant
5. European Bank for Reconstruction and Development 0.00 0.00 0.00 0.00
6. Inter-American Development Bank 107,110,000.00 107,110,000.00 0.00 0.00 Committed ODA Grant
7. Other 143,160,000.00 143,160,000.00 0.00 0.00
Enterprise for the Americas Multilateral Investment Fund 14,995,000.00 14,995,000.00 0.00 0.00 Committed ODA Grant
Global Agriculture and Food Security Program 128,165,000.00 128,165,000.00 Committed ODA Grant
Specialized United Nations bodies 85,314,000.00 85,314,000.00 42,826,289.00 42,826,289.00
1. United Nations Development Programme 78,000,000.00 78,000,000.00
United Nations Development Programme 78,000,000.00 78,000,000.00 Committed ODA Grant
2. United Nations Environment Programme 7,314,000.00 7,314,000.00
United Nations Environment Programme 7,314,000.00 7,314,000.00 Committed ODA Grant
3. Other 0.00 0.00 42,826,289.00 42,826,289.00
Intergovernmental Panel on Climate Change 0.00 0.00 4,475,289.00 4,475,289.00 Committed ODA Grant Cross-cutting Cross-cutting
Montreal Protocol Multilateral Fund 0.00 0.00 34,550,000.00 34,550,000.00 Committed ODA Grant Mitigation Energy
UNFCCC Core Budget 3,801,000.00 3,801,000.00 Committed ODA Grant Cross-cutting Cross-cutting
Custom Footnotes
f Please specify.
g Cross-cutting type of support refers to funding for activities which are cross-cutting across mitigation and adaptation.
d This refers to support to multilateral institutions that Parties cannot specify as climate-specific.
e Parties should explain in their biennial reports how they define funds as being climate-specific.
Donor funding Core/generald
c Parties may select several applicable sectors. Parties may report sectoral distribution, as applicable, under “Other”.
Total amount
Climate-specifice
Statusb
Funding sourcef
Financial
instrumentf Type of support
f, gSector
c
Abbreviations: ODA = official development assistance, OOF = other official flows.
a Parties should fill in a separate table for each year, namely 2011 and 2012, where 2014 is the reporting year.
b Parties should explain, in their biennial reports, the methodologies used to specify the funds as provided, committed and/or pledged. Parties will provide the information for as many status categories as appropriate in the following order of priority: provided, committed, pledged.

Table 7(a) USA_BR2_v1.0
Provision of public financial support: contribution through multilateral channels in 2014a
American dollar -
USDUSD
American dollar -
USDUSD
Total contributions through multilateral channels 2,367,599,000.00 2,367,599,000.00 442,343,579.00 442,343,579.00
Multilateral climate change funds g 71,900,000.00 71,900,000.00 399,772,000.00 399,772,000.00
1. Global Environment Facility 71,900,000.00 71,900,000.00 71,900,000.00 71,900,000.00 Committed ODA Grant Cross-cutting Cross-cutting
2. Least Developed Countries Fund 0.00 0.00 26,175,000.00 26,175,000.00 Committed ODA Grant Adaptation Cross-cutting
3. Special Climate Change Fund 0.00 0.00 0.00 0.00
4. Adaptation Fund 0.00 0.00 0.00 0.00
5. Green Climate Fund 0.00 0.00 0.00 0.00
6. UNFCCC Trust Fund for Supplementary Activities 0.00 0.00 2,749,000.00 2,749,000.00 Committed ODA Grant Cross-cutting Cross-cutting
7. Other multilateral climate change funds 0.00 0.00 298,948,000.00 298,948,000.00
Clean Technology Fund 0.00 0.00 209,600,000.00 209,600,000.00 Committed ODA Grant Mitigation Energy
Pilot Program for Climate Resilience 0.00 0.00 74,900,000.00 74,900,000.00 Committed ODA Grant Adaptation Cross-cutting
Initiative for Sustainable Landscapes 0.00 0.00 6,948,000.00 6,948,000.00 Committed ODA Grant Mitigation Forestry, Agriculture
Pilot Auction Facility for Methane and Climate Change Mitigation 7,500,000.00 7,500,000.00 Committed ODA Grant Mitigation Energy
Multilateral financial institutions, including regional development banks 2,208,449,000.00 2,208,449,000.00 0.00 0.00
1. World Bank 1,541,957,000.00 1,541,957,000.00 0.00 0.00 Committed ODA Grant
2. International Finance Corporation 0.00 0.00 0.00 0.00
3. African Development Bank 208,754,000.00 208,754,000.00 0.00 0.00 Committed ODA Grant
4. Asian Development Bank 216,440,000.00 216,440,000.00 0.00 0.00 Committed ODA Grant
5. European Bank for Reconstruction and Development 0.00 0.00 0.00 0.00
6. Inter-American Development Bank 102,000,000.00 102,000,000.00 0.00 0.00 Committed ODA Grant
7. Other 139,298,000.00 139,298,000.00
Enterprise for the Americas Multilateral Investment Fund 6,298,000.00 6,298,000.00
Global Agriculture and Food Security Program 133,000,000.00 133,000,000.00 Committed ODA Grant
Specialized United Nations bodies 87,250,000.00 87,250,000.00 42,571,579.00 42,571,579.00
1. United Nations Development Programme 80,000,000.00 80,000,000.00
United Nations Development Programme 80,000,000.00 80,000,000.00 Committed ODA Grant
2. United Nations Environment Programme 7,250,000.00 7,250,000.00
United Nations Environment Programme 7,250,000.00 7,250,000.00 Committed ODA Grant
3. Other 0.00 0.00 42,571,579.00 42,571,579.00
Intergovernmental Panel on Climate Change 0.00 0.00 3,920,579.00 3,920,579.00 Committed ODA Grant Cross-cutting Cross-cutting
Montreal Protocol Multilateral Fund 0.00 0.00 34,500,000.00 34,500,000.00 Committed ODA Grant Mitigation Energy
UNFCCC Core Budget 4,151,000.00 4,151,000.00 Committed ODA Grant Cross-cutting Cross-cutting
Custom Footnotes
f Please specify.
g Cross-cutting type of support refers to funding for activities which are cross-cutting across mitigation and adaptation.
e Parties should explain in their biennial reports how they define funds as being climate-specific.
d This refers to support to multilateral institutions that Parties cannot specify as climate-specific.
c Parties may select several applicable sectors. Parties may report sectoral distribution, as applicable, under “Other”.
Donor funding
Total amount
Statusb
Funding sourcef
Financial
instrumentf Type of support
f, gCore/generald
SectorcClimate-specific
e
Abbreviations: ODA = official development assistance, OOF = other official flows.
a Parties should fill in a separate table for each year, namely 2011 and 2012, where 2014 is the reporting year.
b Parties should explain, in their biennial reports, the methodologies used to specify the funds as provided, committed and/or pledged. Parties will provide the information for as many status categories as appropriate in the following order of priority: provided, committed, pledged.

Table 7(b) USA_BR2_v1.0
Provision of public financial support: contribution through bilateral, regional and other channels in 2013a
American dollar -
USDUSD
Total contributions through bilateral,
regional and other channels
2,219,999,019.25 2,219,999,019.25
Dominican Republic / 3,479,299.00 3,479,299.00 Committed ODA Grant Adaptation Cross-cutting
Ecuador / 1,449,880.00 1,449,880.00 Committed ODA Grant Adaptation Cross-cutting
Ecuador / 1,321,852.00 1,321,852.00 Committed ODA Grant Mitigation Forestry,
Agriculture
El Salvador / 661,475.00 661,475.00 Committed ODA Grant Adaptation Cross-cutting
El Salvador / 30,000,000.00 30,000,000.00 Committed Other () Other (Loan
Guarantee)
Mitigation Energy
Eastern Europe, Multiple Countries / 6,077,513.00 6,077,513.00 Committed ODA Grant Mitigation Energy
Georgia / 2,993,307.00 2,993,307.00 Committed ODA Grant Mitigation Energy
Georgia / 150,000.00 150,000.00 Committed ODA Grant Mitigation Forestry,
Agriculture
Ghana / 327,400.00 327,400.00 Committed ODA Grant Adaptation Cross-cutting
Ghana / 1,056,000.00 1,056,000.00 Committed ODA Grant Mitigation Energy
Guatemala / 4,486,558.00 4,486,558.00 Committed ODA Grant Adaptation Cross-cutting
Guatemala / 4,421,731.00 4,421,731.00 Committed ODA Grant Mitigation Forestry,
Agriculture
Haiti / 2,100,000.00 2,100,000.00 Committed ODA Grant Adaptation Cross-cutting
Honduras / 3,160,866.00 3,160,866.00 Committed ODA Grant Adaptation Cross-cutting
Honduras / 305,000.00 305,000.00 Committed ODA Grant Mitigation Energy
Honduras / 500,000.00 500,000.00 Committed ODA Grant Mitigation Forestry,
Agriculture
Sectord
Additional
informatione
Total amount
Recipient country/
region/project/programmeb
Climate-specificf
Statusc
Funding sourceg
Financial
instrumentg Type of support
g, h

Table 7(b) USA_BR2_v1.0
Provision of public financial support: contribution through bilateral, regional and other channels in 2013a
American dollar -
USDUSD
Sectord
Additional
informatione
Total amount
Recipient country/
region/project/programmeb
Climate-specificf
Statusc
Funding sourceg
Financial
instrumentg Type of support
g, h
Honduras / 28,000,000.00 28,000,000.00 Committed OOF Non-Concessional
Loan
Mitigation Energy
India / 1,910,866.00 1,910,866.00 Committed ODA Grant Adaptation Cross-cutting
India / 4,220,454.00 4,220,454.00 Committed ODA Grant Mitigation Energy
India / 2,866,299.00 2,866,299.00 Committed ODA Grant Mitigation Forestry,
Agriculture
India / 32,000,000.00 32,000,000.00 Committed OOF Non-Concessional
Loan
Mitigation Energy
India / 40,000,000.00 40,000,000.00 Committed Other () Other (Loan
Guarantee)
Mitigation Energy
Indonesia / 3,238,288.00 3,238,288.00 Committed ODA Grant Adaptation Cross-cutting
Indonesia / 4,113,065.00 4,113,065.00 Committed ODA Grant Mitigation Energy
Indonesia / 7,872,767.00 7,872,767.00 Committed ODA Grant Mitigation Forestry,
Agriculture
Afghanistan / 54,447,000.00 54,447,000.00 Committed ODA Grant Mitigation Energy
Africa, Multiple Countries / 21,664,089.00 21,664,089.00 Committed ODA Grant Adaptation Cross-cutting
Africa, Multiple Countries / 12,913,617.00 12,913,617.00 Committed ODA Grant Mitigation Energy
Africa, Multiple Countries / 25,904,583.00 25,904,583.00 Committed ODA Grant Mitigation Forestry,
Agriculture
Africa, Multiple Countries / 4,000,000.00 4,000,000.00 Committed OOF Non-Concessional
Loan
Mitigation Energy
Armenia / 300,000.00 300,000.00 Committed ODA Grant Mitigation Energy
Asia Pacific, Multiple Countries / 5,932,597.00 5,932,597.00 Committed ODA Grant Adaptation Cross-cutting

Table 7(b) USA_BR2_v1.0
Provision of public financial support: contribution through bilateral, regional and other channels in 2013a
American dollar -
USDUSD
Sectord
Additional
informatione
Total amount
Recipient country/
region/project/programmeb
Climate-specificf
Statusc
Funding sourceg
Financial
instrumentg Type of support
g, h
Asia Pacific, Multiple Countries / 4,306,569.00 4,306,569.00 Committed ODA Grant Mitigation Energy
Asia Pacific, Multiple Countries / 10,509,761.00 10,509,761.00 Committed ODA Grant Mitigation Forestry,
Agriculture
Bangladesh / 9,766,051.00 9,766,051.00 Committed ODA Grant Adaptation Cross-cutting
Bangladesh / 4,777,164.00 4,777,164.00 Committed ODA Grant Mitigation Energy
Bangladesh / 2,866,299.00 2,866,299.00 Committed ODA Grant Mitigation Forestry,
Agriculture
Belize / 1,302,000.00 1,302,000.00 Committed ODA Grant Adaptation Cross-cutting
Brazil / 279,305.00 279,305.00 Committed ODA Grant Mitigation Energy
Brazil / 9,551,271.00 9,551,271.00 Committed ODA Grant Mitigation Forestry,
Agriculture
Cambodia / 3,821,731.00 3,821,731.00 Committed ODA Grant Adaptation Cross-cutting
Cambodia / 3,344,015.00 3,344,015.00 Committed ODA Grant Mitigation Forestry,
Agriculture
Latin America and the Caribbean,
Caribbean Islands /
5,254,881.00 5,254,881.00 Committed ODA Grant Adaptation Cross-cutting
Chile / 2,422,657.00 2,422,657.00 Committed ODA Grant Mitigation Energy
Chile / 615,400,000.00 615,400,000.00 Committed Other () Other (Loan
Guarantee)
Mitigation Energy
China / 1,177,847.00 1,177,847.00 Committed ODA Grant Mitigation Energy
Colombia / 2,893,307.00 2,893,307.00 Committed ODA Grant Adaptation Cross-cutting
Colombia / 4,615,063.00 4,615,063.00 Committed ODA Grant Mitigation Energy
Colombia / 6,128,410.00 6,128,410.00 Committed ODA Grant Mitigation Forestry,
Agriculture
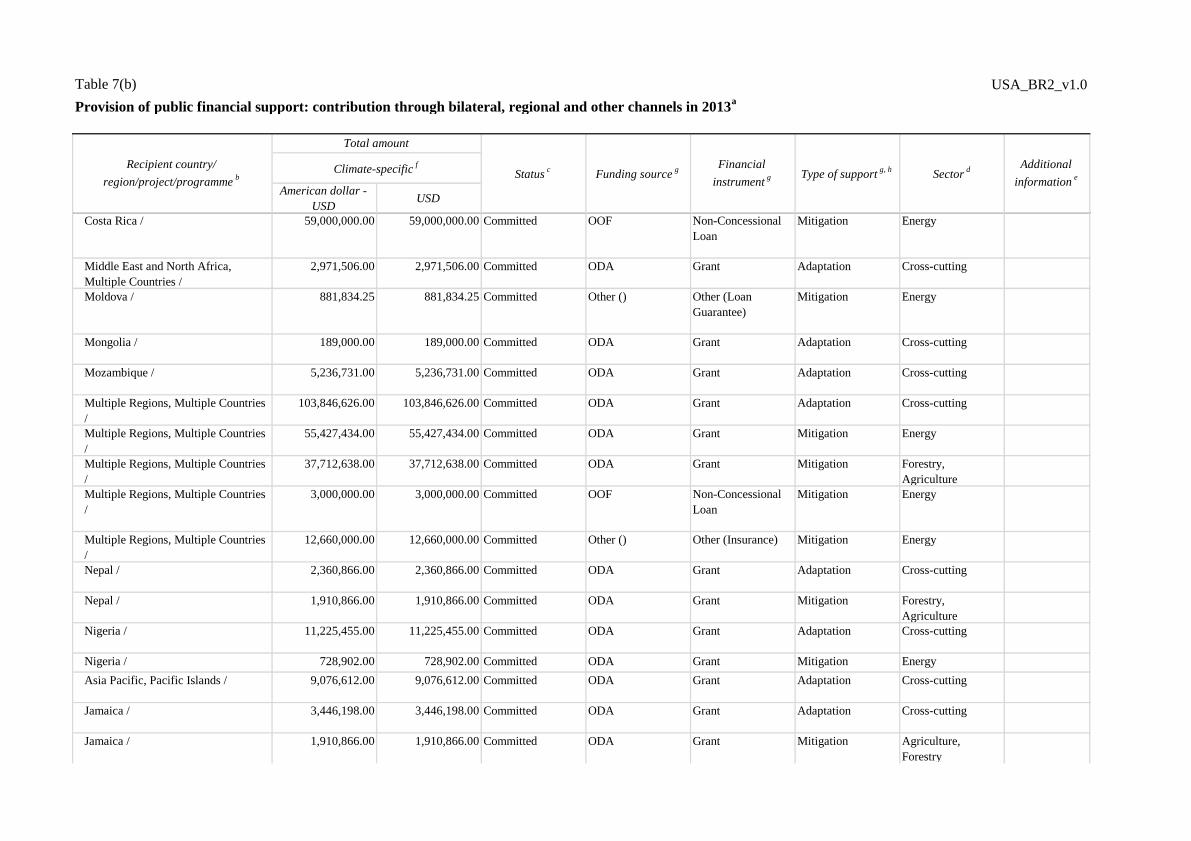
Table 7(b) USA_BR2_v1.0
Provision of public financial support: contribution through bilateral, regional and other channels in 2013a
American dollar -
USDUSD
Sectord
Additional
informatione
Total amount
Recipient country/
region/project/programmeb
Climate-specificf
Statusc
Funding sourceg
Financial
instrumentg Type of support
g, h
Costa Rica / 59,000,000.00 59,000,000.00 Committed OOF Non-Concessional
Loan
Mitigation Energy
Middle East and North Africa,
Multiple Countries /
2,971,506.00 2,971,506.00 Committed ODA Grant Adaptation Cross-cutting
Moldova / 881,834.25 881,834.25 Committed Other () Other (Loan
Guarantee)
Mitigation Energy
Mongolia / 189,000.00 189,000.00 Committed ODA Grant Adaptation Cross-cutting
Mozambique / 5,236,731.00 5,236,731.00 Committed ODA Grant Adaptation Cross-cutting
Multiple Regions, Multiple Countries
/
103,846,626.00 103,846,626.00 Committed ODA Grant Adaptation Cross-cutting
Multiple Regions, Multiple Countries
/
55,427,434.00 55,427,434.00 Committed ODA Grant Mitigation Energy
Multiple Regions, Multiple Countries
/
37,712,638.00 37,712,638.00 Committed ODA Grant Mitigation Forestry,
Agriculture
Multiple Regions, Multiple Countries
/
3,000,000.00 3,000,000.00 Committed OOF Non-Concessional
Loan
Mitigation Energy
Multiple Regions, Multiple Countries
/
12,660,000.00 12,660,000.00 Committed Other () Other (Insurance) Mitigation Energy
Nepal / 2,360,866.00 2,360,866.00 Committed ODA Grant Adaptation Cross-cutting
Nepal / 1,910,866.00 1,910,866.00 Committed ODA Grant Mitigation Forestry,
Agriculture
Nigeria / 11,225,455.00 11,225,455.00 Committed ODA Grant Adaptation Cross-cutting
Nigeria / 728,902.00 728,902.00 Committed ODA Grant Mitigation Energy
Asia Pacific, Pacific Islands / 9,076,612.00 9,076,612.00 Committed ODA Grant Adaptation Cross-cutting
Jamaica / 3,446,198.00 3,446,198.00 Committed ODA Grant Adaptation Cross-cutting
Jamaica / 1,910,866.00 1,910,866.00 Committed ODA Grant Mitigation Agriculture,
Forestry

Table 7(b) USA_BR2_v1.0
Provision of public financial support: contribution through bilateral, regional and other channels in 2013a
American dollar -
USDUSD
Sectord
Additional
informatione
Total amount
Recipient country/
region/project/programmeb
Climate-specificf
Statusc
Funding sourceg
Financial
instrumentg Type of support
g, h
Kazakhstan / 3,025,704.00 3,025,704.00 Committed ODA Grant Mitigation Energy
Kenya / 950,000.00 950,000.00 Committed ODA Grant Adaptation Cross-cutting
Kenya / 3,921,731.00 3,921,731.00 Committed ODA Grant Mitigation Energy
Kenya / 550,000.00 550,000.00 Committed ODA Grant Mitigation Agriculture,
Forestry
Latin America and the Caribbean,
Multiple Countries /
4,903,753.00 4,903,753.00 Committed ODA Grant Adaptation Cross-cutting
Latin America and the Caribbean,
Multiple Countries /
4,308,451.00 4,308,451.00 Committed ODA Grant Mitigation Energy
Latin America and the Caribbean,
Multiple Countries /
10,529,174.00 10,529,174.00 Committed ODA Grant Mitigation Agriculture,
Forestry
Liberia / 805,000.00 805,000.00 Committed ODA Grant Adaptation Cross-cutting
Liberia / 6,029,000.00 6,029,000.00 Committed ODA Grant Mitigation Energy
Liberia / 2,623,000.00 2,623,000.00 Committed ODA Grant Mitigation Forestry,
Agriculture
Macedonia / 150,000.00 150,000.00 Committed ODA Grant Adaptation Cross-cutting
Macedonia / 349,161.00 349,161.00 Committed ODA Grant Mitigation Energy
Malawi / 3,316,299.00 3,316,299.00 Committed ODA Grant Adaptation Cross-cutting
Pakistan / 98,380,000.00 98,380,000.00 Committed ODA Grant Mitigation Energy
Malawi / 2,866,299.00 2,866,299.00 Committed ODA Grant Mitigation Forestry,
Agriculture
Pakistan / 196,500,000.00 196,500,000.00 Committed Other () Other (Loan
Guarantee)
Mitigation Energy
Maldives / 1,910,866.00 1,910,866.00 Committed ODA Grant Adaptation Cross-cutting
Mali / 100,000.00 100,000.00 Committed ODA Grant Adaptation Cross-cutting
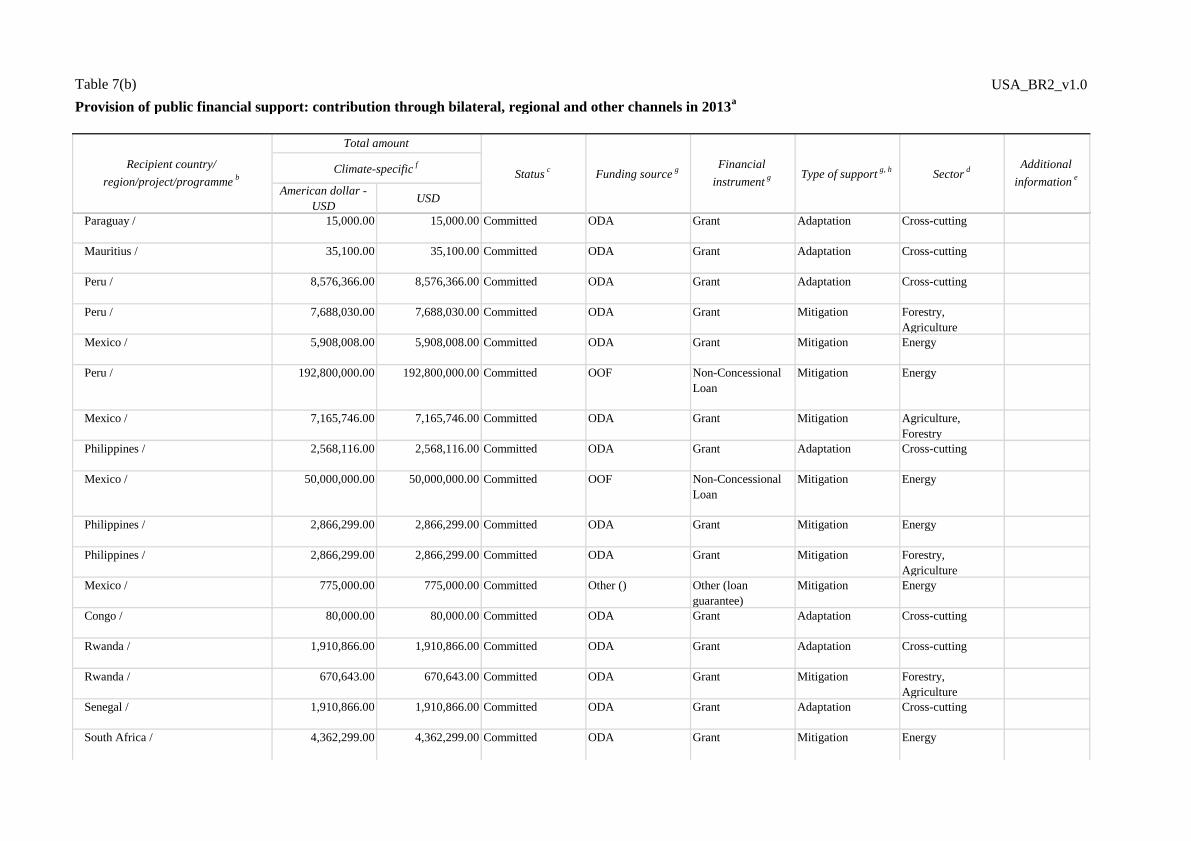
Table 7(b) USA_BR2_v1.0
Provision of public financial support: contribution through bilateral, regional and other channels in 2013a
American dollar -
USDUSD
Sectord
Additional
informatione
Total amount
Recipient country/
region/project/programmeb
Climate-specificf
Statusc
Funding sourceg
Financial
instrumentg Type of support
g, h
Paraguay / 15,000.00 15,000.00 Committed ODA Grant Adaptation Cross-cutting
Mauritius / 35,100.00 35,100.00 Committed ODA Grant Adaptation Cross-cutting
Peru / 8,576,366.00 8,576,366.00 Committed ODA Grant Adaptation Cross-cutting
Peru / 7,688,030.00 7,688,030.00 Committed ODA Grant Mitigation Forestry,
Agriculture
Mexico / 5,908,008.00 5,908,008.00 Committed ODA Grant Mitigation Energy
Peru / 192,800,000.00 192,800,000.00 Committed OOF Non-Concessional
Loan
Mitigation Energy
Mexico / 7,165,746.00 7,165,746.00 Committed ODA Grant Mitigation Agriculture,
Forestry
Philippines / 2,568,116.00 2,568,116.00 Committed ODA Grant Adaptation Cross-cutting
Mexico / 50,000,000.00 50,000,000.00 Committed OOF Non-Concessional
Loan
Mitigation Energy
Philippines / 2,866,299.00 2,866,299.00 Committed ODA Grant Mitigation Energy
Philippines / 2,866,299.00 2,866,299.00 Committed ODA Grant Mitigation Forestry,
Agriculture
Mexico / 775,000.00 775,000.00 Committed Other () Other (loan
guarantee)
Mitigation Energy
Congo / 80,000.00 80,000.00 Committed ODA Grant Adaptation Cross-cutting
Rwanda / 1,910,866.00 1,910,866.00 Committed ODA Grant Adaptation Cross-cutting
Rwanda / 670,643.00 670,643.00 Committed ODA Grant Mitigation Forestry,
Agriculture
Senegal / 1,910,866.00 1,910,866.00 Committed ODA Grant Adaptation Cross-cutting
South Africa / 4,362,299.00 4,362,299.00 Committed ODA Grant Mitigation Energy

Table 7(b) USA_BR2_v1.0
Provision of public financial support: contribution through bilateral, regional and other channels in 2013a
American dollar -
USDUSD
Sectord
Additional
informatione
Total amount
Recipient country/
region/project/programmeb
Climate-specificf
Statusc
Funding sourceg
Financial
instrumentg Type of support
g, h
South Africa / 23,000,000.00 23,000,000.00 Committed OOF Non-Concessional
Loan
Mitigation Energy
United Republic of Tanzania / 2,866,299.00 2,866,299.00 Committed ODA Grant Adaptation Cross-cutting
United Republic of Tanzania / 23,090,000.00 23,090,000.00 Committed OOF Non-Concessional
Loan
Mitigation Energy
United Republic of Tanzania / 7,200,000.00 7,200,000.00 Committed Other () Other (Loan
Guarantee)
Mitigation Energy
Thailand / 450,000.00 450,000.00 Committed ODA Grant Mitigation Energy
Timor-Leste / 1,910,866.00 1,910,866.00 Committed ODA Grant Adaptation Cross-cutting
Trinidad and Tobago / 913,000.00 913,000.00 Committed ODA Grant Adaptation Cross-cutting
Uganda / 2,866,299.00 2,866,299.00 Committed ODA Grant Adaptation Cross-cutting
Ukraine / 3,822,178.00 3,822,178.00 Committed ODA Grant Mitigation Energy
Ukraine / 4,989,000.00 4,989,000.00 Committed Other () Other (Loan
Guarantee)
Mitigation Energy
Uruguay / 168,700,000.00 168,700,000.00 Committed OOF Non-Concessional
Loan
Mitigation Energy
Viet Nam / 3,521,299.00 3,521,299.00 Committed ODA Grant Adaptation Cross-cutting
Viet Nam / 3,548,807.00 3,548,807.00 Committed ODA Grant Mitigation Energy
Viet Nam / 2,388,582.00 2,388,582.00 Committed ODA Grant Mitigation Forestry,
Agriculture
Zambia / 2,480,000.00 2,480,000.00 Committed ODA Grant Adaptation Cross-cutting
Zambia / 4,777,164.00 4,777,164.00 Committed ODA Grant Mitigation Forestry,
Agriculture
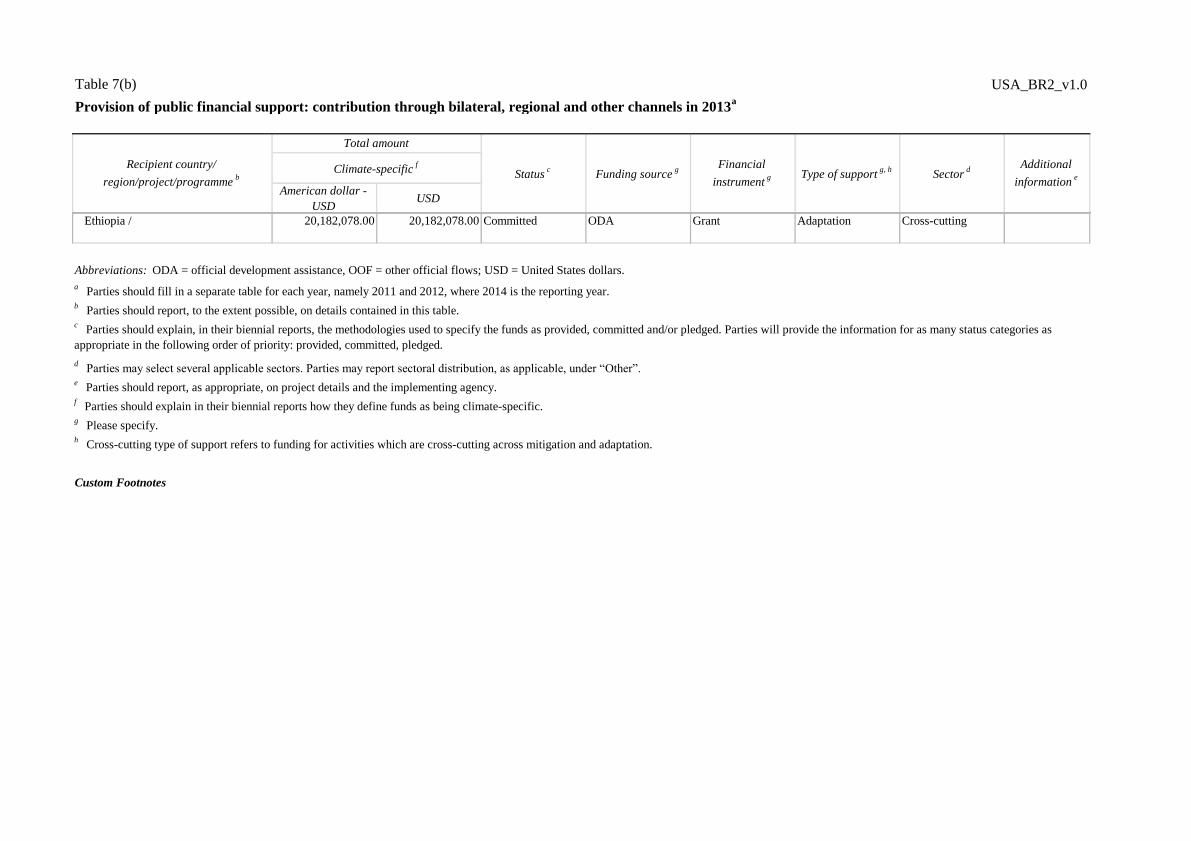
Table 7(b) USA_BR2_v1.0
Provision of public financial support: contribution through bilateral, regional and other channels in 2013a
American dollar -
USDUSD
Sectord
Additional
informatione
Total amount
Recipient country/
region/project/programmeb
Climate-specificf
Statusc
Funding sourceg
Financial
instrumentg Type of support
g, h
Ethiopia / 20,182,078.00 20,182,078.00 Committed ODA Grant Adaptation Cross-cutting
Abbreviations: ODA = official development assistance, OOF = other official flows; USD = United States dollars.
Custom Footnotes
a Parties should fill in a separate table for each year, namely 2011 and 2012, where 2014 is the reporting year.
b Parties should report, to the extent possible, on details contained in this table.
c Parties should explain, in their biennial reports, the methodologies used to specify the funds as provided, committed and/or pledged. Parties will provide the information for as many status categories as
appropriate in the following order of priority: provided, committed, pledged.
d Parties may select several applicable sectors. Parties may report sectoral distribution, as applicable, under “Other”.
e Parties should report, as appropriate, on project details and the implementing agency.
f Parties should explain in their biennial reports how they define funds as being climate-specific.
g Please specify.
h Cross-cutting type of support refers to funding for activities which are cross-cutting across mitigation and adaptation.

Table 7(b) USA_BR2_v1.0
Provision of public financial support: contribution through bilateral, regional and other channels in 2014a
American dollar -
USDUSD
Total contributions through bilateral,
regional and other channels
2,328,594,955.00 2,328,594,955.00
Dominican Republic / 3,079,500.00 3,079,500.00 Committed ODA Grant Adaptation Cross-cutting
Ethiopia / 43,438,493.00 43,438,493.00 Committed ODA Grant Adaptation Cross-cutting
Ethiopia / 1,000,000.00 1,000,000.00 Committed ODA Grant Mitigation Energy
Eastern Europe, Multiple Countries / 4,500,000.00 4,500,000.00 Committed ODA Grant Mitigation Energy
Georgia / 889,100.00 889,100.00 Committed ODA Grant Adaptation Cross-cutting
Georgia / 3,000,000.00 3,000,000.00 Committed ODA Grant Mitigation Energy
Georgia / 630,000.00 630,000.00 Committed ODA Grant Mitigation Forestry,
Agriculture
Ghana / 103,600,000.00 103,600,000.00 Committed ODA Grant Mitigation Energy
Guatemala / 5,301,000.00 5,301,000.00 Committed ODA Grant Adaptation Cross-cutting
Guatemala / 4,400,000.00 4,400,000.00 Committed ODA Grant Mitigation Forestry,
Agriculture
Guyana / 318,000.00 318,000.00 Committed ODA Grant Adaptation Cross-cutting
Haiti / 2,150,700.00 2,150,700.00 Committed ODA Grant Adaptation Cross-cutting
Haiti / 1,536,000.00 1,536,000.00 Committed ODA Grant Mitigation Forestry,
Agriculture
Honduras / 3,930,785.00 3,930,785.00 Committed ODA Grant Adaptation Cross-cutting
Honduras / 400,000.00 400,000.00 Committed ODA Grant Mitigation Energy
Honduras / 1,400,000.00 1,400,000.00 Committed OOF Non-Concessional
Loan
Mitigation Energy
Recipient country/
region/project/programmeb
Total amount
Statusc
Funding sourceg
Financial
instrumentg Type of support
g, hSector
dAdditional
informatione
Climate-specificf

Table 7(b) USA_BR2_v1.0
Provision of public financial support: contribution through bilateral, regional and other channels in 2014a
American dollar -
USDUSD
Recipient country/
region/project/programmeb
Total amount
Statusc
Funding sourceg
Financial
instrumentg Type of support
g, hSector
dAdditional
informatione
Climate-specificf
India / 4,850,000.00 4,850,000.00 Committed ODA Grant Adaptation Cross-cutting
India / 15,368,625.00 15,368,625.00 Committed ODA Grant Mitigation Energy
India / 4,000,000.00 4,000,000.00 Committed ODA Grant Mitigation Forestry,
Agriculture
India / 23,000,000.00 23,000,000.00 Committed OOF Non-Concessional
Loan
Mitigation Energy
Indonesia / 3,000,000.00 3,000,000.00 Committed ODA Grant Adaptation Cross-cutting
Indonesia / 3,000,000.00 3,000,000.00 Committed ODA Grant Mitigation Energy
Indonesia / 8,000,000.00 8,000,000.00 Committed ODA Grant Mitigation Forestry,
Agriculture
Africa, Multiple Countries / 15,000,000.00 15,000,000.00 Committed ODA Grant Adaptation Cross-cutting
Africa, Multiple Countries / 22,930,000.00 22,930,000.00 Committed ODA Grant Mitigation Energy
Africa, Multiple Countries / 24,400,000.00 24,400,000.00 Committed ODA Grant Mitigation Forestry,
Agriculture
Asia Pacific, Multiple Countries / 7,000,000.00 7,000,000.00 Committed ODA Grant Adaptation Cross-cutting
Asia Pacific, Multiple Countries / 3,500,000.00 3,500,000.00 Committed ODA Grant Mitigation Energy
Asia Pacific, Multiple Countries / 8,000,000.00 8,000,000.00 Committed ODA Grant Mitigation Forestry,
Agriculture
Bangladesh / 4,195,000.00 4,195,000.00 Committed ODA Grant Adaptation Cross-cutting
Bangladesh / 4,000,000.00 4,000,000.00 Committed ODA Grant Mitigation Energy
Bangladesh / 4,000,000.00 4,000,000.00 Committed ODA Grant Mitigation Forestry,
Agriculture
Belize / 1,755,000.00 1,755,000.00 Committed ODA Grant Adaptation Cross-cutting

Table 7(b) USA_BR2_v1.0
Provision of public financial support: contribution through bilateral, regional and other channels in 2014a
American dollar -
USDUSD
Recipient country/
region/project/programmeb
Total amount
Statusc
Funding sourceg
Financial
instrumentg Type of support
g, hSector
dAdditional
informatione
Climate-specificf
Brazil / 100,000.00 100,000.00 Committed ODA Grant Adaptation Cross-cutting
Brazil / 436,955.00 436,955.00 Committed ODA Grant Mitigation Energy
Brazil / 5,250,000.00 5,250,000.00 Committed ODA Grant Mitigation Forestry,
Agriculture
Cambodia / 4,000,000.00 4,000,000.00 Committed ODA Grant Adaptation Cross-cutting
Cambodia / 3,500,000.00 3,500,000.00 Committed ODA Grant Mitigation Forestry,
Agriculture
Latin America and the Caribbean,
Caribbean Islands /
5,200,000.00 5,200,000.00 Committed ODA Grant Adaptation Cross-cutting
Chile / 278,900,000.00 278,900,000.00 Committed Other () Other (Loan
Guarantee)
Mitigation Energy
China / 27,800.00 27,800.00 Committed ODA Grant Adaptation Cross-cutting
China / 10,953,071.00 10,953,071.00 Committed ODA Grant Mitigation Energy
China / 1,000,000.00 1,000,000.00 Committed ODA Grant Mitigation Forestry,
Agriculture
Colombia / 3,000,000.00 3,000,000.00 Committed ODA Grant Adaptation Cross-cutting
Colombia / 5,721,382.00 5,721,382.00 Committed ODA Grant Mitigation Energy
Colombia / 7,000,000.00 7,000,000.00 Committed ODA Grant Mitigation Forestry,
Agriculture
Colombia / 50,000,000.00 50,000,000.00 Committed Other () Other (Loan
Guarantee)
Mitigation Energy
Costa Rica / 2,300,000.00 2,300,000.00 Committed OOF Non-Concessional
Loan
Mitigation Energy
Mongolia / 169,000.00 169,000.00 Committed ODA Grant Adaptation Cross-cutting
Morocco / 262,162.00 262,162.00 Committed ODA Grant Mitigation Energy
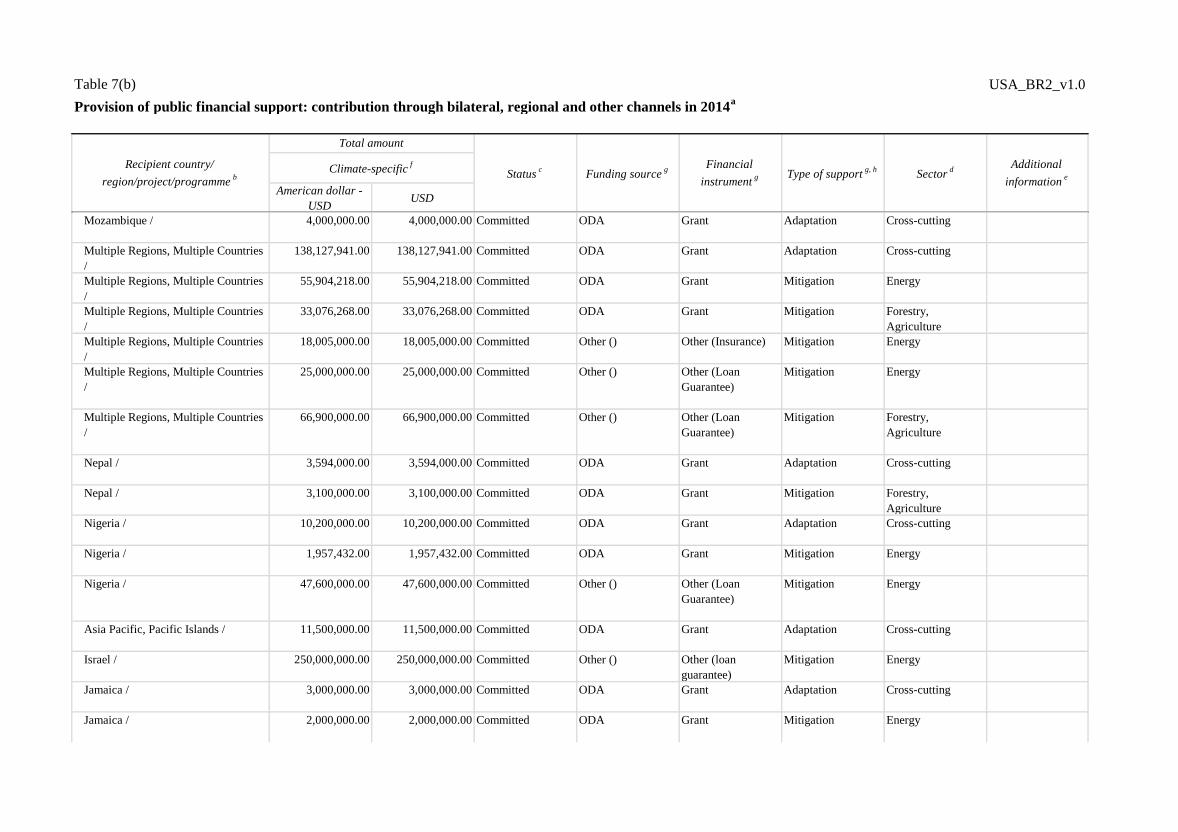
Table 7(b) USA_BR2_v1.0
Provision of public financial support: contribution through bilateral, regional and other channels in 2014a
American dollar -
USDUSD
Recipient country/
region/project/programmeb
Total amount
Statusc
Funding sourceg
Financial
instrumentg Type of support
g, hSector
dAdditional
informatione
Climate-specificf
Mozambique / 4,000,000.00 4,000,000.00 Committed ODA Grant Adaptation Cross-cutting
Multiple Regions, Multiple Countries
/
138,127,941.00 138,127,941.00 Committed ODA Grant Adaptation Cross-cutting
Multiple Regions, Multiple Countries
/
55,904,218.00 55,904,218.00 Committed ODA Grant Mitigation Energy
Multiple Regions, Multiple Countries
/
33,076,268.00 33,076,268.00 Committed ODA Grant Mitigation Forestry,
Agriculture
Multiple Regions, Multiple Countries
/
18,005,000.00 18,005,000.00 Committed Other () Other (Insurance) Mitigation Energy
Multiple Regions, Multiple Countries
/
25,000,000.00 25,000,000.00 Committed Other () Other (Loan
Guarantee)
Mitigation Energy
Multiple Regions, Multiple Countries
/
66,900,000.00 66,900,000.00 Committed Other () Other (Loan
Guarantee)
Mitigation Forestry,
Agriculture
Nepal / 3,594,000.00 3,594,000.00 Committed ODA Grant Adaptation Cross-cutting
Nepal / 3,100,000.00 3,100,000.00 Committed ODA Grant Mitigation Forestry,
Agriculture
Nigeria / 10,200,000.00 10,200,000.00 Committed ODA Grant Adaptation Cross-cutting
Nigeria / 1,957,432.00 1,957,432.00 Committed ODA Grant Mitigation Energy
Nigeria / 47,600,000.00 47,600,000.00 Committed Other () Other (Loan
Guarantee)
Mitigation Energy
Asia Pacific, Pacific Islands / 11,500,000.00 11,500,000.00 Committed ODA Grant Adaptation Cross-cutting
Israel / 250,000,000.00 250,000,000.00 Committed Other () Other (loan
guarantee)
Mitigation Energy
Jamaica / 3,000,000.00 3,000,000.00 Committed ODA Grant Adaptation Cross-cutting
Jamaica / 2,000,000.00 2,000,000.00 Committed ODA Grant Mitigation Energy

Table 7(b) USA_BR2_v1.0
Provision of public financial support: contribution through bilateral, regional and other channels in 2014a
American dollar -
USDUSD
Recipient country/
region/project/programmeb
Total amount
Statusc
Funding sourceg
Financial
instrumentg Type of support
g, hSector
dAdditional
informatione
Climate-specificf
Jamaica / 43,000,000.00 43,000,000.00 Committed OOF Non-Concessional
Loan
Mitigation Energy
Jamaica / 585,072.00 585,072.00 Committed Other () Other (insurance) Mitigation Energy
Jamaica / 22,500,000.00 22,500,000.00 Committed Other () Other (loan
guarantee)
Mitigation Energy
Jordan / 25,000,000.00 25,000,000.00 Committed Other () Other (loan
guarantee)
Mitigation Energy
Kazakhstan / 2,594,800.00 2,594,800.00 Committed ODA Grant Mitigation Energy
Kenya / 3,000,000.00 3,000,000.00 Committed ODA Grant Adaptation Cross-cutting
Kenya / 2,000,000.00 2,000,000.00 Committed ODA Grant Mitigation Energy
Kenya / 46,000,000.00 46,000,000.00 Committed Other () Other (loan
guarantee)
Mitigation Energy
Kosovo / 700,000.00 700,000.00 Committed ODA Grant Mitigation Energy
Lao People's Democratic Republic / 200,000.00 200,000.00 Committed ODA Grant Adaptation Cross-cutting
Latin America and the Caribbean,
Multiple Countries /
5,300,000.00 5,300,000.00 Committed ODA Grant Adaptation Cross-cutting
Latin America and the Caribbean,
Multiple Countries /
6,168,170.00 6,168,170.00 Committed ODA Grant Mitigation Energy
Latin America and the Caribbean,
Multiple Countries /
11,447,000.00 11,447,000.00 Committed ODA Grant Mitigation Forestry,
Agriculture
Lebanon / 900,000.00 900,000.00 Committed ODA Grant Adaptation Cross-cutting
Liberia / 600,000.00 600,000.00 Committed ODA Grant Adaptation Cross-cutting
Liberia / 1,600,000.00 1,600,000.00 Committed ODA Grant Mitigation Agriculture,
Forestry
Macedonia / 225,000.00 225,000.00 Committed ODA Grant Adaptation Cross-cutting
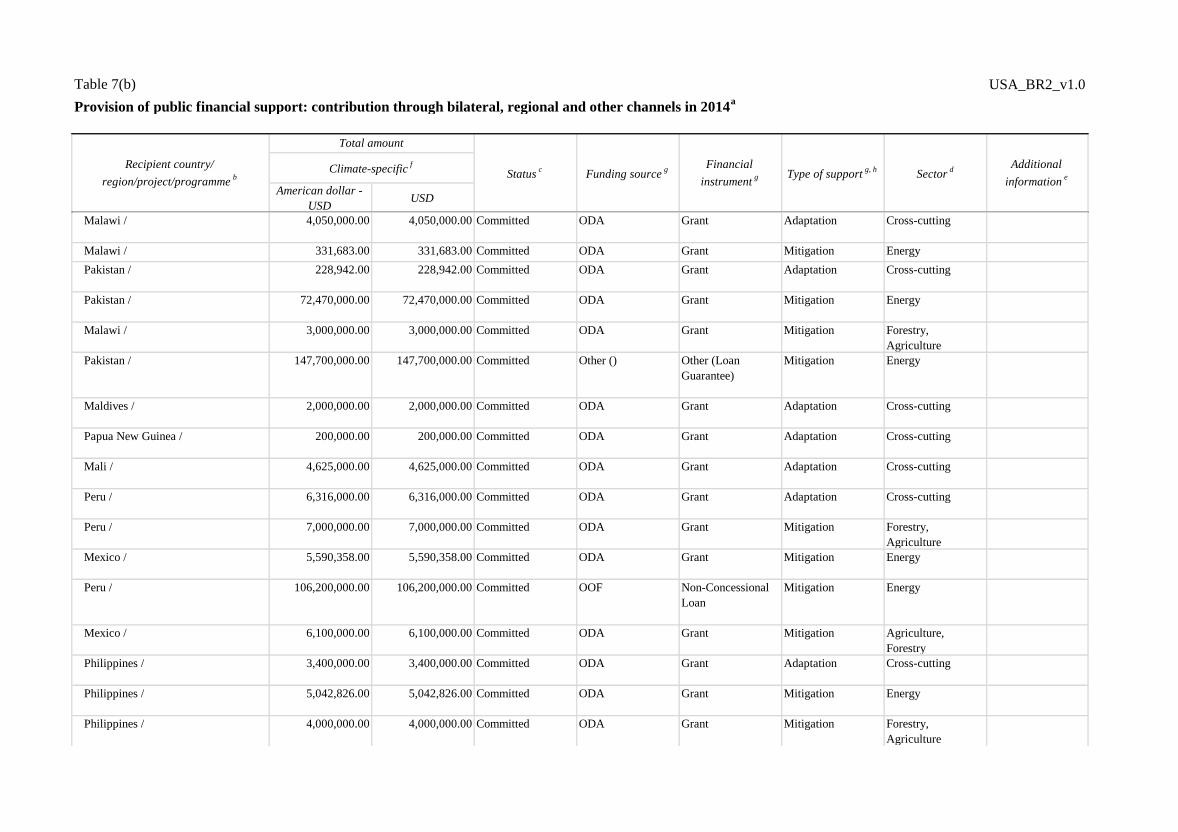
Table 7(b) USA_BR2_v1.0
Provision of public financial support: contribution through bilateral, regional and other channels in 2014a
American dollar -
USDUSD
Recipient country/
region/project/programmeb
Total amount
Statusc
Funding sourceg
Financial
instrumentg Type of support
g, hSector
dAdditional
informatione
Climate-specificf
Malawi / 4,050,000.00 4,050,000.00 Committed ODA Grant Adaptation Cross-cutting
Malawi / 331,683.00 331,683.00 Committed ODA Grant Mitigation Energy
Pakistan / 228,942.00 228,942.00 Committed ODA Grant Adaptation Cross-cutting
Pakistan / 72,470,000.00 72,470,000.00 Committed ODA Grant Mitigation Energy
Malawi / 3,000,000.00 3,000,000.00 Committed ODA Grant Mitigation Forestry,
Agriculture
Pakistan / 147,700,000.00 147,700,000.00 Committed Other () Other (Loan
Guarantee)
Mitigation Energy
Maldives / 2,000,000.00 2,000,000.00 Committed ODA Grant Adaptation Cross-cutting
Papua New Guinea / 200,000.00 200,000.00 Committed ODA Grant Adaptation Cross-cutting
Mali / 4,625,000.00 4,625,000.00 Committed ODA Grant Adaptation Cross-cutting
Peru / 6,316,000.00 6,316,000.00 Committed ODA Grant Adaptation Cross-cutting
Peru / 7,000,000.00 7,000,000.00 Committed ODA Grant Mitigation Forestry,
Agriculture
Mexico / 5,590,358.00 5,590,358.00 Committed ODA Grant Mitigation Energy
Peru / 106,200,000.00 106,200,000.00 Committed OOF Non-Concessional
Loan
Mitigation Energy
Mexico / 6,100,000.00 6,100,000.00 Committed ODA Grant Mitigation Agriculture,
Forestry
Philippines / 3,400,000.00 3,400,000.00 Committed ODA Grant Adaptation Cross-cutting
Philippines / 5,042,826.00 5,042,826.00 Committed ODA Grant Mitigation Energy
Philippines / 4,000,000.00 4,000,000.00 Committed ODA Grant Mitigation Forestry,
Agriculture
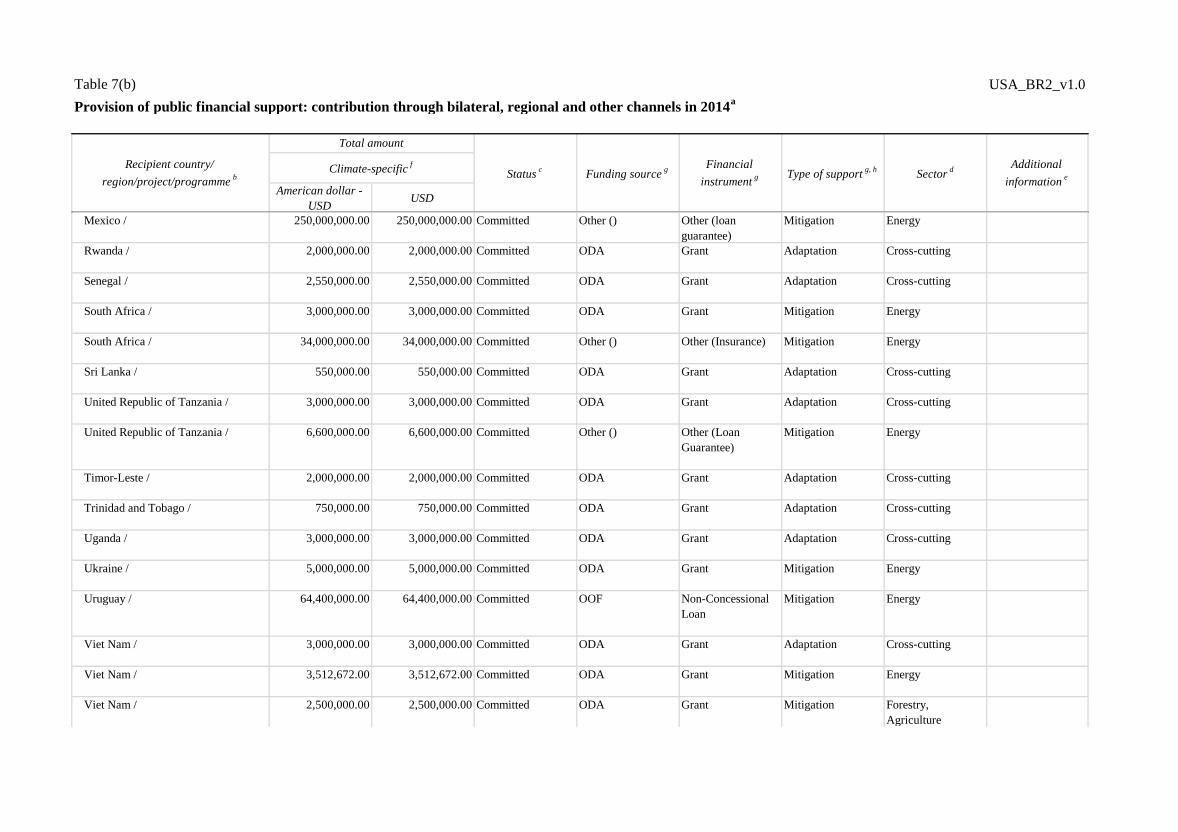
Table 7(b) USA_BR2_v1.0
Provision of public financial support: contribution through bilateral, regional and other channels in 2014a
American dollar -
USDUSD
Recipient country/
region/project/programmeb
Total amount
Statusc
Funding sourceg
Financial
instrumentg Type of support
g, hSector
dAdditional
informatione
Climate-specificf
Mexico / 250,000,000.00 250,000,000.00 Committed Other () Other (loan
guarantee)
Mitigation Energy
Rwanda / 2,000,000.00 2,000,000.00 Committed ODA Grant Adaptation Cross-cutting
Senegal / 2,550,000.00 2,550,000.00 Committed ODA Grant Adaptation Cross-cutting
South Africa / 3,000,000.00 3,000,000.00 Committed ODA Grant Mitigation Energy
South Africa / 34,000,000.00 34,000,000.00 Committed Other () Other (Insurance) Mitigation Energy
Sri Lanka / 550,000.00 550,000.00 Committed ODA Grant Adaptation Cross-cutting
United Republic of Tanzania / 3,000,000.00 3,000,000.00 Committed ODA Grant Adaptation Cross-cutting
United Republic of Tanzania / 6,600,000.00 6,600,000.00 Committed Other () Other (Loan
Guarantee)
Mitigation Energy
Timor-Leste / 2,000,000.00 2,000,000.00 Committed ODA Grant Adaptation Cross-cutting
Trinidad and Tobago / 750,000.00 750,000.00 Committed ODA Grant Adaptation Cross-cutting
Uganda / 3,000,000.00 3,000,000.00 Committed ODA Grant Adaptation Cross-cutting
Ukraine / 5,000,000.00 5,000,000.00 Committed ODA Grant Mitigation Energy
Uruguay / 64,400,000.00 64,400,000.00 Committed OOF Non-Concessional
Loan
Mitigation Energy
Viet Nam / 3,000,000.00 3,000,000.00 Committed ODA Grant Adaptation Cross-cutting
Viet Nam / 3,512,672.00 3,512,672.00 Committed ODA Grant Mitigation Energy
Viet Nam / 2,500,000.00 2,500,000.00 Committed ODA Grant Mitigation Forestry,
Agriculture

Table 7(b) USA_BR2_v1.0
Provision of public financial support: contribution through bilateral, regional and other channels in 2014a
American dollar -
USDUSD
Recipient country/
region/project/programmeb
Total amount
Statusc
Funding sourceg
Financial
instrumentg Type of support
g, hSector
dAdditional
informatione
Climate-specificf
Zambia / 5,000,000.00 5,000,000.00 Committed ODA Grant Mitigation Forestry,
Agriculture
Latin America and the Caribbean,
Caribbean Islands /
300,000.00 300,000.00 Committed ODA Grant Mitigation Energy
Abbreviations: ODA = official development assistance, OOF = other official flows; USD = United States dollars.
Custom Footnotes
c Parties should explain, in their biennial reports, the methodologies used to specify the funds as provided, committed and/or pledged. Parties will provide the information for as many status categories as
appropriate in the following order of priority: provided, committed, pledged.
a Parties should fill in a separate table for each year, namely 2011 and 2012, where 2014 is the reporting year.
b Parties should report, to the extent possible, on details contained in this table.
d Parties may select several applicable sectors. Parties may report sectoral distribution, as applicable, under “Other”.
e Parties should report, as appropriate, on project details and the implementing agency.
f Parties should explain in their biennial reports how they define funds as being climate-specific.
g Please specify.
h Cross-cutting type of support refers to funding for activities which are cross-cutting across mitigation and adaptation.

Table 8 USA_BR2_v1.0
Provision of technology development and transfer supporta,b
Recipient country and/or region Targeted area
Measures and
activities related to
technology transfer
Sectorc
Source of the funding
for technology
transfer
Activities undertaken
byStatus Additional information
d
Initially piloted in 17 countries (including
Armenia, Chile, Ethiopia, Honduras, India,
Kenya, Liberia, Maldives, Mali, Mongolia,
Nepal, Solomon Islands, and Tanzania), with
plans to extend to global coverage in future years
Mitigation Readiness for
Investment in
Sustainable Energy
Index
Energy Public Public Implemented The index (1) provides information on country performance in terms of the
market conditions, policies, institutions, laws, and regulations that contribute
to an enabling environment for private
investment; (2) builds on existing measures, such as the World Bank’s
“Doing Business Index,” while identifying sectorspecific barriers and
incentives; and (3) guides donors and developing
country governments toward concrete measures for improving the enabling
environment for private-sector investments in clean technologies.
Sub-Saharan Africa Mitigation Power Africa Energy Private and Public Public Implemented This initiative (1) provides early-stage transaction support, financing support,
assistance with regulatory and policy design and reform, capacity building,
legal assistance, and other informational resources to facilitate the
deployment of clean energy technologies throughout sub-Saharan Africa; and
(2) aims to double access to power in sub-Saharan Africa through advancing
the transfer of assets from the public to the private sector.
Subregions of Latin America (the Andean region
and Caribbean), Africa (East Africa and the
Sahel), and Asia (South Asia and Southeast
Asia), starting with Colombia, Ethiopia, and
Bangladesh
Adaptation Climate Services For
Resilient
Development
Other (Cross-
Cutting)
Private and Public Private and Public Implemented This program (1) enables developing countries to access and use climate
information to enhance decision making; (2) provides needed climate
services—including actionable science, data, information, tools, and
training—to developing countries that are working to strengthen their
national resilience
to the impacts of climate change; (3) comprises an international group of
founding partner institutions (e.g., American Red Cross, Asian Development
Bank, Esri, Google, Inter-American
Development Bank, Skoll Global Threats Fund, and United Kingdom) to
pool resources and leverage one another’s efforts; and (4) works with Peace
Corps to provide support for on-the ground implementation of climate-
resilience activities.

Table 8 USA_BR2_v1.0
Provision of technology development and transfer supporta,b
Recipient country and/or region Targeted area
Measures and
activities related to
technology transfer
Sectorc
Source of the funding
for technology
transfer
Activities undertaken
byStatus Additional information
d
Africa, Asia, Latin America Adaptation U.S. Forest Service-
International Union of
Forest Research
Organizations
Partnership
Other
(Forestry)
Public Public Implemented This partnership (1) strengthens national forest research systems and
enhances the development and implementation of sound forest management
policies and practices through the generation
and dissemination of quality-research results on forests and trees in Africa,
Asia, and Latin America, particularly through capacity development,
assistance to scientists, and institution building; (2) mobilizes and
disseminates forest-related information; (3) implements capacity-building
activities through the International Union of Forest Research Organizations’
Special Program for Development of Capacities; and (4) assists forest
research institutions to effectively contribute to shaping national and local
forest policies and sustainable forest management systems.
Global Adaptation Global Forest
Information Service
Other
(Forestry)
Public Public Implemented This service (1) provides a framework and information services to scientists
and policymakers to enable sharing of forest-related data and information
through a single gateway; and (2) promotes the dissemination and sharing of
forest information and knowledge by developing a common information
platform, building capacity, and enhancing partnerships among forestry
information providers and users.
Members: Australia, Brazil, Canada, China,
Denmark, European Commission, Finland,
France, Germany, India, Indonesia, Italy, Japan,
Korea, Mexico, Norway, Russia, Saudi Arabia,
South Africa, Spain, Sweden, United Arab
Emirates, United Kingdom, and United States
Mitigation Clean Energy
Ministerial (CEM)
Energy Public Public Implemented This high-level global forum promotes policies and programs that advance
clean energy technology, share lessons learned and best practices, and
encourage the transition to a global clean energy economy. Initiatives (such
as Global LEAP, 21st Century Power Partnership, SEAD, and ISGAN,
described below) are based on areas of common interest among participating
governments and other stakeholders.
Africa, India, and South Asia Mitigation Global Lighting and
Energy Access
Partnership
Energy Public Public Implemented Global LEAP (1) enhances the efficiency of the direct current (DC)-powered
appliances designed for use in an off-grid context (e.g., using home-based
electricity systems, often powered by a solar panel on the roof, or
community-level DC power via minigrids); (2) catalyzes markets through
support for quality
assurance frameworks, which build consumer and investor confidence; (3)
encourages market transformation toward the best, most efficient off-grid
energy service technologies through its awards programs; and (4) facilitates
collaboration among donors in the off-grid lighting and energy access space.

Table 8 USA_BR2_v1.0
Provision of technology development and transfer supporta,b
Recipient country and/or region Targeted area
Measures and
activities related to
technology transfer
Sectorc
Source of the funding
for technology
transfer
Activities undertaken
byStatus Additional information
d
India, Mexico, and South Africa Mitigation 21st Century Power
Partnership
Energy Public Public Implemented A global partnership that (1) provides in-depth technical assistance to
support transformation of power systems and enable increased penetration of
renewable energy, energy efficiency, storage, and smart grid technologies;
(2) conducts thought leadership reports and web seminars on innovations in
clean power system transformation to enable global education and support
for strategies for increased use of clean energy technologies.
India, Mexico, South Africa, and Indonesia Mitigation Super-efficient
Equipment and
Appliance
Deployment (SEAD)
Energy Public Public Implemented This global partnership (1) provides direct technical assistance to support the
development of best-practice appliance energy efficiency policies and
programs, and (2) supports voluntary collaboration among governments
working to promote the manufacture, purchase, and use of energy-efficient
appliances, lighting, and equipment worldwide.
Official participating countries: Australia,
Austria, Belgium, Canada, France, Germany,
India, Italy, Korea, Mexico, the Netherlands,
Sweden, Switzerland, and United States
Mitigation International Smart
Grid Action Network
(ISGAN)
Energy Public Public Implemented ISGAN (1) facilitates dynamic knowledge sharing, technical assistance, and
project coordination on innovative policies, regulations, and projects and
related best practices; (2) develops testing standards for smart grid
components; (3) facilitates coordination of testing efforts across a
consortium of international laboratories; (4) authors reports and other
resources on emerging smart grid concepts, with a focus on reaching
policymakers, regulators, and technology developers and implementers; (5)
develops tools for assessing the costs and benefits of implementing smart
grid projects; and (6) convenes a network of country representatives,
regulators, policymakers, and energy service and technology providers to
exchange best practices and lessons learned.
a To be reported to the extent possible.
Custom Footnotes
b The tables should include measures and activities since the last national communication or biennial
report.c Parties may report sectoral disaggregation, as appropriate.
d Additional information may include, for example, funding for technology development and transfer provided, a short description of the measure or activity and co-financing arrangements.
This table is purely illustrative and is not a comprehensive list of U.S. technology development and transfer activities.

Table 9 USA_BR2_v1.0
Provision of capacity-building supporta
Recipient country/region Targeted area Programme or project title Description of programme or project b,c
Global Mitigation SilvaCarbon SilvaCarbon enhances capacity worldwide for monitoring and
managing forest and terrestrial carbon. The program draws on
the expertise of the U.S. scientific and technical community,
including experts from government, academia, nongovernmental
organizations, and industry. Working in partnership with
developing countries and others, SilvaCarbon enhances
worldwide capacity by identifying, testing, and disseminating
good practices and cost-effective, accurate technologies for
monitoring and managing forest and terrestrial carbon.
Africa, Mekong region, Himalaya region Adaptation SERVIR This joint venture between NASA, USAID, and leading regional
technical institutes provides state-of-the-art, satellite-based Earth
monitoring, imaging and mapping data, geospatial information,
predictive models, and science applications to help improve
capacity for environmental decision making among
developing nations in eastern and southern Africa, the Hindu-
Kush region of the Himalayas, and the lower Mekong River
Basin in Southeast Asia.
Global Adaptation Public–Private Partnership:
Climate Services for
Resilient Development
USAID launched this new public–private partnership to
strengthen the resilience of countries contending with climate
change. Working with partners that include the United Kingdom,
the American Red Cross, and Google, USAID aims to increase
the capacity of partner countries by making existing climate
data, scientific information, tools, and services more accessible
to decision makers and vulnerable individuals around the world.
Global Mitigation Enhancing Capacity for Low
Emission Development
Strategies (EC-LEDS)
This program supports partner countries in developing and
implementing low-emission development strategies and country-
led national plans to promote sustainable development, while
reducing GHG emissions. EC-LEDS provides countries with
technical assistance to develop GHG inventories, conduct a
range
of economic analyses, leverage finance, and plan and implement
LEDS across multiple economic sectors. Actions stemming from
LEDS include putting policies, regulations, and infrastructure in
place to dramatically increase clean energy use and energy
efficiency and piloting payments for sustainable forest
management, including REDD+ arrangements.
Peru, Himalaya Hindu- Kush region of South
Asia, Pamir Mountain region of Central Asia
Adaptation High Mountain Adaptation
Partnership
With support from USAID and DOS, this partnership facilitates
South–South learning to understand and manage climaterelated
challenges in high-mountain communities. The program has
pioneered rapid assessment techniques for studying the risks of
glacier lakes and has supported community-led consultation and
planning to address these risks in a timely and effective fashion.
Global Mitigation Clean Energy Solutions
Center
CESC helps governments design and adopt policies and
programs that support the deployment of clean energy
technologies. It offers no-cost expert policy assistance, webinars
and training forums, clean energy policy reports, data, and tools
provided in partnership with more than 35 leading international
and regional clean energy organizations.
Global Multiple Areas Climate Economic Analysis
for Development,
Investment, and Resilience
(CEADIR) Project
CEADIR aims to increase the capacity of governments, USAID
missions, universities and research institutes, private companies,
and civil society organizations to conduct and use economic
analyses for global climate change mitigation and adaptation.
The project also seeks to mobilize finance for
climate-related investment. CEADIR provides clients access to
global best practices and innovative tools for analysis of and
investment in adaptation, clean energy, and sustainable
landscapes, as well as supports low-emission development
strategies.

Table 9 USA_BR2_v1.0
Provision of capacity-building supporta
Recipient country/region Targeted area Programme or project title Description of programme or project b,c
Global Adaptation GIZ Climate Finance
Readiness
This comprehensive climate finance-readiness support program
prioritizes the role of domestic budgets and private investment in
climate financing and the facilitation of access to international
funds, such as the Green Climate Fund. The goals of the USAID-
GIZ partnership include (1) building the capacity of countries
to develop ambitious and effective strategies for large-scale
mitigation and adaptation linked to enhanced public- and private-
sector financing, (2) removing barriers to increased private-
sector involvement, (3) increasing the capacity of institutions to
access and use climate finance, and (4) increasing the capacity
of mission staff to understand and address climate finance
issues.
a To be reported to the extent possible.
c Additional information may be provided on, for example, the measure or activity and co-financing arrangements.
Custom Footnotes
b Each Party included in Annex II to the Convention shall provide information, to the extent possible, on how it has provided capacity-building support that
responds to the existing and emerging capacity-building needs identified by Parties not included in Annex I to the Convention in the areas of mitigation, adaptation
and technology development and transfer.
This table is purely illustrative and does not represent an exhaustive list of U.S. capacity-building activities.Capacity-building needs are addressed throughout all of
U.S. support activities, not as separate line items or projects, and are provided as a means for taking action on a mutually shared goal.DOS = U.S. Department of
State; GHG = greenhouse gas; GIZ = Deutsche Gesellschaft für Internationale Zusammenarbeit; NASA = National Aeronautics and Space Administration; REDD+
= reducing emissions from deforestation and forest degradation in developing countries; USAID = U.S. Agency for International Development.