BPI Investor Update · CIR 51% 53% 1.8% ROE 14.7% 13.1% -1.6% ... P4.13 bn (-63.1) ... BPI Investor...
21
BPI Investor Update Strength and Quality in Earnings As of September 30, 2017
Transcript of BPI Investor Update · CIR 51% 53% 1.8% ROE 14.7% 13.1% -1.6% ... P4.13 bn (-63.1) ... BPI Investor...
CONFIDENTIAL
BPI Investor UpdateStrength and Quality in Earnings
As of September 30, 2017
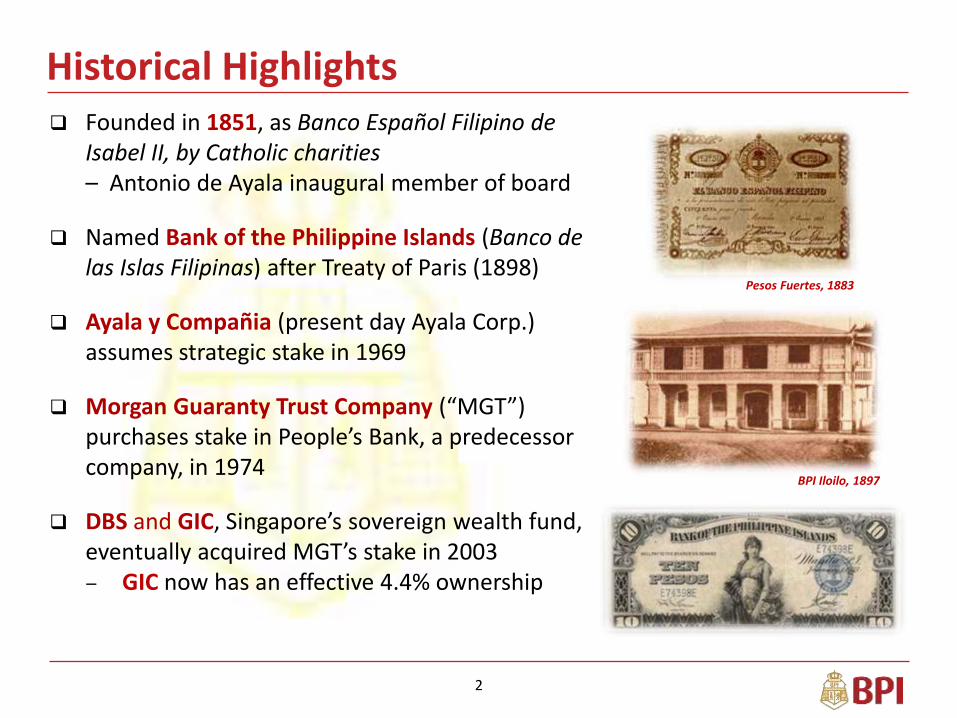
Founded in 1851, as Banco Español Filipino de Isabel II, by Catholic charities– Antonio de Ayala inaugural member of board
Named Bank of the Philippine Islands (Banco de las Islas Filipinas) after Treaty of Paris (1898)
Ayala y Compañia (present day Ayala Corp.) assumes strategic stake in 1969
Morgan Guaranty Trust Company (“MGT”)purchases stake in People’s Bank, a predecessor company, in 1974
DBS and GIC, Singapore’s sovereign wealth fund, eventually acquired MGT’s stake in 2003– GIC now has an effective 4.4% ownership
Historical Highlights
Pesos Fuertes, 1883
BPI Iloilo, 1897
2

GIC, 4.4%
RCAM*, 8.3%
Ayala Corp,48.2%
Public Float,39.1%
Shareholders & Equity Profile
Fundamentals Description
PCOMP Index 4.97% weight
Stock Price P103.90 per share
BV per share P45.45
P-B Ratio 2.29x
P-E Ratio 17.55x
Dividends P1.80 per share
Issued Shares 3.939 bn
Market Cap P409.304 bn
Shareholders As of November 24, 2017
* Roman Catholic Archdiocese of Manila
3
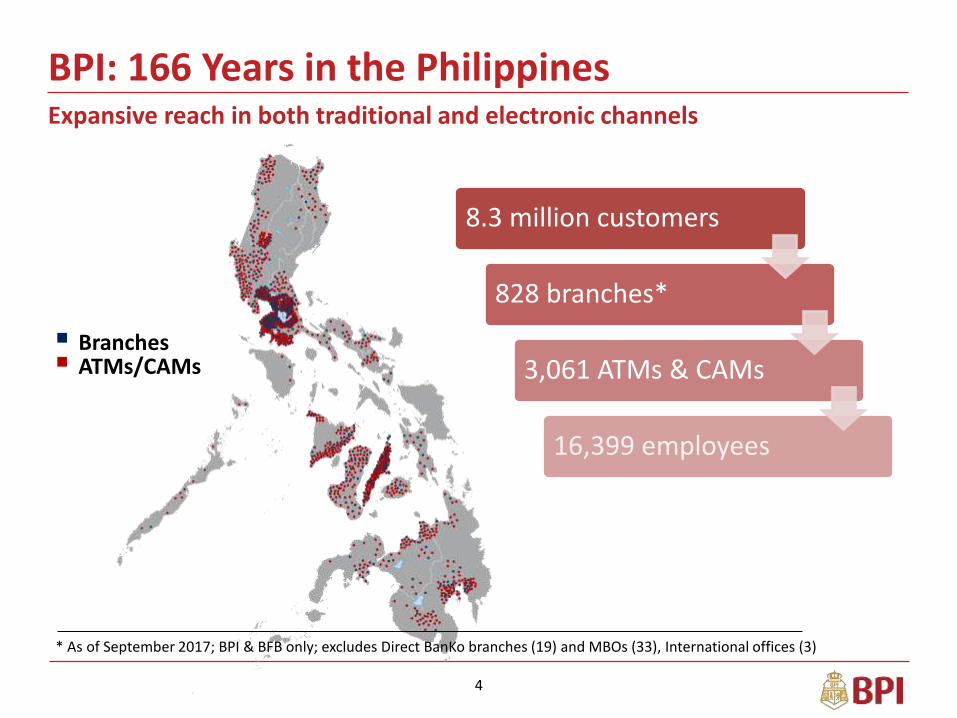
BPI: 166 Years in the Philippines
Branches ATMs/CAMs
Expansive reach in both traditional and electronic channels
8.3 million customers
828 branches*
3,061 ATMs & CAMs
16,399 employees
4
* As of September 2017; BPI & BFB only; excludes Direct BanKo branches (19) and MBOs (33), International offices (3)

Electronic ChannelsSignificant leadership in technology-based banking
5
+14.2%
+23.3%
-0.5%
-
Express Mobile
Express Phone -3.5%
No. of Clients Sep 2015 Sep 2016 Sep 2017
Express Online 2,178,921 2,513,293 2,870,517
Express Mobile 1,547,201 1,951,842 2,405,698
Express Phone 821,966 799,919 771,887
ExpressLink 25,289 29,138 29,002
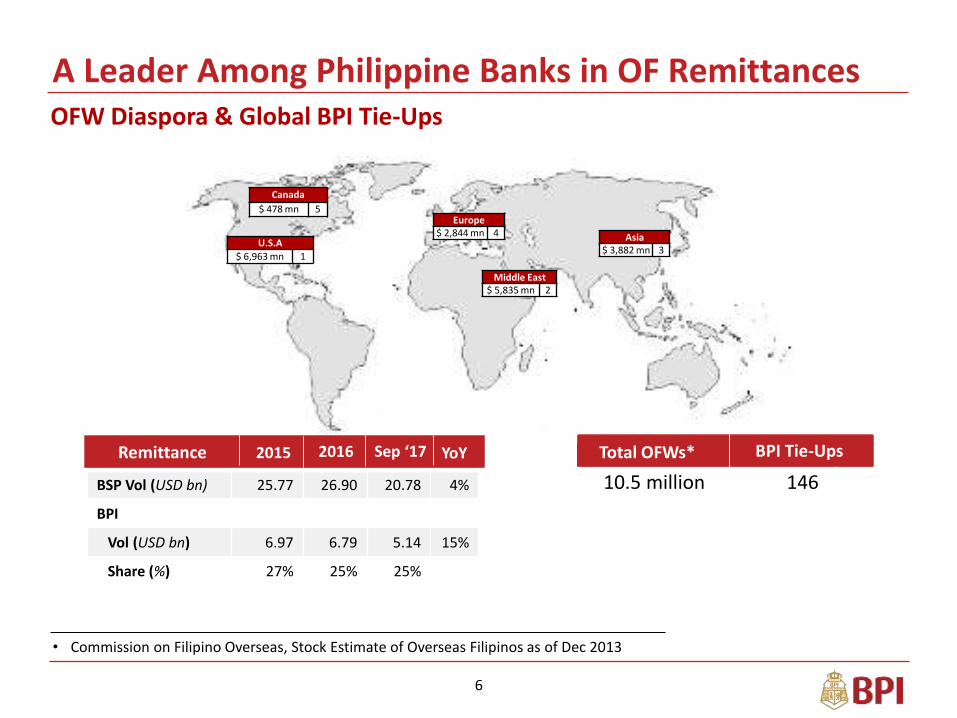
• Commission on Filipino Overseas, Stock Estimate of Overseas Filipinos as of Dec 2013
ITSC Meeting
A Leader Among Philippine Banks in OF Remittances
BSP Vol (USD bn) 25.77 26.90 20.78 4%
BPI
Vol (USD bn) 6.97 6.79 5.14 15%
Share (%) 27% 25% 25%
Total OFWs* BPI Tie-Ups10.5 million 146
OFW Diaspora & Global BPI Tie-Ups
Canada
$ 478 mn 5Europe
$ 2,844 mn 4 Asia$ 3,882 mn 3
Middle East$ 5,835 mn 2
U.S.A
$ 6,963 mn 1
Remittance 2015 2016 Sep ‘17 YoY Total OFWs* BPI Tie-Ups
6

Excellence in Debt Capital Markets
7
Underwriter Mkt Share (%) Issues
China Banking Corp 1 16.4 12
BDO Capital Investment 2
BPI Capital Corporation 3
ING Group 4
5Unicapital Inc.
Standard Chartered 6
7Security Bank Corp
16.2
13.2
12.2
7.1
6.8
6.4
10
8
6
5
6
9
Sept 2017 Rank
Dec 2016
Feb 2017
Jun 2017
Sep 2017
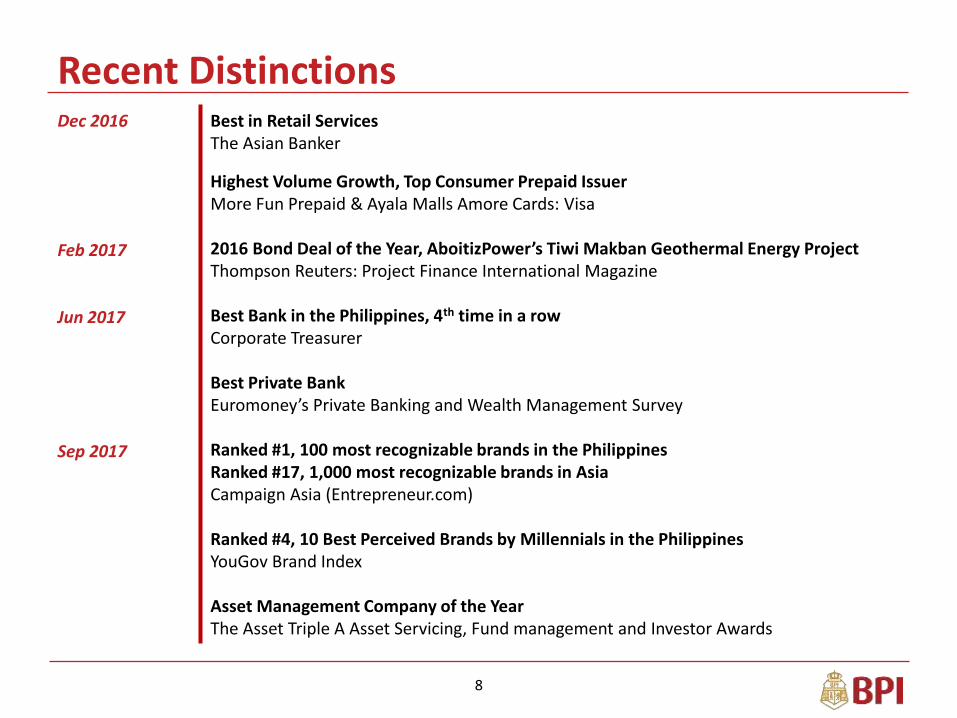
Best in Retail ServicesThe Asian Banker
Highest Volume Growth, Top Consumer Prepaid IssuerMore Fun Prepaid & Ayala Malls Amore Cards: Visa
2016 Bond Deal of the Year, AboitizPower’s Tiwi Makban Geothermal Energy ProjectThompson Reuters: Project Finance International Magazine
Best Bank in the Philippines, 4th time in a rowCorporate Treasurer
Best Private BankEuromoney’s Private Banking and Wealth Management Survey
Ranked #1, 100 most recognizable brands in the PhilippinesRanked #17, 1,000 most recognizable brands in AsiaCampaign Asia (Entrepreneur.com)
Ranked #4, 10 Best Perceived Brands by Millennials in the PhilippinesYouGov Brand Index
Asset Management Company of the YearThe Asset Triple A Asset Servicing, Fund management and Investor Awards
Recent Distinctions
8
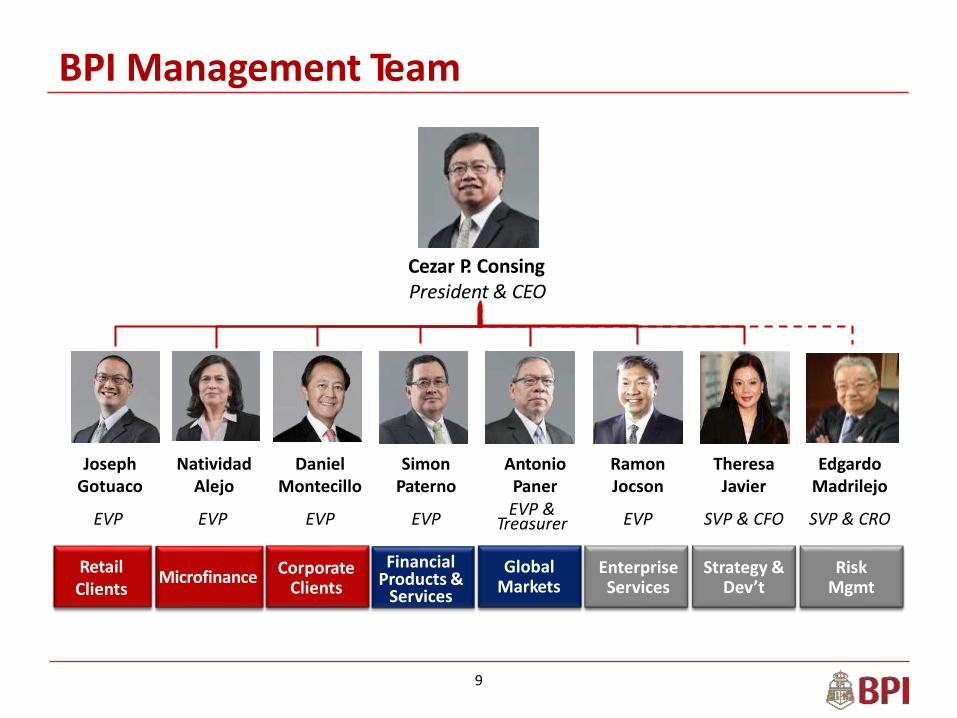
BPI Management Team
Picture
Cezar P. ConsingPresident & CEO
RetailClients
EnterpriseServices
Financial Products &
Services
Corporate Clients
Global Markets
JosephGotuaco
NatividadAlejo
Daniel Montecillo
SimonPaterno
AntonioPaner
Ramon Jocson
Theresa Javier
Edgardo Madrilejo
EVP EVP EVP EVPEVP &
Treasurer EVP SVP & CFO SVP & CRO
Strategy &Dev’t
Risk Mgmt
9
Microfinance

Sept 2017 Performance HighlightsSustained growth in assets
in P Bn 2016 2017 YoY (ppt)
Balance Sheet
Assets 1,590.0 1,799.8 13.2%
Net Loans 931.1 1,122.2 20.5%
Deposits 1,320.2 1,504.9 14.0%
CASA 992.9 1,073.2 8.1%
Capital 165.6 179.0 8.1%
Income Statement
Net Revenues 50.4 53.0 5.2%
Net Int Income 31.3 35.5 13.5%
Non-Int Income 19.1 17.5 -8.4%
Opex 25.6 27.9 8.9%
Provisions 4.0 3.6 -8.7%
Net Income 17.4 17.0 -1.9%
Comp Income 18.7 17.3 -7.5%
10

Sept 2017 Performance HighlightsAdequate capital, and strong asset quality
2016 2017 YoY (ppt)
Balance Sheet
LDR 71% 75% 4.0%
CASA Ratio 75% 71% -3.9%
Profitability
CIR 51% 53% 1.8%
ROE 14.7% 13.1% -1.6%
ROA 1.5% 1.3% -0.2%
Asset Quality
Gross 90-Day NPL 1.64% 1.47% -0.2%
NPL Cover 112% 126% 13.8%
Capital
CAR 14.2% 13.4% -0.8%
CET1 13.3% 12.5% -0.8%
11

18.7 17.3
Sep 2016 Sep 2017
17.4 17.0
Sep 2016 Sep 2017
Strong Earnings QualityNet Income slightly down YoY; Excluding one-off gains, up 33%
12
Net IncomeP bn
Comprehensive IncomeP bn
-1.9%
YoY Growth
-7.5%
YoY Growth

31.3 35.5
19.1 17.5
50.4 53.0
Sep 2016 Sep 2017
Revenue Growth Remains PositiveCore intermediation business continued to be strong driver of revenues
13
RevenuesP bn
Revenue Mix
Net Interest Income Non-Interest Income
13.5%
-8.4%
YoY Growth
5.2%
62.0% 66.9%
38.0% 33.1%
Sep 2016 Sep 2017

12.615.1
6.6 2.4
19.117.5
Sep 2016 Sep 2017
Non-Interest Income
14
Securities & FX trading decrease P4.13 bn (-63.1) vs last year
Fees & other income up by P2.5 bn (20.1%) vs last yeardriven by:– Credit card income– Bank Commissions– Corporate Finance – Asset Sales
Breakdown of Non-Interest IncomeP bn
-27.84%
12.1%
20.1%
-63.1%
YoY Growth
-8.4%
66% 86%
34% 14%
Fees & Others
Sec & FX
Slowdown in securities trading shrunk non-interest income in Sept 2017
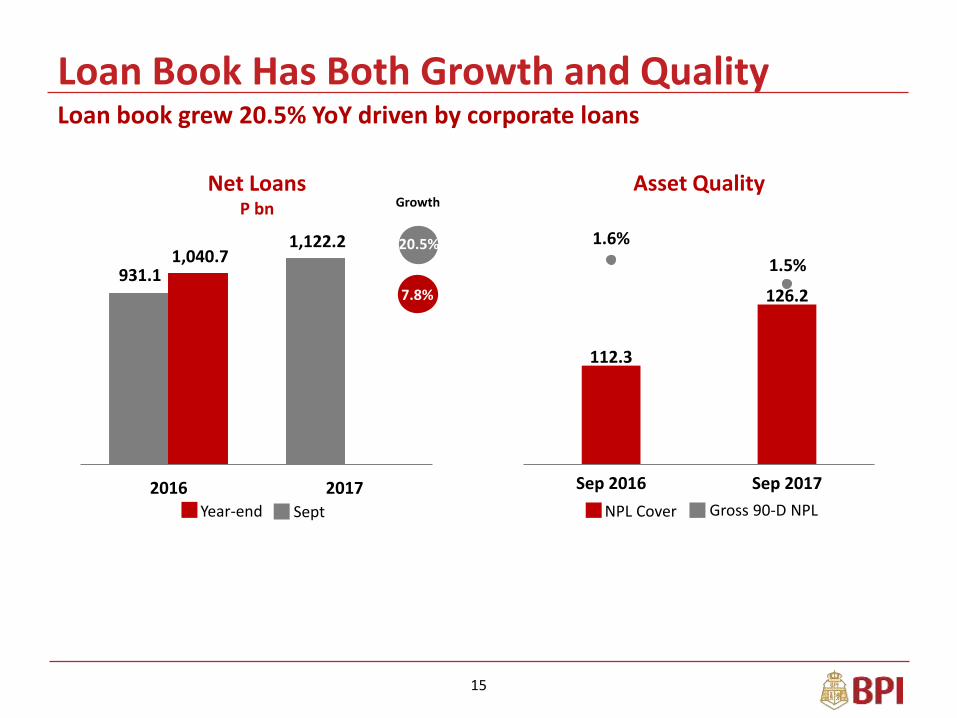
931.1
1,122.2 1,040.7
2016 2017
Loan Book Has Both Growth and Quality
15
Net LoansP bn
Asset Quality
NPL Cover Gross 90-D NPL
7.8%
Growth
20.5%
Year-end Sept
Loan book grew 20.5% YoY driven by corporate loans
112.3
126.2
1.6%
1.5%
Sep 2016 Sep 2017

112.9 117.1
53.3 57.1
40.348.8
Sep 2016 Sep 2017
656.8
834.6
82.2
81.1
Sep 2016 Sep 2017
YoY Growth
Sustained Growth in Loan Segments
Corporate Loan BalancesP bn
Retail Loan BalancesP bn
89% 91%Corp&MM%
11% 9%SME%
55% 52%Housing%
26% 26%Auto%
19% 22%Cards%
23.9%
-1.3%
27.1%
739.0
915.7
206.5222.9
1 Cards inclusive of Personal Loans.
3.7%
7.0%
21.0%
7.9%
YoY Growth
Going beyond marginal bookings
16

75.2%
71.3%70.5%
74.6%
Sep 2016 Sep 2017
1,320.2 1,504.9
992.9 1,073.2
Sep 2016 Sep 2017
Deposit and CASA Growth Remains StrongEfficiency continues to improve with LDR ratio
DepositsP bn
CASA Ratio, LDR
14.0%
8.1%
YoY Growth
Total Deposits CASA Deposits CASA Ratio LDR
17
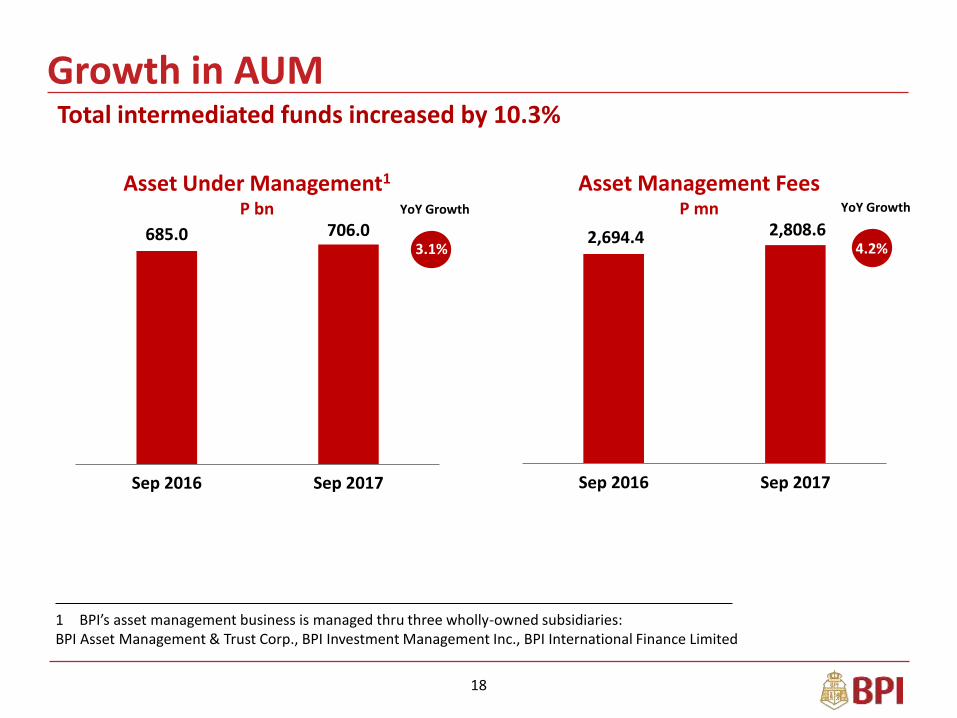
2,694.4 2,808.6
Sep 2016 Sep 2017
685.0 706.0
Sep 2016 Sep 2017
Growth in AUM
18
Asset Under Management1
P bn
Asset Management FeesP mnYoY Growth
3.1%
-15.8%
YoY Growth
4.2%
Total intermediated funds increased by 10.3%
1 BPI’s asset management business is managed thru three wholly-owned subsidiaries:BPI Asset Management & Trust Corp., BPI Investment Management Inc., BPI International Finance Limited
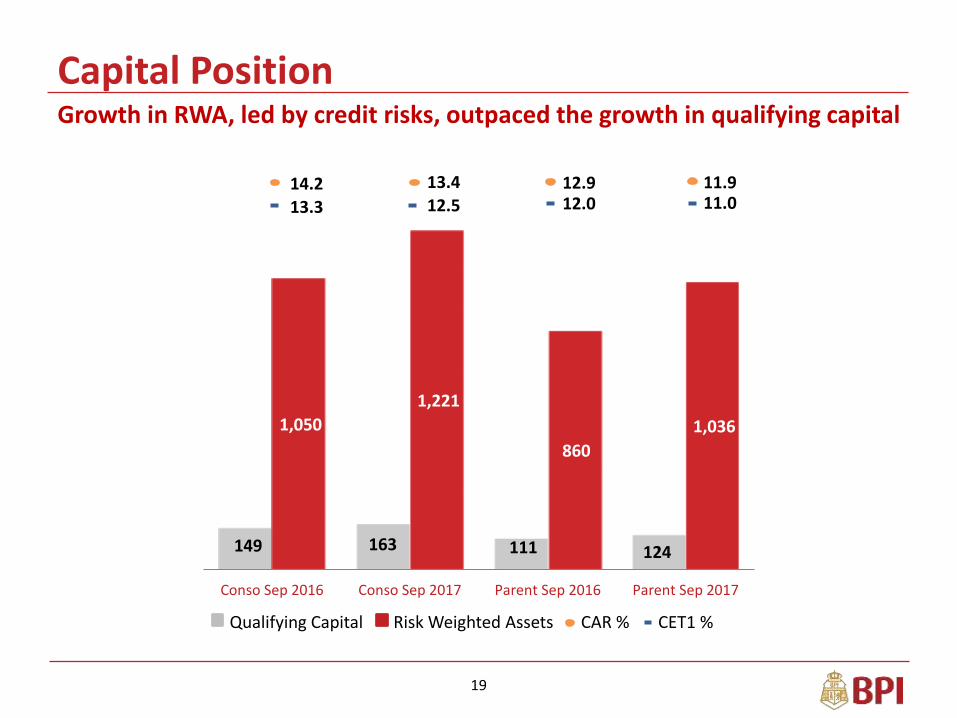
149 163 111 124
1,050
1,221
860
1,036
Conso Sep 2016 Conso Sep 2017 Parent Sep 2016 Parent Sep 2017
Capital Position
19
13.314.2 13.4
12.512.912.0
11.911.0
CAR % CET1 %Qualifying Capital Risk Weighted Assets
Growth in RWA, led by credit risks, outpaced the growth in qualifying capital

Credit RatingsMoody’s1 Fitch Ratings2 Capital
Intelligence3
Bank Financial Strength Rating
- - BBB
LT Local Currency Rating
- BBB- -
LT Foreign Currency Rating
Baa2/Prime-2 BBB- BBB
Outlook Stable Stable Stable
LT Foreign -Philippines
- BBB- -
/1 As of Sept 2017; /2 As of February 2017; /3 As of October 2017
22

CONFIDENTIAL
Thank you.
As of September 30, 2017
BPI Investor UpdateStrength and Quality in Earnings