BP Stat Review
27
bp.com/statisticalreview BP Statistical Review of World Energy June 2010 Recession and Recovery Christof Rühl Group Chief Economist © BP 2010
-
Upload
petrolifera -
Category
Documents
-
view
219 -
download
0
Transcript of BP Stat Review

bp.com/statisticalreview
BP Statistical Reviewof World EnergyJune 2010
Recession and Recovery
Christof RühlGroup Chief Economist
© BP 2010

BP Statistical Review of World Energy 2010
© BP 2010
Outline
• Introduction
• Recession and Recovery
• Fuel by Fuel
• Conclusions
BP Statistical Review of World Energy 2010
© BP 2010
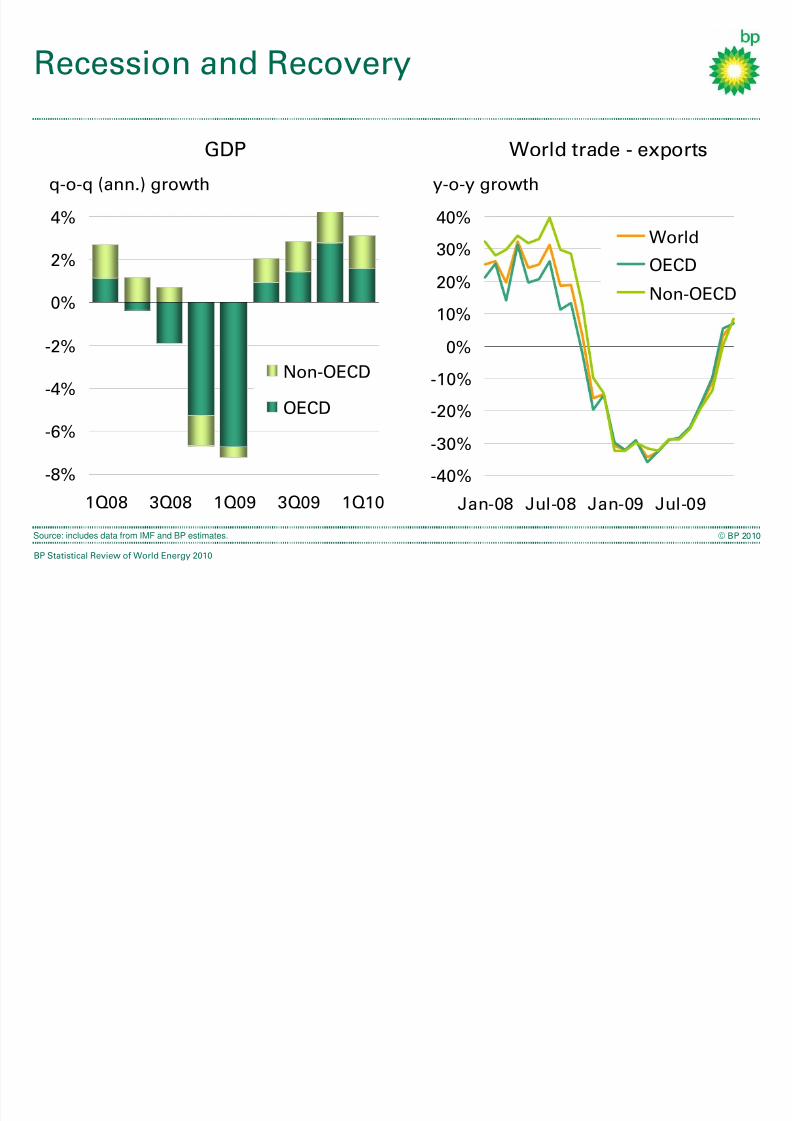
-8%
-6%
-4%
-2%
0%
2%
4%
1Q08 3Q08 1Q09 3Q09 1Q10
Non-OECD
OECD
q-o-q (ann.) growth
GDP
Recession and Recovery
-40%
-30%
-20%
-10%
0%
10%
20%
30%
40%
Jan-08 Jul-08 Jan-09 Jul-09
World
OECD
Non-OECD
World trade - exports
y-o-y growth
Source: includes data from IMF and BP estimates.

BP Statistical Review of World Energy 2010
© BP 2010
-6%
-4%
-2%
0%
2%
4%
2003-07 2008 2009
GDP
Energy
GDP and Energy Consumption Growth
OECD Non-OECD
0%
2%
4%
6%
8%
2003-07 2008 2009
Source: includes data from Oxford Economics.
y-o-y growth y-o-y growth

BP Statistical Review of World Energy 2010
© BP 2010
-300
-200
-100
0
100
200
300
World OECD China & India Other non-OECD
Oil Gas Coal Nuclear Hydro
Primary Energy Consumption
Growth 2009, Mtoe
BP Statistical Review of World Energy 2010
© BP 2010
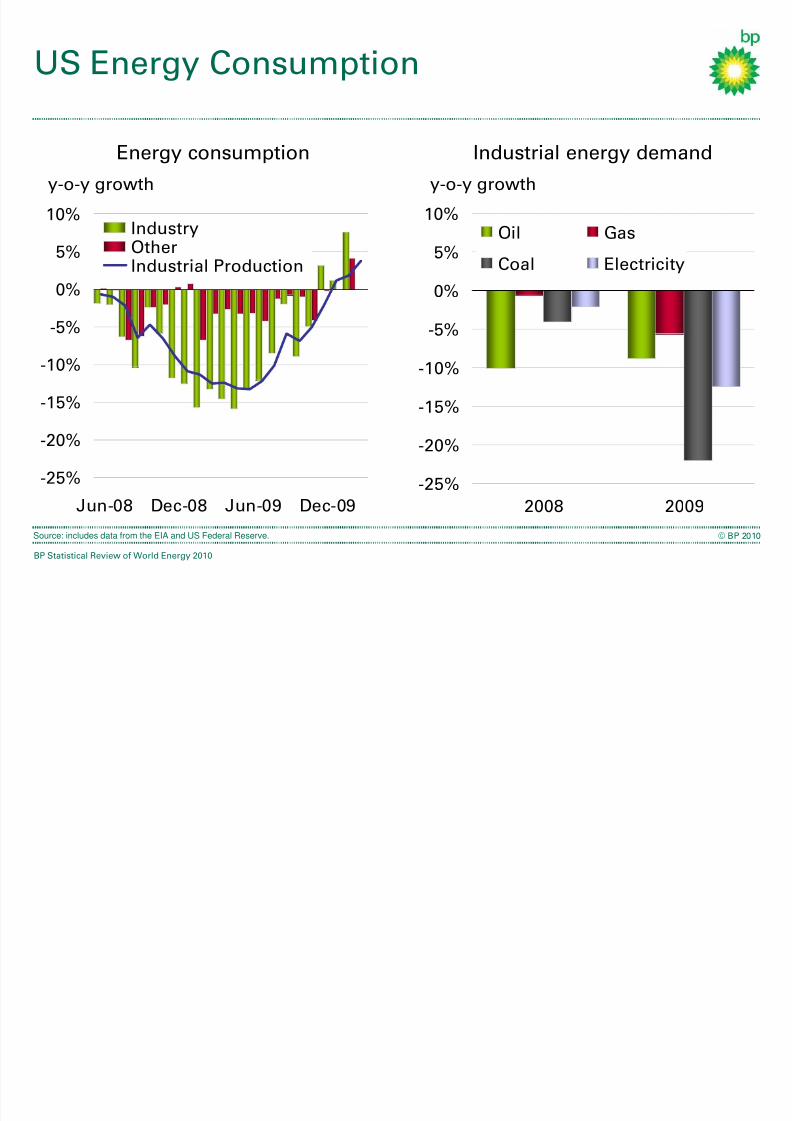
-25%
-20%
-15%
-10%
-5%
0%
5%
10%
Jun-08 Dec-08 Jun-09 Dec-09
IndustryOtherIndustrial Production
y-o-y growth
US Energy Consumption
-25%
-20%
-15%
-10%
-5%
0%
5%
10%
2008 2009
Oil Gas
Coal Electricity
Source: includes data from the EIA and US Federal Reserve.
Energy consumption
y-o-y growth
Industrial energy demand

BP Statistical Review of World Energy 2010
© BP 2010
0
20
40
60
80
100
120
140
Jan-07 Jul-07 Jan-08 Jul-08 Jan-09 Jul-09 Jan-10
Oil (Brent)
Gas (Henry Hub)
Coal (Basket)
Energy Prices
$/boe
Source: includes data from Platts and McCloskey.

BP Statistical Review of World Energy 2010
© BP 2010
19,700
19,900
20,100
20,300
Decline Growth
UOt
0%
10%
20%
30%
40%
2000 2003 2006 2009
Nuclear
Renewables
Hydro
Total electricity generation
TWh
2008 2009
Fromfossilfuels
Nuclear Hydro
Renewables
Non-Fossil Fuels and Power Generation
Share of total generation

BP Statistical Review of World Energy 2010
© BP 2010
0
50
100
150
200
2005 2006 2007 2008 2009
US Germany
Spain China
RoW
MexicoNorth Sea
Wind capacity
Source: includes data from BTM Consult, EIA and F.O. Lichts.
Renewable Energy
Ethanol production
0
10
20
30
40
2005 2006 2007 2008 2009
RoW
US
Brazil
MtoeGW

BP Statistical Review of World Energy 2010
© BP 2010
0
30
60
90
120
150
2002 2003 2004 2005 2006 2007 2008 2009 2010
Dated Brent Annual averages$/bbl
Crude Oil Prices
Source: includes data from Platts.
BP Statistical Review of World Energy 2010
© BP 2010
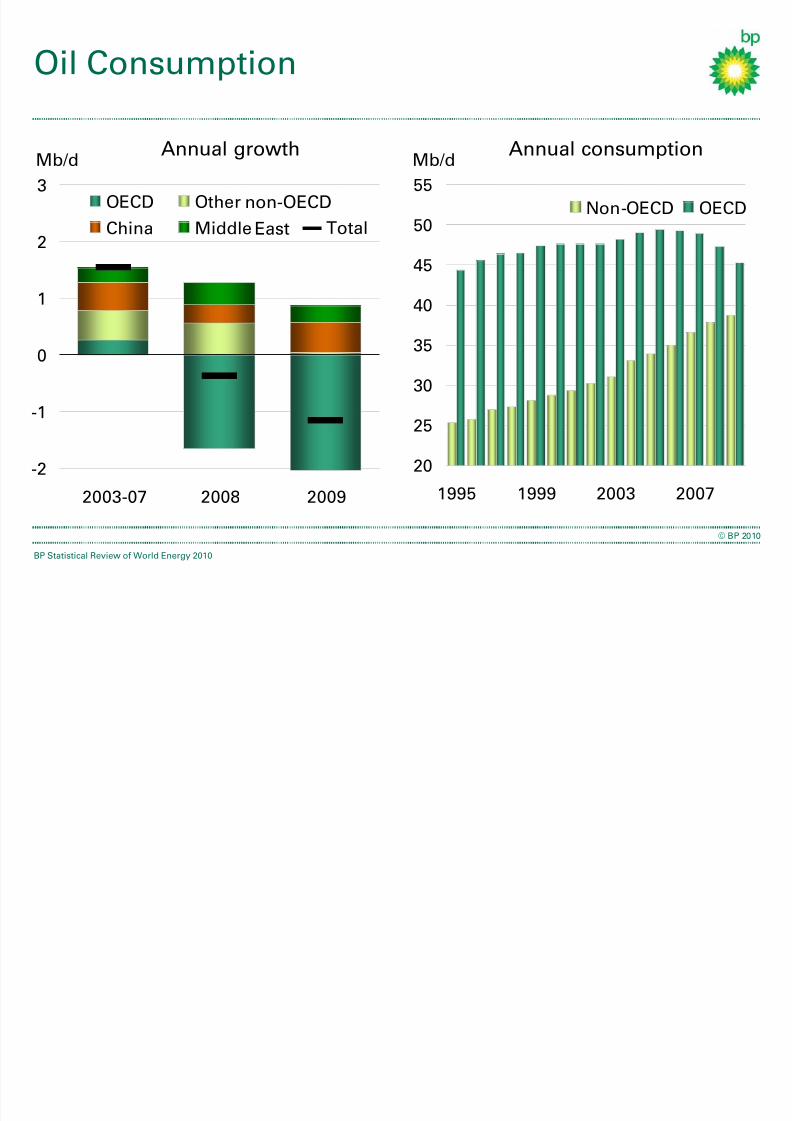
Oil Consumption
Annual consumption
20
25
30
35
40
45
50
55
1995 1999 2003 2007
Non-OECD OECD
-2
-1
0
1
2
3
2003-07 2008 2009
OECD Other
China Middle
non-OECD
Mb/d
East
Annual growthMb/d
Total

BP Statistical Review of World Energy 2010
© BP 2010
-3
-2
-1
0
1
2
1Q08 2Q08 3Q08 4Q08 1Q09 2Q09 3Q09 4Q09
Global consumption Non-OPEC supply OPEC supply
y-o-y growth, Mb/d
Source: includes data from the IEA.
OPEC Supply Management

BP Statistical Review of World Energy 2010
© BP 2010
OPEC Production
Iraq
Ecuador
Qatar
Nigeria
Angola
Iran
Libya
Algeria
Kuwait
UAESaudi
Arabia
-1.2 -0.9 -0.6 -0.3 0.0 0.3
Decrease Increase
Venezuela
Mb/d
-1.2
-0.8
-0.4
0.0
0.4
0.8
2003-07 2008 2009
Saudi Arabia
Kuwait/UAE
Other
Mb/d2009 vs 2008 Annual average growth

BP Statistical Review of World Energy 2010
© BP 2010
0
50
100
150
200
Jan-08 Jan-09 Jan-10
Brent priceRig count excl. N. AmericaUS rig count
Non-OPEC Production
US
Russia
Brazil
Canada
UK
Norway
China
Mexico
-0.4 -0.2 0.0 0.2 0.4 0.6
Decrease Increase
OECD
FSU
Non-OECD
Azerbaijan
Kazakhstan
Source: includes data from Baker Hughes and Platts.
Mb/d Index: Jan 2008 = 100
Oil rig count and oil price2009 vs 2008

BP Statistical Review of World Energy 2010
© BP 2010
0
40
80
120
160
Jan-09 May-09 Sep-09 Jan-10
Crude Distillate
Oil Inventories
2400
2500
2600
2700
2800
2900
Jan Mar May Jul Sep Nov
04-08 Range 2009 2010
Mbbls
OECD commercial oil stocks
Mbbls
Oil in floating storage
Source: includes data from IEA.

BP Statistical Review of World Energy 2010
© BP 2010
0
2
4
6
8
10
2000 2002 2004 2006 2008 2010
ytd
BP GIM
10-yr. Av.
0
1
2
3
4
2006 2007 2008 2009
From new facilities
From lower crude runs
$/bbl
Source: includes data from Parpinelli Technon and ESAI.
y-o-y, Mb/d
Refining Margins and Spare Capacity
Refining margins Spare capacity growth

BP Statistical Review of World Energy 2010
© BP 2010
-2
-1
0
1
2
2005 2006 2007 2008 2009
non-OECD
OECD
Refinery utilisation
Crude Runs and Refinery Utilisation
Source: includes data from Parpinelli-Technon and ESAI.
78%
81%
84%
87%
90%
2005 2006 2007 2008 2009
World OECD
non-OECD
Crude run growth
y-o-y, Mb/d

BP Statistical Review of World Energy 2010
© BP 2010
-100
-80
-60
-40
-20
0
20
40
Consumption Production
Bcm2009 vs 2008
Natural Gas Market
0
2
4
6
8
10
12
2002 2004 2006 2008 2010
ytd
AGIP
Henry Hub
$/MmbtuGas prices
FSU
Other
OECD
Source: includes data from Platts and BMWi.

BP Statistical Review of World Energy 2010
© BP 2010
300
350
400
450
500
550
600
2005 2006 2007 2008 2009
Bcm
US Natural Gas Production
Total gas productionProduction growth vs. rig count
-20
-10
0
10
20
30
700 900 1100 1300 1500
2005
2006
2007
2008
Gas rig count
2009
y-o-y, Bcm
Other
Coal bed methane
Shale
Source: includes data from the EIA and Baker Hughes.

BP Statistical Review of World Energy 2010
© BP 2010
0%
10%
20%
30%
40%
1Q 2Q 3Q 4Q
2008
2009
0
20
40
60
80
100
Jan-08 Jan-09 Jan-10
Central Appalachian coal
Henry Hub
$/MWh
Source: includes data from the EIA and Platts. * Accounting for thermal efficiencies and transport cost of coal.
Gas share of generation from gas/coalCost in power generation*
US Power Sector Fuel Switching

BP Statistical Review of World Energy 2010
© BP 2010
Liquefied Natural Gas
0
50
100
150
200
250
2001 2003 2005 2007 2009
Bcm
Source: includes data from Cedigaz.
-10
0
10
20
2007 2008 2009
LNG exports by basin
Atlantic Basin
Pacific Basin
Middle East Europe
Other
Asia
y-o-y, Bcm
LNG import growth by region

BP Statistical Review of World Energy 2010
© BP 2010
-100
-80
-60
-40
-20
0
20
Bcm
Cons.Net
pipeline
Net LNG
Europe - 2009 vs 2008 FSU - 2009 vs 2008
Prod.
Gas-On-Gas Competition
Source: includes data from Cedigaz.
-100
-80
-60
-40
-20
0
20
Prod.
Cons.
Bcm
BP Statistical Review of World Energy 2010
© BP 2010
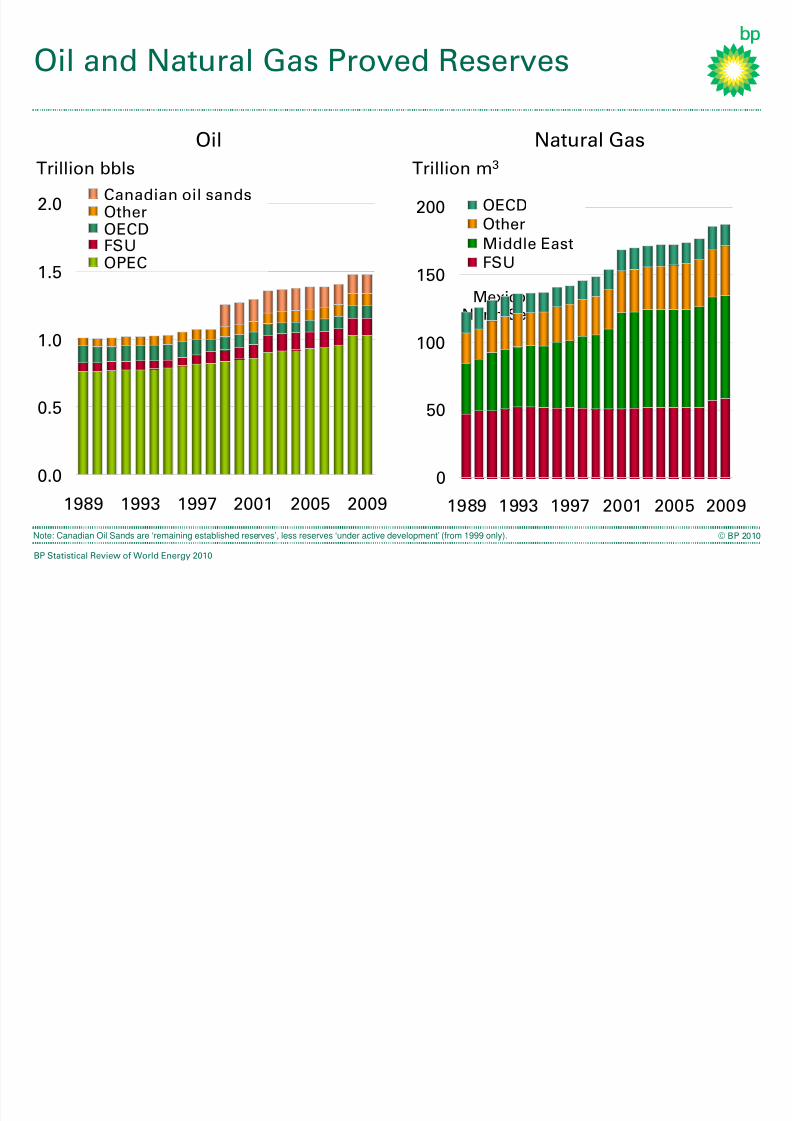
0.0
0.5
1.0
1.5
2.0
1989 1993 1997 2001 2005 2009
Canadian oil sandsOtherOECDFSUOPEC
MexicoNorth Sea
Oil
Oil and Natural Gas Proved Reserves
Natural Gas
0
50
100
150
200
1989 1993 1997 2001 2005 2009
OECD
Other
Middle East
FSU
Trillion m3Trillion bbls
Note: Canadian Oil Sands are ‘remaining established reserves’, less reserves ‘under active development’ (from 1999 only).

BP Statistical Review of World Energy 2010
© BP 2010
-200
-100
0
100
200
2003-07 2008 2009
China
India
OECD
Rest of World
Mtoe
Coal Consumption and Production
-60 -40 -20 0 20
India
Indonesia
Australia
Vietnam
Poland
Kazakhstan
Russia
US
Mtoe
2009 production changes ex-ChinaConsumption growth

BP Statistical Review of World Energy 2010
© BP 2010
Coal Prices and Indian Ocean Exports
0
50
100
150
200
Jan-07 Oct-07 Jul-08 Apr-09 Jan-10
Japan Steam coal
Qinhuangdao Spot
Newcastle, Australia
$/tonne
Source: includes data from McCloskey, Platts and FACTS.
Export shares
0%
10%
20%
30%
40%to China to India
08 09Australia
08 09Indonesia
08 09South Africa
Coal prices

BP Statistical Review of World Energy 2010
© BP 2010
Chinese Coal Consumption
0%
5%
10%
15%
20%
Cement Steel Other Power
0%
5%
10%
15%
20%
2003-07 2008 2009
GDP
Coal
Electricity
y-o-y growth
2009 coal consumption by use
Source: includes coal use estimates based on data from the National Bureau of Statistics.
Chinese GDP, coal and electricityy-o-y growth
Total

BP Statistical Review of World Energy 2010
© BP 2010
Conclusion
• It’s the Economy
• Maintaining growth has been energy intensive
• Long term trends in major fuel markets acceleratedduring recession and recovery
• So did the global re-allocation of energy resources,supporting growth in the developing world