BOTSWANA STEPS SURVEY REPORT ON Non-communicable Disease ...
132
REPUBLIC OF BOTSWANA BOTSWANA STEPS SURVEY REPORT ON Non-communicable Disease Risk Factors DECEMBER 30 TH 2015
Transcript of BOTSWANA STEPS SURVEY REPORT ON Non-communicable Disease ...

REPUBLIC OF BOTSWANA
BOTSWANA STEPS SURVEY REPORT
ON
Non-communicable Disease Risk Factors
DECEMBER 30TH 2015

Botswana Non-communicable Disease Risk Factor Surveillance - 2014 Page 2
INTRODUCTION
Non-communicable diseases constitute a major public health challenge that affects social
and economic development all over the world. A total of 56 million deaths occurred
worldwide during 2012. Of these, 38 million were due to NCDs, nearly three quarters of these
NCD deaths (28 million) occurred in low- and middle-income countries.
The leading causes of NCD deaths in 2012 were: cardiovascular diseases 17.5 million deaths,
or 46.2% of NCD deaths; cancers 8.2 million, or 21.7% of NCD deaths; respiratory diseases,
including asthma and chronic obstructive pulmonary disease 4.0 million, or 10.7% of NCD
deaths and diabetes 1.5 million, or 4% of NCD deaths. Thus, the four major NCDs were
responsible for 82% of NCD deaths.
These major non-communicable diseases share four behavioural risk factors: tobacco use,
unhealthy diet, physical inactivity and harmful use of alcohol. Apart from these: Exposure to
environmental and occupational hazards has potential influence in developing non-communicable
diseases. Although morbidity and mortality from non-communicable diseases mainly occur in
adulthood, exposure to risk factors begins in early life during pregnancy, childhood. Children
can die from treatable non-communicable diseases (such as rheumatic heart disease, type 1
diabetes, asthma and leukaemia) if health promotion, disease prevention and comprehen-
sive care are not provided.
According to WHO’s projection, the total annual number of deaths from non-communicable
diseases will increase to 55 million by 2030 if “business as usual” continues. Scientific
knowledge demonstrates that the non-communicable disease burden can be greatly
reduced if cost-effective preventive and curative actions, along with interventions for
prevention and control of non-communicable diseases already available, are implemented in
an effective and balanced manner.
Fortunately enough the time has come for the Ministry of Health to make a paradigm shift from
concentrating more on curative services to a major public health domain which focuses on
promotion, education, prevention and control, rehabilitative and palliative measures which will
eventually reduce the burden of NCD and other diseases in the country.

Botswana Non-communicable Disease Risk Factor Surveillance - 2014 Page 3
SCOPE OF THE SURVERY
The literature review from the World Health Organization and International Agency for
Research on NCDs in Sub-Saharan Africa on the prevalence and incidence of cardiovascular
diseases, diabetes mellitus Type 2, cancer and their risk factors showed differ considerably
between countries, urban/rural location and other sub-populations. The prevalence of stroke
ranged from 0.07 to 0.3%, diabetes mellitus from 0 to 16%, hypertension from 6 to 48%,
obesity from 0.4 to 43% and current smoking from 0.4 to 71%. Hypertension prevalence was
consistently similar among men and women, whereas women were more frequently obese and
men were more frequently current smokers.
Drivers of NCD epidemics are urbanization and changes in lifestyle associated with
economic development. These include changes in (i) diet, (ii) physical activity,
(iii) Smoking, (iv) Obesity and (v) alcohol use. In high-income countries, ∼90% of all new
diabetes mellitus cases and 70–80% of all new CVD cases are attributable to relatively modest
differences in these lifestyle factors. Similarly, the INTERHEART study that included nine
African nations and 43 other countries found that five risk factors (smoking, hypertension,
abdominal obesity, and diabetes mellitus) accounted for 90% of the risk for a first myocardial
infarction in the African sites.
Other social and environmental changes in Sub-Saharan Africa also play a role such as changes
in air quality and early childhood exposures. These lead to increased prevalence of NCD risk
factors such as COPD, hypertension, abdominal obesity and abnormal blood lipids. If action is
not taken, one estimate shows that US$84 billion in lost productivity could occur due to heart
disease, stroke and diabetes in the 23 low- and middle-income countries (four of which are in
Sub-Saharan Africa), which would account for 80% of worldwide NCD mortality by 2015.
The 2007 Botswana STEPS survey indicated that the major risk factors related to NCD were at
a higher rate. Therefore the current survey was conducted to explore and compare the results
if at all the interventions taken has brought change in the disease burden.

Botswana Non-communicable Disease Risk Factor Surveillance - 2014 Page 4
Table of Contents INTRODUCTION............................................................................................................................................. 2
SCOPE OF THE SURVERY ............................................................................................................................... 3
INTRODUCTION........................................................................................................................................... 10
.................................................................................................................................................................... 11
Botswana Population & Housing Census .................................................................................................... 12
Population by Age Group and Sex .............................................................................................................. 12
BOTSWANA POPULATION PYRAMID .......................................................................................................... 13
SUMMARY OF SAMPLING FRAME - DISTRICTS WITH THEIR EA & NUMBER OF STUDY UNITS .................. 15
SAMPLING DESIGN/METHODOLOGY .......................................................................................................... 16
RESULTS ...................................................................................................................................................... 17
DISTRICTPARTICIPANTS OF THE STEPTS SURVEY ....................................................................................... 21
PARTICIPANTS OF STEPS SURVEY BY DISTRICT AND SEX ............................................................................ 23
Demographic Information Results .............................................................................................................. 25
Tobacco Use ................................................................................................................................................ 32
Alcohol Consumption ................................................................................................................................. 52
Fruit and Vegetable Consumption .............................................................................................................. 66
Physical Activity (Reference material guiding content of physical activity) ............................................... 70
History of Raised Blood Pressure................................................................................................................ 80
History of Diabetes ..................................................................................................................................... 83
History of Raised Total Cholesterol ............................................................................................................ 85
History of Cardiovascular Diseases ............................................................................................................. 87
Lifestyle Advice ........................................................................................................................................... 88
Cervical Cancer Screening........................................................................................................................... 90
Physical Measurements .............................................................................................................................. 90
Biochemical Measurements ....................................................................................................................... 99
Cardiovascular disease risk ....................................................................................................................... 102
Summary of Combined Risk Factors ......................................................................................................... 102
GENERAL RECOMMENDATIONS ............................................................................................................... 106
FACT SHEET – Behavioural & Measurements (a) ..................................................................................... 107
Tobacco Fact Sheet (b) ............................................................................................................................. 113
STEPS Instrument ...................................................................................................................................... 116
REFERENCES .............................................................................................................................................. 132

Botswana Non-communicable Disease Risk Factor Surveillance - 2014 Page 5
TABLES TABLE 1 DISTRICT POPULATION BY SEX & AGE GROUP ............................................................................................................................. 12 TABLE 2 SAMPLING FRAME ................................................................................................................................................................ 15 TABLE 3 PARTICIPANTS BY DISTRICT ..................................................................................................................................................... 21 TABLE4 COVERAGE .......................................................................................................................................................................... 22 TABLE 5 COVERAGE BY DISTRICT AND SEX.............................................................................................................................................. 23 TABLE 6 COVERAGE BY DISTRICT & AGE GROUP ...................................................................................................................................... 24 TABLE 7 RESPONDENTS BY AGE GROUP & SEX ........................................................................................................................................ 25 TABLE 8 MEAN NUMBER OF YEARS OF EDUCATION ................................................................................................................................. 25 TABLE 9 HIGHEST LEVEL OF EDUCATION MALES ..................................................................................................................................... 25 TABLE 10 HIGHEST LEVEL OF EDUCATION FEMALES ................................................................................................................................. 26 TABLE 11 HIGHEST LEVEL OF EDUCATION BOTH SEXES ............................................................................................................................. 26 TABLE 12 ETHNIC GROUP OF PARTICIPANTS ........................................................................................................................................... 27 TABLE 13 MARITAL STATUS OF MALE PARTICIPANTS................................................................................................................................ 27 TABLE 14 MARITAL STATUS OF FEMALE PARTICIPANTS ............................................................................................................................. 28 TABLE 15 MARITAL STATUS OF BOTH SEXES........................................................................................................................................... 28 TABLE 16 EMPLOYMENT STATUS OF MALES ........................................................................................................................................... 29 TABLE 17 EMPLOYMENT STATUS OF FEMALES ........................................................................................................................................ 29 TABLE 18 EMPLOYMENT STATUS OF BOTH SEXES .................................................................................................................................... 29 TABLE 19 UNPAID WORK AND UNEMPLOYED MALES ............................................................................................................................... 30 TABLE 20 UNPAID WORK & UNEMPLOYED FEMALES ............................................................................................................................... 30 TABLE 21 UNPAID WORK BOTH SEXES .................................................................................................................................................. 30 TABLE 22 HOUSEHOLD RESIDENTS 15-69 YRS. ...................................................................................................................................... 31 TABLE 23 ESTIMATED HOUSEHOLD EARNINGS ........................................................................................................................................ 31 TABLE 24CURRENT SMOKERS BOTH ..................................................................................................................................................... 32 TABLE 25CURRENT DAILY SMOKERS ..................................................................................................................................................... 32 TABLE 26 SMOKING STATUS MALES ..................................................................................................................................................... 32 TABLE 27 SMOKING STATUS FEMALES .................................................................................................................................................. 33 TABLE 28 SMOKING STATUS BOTH....................................................................................................................................................... 33 TABLE 29 MEAN AGE STARTED SMOKING .............................................................................................................................................. 34 TABLE 30 MEAN DURATION OF SMOKING ............................................................................................................................................. 34 TABLE 31 MANUFACTURED CIG. SMOKERS AMONG DAILY ........................................................................................................................ 34 TABLE 32 MANUFACTURED CIG. SMOKERS AMONG CURRENT ................................................................................................................... 34 TABLE 33MEAN TYPE OF TOBACCO USED BY TYPE MALES ......................................................................................................................... 35 TABLE 34MEAN AMOUNT OF TOBACCO USED BY TYPE FEMALES ................................................................................................................ 35 TABLE 35MEAN TOBACCO USE BY TYPE BOTH ........................................................................................................................................ 36 TABLE 36CURRENT SMOKERS BY TYPE OF PRODUCT - MALES .................................................................................................................... 36 TABLE 37 CURRENT SMOKERS BY TYPE OF PRODUCT – FEMALES ................................................................................................................ 37 TABLE 38 PERCENTAGE OF CURRENT SMOKERS – BOTH .......................................................................................................................... 38 TABLE 39 DAILY QUANTITIES OF TOBACCO TYPE USED – MALES ................................................................................................................ 39 TABLE 40 DAILY QUANTITIES OF TOBACCO TYPE USED - FEMALES ............................................................................................................... 39 TABLE 41 DAILY QUANTITIES OF TOBACCO TYPE USED – BOTH .................................................................................................................. 40 TABLE 42FORMER DAILY SMOKERS AMONG ALL ..................................................................................................................................... 41 TABLE 43FORMER SMOKERS AMONG EVER DAILY ................................................................................................................................... 41 TABLE 44MEAN YEARS SINCE CESSATION .............................................................................................................................................. 41 TABLE 45SMOKERS WHO HAVE TRIED TO STOP ...................................................................................................................................... 41 TABLE 46 ADVISED BY HEALTH WORKERS TO STOP SMOKING..................................................................................................................... 42 TABLE 47CURRENT SMOKELESS TOBACCO USERS .................................................................................................................................... 42 TABLE 48SMOKELESS TOBACCO USE MALES ........................................................................................................................................... 42 TABLE 49SMOKELESS TOBACCO USE FEMALES ........................................................................................................................................ 42 TABLE 50SMOKELESS TOBACCO USE – BOTH ......................................................................................................................................... 43 TABLE 51FORMER SMOKELESS TOBACCO USERS AMONG ALL .................................................................................................................... 43 TABLE 52FORMER DAILY SMOKELESS TOBACCO USERS AMONG EVER DAILY USERS ......................................................................................... 44 TABLE 53MEAN TIME PER DAY SMOKELESS TOBACCO USED – MALES ......................................................................................................... 44 TABLE 54MEAN TIME/D SMOKELESS TOBACCO USED – FEMALES ............................................................................................................... 45 TABLE 55MEAN TIME/D SMOKELESS TOBACCO USED – BOTH ................................................................................................................... 45

Botswana Non-communicable Disease Risk Factor Surveillance - 2014 Page 6
TABLE 56PERCENTAGE OF CURRENT USERS OF SMOKELESS TOBACCO BY TYPE – FEMALES ............................................................................... 46 TABLE 57 PERCENTAGE OF CURRENT USERS OF SMOKELESS TOBACCO BY TYPE – BOTH .................................................................................. 47 TABLE 58 CURRENT TOBACCO USERS - BOTH......................................................................................................................................... 47 TABLE 59EXPOSURE TO 2ND HAND SMOKE IN HOME - BOTH .................................................................................................................... 48 TABLE 60EXPOSURE TO 2ND HAND SMOKE IN WORKPLACE– BOTH ............................................................................................................ 48 TABLE 61 REASON FOR SMOKING AND SMOKELESS-MALES ...................................................................................................................... 49 TABLE 62REASON FOR SMOKING & SMOKELESS- FEMALES ....................................................................................................................... 50 TABLE 63REASON FOR SMOKING & SMOKELESS - BOTH ........................................................................................................................... 50 TABLE 64REASONS OF TOBACCO DAILY USERS - MALES ........................................................................................................................... 51 TABLE 65REASONS OF TOBACCO DAILY USERS - FEMALES ......................................................................................................................... 51 TABLE 66 REASONS OF TOBACCO DAILY USERS – BOTH ............................................................................................................................ 51 TABLE 67ALCOHOL CONSUMPTION STATUS – MALES .............................................................................................................................. 52 TABLE 68 ALCOHOL CONSUMPTION STATUS – FEMALES .......................................................................................................................... 52 TABLE 69ALCOHOL CONSUMPTION STATUS - BOTH ................................................................................................................................ 53 TABLE 70STOPPED DRINKING DUE TO HEALTH REASONS ........................................................................................................................... 53 TABLE 71FREQ. OF ALCOHOL CONSUMPTION – MALES ............................................................................................................................ 54 TABLE 72FREQ. OF ALCOHOL CONSUMPTION – FEMALES ......................................................................................................................... 54 TABLE 73FREQUENCY OF ALCOHOL CONSUMPTION – BOTH ..................................................................................................................... 54 TABLE 74MEAN NUMBER OF DRINKING PAST 1 MON. - BOTH .................................................................................................................. 55 TABLE 75MEAN STANDARD DRINKS PAST 1 MONTH – BOTH ..................................................................................................................... 55 TABLE 76DRINKING AT HIGH LEVEL – BOTH .......................................................................................................................................... 55 TABLE 77DRINKING AT INTERMEDIATE LEVEL - BOTH .............................................................................................................................. 55 TABLE 78DRINKING AT LOWER LEVEL – BOTH ........................................................................................................................................ 56 TABLE 79COMBINED LEVEL IN THE PAST 1 MONTH – MALES ..................................................................................................................... 56 TABLE 80 COMBINED LEVEL IN THE PAST 1 MONTH – FEMALES ................................................................................................................. 56 TABLE 81COMBINED LEVEL IN THE PAST 1 MONTH – BOTH ...................................................................................................................... 57 TABLE 82 MEAN MAXIMUM STANDARD DRINKS – BOTH .......................................................................................................................... 57 TABLE 83 SIX OR MORE DRINKS – BOTH ............................................................................................................................................... 58 TABLE 84MEAN NUMBER OF TIMES 6 DRINKS ........................................................................................................................................ 58 TABLE 85 FREQ. OF ALCOHOL CONSUMPTION 1 WK. - MALES ................................................................................................................... 59 TABLE 86 FREQ. OF ALCOHOL CONSUMPTION 1 WK. – FEMALES ................................................................................................................ 59 TABLE 87 FREQ. OF ALCOHOL CONSUMPTION 1 WK. – BOTH .................................................................................................................... 59 TABLE 88MEAN NUMBER OF STANDARD DRINKS 1WK – BOTH .................................................................................................................. 60 TABLE 89CONSUMPTION OF UNRECORDED ALCOHOL - BOTH .................................................................................................................... 60 TABLE 90MEAN NUMBER OF STANDARD UNRECORDED - BOTH ................................................................................................................. 61 TABLE 91PERCENTAGE OF UNRECORDED ALCOHOL 1WK .......................................................................................................................... 61 TABLE 92UNRECORDED ALCOHOL BY TYPE – MALES ................................................................................................................................ 61 TABLE 93UNRECORDED ALCOHOL BY TYPE – FEMALES ............................................................................................................................ 61 TABLE 94UNRECORDED ALCOHOL CONSUMPTION – BOTH ....................................................................................................................... 62 TABLE 95NOT BEING ABLE TO STOP – MALES ........................................................................................................................................ 62 TABLE 96BEING NOT ABLE TO STOP – FEMALES ..................................................................................................................................... 63 TABLE 97 BEING NOT ABLE TO STOP – BOTH ......................................................................................................................................... 63 TABLE 98FAILING TO DO WHAT IS EXPECTED – MALES ............................................................................................................................. 64 TABLE 99 FAILING TO DO WHAT IS EXPECTED – FEMALES ......................................................................................................................... 64 TABLE 100 FAILING TO DO WHAT IS EXPECTED - BOTH ............................................................................................................................ 64 TABLE 101 FREQ. OF NEEDING A FIRST DRINK – MALES ........................................................................................................................... 64 TABLE 102 FREQ. OF NEEDING A FIRST DRINK – FEMALES ........................................................................................................................ 65 TABLE 103 FREQ. OF NEEDING A FIRST DRINK – BOTH ............................................................................................................................. 65 TABLE 104 FAMILY PROBLEMS – MALES .............................................................................................................................................. 66 TABLE 105 FAMILY PROBLEMS - FEMALES ............................................................................................................................................ 66 TABLE 106 FAMILY PROBLEMS - BOTH ................................................................................................................................................. 66 TABLE 107 MEAN DAYS FRUITS CONSUMED IN A TYPICAL DAY ................................................................................................................... 67 TABLE 108 MEAN CONSUMED ON AVERAGE FRUITS/D ............................................................................................................................ 67 TABLE 109 MEAN DAYS VEGETABLES CONSUMED IN A TYPICAL DAY ........................................................................................................... 67 TABLE 110 MEAN SERVINGS OF VEG. ON AVERAGE ................................................................................................................................. 67 TABLE 111 MEAN FRUIT/VEG. SERVINGS ON AVERAGE ............................................................................................................................ 68 TABLE 112 NUMBER OF SERVINGS FRUITS/VEG. ON AVERAGE - MALES ....................................................................................................... 68 TABLE 113 NUMBER OF SERVINGS FRUIT/VEG. – FEMALES ....................................................................................................................... 68 TABLE 114 NUMBER OF FRUITS/VEG. SERVINGS - BOTH .......................................................................................................................... 68

Botswana Non-communicable Disease Risk Factor Surveillance - 2014 Page 7
TABLE 115 LESS THAN 5 SERVINGS OF FRUIT/VEG. - BOTH ....................................................................................................................... 69 TABLE 116 TYPE OF FAT/OIL USED ...................................................................................................................................................... 70 TABLE 117 MEALS EATEN OUTSIDE HOME ............................................................................................................................................ 70 TABLE 118 NOT MEETING WHO RECOMMENDATION- BOTH ................................................................................................................... 72 TABLE 119 LEVEL OF TOTAL PHYSICAL ACTIVITY – MALES ......................................................................................................................... 72 TABLE 120 LEVEL OF PHYSICAL ACTIVITY – FEMALES ............................................................................................................................... 72 TABLE 121 LEVEL OF PHYSICAL ACTIVITY - BOTH .................................................................................................................................... 72 TABLE 122 MEAN MINUTES OF TOTAL PHYSICAL ACTIVITY ........................................................................................................................ 73 TABLE 123 MEDIAN MINUTES OF PHYSICAL ACTIVITY .............................................................................................................................. 73 TABLE 124 MEAN MINUTES WORK RELATED ......................................................................................................................................... 74 TABLE 125 MEAN MINUTES TRANSPORT RELATED .................................................................................................................................. 74 TABLE 126 MEAN MINUTES RECREATION RELATED ................................................................................................................................. 74 TABLE 127 MEDIAN MINUTES WORK RELATED ....................................................................................................................................... 75 TABLE 128 MEDIAN MINUTES TRANSPORT RELATED ............................................................................................................................... 75 TABLE 129 MEDIAN MINUTES RECREATION RELATED .............................................................................................................................. 75 TABLE 130 NO WORK RELATED PHYSICAL ACTIVITY ................................................................................................................................. 76 TABLE 131 NO TRANSPORT RELATED PHYSICAL ACTIVITY .......................................................................................................................... 76 TABLE 132 NO RECREATION RELATED PHYSICAL ACTIVITY ......................................................................................................................... 76 TABLE 133 COMPOSITION OF TOTAL PHYSICAL ACTIVITY – MALES .............................................................................................................. 77 TABLE 134 COMPOSITION OF TOTAL PHYSICAL ACTIVITY – FEMALES ........................................................................................................... 77 TABLE 135 COMPOSITION OF PHYSICAL ACTIVITY - BOTH ......................................................................................................................... 77 TABLE 136 NO VIGOROUS PHYSICAL ACTIVITY ........................................................................................................................................ 78 TABLE 137 MINUTES SPENT ON SEDENTARY ACTIVITY - MALES .................................................................................................................. 78 TABLE 138 MINUTES SPENT ON SEDENTARY ACTIVITY - FEMALES............................................................................................................... 79 TABLE 139 MINUTES ON SEDENTARY ACTIVITY - BOTH ............................................................................................................................ 79 TABLE 140 BP MEASUREMENT AND DX - MALES ................................................................................................................................... 80 TABLE 141 BP MEASUREMENT AND DX - FEMALES ................................................................................................................................ 80 TABLE 142 BP MEASUREMENT AND DX - BOTH ..................................................................................................................................... 80 TABLE 143 CURRENTLY TAKING MEDICATIONS ....................................................................................................................................... 81 TABLE 144 SEEN A TRADITIONAL HEALER FOR BP ................................................................................................................................... 81 TABLE 145 TAKING TRADITIONAL REMEDY FOR BP ................................................................................................................................. 82 TABLE 146 BLOOD SUGAR MEASUREMENT &DX – MALES ........................................................................................................................ 83 TABLE 147 BLOOD SUGAR MEASUREMENT &DX - FEMALES ..................................................................................................................... 83 TABLE 148 BLOOD SUGAR MEASUREMENT - BOTH ................................................................................................................................. 83 TABLE 149 TAKING MEDICATION FOR DIABETES ..................................................................................................................................... 84 TABLE 150 TAKING INSULIN FOR DIABETES ........................................................................................................................................... 84 TABLE 151 SEEN TRADITIONAL HEALER FOR DIABETES – BOTH .................................................................................................................. 85 TABLE 152 TAKING HERBAL TREATMENT FOR DIABETES ........................................................................................................................... 85 TABLE 153 CHOLESTEROL MEASUREMENT &DX - MALES ......................................................................................................................... 85 TABLE 154 CHOLESTEROL MEASUREMENT & DX – FEMALES .................................................................................................................... 85 TABLE 155 CHOLESTEROL MEASUREMENT &DX – BOTH ......................................................................................................................... 86 TABLE 156 TAKING TREATMENT FOR CHOLESTEROL ................................................................................................................................ 86 TABLE 157 EVER HAD HEART ATTACK - BOTH ........................................................................................................................................ 87 TABLE 158 TAKING ASPIRIN ............................................................................................................................................................... 87 TABLE 159 TAKING STATIN ................................................................................................................................................................ 87 TABLE 160 ADVISED BY A HEALTH WORKER ON TOBACCO ........................................................................................................................ 88 TABLE 161 ADVISED ON SALT REDUCTION ............................................................................................................................................. 88 TABLE 162 ADVISED TO EAT 5 SERVINGS OF FRUITS/VEG. ......................................................................................................................... 88 TABLE 163 ADVISED TO REDUCE FAT ................................................................................................................................................... 88 TABLE 164 ADVISED ON PHYSICAL ACTIVITY .......................................................................................................................................... 89 TABLE 165 ADVISED TO REDUCE WEIGHT.............................................................................................................................................. 89 TABLE 166 CERVICAL SCREENING BY AGE GROUP .................................................................................................................................... 90 TABLE 167 MEAN SBP – BOTH .......................................................................................................................................................... 90 TABLE 168 MEAN DBP .................................................................................................................................................................... 91 TABLE 169 SBP>140 & DBP>90 EXCLUDING ON MEDICATION ............................................................................................................... 91 TABLE 170 SBP≥140 AND/ORDBP≥90 ON MEDICATION ....................................................................................................................... 92 TABLE 171 SBP≥160 AND/OR DBP≥100 EXCLUDING MEDICATION ......................................................................................................... 92 TABLE 172SBP≥160 AND/ORDBP≥100 EXCLUDING MEDICATION ........................................................................................................... 92 TABLE 173 TREATED OR CONTROLLED RAISED BP - MALES ...................................................................................................................... 93

Botswana Non-communicable Disease Risk Factor Surveillance - 2014 Page 8
TABLE 174 TREATED OR CONTROLLED BP - FEMALES .............................................................................................................................. 93 TABLE 175 TREATED OR CONTROLLED RAISED BP - BOTH ........................................................................................................................ 93 TABLE 176 MEAN HEART RATE – BOTH ............................................................................................................................................... 94 TABLE 177 MEAN HEIGHT ................................................................................................................................................................ 94 TABLE 178 MEAN WEIGHT ............................................................................................................................................................... 95 TABLE 179 MEAN BMI .................................................................................................................................................................... 96 TABLE 180 BMI CLASSIFICATION - MALES ............................................................................................................................................ 96 TABLE 181 BMI CLASSIFICATION – FEMALES......................................................................................................................................... 96 TABLE 182 BMI CLASSIFICATION - BOTH .............................................................................................................................................. 96 TABLE 183 BMI GREATER THAN 25 .................................................................................................................................................... 97 TABLE 184 WAIST CIRCUMFERENCE .................................................................................................................................................... 97 TABLE 185 HIP CIRCUMFERENCE ........................................................................................................................................................ 97 TABLE 186 MEAN WAIST/HIP RATIO .................................................................................................................................................. 98 TABLE 187 MEAN FBG .................................................................................................................................................................... 99 TABLE 188 IMPAIRED FASTING GLYCAEMIA .......................................................................................................................................... 99 TABLE 189 RAISED BLOOD GLUCOSE ON MEDICATION ............................................................................................................................. 99 TABLE 190 CURRENTLY ON MEDICATION .............................................................................................................................................. 99 TABLE 191 MEAN TOTAL CHOLESTEROL ............................................................................................................................................. 100 TABLE 192 CHOLESTEROL >5.0MMOL/L ON MEDICATION ....................................................................................................................... 100 TABLE 193 CHOLESTEROL >6.2MMOL/L ON MEDICATION ........................................................................................................................ 100 TABLE 194 MEAN HDL ................................................................................................................................................................... 100 TABLE 195 PERCENTAGE OF RESPONDENTS WITH HDL .......................................................................................................................... 101 TABLE 196 CVD RISK>30% ............................................................................................................................................................ 102 TABLE 197 ELIGIBLE PERSONS RECEIVING THERAPY ............................................................................................................................... 102 TABLE 198 SUMMARY OF COMBINED RISK FACTORS – MALES ................................................................................................................ 103 TABLE 199 SUMMARY OF COMBINED RISK FACTORS - FEMALES............................................................................................................... 103 TABLE 200 SUMMARY OF COMBINED RISK FACTORS – BOTH .................................................................................................................. 104

Botswana Non-communicable Disease Risk Factor Surveillance - 2014 Page 9
FIGURE 1 MAP OF BOTSWANA ........................................................................................................................................................... 11 FIGURE 2POPULATION PYRAMID ......................................................................................................................................................... 13 FIGURE 3 PARTICIPANTS BY AGE GROUP................................................................................................................................................ 24 FIGURE 4 EDUCATIONAL LEVEL BY SEX .................................................................................................................................................. 26 FIGURE 5EDUCATIONAL LEVEL - BOTH SEXES .......................................................................................................................................... 27 FIGURE 6 MARITAL STATUS BY SEX ...................................................................................................................................................... 28 FIGURE 7 EMPLOYMENT STATUS ......................................................................................................................................................... 30 FIGURE 8 UNPAID WORK AND UNEMPLOYED ......................................................................................................................................... 31 FIGURE 9 SMOKING STATUSES OF PARTICIPANTS .................................................................................................................................... 33 FIGURE 10 CURRENT SMOKERS WITH TYPE OF PRODUCTS ......................................................................................................................... 37 FIGURE 11 SMOKERS BY AGE GROUP & TOBACCO TYPE ............................................................................................................................ 38 FIGURE 12 TYPE OF TOBACCO PRODUCTS USED ...................................................................................................................................... 39 FIGURE 13 QUANTITY OF TOBACCO USED ............................................................................................................................................. 40 FIGURE 14QUANTITY OF CIGARETTES USED – BOTH ................................................................................................................................ 40 FIGURE 15SMOKELESS TOBACCO USERS................................................................................................................................................ 43 FIGURE 16MEAN TIMES DAILY USED BY SMOKELESS USERS ....................................................................................................................... 44 FIGURE 17MALE SMOKELESS TOBACCO USERS BY TYPE ............................................................................................................................ 46 FIGURE 18 CURRENT FEMALES SMOKELESS TOBACCO USERS ..................................................................................................................... 47 FIGURE 19CURRENT & DAILY TOBACCO USERS ...................................................................................................................................... 48 FIGURE 20EXPOSURE TO 2ND HAND SMOKE 30 DAYS ............................................................................................................................. 49 FIGURE 21REASONS FOR CURRENT TOBACCO USE ................................................................................................................................... 50 FIGURE 22 REASONS FOR DAILY TOBACCO USE ....................................................................................................................................... 52 FIGURE 23ALCOHOL CONSUMPTION STATUS ......................................................................................................................................... 53 FIGURE 24FREQUENCY OF ALCOHOL CONSUMPTION ............................................................................................................................... 54 FIGURE 26 LEVEL OF DRINKING ........................................................................................................................................................... 57 FIGURE 27 CONSUMPTION GREATER THAN 6 ALCOHOL ............................................................................................................................ 58 FIGURE 28 ALCOHOL IN THE PAST 7 DAYS ............................................................................................................................................. 60 FIGURE 29UNRECORDED ALCOHOL IN THE PAST 7 DAYS ........................................................................................................................... 62 FIGURE 30UNABLE TO STOP DRINKING ................................................................................................................................................. 63 FIGURE 31FREQUENCY OF NEEDING 1ST DRINK ...................................................................................................................................... 65 FIGURE 32NUMBER OF SERVINGS FRUITS/VEGETABLES ............................................................................................................................ 69 FIGURE 33 CONSUMED <5 SERVINGS OF FRUITS/VEG. ............................................................................................................................. 69 FIGURE 34LEVEL OF PHYSICAL ACTIVITY ................................................................................................................................................ 73 FIGURE 35MEAN MINUTES SPENT ON PHYSICAL ACTIVITY ......................................................................................................................... 74 FIGURE 36MINUTES SPENT ON TYPE OF ACTIVITIES ................................................................................................................................. 75 FIGURE 37NOT RELATED TO PHYSICAL ACTIVITY ..................................................................................................................................... 76 FIGURE 38COMPOSITION OF TOTAL PHYSICAL ACTIVITY ............................................................................................................................ 77 FIGURE 39WITH NO VIGOROUS PHYSICAL ACTIVITY ................................................................................................................................. 78 FIGURE 40TIME SPENT ON SEDENTARY ACTIVITY .................................................................................................................................... 79 FIGURE 41BP MEASUREMENT & HPN DIAGNOSIS ................................................................................................................................. 81 FIGURE 42BLOOD SUGAR MEASUREMENT & DIAGNOSIS .......................................................................................................................... 84 FIGURE 43TOTAL CHOLESTEROL MEASUREMENT .................................................................................................................................... 86 FIGURE 44ADVICE GIVEN BY HEALTH WORKER ....................................................................................................................................... 89 FIGURE 45SYSTOLIC BLOOD PRESSURE ................................................................................................................................................. 90 FIGURE 46DIASTOLIC BLOOD PRESSURE ............................................................................................................................................... 91 FIGURE 47SBP≥140 AND/ORDBP≥90 MMHG .................................................................................................................................... 92 FIGURE 48TREATED AND OR CONTROLLED RAISED BP ............................................................................................................................. 94 FIGURE 49MEAN HEIGHT .................................................................................................................................................................. 95 FIGURE 50MEAN WEIGHT ................................................................................................................................................................. 95 FIGURE 51BMI ............................................................................................................................................................................... 97 FIGURE 52BLOOD TEST FOR GLUCOSE & LIPIDS .................................................................................................................................... 101 FIGURE 53 RISK FACTORS IN MALES ................................................................................................................................................... 103 FIGURE 54 RISK FACTORS IN FEMALES ................................................................................................................................................ 104 FIGURE 55 RISK FACTORS - BOTH SEXES ............................................................................................................................................. 104

Botswana Non-communicable Disease Risk Factor Surveillance - 2014 Page 10
INTRODUCTION
Chronic Non- Communicable Diseases
Common, preventable risk factors underlie most chronic diseases. These chronic disease risk factors are
leading causes of the death and disability burden in all countries, regardless of their economic
development status. The leading risk factor globally is raised blood pressure, followed by tobacco use,
raised total cholesterol, and low fruit and vegetable consumption. The major risk factors together
account for around 80% of deaths from heart disease and stroke.
The basis of chronic diseases prevention is the identification of the major common risk factors and their
prevention and control measures.
The major (modifiable) behavioural risk factors identified in the World are:
• Tobacco use
• Harmful alcohol consumption
• Unhealthy diet (low fruit and vegetable consumption) &
• Physical inactivity
The major biological risk factors identified are:
• Overweight and obesity
• Raised blood pressure
• Raised blood glucose
• Abnormal blood lipids / 'raised total cholesterol'
Therefore the above eight major behavioural and biological risk factors are addressed using a WHO
established tool called WHO STEPSwise chronic disease risk factor surveillance.
What is then STEPS?
STEPS is a sequential process that starts with gathering key information on risks factors with a
questionnaire (STEPS 1), moves to simple physical measurements (STEPS 2) and then to more
complex collection of blood samples for biochemical analysis (STEPS 3).
STEPS use a representative sample of the target population. This allows for results to be generalised to
the population. The tool is used by WHO member countries to identify their risk factors and compare
results across.
1
2
3
USE OF QUESTIONNAIRE (DEMOGRAPHIC & BEHAVIOURAL)
PHYSICAL MEASUREMENTS BP,wt, ht,girth
BIOCHEMICAL TESTS Glucose, cholesterol

Botswana Non-communicable Disease Risk Factor Surveillance - 2014 Page 11
Figure 1 Map of Botswana

Botswana Non-communicable Disease Risk Factor Surveillance - 2014 Page 12
Botswana Population & Housing Census
Population by Age Group and Sex
2011
Table 1 District population by sex & age group
AGE GROUP SEX
TOTAL MALE FEMALE
<1 28,075 27,294 55,369
1 - 4 91,971 90,047 182,018
5 - 9 108561 106622 215,183
10 - 14 104468 102976 207,444
15 - 19 104847 105956 210,803
20 - 24 97270 103045 200,315
25 - 29 101193 106576 207,769
30 - 34 84507 85989 170,496
35 - 39 68438 66765 135,203
40 - 44 48757 50494 99,251
45 - 49 37879 44358 82,237
50 - 54 29737 36616 66,353
55 - 59 24363 29685 54,048
60 - 64 17343 20235 37,578
65 - 69 12237 15504 27,741
70 - 74 9461 12788 22,249
75 - 79 6963 10915 17,878
80 - 84 4868 8344 13,212
85 - 89 2822 5420 8,242
90+ 5311 6204 11,515
TOTAL 989,071 1,035,833 2,024,904

Botswana Non-communicable Disease Risk Factor Surveillance - 2014 Page 13
BOTSWANA POPULATION PYRAMID
2011
Figure 2Population pyramid
150,000 100,000 50,000 0 50,000 100,000 150,000
<1 year
1-4 year
5-9 year
10-14year
15 - 19year
20 - 24year
25 - 29year
30 - 34year
35 - 39year
40 - 44year
45 - 49year
50 - 54year
55 - 59year
60 - 64year
65 - 69year
70 - 74year
75 - 79year
80 - 84year
85 - 89year
90+year
FEMALES MALES

Botswana Non-communicable Disease Risk Factor Surveillance - 2014 Page 14
Popul at i on
Botswana Population Pyramid 2011
by Age and Sex
0
20 000
40 000
60 000
80 000
100 000
120 000
140 0000
20 000
40 000
60 000
80 000
100 000
120 000
140 000
0-4
10-14
20-24
30-34
40-44
50-54
60-64
70-74
80-84
90+
Male Female

SUMMARY OF SAMPLING FRAME - DISTRICTS WITH THEIR EA & NUMBER OF STUDY UNITS
STEPS SURVEY 2014
*The 1st 7 districts are cities & town
Table 2 Sampling frame
District Code
LOCALITY TYPE
Total EA
Sampled EA
Total Pop. (All Ages)
Sampled Pop.
Target Pop.
(15-64) %
Proportion of Study
Units (6400)
High Med Low SHHA Village Urban
Cattle
Post Land Farm Mixt Camp
Land area
Gaborone 1 92 59 77 211 527 34 211755 15472 11913 817
Francistown 2 13 21 14 129 202 15 96323 9368 6558 450
Lobatse 3 5 12 12 46 78 4 28953 1509 1041 71
Selibe/ Phikwe 4 21 5 26 85 141 7 47134 2947 2033 139
Orapa 5 6 6 15 0 28 2 8649 565 401 28
Jwaneng 6 9 4 19 0 42 2 15734 1246 922 63
Sowa 7 10 2 1 14 1 3597 338 240 16
Southern 10 80 128 24 67 4 303 20 127075 11160 6361 436
Barolong 11 97 4 17 3 121 8 53666 4383 2454 168
Ngwktse West 12 22 6 4 3 1 36 2 13202 949 531 36
South East 20 34 127 24 6 1 3 195 13 80804 6579 4671 320
Kwenen/East 30 109 352 3 90 37 589 41 252738 20535 13142 901
Kwenen/West 31 48 14 11 27 16 116 7 43889 2919 1576 108
Kgatleng 40 79 80 13 43 215 14 89244 7182 4453 305
Serow/Palpye 50 159 215 36 71 4 4 5 494 27 169591 10346 6104 419
Mahalapye 51 115 119 36 41 5 2 319 18 115196 8909 4989 342
Cen Bobonong 52 65 81 33 24 2 3 2 210 11 71936 4882 2734 188
CentrlBoteti 53 51 38 33 9 1 132 9 55677 6095 3535 242
CentrlTutume 54 194 104 8 38 3 31 5 2 386 20 134056 10004 5502 377
North East 60 114 1 5 8 3 1 133 9 57351 4894 2741 188
Ngami East 70 32 108 16 18 4 17 196 14 85002 7132 4279 294
Ngami West 71 41 7 25 73 5 34729 3230 1712 117
Chobe 72 16 14 2 3 2 4 41 3 16981 1437 963 66
Ghanzi 80 43 30 17 1 16 1 1 109 6 42333 3738 2504 172
Kgalgdi South 90 48 26 9 6 1 90 5 29067 1942 1146 79
Kgalgdi North 91 54 1 55 3 20476 1,261 794 54
Grand Total 156 109 164 471 1401 1436 257 506 56 106 30 19 4845 300 1905158 149,022 93299 6400

SAMPLING DESIGN/METHODOLOGY
Botswana has a population of over 2 million with 27 districts and 4,845 enumeration areas and sample size of 300 enumeration areas with a target population of 6,400 people was systematically drawn from a pool of the whole enumeration areas. Against the identified enumeration areas numbers of households were listed and proportion of participants was calculated from the total sample size required for the country. Finally a computer generated random number was drawn to go into specific households in that specific enumeration area and at the end eligible participants residing in the household were listed into the electronic hand held data assistant(PDA) and at the end a name was picked automatically to participate in the survey. From the selected districts enumerators, supervisors were called to Gaborone and formally trained for four days on the STEPS survey package. This was done in collaboration with WHO Geneva, AFRO and Botswana. WHO supported the 2014 Botswana STEPS survey in bringing additional equipment on borrowed basis and making payment for transport, meal allowance for some enumerators, purchasing of reagents and computers. The STEPS Survey was a resource consuming exercise – It involved 144 health workers,9 drivers from health facilities of the selected 26 districts. It took two and a half months to complete the survey. The targeted sample size was not reached according to planned due to reasons such as: shortage of transport, inadequate survey equipment, environmentally unfriendly machines (Blood testing, faulty reading when extremely cold and hot), PDA’s non-functionality, loss of data after being entered into PDA, reading the map and find the sampled plot number which was time consuming to find houses in enumeration areas, and long distances between households etc. Preparation of the data set for analysis: cleaning, completing missing information, took almost 5 months between the Ministry of Health and STEPS Team in Geneva. Finally, most of the analysis, the fact sheet and data book was done, a draft report written and reviewed by WHO to finally produce this extensive document.

Botswana Non-communicable Disease Risk Factor Surveillance - 2014 Page 17
RESULTS
The population of Botswana is young and the broad base of the pyramid is occupied by the age group
0-4 years and yet the splitting of this age group shows that the under 1 children were few in number.
Twenty six districts with an estimated sample size of 6400 was planned to collect data, but only 4074
individuals participated in the survey. The overall coverage was 63.7%.
The great majority of the households (84%) had 1-3 residents with the target age group of above 15 to
69 years.
The number of female participants was twice higher than males during the survey and the proportion
of age groups 15-44 were more than the other age categories involved.
The mean number of years spent on education was almost the same in both sexes.
The highest level of education achieved in males and females was Junior Secondary.
Among the STEPS survey participants 96.4% were Motswana while 3.6% were other African, European
and other nationalities.
64.9% of the survey participants were never married, 19.0% married; followed by 10% cohabiting and
5% combined widowed plus divorced individuals.
71.9% of the whole participants of the survey were unpaid workers (students, homemaker, retired,
unemployed), 14% government employees.
The response to the question to state their estimated household income was poor and inconclusive.
The overall smoking status of the country is 18% and the rate of male smokers was 6 times higher than
the females.
Smoking was initiated as early as 20 years in males then a couple of years later by females.
The daily smoking behaviour and using the type of cigarette was the same in both sexes.
Smoking of manufactured cigarettes was the highest followed by the use of hand rolled and other
unspecified types of products.
1.9%of daily smokers were smoking ≥25 manufactured or hand-rolled cigarettes per day and 37.8%
were smoking less than 5 cigs/day
4% of the survey participants use smokeless tobacco and that mainly the females. The mode of use of
smokeless tobacco is 80% snuff by nose, 27% snuff by mouth, and 5.8% by chewing.

Botswana Non-communicable Disease Risk Factor Surveillance - 2014 Page 18
26% of participants were current drinkers in the past 1 month with the majority of males.
51% of the survey participants drink alcohol 1-5 times in a week and the remaining at least 1-3 times in
a month.
Drinking at high level of pure alcohol (≥60 in males and ≥40 in females) in the past 30 days was 5.9%,
intermediate (40-59g of alcohol) 6.4%, and lower end (<40g) was 87.7%.
The mean maximum number of standard drinks consumed in the past 30 days was 11.6, and those
who had 6 or more drinks in a single day were 18.6 in both sexes.
Among those who consume alcohol in the past 7 days, 72.7% were drinking 1-6 times daily.
86.5% of 108 participants who consumed unrecorded alcohol in the past 7 days was home brewed
beer/wine.
The mean number of days fruits consumed on a typical week was 3.1 and the mean serving per day was 0.8%. The mean number of days vegetables consumed on a typical week was 4 and the number of servings on average per day was l.1times. The mean number of servings of fruit and/or vegetables on average per day was 1.7, and only 5.2% of them had greater or equal to 5 servings while 41% had not even once where as 53% had 1-4 servings per day. Therefore out of the total number of participants (3651) who had on average less than 5 servings of fruit and/or vegetables per day were94.8%. Vegetable oil was most often used (98.2%) for meal preparation in the households.
1.1% out of 3994 participants ate meals prepared outside their homes.
The study result showed that 20.1% of participants were not meeting the WHO standard on physical
activity. WHO recommends physical activity during work, transport and leisure time spending 150
minutes of moderate intensity activity or 75 minutes of vigorous activity or an equivalent combination
of moderate and vigorous intensity activity of at least 600 MET-Minutes (Metabolic Equivalent per
week).
Out of 3287 male and female respondents, 38.0% had activity from work, 47.0% activity from
transport, and 15% during leisure time.57.3% of respondents had no vigorous physical activity.
The median number spent in sedentary activities on average per day was 165 minutes and the mean
was 198.2 minutes in both sexes.
When asking males on history of events on blood pressure, 26.2% of them never got measured their
BP, 57.1% were measured but not diagnosed, and 16.7% were diagnosed within the past 12 months of

Botswana Non-communicable Disease Risk Factor Surveillance - 2014 Page 19
the survey. Where as in females 15.4% never measured, 58.4% were measured but not diagnosed,
and 26.2% diagnosed within the 12 months. All in all, 35.2% of both of them were diagnosed as
having raised blood pressure and were taking medication prescribed by a health worker.
3.3% of 1100 had seen a traditional healer for raised blood pressure and 3.8% of both sexes were
taking traditional medicine.
In males, blood sugar measurement and diagnosis was never done in 80.4% of them, 23.1% were
measured but not diagnosed, and 1.7% were diagnosed within 12 months. While in females 74.6%
were not measured, 23.1% were measured but not diagnosed and 2.3% diagnosed within the 12
months of the survey. Out of the 111 diabetes cases diagnosed in both sexes, 58.5% were on oral
medications and 31.5% were on Insulin, yet 0.8% of the females who had also seen a traditional healer,
0.5% of them were taking traditional medicine.
Cholesterol measurement is not done is 94.0% of the participants, and yet of those diagnosed to have
raised level, 30.4% of them were taking oral medication. Cardiovascular symptom were observed in
5.6% of the total respondents and 1.0% of them were on Aspirin and Statin
Advice was given by health workers on lifestyles: 35% to quit tobacco or not to start, 42% to reduce
salt in their diet, 50.4% to eat at least five servings of fruit and/or vegetables every day, 50.3% to
reduce fat in their daily meal preparation, 50% to start or do more physical activity and 43.4% to
reduce weight and maintain healthy body.
Cervical cancer screening test mainly using Pap smear was done in 34.3% of the female 15-69 years of
age participants of which 50.7% who tested were from the age group 30-49 years.
Blood pressure was measured in the survey participants and was found that SBP≥140 and/or DBP≥90
mmHg in 24.2% excluding those on medication for raised BP and 29.4% or currently on medication.
Participants with SBP≥160 and/or DBP≥100 mmHg excluding those on medication for raised blood
pressure were 7.3% where as currently on medication were 13.7%
The outcome of 1347 respondents with treated and/or controlled blood pressure was as follows: On
medication and SBP/DBP below the cut-off point was10.0%, on medication and yet whose BP was
above the cut-off point were 13.5%, not on medication, but with raised BP were 76.4%.

Botswana Non-communicable Disease Risk Factor Surveillance - 2014 Page 20
Other biometrics recorded was: Mean heart rate of 76.4/Min, mean height 171 centimetres for males
and 161 centimetres for females, mean weight 63.6kg for males and 64.3kg for females.
Waist circumference for males was 77.8cm and for females 82.7cm. The hip circumference for males
was 93.7cm and 102.8 cm for females. The waist-hip ratio was 0.8.
There were 3881 participants whose BMI was calculated and showed that the mean body mass index
for both sexes was 23.3kg/m2. 14.2% had adult malnutrition, 55.2% were under the normal range,
18.8% were overweight, and 11.8 were obese. Splitting the values by sex, 19.8% of males were above
BMI≥25kg/m2 and females were 42.2%. This shows that females were more overweight and obese
than males.
Biochemical measurement was done in 3456 participants of the survey and showed that the mean
fasting blood glucose was 4.4mmol/L, impaired fasting glycaemia was 3.45mmol/L, the mean total
cholesterol was 3.6mmol/L, and mean HDL was 1.3mmol/L. The prevalence of raised blood glucose
was 5.8% and that of total cholesterol was 11%.
The overall risk factors that lead to non-communicable diseases was combined and of those taking into
account for the analyses there were only 1.3% of the attendants with zero risk factors, 73.1% had 1-2
risk factors, and 25.7% of the 3117 had 3-5 risk factors.
9.7% of age group 40-69 years had a 10 year CVD risk of ≥30%.

Botswana Non-communicable Disease Risk Factor Surveillance - 2014 Page 21
DISTRICTPARTICIPANTS OF THE STEPTS SURVEY
2014
Table 3 Participants by district
District Frequency Percent Barolong 134 3.3 Bobonong 117 2.9 Boteti 164 4.0 Chobe 59 1.4 Francistown 89 2.2 Gaborone 372 9.1 Ghanzi 150 3.7 Jwaneng 64 1.6 Kgalagadi North 48 1.2 Kgalagadi South 69 1.7 Kgatleng 270 6.6 Kweneng East 506 12.4 Kweneng West 90 2.2 Lobatse 59 1.4 Mahalapye 243 6.0 Ngamiland East 141 3.5 NgamilandWest 73 1.8 Ngwaketse West 37 .9 North East 125 3.1 Orapa 22 .5 SelebiPhikwe 112 2.7 Serowe/Palapye 225 5.5 South East 235 5.8 Southern 423 10.4 Tutume 247 6.1
Total 4074 100.0

Botswana Non-communicable Disease Risk Factor Surveillance - 2014 Page 22
BOTSWANA STEPS SURVEY - 2014
Districts Planned
Sample Size Completed
(Participated)
Percent
Coverage (Response Rate)
Barolong 169 134 79
Bobonong 188 117 62
Boteti 243 164 67
Chobe 67 59 88
Francistown 606 89 15
Gaborone 818 372 45
Ghanzi 172 150 87
Jwaneng 104 64 62
Kgalagadi North 91 48 53
Kgalagadi South 79 69 87
Kgatleng 305 270 89
Kweneng East 909 506 56
Kweneng West 71 90 128
Lobatse 72 59 82
Mahalapye 342 243 71
Ngamiland East 272 141 52
Ngamiland West 139 73 53
Ngwakeste West 36 37 103
North East 150 125 83
Orapa 28 22 79
SelebiPhikwe 141 112 79
SerowePalapye 420 225 54
South East 334 235 70
Southern 394 423 107
Tutume 260 247 95
Grand Total 6410 4074 64 Table4 Coverage

Botswana Non-communicable Disease Risk Factor Surveillance - 2014 Page 23
PARTICIPANTS OF STEPS SURVEY BY DISTRICT AND SEX
2014
Table 5 Coverage by district and sex
District Sex
Total Male Female
Barolong 35 99 134
Bobonong 34 83 117
Boteti 67 97 164
Chobe 23 36 59
Francistown 31 58 89
Gaborone 134 238 372
Ghanzi 56 94 150
Jwaneng 16 48 64
Kgalgadi North 14 34 48
Kgalgadi South 24 45 69
Kgatleng 99 171 270
Kweneng East 159 347 506
Kweneng West 32 58 90
Lobatse 16 43 59
Mahalapye 78 165 243
Ngamiland East 43 98 141
Ngamiland West 25 48 73
Ngwaketse West 6 31 37
North East 38 87 125
Orapa 3 19 22
SelebiPhikwe 40 72 112
Serowe/Palapye 66 159 225
South East 87 148 235
Southern 128 295 423
Tutume 67 180 247
Total 1321 2753 4074

Botswana Non-communicable Disease Risk Factor Surveillance - 2014 Page 24
STEPS SURVEY PARTICIPANTS BY DISTRICT AND AGE GROUP
2014
Table 6 Coverage by district & age group
Figure 3 Participants by age group
0
100
200
300
400
500
600
700
Nu
mb
er o
f P
arti
cip
ants
Age Group
Botswana STEPS Survey Participants by Age Group 2014
District Age Group Total
15-19 20-24 25-29 30-34 35-39 40-44 45-49 50-54 55-59 60-64 65-69
Barolong 14 21 21 14 19 11 11 6 7 9 1 134
Bobonong 5 17 11 14 16 11 12 8 9 7 7 117
Boteti 7 23 22 26 19 18 20 13 7 6 3 164
Chobe 1 9 7 6 6 6 6 3 5 8 2 59
Francistown 16 11 18 12 5 5 7 6 7 0 2 89
Gaborone 31 81 65 57 29 38 25 20 15 10 1 372
Ghanzi 17 25 22 24 9 13 12 16 8 4 0 150
Jwaneng 3 8 11 9 8 11 4 5 3 1 1 64
Kgalgadi North 1 2 9 7 7 4 2 2 4 7 3 48
Kgalgadi South 2 5 9 7 13 10 7 2 7 6 1 69
Kgatleng 21 36 41 37 30 27 17 20 24 17 0 270
Kweneng East 39 73 78 59 66 43 48 31 34 18 17 506
Kweneng West 7 15 14 13 14 5 4 8 5 3 2 90
Lobatse 6 13 13 5 6 6 2 2 1 1 4 59
Mahalapye 10 28 34 27 27 18 22 22 19 19 17 243
Ngamiland East 10 25 24 18 17 14 15 7 3 4 4 141
Ngamiland West 4 6 10 14 12 7 6 4 4 3 3 73
Ngwaketse West 0 6 8 4 5 3 1 5 2 2 1 37
North East 5 20 11 19 19 13 6 7 11 10 4 125
Orapa 0 2 4 9 4 1 2 0 0 0 0 22
SelebiPhikwe 15 19 18 15 12 6 11 5 4 3 4 112
Serowe/Palapye 9 34 34 27 27 22 18 13 19 12 10 225
South East 16 45 32 33 34 17 17 12 11 12 6 235
Southern 39 66 45 56 40 38 23 35 34 34 13 423
Tutume 20 35 34 34 20 19 25 13 19 15 13 247
Total 298 625 595 546 464 366 323 265 262 211 119 4074

Botswana Non-communicable Disease Risk Factor Surveillance - 2014 Page 25
Demographic Information Results
Age group and sex of respondents
Age Group (years)
Men Women Both Sexes
n % n % n %
15-29 562 42.6 1003 36.5 1565 38.5
30-44 420 31.8 930 33.8 1350 33.2
45-59 248 18.8 586 21.3 834 20.5
60-69 89 6.7 232 8.4 321 7.9
15-69 1319 100.0 2751 100.0 4070 100.0
Table 7 Respondents by age group & sex
Mean number of years of education
Age Group (years)
Men Women Both Sexes
n Mean n Mean n Mean
15-29 562 11.3 1003 11.2 1565 11.3
30-44 417 11.0 930 10.3 1347 10.5
45-59 246 6.4 585 6.3 831 6.3
60-69 88 4.4 232 4.2 320 4.3
15-69 1313 9.8 2750 9.3 4063 9.4
Table 8 Mean number of years of education
The age group of respondent was from 15-69. The number of participants in the age group 15-44
years was higher.
The number of female respondents was twice that of men in the survey.
The mean number of years spent on education was almost the same in both sexes
Highest level of education
Males
Agerange
n
Percent
No formal schooling
Less than
primary school
Primary school
completed
Jnr. Secondary
school completed
Snr. Secondary
school completed
High School completed
Tertiary School
completed
College/ University completed
Post graduate degree
15-29 561 0.5 2.9 8.9 35.1 29.8 3.4 14.6 4.8 0
30-44 419 4.3 6.4 12.2 27.2 15.3 2.4 22.4 8.1 1.7
45-59 248 29.4 11.3 25 14.9 4.4 0.4 9.7 4.4 0.4
60-69 89 41.6 22.5 19.1 9 1.1 0 4.5 2.2 0
TOTAL 1317 9.9 6.9 13.7 27 18.5 2.3 15.5 5.6 0.6
Table 9 Highest level of education Males

Botswana Non-communicable Disease Risk Factor Surveillance - 2014 Page 26
Highest level of education
Females
Age
range
n
Percent
No formal schooling
Less than
primary school
Primary school
completed
Jnr. Secondary
school completed
Snr. Secondary
school completed
High School completed
Tertiary School
completed
College/ University completed
Post graduate degree
15-29 1003 1 1.8 7.2 39.6 30.8 3.2 12.9 3.6 0
30-44 930 3.8 4.5 14.9 40.2 13.9 1.1 13.5 7.7 0.3
45-59 586 21 18.1 32.3 17.2 2 0.3 5.5 3.1 0.5
60-69 232 36.2 29.3 25 2.6 0.9 0.4 2.2 2.6 0.9
TOTAL 2751 9.2 8.5 16.6 31.9 16.4 1.6 10.6 4.8 0.3
Table 10 Highest level of education Females
0
5
10
15
20
25
30
35
Pe
rce
nt
Educational Level of STEPS Survey Participantsn=1317(males)
n=2751(females)
Males
Females
Figure 4 Educational level by sex
Highest level of education
Both Sexes
Agerange
n
Percent
No formal schooling
Less than
primary school
Primary school
completed
Jnr. Secondary
school completed
Snr. Secondary
school completed
High School
completed
Tertiary School
completed
College/ University completed
Post graduate degree
15-29 1564 0.8 2.2 7.8 38 30.4 3.3 13.5 4 0
30-44 1349 3.9 5.1 14.1 36.2 14.3 1.5 16.3 7.9 0.7
45-59 834 23.5 16.1 30.1 16.5 2.8 0.4 6.7 3.5 0.5
60-69 321 37.7 27.4 23.4 4.4 0.9 0.3 2.8 2.5 0.6
TOTAL 4068 9.4 8 15.7 30.3 17.1 1.8 12.2 5.1 0.4
Table 11 Highest level of education both sexes

Botswana Non-communicable Disease Risk Factor Surveillance - 2014 Page 27
Figure 5Educational level - both sexes
Equal number of Males and females were seen to have no formal education and starting from the senior secondary school to the post graduate level the percentage of male presence is higher to that of the females.
Ethnic Group
Age Group (years)
n Motswana Other
African European Asian Others
15-29 1564 96.7 3.1 0.0 0.1 0.1
30-44 1349 95.2 4.4 0.1 0.0 0.3
45-59 834 97.0 2.6 0.1 0.1 0.1
60-69 321 98.4 1.2 0.0 0.3 0.0
TOTAL 4068 96.4 3.3 0.0 0.1 0.1
Table 12 Ethnic group of participants
Among the STEPS survey participants, the great majority of the ethnic groups were Motswana while 3.6% were other African, European and from other nations.
Marital status
Age Group (years)
Men
n %
Never married
% Currently married
% Separated
% Divorced
% Widowed %
Cohabiting
15-29 561 94.5 0.5 0.0 0.0 0.0 5.0
30-44 419 60.6 20.5 0.7 1.2 0.5 16.5
45-59 248 34.7 40.7 1.2 4.8 4.0 14.5
60-69 89 19.1 56.2 0.0 3.4 5.6 15.7
15-69 1317 67.4 18.2 0.5 1.5 1.3 11.2
Table 13 Marital status of male participants
0
5
10
15
20
25
30
35
Per
cen
t
Educational Level of STEPS Study Participants Both Sexes
N=4068

Botswana Non-communicable Disease Risk Factor Surveillance - 2014 Page 28
Marital status
Age Group (years)
Women
n %
Never married
% Currently married
% Separated
% Divorced
% Widowed %
Cohabiting
15-29 1001 85.8 4.8 0.1 0.0 0.0 9.3
30-44 927 58.9 24.4 0.1 1.1 1.8 13.7
45-59 586 45.6 32.4 1.2 3.1 10.6 7.2
60-69 232 33.6 28.0 0.0 4.3 29.7 4.3
15-69 2746 63.7 19.3 0.3 1.4 5.4 9.9
Table 14 Marital status of female participants
Marital status
Age Group (years)
Both Sexes
n % Never married
% Currently married
% Separated
% Divorced % Widowed %
Cohabiting
15-29 1562 88.9 3.3 0.1 0.0 0.0 7.7
30-44 1346 59.4 23.2 0.3 1.1 1.4 14.6
45-59 834 42.3 34.9 1.2 3.6 8.6 9.4
60-69 321 29.6 35.8 0.0 4.0 23.1 7.5
15-69 4063 64.9 18.9 0.4 1.4 4.1 10.3
Table 15 Marital status of both sexes
The marital statuses of the survey participants were diverse: 19.3% were only married and 64.9% were never married, while 10.3% were simply cohabiting and around 5.5% of them were widowed and divorced.
Figure 6 Marital status by sex
0
10
20
30
40
50
60
70
80
Nevermarried
Currentlymarried
Separated Divorced Widowed Cohabiting
Per
cen
t
Marital Status
Marital Status of Steps Survey Participants by Sex 2014
N=4063
Males
Females

Botswana Non-communicable Disease Risk Factor Surveillance - 2014 Page 29
Employment status
Age Group (years)
Men
n %
Government employee
% Non-government employee
% Self-employed
% Unpaid
15-29 556 7.0 2.9 17.8 72.3
30-44 416 27.2 4.8 15.4 52.6
45-59 242 28.1 4.1 12.8 55.0
60-69 76 6.6 0.0 9.2 84.2
15-69 1290 17.4 3.6 15.6 63.4
Table 16 Employment status of males
Employment status
Age Group (years)
Women
n %
Government employee
% Non-government employee
% Self-employed
% Unpaid
15-29 986 7.1 1.3 9.9 81.6
30-44 914 17.7 3.0 11.9 67.4
45-59 545 17.6 1.5 5.5 75.4
60-69 186 7.0 0.5 1.1 91.4
15-69 2631 13.0 1.9 9.1 76.1
Table 17 Employment status of females
Employment status
Age Group (years)
Both Sexes
n %
Government employee
% Non-government employee
% Self-employed
% Unpaid
15-29 1542 7.1 1.9 12.8 78.3
30-44 1330 20.7 3.5 13.0 62.8
45-59 787 20.8 2.3 7.8 69.1
60-69 262 6.9 0.4 3.4 89.3
15-69 3921 14.4 2.4 11.2 71.9
Table 18 Employment status of both sexes
The comprehensive picture of the employment status of the participants is as stated in the above tables. It shows that as a government employee men are more than the females (17.4% versus 14.4% respectively). 71.9% of the whole participants were unpaid workers which include persons who are non-paid, students, homemakers, retired, and unemployed- i) able to work ii) Unable to work. Please see details are below.

Botswana Non-communicable Disease Risk Factor Surveillance - 2014 Page 30
0
20
40
60
80
Gov. employee Non-gov.employee
Self-employed Unpaid
Pe
rce
nt
STEPS Survey Participants by Employment Status2014
N=3921
Males
Females
Figure 7 Employment status
Unpaid work and unemployed
Age Group (years)
Men
n % Non-
paid %
Student % Home-
maker % Retired
Unemployed
% Able to work
% Not able to work
15-29 402 12.9 8.0 39.8 5.5 0.0 33.8
30-44 219 46.6 3.7 2.7 7.3 0.5 39.3
45-59 133 38.3 9.0 0.0 5.3 11.3 36.1
60-69 64 35.9 6.3 0.0 6.3 25.0 26.6
15-69 818 27.9 6.8 20.3 6.0 3.9 35.1
Table 19 Unpaid work and unemployed males
Unpaid work and unemployed
Age Group (years)
Women
n % Non-
paid %
Student % Home-
maker % Retired
Unemployed
% Able to work
% Not able to work
15-29 805 5.3 7.1 30.9 13.2 0.1 43.4
30-44 616 20.6 8.8 2.3 16.4 0.6 51.3
45-59 411 17.0 13.1 0.0 19.2 4.6 46.0
60-69 170 12.9 12.4 0.0 21.8 21.2 31.8
15-69 2002 13.1 9.3 13.1 16.1 3.0 45.4
Table 20 Unpaid work & unemployed Females
Unpaid work and unemployed
Age Group (years)
Both Sexes
n % Non-
paid %
Student % Home-
maker % Retired
Unemployed
% Able to work
% Not able to work
15-29 1207 7.9 7.4 33.9 10.6 0.1 40.2
30-44 835 27.4 7.4 2.4 14.0 0.6 48.1
45-59 544 22.2 12.1 0.0 15.8 6.3 43.6
60-69 234 19.2 10.7 0.0 17.5 22.2 30.3
15-69 2820 17.4 8.6 15.2 13.2 3.3 42.4
Table 21 Unpaid work both sexes

Botswana Non-communicable Disease Risk Factor Surveillance - 2014 Page 31
05
101520253035404550
Perc
ent
Unpaid Work and Unemployed of STEPS Survey Participants
2014N=2820
Males
Females
Figure 8 Unpaid work and Unemployed
Number of household members
Above 15-69 Years
No. of people Frequency Percent
1-3 3387 83.6
4-6 596 14.7
>6 68 1.7
Total 4051 100.0
Table 22 Household residents 15-69 yrs.
It was not easy to collect information on household income either on daily, monthly, annual or mention an estimated annual income from the participants, yet some of them responded and the data was analysed showing the estimated household earnings.
Estimated household earnings in Pula
n % Quintile
<5000 % Quintile 5000-9999
% Quintile 10000-14000
% Quintile 15000-19999
% Quintile >20000
92 63.0 9.8 7.6 4.3 15.2
Table 23 Estimated household earnings
Mean annual per capita income
n Mean
3046 20,799.8

Botswana Non-communicable Disease Risk Factor Surveillance - 2014 Page 32
Tobacco Use
Percentage of current smokers
Age Group (years)
Men Women Both Sexes
n % Current
smoker 95% CI n
% Current smoker
95% CI n %
Current smoker
95% CI
15-29 561 25.1 20.8-29.5 1003 3.8 1.9-5.7 1564 15.0 12.4-17.5
30-44 418 40.1 32.1-48.2 930 3.7 2.2-5.1 1348 22.2 17.3-27.2
45-59 248 37.6 28.7-46.4 585 7.8 4.2-11.4 833 21.5 16.3-26.7
60-69 89 30.9 16.7-45.2 232 12.3 0.6-24.0 321 20.8 11.6-29.9
15-69 1316 31.4 27.5-35.3 2750 4.9 3.5-6.2 4066 18.3 15.9-20.7
Table 24Current smokers both
Current daily smokers among smokers
Age Group (years)
Men Women Both Sexes
n % Daily smokers
95% CI n % Daily smokers
95% CI n % Daily smokers
95% CI
15-29 157 74.8 65.7-83.8 29 53.7 24.9-82.5 186 72.2 63.1-81.3
30-44 143 83.7 75.2-92.1 39 71.4 52.7-90.0 182 82.7 74.4-90.9
45-59 86 92.5 86.7-98.2 30 89.4 78.5-100.0 116 91.9 86.9-96.9
60-69 27 76.6 50.4-100.0 15 89.9 72.1-100.0 42 80.9 61.8-99.9
15-69 413 81.0 75.9-86.0 113 71.8 56.4-87.3 526 79.8 74.8-84.8
Table 25Current daily smokers
Percentage of male current smokers is 7 times higher to that of the females. The overall smoking status of the people in the country is 18.3%. There were 413 male and 113 female daily current smokers.
Smoking status
Age Group (years)
Men
n Current smoker Non-smokers
% Daily 95% CI %
Non-daily 95% CI
% Former smoker
95% CI % Never smoker
95% CI
15-29 561 18.8 14.8-22.8 6.3 3.8-8.9 10.4 6.5-14.3 64.5 59.1-69.8
30-44 418 33.6 25.1-42.0 6.6 3.3-9.8 13.0 8.4-17.6 46.9 38.9-54.9
45-59 248 34.8 25.9-43.6 2.8 0.7-5.0 22.4 15.9-28.9 40.0 32.4-47.6
60-69 89 23.7 11.3-36.1 7.3 0.0-16.5 15.0 6.9-23.0 54.1 38.8-69.5
15-69 1316 25.4 21.9-29.0 6.0 4.2-7.7 13.0 10.4-15.6 55.6 51.5-59.8
Table 26 Smoking status males

Botswana Non-communicable Disease Risk Factor Surveillance - 2014 Page 33
Smoking status
Age Group (years)
Women
n
Current smoker Non-smokers
% Daily 95% CI % Non-daily
95% CI % Former smoker
95% CI % Never smoker
95% CI
15-29 1003 2.0 1.0-3.1 1.8 0.1-3.5 2.6 1.5-3.7 93.6 91.4-95.8
30-44 930 2.6 1.4-3.8 1.0 0.2-1.9 4.0 2.4-5.5 92.4 90.2-94.5
45-59 585 7.0 3.6-10.4 0.8 0.0-1.7 6.2 2.5-9.8 86.0 81.3-90.8
60-69 232 11.1 0.0-22.8 1.2 0.0-3.1 9.0 3.5-14.5 78.7 67.2-90.2
15-69 2750 3.5 2.4-4.6 1.4 0.5-2.3 3.9 2.9-5.0 91.2 89.3-93.1
Table 27 Smoking status females
Smoking status
Age Group (years)
Both Sexes
n
Current smoker Non-smokers
% Daily 95% CI % Non-
daily 95% CI
% Former smoker
95% CI % Never smoker
95% CI
15-29 1564 10.8 8.5-13.1 4.2 2.6-5.7 6.7 4.5-8.8 78.3 75.3-81.4
30-44 1348 18.4 13.4-23.3 3.9 2.1-5.6 8.6 6.1-11.0 69.2 64.1-74.4
45-59 833 19.8 14.7-24.9 1.7 0.7-2.8 13.7 10.1-17.2 64.8 59.6-70.1
60-69 321 16.8 8.3-25.2 4.0 0.0-8.3 11.7 7.1-16.3 67.5 58.5-76.5
15-69 4066 14.6 12.4-16.8 3.7 2.7-4.7 8.5 7.1-9.9 73.2 70.6-75.8
Table 28 Smoking status both
Looking at the smoking status of each sex, there are more daily smoking in males compared to that of the females. In general, out of 4066 participants, 14.6% of both sexes smoke daily. 3.7%, non-daily,8.5% were former smokers but none currently and 73.2% had never smoked.
Figure 9 Smoking statuses of participants
0
10
20
30
40
50
60
70
80
90
100
Daily Non-daily Former smoker Never smoker
Pe
rcen
t
Smoking Status of STEPS Survey Participants 2014
N=4066
Male
Female

Botswana Non-communicable Disease Risk Factor Surveillance - 2014 Page 34
Mean age started smoking
Age Group (years)
Men Women Both Sexes
n Mean age
95% CI n Mean age
95% CI n Mean age
95% CI
15-29 108 18.6 18.0-19.3 18 19.0 16.1-21.8 126 18.6 18.0-19.3
30-44 110 21.6 19.9-23.2 25 24.3 19.9-28.7 135 21.7 20.2-23.3
45-59 65 25.2 21.7-28.6 21 31.2 23.7-38.7 86 26.3 22.9-29.6
60-69 19 25.6 22.9-28.3 12 44.1 34.7-53.6 31 32.4 23.7-41.2
15-69 302 21.2 20.2-22.1 76 28.5 22.2-34.9 378 22.0 20.8-23.2
Table 29 Mean age started smoking
Mean duration of smoking
Age Group (years)
Men Women Both Sexes
n Mean
duration 95% CI n
Mean duration
95% CI n Mean
duration 95% CI
15-29 108 5.9 5.2-6.5 18 5.6 2.6-8.7 126 5.9 5.2-6.5
30-44 110 16.1 13.7-18.5 25 14.0 10.0-17.9 135 15.9 13.6-18.2
45-59 65 26.6 23.0-30.2 21 18.6 9.2-28.1 86 25.2 21.5-28.8
60-69 19 36.5 33.6-39.4 12 18.8 8.0-29.7 31 30.0 21.2-38.9
15-69 302 14.6 12.7-16.6 76 13.7 10.6-16.8 378 14.5 12.7-16.4
Table 30 Mean duration of smoking
The mean age males start smoking is 21.2 years while females start in later ages at 28.5years of age. Themean duration of smoking in years is the same between males and females.
Manufactured cigarette smokers among daily smokers
Age Group (years)
Men Women Both Sexes
n
% Manu-factured cigarette smoker
95% CI n
% Manu-
factured cigarette smoker
95% CI n
% Manu-
factured cigarette smoker
95% CI
15-29 111 96.1 91.7-100.0 17 65.9 40.6-91.2 128 93.5 87.8-99.1
30-44 112 87.5 78.9-96.1 27 46.9 24.3-69.5 139 84.9 76.4-93.4
45-59 71 78.2 64.4-92.0 26 41.5 10.3-72.7 97 71.2 58.1-84.2
60-69 22 37.6 12.0-63.3 13 13.1 0.0-33.9 35 28.8 8.2-49.5
15-69 316 87.0 81.1-92.9 83 44.2 26.7-61.7 399 82.0 76.2-87.8
Table 31 Manufactured cig. Smokers among daily
Manufactured cigarette smokers among current smokers
Age Group (years)
Men Women Both Sexes
n
% Manu-factured cigarette smoker
95% CI n
% Manu-factured cigarette smoker
95% CI n
% Manu-factured cigarette smoker
95% CI
15-29 153 96.7 93.3-100.0
26 76.8 57.2-96.3
179 94.4 90.1-98.7
30-44 136 88.0 80.6-95.4 38 51.7 32.0-71.4 174 85.2 77.9-92.5
45-59 81 78.8 65.8-91.8 29 39.6 10.1-69.1 110 71.2 58.9-83.5
60-69 27 52.2 24.1-80.4 14 15.8 0.0-38.6 41 41.1 15.3-66.8
15-69 397 88.6 83.6-93.5 107 52.9 36.4-69.4 504 84.1 79.2-88.9
Table 32 Manufactured cig. smokers among current
82.0% of daily smokers and 84.1% of the current smokers of both sexes use manufactured cigarettes.

Botswana Non-communicable Disease Risk Factor Surveillance - 2014 Page 35
Mean amount of tobacco used by daily smokers by type
Age Group (years)
Men
n Mean # of
manufactured cig.
95% CI n Mean # of hand-rolled
cig. 95% CI n
Mean # of pipes of tobacco
95% CI
15-29 110 5.0 4.0-6.0 113 1.8 0.7-2.9 114.0 0.6 0.0-1.7
30-44 111 6.5 4.8-8.1 111 3.0 1.1-4.9 114.0 0.2 0.0-0.5
45-59 70 5.7 3.6-7.8 71 2.2 1.1-3.4 73.0 0.1 0.0-0.1
60-69 22 1.3 0.3-2.3 19 6.0 2.4-9.6 22.0 0.0 --------
15-69 313 5.5 4.7-6.4 314 2.5 1.6-3.5 323.0 0.3 0.0-0.8
Table 33Mean type of tobacco used by type males
Mean amount of tobacco used by daily smokers by type
Age Group (years)
Men
n
Mean # of cigars,
cheerots, cigarillos
95% CI n Mean # of
shisha sessions
95% CI n Mean # of other type of tobacco
95% CI
15-29 113 0.3 0.0-0.7 114 0.0 -------- 113 0.1 0.0-0.2
30-44 114 0.2 0.0-0.4 114 0.0 0.0-0.0 113 0.3 0.0-0.7
45-59 74 0.0 -------- 74 0.0 -------- 74 0.4 0.0-0.9
60-69 22 0.1 0.0-0.4 22 0.0 -------- 21 0.1 0.0-0.3
15-69 323 0.2 0.0-0.4 324 0.0 0.0-0.0 321 0.2 0.1-0.4
Mean amount of tobacco used by daily smokers by type
Age Group (years)
Women
n Mean # of manufactured cig.
95% CI N Mean # of hand-
rolled cig. 95% CI n
Mean # of pipes
of tobacco
95% CI
15-29 17 3.0 1.5-4.5 18 1.1 0.0-2.2 19 0.0 --------
30-44 27 2.4 0.7-4.1 26 1.3 0.0-2.6 28 0.2 0.0-0.7
45-59 25 1.1 0.4-1.9 25 2.7 0.4-4.9 26 0.0 --------
60-69 13 0.6 0.0-1.5 13 0.6 0.0-1.7 13 0.0 --------
15-69 82 1.8 1.0-2.6 82 1.6 0.6-2.5 86 0.1 0.0-0.2
Table 34Mean amount of tobacco used by type females
Mean amount of tobacco used by daily smokers by type
Age Group (years)
Women
n
Mean # of cigars,
cheerots, cigarillos
95% CI N Mean # of
shisha sessions
95% CI n Mean # of other type of tobacco
95% CI
15-29 19 0.3 0.0-1.0 19 0.0 -------- 19 0.6 0.0-1.8
30-44 28 0.1 0.0-0.3 28 0.0 -------- 26 1.4 0.3-2.5
45-59 26 0.4 0.0-1.3 26 0.2 0.0-0.6 24 1.5 0.0-3.0
60-69 13 0.0 -------- 13 0.0 -------- 11 0.8 0.0-1.8
15-69 86 0.2 0.0-0.6 86 0.1 0.0-0.2 80 1.1 0.4-1.8
The mean number of manufactured cigarette used by 313 male daily smokers was 5.5; hand rolled 2.5; pipes of tobacco 0.3; cigarillo 0.2; and other tobacco types 0.2; whereas the mean amount of manufactured cigarettes used in daily smoking females was 1.8; hand rolled 1.6; pipes, cigarillos shishas less than 1.0 and other types of tobacco 1.1.

Botswana Non-communicable Disease Risk Factor Surveillance - 2014 Page 36
Mean amount of tobacco used by daily smokers by type
Age Group (years)
Both Sexes
n Mean # of manufactu
red cig. 95% CI N
Mean # of hand-rolled
cig. 95% CI n
Mean # of pipes of tobacco
95% CI
15-29 127 4.9 3.9-5.8 131 1.7 0.7-2.8 133 0.5 0.0-1.5
30-44 138 6.2 4.6-7.8 137 2.9 1.1-4.7 142 0.2 0.0-0.5
45-59 95 4.8 3.3-6.4 96 2.3 1.3-3.3 99 0.0 0.0-0.1
60-69 35 1.0 0.2-1.9 32 3.9 0.8-7.1 35 0.0 --------
15-69 395 5.1 4.3-5.9 396 2.4 1.5-3.3 409 0.3 0.0-0.7
Table 35Mean tobacco use by type both
Mean amount of tobacco used by daily smokers by type
Age Group (years)
Both Sexes
n
Mean # of cigars,
cheerots, cigarillos
95% CI N Mean #
of shisha sessions
95% CI n
Mean # of other type
of tobacco
95% CI
15-29 132 0.3 0.0-0.7 133 0.0 -------- 132 0.1 0.0-0.2
30-44 142 0.2 0.0-0.3 142 0.0 0.0-0.0 139 0.4 0.0-0.8
45-59 100 0.1 0.0-0.2 100 0.0 0.0-0.0 98 0.6 0.2-1.0
60-69 35 0.1 0.0-0.3 35 0.0 -------- 32 0.3 0.0-0.6
15-69 409 0.2 0.0-0.4 410 0.0 0.0-0.0 401 0.3 0.2-0.5
The mean number daily smokers using manufactured cigarettes of 5.1; hand rolled 2.4; cigarillos and other types of tobacco less than 0.5in both sexes.
Percentage of current smokers smoking each of the following products
Age Group (years)
Men
n % Manuf.
cigs. 95% CI
% Hand-rolledcigs.
95% CI % Pipes of
tobacco 95% CI
15-29 157 94.8 90.9-98.7 28.6 17.9-39.3 1.6 0.0-3.8
30-44 143 86.0 78.3-93.8 43.4 27.8-59.0 5.4 0.0-11.7
45-59 86 76.8 64.0-89.6 44.7 27.7-61.7 1.9 0.0-5.0
60-69 27 52.2 24.1-80.4 59.1 31.6-86.5 0.0 0.0-0.0
15-69 413 86.8 81.8-91.7 38.0 29.3-46.7 3.0 0.4-5.6
Table 36Current smokers by type of product - Males
Percentage of current smokers smoking each of the following products
Age Group (years)
Men
n % Cigars, cheroots, cigarillos
95% CI % Shisha 95% CI % Other 95% CI
15-29 157 1.1 0.0-2.4 0.0 0.0-0.0 7.8 0.0-16.8
30-44 143 5.3 0.0-11.5 0.9 0.0-2.8 4.8 0.7-8.8
45-59 86 0.0 0.0-0.0 0.0 0.0-0.0 20.1 1.1-39.0
60-69 27 1.7 0.0-5.0 0.0 0.0-0.0 7.9 0.0-17.6
15-69 413 2.5 0.0-5.0 0.3 0.0-1.0 8.6 3.3-13.9

Botswana Non-communicable Disease Risk Factor Surveillance - 2014 Page 37
Percentage of current smokers smoking each of the following products
Age Group (years)
Women
n % Manuf.
cigs. 95% CI
% Hand-rolledcigs.
95% CI % Pipes of
tobacco 95% CI
15-29 29 70.2 49.0-91.3 14.1 0.0-28.6 0.0 0.0-0.0
30-44 39 48.6 29.0-68.2 18.7 2.9-34.5 3.5 0.0-10.3
45-59 30 38.1 9.6-66.6 31.9 10.2-53.7 0.0 0.0-0.0
60-69 15 14.6 0.0-35.0 13.9 0.0-33.6 0.0 0.0-0.0
15-69 113 49.4 33.7-65.1 19.6 8.9-30.3 0.7 0.0-2.2
Table 37 Current smokers by type of product – Females
Percentage of current smokers smoking each of the following products
Age Group (years)
Women
n % Cigars, cheroots, cigarillos
95% CI % Shisha 95% CI % Other 95% CI
15-29 29 3.7 0.0-9.2 0.0 0.0-0.0 12.3 0.0-27.5
30-44 39 3.5 0.0-10.3 0.0 0.0-0.0 40.5 20.1-60.9
45-59 30 3.7 0.0-11.0 3.7 0.0-11.0 27.4 8.6-46.3
60-69 15 0.0 0.0-0.0 0.0 0.0-0.0 18.3 0.0-47.1
15-69 113 3.1 0.0-6.3 1.0 0.0-2.9 23.1 12.4-33.8
Figure 10 Current smokers with type of products
0
10
20
30
40
50
60
70
80
90
100
Pe
rcen
tage
Current smokers using the following products STEPS Survey 2014
Males
Females

Botswana Non-communicable Disease Risk Factor Surveillance - 2014 Page 38
Percentage of current smokers smoking each of the following products
Age Group (years)
Both Sexes
n % Manuf.
cigs. 95% CI
% Hand-rolledcigs.
95% CI % Pipes of
tobacco 95% CI
15-29 186 91.9 87.1-96.6 26.8 17.0-36.6 1.4 0.0-3.4
30-44 182 83.0 75.4-90.7 41.4 26.6-56.2 5.2 0.0-11.0
45-59 116 69.2 57.2-81.2 42.2 28.9-55.5 1.5 0.0-4.0
60-69 42 40.1 14.9-65.2 44.5 20.2-68.7 0.0 0.0-0.0
15-69 526 81.9 77.0-86.7 35.6 27.8-43.4 2.7 0.4-5.0
Table 38 Percentage of Current smokers – Both
Percentage of current smokers smoking each of the following products
Age Group (years)
Both Sexes
n % Cigars, cheroots, cigarillos
95% CI % Shisha 95% CI % Other 95% CI
15-29 186 1.4 0.1-2.7 0.0 0.0-0.0 8.3 0.3-16.4
30-44 182 5.1 0.0-10.9 0.9 0.0-2.6 7.6 3.2-12.0
45-59 116 0.7 0.0-2.1 0.7 0.0-2.1 21.5 6.8-36.3
60-69 42 1.1 0.0-3.4 0.0 0.0-0.0 11.2 0.2-22.3
15-69 526 2.6 0.4-4.8 0.4 0.0-1.1 10.5 6.0-15.0
Figure 11 Smokers by age group & tobacco type
0102030405060708090
100
Per
cen
t
Current smokers by age group & type of tobacco product used by both sexes
STEPS Survey 2014
15-29
30-44
45-59
60-69
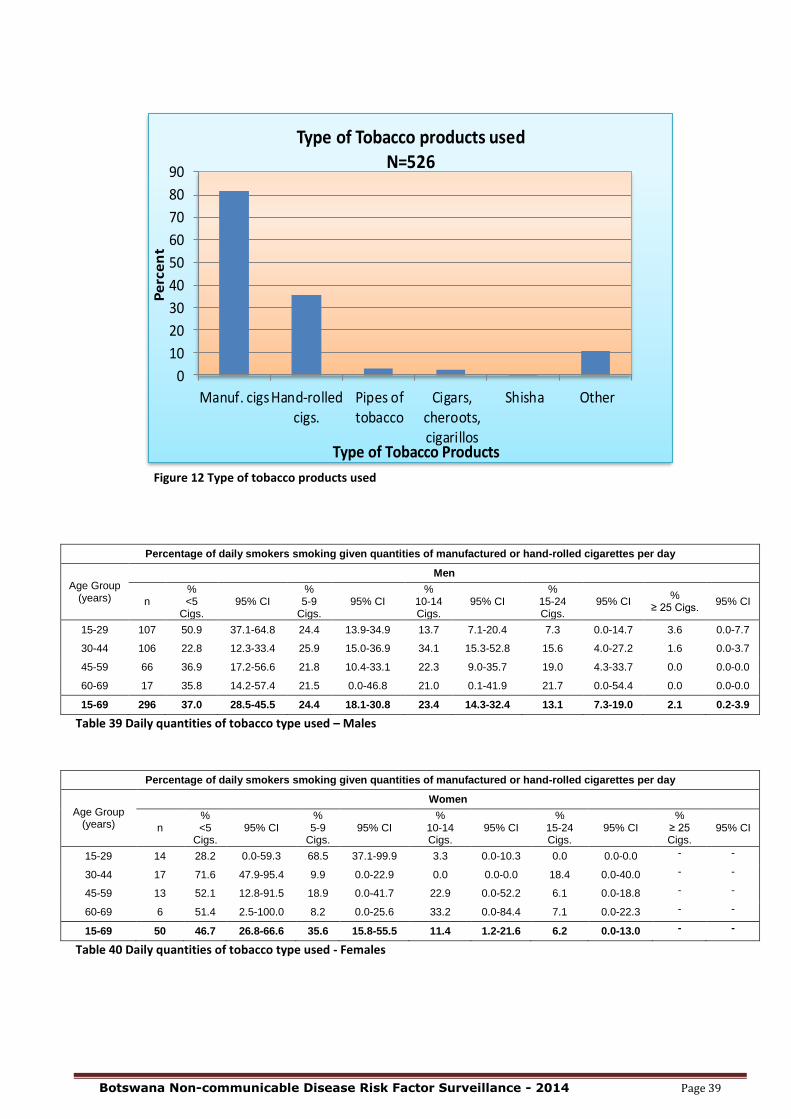
Botswana Non-communicable Disease Risk Factor Surveillance - 2014 Page 39
0
10
20
30
40
50
60
70
80
90
Manuf. cigsHand-rolledcigs.
Pipes oftobacco
Cigars,cheroots,cigarillos
Shisha Other
Pe
rce
nt
Type of Tobacco Products
Type of Tobacco products usedN=526
Figure 12 Type of tobacco products used
Percentage of daily smokers smoking given quantities of manufactured or hand-rolled cigarettes per day
Age Group (years)
Men
n % <5
Cigs. 95% CI
% 5-9
Cigs. 95% CI
% 10-14 Cigs.
95% CI %
15-24 Cigs.
95% CI %
≥ 25 Cigs. 95% CI
15-29 107 50.9 37.1-64.8 24.4 13.9-34.9 13.7 7.1-20.4 7.3 0.0-14.7 3.6 0.0-7.7
30-44 106 22.8 12.3-33.4 25.9 15.0-36.9 34.1 15.3-52.8 15.6 4.0-27.2 1.6 0.0-3.7
45-59 66 36.9 17.2-56.6 21.8 10.4-33.1 22.3 9.0-35.7 19.0 4.3-33.7 0.0 0.0-0.0
60-69 17 35.8 14.2-57.4 21.5 0.0-46.8 21.0 0.1-41.9 21.7 0.0-54.4 0.0 0.0-0.0
15-69 296 37.0 28.5-45.5 24.4 18.1-30.8 23.4 14.3-32.4 13.1 7.3-19.0 2.1 0.2-3.9
Table 39 Daily quantities of tobacco type used – Males
Percentage of daily smokers smoking given quantities of manufactured or hand-rolled cigarettes per day
Age Group (years)
Women
n % <5
Cigs. 95% CI
% 5-9
Cigs. 95% CI
% 10-14 Cigs.
95% CI %
15-24 Cigs.
95% CI %
≥ 25 Cigs.
95% CI
15-29 14 28.2 0.0-59.3 68.5 37.1-99.9 3.3 0.0-10.3 0.0 0.0-0.0 - -
30-44 17 71.6 47.9-95.4 9.9 0.0-22.9 0.0 0.0-0.0 18.4 0.0-40.0 - -
45-59 13 52.1 12.8-91.5 18.9 0.0-41.7 22.9 0.0-52.2 6.1 0.0-18.8 - -
60-69 6 51.4 2.5-100.0 8.2 0.0-25.6 33.2 0.0-84.4 7.1 0.0-22.3 - -
15-69 50 46.7 26.8-66.6 35.6 15.8-55.5 11.4 1.2-21.6 6.2 0.0-13.0 - -
Table 40 Daily quantities of tobacco type used - Females

Botswana Non-communicable Disease Risk Factor Surveillance - 2014 Page 40
Figure 13 Quantity of tobacco used
Percentage of daily smokers smoking given quantities of manufactured or hand-rolled cigarettes per day
Age Group (years)
Both Sexes
n % <5
Cigs. 95% CI
% 5-9
Cigs. 95% CI
% 10-14 Cigs.
95% CI %
15-24 Cigs.
95% CI %
≥ 25 Cigs.
95% CI
15-29 121 49.2 35.7-62.7 27.8 17.2-38.4 12.9 6.7-19.2 6.8 0.0-13.6 3.3 0.0-7.1
30-44 123 24.9 14.3-35.5 25.3 14.8-35.7 32.6 14.3-50.9 15.7 4.6-26.8 1.5 0.0-3.5
45-59 79 39.2 22.3-56.2 21.3 10.0-32.6 22.4 9.8-35.1 17.0 4.5-29.5 0.0 0.0-0.0
60-69 23 37.6 17.9-57.2 20.0 0.0-42.5 22.4 2.0-42.7 20.1 0.0-49.5 0.0 0.0-0.0
15-69 346 37.8 29.7-45.8 25.3 19.1-31.6 22.4 14.0-30.9 12.6 7.1-18.0 1.9 0.2-3.6
Table 41 Daily quantities of tobacco type used – Both
0
5
10
15
20
25
30
35
40
<5 5-9 10-4 15-24 ≥ 25
Per
cen
t
Quantity of Cigarette
Percentage of Daily Smokers by Quantity of Cigarettes
STEPS Survey 2014N = 346 (Both Male & Females)
Figure 14Quantity of cigarettes used – Both
0
5
10
15
20
25
30
35
40
45
50
<5 5-9 10-14 15-24 ≥ 25
Pe
rcen
t o
f Sm
oke
rs
Quantity of Cigarettes
Percentage of Daily smokers Using quantities of manuf.cigarettes or hand rolled
Males
Females

Botswana Non-communicable Disease Risk Factor Surveillance - 2014 Page 41
Former daily smokers among all respondents
Age Group (years)
Men Women Both Sexes
n
% Former
daily smokers
95% CI n
% Former
daily smokers
95% CI n
% Former
daily smokers
95% CI
15-29 561 7.9 4.3-11.5 1003 1.4 0.0-2.9 1564 4.8 2.7-6.8
30-44 418 11.5 7.0-16.1 930 2.3 1.1-3.5 1348 7.0 4.6-9.4
45-59 248 19.4 13.3-25.5 585 4.4 1.5-7.3 833 11.3 8.0-14.6
60-69 89 18.4 7.3-29.6 232 7.2 2.2-12.3 321 12.3 6.8-17.8
15-69 1316 11.0 8.4-13.5 2750 2.4 1.3-3.6 4066 6.8 5.4-8.1
Table 42Former daily smokers among all
Former daily smokers among ever daily smokers
Age Group (years)
Men Women Both Sexes
n
% Former
daily smokers
95% CI n
% Former
daily smokers
95% CI n
% Former
daily smokers
95% CI
15-29 154 29.6 18.3-40.8 30 40.0 8.3-71.6 184 30.7 19.9-41.4
30-44 168 25.6 15.3-35.9 50 46.8 29.1-64.4 218 27.6 18.0-37.2
45-59 122 35.8 24.4-47.2 50 38.7 18.4-58.9 172 36.4 25.9-46.8
60-69 39 43.8 22.4-65.1 26 39.5 5.6-73.4 65 42.3 24.4-60.3
15-69 483 30.1 23.9-36.3 156 41.1 26.6-55.6 639 31.6 25.9-37.4
Table 43Former smokers among ever daily
Mean years since cessation
Age Group (years)
Men Women Both Sexes
n Mean years
95% CI n Mean years
95% CI n Mean years
95% CI
15-29 53 2.0 1.1-2.9 30 3.8 2.6-5.0 83 2.3 1.5-3.1
30-44 62 5.9 4.1-7.6 36 7.1 4.7-9.6 98 6.2 4.7-7.6
45-59 57 19.3 15.6-23.0 25 12.1 6.3-18.0 82 17.9 14.7-21.1
60-69 18 18.8 13.2-24.4 13 15.8 7.9-23.7 31 17.6 13.0-22.3
15-69 190 8.0 6.1-9.8 104 8.1 5.8-10.4 294 8.0 6.4-9.5
Table 44Mean years since cessation
Current smokers who have tried to stop smoking
Age Group (years)
Men Women Both Sexes
n % Tried to stop
smoking 95% CI n
% Tried to stop
smoking 95% CI n
%Tried to stop
smoking 95% CI
15-29 157 65.5 56.0-74.9 29 34.1 10.9-57.2 186 61.7 52.4-71.0
30-44 143 53.5 40.1-67.0 39 57.1 36.6-77.6 182 53.8 41.4-66.2
45-59 86 49.7 34.4-64.9 30 33.7 11.6-55.9 116 46.6 32.3-60.8
60-69 27 58.5 37.8-79.2 15 71.4 36.9-100.0 42 62.7 44.4-80.9
15-69 413 58.2 51.7-64.8 113 44.3 29.2-59.3 526 56.4 50.0-62.7
Table 45Smokers who have tried to stop

Botswana Non-communicable Disease Risk Factor Surveillance - 2014 Page 42
Current smokers who have been advised by doctor to stop smoking
Age Group (years)
Men Women Both Sexes
n % Advised
to stop smoking
95% CI n % Advised to stop smoking
95% CI n %Advised to
stop smoking
95% CI
15-29 127 34.0 22.2-45.8 29 48.1 20.6-75.6 156 36.0 25.3-46.8
30-44 123 42.6 28.8-56.4 37 49.9 29.7-70.0 160 43.3 30.6-56.1
45-59 80 42.4 27.4-57.5 30 46.8 19.2-74.4 110 43.3 31.4-55.2
60-69 25 63.5 37.7-89.3 14 51.6 33.9-69.3 39 59.6 40.4-78.8
15-69 355 40.0 32.4-47.7 110 48.6 35.0-62.3 465 41.4 34.7-48.1
Table 46 Advised by health workers to stop smoking
Current users of smokeless tobacco
Age Group (years)
Men Women Both Sexes
n %
Current users
95% CI n %
Current users
95% CI n %
Current users
95% CI
15-29 561 0.6 0.0-1.2 1003 2.1 0.8-3.3 1564 1.3 0.6-2.0
30-44 418 2.2 0.6-3.8 930 7.2 4.4-9.9 1348 4.6 3.0-6.3
45-59 248 2.8 0.0-5.8 585 11.5 7.6-15.4 833 7.5 4.6-10.4
60-69 89 3.5 0.0-7.2 232 27.0 15.5-38.5 321 16.3 8.7-24.0
15-69 1316 1.5 0.8-2.2 2750 6.5 4.9-8.1 4066 3.9 3.0-4.9
Table 47Current smokeless tobacco users
Smokeless tobacco use
Age Group (years)
Men
n Current user Non user
% Daily 95% CI % Non-
daily 95% CI
% Past user
95% CI %
Never used
95% CI
15-29 561 0.3 0.0-0.6 0.3 0.0-0.8 1.0 0.0-2.0 98.4 97.3-99.6
30-44 418 0.3 0.0-0.6 1.9 0.4-3.5 0.2 0.0-0.5 97.6 96.0-99.2
45-59 248 1.5 0.0-4.1 1.3 0.0-2.9 1.8 0.0-4.1 95.4 91.7-99.0
60-69 89 2.2 0.0-4.7 1.4 0.0-4.0 0.4 0.0-1.1 96.1 92.3-99.9
15-69 1316 0.5 0.1-1.0 0.9 0.4-1.5 0.9 0.2-1.5 97.7 96.8-98.6
Table 48Smokeless tobacco use males
Smokeless tobacco use
Age Group (years)
Women
n
Current user Non user
% Daily 95% CI % Non-
daily 95% CI
% Past user
95% CI % Never
used 95% CI
15-29 1003 1.6 0.4-2.7 0.5 0.0-1.0 1.5 0.5-2.5 96.4 94.8-98.0
30-44 930 5.4 3.0-7.8 1.7 0.4-3.1 3.1 1.5-4.8 89.7 86.6-92.8
45-59 585 10.0 6.3-13.7 1.5 0.5-2.5 3.8 2.0-5.7 84.7 80.2-89.1
60-69 232 19.6 11.9-27.3 7.4 0.9-13.9 7.2 2.7-11.7 65.7 53.2-78.3
15-69 2750 5.0 3.6-6.5 1.4 0.8-2.0 2.7 1.8-3.6 90.8 89.0-92.7
Table 49Smokeless tobacco use females

Botswana Non-communicable Disease Risk Factor Surveillance - 2014 Page 43
Smokeless tobacco use
Age Group (years)
Both Sexes
n
Current user Non user
% Daily 95% CI %
Non-daily
95% CI % Past
user 95% CI
% Never used
95% CI
15-29 1564 0.9 0.3-1.5 0.4 0.0-0.7 1.3 0.6-2.0 97.4 96.5-98.4
30-44 1348 2.8 1.6-4.0 1.9 0.8-2.9 1.6 0.8-2.5 93.7 91.9-95.6
45-59 833 6.1 3.3-8.9 1.4 0.5-2.3 2.9 1.5-4.3 89.6 86.4-92.7
60-69 321 11.7 6.6-16.8 4.7 0.7-8.6 4.1 1.5-6.7 79.6 71.0-88.1
15-69 4066 2.8 2.0-3.6 1.2 0.7-1.6 1.8 1.2-2.3 94.3 93.2-95.4
Table 50Smokeless tobacco use – Both
0
1
2
3
4
5
6
Daily Non-daily Past user
Pe
rce
nt
Smokeless Tobacco Use
Smokeless Tobacco Use by Survey Participants n=Males1315, Females 2750
Male
Female
Figure 15Smokeless tobacco users
Former daily smokeless tobacco users among all respondents
Age Group (years)
Men Women Both Sexes
n
% Former
daily users
95% CI n
% Former
daily users
95% CI n
% Former
daily users
95% CI
15-29 560 0.5 0.0-1.4 1003 0.9 0.2-1.5 1563 0.7 0.2-1.2
30-44 418 0.5 0.0-1.3 930 3.0 1.2-4.7 1348 1.7 0.8-2.7
45-59 248 2.9 0.2-5.7 585 3.3 1.7-5.0 833 3.2 1.6-4.7
60-69 89 0.0 0.0-0.0 232 10.2 4.9-15.5 321 5.6 2.5-8.6
15-69 1315 0.8 0.2-1.4 2750 2.4 1.6-3.2 4065 1.6 1.1-2.1
Table 51Former smokeless tobacco users among all

Botswana Non-communicable Disease Risk Factor Surveillance - 2014 Page 44
Table 52Former daily smokeless tobacco users among ever daily users
Mean times per day smokeless tobacco used by daily smokeless tobacco users by type
Age Group (years)
Men
n Snuff by mouth
95% CI n Snuff by
nose 95% CI n
Chewing tobacco
95% CI
15-29 2 0.0 -------- 2 4.0 -------- 3 0 --------
30-44 2 4.2 0.0-10.0 2 1.6 0.0-4.9 2 0 --------
45-59 2 4.6 3.2-5.9 2 4.6 3.2-5.9 2 0 --------
60-69 3 0.5 0.0-1.6 3 2.2 0.5-3.9 3 0 --------
15-69 9 2.8 0.1-5.5 9 3.5 1.7-5.3 10 0 --------
Table 53Mean time per day smokeless tobacco used – Males
Mean times per day smokeless tobacco used by daily smokeless tobacco users by type
Age Group (years)
Men
n Betel, quid 95% CI n Other 95% CI
15-29 3 0 -------- 3 0 --------
30-44 2 0 -------- 2 0 --------
45-59 2 0 -------- 2 0 --------
60-69 3 0 -------- 3 0 --------
15-69 10 0 -------- 10 0 --------
0
1
2
3
4
5
Snuff by mouth Snuff by nose Chewing tobacco
Pe
rce
nt
Mean times per day used
Mean times daily used by smokeless tobacco daily usersn=Males 10, Females 159
Male
Female
Figure 16Mean times daily used by smokeless users
Former daily smokeless tobacco users among ever daily users
Age Group (years)
Men Women Both Sexes
n
% Former
daily users
95% CI n
% Former
daily users
95% CI n % Former dailyusers
95% CI
15-29 6 65.7 18.1-100.0 23 35.5 10.5-60.6 29 43.7 18.4-69.0
30-44 5 66.6 18.6-100.0 66 35.3 17.7-52.9 71 38.1 21.2-55.0
45-59 7 65.9 16.6-100.0 89 25.1 14.3-35.9 96 34.1 18.8-49.4
60-69 3 0.0 0.0-0.0 60 34.2 20.3-48.0 63 32.2 19.0-45.4
15-69 21 61.1 32.7-89.5 238 32.1 23.3-41.0 259 36.7 27.5-45.9
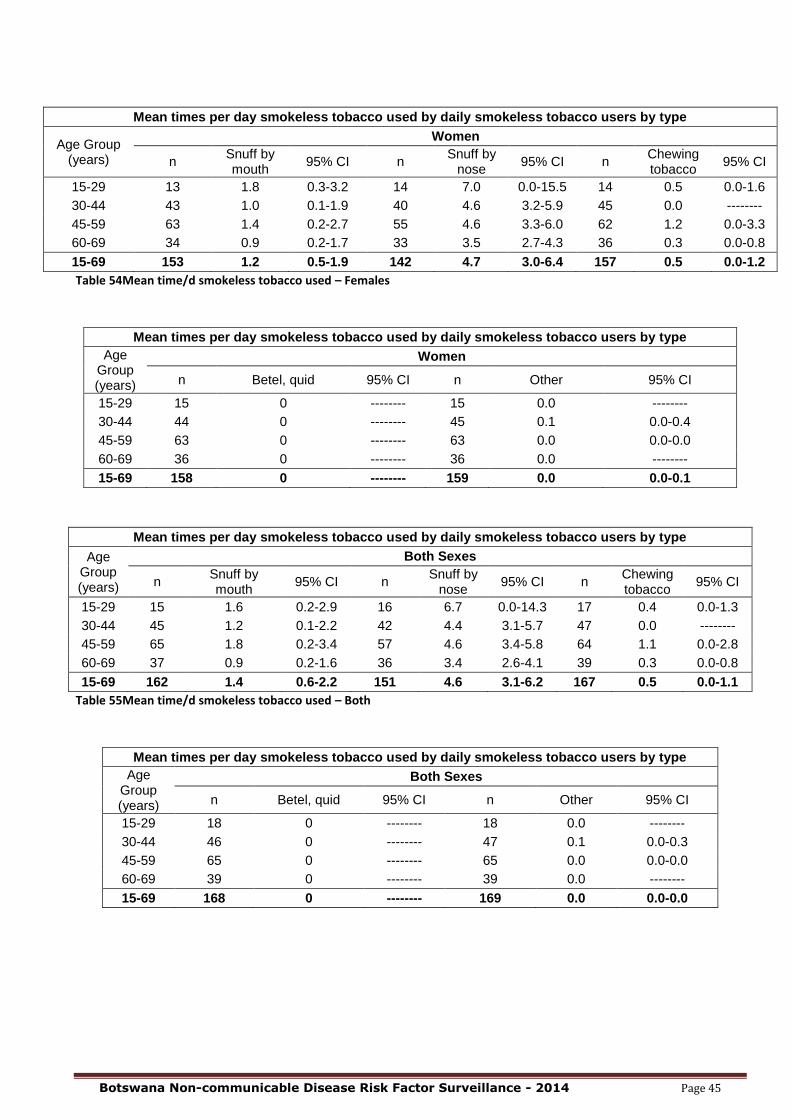
Botswana Non-communicable Disease Risk Factor Surveillance - 2014 Page 45
Mean times per day smokeless tobacco used by daily smokeless tobacco users by type
Age Group (years)
Women
n Snuff by mouth
95% CI n Snuff by
nose 95% CI n
Chewing tobacco
95% CI
15-29 13 1.8 0.3-3.2 14 7.0 0.0-15.5 14 0.5 0.0-1.6
30-44 43 1.0 0.1-1.9 40 4.6 3.2-5.9 45 0.0 --------
45-59 63 1.4 0.2-2.7 55 4.6 3.3-6.0 62 1.2 0.0-3.3
60-69 34 0.9 0.2-1.7 33 3.5 2.7-4.3 36 0.3 0.0-0.8
15-69 153 1.2 0.5-1.9 142 4.7 3.0-6.4 157 0.5 0.0-1.2
Table 54Mean time/d smokeless tobacco used – Females
Mean times per day smokeless tobacco used by daily smokeless tobacco users by type
Age Group (years)
Women
n Betel, quid 95% CI n Other 95% CI
15-29 15 0 -------- 15 0.0 --------
30-44 44 0 -------- 45 0.1 0.0-0.4
45-59 63 0 -------- 63 0.0 0.0-0.0
60-69 36 0 -------- 36 0.0 --------
15-69 158 0 -------- 159 0.0 0.0-0.1
Mean times per day smokeless tobacco used by daily smokeless tobacco users by type
Age Group (years)
Both Sexes
n Snuff by mouth
95% CI n Snuff by
nose 95% CI n
Chewing tobacco
95% CI
15-29 15 1.6 0.2-2.9 16 6.7 0.0-14.3 17 0.4 0.0-1.3
30-44 45 1.2 0.1-2.2 42 4.4 3.1-5.7 47 0.0 --------
45-59 65 1.8 0.2-3.4 57 4.6 3.4-5.8 64 1.1 0.0-2.8
60-69 37 0.9 0.2-1.6 36 3.4 2.6-4.1 39 0.3 0.0-0.8
15-69 162 1.4 0.6-2.2 151 4.6 3.1-6.2 167 0.5 0.0-1.1
Table 55Mean time/d smokeless tobacco used – Both
Mean times per day smokeless tobacco used by daily smokeless tobacco users by type
Age Group (years)
Both Sexes
n Betel, quid 95% CI n Other 95% CI
15-29 18 0 -------- 18 0.0 --------
30-44 46 0 -------- 47 0.1 0.0-0.3
45-59 65 0 -------- 65 0.0 0.0-0.0
60-69 39 0 -------- 39 0.0 --------
15-69 168 0 -------- 169 0.0 0.0-0.0

Botswana Non-communicable Disease Risk Factor Surveillance - 2014 Page 46
0
10
20
30
40
50
60
70
80
Snuff by mouth Snuff by nose Other
Per
cen
t
Type of smokeless tobacco
Male current smokeless tobacco users by typeN=22
Figure 17Male smokeless tobacco users by type
Percentage of current users of smokeless tobacco using each of the following products
Age Group (years)
Women
n % Snuff by
mouth 95% CI
% Snuff by nose
95% CI % Chewing
tobacco 95% CI
15-29 20 46.7 16.8-76.6 80.8 62.6-99.1 7.6 0.0-22.4
30-44 57 22.5 8.0-36.9 87.5 77.4-97.5 0.0 0.0-0.0
45-59 76 24.8 6.1-43.5 84.7 73.8-95.6 14.1 0.0-32.5
60-69 44 19.9 3.3-36.4 74.3 58.2-90.5 8.2 0.0-17.0
15-69 197 26.4 14.5-38.3 82.5 75.0-90.0 7.2 1.1-13.2
Table 56Percentage of current users of smokeless tobacco by type – Females
Percentage of current users of smokeless tobacco using each of the following products
Age Group (years)
Women
n % Betel, quid 95% CI % Other 95% CI
15-29 20 4.6 0.0-13.8 2.2 0.0-6.7
30-44 57 0.0 0.0-0.0 1.8 0.0-5.3
45-59 76 0.0 0.0-0.0 3.8 0.0-7.9
60-69 44 0.0 0.0-0.0 5.7 0.0-16.9
15-69 197 0.7 0.0-2.2 3.4 0.1-6.6

Botswana Non-communicable Disease Risk Factor Surveillance - 2014 Page 47
0
20
40
60
80
100
Snuff bymouth
Snuff bynose
Chewingtobacco
Betel, quid Other
Per
cen
t
Type of Smokeless Tobacco
Female current smokeless tobacco users by typeN=197
Figure 18 Current females smokeless tobacco users
Percentage of current users of smokeless tobacco using each of the following products
Age Group (years)
Both Sexes
n % Snuff by
mouth 95% CI
% Snuff by nose
95% CI % Chewing
tobacco 95% CI
15-29 24 36.1 8.3-63.9 79.9 63.5-96.4 5.9 0.0-17.4
30-44 66 22.5 9.1-36.0 83.4 71.6-95.2 0.0 0.0-0.0
45-59 81 33.2 8.4-58.0 83.0 71.3-94.7 11.6 0.0-25.4
60-69 48 19.5 4.2-34.7 71.6 56.2-86.9 7.4 0.0-15.2
15-69 219 27.1 15.8-38.5 80.2 73.0-87.4 5.8 1.0-10.6
Table 57 Percentage of current users of smokeless tobacco by type – Both
Percentage of current users of smokeless tobacco using each of the following products
Age Group (years)
Both Sexes
n % Betel, quid 95% CI % Other 95% CI
15-29 24 3.6 0.0-10.7 1.7 0.0-5.1
30-44 66 0.0 0.0-0.0 4.7 0.0-11.8
45-59 81 0.0 0.0-0.0 3.2 0.0-6.7
60-69 48 0.0 0.0-0.0 8.9 0.0-21.4
15-69 219 0.6 0.0-1.8 4.7 0.0-9.6
Current tobacco users
Age Group (years)
Men Women Both Sexes
n %
Current users
95% CI n %
Current users
95% CI n %
Current users
95% CI
15-29 561 25.3 20.9-29.7 1003 5.4 3.2-7.6 1564 15.8 13.1-18.5
30-44 418 40.7 32.7-48.7 930 9.3 6.3-12.3 1348 25.3 20.3-30.3
45-59 248 38.3 29.5-47.1 585 16.7 11.8-21.6 833 26.6 21.3-32.0
60-69 89 31.8 17.5-46.0 232 29.9 18.6-41.2 321 30.7 21.7-39.8
15-69 1316 31.8 27.9-35.7 2750 9.7 7.6-11.9 4066 20.9 18.4-23.4
Table 58 current tobacco users - Both

Botswana Non-communicable Disease Risk Factor Surveillance - 2014 Page 48
Daily tobacco users
Age Group (years)
Men Women Both Sexes
n % Daily users
95% CI n % Daily users
95% CI n % Daily users
95% CI
15-29 561 18.9 15.0-22.9 1003 3.2 1.7-4.7 1564 11.5 9.1-13.8
30-44 418 33.7 25.2-42.1 930 6.9 4.3-9.5 1348 20.5 15.6-25.5
45-59 248 34.9 26.1-43.8 585 14.8 10.2-19.5 833 24.1 18.8-29.3
60-69 89 24.5 12.1-37.0 232 25.2 13.8-36.6 321 24.9 16.3-33.5
15-69 1316 25.6 22.0-29.2 2750 7.4 5.7-9.1 4066 16.6 14.4-18.9
0
5
10
15
20
25
30
35
15-29 30-44 45-59 60-69
PE
RC
EN
T
AGE GROUP
Current & Daily Tobacco Users by age group among survey participants
N=4066
Currenttobaccousers
Daily tobacco
users
Figure 19Current & Daily tobacco users
Exposed to second-hand smoke in home during the past 30 days
Age Group (years)
Men Women Both Sexes
n % Exposed 95% CI n % Exposed 95% CI n % Exposed 95% CI
15-29 560 49.6 43.8-55.4 1003 42.5 37.5-47.6 1563 46.2 42.0-50.5
30-44 418 49.6 41.1-58.0 930 37.1 32.1-42.2 1348 43.5 38.0-48.9
45-59 248 37.4 29.7-45.2 585 35.0 29.6-40.3 833 36.1 31.2-41.1
60-69 89 42.2 28.3-56.2 232 37.6 26.1-49.0 321 39.7 30.5-48.9
15-69 1315 47.6 43.0-52.3 2750 39.5 35.9-43.1 4065 43.6 40.3-46.9
Table 59Exposure to 2nd hand smoke in home - Both
Exposed to second-hand smoke in the workplace during the past 30 days
Age Group (years)
Men Women Both Sexes
n %
Exposed 95% CI n
% Exposed
95% CI n %
Exposed 95% CI
15-29 495 33.0 26.3-39.7 878 25.4 20.9-29.9 1373 29.5 24.8-34.1
30-44 374 32.2 23.0-41.4 809 28.6 23.1-34.0 1183 30.5 24.7-36.2
45-59 215 28.5 20.4-36.5 514 19.1 13.6-24.6 729 23.3 19.0-27.7
60-69 72 18.4 7.7-29.2 199 15.1 7.5-22.7 271 16.6 10.0-23.3
15-69 1156 31.6 26.2-36.9 2400 24.8 21.4-28.1 3556 28.3 24.6-31.9
Table 60Exposure to 2nd hand smoke in workplace– Both

Botswana Non-communicable Disease Risk Factor Surveillance - 2014 Page 49
Men are more exposed to second-hand smoke than females at home – (47.6% versus 39.5% respectively). In the same way the exposure at workplace is higher in males to females. Out of 4065 male and female participants 43.6% were exposed to 2nd hand smoke at home, while 28.3% of 3556 were exposed at workplace
0
5
10
15
20
25
30
35
40
45
50
Males Females
Pe
rce
nt
Exposure to second-hand smoke during the past 1month
STEPS Survey 2014
Home
Workplace
Figure 20Exposure to 2nd hand smoke 30 days
Main reason for tobacco use among current tobacco users
(Both smoking and smokeless)
Age range
Among current tobacco users Males
n Unable
to stop / habit
Sign of prestige
Relieves stress,
relaxation
Seen from parents,
neighbours, friends
Peer pressure
Recreational, gives pleasure
To socialize
Other reasons
15-29 158 11.2 0.9 24.0 6.6 24.2 19.4 8.4 5.2
30-44 147 12.8 0.8 22.4 2.0 26.6 16.0 6.7 12.7
45-59 88 14.7 ---- 22.4 1.4 28.4 19.6 0.2 13.2
60-69 28 27.9 ---- 30.8 ---- 9.0 6.6 2.6 23.1
15-69 421 13.1 0.7 23.5 3.8 25.1 17.6 6.2 10.1 Table 61 Reason for smoking and smokeless-Males

Botswana Non-communicable Disease Risk Factor Surveillance - 2014 Page 50
Age range
Among current tobacco users Females
n Unable
to stop / habit
Sign of prestige
Relieves stress,
relaxation
Seen from parents,
neighbours, friends
Peer pressure
Recreational, gives pleasure
To socialize
Other reasons
15-29 45 5.0 ---- 23.6 1.8 33.0 18.4 2.3 16.1
30-44 79 5.6 1.2 34.3 15.8 11.2 19.7 2.7 9.5
45-59 92 6.8 ---- 39.3 1.6 5.4 21.1 4.5 21.4
60-69 51 13.8 ---- 47.6 3.6 3.0 7.3 6.8 18.0
15-69 267 7.2 0.3 35.0 5.9 14.2 17.5 3.8 16.1 Table 62Reason for smoking & smokeless- Females
Age range
Among current tobacco users Both
n Unable
to stop / habit
Sign of prestige
Relieves stress,
relaxation
Seen from parents,
neighbours, friends
Peer pressure
Recreational, gives
pleasure
To socialize
Other reasons
15-29 203 10.2 0.8 23.9 5.8 25.7 19.2 7.4 7.0
30-44 226 11.5 0.9 24.6 4.5 23.8 16.7 5.9 12.1
45-59 180 12.0 ---- 28.1 1.5 20.6 20.1 1.6 16.0
60-69 79 20.4 ---- 39.8 1.9 5.8 7.0 4.8 20.4
15-69 688 11.8 0.6 26.1 4.3 22.6 17.6 5.6 11.5 Table 63Reason for smoking & smokeless - Both
0.0
5.0
10.0
15.0
20.0
25.0
30.0
35.0
40.0
Unable tostop / habit
Sign ofprestige
Relievesstress,
relaxation
Seen fromparents,
neighbours,friends
Peerpressure Recreational,
givespleasure
To socialize Otherreasons
Pe
rce
nt
Main reason for tobacco use among current tobacco users(both smoking & non- smokeless)
M=421, F=267 Males
Females
Figure 21Reasons for current tobacco use

Botswana Non-communicable Disease Risk Factor Surveillance - 2014 Page 51
Main reason for tobacco use among daily tobacco users (both smoking and smokeless)
Age range
Among daily tobacco users Males
n Unable
to stop / habit
Sign of prestige
Relieves stress,
relaxation
Seen from parents,
neighbours, friends
Peer pressure
Recreational, gives
pleasure
To socialize
Other reasons
15-29 115 13.3 0.5 18.4 6.2 27.9 18.1 9.5 6.1
30-44 115 14.2 1.0 21.3 2.5 28.9 12.6 6.2 13.5
45-59 76 12.8 ---- 20.8 1.0 30.1 20.5 0.2 14.4
60-69 23 33.1 ---- 17.2 ---- 11.6 8.6 3.3 26.1
15-69 329 14.4 0.6 19.9 3.5 28.0 16.0 6.3 11.3 Table 64Reasons of tobacco daily users - Males
Main reason for tobacco use among daily tobacco users (both smoking and smokeless)
Age range
Among daily tobacco users Females
n
Unable to stop /
habit
Sign of prestige
Relieves stress,
relaxation
Seen from parents,
neighbours, friends
Peer pressure
Recreational, gives
pleasure
To socialize
Other reasons
15-29 31 8.3 ---- 8.1 3.0 37.0 24.6 2.0 16.9
30-44 61 7.6 1.7 28.5 21.3 13.4 13.6 3.2 10.7
45-59 77 7.6 ---- 37.2 1.8 5.0 23.8 2.8 21.9
60-69 44 16.4 ---- 49.4 2.9 3.5 8.6 8.1 11.2
15-69 213 9.5 0.4 30.9 7.5 13.9 18.3 3.8 15.7 Table 65Reasons of tobacco daily users - Females
Main reason for tobacco use among daily tobacco users
(both smoking and smokeless)
Age range
Among daily tobacco users Both
n
Unable to stop /
habit
Sign of prestige
Relieves stress,
relaxation
Seen from parents,
neighbours, friends
Peer pressure
Recreational, gives
pleasure
To socialize
Other reasons
15-29 146 12.7 0.4 17.0 5.7 29.2 19.0 8.5 7.5
30-44 176 13.1 1.1 22.5 5.6 26.3 12.7 5.7 13.0
45-59 153 11.1 ---- 26.2 1.3 21.8 21.6 1.1 16.9
60-69 67 23.9 ---- 35.0 1.6 7.2 8.6 5.9 17.9
15-69 542 13.3 0.5 22.3 4.4 24.9 16.5 5.7 12.3 Table 66 Reasons of tobacco daily users – Both

Botswana Non-communicable Disease Risk Factor Surveillance - 2014 Page 52
0.0
5.0
10.0
15.0
20.0
25.0
30.0
35.0
1) Unable tostop / habit
2) Sign ofprestige
3) Relievesstress,
relaxation
4) Seen fromparents,
neighbours,friends
5) Peerpressure
6)Recreational,
givespleasure
8) Tosocialize
9) Otherreasons
Per
cen
t
Main reason for tobacco use among daily users
(both smoking & non- smokeless)M=329, F=213
Males
Females
Figure 22 Reasons for daily tobacco use
Alcohol Consumption
Alcohol consumption status
Age Group (years)
Men
n
% Current drinker (past 30
days)
95% CI
% Drank in past 12
months, not current
95% CI % Past 12 months
abstainer 95% CI
% Lifetime
abstainer 95% CI
15-29 560 36.4 31.1-41.7 10.7 6.9-14.5 7.1 4.7-9.6 45.7 40.0-51.5
30-44 418 48.8 40.4-57.2 6.6 3.2-9.9 9.5 5.4-13.7 35.1 27.9-42.3
45-59 248 36.4 28.3-44.6 7.8 3.8-11.7 19.7 13.4-26.1 36.1 28.6-43.5
60-69 89 27.1 14.2-40.0 5.6 1.0-10.2 31.9 16.9-46.9 35.4 21.3-49.6
15-69 1315 39.6 35.5-43.7 8.9 6.6-11.1 10.7 8.4-12.9 40.9 37.0-44.8
Table 67Alcohol consumption status – males
Alcohol consumption status
Age Group (years)
Women
n
% Current drinker (past 30
days)
95% CI
% Drank in past 12 months,
not current
95% CI % Past 12 months
abstainer 95% CI
% Lifetime abstainer
95% CI
15-29 1003 12.4 9.8-15.0 10.6 7.7-13.5 12.5 9.6-15.4 64.5 60.2-68.8
30-44 930 13.8 10.6-17.0 5.4 3.6-7.3 17.1 13.5-20.7 63.6 58.8-68.5
45-59 585 13.2 8.2-18.1 2.3 0.6-4.0 12.3 8.6-16.0 72.3 66.9-77.7
60-69 232 11.5 4.5-18.5 4.7 1.8-7.7 5.7 2.3-9.0 78.1 70.3-85.9
15-69 2750 12.9 10.8-15.0 7.5 5.9-9.0 13.4 11.4-15.4 66.3 63.2-69.3
Table 68 Alcohol consumption status – Females

Botswana Non-communicable Disease Risk Factor Surveillance - 2014 Page 53
Alcohol consumption status
Age Group (years)
Both Sexes
n
% Current drinker (past 30
days)
95% CI
% Drank in past 12 months,
not current
95% CI
% Past 12
months abstainer
95% CI % Lifetime abstainer
95% CI
15-29 1563 25.0 21.9-28.1 10.6 8.2-13.1 9.7 7.6-11.8 54.7 50.8-58.5
30-44 1348 31.6 26.7-36.6 6.0 3.8-8.2 13.3 10.5-16.0 49.1 44.3-53.9
45-59 833 23.9 18.9-28.8 4.8 2.9-6.8 15.7 12.0-19.4 55.6 50.7-60.5
60-69 321 18.6 11.8-25.4 5.1 2.4-7.8 17.6 9.6-25.6 58.7 49.6-67.7
15-69 4065 26.4 24.0-28.8 8.2 6.8-9.6 12.0 10.3-13.7 53.4 50.8-56.0
Table 69Alcohol consumption status - Both
Figure 23Alcohol consumption status
Stopping drinking due to health reasons
Age Group (years)
Men Women Both Sexes
n
% stopping due to health
reasons
95% CI n
% stopping due to health
reasons
95% CI n
% stopping due to health
reasons
95% CI
15-29 43 12.7 1.0-24.5 116 22.0 13.0-31.0 159 18.5 10.9-26.1
30-44 36 12.1 0.0-24.5 134 19.3 10.0-28.5 170 16.6 9.4-23.9
45-59 45 25.0 10.9-39.1 77 24.6 14.4-34.8 122 24.8 15.7-33.9
60-69 21 23.9 0.0-52.1 20 11.3 0.0-22.8 41 21.7 0.0-44.9
15-69 145 17.1 9.4-24.8 347 21.1 15.5-26.7 492 19.3 14.5-24.2
Table 70stopped drinking due to health reasons
17.1% of 145 male drinkers and 21.1% of 347 female drinkers had stopped due to health reasons.
0
10
20
30
40
50
60
70
Current drinker(past 30 days)
Drank in past 12months, not
current
Past 12 monthsabstainer
Lifetime abstainer
Pe
rce
nt
Alcohol Consumption Status of Survey ParticipantsN=4065
Males
Females

Botswana Non-communicable Disease Risk Factor Surveillance - 2014 Page 54
Frequency of alcohol consumption in the past 12 months
Age Group (years)
Men
n %
Daily 95% CI
% 5-6 days/ week
95% CI % 3-4 days/ week
95% CI % 1-2 days/ week
95% CI % 1-3 days/ month
95% CI %<
once a month
95% CI
15-29 259 4.8 2.0-7.6 4.9 1.5-8.2 8.4 4.0-12.8 28.5 21.2-35.7 22.0 15.0-28.9 31.5 24.3-38.7
30-44 209 17.3 4.2-30.4 5.7 1.5-9.9 11.1 3.2-19.0 29.7 20.0-39.3 18.3 11.0-25.6 17.9 9.8-26.0
45-59 107 16.8 6.4-27.1 4.8 0.5-9.0 8.9 0.4-17.5 34.2 18.9-49.5 19.1 9.7-28.6 16.2 8.0-24.4
60-69 33 24.0 4.1-44.0 1.7 0.0-5.1 16.9 1.4-32.4 23.1 8.0-38.2 8.3 0.0-18.0 25.9 9.6-42.2
15-69 608 11.0 6.1-16.0 5.0 2.7-7.4 9.6 5.9-13.3 29.4 23.9-34.9 20.0 15.5-24.5 25.0 19.8-30.1
Table 71Freq. of alcohol consumption – Males
Frequency of alcohol consumption in the past 12 months
Age Group (years)
Women
n %
Daily 95% CI
%5-6 days/ week
95% CI %3-4 days/ week
95% CI %1-2 days/ week
95% CI %1-3 days/ month
95% CI %<
once a month
95% CI
15-29 216 4.2 0.9-7.4 1.6 0.0-3.4 3.2 0.7-5.6 23.3 14.6-32.0 22.7 14.4-31.1 45.0 35.9-54.2
30-44 168 6.8 0.4-13.3 4.3 0.1-8.5 4.6 0.0-10.7 20.3 11.5-29.1 25.1 17.0-33.1 38.9 28.6-49.1
45-59 61 30.6 4.6-56.6 6.0 0.0-14.0 8.1 1.3-15.0 21.2 1.4-41.0 17.3 5.2-29.4 16.9 3.6-30.2
60-69 32 46.6 22.8-70.3 4.6 0.0-13.5 1.6 0.0-3.9 12.5 0.0-25.1 12.0 0.0-24.7 22.8 6.4-39.1
15-69 477 10.1 5.0-15.3 3.1 1.3-4.8 4.1 1.8-6.4 21.7 16.2-27.2 22.2 16.5-27.9 38.8 32.0-45.5
Table 72Freq. of alcohol consumption – Females
Frequency of alcohol consumption in the past 12 months
Age Group (years)
Both Sexes
n %
Daily 95% CI % cy 95% CI
% 3-4 days/ week
95% CI % 1-2 days/ week
95% CI % 1-3 days/ month
95% CI %
< once a month
95% CI
15-29 475 4.6 2.5-6.7 3.9 1.4-6.4 6.8 3.4-10.2 26.9 21.0-32.9 22.2 16.5-27.9 35.5 29.4-41.7
30-44 377 14.6 4.6-24.7 5.3 2.1-8.6 9.4 3.4-15.5 27.3 19.8-34.7 20.0 14.1-26.0 23.3 16.7-29.9
45-59 168 20.8 7.4-34.1 5.1 1.5-8.8 8.7 2.1-15.2 30.4 17.7-43.2 18.6 11.2-25.9 16.4 9.6-23.2
60-69 65 32.3 17.0-47.7 2.8 0.0-6.7 11.3 1.4-21.2 19.2 8.8-29.6 9.7 2.0-17.4 24.7 12.7-36.7
15-69 1085 10.8 6.8-14.8 4.5 2.7-6.2 8.0 5.3-10.8 27.2 22.8-31.6 20.6 16.8-24.5 28.9 24.5-33.3
Table 73Frequency of alcohol consumption – Both
0
5
10
15
20
25
30
35
Per
cen
t
Frequency of Alcohol Consuption
Frequency of Alcohol Consumption in the past 1 year by Survey Participants
N=1085
Figure 24Frequency of alcohol consumption

Botswana Non-communicable Disease Risk Factor Surveillance - 2014 Page 55
Mean number of drinking occasions in the past 30 days among current (past 30 days) drinkers
Age Group (years)
Men Women Both Sexes
n Mean 95% CI n Mean 95% CI n Mean 95% CI
15-29 193 4.8 3.7-5.9 125 4.0 3.1-4.9 318 4.6 3.7-5.5
30-44 170 5.1 4.0-6.2 110 3.4 2.4-4.4 280 4.7 3.9-5.6
45-59 76 6.0 3.9-8.0 44 6.7 1.9-11.5 120 6.2 4.2-8.2
60-69 22 6.2 2.7-9.7 17 12.3 3.0-21.5 39 8.2 3.9-12.6
15-69 461 5.1 4.4-5.8 296 4.6 3.0-6.1 757 5.0 4.3-5.6
Table 74Mean number of drinking past 1 mon. - Both
Mean number of standard drinks per drinking occasion among current (past 30 days) drinkers
Age Group (years)
Men Women Both Sexes
n Mean 95% CI n Mean 95% CI n Mean 95% CI
15-29 184 8.2 6.7-9.8 119 6.4 5.3-7.5 303 7.8 6.6-9.0
30-44 174 8.7 7.0-10.4 104 7.3 4.4-10.2 278 8.4 7.0-9.8
45-59 76 6.3 4.5-8.1 44 4.5 3.5-5.4 120 5.8 4.5-7.0
60-69 23 4.3 3.6-5.1 18 4.1 2.8-5.4 41 4.3 3.6-4.9
15-69 457 8.1 7.0-9.1 285 6.3 5.1-7.4 742 7.6 6.8-8.5
Table 75Mean standard drinks past 1 month – both
Drinking at high-end level among all respondents (≥60g of pure alcohol on average per occasion among men and
≥40g of pure alcohol on average per occasion among women)
Age Group (years)
Men Women Both Sexes
n % ≥60g 95% CI n % ≥40g 95% CI n % high-
end level 95% CI
15-29 539 1.9 0.6-3.1 990 0.4 0.0-0.9 1529 1.2 0.5-1.8
30-44 393 3.4 1.2-5.6 917 0.5 0.0-1.0 1310 1.9 0.9-3.0
45-59 234 2.5 0.4-4.6 577 0.4 0.0-0.8 811 1.3 0.4-2.3
60-69 84 0.0 0.0-0.0 226 2.6 0.0-6.7 310 1.5 0.0-3.8
15-69 1250 2.3 1.4-3.2 2710 0.6 0.2-0.9 3960 1.4 0.9-1.9
Table 76Drinking at high level – Both
Drinking at intermediate level among all respondents (40-59.9g of pure alcohol on average per occasion
among men and 20-39.9g of pure alcohol on average per occasion among women)
Age Group (years)
Men Women Both Sexes
n % 40-59.9g
95% CI n % 20-39.9g
95% CI n %
intermediate level
95% CI
15-29 539 0.5 0.0-1.0 990 1.1 0.2-2.0 1529 0.8 0.3-1.3
30-44 393 4.4 0.4-8.4 917 1.5 0.0-3.1 1310 3.0 0.8-5.1
45-59 234 1.9 0.0-5.5 577 1.2 0.0-3.5 811 1.5 0.0-3.5
60-69 84 1.6 0.0-4.8 226 0.8 0.0-2.0 310 1.2 0.0-2.7
15-69 1250 1.9 0.6-3.2 2710 1.2 0.5-1.9 3960 1.5 0.8-2.3
Table 77Drinking at intermediate level - Both

Botswana Non-communicable Disease Risk Factor Surveillance - 2014 Page 56
Drinking at lower-end level among all respondents (<40g of pure alcohol on average per occasion among men and <20g of pure alcohol on average per occasion among women)
Age Group (years)
Men Women Both Sexes
n % <40g 95% CI n % <20g 95% CI n % lower-end level
95% CI
15-29 539 31.7 26.5-37.0 990 9.8 7.4-12.1 1529 21.1 18.2-24.1
30-44 393 37.9 29.1-46.6 917 10.4 7.8-13.1 1310 24.1 19.2-29.0
45-59 234 29.1 20.6-37.6 577 10.6 5.8-15.4 811 19.0 13.9-24.1
60-69 84 19.1 10.0-28.2 226 4.8 1.6-8.0 310 11.1 6.9-15.4
15-69 1250 32.6 28.6-36.5 2710 9.8 8.1-11.5 3960 21.2 18.9-23.4
Table 78Drinking at lower level – Both
High-end, intermediate, and lower-end level drinking among current (past 30 days) drinkers
Age Group (years)
Men
n %
high-end (≥60g)
95% CI %
intermediate (40-59.9g)
95% CI %
lower-end (<40g)
95% CI
15-29 181 5.5 2.0-9.0 1.5 0.0-3.1 93.1 89.2-96.9
30-44 166 7.4 2.6-12.3 9.7 1.0-18.3 82.9 73.2-92.6
45-59 72 7.4 0.9-13.9 5.6 0.0-16.3 87.0 75.0-98.9
60-69 22 0.0 0.0-0.0 7.9 0.0-21.3 92.1 78.7-100.0
15-69 441 6.3 3.8-8.7 5.1 1.6-8.5 88.7 84.5-92.8
Table 79Combined level in the past 1 month – males
High-end, intermediate, and lower-end level drinking among current (past 30 days) drinkers
Age Group (years)
Women
n %
high-end (≥40g)
95% CI %
intermediate (20-39.9g)
95% CI %
lower-end (<20g)
95% CI
15-29 117 3.6 0.0-7.6 9.7 2.4-17.1 86.7 78.7-94.7
30-44 103 3.9 0.0-8.0 12.0 0.0-24.3 84.0 71.6-96.5
45-59 43 3.2 0.0-6.8 9.8 0.0-27.9 87.0 68.8-100.0
60-69 16 31.9 0.0-64.3 9.5 0.0-25.0 58.6 29.4-87.8
15-69 279 4.8 2.0-7.5 10.4 5.1-15.8 84.8 78.6-91.0
Table 80 Combined level in the past 1 month – Females
High-end, intermediate, and lower-end level drinking among current (past 30 days) drinkers

Botswana Non-communicable Disease Risk Factor Surveillance - 2014 Page 57
Age Group (years)
Both sexes
n %
high-end 95% CI
% intermediate
95% CI %
lower-end 95% CI
15-29 298 5.0 2.2-7.8 3.4 1.3-5.5 91.6 88.2-95.0
30-44 269 6.7 2.9-10.5 10.2 2.9-17.4 83.1 75.2-91.1
45-59 115 6.1 1.5-10.7 6.9 0.0-16.1 87.0 77.1-96.9
60-69 38 10.7 0.0-25.8 8.4 0.0-18.6 80.9 65.2-96.7
15-69 720 5.9 3.9-7.9 6.4 3.4-9.3 87.7 84.3-91.2
Table 81Combined level in the past 1 month – Both
6.3 5.1
88.7
4.810.4
84.8
0
10
20
30
40
50
60
70
80
90
100
High-end (≥60g)
Intermediate(40-59.9g)
Lower-end(<40g)
Per
cen
t
Level of Alcohol
Level of Drinking Among Current Drinkers
(past 30 days) N=450
Males
Females
Figure 25 Level of drinking
Mean maximum number of standard drinks consumed on one occasion in the past 30 days
Age Group (years)
Men Women Both Sexes
n Mean
maximum number
95% CI n Mean
maximum number
95% CI n Mean
maximum number
95% CI
15-29 180 12.3 9.0-15.5 122 9.0 7.4-10.5 302 11.5 9.0-14.0
30-44 172 15.3 8.5-22.1 103 9.9 5.6-14.3 275 14.1 8.6-19.6
45-59 75 7.6 5.5-9.7 44 5.4 4.2-6.6 119 6.9 5.5-8.4
60-69 23 6.0 4.3-7.6 18 5.6 3.9-7.3 41 5.8 4.6-7.0
15-69 450 12.6 9.7-15.5 287 8.5 6.9-10.2 737 11.6 9.3-13.9
Table 82 Mean maximum standard drinks – Both
Six or more drinks on a single occasion at least once during the past 30 days among total population

Botswana Non-communicable Disease Risk Factor Surveillance - 2014 Page 58
Age Group (years)
Men Women Both Sexes
n % ≥ 6 drinks
95% CI n % ≥ 6 drinks
95% CI n % ≥ 6 drinks
95% CI
15-29 560 26.5 21.5-31.5 1003 8.4 6.0-10.7 1563 17.9 15.0-20.7
30-44 418 37.0 29.2-44.9 930 10.0 7.0-12.9 1348 23.8 19.1-28.4
45-59 248 21.8 14.9-28.6 585 7.4 3.1-11.7 833 14.0 9.6-18.4
60-69 89 12.9 5.3-20.5 232 4.8 1.6-8.0 321 8.5 4.7-12.3
15-69 1315 28.3 24.4-32.2 2750 8.5 6.6-10.3 4065 18.5 16.3-20.7
Table 83 Six or more drinks – Both
0
5
10
15
20
25
30
Males Females
Pe
rce
nt
≥ 6 Alcoholic drinks taken on a single occasion at least 1x in past 30 Days
N=1315
Figure 26 Consumption greater than 6 alcohol
The above figure shows that males drink 3 times more than the females of ≥ 6 Alcoholic drinks. Out of those who drink greater or equal to 6 drinks in 30 days it was observed that males had taken 4 times and females 2 times in a single occasion in the past 30 days (N=452).
Mean number of times with six or more drinks during a single occasion in the past 30 days among current drinkers
Age Group (years)
Men Women Both Sexes
n Mean
number of times
95% CI n Mean
number of times
95% CI n Mean
number of times
95% CI
15-29 183 2.8 1.8-3.8 119 2.3 1.6-2.9 302 2.7 1.9-3.5
30-44 173 6.1 2.3-9.9 108 2.1 1.4-2.7 281 5.2 2.1-8.2
45-59 74 3.0 2.1-4.0 42 2.4 1.0-3.9 116 2.8 1.9-3.7
60-69 22 3.0 1.2-4.8 18 3.8 0.6-7.0 40 3.3 1.7-4.9
15-69 452 4.0 2.5-5.6 287 2.3 1.8-2.8 739 3.6 2.4-4.8
Table 84Mean number of times 6 drinks

Botswana Non-communicable Disease Risk Factor Surveillance - 2014 Page 59
Frequency of alcohol consumption in the past 7 days
Age Group (years)
Men
n % Daily 95% CI % 5-6 days
95% CI % 3-4 days
95% CI % 1-2 days
95% CI % 0 days
95% CI
15-29 197 3.7 0.0-7.5 2.1 0.0-4.5 22.3 13.5-31.2 38.9 29.3-48.4 33.0 22.6-43.4
30-44 189 5.8 1.5-10.2 2.9 0.8-5.1 25.9 11.3-40.4 41.8 30.3-53.4 23.5 12.9-34.2
45-59 80 13.4 4.5-22.3 8.0 0.0-18.0 12.9 1.9-23.9 47.9 31.2-64.6 17.8 5.3-30.2
60-69 24 25.6 2.5-48.6 0.8 0.0-2.5 12.0 0.4-23.6 49.1 26.3-72.0 12.5 0.8-24.2
15-69 490 6.2 3.5-9.0 3.1 1.3-4.9 22.2 15.5-28.9 41.3 34.9-47.7 27.2 19.9-34.4
Table 85 Freq. of alcohol consumption 1 wk. - males
Frequency of alcohol consumption in the past 7 days
Age Group (years)
Women
n % Daily 95% CI % 5-6 days
95% CI % 3-4 days
95% CI % 1-2 days 95% CI % 0 days
95% CI
15-29 128 5.8 0.4-11.2 1.1 0.0-2.7 6.9 2.1-11.7 55.4 43.6-67.1 30.9 20.4-41.4
30-44 113 7.0 0.0-15.4 1.7 0.0-3.8 12.6 1.8-23.3 45.4 32.8-58.1 33.3 20.6-46.1
45-59 47 23.5 3.7-43.4 12.5 0.0-34.8 8.3 1.0-15.5 43.9 20.2-67.6 11.9 0.0-24.6
60-69 21 39.6 3.3-76.0 0.0 0.0-0.0 26.0 0.5-51.5 21.9 0.0-44.3 12.4 0.0-27.3
15-69 309 10.6 4.6-16.5 3.0 0.0-7.0 9.8 5.5-14.1 48.9 41.8-55.9 27.7 20.4-35.1
Table 86 Freq. of alcohol consumption 1 wk. – females
Frequency of alcohol consumption in the past 7 days
Age Group (years)
Both Sexes
n % Daily 95% CI % 5-6 days 95% CI % 3-4 days 95% CI % 1-2 days 95% CI % 0 days
95% CI
15-29 325 4.2 1.0-7.3 1.9 0.1-3.7 18.7 11.9-25.5 42.8 34.8-50.7 32.5 24.0-40.9
30-44 302 6.1 2.2-10.0 2.7 0.9-4.4 23.0 11.3-34.8 42.6 33.1-52.1 25.6 16.9-34.3
45-59 127 16.4 6.1-26.7 9.3 0.0-18.6 11.5 3.2-19.8 46.7 32.1-61.3 16.0 7.5-24.6
60-69 45 30.5 9.9-51.1 0.5 0.0-1.6 16.9 5.2-28.6 39.6 21.4-57.8 12.5 3.2-21.7
15-69 799 7.3 4.5-10.0 3.1 1.4-4.7 19.2 13.9-24.6 43.1 38.2-48.1 27.3 21.6-33.0
Table 87 Freq. of alcohol consumption 1 wk. – Both

Botswana Non-communicable Disease Risk Factor Surveillance - 2014 Page 60
Figure 27 Alcohol in the past 7 days
Mean number of standard drinks consumed on average per day in the past 7 days among current drinkers
Age Group (years)
Men Women Both Sexes
n Mean
number 95% CI n
Mean number
95% CI n Mean
number 95% CI
15-29 197 1.6 1.2-2.1 128 1.3 0.9-1.8 325 1.6 1.2-1.9
30-44 189 1.8 1.3-2.3 113 1.5 0.7-2.3 302 1.7 1.4-2.1
45-59 80 1.6 1.1-2.1 47 1.2 0.8-1.6 127 1.5 1.1-1.9
60-69 24 1.6 0.8-2.4 21 2.1 0.8-3.4 45 1.8 1.1-2.5
15-69 490 1.7 1.4-2.0 309 1.4 1.1-1.7 799 1.6 1.4-1.9
Table 88Mean number of standard drinks 1wk – Both
Consumption of unrecorded alcohol
Age Group (years)
Men Women Both Sexes
n
% consuming unrecorded
alcohol
95% CI n
% consuming unrecorded
alcohol
95% CI n
% consuming unrecorded
alcohol
95% CI
15-29 196 12.4 5.4-19.5 129 13.6 6.0-21.2 325 12.7 7.1-18.4
30-44 189 23.0 7.9-38.2 113 20.5 7.5-33.6 302 22.5 10.3-34.7
45-59 81 29.7 15.8-43.6 50 37.0 14.8-59.2 131 31.9 19.9-43.9
60-69 27 33.1 11.6-54.6 20 76.3 63.1-89.5 47 46.8 31.1-62.5
15-69 493 19.1 11.8-26.3 312 22.5 16.1-28.8 805 19.9 14.1-25.7
Table 89Consumption of unrecorded alcohol - Both
The mean number of standard drinks consumed on average per day in the past 7 days among current drinkers was the same in males and female participants. Consumption of unrecorded alcohol is as well the same in the population.

Botswana Non-communicable Disease Risk Factor Surveillance - 2014 Page 61
Mean number of standard drinks of unrecorded alcohol consumed on average per day in the past 7 days among current drinkers
Age Group (years)
Men Women Both Sexes
n Mean
number 95% CI n
Mean number
95% CI n Mean
number 95% CI
15-29 15 1.4 0.8-2.1 18 0.9 0.5-1.2 33 1.2 0.7-1.8
30-44 18 0.8 0.4-1.2 15 1.0 0.8-1.1 33 0.8 0.5-1.1
45-59 15 0.8 0.3-1.2 16 1.0 0.6-1.3 31 0.8 0.5-1.2
60-69 6 0.8 0.5-1.1 9 0.8 0.2-1.3 15 0.8 0.5-1.1
15-69 54 1.0 0.7-1.3 58 0.9 0.8-1.1 112 1.0 0.7-1.2
Table 90Mean number of standard unrecorded - Both
Percentage of unrecorded alcohol from all alcohol consumed during past 7 days
Age Group (years)
Men Women Both Sexes
n % unrecorded
alcohol of all alcohol n
% unrecorded alcohol of all alcohol
n % unrecorded alcohol of all
alcohol
15-29 129 7.7 79 8.7 208 78.7
30-44 139 7.4 76 9.9 215 7.8
45-59 62 10.6 37 18.6 99 12.8
60-69 20 15.4 15 17.0 35 16.0
15-69 350 8.1 207 11.3 557 8.8
Table 91Percentage of unrecorded alcohol 1wk
Unrecorded alcohol consumption during the past 7 days by type
Age Group (years)
Men
n % home-
brewed spirits
% home-brewed beer/
wine
% brought over border
% surrogate
alcohol
% other
15-29 13 66.6 14.9 15.5 0.4 2.6
30-44 18 11.8 80.2 0 0 8.0
45-59 14 11.8 86.0 0 0 2.2
60-69 6 16.2 83.8 0 0 0
15-69 51 36.1 52.6 6.8 0.2 4.3
Table 92Unrecorded alcohol by type – males
Unrecorded alcohol consumption during the past 7 days by type
Age Group (years)
Women
n % home-
brewed spirits
% home-brewed beer/
wine
% brought over border
% surrogate
alcohol
% other
15-29 17 25.5 41.3 19.3 6.0 7.9
30-44 15 48.5 36.7 12.6 0 2.2
45-59 16 53.3 43.5 0 0 3.1
60-69 9 44.1 28.3 0 0 27.5
15-69 57 41.2 39.3 10.1 2.1 7.3
Table 93Unrecorded alcohol by type – Females

Botswana Non-communicable Disease Risk Factor Surveillance - 2014 Page 62
0 10 20 30 40 50 60
other
surrogate alcohol
brought over border
home-brewedbeer/wine
home-brewed spirits
Percent
Unrecorded Alcohol Consumption During the Past 7 days by Type
N=108
Females
Males
Figure 28Unrecorded alcohol in the past 7 days
Unrecorded alcohol consumption during the past 7 days by type
Age Group (years)
Both Sexes
n % home-
brewed spirits
% home-brewed beer/ wine
% brought
over border
% surro-gate
alcohol
% other
15-29 30 57.1 21.0 16.4 1.7 3.8
30-44 33 19.5 71.1 2.7 0 6.8
45-59 30 28.4 69.0 0 0 2.6
60-69 15 28.4 59.6 0 0 12.0
15-69 108 37.5 49.0 7.7 0.7 5.1
Table 94Unrecorded alcohol consumption – Both
Frequency of not being able to stop drinking once started during the past 12 months among past 12 month drinkers
Age Group (years)
Men
n % monthly
or more frequently
95% CI % less than
monthly 95% CI % never 95% CI
15-29 264 17.7 12.0-23.4 15.2 8.3-22.2 67.1 59.1-75.1
30-44 215 26.4 14.5-38.2 10.6 5.6-15.6 63.0 50.7-75.3
45-59 108 29.0 13.8-44.1 6.9 1.1-12.8 64.1 49.3-78.8
60-69 34 46.5 28.3-64.7 6.6 0.0-14.3 47.0 30.0-64.0
15-69 621 22.8 17.3-28.3 12.4 8.2-16.7 64.7 58.1-71.4
Table 95Not being able to stop – Males

Botswana Non-communicable Disease Risk Factor Surveillance - 2014 Page 63
Frequency of not being able to stop drinking once started during the past 12 months among past 12 month drinkers
Age Group (years)
Women
n % monthly
or more frequently
95% CI % less than
monthly 95% CI % never 95% CI
15-29 227 15.2 7.5-22.8 5.8 2.4-9.2 79.0 70.9-87.1
30-44 170 20.8 12.8-28.9 9.2 3.4-15.0 70.0 60.4-79.5
45-59 63 13.8 3.9-23.7 3.1 0.0-7.0 83.1 72.8-93.4
60-69 35 26.9 9.6-44.2 18.3 0.0-46.3 54.9 31.7-78.0
15-69 495 17.1 12.5-21.6 7.0 4.3-9.7 76.0 70.1-81.8
Table 96Being not able to stop – Females
0 20 40 60 80
monthly ormore
frequently
less thanmonthly
never
Percent
Unable to stop drinking once started during the past 12 months among drinkers in the past 12 months
N=1116
Females
Males
Figure 29Unable to stop drinking
Frequency of not being able to stop drinking once started during the past 12 months among past 12 month drinkers
Age Group (years)
Both Sexes
n % monthly
or more frequently
95% CI % less than
monthly 95% CI % never 95% CI
15-29 491 16.9 12.2-21.6 12.3 7.2-17.4 70.8 64.6-76.9
30-44 385 25.0 15.7-34.3 10.3 6.3-14.2 64.8 55.1-74.4
45-59 171 24.6 12.5-36.6 5.8 1.5-10.1 69.6 57.9-81.3
60-69 69 39.1 24.8-53.4 10.9 0.0-23.2 49.9 36.2-63.6
15-69 1116 21.2 16.9-25.4 10.8 7.6-14.1 68.0 62.9-73.1
Table 97 Being not able to stop – Both

Botswana Non-communicable Disease Risk Factor Surveillance - 2014 Page 64
Frequency of failing to do what was normally expected from you during the past 12 months among past 12 month drinkers
Age Group (years)
Men
n % monthly
or more frequently
95% CI % less than
monthly 95% CI % never 95% CI
15-29 264 13.9 8.6-19.2 9.0 4.9-13.1 77.1 70.7-83.4
30-44 215 20.6 8.7-32.4 11.0 5.7-16.2 68.5 57.0-79.9
45-59 108 19.8 3.7-35.8 4.4 0.5-8.3 75.8 60.1-91.5
60-69 34 19.2 2.7-35.7 1.7 0.0-5.0 79.1 62.4-95.8
15-69 621 17.0 11.8-22.2 8.9 6.0-11.8 74.1 68.8-79.5
Table 98Failing to do what is expected – Males
Frequency of failing to do what was normally expected from you during the past 12 months among past 12 month drinkers
Age Group (years)
Women
n % monthly
or more frequently
95% CI % less than
monthly 95% CI % never 95% CI
15-29 227 14.5 6.8-22.2 7.3 3.9-10.6 78.3 69.9-86.6
30-44 170 13.5 5.3-21.8 6.6 2.6-10.6 79.9 70.8-89.0
45-59 63 8.9 1.4-16.5 3.6 0.0-7.8 87.5 78.6-96.4
60-69 35 13.3 0.0-26.9 4.4 0.0-12.9 82.4 67.2-97.5
15-69 495 13.5 8.8-18.2 6.5 4.2-8.8 80.0 75.0-85.0
Table 99 Failing to do what is expected – Females
Frequency of failing to do what was normally expected from you during the past 12 months among past 12 month drinkers
Age Group (years)
Both Sexes
n % monthly
or more frequently
95% CI % less than
monthly 95% CI % never 95% CI
15-29 491 14.1 9.7-18.5 8.5 5.4-11.5 77.4 72.4-82.5
30-44 385 18.8 9.6-28.1 9.9 5.8-13.9 71.3 62.3-80.4
45-59 171 16.6 5.1-28.2 4.2 1.1-7.2 79.2 68.0-90.4
60-69 69 17.0 5.5-28.5 2.7 0.0-6.5 80.3 68.5-92.1
15-69 1116 16.0 12.0-20.0 8.2 6.0-10.4 75.8 71.8-79.9
Table 100 Failing to do what is expected - Both
Frequency of needing a first drink in the morning to get going during the past 12 months among past 12 month
drinkers
Age Group (years)
Men
n % monthly
or more frequently
95% CI % less than
monthly 95% CI % never 95% CI
15-29 264 19.7 13.5-26.0 11.4 6.4-16.4 68.8 61.1-76.5
30-44 215 30.5 18.1-42.8 6.0 2.5-9.6 63.5 51.3-75.7
45-59 108 15.5 5.2-25.7 2.7 0.0-5.5 81.8 71.3-92.3
60-69 34 25.6 6.7-44.4 4.4 0.0-10.9 70.0 51.7-88.3
15-69 621 23.0 17.5-28.4 8.4 5.5-11.3 68.7 62.6-74.8
Table 101 Freq. of needing a first drink – Males

Botswana Non-communicable Disease Risk Factor Surveillance - 2014 Page 65
Frequency of needing a first drink in the morning to get going during the past 12 months among past 12 month drinkers
Age Group (years)
Women
n % monthly or
more frequently 95% CI
% less than monthly
95% CI % never 95% CI
15-29 227 14.6 6.6-22.6 8.0 3.8-12.2 77.3 69.0-85.6
30-44 170 8.6 3.6-13.6 3.6 0.0-7.5 87.8 81.6-93.9
45-59 63 19.3 2.7-35.8 16.0 0.0-33.4 64.7 46.0-83.4
60-69 35 8.1 0.0-17.2 3.3 0.0-9.7 88.6 77.4-99.8
15-69 495 13.3 8.4-18.2 7.6 4.4-10.8 79.1 72.8-85.5
Table 102 Freq. of needing a first drink – Females
Frequency of needing a first drink in the morning to get going during the past 12 months among past 12
month drinkers
Age Group (years)
Both Sexes
n % monthly or
more frequently 95% CI
% less than monthly
95% CI % never 95% CI
15-29 491 18.2 13.2-23.2 10.4 6.6-14.2 71.4 65.3-77.5
30-44 385 25.0 15.1-34.9 5.4 2.7-8.2 69.6 59.7-79.4
45-59 171 16.6 5.7-27.5 6.6 1.4-11.8 76.8 66.0-87.6
60-69 69 19.0 5.4-32.7 4.0 0.0-8.7 77.0 63.3-90.6
15-69 1116 20.1 15.9-24.4 8.1 5.9-10.4 71.7 66.9-76.5
Table 103 Freq. of needing a first drink – Both
0
10
20
30
40
50
60
70
80
90
monthly or morefrequently
less thanmonthly
never
Pe
rce
nt
Frequency of needing a first drink in the morning to get
going during the past 12 months among past 12 month drinkersN=1116
Males
Females
Figure 30Frequency of needing 1st drink

Botswana Non-communicable Disease Risk Factor Surveillance - 2014 Page 66
Frequency of family/partner problems due to someone else’s drinking during the past 12 months among all respondents
Age Group (years)
Men
n % monthly
or more frequently
95% CI % less than
monthly 95% CI % never 95% CI
15-29 560 1.8 0.8-2.8 13.1 9.1-17.1 85.1 81.0-89.2
30-44 418 5.3 0.9-9.6 13.7 6.2-21.1 81.0 72.8-89.3
45-59 248 3.8 0.9-6.7 5.2 2.1-8.3 91.0 86.7-95.3
60-69 89 1.4 0.0-3.2 7.3 0.5-14.1 91.3 84.3-98.4
15-69 1315 3.1 1.6-4.5 11.9 8.6-15.3 85.0 81.5-88.5
Table 104 Family problems – Males
Frequency of family/partner problems due to someone else’s drinking during the past 12 months among all respondents
Age Group (years)
Women
n % monthly
or more frequently
95% CI % less than
monthly 95% CI % never 95% CI
15-29 1003 3.5 2.0-4.9 10.0 7.0-13.0 86.5 83.3-89.7
30-44 930 4.1 2.2-6.0 7.5 5.0-9.9 88.5 85.5-91.4
45-59 585 3.9 1.0-6.7 7.7 4.7-10.7 88.5 83.7-93.3
60-69 232 3.2 0.7-5.6 7.7 3.5-11.8 89.2 84.3-94.0
15-69 2750 3.7 2.6-4.8 8.8 6.8-10.7 87.5 85.3-89.8
Table 105 Family problems - Females
The frequency of family/partner problems due to someone else’s drinking during the past 12 months of the STEPS survey among all respondents was the same in the male and female participants and about 13.8% of them had frequent or seldom problems encountered within a month’s time. The percentage of someone else drinking monthly or more frequently was 3.4%
Frequency of family/partner problems due to someone else’s drinking during the past 12 months among all respondents
Age Group (years)
Both Sexes
n % monthly or
more frequently 95% CI
% less than monthly
95% CI % never 95% CI
15-29 1563 2.6 1.7-3.5 11.6 9.0-14.3 85.8 83.1-88.5
30-44 1348 4.7 2.3-7.1 10.6 6.5-14.8 84.7 80.1-89.3
45-59 833 3.8 1.9-5.8 6.5 4.4-8.6 89.7 86.5-92.8
60-69 321 2.4 0.8-3.9 7.5 3.7-11.2 90.1 86.1-94.2
15-69 4065 3.4 2.4-4.4 10.4 8.4-12.4 86.3 84.0-88.5
Table 106 Family problems - Both
Fruit and Vegetable Consumption

Botswana Non-communicable Disease Risk Factor Surveillance - 2014 Page 67
Mean number of days fruit consumed in a typical week
Age Group (years)
Men Women Both Sexes
n Mean
number of days
95% CI n Mean
number of days
95% CI n Mean
number of days
95% CI
15-29 373 2.8 2.5-3.1 704 3.1 2.8-3.3 1077 2.9 2.7-3.1
30-44 283 3.0 2.6-3.3 600 3.5 3.2-3.9 883 3.2 3.0-3.5
45-59 159 3.1 2.6-3.6 354 3.1 2.8-3.5 513 3.1 2.8-3.4
60-69 52 2.9 2.1-3.7 134 3.5 2.8-4.1 186 3.2 2.7-3.7
15-69 867 2.9 2.7-3.1 1792 3.2 3.1-3.4 2659 3.1 2.9-3.2
Table 107 Mean days fruits consumed in a typical day
Mean number of servings of fruit on average per day
Age Group (years)
Men Women Both Sexes
n
Mean number
of servings
95% CI n
Mean number
of servings
95% CI n
Mean number
of servings
95% CI
15-29 370 0.7 0.6-0.8 702 0.8 0.7-0.9 1072 0.8 0.7-0.8
30-44 281 1.0 0.5-1.5 599 1.0 0.9-1.2 880 1.0 0.7-1.3
45-59 159 0.8 0.6-1.0 352 0.8 0.7-0.9 511 0.8 0.7-0.9
60-69 52 0.5 0.4-0.7 134 1.0 0.7-1.3 186 0.8 0.6-1.0
15-69 862 0.8 0.6-1.0 1787 0.9 0.8-1.0 2649 0.8 0.7-0.9
Table 108 Mean consumed on average fruits/d
Mean number of days vegetables consumed in a typical week
Age Group (years)
Men Women Both Sexes
n Mean
number of days
95% CI n Mean
number of days
95% CI n Mean
number of days
95% CI
15-29 464 3.8 3.5-4.2 883 4.2 3.9-4.4 1347 4.0 3.8-4.2
30-44 359 4.0 3.6-4.4 824 4.4 4.1-4.6 1183 4.2 3.9-4.4
45-59 212 3.7 3.3-4.1 511 4.1 3.6-4.5 723 3.9 3.6-4.2
60-69 75 4.0 3.3-4.7 201 4.4 3.9-4.8 276 4.2 3.8-4.6
15-69 1110 3.9 3.6-4.1 2419 4.2 4.0-4.4 3529 4.0 3.9-4.2
Table 109 Mean days vegetables consumed in a typical day
Mean number of servings of vegetables on average per day
Age Group (years)
Men Women Both Sexes
n
Mean number
of servings
95% CI n
Mean number
of servings
95% CI n
Mean number
of servings
95% CI
15-29 462 1.1 0.9-1.3 883 1.2 1.0-1.3 1345 1.1 1.0-1.3
30-44 356 1.3 0.8-1.7 823 1.2 1.0-1.3 1179 1.2 1.0-1.5
45-59 212 0.9 0.7-1.0 507 1.1 0.9-1.2 719 1.0 0.8-1.1
60-69 75 1.1 0.8-1.3 201 1.0 0.9-1.2 276 1.0 0.9-1.2
15-69 1105 1.1 0.9-1.3 2414 1.1 1.0-1.2 3519 1.1 1.0-1.2
Table 110 Mean servings of veg. on average

Botswana Non-communicable Disease Risk Factor Surveillance - 2014 Page 68
Mean number of servings of fruit and/or vegetables on average per day
Age Group (years)
Men Women Both Sexes
n
Mean number
of servings
95% CI n Mean
number of servings
95% CI n
Mean number
of servings
95% CI
15-29 496 1.5 1.3-1.8 919 1.7 1.5-1.9 1415 1.6 1.4-1.8
30-44 370 2.0 1.2-2.9 844 1.9 1.7-2.1 1214 2.0 1.5-2.4
45-59 217 1.4 1.2-1.7 522 1.6 1.4-1.8 739 1.5 1.3-1.7
60-69 78 1.4 1.0-1.7 205 1.7 1.4-2.0 283 1.5 1.3-1.8
15-69 1161 1.7 1.3-2.0 2490 1.7 1.6-1.9 3651 1.7 1.5-1.9
Table 111 Mean fruit/veg. servings on average
The mean number of servings of fruit and or vegetables on average per day was two times in both males and females
Number of servings of fruit and/or vegetables on average per day
Age Group (years)
Men
n % no fruit
and/or vegetables
95% CI % 1-2
servings 95% CI
% 3-4 servings
95% CI % ≥5
servings 95% CI
15-29 496 47.9 41.4-54.3 39.2 33.2-45.3 8.4 5.3-11.5 4.5 2.1-6.9
30-44 370 37.0 27.4-46.6 46.2 37.3-55.1 12.6 7.4-17.9 4.2 1.3-7.0
45-59 217 51.7 42.3-61.1 35.5 26.7-44.3 8.2 3.9-12.5 4.6 1.2-8.0
60-69 78 40.2 26.9-53.5 45.4 30.4-60.3 14.0 1.1-27.0 0.4 0.0-1.1
15-69 1161 44.9 40.0-49.8 41.0 36.9-45.2 9.8 7.3-12.4 4.2 2.4-6.1
Table 112 Number of servings fruits/veg. on average - males
Number of servings of fruit and/or vegetables on average per day
Age Group (years)
Women
n % no fruit
and/or vegetables
95% CI % 1-2
servings 95% CI
% 3-4 servings
95% CI % ≥5
servings 95% CI
15-29 919 35.4 30.5-40.4 48.9 44.5-53.3 9.9 7.4-12.5 5.7 3.7-7.8
30-44 844 35.1 30.1-40.1 45.4 40.7-50.1 11.7 8.2-15.2 7.8 5.0-10.6
45-59 522 40.6 32.7-48.6 43.9 36.6-51.2 10.9 6.7-15.2 4.5 1.8-7.2
60-69 205 43.3 33.8-52.9 39.5 28.2-50.9 9.4 3.9-15.0 7.7 1.0-14.4
15-69 2490 36.6 32.8-40.4 46.6 43.1-50.0 10.6 8.6-12.6 6.2 4.6-7.8
Table 113 number of servings fruit/veg. – Females
Number of servings of fruit and/or vegetables on average per day
Age Group (years)
Both Sexes
n % no fruit
and/or vegetables
95% CI % 1-2
servings 95% CI
% 3-4 servings
95% CI % ≥5
servings 95% CI
15-29 1415 41.8 37.4-46.2 44.0 40.1-47.8 9.1 7.0-11.3 5.1 3.4-6.8
30-44 1214 36.1 30.7-41.5 45.8 41.1-50.5 12.2 9.2-15.2 6.0 3.8-8.1
45-59 739 45.7 39.2-52.2 40.0 34.2-45.9 9.7 6.5-12.8 4.6 2.4-6.8
60-69 283 41.9 33.8-50.0 42.2 33.4-50.9 11.5 4.9-18.1 4.4 0.4-8.4
15-69 3651 40.7 37.3-44.1 43.8 41.2-46.5 10.2 8.4-12.0 5.2 3.9-6.6
Table 114 Number of fruits/veg. servings - Both

Botswana Non-communicable Disease Risk Factor Surveillance - 2014 Page 69
0
10
20
30
40
50
No fruitand/or
vegetables
1-2 servings 3-4 servings ≥5 servings
Per
cen
t
Number of servings of fruits and/or vegetables on average per day
N=3651
Males
Females
Figure 31Number of servings fruits/vegetables
Less than five servings of fruit and/or vegetables on average per day
Age Group (years)
Men Women Both Sexes
n % < five servings per day
95% CI n % < five servings per day
95% CI n % < five servings per day
95% CI
15-29 496 95.5 93.1-97.9 919 94.3 92.2-96.3 1415 94.9 93.2-96.6
30-44 370 95.8 93.0-98.7 844 92.2 89.4-95.0 1214 94.0 91.9-96.2
45-59 217 95.4 92.0-98.8 522 95.5 92.8-98.2 739 95.4 93.2-97.6
60-69 78 99.6 98.9-100.0 205 92.3 85.6-99.0 283 95.6 91.6-99.6
15-69 1161 95.8 93.9-97.6 2490 93.8 92.2-95.4 3651 94.8 93.4-96.1
Table 115 Less than 5 servings of fruit/veg. - Both
92
93
94
95
96
Males Females
Pe
rce
nt
Survey Participants who had less than 5 servings of fuits and/or vegetables
on average perdayN=1161
Figure 32 Consumed <5 servings of fruits/veg.

Botswana Non-communicable Disease Risk Factor Surveillance - 2014 Page 70
Type of oil or fat most often used for meal preparation in household
n (house-holds) Type % 95% CI %
4062
Vegetable oil 98.2 97.6-98.8
Lard 0.4 0.2-0.6
Butter 0.1 0.0-0.3
Margarine 0.2 0.0-0.4
none in particular 0.5 0.2-0.8
None used 0.4 0.0-0.8
Other 0.1 0.0-0.2
Table 116 Type of fat/oil used
The type of oil or fat most used for meal preparation in household was vegetable oil (98.2%) and other types of fat/oil (1.8%).
Mean number of meals eaten outside a home
Age Group (years)
Men Women Both Sexes
n mean 95% CI n mean 95% CI n mean 95% CI
15-29 545 1.5 1.2-1.8 988 1.1 0.9-1.4 1533 1.3 1.1-1.5
30-44 409 1.5 1.1-2.0 918 0.8 0.6-1.1 1327 1.2 0.9-1.5
45-59 241 1.0 0.6-1.3 574 0.3 0.2-0.4 815 0.6 0.4-0.8
60-69 88 0.5 0.3-0.7 231 0.2 0.1-0.2 319 0.3 0.2-0.4
15-69 1283 1.4 1.1-1.6 2711 0.9 0.7-1.0 3994 1.1 1.0-1.3
Table 117 Meals eaten outside home
Higher percentage of males eat meals prepared outside home (1.4%) as compared to that of females (0.9%)
Physical Activity (Reference material guiding content of physical activity)

Botswana Non-communicable Disease Risk Factor Surveillance - 2014 Page 71
Introduction The two most common ways to describe physical activity (or inactivity) are (1) MET-minutes per week or time spent in physical activity, and
Metabolic Equivalent (MET)
METs (Metabolic Equivalents) are commonly used to express the intensity of physical activities, Applying MET values to activity levels allows us to calculate total physical activity. MET is the ratio of a person's working metabolic rate relative to the resting metabolic rate. One MET is defined as the energy spent on sitting quietly, and is equivalent to a caloric consumption of 1 kcal/kg/hour. It is estimated that, compared to sitting quietly, a person's caloric consumption is four times as high when being moderately active, and eight times as high when being vigorously active.
Activity MET value
Work Moderate MET value = 4.0 Vigorous MET value = 8.0
Transport Cycling and walking MET value = 4.0
Recreation Moderate MET value = 4.0 Vigorous MET value = 8.0
WHO global recommendations on physical activity for health
Throughout a week, including activity for work, during transport and leisure time, adults should do at least:
150 minutes of moderate-intensity physical activity OR
75 minutes of vigorous-intensity physical activity OR
An equivalent combination of moderate- and vigorous-intensity physical activity achieving at least 600 MET-minutes.
Former recommen-dations for comparison purposes
The three levels of physical activity suggested for classifying populations were low, moderate, and high. The criteria for these levels are shown below.
High A person reaching any of the following criteria is classified in this category: - Vigorous-intensity activity on at least 3 days achieving a minimum of at least 1,500
MET-minutes/week OR - 7 or more days of any combination of walking, moderate- or vigorous-intensity
activities achieving a minimum of at least 3,000 MET-minutes per week.
Moderate A person not meeting the criteria for the "high" category, but meeting any of the
following criteria is classified in this category: - 3 or more days of vigorous-intensity activity of at least 20 minutes per day OR - 5 or more days of moderate-intensity activity or walking of at least 30 minutes per
day OR - 5 or more days of any combination of walking, moderate- or vigorous-intensity
activities achieving a minimum of at least 600 MET-minutes per week.
Low A person not meeting any of the above mentioned criteria falls in this category.

Botswana Non-communicable Disease Risk Factor Surveillance - 2014 Page 72
Not meeting WHO recommendations on physical activity for health
Age Group (years)
Men Women Both Sexes
n % not
meeting recs
95% CI n % not
meeting recs
95% CI n % not
meeting recs
95% CI
15-29 503 9.2 6.2-12.2 909 27.2 23.1-31.2 1412 17.8 15.2-20.5
30-44 370 18.9 12.9-24.9 845 23.4 18.7-28.0 1215 21.1 16.9-25.3
45-59 226 21.7 13.2-30.3 525 26.0 19.6-32.3 751 24.0 18.6-29.4
60-69 83 21.5 11.1-31.9 210 28.2 18.3-38.2 293 25.2 18.1-32.2
15-69 1182 14.3 11.3-17.3 2489 25.9 22.7-29.2 3671 20.1 17.4-22.7
Table 118 Not meeting WHO recommendation- Both
Level of total physical activity according to former recommendations
Age Group (years)
Men
n % Low 95% CI %
Moderate 95% CI % High 95% CI
15-29 503 16.2 12.0-20.3 22.0 17.3-26.6 61.9 56.3-67.4
30-44 370 22.3 16.1-28.5 19.3 12.1-26.5 58.4 50.0-66.8
45-59 226 28.4 19.5-37.4 19.5 13.6-25.4 52.0 43.0-61.1
60-69 83 35.8 20.2-51.5 18.7 8.5-29.0 45.4 30.4-60.5
15-69 1182 20.6 17.2-23.9 20.7 17.5-23.9 58.7 54.3-63.2
Table 119 Level of total physical activity – males
Level of total physical activity according to former recommendations
Age Group (years)
Women
n % Low 95% CI %
Moderate 95% CI % High 95% CI
15-29 909 35.1 30.5-39.6 32.2 27.9-36.5 32.7 28.0-37.4
30-44 845 33.0 28.1-38.0 25.2 21.2-29.2 41.8 37.1-46.5
45-59 525 35.2 28.5-41.9 22.4 17.3-27.5 42.4 35.3-49.5
60-69 210 41.6 30.4-52.8 22.5 14.3-30.7 35.8 24.3-47.4
15-69 2489 34.9 31.4-38.3 28.1 25.4-30.8 37.1 33.5-40.6
Table 120 Level of physical activity – Females
Level of total physical activity according to former recommendations
Age Group (years)
Both Sexes
n % Low 95% CI %
Moderate 95% CI % High 95% CI
15-29 1412 25.2 22.2-28.3 26.9 23.5-30.3 47.9 43.7-52.1
30-44 1215 27.6 23.2-32.0 22.2 18.3-26.1 50.2 45.1-55.2
45-59 751 32.0 26.3-37.8 21.1 16.9-25.2 46.9 40.8-53.0
60-69 293 39.0 29.6-48.4 20.8 14.0-27.6 40.2 31.1-49.3
15-69 3671 27.6 24.8-30.5 24.4 22.0-26.7 48.0 44.6-51.4
Table 121 Level of physical activity - Both

Botswana Non-communicable Disease Risk Factor Surveillance - 2014 Page 73
0
10
20
30
40
50
60
70
Low Moderate High
Per
cen
t
Level of Total Physical Activity
Level of Physical Activity According to Former Recommendations
N=3671
Males
Females
Figure 33Level of physical activity
Mean minutes of total physical activity on average per day
Age Group (years)
Men Women Both Sexes
n Mean
minutes 95% CI n
Mean minutes
95% CI n Mean
minutes 95% CI
15-29 503 208.7 181.1-236.4 909 98.3 84.9-111.7 1412 155.8 138.7-172.9
30-44 370 186.3 155.2-217.3 845 150.0 132.0-168.0 1215 168.3 150.0-186.7
45-59 226 222.4 181.3-263.5 525 159.7 131.0-188.4 751 189.2 166.2-212.2
60-69 83 197.1 120.6-273.5 210 123.6 85.6-161.6 293 157.3 117.6-196.9
15-69 1182 203.6 184.8-222.5 2489 124.4 113.4-135.5 3671 164.5 151.8-177.1
Table 122 Mean minutes of total Physical activity
Median minutes of total physical activity on average per day
Age Group (years)
Men Women Both Sexes
n Median minutes
Inter-quartile range
(P25-P75)
n Median minutes
Inter-quartile range
(P25-P75) n
Median minutes
Inter-quartile range
(P25-P75)
15-29 503 120.0 45.7-308.6 909 51.4 17.1-120.0 1412 81.4 30.0-202.9
30-44 370 94.3 30.0-270.0 845 74.3 21.4-197.1 1215 87.1 28.6-247.1
45-59 226 109.3 38.6-351.4 525 77.1 17.1-240.0 751 90.0 21.4-287.1
60-69 83 90.0 24.3-300.0 210 60.0 12.9-180.0 293 64.3 17.1-218.6
15-69 1182 108.6 38.6-300.0 2489 60.0 17.1-158.6 3671 85.7 28.6-225.7
Table 123 Median minutes of physical activity
Mean minutes of work-related physical activity on average per day

Botswana Non-communicable Disease Risk Factor Surveillance - 2014 Page 74
Age Group (years)
Men Women Both Sexes
n Mean
minutes 95% CI n
Mean minutes
95% CI n Mean
minutes 95% CI
15-29 503 110.6 87.6-133.6 909 45.2 37.2-53.1 1412 79.3 65.8-92.7
30-44 370 113.4 85.7-141.1 845 99.5 85.1-113.9 1215 106.5 90.6-122.5
45-59 226 135.4 99.2-171.6 525 102.6 81.5-123.7 751 118.0 98.3-137.8
60-69 83 106.7 54.0-159.4 210 93.1 55.3-130.8 293 99.3 68.1-130.5
15-69 1182 114.7 98.5-130.9 2489 72.7 64.5-81.0 3671 93.9 83.9-104.0
Table 124 Mean minutes work related
Mean minutes of transport-related physical activity on average per day
Age Group (years)
Men Women Both Sexes
n Mean
minutes 95% CI n
Mean minutes
95% CI n Mean
minutes 95% CI
15-29 503 62.8 50.8-74.8 909 40.0 29.3-50.7 1412 51.9 43.5-60.2
30-44 370 52.5 40.8-64.3 845 40.4 32.8-48.0 1215 46.5 38.9-54.2
45-59 226 72.3 54.9-89.7 525 50.7 38.2-63.3 751 60.8 50.5-71.2
60-69 83 88.4 50.2-126.6 210 28.9 20.6-37.1 293 56.1 37.5-74.8
15-69 1182 62.4 53.4-71.3 2489 41.2 34.5-47.9 3671 51.9 45.6-58.2
Table 125 Mean minutes transport related
Mean minutes of recreation-related physical activity on average per day
Age Group (years)
Men Women Both Sexes
n Mean
minutes 95% CI n
Mean minutes
95% CI n Mean
minutes 95% CI
15-29 503 35.3 29.2-41.4 909 13.1 10.1-16.1 1412 24.7 20.9-28.5
30-44 370 20.3 15.7-25.0 845 10.1 6.1-14.0 1215 15.2 12.2-18.2
45-59 226 14.7 7.2-22.3 525 6.4 3.6-9.2 751 10.3 6.4-14.2
60-69 83 2.0 0.1-3.9 210 1.7 0.5-2.8 293 1.8 0.8-2.9
15-69 1182 26.6 22.7-30.5 2489 10.5 8.4-12.6 3671 18.6 16.2-21.1
Table 126 Mean minutes recreation related
0
20
40
60
80
100
120
140
Men Women Both Sexes
Pe
rce
nt
Mean Minutes spent on Related Physical Activity/ DayN=3671
Work
Transport
Recreational
Figure 34Mean minutes spent on physical activity
Median minutes of work-related physical activity on average per day

Botswana Non-communicable Disease Risk Factor Surveillance - 2014 Page 75
Age Group (years)
Men Women Both Sexes
n Median minutes
Inter-quartile range
(P25-P75)
n Median minutes
Inter-quartile range
(P25-P75)
n Median minutes
Inter-quartile range
(P25-P75)
15-29 503 10.7 0.0-162.9 909 0.0 0.0-42.9 1412 4.3 0.0-69.4
30-44 370 25.7 0.0-137.1 845 25.7 0.0-120.0 1215 25.7 0.0-128.6
45-59 226 17.1 0.0-180.0 525 8.6 0.0-154.3 751 12.9 0.0-171.4
60-69 83 17.1 0.0-120.0 210 12.9 0.0-122.9 293 12.9 0.0-122.9
15-69 1182 15.0 0.0-162.9 2489 8.6 0.0-77.1 3671 8.6 0.0-109.3
Table 127 Median minutes work related
Median minutes of transport-related physical activity on average per day
Age Group (years)
Men Women Both Sexes
n Median minutes
Inter-quartile range
(P25-P75)
n Median minutes
Inter-quartile range
(P25-P75)
n Median minutes
Inter-quartile range
(P25-P75)
15-29 503 30.0 11.0-60.0 909 17.1 4.3-40.0 1412 25.7 8.6-60.0
30-44 370 21.4 1.4-60.0 845 15.0 1.4-42.9 1215 20.0 1.4-60.0
45-59 226 30.0 6.4-90.0 525 21.4 1.4-60.0 751 25.7 2.9-68.6
60-69 83 32.1 11.4-90.0 210 10.0 0.0-30.0 293 18.0 2.1-60.0
15-69 1182 30.0 10.0-68.6 2489 17.1 2.9-42.9 3671 21.4 4.3-60.0
Table 128 Median minutes transport related
Median minutes of recreation-related physical activity on average per day
Age Group (years)
Men Women Both Sexes
n Median minutes
Inter-quartile range
(P25-P75)
n Median minutes
Inter-quartile range
(P25-P75)
n Median minutes
Inter-quartile range
(P25-P75)
15-29 503 12.9 0.0-51.4 909 0.0 0.0-0.0 1412 0.0 0.0-34.3
30-44 370 0.0 0.0-29.3 845 0.0 0.0-0.0 1215 0.0 0.0-12.9
45-59 226 0.0 0.0-8.6 525 0.0 0.0-0.0 751 0.0 0.0-0.0
60-69 83 0.0 0.0-0.0 210 0.0 0.0-0.0 293 0.0 0.0-0.0
15-69 1182 0.0 0.0-34.3 2489 0.0 0.0-0.0 3671 0.0 0.0-17.1
Table 129 Median minutes recreation related
0
5
10
15
20
25
30
35
Males Females Both
Per
cen
t
Median Minutes Spent on Relate Physical Activity/DayN=3671
Work
Transport
Recreational
Figure 35Minutes spent on type of activities
No work-related physical activity

Botswana Non-communicable Disease Risk Factor Surveillance - 2014 Page 76
Age Group (years)
Men Women Both Sexes
n % no
activity at work
95% CI n % no
activity at work
95% CI n % no
activity at work
95% CI
15-29 503 46.6 39.9-53.3 909 51.5 46.0-56.9 1412 48.9 44.0-53.8
30-44 370 43.1 34.7-51.5 845 39.1 33.7-44.5 1215 41.1 35.9-46.3
45-59 226 45.6 36.4-54.8 525 47.2 40.7-53.8 751 46.5 40.7-52.2
60-69 83 43.9 29.7-58.2 210 46.6 35.7-57.5 293 45.4 36.2-54.6
15-69 1182 45.3 40.0-50.6 2489 47.0 42.9-51.0 3671 46.1 42.3-50.0
Table 130 No work related physical activity
No transport-related physical activity
Age Group (years)
Men Women Both Sexes
n
% no activity
for transport
95% CI n
% no activity
for transport
95% CI n
% no activity
for transport
95% CI
15-29 503 13.5 9.4-17.7 909 20.8 17.0-24.5 1412 17.0 13.9-20.1
30-44 370 24.9 17.8-32.1 845 24.4 19.2-29.5 1215 24.7 19.8-29.5
45-59 226 22.3 15.6-29.0 525 24.7 17.9-31.6 751 23.6 18.2-28.9
60-69 83 15.3 4.3-26.2 210 30.3 19.0-41.6 293 23.4 14.4-32.4
15-69 1182 18.1 14.7-21.5 2489 23.0 19.7-26.3 3671 20.5 17.7-23.4
Table 131 No transport related physical activity
No recreation-related physical activity
Age Group (years)
Men Women Both Sexes
n % no
activity at recreation
95% CI n % no
activity at recreation
95% CI n % no
activity at recreation
95% CI
15-29 503 43.7 37.6-49.8 909 75.1 71.0-79.2 1412 58.8 54.8-62.8
30-44 370 59.2 50.6-67.8 845 79.5 75.1-83.9 1215 69.3 64.2-74.3
45-59 226 72.4 63.9-80.9 525 84.1 78.8-89.4 751 78.6 73.4-83.8
60-69 83 94.3 89.6-99.0 210 87.2 79.7-94.7 293 90.5 85.9-95.0
15-69 1182 54.5 49.8-59.2 2489 78.5 75.5-81.5 3671 66.4 63.3-69.4
Table 132 No recreation related physical activity
Figure 36Not related to physical activity
0
10
20
30
40
50
60
70
80
90
Males Females Both
Per
cen
t
Not Related to Physical Activity N=3671
Work
Transport
Recreational

Botswana Non-communicable Disease Risk Factor Surveillance - 2014 Page 77
Composition of total physical activity
Age Group (years)
Men
n % Activity from work
95% CI % Activity for
transport 95% CI
% Activity during leisure
time 95% CI
15-29 483 32.8 27.9-37.8 43.2 37.7-48.7 24.0 20.1-27.9
30-44 332 39.5 34.0-45.0 42.0 36.5-47.6 18.5 14.3-22.6
45-59 196 40.5 32.9-48.0 49.2 40.8-57.5 10.4 5.5-15.3
60-69 73 40.0 27.7-52.3 58.0 45.9-70.1 2.0 0.0-4.0
15-69 1084 36.0 32.3-39.6 44.3 40.3-48.4 19.7 17.0-22.3
Table 133 Composition of total physical activity – males
Composition of total physical activity
Age Group (years)
Women
n % Activity from work
95% CI % Activity for
transport 95% CI
% Activity during leisure
time 95% CI
15-29 800 33.0 29.3-36.6 54.4 50.3-58.5 12.6 10.2-15.0
30-44 766 48.3 44.3-52.3 42.6 38.5-46.8 9.1 6.2-12.0
45-59 457 44.3 39.3-49.2 51.2 46.1-56.3 4.5 2.8-6.3
60-69 180 50.7 40.7-60.7 44.7 34.9-54.6 4.6 0.7-8.4
15-69 2203 40.2 37.4-42.9 49.9 46.8-53.0 9.9 8.2-11.6
Table 134 composition of total physical activity – Females
Composition of total physical activity
Age Group (years)
Both Sexes
n % Activity from work
95% CI % Activity for
transport 95% CI
% Activity during leisure
time 95% CI
15-29 1283 32.9 29.4-36.3 48.3 44.6-52.1 18.8 16.3-21.2
30-44 1098 43.9 40.5-47.2 42.3 38.8-45.9 13.8 11.3-16.3
45-59 653 42.4 37.6-47.2 50.2 45.1-55.3 7.3 4.6-10.0
60-69 253 45.6 36.7-54.4 51.1 42.5-59.6 3.3 1.2-5.5
15-69 3287 38.0 35.4-40.6 47.0 44.2-49.8 15.0 13.2-16.7
Table 135 Composition of physical activity - Both
0
10
20
30
40
50
60
Males Females Both
Perc
ent
Composition of Total Physical ActivityN=3287
work
transport
leisure time
Figure 37composition of total physical activity

Botswana Non-communicable Disease Risk Factor Surveillance - 2014 Page 78
No vigorous physical activity
Age Group (years)
Men Women Both Sexes
n % no
vigorous activity
95% CI n % no
vigorous activity
95% CI n % no
vigorous activity
95% CI
15-29 503 36.1 29.8-42.4 909 76.1 71.7-80.5 1412 55.3 50.9-59.7
30-44 370 43.3 34.8-51.9 845 68.3 63.5-73.0 1215 55.7 50.3-61.1
45-59 226 55.5 45.7-65.3 525 69.5 63.0-76.0 751 62.9 57.2-68.6
60-69 83 75.5 62.2-88.8 210 67.1 54.9-79.2 293 70.9 61.6-80.3
15-69 1182 42.7 37.6-47.8 2489 72.3 69.0-75.6 3671 57.3 53.9-60.7
Table 136 No vigorous physical activity
0
10
20
30
40
50
60
70
80
15-29 30-44 45-59 60-69 Total
Pe
rce
nt
Age Group
Participants with no vigorous physical activityN=1182
Males
Females
Figure 38with no vigorous physical activity
Females and the elderly are seen to have not participated in vigorous physical activity.
Minutes spent in sedentary activities on average per day
Age Group (years)
Men
n Mean
minutes 95% CI
Median minutes
Inter-quartile range
(P25-P75)
15-29 559 207.7 186.3-229.1 180 60-300
30-44 418 194.1 168.9-219.3 180 60-300
45-59 248 177.4 151.1-203.7 120 60-240
60-69 89 184.2 133.3-235.1 120 60-300
15-69 1314 198.6 183.0-214.3 180 60-300
Table 137 Minutes spent on sedentary activity - males

Botswana Non-communicable Disease Risk Factor Surveillance - 2014 Page 79
Minutes spent in sedentary activities on average per day
Age Group (years)
Women
n Mean
minutes 95% CI
Median minutes
Inter-quartile range
(P25-P75)
15-29 996 215.1 197.7-232.5 180 60-300
30-44 928 193.1 175.3-210.9 122 60-300
45-59 585 157.6 142.6-172.7 120 45-240
60-69 232 183.2 146.0-220.3 120 60-240
15-69 2741 197.7 184.9-210.6 150 60-300
Table 138 Minutes spent on sedentary activity - Females
Minutes spent in sedentary activities on average per day
Age Group (years)
Both Sexes
n Mean
minutes 95% CI
Median minutes
Inter-quartile range
(P25-P75)
15-29 1555 211.2 196.1-226.4 180 60-300
30-44 1346 193.6 177.8-209.5 180 60-300
45-59 833 166.7 151.3-182.1 120 60-240
60-69 321 183.6 152.9-214.4 120 60-300
15-69 4055 198.2 187.0-209.4 165 60-300
Table 139 Minutes on sedentary activity - Both
0
50
100
150
200
250
Males Females Both
Min
ute
s
Time Spent on Sedentary Activities/DayN=4055
Mean
Median
Figure 39Time spent on sedentary activity

Botswana Non-communicable Disease Risk Factor Surveillance - 2014 Page 80
History of Raised Blood Pressure
Blood pressure measurement and diagnosis
Age Group (years)
Men
n
% Never
measured
95% CI
% measured,
not diagnosed
95% CI
% diagnosed,
but not within past 12 months
95% CI
% diagnosed within past 12 months
95% CI
15-29 559 32.9 27.5-38.3 57.2 51.6-62.8 4.0 2.1-5.8 5.9 3.2-8.6
30-44 418 24.3 15.9-32.7 57.1 48.5-65.7 7.6 4.4-10.9 11.0 6.3-15.6
45-59 248 10.5 6.0-15.0 58.1 50.2-65.9 8.8 4.7-12.8 22.7 16.3-29.1
60-69 89 7.6 1.5-13.7 52.5 38.5-66.5 10.6 3.3-18.0 29.3 15.4-43.2
15-69 1314 26.2 21.7-30.8 57.1 52.7-61.5 6.0 4.5-7.4 10.7 8.3-13.2
Table 140 BP measurement and Dx - Males
Blood pressure measurement and diagnosis
Age Group (years)
Women
n
% Never
measured
95% CI
% measured,
not diagnosed
95% CI
% diagnosed,
but not within past 12 months
95% CI
% diagnosed within past 12 months
95% CI
15-29 996 22.3 18.5-26.1 62.9 58.9-66.8 5.3 3.7-6.8 9.5 7.0-12.1
30-44 928 8.8 6.4-11.2 60.2 55.7-64.7 9.9 6.8-12.9 21.1 17.3-24.9
45-59 585 8.3 4.8-11.8 46.8 40.7-52.9 12.1 8.5-15.7 32.8 26.8-38.8
60-69 232 8.0 0.2-15.8 43.2 31.7-54.7 14.1 8.6-19.5 34.7 25.6-43.8
15-69 2741 15.4 13.0-17.7 58.4 55.7-61.1 8.2 6.6-9.8 18.0 15.9-20.1
Table 141 BP measurement and Dx - Females
Blood pressure measurement and diagnosis
Age Group (years)
Both sexes
n % Never
measured 95% CI
% measured,
not diagnosed
95% CI
% diagnosed,
but not within past 12 months
95% CI
% diagnosed within past 12 months
95% CI
15-29 1555 27.8 24.5-31.2 59.9 56.5-63.4 4.6 3.3-5.9 7.7 5.7-9.6
30-44 1346 16.7 12.0-21.5 58.6 53.5-63.7 8.7 6.6-10.9 16.0 13.0-18.9
45-59 833 9.3 6.3-12.3 52.0 46.8-57.2 10.6 7.8-13.4 28.2 23.7-32.6
60-69 321 7.8 2.7-12.9 47.4 38.5-56.3 12.5 8.1-16.9 32.3 24.7-39.9
15-69 4055 20.9 18.1-23.7 57.7 54.9-60.5 7.1 5.9-8.2 14.3 12.6-16.0
Table 142 BP measurement and Dx - Both

Botswana Non-communicable Disease Risk Factor Surveillance - 2014 Page 81
0
10
20
30
40
50
60
70
Never measured measured, notdiagnosed
diagnosed, butnot within past
12 months
diagnosedwithin past 12
months
Pe
rce
nt
BP Measurement and Hypertension DiagnosisAmong STEPS suvey participants
N=4055
Males
Females
Figure 40BP measurement & HPN diagnosis
Currently taking drugs (medication) for raised blood pressure prescribed by doctor or health worker among those
diagnosed
Age Group (years)
Men Women Both Sexes
n % taking
meds 95% CI n
% taking meds
95% CI n % taking
meds 95% CI
15-29 58 8.3 0.1-16.4 154 13.0 6.0-20.1 212 11.0 5.6-16.4
30-44 70 27.7 12.0-43.3 289 31.4 23.1-39.8 359 30.0 21.6-38.4
45-59 86 49.2 37.9-60.6 279 57.1 48.1-66.1 365 54.2 46.8-61.6
60-69 31 63.1 41.3-84.9 133 74.9 65.9-84.0 164 70.1 59.9-80.4
15-69 245 30.9 23.4-38.4 855 38.0 33.3-42.7 1100 35.2 31.1-39.3
Table 143 Currently taking medications
Seen a traditional healer among those previously diagnosed
Age Group (years)
Men Women Both Sexes
n % seen
trad. healer
95% CI n
% seen trad.
healer
95% CI n % seen
trad. healer
95% CI
15-29 58 0.9 0.0-2.8 154 0.5 0.0-1.4 212 0.7 0.0-1.6
30-44 70 9.3 0.0-21.7 289 1.1 0.0-2.2 359 4.2 0.0-9.2
45-59 86 4.9 0.0-10.6 279 5.3 2.4-8.2 365 5.2 2.1-8.2
60-69 31 6.2 0.0-18.0 133 1.5 0.0-3.7 164 3.4 0.0-8.4
15-69 245 5.2 0.4-10.0 855 2.1 1.2-3.1 1100 3.3 1.2-5.4
Table 144 Seen a traditional healer for BP
Among 245 male participants diagnosed as havingraisedblood pressure,30.9% of themhad prescription for medicines by healthworkers. In addition 5.2% of themwereseenby a traditionalhealer and the sameweretakingtraditionalmedicine. While 88.0% of 855 femalesdiagnosedweretakingmedicationprescribed by a healthworkerplus 2.1% of themseen by a traditionalhealerand2.9% takingherbalmedicine for theirraisedblood pressure.

Botswana Non-communicable Disease Risk Factor Surveillance - 2014 Page 82
Currently taking herbal or traditional remedy for raised blood pressure among those previously diagnosed
Age Group (years)
Men Women Both Sexes
n %taking
trad. meds
95% CI n
% taking trad. meds
95% CI n % taking
trad.meds 95% CI
15-29 58 0.8 0.0-2.2 154 1.2 0.0-2.9 212 1.1 0.0-2.2
30-44 70 10.5 0.0-23.1 289 1.8 0.0-3.6 359 5.1 0.0-10.3
45-59 86 5.6 0.0-11.5 279 5.0 2.3-7.8 365 5.2 2.2-8.3
60-69 31 0.9 0.0-2.8 133 5.5 0.4-10.6 164 3.6 0.4-6.9
15-69 245 5.2 0.3-10.0 855 2.9 1.6-4.2 1100 3.8 1.7-5.9
Table 145 Taking traditional remedy for BP

Botswana Non-communicable Disease Risk Factor Surveillance - 2014 Page 83
History of Diabetes
Blood sugar measurement and diagnosis
Age Group (years)
Men
n % Never
measured 95% CI
% measured,
not diagnosed
95% CI
% diagnosed,
but not within past 12 months
95% CI
% diagnosed within past 12 months
95% CI
15-29 559 88.8 85.5-92.1 11.1 7.8-14.4 0.1 0.0-0.2 0.0 0.0-0.0
30-44 418 74.8 68.8-80.7 23.2 17.3-29.1 0.6 0.0-1.2 1.4 0.0-3.3
45-59 248 64.3 56.5-72.0 31.5 23.8-39.3 0.9 0.0-1.9 3.4 1.2-5.5
60-69 89 66.5 54.9-78.0 21.4 12.5-30.3 0.0 0.0-0.0 12.1 1.1-23.1
15-69 1314 80.4 77.2-83.7 17.8 14.7-20.9 0.3 0.1-0.6 1.4 0.6-2.2
Table 146 Blood sugar measurement &Dx – males
Blood sugar measurement and diagnosis
Age Group (years)
Women
n % Never
measured 95% CI
% measured,
not diagnosed
95% CI
% diagnosed,
but not within past 12 months
95% CI
% diagnosed within past 12 months
95% CI
15-29 996 87.4 84.8-90.0 11.9 9.4-14.4 0.2 0.0-0.5 0.5 0.0-1.2
30-44 928 67.2 61.9-72.5 30.6 25.9-35.4 0.8 0.1-1.5 1.3 0.1-2.6
45-59 585 57.2 51.4-63.0 37.7 32.1-43.4 1.7 0.5-2.9 3.4 1.4-5.3
60-69 232 49.6 40.3-58.8 41.5 32.3-50.8 0.5 0.0-1.2 8.4 3.5-13.2
15-69 2741 74.6 72.1-77.1 23.1 20.7-25.5 0.6 0.3-0.9 1.7 1.0-2.3
Table 147 Blood sugar measurement &Dx - Females
Blood sugar measurement and diagnosis
Age Group (years)
Both sexes
n % Never
measured 95% CI
% measured,
not diagnosed
95% CI
% diagnosed,
but not within past 12 months
95% CI
% diagnosed within past 12 months
95% CI
15-29 1555 88.1 86.0-90.3 11.5 9.4-13.5 0.1 0.0-0.3 0.3 0.0-0.6
30-44 1346 71.1 66.8-75.3 26.9 22.9-30.8 0.7 0.3-1.2 1.4 0.2-2.5
45-59 833 60.4 55.3-65.5 34.9 30.0-39.8 1.3 0.6-2.1 3.4 1.9-4.8
60-69 321 57.3 49.8-64.7 32.4 25.5-39.3 0.3 0.0-0.6 10.1 4.3-15.8
15-69 4055 77.5 75.4-79.7 20.4 18.4-22.5 0.5 0.3-0.7 1.5 0.9-2.1
Table 148 Blood sugar measurement - Both

Botswana Non-communicable Disease Risk Factor Surveillance - 2014 Page 84
0
10
20
30
40
50
60
70
80
90
Never measured measured, notdiagnosed
diagnosed, butnot within past
12 months
diagnosed withinpast 12 months
Pe
rce
nt
Blood Sugar Measurement and Diagnosis Among STEPS Survey Participants
N=4055
Figure 41Blood sugar measurement & diagnosis
Currently taking drugs (medication) prescribed for diabetes among those previously diagnosed
Age Group (years)
Men Women Both Sexes
n % taking
meds 95% CI n
% taking meds
95% CI n % taking
meds 95% CI
15-29 1 0.0 0.0-0.0 6 22.1 0.0-55.4 7 19.6 0.0-48.5
30-44 9 74.1 39.9-100.0 15 17.0 0.0-40.3 24 44.9 12.7-77.1
45-59 13 57.3 27.0-87.6 35 52.4 29.5-75.4 48 54.5 36.3-72.6
60-69 7 100.0 100.0-100.0 25 86.4 74.5-98.3 32 93.6 87.1-100.0
15-69 30 75.1 57.1-93.2 81 45.6 30.0-61.3 111 58.5 45.6-71.5
Table 149 Taking medication for diabetes
Currently taking insulin prescribed for diabetes among those previously diagnosed
Age Group (years)
Men Women Both Sexes
n % taking insulin
95% CI n % taking insulin
95% CI n % taking insulin
95% CI
15-29 1 0.0 0.0-0.0 6 22.1 0.0-55.4 7 19.6 0.0-48.5
30-44 9 53.1 1.5-100.0 15 7.7 0.0-23.0 24 29.9 0.0-64.6
45-59 13 19.4 0.0-41.8 35 19.9 4.4-35.5 48 19.7 7.1-32.3
60-69 7 65.0 19.9-100.0 25 39.4 14.2-64.6 32 53.0 24.5-81.5
15-69 30 44.7 16.4-73.0 81 21.2 9.6-32.8 111 31.5 18.0-45.1
Table 150 Taking Insulin for diabetes
Out of the 111 male and female diabetic cases diagnosed, 58.5% of them were on oral medications and 31.5% were on Insulin. Additionally 0.4% had also seen a traditional healer and 0.5% of them were taking traditional medicine.

Botswana Non-communicable Disease Risk Factor Surveillance - 2014 Page 85
Seen a traditional healer for diabetes among those previously diagnosed
Age Group (years)
Men Women Both Sexes
n % seen
trad. healer
95% CI n %
seen trad. healer
95% CI n % seen
trad. healer
95% CI
15-29 - - - 6 0.0 0.0-0.0 7 0.0 0.0-0.0
30-44 - - - 15 0.0 0.0-0.0 24 0.0 0.0-0.0
45-59 - - - 35 1.9 0.0-5.6 48 1.1 0.0-3.3
60-69 - - - 25 0.0 0.0-0.0 32 0.0 0.0-0.0
15-69 - - - 81 0.7 0.0-2.0 111 0.4 0.0-1.1
Table 151 Seen traditional healer for diabetes – Both
Currently taking herbal or traditional treatment for diabetes among those previously diagnosed
Age Group (years)
Men Women Both Sexes
n % taking
trad. meds 95% CI n
% taking trad. meds
95% CI n % taking
trad. meds 95% CI
15-29 - - - 6 0.0 0.0-0.0 7 0.0 0.0-0.0
30-44 - - - 15 0.0 0.0-0.0 24 0.0 0.0-0.0
45-59 - - - 35 2.4 0.0-6.3 48 1.4 0.0-3.7
60-69 - - - 25 0.0 0.0-0.0 32 0.0 0.0-0.0
15-69 - - - 81 0.8 0.0-2.2 111 0.5 0.0-1.2
Table 152 Taking herbal treatment for diabetes
History of Raised Total Cholesterol
Total cholesterol measurement and diagnosis
Age Group (years)
Men
n % Never
measured 95% CI
% measured,
not diagnosed
95% CI
% diagnosed,
but not within past 12 months
95% CI
% diagnosed within past 12 months
95% CI
15-29 559 97.2 95.9-98.5 2.5 1.2-3.8 0.1 0.0-0.4 0.1 0.0-0.4
30-44 418 90.7 86.0-95.5 4.8 2.4-7.3 1.4 0.0-3.3 3.1 0.0-6.8
45-59 248 86.6 79.9-93.2 11.3 4.9-17.7 1.4 0.0-3.5 0.7 0.0-1.5
60-69 89 89.9 79.6-100.0 3.8 0.0-7.5 0.0 0.0-0.0 6.3 0.0-16.1
15-69 1314 93.6 91.6-95.5 4.4 3.0-5.9 0.7 0.0-1.3 1.4 0.2-2.6
Table 153 Cholesterol measurement &Dx - males
Total cholesterol measurement and diagnosis
Age Group (years)
Women
n % Never measure
d 95% CI
% measured,
not diagnosed
95% CI
% diagnosed,
but not within past 12 months
95% CI
% diagnosed within past 12 months
95% CI
15-29 996 97.6 96.4-98.9 2.3 1.0-3.5 0.0 0.0-0.0 0.1 0.0-0.3
30-44 928 92.8 90.2-95.5 6.2 3.6-8.7 0.8 0.1-1.5 0.2 0.0-0.4
45-59 585 89.4 85.4-93.4 6.8 3.7-9.8 1.9 0.0-4.2 1.9 0.4-3.4
60-69 232 87.8 80.1-95.5 9.9 2.3-17.5 0.9 0.0-2.3 1.4 0.1-2.6
15-69 2741 94.4 93.1-95.7 4.6 3.4-5.7 0.6 0.2-1.0 0.5 0.2-0.8
Table 154 Cholesterol measurement & DX – Females

Botswana Non-communicable Disease Risk Factor Surveillance - 2014 Page 86
Total cholesterol measurement and diagnosis
Age Group (years)
Both sexes
n % Never
measured 95% CI
% measured,
not diagnosed
95% CI
% diagnosed,
but not within past 12 months
95% CI
% diagnosed within past 12 months
95% CI
15-29 1555 97.4 96.5-98.3 2.4 1.5-3.3 0.1 0.0-0.2 0.1 0.0-0.3
30-44 1346 91.8 88.8-94.7 5.5 3.6-7.3 1.1 0.1-2.1 1.7 0.0-3.6
45-59 833 88.1 84.1-92.1 8.9 5.5-12.3 1.7 0.2-3.2 1.4 0.5-2.2
60-69 321 88.8 82.4-95.1 7.1 2.5-11.7 0.5 0.0-1.3 3.6 0.0-8.2
15-69 4055 94.0 92.7-95.2 4.5 3.5-5.5 0.6 0.2-1.0 0.9 0.3-1.6
Table 155 Cholesterol measurement &Dx – Both
2.4% of 1314 male participants had a total cholesterol measurement and diagnosis while in the females1.1% of 2741 had been diagnosed as having cholesterol within the past 12 months of the study. Amongthe 54 male and female participants diagnosed as having raised total cholesterol, 30.4% of themwerecurrently taking oral medications.
94
4.5 0.6 0.90
102030405060708090
100
Nevermeasured
measured,not
diagnosed
diagnosed,but not
within past12 months
diagnosedwithin past12 months
Per
cen
t
Total Cholesterol Measurement & DiagnosisN=4055
Males
Females
Both
Figure 42Total cholesterol measurement
Currently taking oral treatment (medication) prescribed for raised total cholesterol among those previously diagnosed
Age Group (years)
Men Women Both Sexes
n % taking
meds 95% CI n
% taking meds
95% CI n % taking
meds 95% CI
15-29 2 51.5 0.0-100.0 2 0.0 0.0-0.0 4 39.1 0.0-97.6
30-44 7 51.6 0.0-100.0 11 0.0 0.0-0.0 18 42.4 0.0-86.5
45-59 6 10.6 0.0-34.6 16 16.2 0.0-39.0 22 14.4 0.0-31.3
60-69 3 16.7 0.0-58.9 7 11.7 0.0-35.2 10 15.2 0.0-42.6
15-69 18 40.8 1.0-80.5 36 10.6 0.0-23.8 54 30.4 3.4-57.5
Table 156 Taking treatment for cholesterol

Botswana Non-communicable Disease Risk Factor Surveillance - 2014 Page 87
History of Cardiovascular Diseases
Having ever had a heart attack or chest pain from heart disease or a stroke
Age Group (years)
Men Women Both Sexes
n % CVD history
95% CI n %
CVD history
95% CI n %
CVD history
95% CI
15-29 559 2.1 0.8-3.3 996 6.0 3.6-8.4 1555 3.9 2.6-5.3
30-44 418 6.3 2.1-10.5 928 6.4 4.2-8.5 1346 6.3 3.8-8.8
45-59 248 7.6 3.1-12.1 585 8.3 4.7-11.9 833 8.0 4.8-11.2
60-69 89 6.8 0.0-14.1 232 15.2 6.1-24.2 321 11.4 5.1-17.6
15-69 1314 4.3 2.7-5.8 2741 7.0 5.0-9.0 4055 5.6 4.2-7.0
Table 157 Ever had heart attack - Both
Currently taking aspirin regularly to prevent or treat heart disease
Age Group (years)
Men Women Both Sexes
n % taking aspirin
95% CI n % taking aspirin
95% CI n % taking aspirin
95% CI
15-29 559 0.2 0.0-0.7 996 0.5 0.0-1.2 1555 0.4 0.0-0.8
30-44 418 1.1 0.0-3.0 928 0.9 0.1-1.7 1346 1.0 0.0-2.0
45-59 248 0.9 0.0-1.9 585 2.0 0.2-3.8 833 1.5 0.4-2.6
60-69 89 7.1 0.0-17.0 232 4.3 0.4-8.3 321 5.6 0.7-10.5
15-69 1314 0.9 0.1-1.7 2741 1.1 0.5-1.7 4055 1.0 0.5-1.5
Table 158 Taking Aspirin
Currently taking statins regularly to prevent or treat heart disease
Age Group (years)
Men Women Both Sexes
n % taking statins
95% CI n % taking statins
95% CI n % taking statins
95% CI
15-29 559 0.0 0.0-0.0 996 0.1 0.0-0.4 1555 0.1 0.0-0.2
30-44 418 2.8 0.0-6.4 928 1.6 0.0-3.2 1346 2.2 0.2-4.2
45-59 248 0.6 0.0-1.4 585 1.2 0.0-2.8 833 0.9 0.0-1.8
60-69 89 0.0 0.0-0.0 232 4.0 1.1-6.9 321 2.2 0.6-3.8
15-69 1314 0.9 0.0-2.0 2741 0.9 0.4-1.5 4055 0.9 0.3-1.5
Table 159 Taking Statin
5.6% of 4055 participants had history of Cardiovascular Disease (heart attack or chest pain from heart disease or a stroke) and 1.0% of them were taking Aspirin and 0.9% on Statin regularly.

Botswana Non-communicable Disease Risk Factor Surveillance - 2014 Page 88
Lifestyle Advice
Advised by doctor or health worker to quit using tobacco or don’t start
Age Group (years)
Men Women Both Sexes
n %
advised 95% CI n
% advised
95% CI n %
advised 95% CI
15-29 559 35.6 28.9-42.3 996 35.1 30.2-39.9 1555 35.4 30.8-39.9
30-44 418 34.7 27.2-42.1 928 33.9 29.0-38.8 1346 34.3 29.5-39.0
45-59 248 42.0 33.5-50.5 585 33.6 27.1-40.0 833 37.5 31.9-43.0
60-69 89 33.2 18.6-47.8 232 34.4 26.7-42.1 321 33.9 25.8-41.9
15-69 1314 36.1 31.3-40.9 2741 34.4 30.9-38.0 4055 35.3 31.9-38.6
Table 160 Advised by a health worker on tobacco
Advised by doctor or health worker to reduce salt in the diet
Age Group (years)
Men Women Both Sexes
n %
advised 95% CI n
% advised
95% CI n %
advised 95% CI
15-29 559 30.1 23.8-36.4 996 38.8 34.2-43.4 1555 34.3 30.0-38.5
30-44 418 34.0 26.9-41.2 928 53.4 48.5-58.3 1346 43.5 38.9-48.1
45-59 248 56.2 47.6-64.8 585 63.3 57.5-69.1 833 60.0 54.4-65.7
60-69 89 48.2 35.4-61.1 232 68.9 59.6-78.1 321 59.5 51.8-67.1
15-69 1314 35.6 31.2-40.0 2741 48.6 45.5-51.8 4055 42.0 38.9-45.2
Table 161 advised on salt reduction
Advised by doctor or health worker to eat at least five servings of fruit and/or vegetables each day
Age Group (years)
Men Women Both Sexes
n %
advised 95% CI n
% advised
95% CI n %
advised 95% CI
15-29 559 42.5 36.6-48.4 996 53.8 49.6-58.1 1555 47.9 44.2-51.6
30-44 418 40.2 32.7-47.6 928 60.4 55.8-65.0 1346 50.1 45.4-54.9
45-59 248 57.5 49.4-65.5 585 59.9 54.3-65.5 833 58.8 53.6-64.0
60-69 89 39.7 25.8-53.6 232 62.6 54.8-70.4 321 52.2 43.7-60.8
15-69 1314 43.7 39.3-48.1 2741 57.2 54.1-60.3 4055 50.4 47.4-53.4
Table 162 advised to eat 5 servings of fruits/veg.
Advised by doctor or health worker to reduce fat in the diet
Age Group (years)
Men Women Both Sexes
n %
advised 95% CI n
% advised
95% CI n %
advised 95% CI
15-29 559 36.7 30.8-42.5 996 51.4 46.6-56.1 1555 43.7 39.5-47.8
30-44 418 44.1 36.0-52.2 928 60.9 56.0-65.8 1346 52.3 47.4-57.2
45-59 248 57.7 48.6-66.7 585 72.1 66.1-78.1 833 65.5 59.6-71.3
60-69 89 52.2 39.6-64.8 232 69.1 61.2-76.9 321 61.4 54.1-68.7
15-69 1314 42.3 38.0-46.6 2741 58.4 55.5-61.4 4055 50.3 47.2-53.3
Table 163 Advised to reduce fat

Botswana Non-communicable Disease Risk Factor Surveillance - 2014 Page 89
Advised by doctor or health worker to start or do more physical activity
Age Group (years)
Men Women Both Sexes
n %
advised 95% CI n
% advised
95% CI n %
advised 95% CI
15-29 559 43.6 38.0-49.2 996 48.6 44.3-53.0 1555 46.0 42.2-49.8
30-44 418 50.2 42.2-58.3 928 56.8 52.4-61.2 1346 53.5 48.6-58.3
45-59 248 53.7 44.6-62.9 585 59.0 53.4-64.7 833 56.6 50.8-62.4
60-69 89 44.4 30.9-57.9 232 49.5 40.8-58.3 321 47.2 39.6-54.8
15-69 1314 46.9 42.6-51.2 2741 52.7 49.6-55.8 4055 49.8 46.7-52.9
Table 164 Advised on physical activity
Advised by doctor or health worker to maintain a healthy body weight or to lose weight
Age Group (years)
Men Women Both Sexes
n %
advised 95% CI n
% advised
95% CI n %
advised 95% CI
15-29 559 37.8 31.9-43.6 996 41.9 37.5-46.4 1555 39.8 35.9-43.6
30-44 418 43.9 35.8-52.0 928 51.2 46.5-55.9 1346 47.5 42.5-52.5
45-59 248 45.5 36.1-54.9 585 52.1 45.7-58.6 833 49.1 42.7-55.5
60-69 89 34.9 22.7-47.2 232 43.7 34.5-52.8 321 39.7 31.9-47.5
15-69 1314 40.5 36.2-44.7 2741 46.3 43.1-49.6 4055 43.4 40.3-46.5
Table 165 Advised to reduce weight
0
10
20
30
40
50
60
70
Qu
it usin
gto
ba
cco
Red
uce
salt
Lose
we
ight
Do
ph
ysical
activity
Red
uce
fat
Eat fiv
ese
rvings
fruits/ve
gs
Pe
rce
nt
Advise Given by a Health Workerto Survey Participantsn=Males 1314, Females 2741
Males
Females
Figure 43Advice given by health worker

Botswana Non-communicable Disease Risk Factor Surveillance - 2014 Page 90
Cervical Cancer Screening
Age Group (years)
n % ever tested 95% CI
15-29 971 20.3 17.1-23.4
30-44 914 50.6 45.6-55.6
45-59 576 49.7 43.0-56.4
60-69 226 29.5 21.4-37.5
15-69 2687 34.3 31.7-37.0
Table 166 Cervical screening by age group
Physical Measurements
Mean systolic blood pressure (mmHg)
Age Group (years)
Men Women Both Sexes
n Mean 95% CI n Mean 95% CI n Mean 95% CI
15-29 555 127.7 125.7-129.8 982 117.3 116.2-118.4 1537 122.8 121.5-124.1
30-44 413 129.9 127.4-132.5 921 124.1 122.5-125.7 1334 127.1 125.5-128.6
45-59 245 140.2 135.0-145.4 577 137.1 134.0-140.3 822 138.6 135.6-141.5
60-69 86 145.1 139.3-150.8 228 140.2 135.6-144.8 314 142.4 138.7-146.0
15-69 1299 130.8 129.3-132.3 2708 123.7 122.7-124.8 4007 127.3 126.3-128.3
Table 167 Mean SBP – Both
0
30
60
90
120
150
180
15-29 30-44 45-59 60-69
Me
an
SB
P
Age Group
SBP of Survey ParticipantsN=4007
Males
Females
Figure 44Systolic Blood Pressure
The mean systolic blood pressureand the diastolic blood pressuresin both sexesare directly proportional to the increase of the age groups.

Botswana Non-communicable Disease Risk Factor Surveillance - 2014 Page 91
Mean diastolic blood pressure (mmHg)
Age Group (years)
Men Women Both Sexes
n Mean 95% CI n Mean 95% CI n Mean 95% CI
15-29 555 77.7 76.1-79.3 982 76.4 75.4-77.3 1537 77.1 76.1-78.1
30-44 413 80.9 79.1-82.7 921 81.6 80.3-82.8 1334 81.2 80.1-82.4
45-59 245 85.3 82.7-87.9 577 85.3 83.2-87.4 822 85.3 83.6-87.0
60-69 86 84.2 80.6-87.7 228 83.9 81.9-86.0 314 84.0 82.1-86.0
15-69 1299 80.0 78.9-81.0 2708 79.7 78.9-80.5 4007 79.8 79.1-80.6
Table 168 Mean DBP
70
72
74
76
78
80
82
84
86
15-29 30-44 45-59 60-69
Mea
n D
BP
Age Group
DBP of Survey ParticipantsN=4007
Males
Females
Figure 45Diastolic Blood Pressure
SBP ≥140 and/or DBP ≥ 90 mmHg, excluding those on medication for raised blood pressure
Age Group (years)
Men Women Both Sexes
n % 95% CI n % 95% CI n % 95% CI
15-29 550 22.2 17.9-26.5 964 11.6 8.8-14.5 1514 17.2 14.5-19.9
30-44 401 28.8 22.2-35.3 844 24.4 20.2-28.5 1245 26.7 22.6-30.7
45-59 204 41.1 31.1-51.0 432 42.8 35.6-49.9 636 41.9 35.7-48.2
60-69 67 42.7 27.8-57.7 138 48.5 34.6-62.4 205 45.8 35.1-56.6
15-69 1222 27.1 23.8-30.3 2378 21.0 18.8-23.2 3600 24.2 22.0-26.3
Table 169 SBP>140 & DBP>90 excluding on medication
Excluding those who were on medication for raised blood pressure, out of 3600 survey participants, 24.2% of them had systolic blood pressure of greater or equal to 140mmHg and/or diastolic blood pressure of greater or equal to 90mmHg and was higher in males. Out of 4007participants with SBP≥140 and or DBP≥90mmHg or currently on medication for raised blood pressure were 29.4%, and excluding those on medications, 7.3% of 3600 participants had a SBP≥160 and or DBP≥100.

Botswana Non-communicable Disease Risk Factor Surveillance - 2014 Page 92
SBP ≥140 and/or DBP ≥ 90 mmHg or currently on medication for raised blood pressure
Age Group (years)
Men Women Both Sexes
n % 95% CI n % 95% CI n % 95% CI
15-29 555 22.9 18.6-27.2 982 13.6 10.6-16.6 1537 18.5 15.7-21.2
30-44 413 30.8 24.2-37.4 921 31.0 26.2-35.9 1334 30.9 26.6-35.3
45-59 245 50.0 41.0-58.9 577 56.4 49.7-63.2 822 53.4 47.7-59.2
60-69 86 59.5 46.0-73.1 228 65.5 54.1-76.9 314 62.8 53.8-71.9
15-69 1299 30.4 27.2-33.7 2708 28.4 25.9-30.8 4007 29.4 27.3-31.6
Table 170 SBP≥140 and/orDBP≥90 on medication
0
5
10
15
20
25
30
35
SBP ≥(140 / 90 mmHg) currently on medication
N=3600
SBP ≥(140 / 90 mmHg) excluding those on medication N=4007
Pe
rce
nt
Participants of the STEPS survey whose SBP was ≥140mmHg and/or DBP≥90mmHg
Men
Women
Both Sexes
Figure 46SBP≥140 and/orDBP≥90 mmHg
SBP ≥160 and/or DBP ≥ 100 mmHg, excluding those on medication for raised blood pressure
Age Group (years)
Men Women Both Sexes
n % 95% CI n % 95% CI n % 95% CI
15-29 550 4.0 1.6-6.4 964 1.4 0.6-2.2 1514 2.8 1.4-4.1
30-44 401 9.3 5.5-13.1 844 7.4 5.3-9.6 1245 8.4 6.2-10.6
45-59 204 20.2 11.1-29.3 432 16.8 12.0-21.6 636 18.5 13.5-23.5
60-69 67 28.2 13.7-42.7 138 25.6 14.9-36.3 205 26.8 18.2-35.4
15-69 1222 8.3 6.2-10.4 2378 6.2 5.1-7.3 3600 7.3 6.1-8.5
Table 171 SBP≥160 and/or DBP≥100 excluding medication
SBP ≥160 and/or DBP ≥ 100 mmHg or currently on medication for raised blood pressure
Age Group (years)
Men Women Both Sexes
n % 95% CI n % 95% CI n % 95% CI
15-29 555 4.8 2.2-7.4 982 3.6 2.1-5.2 1537 4.3 2.7-5.8
30-44 413 11.8 7.7-15.9 921 15.6 12.3-18.9 1334 13.7 11.1-16.2
45-59 245 32.2 23.6-40.8 577 36.7 30.8-42.6 822 34.6 29.8-39.4
60-69 86 49.3 34.9-63.7 228 50.2 39.7-60.6 314 49.8 41.9-57.7
15-69 1299 12.5 10.2-14.8 2708 15.0 13.3-16.7 4007 13.7 12.3-15.2
Table 172SBP≥160 and/orDBP≥100 excluding medication
Out of 4007 participants 13.7% were with aSBP ≥160 and/or DBP ≥ 100 mmHg or currently on medication for raised blood pressure.

Botswana Non-communicable Disease Risk Factor Surveillance - 2014 Page 93
Respondents with treated and/or controlled raised blood pressure
Age Group (years)
Men
n
% On medication
and SBP<140
and DBP<90
95% CI
% On medication and
SBP≥140 and/orDBP≥90
95% CI
% Not on medication
and SBP≥140 and/orDBP≥90
95% CI
15-29 123 1.6 0.0-3.8 2.4 0.0-5.7 96.0 92.1-100.0
30-44 125 4.8 0.0-10.4 4.4 0.7-8.0 90.8 84.3-97.3
45-59 121 10.3 2.8-17.8 19.8 11.5-28.1 69.9 59.4-80.3
60-69 46 16.2 0.0-34.0 33.1 15.1-51.2 50.7 31.7-69.8
15-69 415 5.7 2.7-8.8 9.5 6.3-12.6 84.8 80.7-88.9
Table 173 Treated or controlled raised BP - Males
Respondents with treated and/or controlled raised blood pressure
Age Group (years)
Women
n
% On medication
and SBP<140
and DBP<90
95% CI
% On medication and
SBP≥140 and/orDBP≥90
95% CI
% Not on medication
and SBP≥140 and/orDBP≥90
95% CI
15-29 130 8.7 2.3-15.1 7.7 2.0-13.4 83.6 74.9-92.3
30-44 293 10.4 6.3-14.6 18.1 10.7-25.4 71.5 64.3-78.7
45-59 350 19.0 13.8-24.3 23.3 16.8-29.9 57.6 50.7-64.6
60-69 159 26.6 17.9-35.3 23.8 15.5-32.1 49.6 39.2-60.1
15-69 932 14.8 11.9-17.8 18.0 14.5-21.6 67.1 63.0-71.3
Table 174 Treated or controlled BP - Females
Respondents with treated and/or controlled raised blood pressure
Age Group (years)
Both Sexes
n
% On medication
and SBP<140
and DBP<90
95% CI
% On medication and
SBP≥140 and/orDBP≥90
95% CI
% Not on medication and
SBP≥140 and/orDBP≥90
95% CI
15-29 253 4.1 1.4-6.8 4.2 1.3-7.2 91.7 87.7-95.7
30-44 418 7.6 4.0-11.2 11.1 6.9-15.3 81.3 76.5-86.2
45-59 471 15.3 11.0-19.5 21.8 16.9-26.8 62.9 57.1-68.8
60-69 205 22.2 13.1-31.3 27.8 19.4-36.2 50.1 41.0-59.2
15-69 1347 10.1 7.9-12.2 13.5 11.1-15.9 76.4 73.4-79.4
Table 175 Treated or controlled raised BP - Both

Botswana Non-communicable Disease Risk Factor Surveillance - 2014 Page 94
0
10
20
30
40
50
60
70
80
90
On medication &SBP<140 and
DBP<90
On medication & SBP≥140 and/or
DBP≥90
Not on medication & SBP≥140 and/or
DBP≥90
Pe
rce
nt
Respondents with treated and/or controlled raised BP
N=1347
Males
Females
Both
Figure 47Treated and or controlled raised BP
Mean heart rate (beats per minute)
Age Group (years)
Men Women Both Sexes
n mean 95% CI n mean 95% CI n mean 95% CI
15-29 555 70.5 69.1-72.0 983 82.7 81.7-83.7 1538 76.3 75.3-77.3
30-44 413 73.4 71.4-75.5 922 79.7 78.6-80.7 1335 76.5 75.3-77.6
45-59 245 73.8 71.6-76.1 578 80.4 77.7-83.1 823 77.4 75.7-79.1
60-69 86 72.0 68.8-75.1 228 75.6 73.5-77.8 314 74.0 72.0-75.9
15-69 1299 71.9 70.8-72.9 2711 81.1 80.3-81.8 4010 76.4 75.7-77.1
Table 176 Mean Heart Rate – Both
The mean heart rate was 76.4, beats/minute in both sexes, and yet it was higher in the females.
Mean height (cm)
Age Group (years)
Men Women
n Mean 95% CI n Mean 95% CI
15-29 554 171.2 170.3-172.1 931 160.5 159.9-161.2
30-44 412 171.1 170.0-172.3 882 161.3 160.4-162.1
45-59 246 170.3 169.1-171.5 574 161.7 158.8-164.7
60-69 87 168.8 166.9-170.7 224 159.1 157.5-160.6
15-69 1299 170.9 170.3-171.6 2611 160.9 160.2-161.5
Table 177 Mean Height

Botswana Non-communicable Disease Risk Factor Surveillance - 2014 Page 95
150
155
160
165
170
175
15-29 30-44 45-59 60-69
He
igh
t in
Ce
nti
mtr
es
Age Group
Mean Height of Participants in Centimetres by Age & Sex Groups
Males
Females
Figure 48Mean height
Mean weight (kg)
Age Group (years)
Men Women
n Mean 95% CI n Mean 95% CI
15-29 554 60.5 59.3-61.7 930 58.7 57.5-59.8
30-44 412 66.9 65.0-68.8 881 69.3 67.6-71.0
45-59 245 67.5 64.9-70.1 571 70.4 67.6-73.1
60-69 87 67.9 64.1-71.8 224 69.3 66.9-71.6
15-69 1298 63.6 62.6-64.6 2606 64.3 63.3-65.3
Table 178 Mean Weight
50
55
60
65
70
75
15-29 30-44 45-59 60-69
We
igh
t in
Kg
Mean Weight of Participants by Age & Sex Groups
Males
Females
Figure 49Mean weight

Botswana Non-communicable Disease Risk Factor Surveillance - 2014 Page 96
Mean BMI (kg/m2)
Age Group (years)
Men Women Both Sexes
n Mean 95% CI n Mean 95% CI n Mean 95% CI
15-29 548 20.7 20.3-21.1 924 22.9 22.4-23.3 1472 21.7 21.4-22.0
30-44 411 22.9 22.3-23.5 876 26.7 26.1-27.3 1287 24.7 24.2-25.2
45-59 245 23.3 22.4-24.1 569 27.3 26.3-28.4 814 25.4 24.7-26.2
60-69 86 23.9 22.7-25.0 222 27.3 26.4-28.1 308 25.7 24.9-26.5
15-69 1290 21.8 21.5-22.1 2591 25.0 24.6-25.3 3881 23.3 23.1-23.6
Table 179 Mean BMI
BMI classifications
Age Group (years)
Men
n
% Under-weight <18.5
95% CI
% Normal weight
18.5-24.9
95% CI %
Over weight 25.0-29.9
95% CI %
Obese ≥30.0
95% CI
15-29 548 23.0 17.7-28.4 66.0 60.5-71.5 8.1 5.6-10.7 2.9 1.1-4.7
30-44 411 13.2 7.9-18.6 59.8 52.6-67.1 20.0 14.5-25.5 6.9 3.7-10.1
45-59 245 16.3 10.0-22.6 49.3 41.1-57.6 26.0 17.6-34.3 8.4 3.9-12.9
60-69 86 15.4 5.3-25.6 50.1 36.1-64.1 24.1 13.5-34.8 10.4 2.9-17.8
15-69 1290 18.9 15.7-22.2 61.3 57.5-65.0 14.7 12.2-17.1 5.1 3.6-6.6
Table 180 BMI classification - Males
BMI classifications
Age Group (years)
Women
n % Under-
weight <18.5
95% CI % Normal
weight 18.5-24.9
95% CI % BMI
25.0-29.9 95% CI
% Obese ≥30.0
95% CI
15-29 924 12.0 9.2-14.8 61.1 56.8-65.3 17.3 14.2-20.3 9.7 7.2-12.2
30-44 876 5.1 3.3-6.9 40.7 36.2-45.1 28.0 23.7-32.2 26.3 22.0-30.5
45-59 569 8.9 2.6-15.3 32.8 26.3-39.3 26.3 20.9-31.7 32.0 26.0-38.0
60-69 222 5.1 0.7-9.5 29.1 21.7-36.5 40.4 31.4-49.5 25.4 16.2-34.6
15-69 2591 9.1 7.3-10.9 48.7 45.9-51.4 23.2 21.0-25.4 19.1 16.9-21.2
Table 181 BMI classification – Females
BMI classifications
Age Group (years)
Both Sexes
n % Under-
weight <18.5
95% CI % Normal
weight 18.5-24.9
95% CI % BMI
25.0-29.9 95% CI
% Obese ≥30.0
95% CI
15-29 1472 18.0 14.6-21.3 63.7 60.1-67.4 12.3 10.3-14.3 6.0 4.5-7.5
30-44 1287 9.4 6.4-12.3 50.7 46.2-55.2 23.8 20.3-27.3 16.1 13.3-18.9
45-59 814 12.4 7.1-17.7 40.5 34.8-46.2 26.1 21.1-31.2 21.0 16.8-25.2
60-69 308 9.8 4.8-14.9 38.7 30.4-47.0 33.0 26.0-40.0 18.5 12.0-25.0
15-69 3881 14.2 12.2-16.2 55.2 52.8-57.7 18.8 17.1-20.4 11.8 10.5-13.1
Table 182 BMI classification - Both

Botswana Non-communicable Disease Risk Factor Surveillance - 2014 Page 97
0
10
20
30
40
50
60
70
Under-weight(<18.5)
Normal weight(18.5-24.9)
Over weight(25.0-29.9)
Obese(>30.0)
Pe
rce
nt
BMI in Kg/mt2
Body Mass Index of Participants
N=3881
Males
Females
Both
Figure 50BMI
BMI≥25
Age Group (years)
Men Women Both Sexes
n %
BMI≥25 95% CI n
% BMI≥25
95% CI n %
BMI≥25 95% CI
15-29 548 11.0 8.0-14.0 924 27.0 23.0-30.9 1472 18.3 15.8-20.9
30-44 411 26.9 20.6-33.2 876 54.2 49.5-58.9 1287 39.9 35.5-44.3
45-59 245 34.4 25.9-42.8 569 58.3 51.1-65.5 814 47.1 41.4-52.8
60-69 86 34.5 23.1-45.8 222 65.8 58.8-72.8 308 51.5 44.4-58.5
15-69 1290 19.8 17.0-22.6 2591 42.2 39.5-45.0 3881 30.6 28.5-32.7
Table 183 BMI Greater than 25
Waist circumference (cm)
Age Group (years)
Men Women
n Mean 95% CI n Mean 95% CI
15-29 550 73.5 71.6-75.4 930 76.8 75.3-78.2
30-44 412 81.0 78.4-83.6 881 86.7 84.9-88.5
45-59 244 84.1 81.1-87.2 572 90.3 87.7-92.8
60-69 87 89.4 86.2-92.6 222 91.3 88.3-94.4
15-69 1293 77.8 76.2-79.4 2605 82.7 81.4-84.0
Table 184 Waist circumference
Hip circumference (cm)
Age Group (years)
Men Women
n Mean 95% CI n Mean 95% CI
15-29 550 91.7 90.6-92.7 927 99.2 97.9-100.4
30-44 412 95.7 94.0-97.4 881 106.7 105.5-107.8
45-59 244 95.6 93.6-97.5 572 105.9 103.6-108.3
60-69 87 98.1 95.9-100.2 222 104.6 102.4-106.9
15-69 1293 93.7 92.8-94.5 2602 102.8 101.9-103.7
Table 185 Hip circumference

Botswana Non-communicable Disease Risk Factor Surveillance - 2014 Page 98
Mean waist / hip ratio
Age Group (years)
Men Women
n Mean 95% CI n Mean 95% CI
15-29 550 0.8 0.8-0.8 927 0.8 0.8-0.8
30-44 412 0.8 0.8-0.9 881 0.8 0.8-0.8
45-59 244 0.9 0.9-0.9 572 0.9 0.8-0.9
60-69 87 0.9 0.9-0.9 222 0.9 0.8-0.9
15-69 1293 0.8 0.8-0.8 2602 0.8 0.8-0.8
Table 186 Mean Waist/Hip ratio
Summary of Physical Biometrics
The mean height for males was 171 centimetres and that of females was 161 centimetres.
The mean weight of males was 63.6kg while that of females was 64.3kg
The mean BMI for males was 21.0kg/m2 while for females it was25.0kg/m2
The waist Circumference for males was- 77.8 centimetres
The waist Circumference for females was - 82.7 centimetres
Hip circumference for males 93.7 centimetres
Hip circumference for females 102.8 centimetres
The Waist/Hip ratio for both males and females was 0.8

Botswana Non-communicable Disease Risk Factor Surveillance - 2014 Page 99
Biochemical Measurements
Mean fasting blood glucose (mmol/L)
Age Group (years)
Men Women Both Sexes
n Mean 95% CI n Mean 95% CI n Mean 95% CI
15-29 478 4.2 4.1-4.3 844 4.3 4.2-4.4 1322 4.2 4.1-4.3
30-44 350 4.5 4.3-4.7 790 4.5 4.4-4.7 1140 4.5 4.4-4.6
45-59 209 4.7 4.4-5.0 513 4.9 4.7-5.0 722 4.8 4.6-5.0
60-69 72 5.4 4.7-6.0 200 5.1 4.7-5.4 272 5.2 4.9-5.6
15-69 1109 4.4 4.3-4.5 2347 4.5 4.4-4.6 3456 4.4 4.4-4.5
Table 187 Mean FBG
The mean fasting blood glucose was the same both in males and females (4.4mmol/L).
Fasting Blood Glucose
Impaired Fasting Glycaemia*
Age Group (years)
Men Women Both Sexes
n % 95% CI n % 95% CI n % 95% CI
15-29 478 2.4 0.7-4.2 844 1.8 0.8-2.9 1322 2.1 1.1-3.2
30-44 350 2.7 0.8-4.6 790 3.7 2.0-5.4 1140 3.2 1.9-4.4
45-59 209 7.4 2.5-12.3 513 7.2 3.4-11.1 722 7.3 4.3-10.3
60-69 72 4.6 0.0-10.5 200 5.9 2.4-9.5 272 5.3 1.8-8.7
15-69 1109 3.3 1.9-4.6 2347 3.4 2.4-4.5 3456 3.4 2.5-4.2
Table 188 Impaired Fasting Glycaemia
Raised blood glucose or currently on medication for diabetes**
Age Group (years)
Men Women Both Sexes
n % 95% CI n % 95% CI n % 95% CI
15-29 478 0.8 0.1-1.6 844 1.4 0.1-2.8 1322 1.1 0.4-1.9
30-44 350 0.9 0.0-1.7 790 2.7 1.0-4.4 1140 1.8 0.8-2.7
45-59 209 6.0 1.3-10.8 513 5.4 3.2-7.7 722 5.7 3.2-8.2
60-69 72 12.5 0.1-24.8 200 9.6 4.9-14.4 272 11.0 4.6-17.4
15-69 1109 2.1 1.0-3.1 2347 2.9 2.0-3.8 3456 2.5 1.8-3.2
Table 189 Raised blood glucose on medication
Currently on medication for diabetes
Age Group (years)
Men Women Both Sexes
n % 95% CI n % 95% CI n % 95% CI
15-29 562 0.0 0.0-0.0 1003 0.2 0.0-0.5 1565 0.1 0.0-0.2
30-44 420 1.5 0.0-3.4 930 0.4 0.0-0.9 1350 0.9 0.0-2.0
45-59 248 2.7 0.9-4.6 586 3.4 1.9-5.0 834 3.1 1.9-4.3
60-69 89 12.1 1.1-23.1 232 7.8 3.3-12.4 321 9.8 4.1-15.6
15-69 1319 1.4 0.5-2.2 2751 1.2 0.8-1.6 4070 1.3 0.8-1.8
Table 190 Currently on medication

Botswana Non-communicable Disease Risk Factor Surveillance - 2014 Page 100
Mean total cholesterol (mmol/L)
Age Group (years)
Men Women Both Sexes
n Mean 95% CI n Mean 95% CI n Mean 95% CI
15-29 466 3.2 3.1-3.3 843 3.4 3.4-3.5 1309 3.3 3.2-3.4
30-44 357 3.8 3.6-4.0 797 3.8 3.7-3.9 1154 3.8 3.7-3.9
45-59 217 4.0 3.8-4.2 513 4.2 4.1-4.4 730 4.1 4.0-4.3
60-69 73 4.1 3.8-4.4 202 4.4 4.1-4.6 275 4.2 4.1-4.4
15-69 1113 3.5 3.4-3.6 2355 3.7 3.7-3.8 3468 3.6 3.6-3.7
Table 191 Mean total cholesterol
Total cholesterol ≥ 5.0 mmol/L or ≥ 190 mg/dl or currently on medication for raised cholesterol
Age Group (years)
Men Women Both Sexes
n % 95% CI n % 95% CI n % 95% CI
15-29 466 4.6 2.2-7.0 843 5.4 3.3-7.4 1309 5.0 3.4-6.5
30-44 357 16.0 9.1-22.9 797 12.6 9.4-15.7 1154 14.4 10.3-18.4
45-59 217 18.6 11.7-25.4 513 19.8 14.5-25.2 730 19.3 14.8-23.7
60-69 73 30.2 15.6-44.8 202 26.9 17.7-36.1 275 28.5 19.3-37.7
15-69 1113 11.2 8.5-13.9 2355 10.9 9.2-12.6 3468 11.0 9.4-12.7
Table 192 Cholesterol >5.0mmol/L on medication
Total cholesterol ≥ 6.2 mmol/L or ≥ 240 mg/dl or currently on medication for raised cholesterol
Age Group (years)
Men Women Both Sexes
n % 95% CI n % 95% CI n % 95% CI
15-29 466 0.6 0.0-1.3 843 0.6 0.1-1.0 1309 0.6 0.2-1.0
30-44 357 5.8 1.1-10.5 797 3.6 2.0-5.2 1154 4.7 2.1-7.4
45-59 217 7.2 2.7-11.7 513 6.2 3.3-9.2 730 6.7 3.7-9.7
60-69 73 8.0 0.0-19.0 202 5.7 2.4-9.0 275 6.8 1.2-12.4
15-69 1113 3.4 1.7-5.1 2355 2.6 1.9-3.4 3468 3.0 2.0-4.0
Table 193 Cholesterol >6.2mmol/l on medication
Mean HDL (mmol/L)
Age Group (years)
Men Women Both Sexes
n Mean 95% CI n Mean 95% CI n Mean 95% CI
15-29 485 1.2 1.1-1.2 863 1.4 1.4-1.4 1348 1.3 1.3-1.3
30-44 361 1.3 1.2-1.4 806 1.4 1.4-1.5 1167 1.4 1.3-1.4
45-59 220 1.3 1.2-1.4 517 1.4 1.4-1.5 737 1.4 1.3-1.4
60-69 73 1.3 1.2-1.5 202 1.4 1.3-1.5 275 1.4 1.3-1.5
15-69 1139 1.2 1.2-1.3 2388 1.4 1.4-1.4 3527 1.3 1.3-1.4
Table 194 Mean HDL
* Impaired fasting glycaemia is defined as either Plasma venous value: ≥6.1mmol/L (110mg/dl) and <7.0mmol/L (126mg/dl)
Capillary whole blood value: ≥5.6mmol/L (100mg/dl) and <6.1mmol/L (110mg/dl) ** Raised blood glucose is defined as either
Plasma venous value: ≥ 7.0 mmol/L (126 mg/dl) Capillary whole blood value: ≥ 6.1 mmol/L (110 mg/dl)

Botswana Non-communicable Disease Risk Factor Surveillance - 2014 Page 101
Table 195 Percentage of respondents with HDL
Mean FBGImpaired Fasting
Glycaemia
Raised FBG or on
medicationCurrently on medication Mean total cholesterol Mean HDL
Males 4.4 3.3 2.1 1.4 3.5 1.2
Females 4.5 3.4 2.9 1.2 3.7 1.4
0
0.5
1
1.5
2
2.5
3
3.5
4
4.5
5
Mm
ol/
L
Blood Test of Participants for Glucose & LipidsSTEPS Survey 2014
Figure 51Blood test for glucose & lipids
Percentage of respondents with HDL <1.03mmol/L or <40 mg/dl
Percentage of respondents with HDL <1.29mmol/L or <50 mg/dl
Age Group (years)
Men Women
n % 95% CI n % 95% CI 15-29 485 38.3 31.8-44.7 863 45.6 41.2-49.9 30-44 361 38.6 30.3-46.9 806 44.6 39.5-49.8 45-59 220 32.6 24.3-41.0 517 41.9 36.0-47.8 60-69 73 34.2 19.4-49.0 202 56.1 46.2-66.0 15-69 1139 37.4 32.9-41.9 2388 45.3 42.2-48.4

Botswana Non-communicable Disease Risk Factor Surveillance - 2014 Page 102
Cardiovascular disease risk
Percentage of respondents with a 10-year CVD risk ≥30% or with existing CVD
Age Group (years)
Men Women Both Sexes
n % 95% CI n % 95% CI n % 95% CI
40-54 245 6.1 2.1-10.1
540 9.0 5.5-12.5
785 7.5 4.9-10.2
55-69 129 16.2 7.0-25.5
358 12.1 5.5-18.7
487 14.0 8.3-19.7
40-69 374 9.3 5.2-13.5
898 10.1 6.7-13.4
1272 9.7 6.9-12.6
Table 196 CVD risk>30%
Percentage of eligible persons receiving drug therapy and counselling to prevent heart attacks and strokes
Age Group (years)
Men Women Both Sexes
n % 95% CI n % 95% CI n % 95% CI
40-54 14 9.1 0.0-20.3 43 24.2 4.9-43.5 57 18.1 5.0-31.3
55-69 19 32.6 11.2-54.0
33 39.4
11.2-67.7
52 35.7 20.2-51.2
40-69 33 22.2 7.9-36.5
76 30.5 16.0-45.1
109 26.6 16.2-37.0
Table 197 Eligible persons receiving therapy
Summary of Combined Risk Factors
Percentage of respondents with 0, 1-2, or 3-5 of the following risk factors:
Risk factors:
1. Current daily smoking 2. Less than five servings of fruit and/or vegetables per day 3. Not meeting WHO recommendations on physical activity for health (<150 minutes
of moderate activity per week, or equivalent) 4. Overweight or obese (BMI ≥ 25 kg/m2) 5. Raised BP (SBP ≥ 140 and/or DBP ≥ 90 mmHg or currently on medication for raised
BP).
**Counselling is defined as receiving advice from a doctor or other health worker to quit using tobacco or not start, reduce salt in diet, eat at least five servings of fruit and/or vegetables per day, reduce fat in diet, start or do more physical activity, maintain a healthy body weight or lose weight.
* A 10-year CVD risk of ≥30% is defined according to age, sex, blood pressure, smoking status (current smokers OR those who quit smoking less than 1 year before the assessment), total cholesterol, and diabetes (previously diagnosed OR a fasting plasma glucose concentration >7.0 mmol/l (126 mg/dl)).

Botswana Non-communicable Disease Risk Factor Surveillance - 2014 Page 103
Summary of Combined Risk Factors
Age Group (years)
Men
n
%with 0 Risk factors
95% CI
% with 1-2 risk factors
95% CI % with 3-5 risk factors
95% CI
18-44 738 1.0 0.2-1.9 80.0 75.8-84.2 19.0 14.9-23.0
45-69 275 1.7 0.0-3.6 55.0 46.8-63.1 43.3 35.1-51.6
15-69 1013 1.1 0.4-1.9 75.1 71.1-79.1 23.7 19.8-27.6
Table 198 Summary of combined risk factors – Males
Figure 52 Risk factors in males
Summary of Combined Risk Factors
Age Group (years)
Women
n % with 0 risk
factors 95% CI
% with 1-2 risk factors
95% CI % with 3-5 risk factors
95% CI
18-44 1459 1.7 0.8-2.5 77.8 74.6-81.1 20.5 17.5-23.5
45-69 645 0.2 0.0-0.4 47.5 40.9-54.1 52.3 45.8-58.9
15-69 2104 1.3 0.7-2.0 70.9 67.8-74.0 27.8 24.9-30.8
Table 199 Summary of combined risk factors - Females
0
10
20
30
40
50
60
70
80
0 1-2 3-5
Per
cen
t
Number of Risk Factors
Percentage of risk facors in males N=1013

Botswana Non-communicable Disease Risk Factor Surveillance - 2014 Page 104
Figure 53 Risk factors in females
Summary of Combined Risk Factors
Age Group (years)
Both Sexes
n % with
0 risk factors 95% CI
% with 1-2 risk factors
95% CI % with 3-5 risk factors
95% CI
18-44 2197 1.3 0.7-1.9 79.0 76.0-82.0 19.7 16.9-22.5
45-69 920 0.9 0.0-1.8 51.0 45.5-56.5 48.1 42.6-53.6
15-69 3117 1.2 0.7-1.7 73.1 70.3-75.8 25.7 23.1-28.3
Table 200 Summary of combined risk factors – Both
Figure 54 Risk factors - Both sexes
0
20
40
60
80
0 1-2 3-5
Per
cen
t
Number of Risk Factors
Percentage of Risk factors in females N=2104
0
10
20
30
40
50
60
70
80
0 1-2 3-5
Per
cen
t
Number of Risk Factors
Percentage of Risk Factors in Both Sexes of participants
N=3117

Botswana Non-communicable Disease Risk Factor Surveillance - 2014 Page 105

Botswana Non-communicable Disease Risk Factor Surveillance - 2014 Page 106
GENERAL RECOMMENDATIONS
1. STEPS survey has found significant burden. To address the burden:
Allocation of appropriate budget and resources
Fully integrate NCD prevention activities across all health facilities and other
sectors
Expand vigorously health promotion and education activities to create awareness
in the population to address diseases and risk factors that contribute to
morbidity and premature mortality rates (alcohol, tobacco, unhealthy diet etc.)
Encourage communities for physical activities, consumption of fruits and
vegetables
2. Improve resources for survey operations: transport, equipment, reagents etc. and NCD
interventions
3. Conduct STEPS survey every 4 years
4. Future STEPS survey should:
Include adolescents/kids
Avail adequate resources
Disseminate results systematically and widely to the public
5. Build local capacity on data analysis, report writing and use of data in policy impacting
and research

Botswana Non-communicable Disease Risk Factor Surveillance - 2014 Page 107
FACT SHEET – Behavioural & Measurements (a)
BOTSWANA STEPS Survey 2014 Fact Sheet
The STEPS survey of Non-Communicable Disease (NCD) risk factors survey on Step 1, Step 2 and Step 3 was conducted in Botswana in 26 districts from the 14
th July2014 to 30
th August 2014. Socio demographic and behavioural information was
collected in Step 1. Physical measurements such as height, weight and blood pressure were collected in Step 2, and Biochemical measurements were collected to assess blood glucose and cholesterol levels in Step 3. The survey was a population-based survey aged 15-69. A Cross-sectional exploratory survey was used to produce representative data for 15-69 age groups from systematically sampled enumeration areas of the districts. A total of 4074 individuals participated in the survey. The overall response rate was 64%. A repeat survey is planned for 2020 if funds permit.
Results of participants aged 15-69 years (incl. 95% CI) Both Sexes Males Female
s
Step 1 Tobacco Use
Percentage who currently smoke tobacco 18.3%
(15.9-20.7) 31.4%
(27.5-35.3)
4.9% (3.5-6.2)
Percentage who currently smoke tobacco daily 14.6%
(12.4-16.8) 25.4%
(21.9-29.0)
3.5% (2.4-4.6)
For those who smoke tobacco daily
Average age started smoking (years) 22.0
(20.8-23.2) 21.2
(20.2-22.1)
28.5 (22.2-34.9)
Percentage of daily smokers smoking manufactured cigarettes 82.0%
(76.2-87.8) 87.0%
(81.1-92.9)
44.2% (26.7-61.7)
Mean number of manufactured cigarettes smoked per day (by smokers of manufactured cigarettes)
5.1 (4.3-5.9)
5.5 (4.7-6.4)
1.8 (1.0-2.6)
Step 1 Alcohol Consumption
Percentage who are lifetime abstainers 53.4%
(50.8-56.0) 40.9%
(37.0-44.8)
66.3% (63.2-69.3)
Percentage who are past 12 month abstainers 12.0%
(10.3-13.7) 10.7%
(8.4-12.9)
13.4% (11.4-15.4)
Percentage who currently drink (drank alcohol in the past 30 days) 26.4%
(24.0-28.8) 39.6%
(35.5-43.7)
12.9% (10.8-15.0)
Percentage who engage in heavy episodic drinking (6 or more drinks on any occasion in the past 30 days)
18.5% (16.3-20.7)
28.3% (24.4-32.2)
8.5% (6.6-10.3)
Step 1 Fruit and Vegetable Consumption (in a typical week)
Mean number of days fruit consumed 3.1
(2.9-3.2) 2.9
(2.7-3.1)
3.2 (3.1-3.4)
Mean number of servings of fruit consumed on average per day 0.8
(0.7-0.9) 0.8
(0.6-1.0)
0.9 (0.8-1.0)
Mean number of days vegetables consumed 4.0
(3.9-4.2) 3.9
(3.6-4.1)
4.2 (4.0-4.4)
Mean number of servings of vegetables consumed on average per day 1.1
(1.0-1.2) 1.1
(0.9-1.3)
1.1 (1.0-1.2)

Botswana Non-communicable Disease Risk Factor Surveillance - 2014 Page 108
Percentage who ate less than 5 servings of fruit and/or vegetables on average per day
94.8% (93.4-96.1)
95.8% (93.9-97.6)
93.8% (92.2-95.4)
Step 1 Physical Activity
Percentage with insufficient physical activity (defined as < 150 minutes of moderate-intensity activity per week, or equivalent)*
20.1% (17.4-22.7)
14.3% (11.3-17.3)
25.9% (22.7-29.2)
Median time spent in physical activity on average per day (minutes) (presented with inter-quartile range)
85.7 (28.6-225.7)
108.6 (38.6-300.0)
60.0 (17.1-158.6)
Percentage not engaging in vigorous activity 57.3%
(53.9-60.7) 42.7%
(37.6-47.8)
72.3% (69.0-75.6)
Step 1 Cervical Cancer Screening
Percentage of women aged 30-49 years who ever had a screening test for cervical cancer
50.7% (45.7-55.6)
BOTSWANA STEPS Survey 2014 Fact Sheet
Results of participants aged 15-69 years (incl. 95% CI) Both Sexes Males
Females
Step 2 Physical Measurements
Mean body mass index - BMI (kg/m2)
23.3 (23.1-23.6)
21.8 (21.5-22.1)
25.0 (24.6-25.3)
Percentage who are Overweight (BMI ≥ 25.0 - 29.9 kg/m2)
18.8% (17.1-20.4)
14.7% (12.2-17.1)
23.2% (21.0-25.4)

Botswana Non-communicable Disease Risk Factor Surveillance - 2014 Page 109
Percentage who are Overweight + Obese (BMI ≥ 25.0 kg/m2)
30.6 28.5-32.7
19.8 17.0-22.6
42.3 39.5-45.0
Percentage who are Obese (BMI ≥ 30 kg/m2)
11.8% (10.5-13.1)
5.1% (3.6-6.6)
19.1% (16.9-21.2)
Average waist circumference (cm) 77.8
(76.2-79.4)
82.7 (81.4-84.0)
Mean systolic blood pressure - SBP (mmHg), including those currently on medication for raised BP
127.3 (126.3-128.3)
130.8 (129.3-132.3)
123.7 (122.7-124.

Botswana Non-communicable Disease Risk Factor Surveillance - 2014 Page 110
8)
Mean diastolic blood pressure - DBP (mmHg), including those currently on medication for raised BP
79.8 (79.1-80.6)
80.0 (78.9-81.0)
79.7 (78.9-80.5)
Percentage with raised BP (SBP ≥ 140 and/or DBP ≥ 90 mmHg or currently on medication for raised BP)
29.4% (27.3-31.6)
30.4% (27.2-33.7)
28.4% (25.9-30.8)
Percentage with raised BP (SBP ≥ 140 and/or DBP ≥ 90 mmHg) who are not currently on medication for raised BP
76.4% (73.4-79.4)
84.8% (80.7-88.9)
67.1% (63.0-71.3)
Step 3 Biochemical Measurement
Mean fasting blood glucose, including those currently on medication for raised blood glucose: mmol/L
4.4 (4.4-4.5)
4.4 (4.3-4.5)
4.5 (4.4

Botswana Non-communicable Disease Risk Factor Surveillance - 2014 Page 111
-4.6)
Percentage with impaired fasting glycaemia as defined below
capillary whole blood value ≥5.6 mmol/L (100 mg/dl) and <6.1 mmol/L (110 mg/dl)
4.5% (3.3-5.7)
5.4% (3.1-7.6)
3.7% (2.8-4.6)
Percentage with raised fasting blood glucose as defined below or currently on medication for raised blood glucose capillary whole blood value ≥ 6.1 mmol/L (110 mg/dl)
5.8% (4.7-7.0)
5.3% (3.6-7.1)
6.3% (5.0-7.7)
Mean total blood cholesterol, including those currently on medication for raised cholesterol [choose accordingly: mmol/L or mg/dl]
3.6 (3.6-3.7)
3.5 (3.4-3.6)
3.7 (3.7-3.8)
Percentage with raised total cholesterol (≥ 5.0 mmol/L or ≥ 190 mg/dl or currently on medication for raised cholesterol)
11.0% (9.4-12.7)
11.2% (8.5-13.9)
10.9% (9.2-12.6)
Cardiovascular Disease (CVD) risk

Botswana Non-communicable Disease Risk Factor Surveillance - 2014 Page 112
Percentage aged 40-69 years with a 10-year CVD risk ≥ 30%, or with existing CVD** 9.7%
(6.9-12.6) 9.3%
(5.2-13.5)
10.1% (6.7-13.4)
Summary of combined risk factors
current daily smokers
less than 5 servings of fruits & vegetables per day
insufficient physical activity
overweight (BMI ≥ 25 kg/m2)
raised BP (SBP ≥ 140 and/or DBP ≥ 90 mmHg or currently on medication for raised BP)
Percentage with none of the above risk factors 1.2%
(0.7-1.7) 1.1%
(0.4-1.9)
1.3% (0.7-2.0)
Percentage with three or more of the above risk factors, aged 18 to 44 years
19.7% (16.9-22.5)
19.0% (14.9-23.0)
20.5% (17.5-23.5)
Percentage with three or more of the above risk factors, aged 45 to 69 years
48.1% (42.6-53.6)
43.3% (35.1-51.6)
52.3% (45.8

Botswana Non-communicable Disease Risk Factor Surveillance - 2014 Page 113
-58.9)
Percentage with three or more of the above risk factors, aged 18 to 69 years
25.7% (23.1-28.3)
23.7% (19.8-27.6)
27.8% (24.9-30.8)
** A 10-year CVD risk of ≥30% is defined according to age, sex, blood pressure, smoking status (current smokers OR those who quit smoking less than 1 year before the assessment), total cholesterol, and diabetes (previously diagnosed OR a fasting plasma glucose concentration >7.0 mmol/l (126 mg/dl). * For complete definitions of insufficient physical activity, refer to the GPAQ Analysis Guide (http://www.who.int/chp/steps/GPAQ/en/index.html) or to the WHO Global recommendations on physical activity for health (http://www.who.int/dietphysicalactivity/factsheet_recommendations/en/index.html
For additional information, please contact: STEPS country focal point Dr.Heluf Gessesse Medhin, [email protected]
BOTSWANA STEPS Survey 2014
Tobacco Fact Sheet (b)
The WHO STEPwise approach to surveillance (STEPS) is a simple, standardized method for collecting, analysing and
disseminating data on non-communicable diseases (NCDs) and risk factors. Data are collected on the established risk
factors and NCD conditions that determine the major NCD burden, including tobacco use, harmful use of alcohol,
unhealthy diet, insufficient physical activity, overweight and obesity, raised blood pressure, raised blood glucose, and
abnormal blood lipids. Data from STEPS surveys can be used by countries to help monitor progress in meeting the
global voluntary targets related to specific risk factors such as tobacco, alcohol, diet and physical inactivity. The tobacco
indicators from STEPS can be used to evaluate and monitor existing tobacco-control policies and programmes.*
The STEPS survey on NCD risk factors in Botswana was carried out from July 2014 to August 2014. The STEPS survey
was a population-based survey of participants aged 15-69 years. A Cross Sectional exploratory survey was
conducted in 26 districts of Botswana to collect representative data for these age range. Survey information was
collected electronically using handheld devices. The survey was implemented by health workers from primary health care
facilities and hospitals. A total of 4074 adults participated in the Botswana STEPS survey from 26 districts. The overall
response rate was 64%. A repeat survey is planned for 2020 if funds permit.

Botswana Non-communicable Disease Risk Factor Surveillance - 2014 Page 114
Highlights - Botswana
TOBACCO USE o 31.4% of men, 4.9% of women, and 18.3% overall were current smokers of tobacco. o 1.5% of men, 6.5% of women, and 3.9% overall were current users of smokeless tobacco.
CESSATION o 6 in 10 current smokers tried to stop smoking in the last 12 months. o 4 in 10 current smokers were advised by a health care provider to stop smoking in the last 12 months
SECONDHAND SMOKE o 28.3% of adults were exposed to tobacco smoke at the workplace. o 43.6% of adults were exposed to tobacco smoke at home.
MEDIA o 6 in 10 adults noticed anti-cigarette smoking information on the television or radio. o 7 in 10 current smokers thought about quitting because of warning labels on cigarette packages. o 1 in 10 adults noticed cigarette marketing in stores where cigarettes are sold. o 1 in 10 adults noticed cigarette promotions.
ECONOMICS o Average monthly expenditure on manufactured cigarettes was 2539.7 Pula
Data presented in this fact sheet relate only to select tobacco indicators. Additional information on tobacco or other NCD risk factors from the survey is available from sources listed below.
For additional information, please contact: WHO STEPS Team [[email protected]] Website url if appropriatehttp://www.who.int/tobacco/publications/surveillance/tqs/en/
STEPS country focal point: Dr. Heluf Gessesse Medhin ([email protected])
*Tobacco questions are drawn from the Tobacco Questions for Surveys (TQS)

Results of participants aged 15-69 years Overall % (95% CI)
Males % (95% CI)
Females% (95% CI)
Tobacco Use
Current tobacco users (smoked and/or smokeless)1
Current tobacco users 20.9 (18.4-23.4) 31.8 (27.9-35.7) 9.7 (7.6-11.9)
Current daily tobacco users 16.6 (14.4-18.9) 25.6 (22.0-29.2) 7.4 (5.7-9.1)
Current tobacco smokers
Current tobacco smokers 18.3 (15.9-20.7) 31.4 (27.5-35.3) 4.9 (3.5-6.2)
Current cigarette smokers 2 16.7 (14.3-19.0) 30.0 (26.0-34.0) 3.1 (1.9-4.2)
Current daily tobacco smokers 14.6 (12.4-16.8) 25.4 (21.9-29.0) 3.5 (2.4-4.6)
Current daily cigarette smokers 13.3 (11.1-15.4) 24.2 (20.5-27.8) 2.1 (1.3-3.0)
Average age started tobacco smoking among current smokers (years) 22.1 (21.1-23.2) 21.4 (20.5-22.3) 27.1 (21.9-32.4)
Average number of cigarettes smoked per day (among daily cigarette smokers) 8.1 (7.0-9.2) 8.3 (7.2-9.5) 5.3 (3.9-6.7)
Current smokeless tobacco users
Current smokeless tobacco users 3.9 (3.0-4.9) 1.5 (0.8-2.2) 6.5 (4.9-8.1)
Current daily smokeless tobacco users 2.8 (2.0-3.6)
0.5 (0.1-1.0)
5.0 (3.6-6.5)
Current non-users (smoked and/or smokeless)1
Former tobacco users3 9.0 (7.6-10.5) 13.1 (10.4-15.7) 4.9 (3.8-6.1)
Former tobacco smokers4 8.5 (7.1-9.9) 13.0 (10.4-15.6) 3.9 (2.9-5.0)
Never users 70.1 (67.4-72.7) 55.2 (51.1-59.2) 85.3 (82.9-87.8)
Exposure to Second-hand smoke
Adults exposed to second-hand smoke at home* 43.6 (40.3-46.9) 47.6 (43.0-52.3) 39.5 (35.9-43.1)
Adults exposed to second-hand smoke in the closed areas in their workplace* 28.3 (24.6-31.9) 31.6 (26.2-36.9) 24.8 (21.4-28.1)
Tobacco Cessation
Current smokers who tried to stop smoking in past 12 months 56.4 (50.0-62.7) 58.2 (51.7-64.8) 44.3 (29.2-59.3)
Current smokers advised by a health care provider to stop smoking in past 12 months
41.4 (34.7-48.1) 40.0 (32.4-47.7) 48.6 (35.0-62.3)
Health Warnings
Current smokers who thought about quitting because of a warning label* 67.1 (57.4-76.7) 66.3 (56.1-76.4) 74.8 (57.9-91.8)
Adults who noticed anti-cigarette smoking information on the television or radio * 59.3 (56.3-62.3) 62.2 (58.2-66.3) 56.3 (53.1-59.6)
Adults who noticed anti-cigarette smoking information in newspapers or magazines*
46.1 (42.8-49.4) 49.4 (45.0-53.8) 42.7 (39.1-46.4)
Tobacco Advertisement and Promotion
Adults who noticed cigarette marketing in stores where cigarettes are sold* 12.5 (9.7-15.2) 12.9 (9.5-16.4) 12.0 (9.0-15.1)
Adults who noticed any cigarette promotions* 12.7 (9.9-15.5) 14.8 (11.2-18.4) 10.6 (7.7-13.5)
Economics
Average amount spent on 20 manufactured cigarettes (Pula) 388.5 (219.3-557.6)
Average monthly expenditure on manufactured cigarettes (Pula) 2539.7 (703.7-4375.7)
Cost of 100 packs of manufactured cigarettes as a percentage of per capita Gross Domestic Product (GDP) [2013]
6
22.8 (12.9-32.7)
1 Current use refers to daily and less than daily use. 2 Includes manufactured cigarettes and hand-rolled cigarettes. Adapted for other products as per country situation.3 Current non-users.4 Current non-smokers. 5 Among those who visited a health care provider in past 12 months. 6 [Source and year for per capita GDP]. * During the past 30 days. † Promotions include free cigarette sample, cigarettes at sale prices, coupons for cigarettes, free gifts upon purchase of cigarettes, clothing or other items with cigarette brand name or logo and cigarette promotions in mail. Adults refer to persons age 18-69 years. Data have been weighted to be nationally representative of all men and women age 18-69 years. Technical assistance for the survey was provided by the World Health Organization (WHO). This document has been produced with a partial grant from the CDC Foundation, with financial support from the Bloomberg Initiative to Reduce Tobacco Use, a program of Bloomberg Philanthropies. The contents of this document are the sole responsibility of the authors and can under no circumstances be regarded to reflect the positions of the CDC Foundation.

Botswana Non-communicable Disease Risk Factor Surveillance - 2014 Page 116
Republic of Botswana
STEPS Instrument
For Non-Communicable Diseases Risk Factors Survey

Botswana Non-communicable Disease Risk Factor Surveillance - 2014 Page 117
Chronic Disease
Risk Factor Surveillance Botswana
Survey Information
Location and Date Response Code
1 District name (code) └─┴─┴─┘
I1
2 Village name (code)
I2
3 Locality X1 4 Enumeration Area X2 5 Plot number/House number X3
6 Interviewer ID └─┴─┴─┘
I3
8 Date of completion of the Instrument
└─┴─┘└─┴─┘└─┴─┴─┴─┘ dd mm year
I4
Participant Id Number └─┴─┴─┘└─┴─┴─┘└─┴─┴─┘ Consent, Interview Language and Name Response Code
9 Consent has been read and obtained Yes 1
I5 No 2 If NO, END
10 Interview Language
English 1
I6 Setswana 2
Others 3
11 Time of interview (24 hour clock)
└─┴─┘: └─┴─┘ hrsmins
I7
12 Family Surname I8
13 First Name I9 Additional Information that may be helpful
14 Contact phone number where possible I10
Record and file identification information (I5 to I10) separately from the completed questionnaire.

Botswana Non-communicable Disease Risk Factor Surveillance - 2014 Page 118
Participant Id Number └─┴─┴─┘└─┴─┴─┘└─┴─┴─┘
Step 1 a. Demographic Information
CORE: Demographic Information Question Response Code
15 Sex (Record Male / Female as observed) Male 1 Female 2 C1
16 What is your date of birth? Don't Know 77 777 7777
└─┴─┘└─┴─┘ └─┴─┴─┴─┘ If known, Go to C4 dd mm year
C2
17 How old are you? Years └─┴─┘
C3
18 In total, how many years have you spent at school or in full-time study (excluding pre-school)?
Years └─┴─┘ C4
EXPANDED: Demographic Information 19 What is the highest level of education you have
completed?
No formal schooling 1
C5
Less than primary school 2
Primary school completed 3
Jnr. Secondary school completed
4
Snr. Secondary school completed
5
High school completed 6
Tertiary school completed 7
College/University completed 8
Post graduate degree 9
Refused 88
20 What is your (ethnic / racial group / cultural subgroup / others Nationality] background?
Motswana 1
C6
Other African 2
European 3
Asian 4
Others 5
Refused 88
21 What is your current marital status? Never married 1
C7
married 2
Separated 3
Divorced 4
Widowed 5
Not married but Living with partner/cohabit
6
Refused 88
22
Which of the following best describes your main work status over the past 12 months?
Government employee 1
C8
Parastatal 2
Non-government employee 3
Self-employed 4
Non-paid/unpaid family helper
5
Student 6
Homemaker/house work 7
Retired 8
Unemployed (able to work) 9
Unemployed (unable to work) 10
Refused 88
23 How many people older than 15 years, including yourself, live in your household?
Number of people
└─┴─┘
C9

Botswana Non-communicable Disease Risk Factor Surveillance - 2014 Page 119
EXPANDED: Demographic Information, Continued
Question Response Code
24 Taking the past year, can you tell me what the average earnings of the household have been in Pula?
(RECORD ONLY ONE, NOT ALL 3)
Per week └─┴─┴─┴─┴─┴─┴─┘Go to T1 C10a
OR per month └─┴─┴─┴─┴─┴─┴─┘ Go to T1 C10b
OR per year └─┴─┴─┴─┴─┴─┴─┘Go to T1 C10c
Refused 88 C10d 25 If you don’t know the amount, can you give an estimate
of the annual household income if I read some options to you? Is it (READ OPTIONS)
<5,000 Pula 1
C11
5,000 – 9,999 2
10,000 – 14,999 3
15,000 – 19,999 4
≥ 20,000 5
Don't Know 77
Refused 88
Step 1 b. Behavioural Measurements
CORE: Awareness on Tobacco &Use
Now I am going to ask you some questions about tobacco
Question
Response Code
26 Do you currently smoke any tobacco products, such as cigarettes, cigars or pipes?
(USE SHOWCARD)
Yes 1
T1
No 2 If No, go to T8
27 Do you currently smoke tobacco products daily?
Yes 1 T2
No 2
28 How old were you when you first started smoking?
Age (years)
└─┴─┘ If Known, go to T5a/T5aw
T3 Don’t know 77
29 Do you remember how long ago it was? (RECORD ONLY 1, NOT ALL 3) Don’t know 77
In Years └─┴─┘ If Known, go to T5a/T5aw
T4a
OR in Months └─┴─┘ If Known, go to T5a/T5aw
T4b
OR in Weeks └─┴─┘
T4c
30 On average, how many of the following products do you smoke each day/week? (IF LESS THAN DAILY, RECORD WEEKLY) (RECORD FOR EACH TYPE, USE SHOWCARD) Don’t Know 7777
Tobacco products DAILY WEEKLY
Manufactured cigarettes └─┴─┴─┴─┘ └─┴─┴─┴─┘ T5a/T5aw
Hand-rolled cigarettes └─┴─┴─┴─┘ └─┴─┴─┴─┘
T5b/T5bw
Pipes full of tobacco └─┴─┴─┴─┘ └─┴─┴─┴─┘
T5c/T5cw
Cigars, cheroots, cigarillos └─┴─┴─┴─┘ └─┴─┴─┴─┘
T5d/T5dw
Number of Shisha Sessions └─┴─┴─┴─┘
└─┴─┴─┴─┘
T5e/T5ew
Other
└─┴─┴─┴─┘ └─┴─┴─┴─┘
T5f/T5fw
Other (please specify):
└─┴─┴─┴─┴─┴─┘ T5other/ T5otherw
31 During the past 12 months, have you tried to stop smoking?
Yes 1 T6 No 2

Botswana Non-communicable Disease Risk Factor Surveillance - 2014 Page 120
32 During any visit to a doctor or other health worker in the past 12 months, were you advised to quit smoking tobacco?
Yes 1 If T2=Yes, go to T12; if T2=No, goto T9
T7 No 2 If T2=Yes, go to T12; if T2=No, go to T9
No visit during the past 12 months 3 If T2=Yes, go to T12; if T2=No, go to T9
33 In the past, did you eversmoke any tobacco products? (USE SHOWCARD)
Yes 1 T8
No 2 If No, go to T12
34 In the past, did you ever smoke daily? Yes 1 If T1=Yes, go to T12, else go to T10 T9
No 2If T1=Yes, go to T12, else go to T10
EXPANDED: Tobacco Use
Question Response Code
35 How old were you when you stopped smoking?
Age (years)
└─┴─┘ If Known, go to T12 T10
Don’t Know 77
36 How long ago did you stop smoking? (RECORD ONLY 1, NOT ALL 3) Don’t Know 77
Years ago └─┴─┘ If Known, go to T12
T11a
OR Months ago └─┴─┘ If Known, go to T12
T11b
OR Weeks ago └─┴─┘
T11c
37 Do you currently use any smokeless tobacco products such as [snuff, chewing tobacco, betel]? (USE SHOWCARD)
Yes 1
T12 No 1. If No, go to T15
38 Do you currently usesmokeless tobacco products daily?
Yes 1 T13
No 2 If No, go to T15
39
On average, how many times a day/week do you use …. (IF LESS THAN DAILY, RECORD WEEKLY) (RECORD FOR EACH TYPE, and USE SHOWCARD) Don’t Know 7777
Smokeless Tobacco DAILY WEEKLY
Snuff, by mouth └─┴─┴─┴─┘
└─┴─┴─┴─┘
T14a/T14aw
Snuff, by nose └─┴─┴─┴─┘ └─┴─┴─┴─┘
T14b/T14bw
Chewing tobacco └─┴─┴─┴─┘ └─┴─┴─┴─┘
T14c/T14cw
Betel, quid └─┴─┴─┴─┘ └─┴─┴─┴─┘
T14d/T14dw
Other
└─┴─┴─┴
└─┴─┴─┴─┘ T14e/T14ew
Other (please specify): └─┴─┴─┴─┴─┴─┘
If T13=No, go to, else go toT15
T14other/ T14otherw
40 In the past, did you ever use smokeless tobacco products such as [snuff, chewing tobacco, or betel]?
1 T15
No 2 If No, go to T17
41 In the past, did you ever use smokeless tobacco products such as [snuff, chewing tobacco, or betel] daily?
Yes 1 T16
No 2If No, go to T17
42 During the past 30 days, on how many days did someone in your home smoked when you were present?
Number of days
Don't know └─┴─┘ 77
T17
4343434
During the past 7 days, on how many days did someone smoked in closed areas in your workplace (in the building, in a work area or a specific office) when you were present?
Number of days
Don't know or don't work in a closed area
└─┴─┘
77
If none go to X11
T18

Botswana Non-communicable Disease Risk Factor Surveillance - 2014 Page 121
44 What is the main reason that you use tobacco products (smoking, or smokeless) (SELECT ONLY 1)
Unable to stop / habit
Sign of prestige
1
2
X4
Relieves stress, relaxation 3 Seen from parents, neighbours, friends Peer pressure
4 5
Recreational, gives pleasure 6 Advertising/Promotion 7 To socialize 8
Other reasons 9specify:
45
During the past 30 days, have you noticed information about the dangers of smoking cigarettes or that encourages quitting through the following media? (RECORD FOR EACH)
Newspapers or magazines Yes
1 TP1a No 2
Don't know 77
Television Yes
1 TP1b No 2
Don't know 77
Radio Yes
1 TP1c No 2
Don't know 77
46 During the past 30 days, have you noticed any advertisements or signs promoting cigarettes in stores where cigarettes are sold?
Yes
1 TP2 No 2
Don't know 77 47
During the past 30 days, have you noticed any of the following types of cigarette promotions? (RECORD FOR EACH)
Free samples of cigarettes
Yes
No
Don't know
1 2 77
TP3a
Cigarettes at sale prices Yes 1
2 77
TP3b No
Don't know
Coupons for cigarettes
Yes
No
Don't know
1 2 77
TP3c
Free gifts or special discount offers on other products when buying cigarettes
Yes
1 TP3d No 2
Don't know 77
Clothing or other items with a cigarettebrand name or logo Yes
1 TP3e No 2
Don't know 77
Cigarette promotions in the mail Yes
1 TP3f No 2
Don't know 77
48 During the past 30 days, did you notice any health warnings on cigarette packages?
Yes No Did not see any cigarette packages Don't know
1 2 3 If "did not see any cigarette
packages", go to TP6 77
TP4
49 During the past 30 days, have warning labels on cigarette packages led you to think about quitting?
Yes No Don't know
1 2 77
TP5
50 The last time you bought manufactured cigarettes for yourself, how many cigarettes did you buy in total?
Number of cigarettes Don't know or Don't smoke or purchase manuf. cigarettes
└─┴─┴─┴─┴─┴─┘
7777
TP6
51
In total, how much money did you pay for this purchase?
(DIGITS TO BE ADAPTED TO COUNTRY NEEDS)
Amount Don't know Refused
└─┴─┴─┴─┴
7777
8888
TP7

Botswana Non-communicable Disease Risk Factor Surveillance - 2014 Page 122
EXPANDED - Exposure to other FUMES
52a During the past 12 months, what source of energy was used for cooking by this household? (RECORD FOR EACH)
Paraffin Yes 1
X5a No 2
Wood Yes 1
X5b No 2
Coal, charcoal Yes 1
X5c No 2
Gas / bio-gas Yes 1
X5d No 2
Solar power Yes 1
X5e No 2
Electricity Yes 1
X5f No 2
52b During the past 12 months, what source of energy was used forheating by this household? (RECORD FOR EACH)
Paraffin Yes 1
X6a No 2
Wood Yes 1
X6b No 2
Coal, charcoal Yes 1
X6c No 2
Gas / bio-gas Yes 1
X6d No 2
Solar power Yes 1
X6e No 2
Electricity Yes 1
X6f No 2
CORE: Alcohol Consumption
Question Response Code
53. Have you ever consumed an alcoholic drink such as beer, wine, spirits, chibuku, homemade brews, khadi, mokuru,
fermented cider etc.
(USE SHOWCARD OR SHOW EXAMPLES)
Yes
No
1
2 If No, go to X14 A1
54. Have you consumed an alcoholic drink within the past 12 months?
Yes
No
1
2 If No, go to X14 A2
55. Have you stopped drinking due to health, such as a negative impact on your health or on the advice of your doctor or other health worker?
Yes
No
1 If Yes, go to A16
2 If No, go to A16 A3
56. During the past 12 months, how frequently have you had at least one alcoholic drink?
(READ RESPONSES, USE SHOWCARD)
Daily
5-6 days per week
3-4 days per week
1-2 daysper week
1-3 days per month
Less than once a month
1
2
3
4
5
6
A4
57. Have you consumed an alcoholic drink within the past 30 days?
Yes
No
1
2 A5
58. During the past 30 days, on how many occasions did you have at least one alcoholic drink?
Number
Don't know 77
└─┴─┘ A6
59. During the past 30 days, when you drank alcohol, how many standardalcoholicdrinks on average did you have during one drinking occasion?
(USE SHOWCARD)
Number
Don't know 77 └─┴─┘
A7

Botswana Non-communicable Disease Risk Factor Surveillance - 2014 Page 123
60. During the past 30 days, what was the largest number of standard alcoholic drinks you had on a single occasion, counting all types of alcoholic drinks together?
Largest number
Don't Know 77 └─┴─┘
A8
61. During the past 30 days, how many times did you have6 or more standard alcoholic drinks in a single drinking occasion?
Number of times
Don't Know 77
└─┴─┘ A9
62. During each of the past 7 days, how many standard drinks did you have each day?
(USE SHOWCARD)
Don't Know 77
Monday └─┴─┘ A10a
Tuesday └─┴─┘ A10b
Wednesday └─┴─┘ A10c
Thursday └─┴─┘ A10d
Friday └─┴─┘ A10e
Saturday └─┴─┘ A10f
Sunday └─┴─┘ A10g
I have just asked you about your consumption of alcohol during the past 7 days. The questions were about alcohol in general, while the next questions refer to your consumption of homebrewed alcohol, alcohol brought over the border/from another country, any alcohol not intended for drinking or other untaxed alcohol. Please only think about these types of alcohol when answering the next questions.
63. During the past 7 days, did you consume any homebrewed alcohol; any alcohol brought over the border/from another country.
[AMEND ACCORDING TO LOCAL CONTEXT] (USE SHOWCARD)
Yes 1
A11 No 2 If No, go to A13
64.
On average, how many standard drinks of the following did you consumeduring the past 7 days?
[INSERT COUNTRY-SPECIFIC EXAMPLES] (USE SHOWCARD)
Don't Know 77
Homebrewed spirits, └─┴─┘ A12a Homebrewed or Morula beer
└─┴─┘ A12b
Alcohol brought over the border/from another country └─┴─┘ A12c
Alcohol not intended for drinking, e.g. alcohol-based medicines, perfumes, after shaves └─┴─┘
A12d
Other untaxed alcohol in the country └─┴─┘
A12e
EXPANDED: Alcohol Consumption
65.
During the past 12 months, how often have you found that you were not able to stop drinking once you had started?
Daily or almost daily
Weekly
Monthly
Less than monthly
Never
1
2
3
4
5
A13
66.
During the past 12 months, how often have you failed to do what was normally expected from you because of drinking?
Daily or almost daily
Weekly
Monthly
Less than monthly
Never
1
2
3
4
5
A14
67.
During the past 12 months, how often have you needed a first drink in the morning to get yourself going after a heavy drinking session?
Daily or almost daily
Weekly
Monthly
Less than monthly
Never
1
2
3
4
5
A15
68.
During the past 12 months, have you had family problems or a problem with your partner due to someone else’s drinking?
Yes, more than monthly
Yes, monthly
Yes, several times but less than monthly
Yes, once or twice
No
1
2
3
4
5
A16

Botswana Non-communicable Disease Risk Factor Surveillance - 2014 Page 124
69. What is your mainreason for drinking alcohol?
(SELECT ONLY 1)
Unable to stop / habit
Sign of prestige
1
2
X7
Relieves stress, relaxation 3
Seen from parents, neighbours, friends / Peer pressure
4 5
Recreational, gives pleasure 6
Advertising / Promotion 7
To socialize 8
Other reasons 9 specify:
CORE: Diet
The next questions ask about the fruits and vegetables that you usually eat. I have a nutrition card here that shows you some examples of local fruits and vegetables. Each picture represents the size of a serving. As you answer these questions please think of a typical week in the last year.
Question Response Code
70. Do you eat fruits at least once a week? Yes No
1 2 If no go to X9
X8
71. In a typical week, on how many days do you eat fruit?
(USE SHOWCARD) Number of days Don't Know 77
└─┴─┘
D1
72. How many servings of fruit do you eat on one of those days? (USE SHOWCARD)
Number of servings
Don't Know 77 └─┴─┘ D2
73. What is the main reason for not eating fruits? Not available 1
X9
Not affordable/expensive 2
Gives me discomfort 3
Seasonal 4
Others - specify 5 Don’t know/No reason 77
74. Do you eat vegetables at least once a week?
Yes
No
1 2 If no go to X11
X10
75. In a typical week, on how many days do you eat vegetables?(USE SHOWCARD)
Number of days Don't Know 77 └─┴─┘ If Zero days, go to D5
D3
76. How many servings of vegetables do you eat on one of those days? (USE SHOWCARD)
Number of servings
Don’t know 77 └─┴─┘ D4
77. What is the main reason for not eating vegetables? Not available 1
X11
Not affordable/expensive 2
Gives me discomfort 3
Others - specify 4
Don’t know/No reason 77

Botswana Non-communicable Disease Risk Factor Surveillance - 2014 Page 125
EXPANDED: Diet
78. What type of oil or fat is most often used for meal preparation in your household?
(USE SHOWCARD) (SELECT ONLY ONE
Vegetable oil 1
D5
Lard or suet 2
Butter or ghee 3
Margarine 4
Other 5
None in particular 6
None used 7
Don’t know 77
Specify the type of oil/fat
└─┴─┴─┴─┴─┴─┴─┘ D5other
79. On average, how many meals per week do you eat that were not prepared at your home
Note: Meal means breakfast, lunch or dinner.
Number
Don’t know 77
└─┴─┘
D6
80. During the past 7 days, on average, how many of the following drinks did you consume per day? *1 standard drink is roughly equivalent to 340 ml of sugar based fluid in a can, bottle or glass) RECORD FOR EACH
100% fruit juice X12a-f
Fruit nectar Fizzy or soft drink
Regular soda or pop
Diet pop/Diet soda Regular sports drinks/Energy drinks Don’t know
77
81. During the past 7 days, on average, how many
cups/mugs of hot drinks (milk, coffee, and tea) did you consume with 0 tea spoons, 1-3 tea spoons, or 4+ tea spoons of sugar per day? RECORD FOR EACH (1 CUP/MUG is ≠ 150-200ml capacity)
0 tsp X13
1-3tsp 4+tsp
82. How often is salt or salty sauce added to your daily meal right before you eat or as you are eating
Always Often Sometimes Rarely Never Don’t know
1 2 3 4 5 77
DS1
83. How often is salt added in cooking or preparing foods in your household?
Always Often Sometimes Rarely Never Don't know
1 2 3 4 5 77
DS2
84. Do you think that lowering salt in your diet is important? Yes very important Yes somewhat important Not at all important Don't know
1 2 3 77
DS5
85. Do you think that too much salt in your diet could cause a serious health problem?
Yes No Don't know
1 2 77
DS6

Botswana Non-communicable Disease Risk Factor Surveillance - 2014 Page 126
CORE: Physical Activity
Next I am going to ask you about the time you spend doing different types of physical activity in a typical week. Please answer these questions even if you do not consider yourself to be a physically active person. Think first about the time you spend doing work. Think of work as the things that you have to do such as paid or unpaid work, study/training, household chores, harvesting food/crops, fishing or hunting for food, seeking employment. [Insert other examples if needed]. In answering the following questions 'vigorous-intensity activities' are activities that require hard physical effort and cause large increases in breathing or heart rate, 'moderate-intensity activities' are activities that require moderate physical effort and cause small increases in breathing or heart rate.
Question Response Code
Work
86. Does your work involve vigorous-intensity activity that causes large increases in breathing or heart rate like [carrying or lifting heavy loads, digging or construction work] for at least 10 minutes continuously?
[INSERT EXAMPLES] (USE SHOWCARD)
Yes 1
P1
No 2 If No, go to P 4
87. In a typical week, on how many days do you do vigorous-intensity activities as part of your work? Number of days
└─┘ P2
88. How much time do you spend doing vigorous-intensity activities at work on a typical day?
Hours : minutes └─┴─┘: └─┴─┘
hrsmins
P3 (a-b)
89. Does your work involve moderate-intensity activity, that causes small increases in breathing or heart rate such as brisk walking [or carrying light loads]for at least 10 minutes continuously?
[INSERT EXAMPLES] (USE SHOWCARD)
Yes 1
P4
No 2 If No, go to P 7
90. In a typical week, on how many days do you do moderate-intensity activities as part of your work? Number of days
└─┘ P5
91. How much time do you spend doing moderate-intensity activities at work on a typical day?
Hours : minutes └─┴─┘: └─┴─┘
hrsmins
P6 (a-b)
Travel to and from places The next questions exclude the physical activities at work that you have already mentioned. Now I would like to ask you about the usual way you travel to and from places. For example to work, for shopping, to market, to place of worship. [Insert other examples if needed]
92. Do you walk or use a bicycle(pedal cycle) for at least 10 minutes continuously to get to and from places?
Yes 1 P7
No 2 If No, go to P 10
93. In a typical week, on how many days do you walk or bicycle for at least 10 minutes continuously to get to and from places? Number of days
└─┘
P8
94. How much time do you spend walking or bicycling for travel on a typical day?
Hours : minutes └─┴─┘: └─┴─┘
hrsmins
P9 (a-b)
Recreational activities The next questions exclude the work and transport activities that you have already mentioned. Now I would like to ask you about sports, fitness and recreational activities (leisure),[Insert relevant terms].
95. Do you do any vigorous-intensity sports, fitness or recreational (leisure) activities that cause large increases in breathing or heart rate like [running or football] for at least 10 minutes continuously?
[INSERT EXAMPLES] (USE SHOWCARD)
Yes 1 P10
No 2 If No, go to P 13
96. In a typical week, on how many days do you do vigorous-intensity sports, fitness or recreational (leisure) activities? Number of days
└─┘
P11
97. How much time do you spend doing vigorous-intensity sports, fitness or recreational activities on a typical day? Hours : minutes
└─┴─┘: └─┴─┘
hrsmins
P12 (a-b)

Botswana Non-communicable Disease Risk Factor Surveillance - 2014 Page 127
98. Do you do any moderate-intensity sports, fitness or recreational (leisure) activities that cause a small increase in breathing or heart rate such as brisk walking,[cycling, swimming, and volleyball] for at least 10 minutes continuously?
[INSERT EXAMPLES] (USE SHOWCARD)
Yes 1
P13 No 2 If No, go to P16
99. In a typical week, on how many days do you do moderate-intensity sports, fitness or recreational (leisure) activities? Number of days
└─┘ P14
100. How much time do you spend doing moderate-intensity sports, fitness or recreational (leisure) activities on a typical day? Hours : minutes
└─┴─┘: └─┴─┘
hrsmins
P15 (a-b)
EXPANDED: Physical Activity
Sedentary behaviour
The following question is about sitting or reclining at work, at home, getting to and from places, or with friends including time spent sitting at a desk, sitting with friends, travelling in car, bus, train, reading, playing cards or watching television, but do not include time spent sleeping. [INSERT EXAMPLES] (USE SHOWCARD)
101. How much time do you usually spend sitting or reclining on a typical day? Hours : minutes └─┴─┘: └─┴─┘
hrsmins
P16 (a-b)
CORE: History of Raised Blood Pressure
102. Have you ever had your blood pressure measured by a doctor or other health worker? Yes
No
1
2 If No, go to H6 H1
103. Have you ever been told by a doctor or other health worker that you have raised blood pressure or hypertension?
Yes
No
1
2 If No, go to H6 H2a
104. Have you been told in the past 12 months? Yes
No
1
2 H2b
105. In the past two weeks, have you taken any drugs (medication) for raised blood pressure prescribed by a doctor or other health worker?
Yes
No
1
2 H3
106. Have you ever seen a traditional healer, spiritual, herbalist for raised blood pressure or hypertension?
Yes
No
1
2 H4
107. Are you currently taking any herbal or traditional remedy for your raised blood pressure?
Yes
No
1
2 H5
CORE: History of Diabetes
108. Have you ever had your blood sugar measured by a doctor or other health worker?
Yes 1 H6
No 2
109. Have you ever been told by a doctor or other health worker that you have raised blood sugar or diabetes?
Yes 1 H7a
No
110. Have you been told in the past 12 months? Yes
No
1
2
H7b
111. In the past two weeks, have you taken any drugs (medication) for diabetes prescribed by a doctor or other health worker?
Yes 1 H8
No 2
112. Are you currently taking insulin for diabetes prescribed by a doctor or other health worker?
Yes 1 H9 No 2
113. Have you ever seen a traditional healer for diabetes or raised blood sugar? Yes 1 H10
No 2
114. Are you currently taking any herbal or traditional remedy for your diabetes? Yes 1 H11 No 2

Botswana Non-communicable Disease Risk Factor Surveillance - 2014 Page 128
CORE: History of Raised Total Cholesterol
115. Have you ever had your cholesterol (fat levels in your blood) measured by a doctor or other health worker?
Yes 1 H12
No 2If No, go to H17
116. Have you ever been told by a doctor or other health worker that you have raised cholesterol?
Yes 1 H13a
No 2 If No, go to H17
117. Have you been told in the past 12 months? Yes 1
H13b No 2
118. In the past two weeks, have you taken any oral treatment (medication) for raised total cholesterol prescribed by a doctor or other health worker?
Yes 1 H14
No 2
119. Have you ever seen a traditional healer for raised cholesterol? Yes 1
H15 No 2
120. Are you currently taking any herbal or traditional remedy for your raised cholesterol?
Yes 1 H16
No 2
CORE: History of Cardiovascular Diseases
121.
Have you ever had a heart attack or chest pain from heart disease (angina) or a stroke (cerebro-vascular accident or incident)?
Yes 1 H17
No 2
122.
Are you currently taking aspirin regularly to prevent or treat heart disease? Yes 1 H18
No 2
123.
Are you currently taking statins (Lovastatin/Simvastatin/Atorvastatin or any other statin) regularly to prevent or treat heart disease?
Yes 1 H19
No 2
CORE: Lifestyle Advice
During the past three years, has a doctor or any other health worker advised you to do any of the following?
(RECORD FOR EACH) 124. Quit using tobacco or don’t start Yes
No
1
2 H20a
125. Reduce salt in your diet Yes
No
1
2 H20b
126. Eat at least five servings of fruit and/or vegetables each day Yes
No
1
2 H20c
127. Reduce fat in your diet Yes
No
1
2 H20d
128. Start or do more physical activity Yes
No
1
2 H20e
129. Maintain a healthy body weight or lose weight Yes
No
1 if c1=1 go to X15
2if c1=1 go to X15 H20f
CORE Cervical Cancer Screening 130. Have you ever had a screening test for cervical
cancer? Yes No Don’t know
1 2 go to X15 77
CX1
Which screening test was done? Pap smear Visual Inspection with Acetic Acid (VIA) Human Papilloma Virus (HPV) test Don’t know
1 2 3 77
X14

Botswana Non-communicable Disease Risk Factor Surveillance - 2014 Page 129
EXPANDED: History of Other Chronic Diseases/conditions 131. During the past 12 months have you been told by
a doctor or other health workers that you have/had or suffered from the following problems/conditions?
Eye/vision Problem( like Cataract retinopathy)
Yes No
1 2
X15a
Kidney problem Yes No
1 2
X15b
Nerves problem Yes No
1 2
X15c
Skin problem Yes No
1 2
X15d
Bronchial asthma Yes No
1 2
X15e
Mental Illness
(Such as depression, loneliness, suicidal attempt, no close friends etc.)
Yes No
1 2
X15f
cancer Yes No
1 2
X15g
Any other conditions Specify_____________
Yes No
1 2
X15h
132 During the past 3 years, have you heard or had any information/education on lifestyle modifications? Yes
No
1 2 go to V3
X16
133 Through which of the following media have you heard or had information/education on lifestyle modifications? (TICK ONE OR MORE APPROPRIATELY)
TV Internet/e-mail Radio Newspapers Friends, neighbours Public gathering/meeting Health facilities
Y/N Y/N Y/N Y/N Y/N Y/N
X17a-g
CORE Injury
134 In the past 12 months, have you been involved in a road traffic crash as a driver, passenger, pedestrian, or cyclist?
Yes (as driver) Yes (as passenger) Yes (as pedestrian) Yes (as a cyclist) No Don’t know Refused
1 2 3 4 5 77 88
V3
135 In the past 12 months, were you injured accidentally, other than the road traffic crashes which required medical attention?
Yes
No
Don't know
Refused
1
2
77
88
V5
136 Please indicate which of the following the cause of the above injury was.
Fall 1 V6 V6other
Sports/ Exercise 2
Burn 3
Poisoning 4
Cut 5
Near-drowning 6
Animal bite 7
Other (please specify) 8
Don't know 77
Refused 88
Specify Other

Botswana Non-communicable Disease Risk Factor Surveillance - 2014 Page 130
Step 2Physical Measurements
CORE: Height and Weight
Question Response Code
1. Interviewer ID └─┴─┴─┘
M9
2. Device IDs for height and weight Height └─┴─┘ M10a
Weight └─┴─┘ M10b
3. Height in Centimetres (cm) └─┴─┴─┘. └─┘
M11
4. Weight
If too large for scale 666.6 in Kilograms (kg)
└─┴─┴─┘.└─┘ M12
5. For women: Are you pregnant? Yes 1 If Yes, go to M 8
M8 No 2
CORE: Waist/Hip
6. Device ID for waist
└─┴─┘ M13
7. Waist circumference in Centimetres (cm) └─┴─┴─┘.└─┘
M14
8. Hip circumference in Centimetres (cm) └─┴─┴─┘.└─┘
M15
CORE: Blood Pressure/Heart Rate (HR)
9. Interviewer ID
└─┴─┴─┘ M1
10. Device ID for blood pressure
└─┴─┘ M2
11. Cuff size used
Small 1
M3 Medium 2
Large 3
12. Reading 1
Systolic ( mmHg) └─┴─┴─┘ M4a
Diastolic (mmHg) └─┴─┴─┘ M4b
(HR) Beats per minute └─┴─┴─┘ M16a
13. Reading 2
Systolic ( mmHg) └─┴─┴─┘ M5a
Diastolic (mmHg) └─┴─┴─┘ M5b
(HR) Beats per minute └─┴─┴─┘ M16b
14. Reading 3
Systolic ( mmHg) └─┴─┴─┘ M6a
Diastolic (mmHg) └─┴─┴─┘ M6b
(HR) Beats per minute └─┴─┴─┘ M16c
15. During the past two weeks, have you been treated for raised blood pressure with drugs (medication) prescribed by a doctor or other health worker?
Yes 1 M7
No 2
HRis an expanded measurement.

Botswana Non-communicable Disease Risk Factor Surveillance - 2014 Page 131
Step 3 Biochemical Measurements
CORE: Blood Glucose
Question Response Code
16. During the past 12 hours have you had anything to eat or drink, other than water?
Yes 1 B1
No 2
17. Technician ID
└─┴─┴─┘ B2
18. Device ID
└─┴─┘ B3
19. Time of day blood specimen taken (24 hour clock) Hours : minutes
└─┴─┘: └─┴─┘ hrsmins
B4
20. Fasting blood glucose
Choose accordingly: mmol/l or mg/dl
mmol/l └─┴─┘. └─┴─┘ B5 mg/dl └─┴─┴─┘.└─┘
21. Today, have you taken insulin or other drugs (medication) that have been prescribed by a doctor or other health worker for raised blood glucose?
Yes 1 B6
No 2
CORE: Blood Lipids
22. Device ID
└─┴─┘ B7
23. Total cholesterol
Choose accordingly: mmol/l or mg/dl
mmol/l └─┴─┘. └─┴─┘ B8 mg/dl └─┴─┴─┘.└─┘
24. During the past two weeks, have you been treated for raised cholesterol with drugs (medication) prescribed by a doctor or other health worker?
Yes 1 B9
No 2
EXPANDED: Triglycerides, LDL and HDL Cholesterol
25. Triglycerides
Choose accordingly: mmol/l or mg/dl
mmol/l └─┴─┘. └─┴─┘ B10
mg/dl └─┴─┴─┘.└─┘
26. HDL Cholesterol
Choose accordingly: mmol/l or mg/dl
mmol/l └─┘. └─┴─┘ B11
mg/dl └─┴─┴─┘.└─┘

Botswana Non-communicable Disease Risk Factor Surveillance - 2014 Page 132
REFERENCES
1. Global Report UN, 2010
2. Diet, nutrition and the prevention of chronic diseases. Geneva: world health organization; 2003 world
health organization technical report series 916.
3. The global burden of disease: world health organisation 2004 update
4. 2008 – 2013 action plan for the global strategy for prevention and control of non-communicable diseases
5. Botswana population and housing census – 2011
6. Global status report on Non-communicable Diseases, 2014