Steps to a Well Bermuda 2014 - World Health Organization · Steps to a Well Bermuda 2014 PAHO-WHO...
54
Steps to a Well Bermuda 2014 PAHO-WHO Non-Communicable Disease Risk Factor Survey GOVERNMENT OF BERMUDA Ministry of Health, Seniors and Environment
Transcript of Steps to a Well Bermuda 2014 - World Health Organization · Steps to a Well Bermuda 2014 PAHO-WHO...

Steps to a Well Bermuda 2014
PAHO-WHO Non-Communicable Disease Risk Factor Survey
GOVERNMENT OF BERMUDAMinistry of Health, Seniors and Environment


Ministry of Health, Seniors and Environment
STEPS TO A WELL BERMUDA 2014
PAHO-WHO Non-Communicable Disease Risk Factor Survey
Published by:
Government of Bermuda, Ministry of Health, Seniors and Environment
Copyright © 2016 Ministry of Health, Seniors and Environment
Mailing Address:
P.O. Box HM 1195
Hamilton HM EX
Bermuda
Tel: 278-4900
Fax : 296-3283
Email: [email protected]
Author:
Dy-Juan DeRoza, M. Sc., CHES, Assessment Officer, Ministry of Health, Seniors and Environment
Reference as:
Ministry of Health, Seniors and Environment (2016) Steps to a Well Bermuda 2014. Government of
Bermuda


STEPS TO A WELL BERMUDA 2014
1
Table of Contents
FOREWORD ........................................................................................................................................................... 5
EXECUTIVE SUMMARY ........................................................................................................................................... 7
STEP 1: Behavioural Risk Factors ........................................................................................................................... 7
STEP 2: Physical Measurements ............................................................................................................................ 8
Combined Risk Factors from STEPS 1 and 2 ........................................................................................................... 8
STEP 3: Biochemical Measurements ...................................................................................................................... 8
INTRODUCTION ..................................................................................................................................................... 9
BACKGROUND ................................................................................................................................................................ 9 STEPWISE APPROACH TO CHRONIC DISEASE RISK FACTOR SURVEILLANCE (STEPS) .................................................................. 10 PURPOSE .................................................................................................................................................................... 10
METHODS ............................................................................................................................................................ 11
SCOPE OF STEPS TO A WELL BERMUDA ............................................................................................................................ 11 STUDY POPULATION, SAMPLE SIZE AND SAMPLING ............................................................................................................. 12 DATA COLLECTION ........................................................................................................................................................ 12 DATA PROCESSING ........................................................................................................................................................ 13 RESPONSE RATES AND LIMITATIONS ................................................................................................................................. 13
RESULTS ............................................................................................................................................................... 14
DEMOGRAPHIC INFORMATION ........................................................................................................................................ 14 TOBACCO USE .............................................................................................................................................................. 15 ALCOHOL CONSUMPTION ............................................................................................................................................... 16 ORAL HEALTH .............................................................................................................................................................. 17 DIETARY HABITS ........................................................................................................................................................... 18 PHYSICAL ACTIVITY ........................................................................................................................................................ 20 HISTORY OF NON-COMMUNICABLE DISEASES .................................................................................................................... 22
Blood Pressure ..................................................................................................................................................... 22
Diabetes ............................................................................................................................................................... 23
Cholesterol ........................................................................................................................................................... 24
Cardiovascular Disease ........................................................................................................................................ 24
Cervical Cancer Screening .................................................................................................................................... 25
Family History of Chronic Disease Conditions ...................................................................................................... 26
Lifestyle Advice .................................................................................................................................................... 26
HEALTH CARE .............................................................................................................................................................. 27 Health insurance .................................................................................................................................................. 27
Care for Non-Communicable Diseases ................................................................................................................. 28
PHYSICAL MEASUREMENTS ............................................................................................................................................. 29 Heart Rate ............................................................................................................................................................ 29
Blood pressure ..................................................................................................................................................... 29

STEPS TO A WELL BERMUDA 2014
2
Waist circumference ............................................................................................................................................ 30
Body Mass Index (BMI) ........................................................................................................................................ 31
COMBINED RISK FACTORS .............................................................................................................................................. 32 BIOCHEMICAL MEASUREMENTS ....................................................................................................................................... 33
Fasting Blood Glucose .......................................................................................................................................... 33
Fasting Total Cholesterol ..................................................................................................................................... 33
TRENDS ................................................................................................................................................................ 34
Tobacco use ......................................................................................................................................................... 35
Alcohol Consumption ........................................................................................................................................... 36
Oral Health........................................................................................................................................................... 38
Dietary Habits ...................................................................................................................................................... 39
Raised Blood Pressure .......................................................................................................................................... 41
Diabetes ............................................................................................................................................................... 41
High Cholesterol ................................................................................................................................................... 42
Overweight and Obesity ...................................................................................................................................... 42
Cervical Cancer Screening .................................................................................................................................... 43
Health Insurance .................................................................................................................................................. 43
DISCUSSION ......................................................................................................................................................... 44
OVERALL RISK OF NCDS AND HEALTH CARE UTILIZATION ..................................................................................................... 44 BEHAVIOURAL RISK FACTORS .......................................................................................................................................... 44
Smoking ............................................................................................................................................................... 44
Alcohol Use .......................................................................................................................................................... 45
Oral Health........................................................................................................................................................... 45
Dietary Habits ...................................................................................................................................................... 45
Physical Activity ................................................................................................................................................... 45
History of Non-Communicable Diseases (Self-Reported) ..................................................................................... 46
Lifestyle Advice .................................................................................................................................................... 46
PHYSICAL MEASUREMENTS ............................................................................................................................................. 46 BIOCHEMICAL MEASUREMENTS ....................................................................................................................................... 46 TRENDS ...................................................................................................................................................................... 47 CONCLUSION ............................................................................................................................................................... 47 RECOMMENDATIONS FOR ACTION.................................................................................................................................... 47
REFERENCES ......................................................................................................................................................... 49

STEPS TO A WELL BERMUDA 2014
3
List of Tables and Figures
TABLE 1. LEADING CAUSES OF DEATH, BERMUDA, 2012 ........................................................................................................... 9
FIGURE 1. DIAGRAMMATIC REPRESENTATION OF THE STEPWISE APPROACH ................................................................................ 10
FIGURE 2. SCOPE OF STEPS TO A WELL BERMUDA ................................................................................................................. 11
FIGURE 3. VARIABLES USED FOR THE SAMPLE SIZE CALCULATION ............................................................................................... 12
TABLE 2. RESPONSE RATES ................................................................................................................................................. 13
FIGURE 4. AGE DISTRIBUTION OF RESPONDENTS BY GENDER ..................................................................................................... 14
FIGURE 5. SMOKING STATUS BY GENDER ............................................................................................................................... 15
FIGURE 6. CURRENT DRINKERS BY AGE-GROUP AND GENDER ................................................................................................... 16
FIGURE 7. PROBLEMS RELATED TO STATE OF TEETH BY GENDER ................................................................................................ 17
FIGURE 8. AVERAGE FRUIT AND VEGETABLE CONSUMPTION PER DAY.......................................................................................... 18
FIGURE 9. AVERAGE SUGARY DRINK CONSUMPTION PER DAY .................................................................................................... 18
FIGURE 10. HABITS USED TO CONTROL SALT INTAKE BY GENDER ............................................................................................... 19
FIGURE 11. INSUFFICIENT PHYSICAL ACTIVITY FOR HEALTH (WHO RECOMMENDATIONS) BY AGE-GROUP AND GENDER ...................... 20
FIGURE 12. PHYSICAL ACTIVITY BY TYPE AND GENDER ............................................................................................................. 21
FIGURE 13. PHYSICAL ACTIVITY LEVELS BY GENDER ................................................................................................................. 21
FIGURE 14. SELF-REPORTED HISTORY OF BLOOD PRESSURE MEASUREMENT AND DIAGNOSIS OF RAISED BLOOD PRESSURE OR
HYPERTENSION BY AGE-GROUP .................................................................................................................................. 22
FIGURE 15. MEDICATION USAGE FOR RAISED BLOOD PRESSURE, AMONG THOSE WITH SELF-REPORTED DIAGNOSIS OF RAISED BLOOD
PRESSURE, BY AGE-GROUP AND GENDER ..................................................................................................................... 23
FIGURE 16. SELF-REPORTED HISTORY OF BLOOD SUGAR MEASUREMENT AND DIAGNOSIS OF RAISED BLOOD SUGAR OR DIABETES BY AGE-
GROUP .................................................................................................................................................................. 23
FIGURE 17. SELF-REPORTED HISTORY OF CHOLESTEROL MEASUREMENT AND DIAGNOSIS OF RAISED CHOLESTEROL BY AGE-GROUP ....... 24
FIGURE 18. SELF-REPORTED HISTORY OF CARDIOVASCULAR DISEASE BY AGE-GROUP AND GENDER .................................................. 25
FIGURE 19. USE OF ASPIRIN OR STATINS TO PREVENT OR TREAT HEART DISEASE BY AGE-GROUP ...................................................... 25
FIGURE 20. FAMILY HISTORY OF SELECTED CHRONIC DISEASES BY GENDER .................................................................................. 26
FIGURE 21. LIFESTYLE ADVICE PROVIDED BY A DOCTOR OR HEALTH WORKER OVER THE PAST THREE YEARS, BY GENDER ..................... 26
FIGURE 22. HEALTH INSURANCE COVERAGE BY AGE-GROUP AND GENDER .................................................................................. 27
FIGURE 23. TYPES OF HEALTH INSURANCE ............................................................................................................................. 27
FIGURE 24. REPORTED HISTORY OF OR CURRENT NCD BY AGE-GROUP AND GENDER ................................................................... 28
FIGURE 25. HEALTH CARE USE, HOME CARE AND MISSED USUAL ACTIVITY AMONG THOSE WITH AN NCD BY AGE-GROUP ................... 28
FIGURE 26. MEAN SYSTOLIC BLOOD PRESSURE BY AGE-GROUP AND GENDER .............................................................................. 29
FIGURE 27. MEASURED RAISED BLOOD PRESSURE (140/90MMHG OR ABOVE) BY AGE-GROUP ...................................................... 30
FIGURE 28. BLOOD PRESSURE TREATMENT AND CONTROL BY GENDER ....................................................................................... 30
FIGURE 29. MEAN WAIST CIRCUMFERENCE BY AGE-GROUP AND GENDER .................................................................................. 31
FIGURE 30. BMI CLASSIFICATIONS BY GENDER ...................................................................................................................... 31
FIGURE 31. NUMBER OF SELECTED RISK FACTORS FOR NON-COMMUNICABLE DISEASES ................................................................. 32
FIGURE 32. INCREASED RISK OF NON-COMMUNICABLE DISEASES (3-5 RISK FACTORS) BY AGE-GROUP AND GENDER ........................... 32
FIGURE 33. FASTING BLOOD GLUCOSE LEVELS ....................................................................................................................... 33
FIGURE 34. FASTING CHOLESTEROL LEVELS ........................................................................................................................... 33
FIGURE 35. COMPARISON - CURRENT SMOKING (DAILY OR SOME DAYS) .................................................................................... 35

STEPS TO A WELL BERMUDA 2014
4
FIGURE 36. COMPARISON - ATTEMPTS TO QUIT SMOKING ....................................................................................................... 35
FIGURE 37. COMPARISON - CURRENT DRINKING .................................................................................................................... 36
FIGURE 38. COMPARISON - BINGE DRINKING (VARYING DEFINITIONS) ....................................................................................... 36
FIGURE 39. COMPARISON - BINGE DRINKING (COMMON DEFINITION) ....................................................................................... 37
FIGURE 40. SHOW CARD - STANDARD ALCOHOLIC DRINKS ........................................................................................................ 37
FIGURE 41. COMPARISON - DENTAL VISITS IN PRIOR YEAR ........................................................................................................ 38
FIGURE 42. COMPARISON - FRUIT CONSUMPTION (3 OR MORE SERVINGS PER DAY) ...................................................................... 39
FIGURE 43. SHOW CARD - SERVINGS OF FRUIT ....................................................................................................................... 39
FIGURE 44. COMPARISON VEGETABLE CONSUMPTION (3 OR MORE SERVINGS PER DAY) ................................................................. 40
FIGURE 45. SHOW CARD - SERVINGS OF VEGETABLES .............................................................................................................. 40
FIGURE 46. COMPARISON - RAISED BLOOD PRESSURE (SELF -REPORT AND MEASURED) ................................................................ 41
FIGURE 47. COMPARISON - DIABETES (SELF-REPORT) ............................................................................................................. 41
FIGURE 48. COMPARISON - HIGH CHOLESTEROL -(SELF-REPORT) .............................................................................................. 42
FIGURE 49. COMPARISON - OVERWEIGHT AND OBESITY [BMI≥ 25] (SELF-REPORT AND MEASURED) .............................................. 42
FIGURE 50. COMPARISON - CERVICAL CANCER SCREENING ....................................................................................................... 43
FIGURE 51. COMPARISON - HEALTH INSURANCE COVERAGE ..................................................................................................... 43

STEPS TO A WELL BERMUDA 2014
5
Foreword
From the Chief Medical Officer
Completion of Bermuda's first STEPS survey is an accomplishment in which the Ministry of Health, Seniors and
Environment takes great pride. We are most proud of its collaborative success: the delicate balancing act required
for planning with multiple stakeholders and the coordinated execution needed to implement a complex project.
Relationships with health partners matured through this collaboration and will be an enduring legacy of this first
STEPS undertaking.
Almost as if by divinely guided processes, health partners appeared and offered to collaborate with the Ministry in
January 2013. The specter of escalating chronic non-communicable diseases had the attention of the healthcare
community and individually our collaborators had converged on a line of action, which involved data collection for
the purpose of describing the extent of the problem. Offers of technical support, logistical assistance, advice and
encouragement came from various sources. Most notable was the promise of technical expertise and guidance
from the Caribbean Public Health Agency (CARPHA) in Trinidad and Tobago. It was this commitment that made the
undertaking possible.
In addition to CARPHA's technical assistance, the STEPS journey was embarked upon with the support of local
health partners, particularly the Bermuda Hospitals Board's Chronic Disease Management Centre and the Bermuda
Diabetes Association. Additional encouragement was offered by the Bermuda Heart Foundation and Bermuda
Cancer and Health Centre.
Initially, our plans for the survey included optional components, which were to be supported by the University of
the West Indies, Cave Hill, Barbados, and University of Cumbria in the United Kingdom. The involvement of
esteemed academic centers was a source of inspiration and excitement which fueled community enthusiasm for
the project. Although the optional items in the STEPS survey were not able to be completed in the end, we remain
grateful for the offer of assistance and the energy generated by the commitment from these universities.
The STEPS journey has been an enormously enriching one for the health community in Bermuda, joining the
expertise and efforts of staff from the Ministry, including the Department of Health, with professionals and
laypersons throughout the island. It unified our purpose around one goal: collecting chronic disease risk factor
data on our population. The exhilaration of the early planning stages, the intense detail-orientation of the
operational phase, and the challenges of executing a long-term project have allowed the participants in the project
to bond in ways which will prove useful in the years ahead. As we make strategic plans and take action based on
the information gleaned from the survey experience, we will benefit from the bonds of friendship and trust which
enhance all collaborations.
The survey implementation phase, spanning from November 2013 to December 2014, has ended. Now, the
community and the collaborators have a priceless opportunity to interpret and act on the data we collected
together. This represents a new phase, just as important as the information-gathering phase. It is now the time
for collective action to address the threat of chronic non-communicable diseases. A vast amount of community
health information is available to us for reflection, priority-setting, decision-making and action. We extend our
hands again to our health partners to continue the journey with us.

STEPS TO A WELL BERMUDA 2014
6
Information obtained from the STEPS to a Well Bermuda survey has now been analyzed, validated and shared in
stages with the community. In the months ahead, we anticipate multiple stakeholder gatherings and an evolving
communication plan to assure that every member of the community is informed and involved in helping to take
action to prevent and control chronic NCDs by addressing their risk factors. The STEPS to a Well Bermuda journey
has been an infinitely valuable learning experience for the Ministry and our collaborators and we cherish it.
However, we realize with excitement that the journey has only just begun.
Dr. Cheryl Peek-Ball
Chief Medical Officer
Office of the Chief Medical Officer
Ministry of Health, Seniors and Environment
STEPS TO A WELL BERMUDA 2014
7
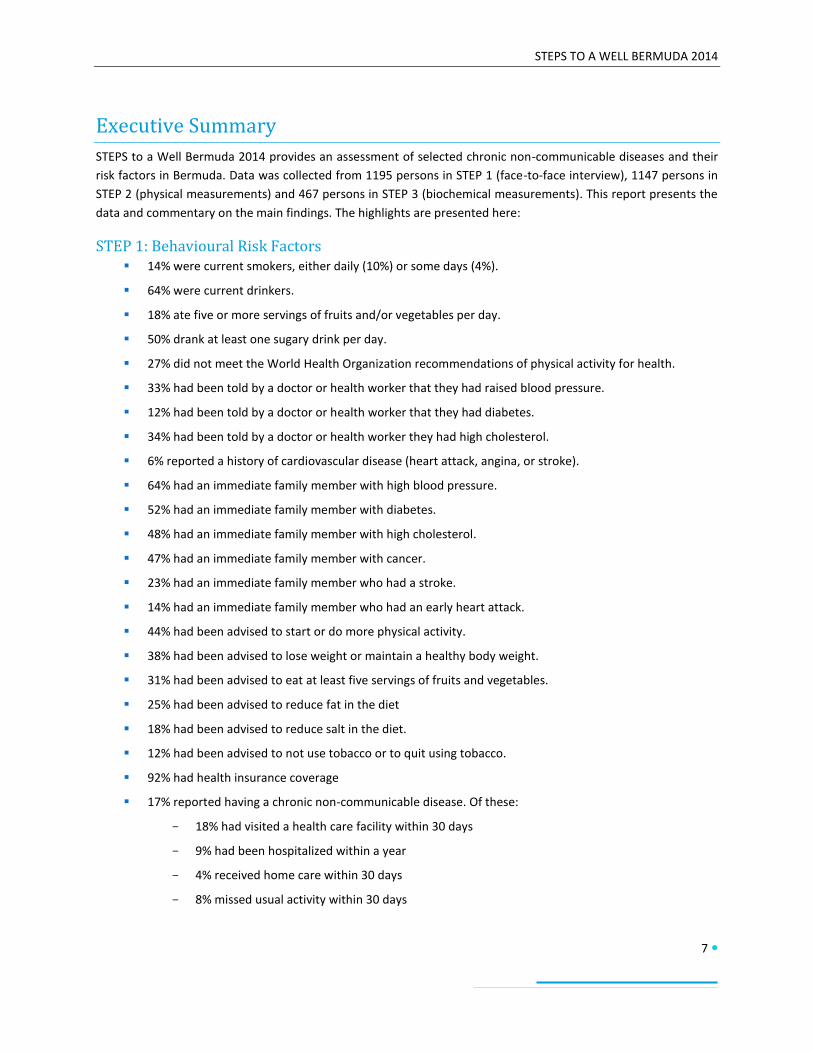
Executive Summary
STEPS to a Well Bermuda 2014 provides an assessment of selected chronic non-communicable diseases and their
risk factors in Bermuda. Data was collected from 1195 persons in STEP 1 (face-to-face interview), 1147 persons in
STEP 2 (physical measurements) and 467 persons in STEP 3 (biochemical measurements). This report presents the
data and commentary on the main findings. The highlights are presented here:
STEP 1: Behavioural Risk Factors 14% were current smokers, either daily (10%) or some days (4%).
64% were current drinkers.
18% ate five or more servings of fruits and/or vegetables per day.
50% drank at least one sugary drink per day.
27% did not meet the World Health Organization recommendations of physical activity for health.
33% had been told by a doctor or health worker that they had raised blood pressure.
12% had been told by a doctor or health worker that they had diabetes.
34% had been told by a doctor or health worker they had high cholesterol.
6% reported a history of cardiovascular disease (heart attack, angina, or stroke).
64% had an immediate family member with high blood pressure.
52% had an immediate family member with diabetes.
48% had an immediate family member with high cholesterol.
47% had an immediate family member with cancer.
23% had an immediate family member who had a stroke.
14% had an immediate family member who had an early heart attack.
44% had been advised to start or do more physical activity.
38% had been advised to lose weight or maintain a healthy body weight.
31% had been advised to eat at least five servings of fruits and vegetables.
25% had been advised to reduce fat in the diet
18% had been advised to reduce salt in the diet.
12% had been advised to not use tobacco or to quit using tobacco.
92% had health insurance coverage
17% reported having a chronic non-communicable disease. Of these:
- 18% had visited a health care facility within 30 days
- 9% had been hospitalized within a year
- 4% received home care within 30 days
- 8% missed usual activity within 30 days

STEPS TO A WELL BERMUDA 2014
8
STEP 2: Physical Measurements The mean heart rate was 73 beats per minute.
The mean blood pressure was 123/80mmHg.
33% had raised blood pressure.
The mean waist circumference was 94cm for men and 90cm for women.
75% were overweight or obese.
Combined Risk Factors from STEPS 1 and 2 The combined risk factor indicator includes current daily smoking, eating less than five servings of fruits and
vegetables, not meeting the WHO recommendation of physical activity for health, raised blood pressure, and
overweight or obesity.
42% had three or more risk factors indicating increased risk for chronic non-communicable diseases.
STEP 3: Biochemical Measurements The mean fasting blood glucose was 92.0mg/dL.
9% had impaired fasting glycaemia.
10% had raised blood glucose.
The mean fasting cholesterol was 189 mg/dL.
26% had high cholesterol.
The STEPS survey represents a significant step forward in gathering national information for informing the national
strategy for the prevention, control and management of NCDs. The survey has provided strong evidence that NCDs
and related modifiable risk factors are prevalent in Bermuda. The following recommendations are outlined as
priority actions for Bermuda:
Continue implementation of the WHO Framework Convention on Tobacco Control
Comprehensive health promotion campaigns to reduce alcohol consumption, particularly targeted at
young people and binge drinking
Develop policies supporting importation of healthy foods and improving the distribution, marketing and
availability of fruit and vegetables
Comprehensive health promotion campaigns promoting the recommended levels of fruit and vegetable
consumption and physical activity and increasing public awareness of the adverse effects of excessive
consumption of high-fat and high-salt foods and high-sugar foods and drinks and physical inactivity
Public awareness campaigns on the importance of regular monitoring and screening of blood pressure,
blood cholesterol and blood sugar levels
Increasing availability and delivery of lifestyle advice by health care providers
Developing a system of community-based care and management of individuals with diagnosed NCDs
All sectors must work together as we endeavour to take greater steps towards a Well Bermuda!

STEPS TO A WELL BERMUDA 2014
9
Introduction
This document is the main report of STEPS to a Well Bermuda, a population-based cross-sectional assessment of
chronic disease risk factors in adults aged 18 and over. It was carried out from November 2013 through December
2014 using the Pan-American version of the World Health Organization’s STEPwise approach to chronic disease risk
factor surveillance (STEPS) methodology. STEPS to a Well Bermuda was conducted with the assistance of the
Caribbean Public Health Agency (CARPHA) and local public health partners, including the Bermuda Hospitals Board,
particularly the Chronic Disease Management Centre, and the Bermuda Diabetes Association.
The Results section provides information on STEPS to a Well Bermuda’s significant findings. Additional information
is provided in the STEPS to a Well Bermuda 2014 Data Book which is available upon request. The Data Book
provides information on every question asked, including counts and confidence intervals. The Survey Instrument is
also available upon request. The Trends section compares selected results from STEPS to a Well Bermuda to the
Health Survey of Adults and Children in Bermuda 2006 and the Health Survey of Adults in Bermuda 2011. The
Discussion section presents the results in context, along with conclusions and recommendations for addressing the
priority chronic disease risk factors.
Background Chronic diseases contribute the greatest proportion of the total burden of disease in the countries of Latin America
and the Caribbean, including Bermuda. This burden of chronic diseases has significant health, social, and economic
consequences.
In Bermuda, the leading causes of death include heart diseases or diseases of the circulatory system, cancer,
diabetes, and diseases of the respiratory system. These chronic diseases accounted for approximately 80% of
deaths in 2012 and are contributed to by common, preventable risk factors.
TABLE 1. LEADING CAUSES OF DEATH, BERMUDA, 2012
Prevention and control of these diseases depends on access to accurate and reliable information about the
prevalence of their associated risk factors. This information is vital to both informing where resources should best
be targeted and for monitoring and evaluating the impact of any actions taken.
STEPS to a Well Bermuda obtained information about eight major behavioural and biological risk factors. The
major (modifiable) behavioral risk factors include tobacco use, harmful alcohol consumption, unhealthy diet (low
fruit and vegetable consumption), and physical inactivity. The major biological risk factors include overweight and
obesity, elevated blood pressure, raised blood glucose, raised cholesterol. Surveillance of these major risk factors is
Underlying Cause of Death %
Diseases of the Circulatory System 35%
Malignant Neoplasms / Cancers 30%
Endocrine, Nutritional and Metabolic Diseases (including Diabetes) 9%
Diseases of the Respiratory System 6%
External Causes 4%
Certain Infectious and Parasitic Diseases 2%
Other Causes 14%

STEPS TO A WELL BERMUDA 2014
10
necessary as they have the greatest impact on chronic disease mortality and morbidity and modification is possible
through effective prevention.
The Health Survey of Adults in Bermuda, 2011, used self-reported data obtained through a telephone survey to
examine these risk factors. That survey found that in the adult population, 13% were current smokers, 50%
currently drank alcoholic beverages, over 80% did not eat at least three servings of fruit or vegetables per day and
18% were sedentary. Additionally, 66% were overweight or obese, 36% had high blood pressure, 11% had
diabetes, and 34% had high cholesterol.
STEPwise Approach to Chronic Disease Risk Factor Surveillance (STEPS) STEPS uses a sequential process to collect chronic disease risk factor information. It starts with gathering
information on key risk factors using a questionnaire (STEP 1), then moves to simple physical measurements, such
as height, weight, and waist circumference (STEP 2) and then to more complex collection of clinical samples for
biochemical analysis (STEP 3). Within each STEP, there are three levels of data collection: core, expanded and
optional. All countries should complete the core items. Expanded and optional items can be completed as
resources allow.
FIGURE 1. DIAGRAMMATIC REPRESENTATION OF THE STEPWISE APPROACH
STEPS differs from other population health surveys in that the behavioural questionnaire is conducted in face-to-
face interviews and show cards are used to clarify what is meant by certain questions. This ensures that all
participants have a clear understanding of the terms used in the STEPS Instrument. As solely self-reported data can
result in underestimation or overestimation of the prevalence of risk factors, health behaviours, and chronic
diseases, self-report data should be supplemented with objective measurement when possible. Therefore, STEPS
contains physical measurements (and biochemical assessments) which can add substantially to the information
about the state of health of a population.
Purpose STEPS to a Well Bermuda, using self-reported information and a range of objective physical and biochemical
measures, aims to:
describe the prevalence and distribution of chronic disease risk factors and selected chronic diseases in
the population,
track the direction and magnitude of risk factor trends, and
provide a sound evidence base to inform public health priorities for the prevention and control of chronic
non-communicable diseases.
STEPS TO A WELL BERMUDA 2014
11
Methods
The Pan-American Health Organization STEPwise approach to chronic disease risk factor surveillance (PAHO-STEPS)
was used in Bermuda. PAHO-STEPS is adapted from the WHO STEPwise approach to chronic disease risk factor
surveillance (WHO-STEPS) and is PAHO’s recommended tool for surveillance of chronic disease risk factors in
adults in the region. A suite of software that allows for the collection of the required STEPS data using Personal
Digital Assistants (PDAs), eSTEPS, was used.
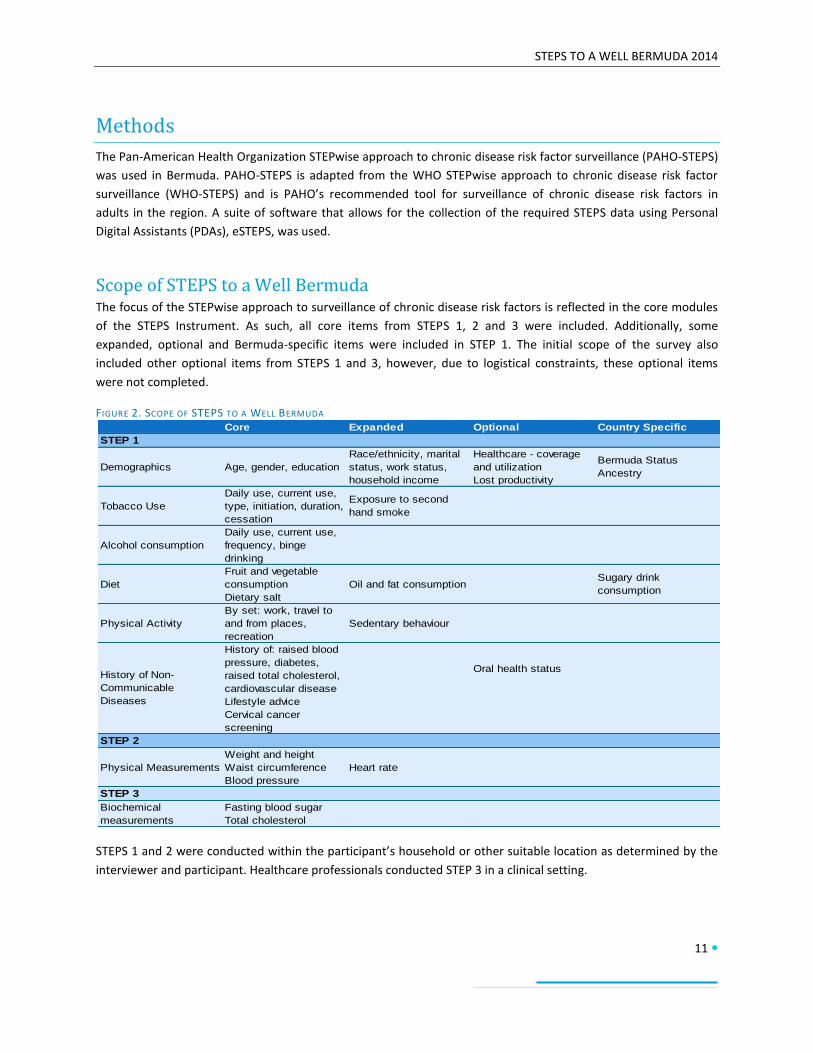
Scope of STEPS to a Well Bermuda The focus of the STEPwise approach to surveillance of chronic disease risk factors is reflected in the core modules
of the STEPS Instrument. As such, all core items from STEPS 1, 2 and 3 were included. Additionally, some
expanded, optional and Bermuda-specific items were included in STEP 1. The initial scope of the survey also
included other optional items from STEPS 1 and 3, however, due to logistical constraints, these optional items
were not completed.
FIGURE 2. SCOPE OF STEPS TO A WELL BERMUDA
STEPS 1 and 2 were conducted within the participant’s household or other suitable location as determined by the
interviewer and participant. Healthcare professionals conducted STEP 3 in a clinical setting.
Core Expanded Optional Country Specific
Demographics Age, gender, education
Race/ethnicity, marital
status, work status,
household income
Healthcare - coverage
and utilization
Lost productivity
Bermuda Status
Ancestry
Tobacco Use
Daily use, current use,
type, initiation, duration,
cessation
Exposure to second
hand smoke
Alcohol consumption
Daily use, current use,
frequency, binge
drinking
Diet
Fruit and vegetable
consumption
Dietary salt
Oil and fat consumptionSugary drink
consumption
Physical Activity
By set: work, travel to
and from places,
recreation
Sedentary behaviour
History of: raised blood
pressure, diabetes,
raised total cholesterol,
cardiovascular disease
Oral health status
Lifestyle advice
Cervical cancer
screening
Physical Measurements
Weight and height
Waist circumference
Blood pressure
Heart rate
Biochemical
measurements
Fasting blood sugar
Total cholesterol
History of Non-
Communicable
Diseases
STEP 1
STEP 2
STEP 3

STEPS TO A WELL BERMUDA 2014
12
Study Population, Sample Size and Sampling The sample size of 2656 households was calculated using the STEPS sample size calculator as applied to the
population projections for persons aged 18 years and older for mid-year 2013. The level of confidence and the
corresponding margin of error used for the sample size calculations were 95% and 0.05, respectively. As STEPS
advises that prior surveys be examined and the risk factor prevalence closest to 50% (0.5) be used as it is most
conservative, the prevalence of raised blood pressure (36%) from the 2011 Health Survey was used. The aim was
to look at young adults, middle-aged adults and older adults by gender resulting in six age-sex strata. A simple
random sample was used (design effect 1). The projected response rate was 80% for STEPS 1 and 2. It was also
anticipated that fewer persons would participate in STEP 3 due to the 12-hour fasting requirement.
FIGURE 3. VARIABLES USED FOR THE SAMPLE SIZE CALCULATION
The Department of Statistics utilized their household sampling frame to provide the selected households by address and individual assessment number. Within each selected household, the Kish Method was used to randomly select one individual aged 18 years and older to participate. Persons with limited capacity to consent and those who were unwilling or unable to participate in STEPS 1, 2 or 3 due to mental and/or physical disability were excluded from participating. Pregnant women were excluded from physical measurements of height, weight, and waist circumference.
Data Collection Data collectors were recruited in September 2013. Preference was given to applicants with experience in
conducting other surveys, including the census. Training was conducted in the evenings for 5 days from 30
September 2013 to 4 October 2013. Representatives from CARPHA facilitated the training with assistance from
Department of Health personnel. Department of Health personnel conducted refresher training on 30 October
2013. This also included practical training on the use of equipment that was unavailable during the initial training.
Pilot testing occurred on 2 - 3 November 2013 using a convenience sample. The training and pilot testing
addressed the following topics:
Overview and rationale of STEPS
Approaching selected households and using the Kish method
Informing participants and obtaining consent
Interview skills
Data collection using eSTEPS on PDAs
Use of show cards
Taking and recording physical measurements and completion of Participant Feedback forms
Procedure for referrals for biochemical measurements, including fasting requirements
Upon successful completion of the training, data collection commenced with 28 interviewing teams for STEPS 1
and 2, overseen by six supervisors. Each team was provided with their respective household listings and maps,
Variable Value
Level of confidence (95%) 1.96
Margin of error 0.05
Risk factor prevalence 0.36
Design effect 1
Number of age-sex strata 6
Expected response rate 0.8

STEPS TO A WELL BERMUDA 2014
13
other survey documents, an eSTEPS PDA and equipment to conduct the physical measurements for STEP 2. This
equipment was provided in a rolling duffle bag and included a stadiometer (height rod), digital scale, BMI wheel,
tape measure, and blood pressure monitor (Omron®).
Healthcare professionals conducting STEP 3 biochemical measurements were trained in the use of CardioChek®
machines and use of eSTEPS on the PDA to enter the data.
Data collection was extended and occurred from 10 November 2013 through 20 December 2014. Data collection
was suspended from 15 December 2013 – 20 January 2014 for the festive season. It was also suspended around
holidays such as Cup Match at the end of July and as necessary due to hurricane activity. Data collection was also
affected by interviewer availability.
Data processing Data was downloaded from each PDA as it became available from active interviewers. This data was stored in a
file created for each PDA and merged at the end of data collection. Although the use of eSTEPS allowed for
immediate error-checking during data collection, additional data cleaning was performed with the assistance of
CARPHA. CARPHA also assisted with the data analysis, including weighting. The data was weighted using individual
and population weights to adjust for age and sex differences between the sample and population. Data analysis
was performed using Epi Info® 3.4.3. STEPS recommended data analysis and reporting tools were used throughout
the data analysis and reporting process, including STEPS-developed Epi Info® programmes, fact sheets and data
book templates. Except for the demographic variables, weighted data are presented in this report.
Response Rates and Limitations As 35% of households were either not reached or ineligible, the overall response rate was low. Among the eligible
households, the response or cooperation rate was 69% for STEP1, 67% for STEP 2 and 27% for STEP 3.
TABLE 2. RESPONSE RATES
The baseline prevalence used for the sample size calculation was based on the prevalence of hypertension. At 36%,
this value was conservative and resulted in a very large sample size. Alternatively, the baseline prevalence of
diabetes (11%) could have been used which would have resulted in a smaller sample size of approximately 1130
households. This sample size may have been more practical given the financial and human resources involved in
carrying out this type of survey and resulted in a higher response rate. Self-selection bias may have also played a
role in STEP 3 participation; persons who may already know their status in regards to the biochemical
measurements under study, namely blood glucose and cholesterol levels, may have been less likely to participate
in STEP 3.
Overall Response Rates STEPS Response Rates
Distribution of responses N % %
Number of completed interviews (STEP 1) 1195 45.0% 69.4%
Number or completed physical measurements (STEP 2) 1147 43.2% 66.6%Number of completed biochemical measurements (STEP 3) 467 17.6% 27.1%
Number of declines 528 19.9% 30.6%
Total eligible households 1723 64.9% 100%
Number of vacant households or businesses 182 6.9%
Addresses not reached 751 28.3%
Total Sample Size 2656 100.0%

STEPS TO A WELL BERMUDA 2014
14
Results
Demographic Information There were a total of 1195 respondents for STEP 1, 1147 for STEP 2 and 467 for STEP 3. The demographic
information presented here is for STEP 1. The demographics for STEPS 2 and 3 are similar. Overall, the socio-
demographics of the respondents are similar to the resident Bermuda population as presented in the 2010 Census
on Population and Housing in Bermuda.
The majority of respondents were women (58.7%). The age breakdowns were similar with 34.5% of respondents
aged 18-44 years, 30.3% of respondents aged 45-59 years and 35.2% of respondents aged 60 years and older.
Among men, the most represented age group was 18-44; among women, it was those aged 60 years and over.
FIGURE 4. AGE DISTRIBUTION OF RESPONDENTS BY GENDER
Over half of respondents (55.8%) were black and around a third (32.4%) were white. The remaining ethnicities
represented were Asian (2.7%), mixed (6.7%), and other (2.5%). When asked about their ancestry, over half of
respondents (54.6%) reported Bermudian ancestry, 11.0% reported West Indian ancestry, 9.6% reported British
ancestry and 7.6% reported Portuguese ancestry. Fewer respondents reported having American (3.5%), European
(3.1%), Asian (2.6%), or Canadian (3.1%) ancestry. The remaining ancestries represented were African (1.8%),
Native American (0.5%) and other (3.3%). The vast majority of respondents (80.6%) were Bermudian. Among the
non-Bermudians, 5.3% were Permanent Resident Certificate Holders and 4.5% were spouses of Bermudians. Of all
respondents, 25.9% had never been married, 47.4% were currently married, either first time or remarried, 8.5%
were divorced and 18.3% were divorced or legally separated.
The majority of respondents (70.5%) were employed. One-fifth (20.8%) of respondents were retired. The
remaining respondents were out of work (5.1%), homemakers (2.7%) or students (1.0%). On average, respondents
had spent 14.0 years in school or full-time study; however, there was a trend of younger persons having more
years of education than older persons. Respondents aged 18-44 had on average 15 years of schooling and
respondents aged 45-59 had 14.6 years of schools compared to an average of 12.3 years of schooling in those aged
60 years and older. Very few respondents (0.2%) had no formal schooling, had completed primary school only
(2.7%) or had completed up to middle school (4.9%). Overall, 92.4% had completed secondary or higher education.
Additionally, just over half of respondents (51.8%) had an estimated household income of less than $72,000.
15.1% 19.3% 12.8%
17.5% 13.4%
21.8%
Men Women
18-44 45-59 60+

STEPS TO A WELL BERMUDA 2014
15
Tobacco Use Respondents were asked about current and past cigarette smoking. Overall, 13.9% of respondents reported
current smoking, either daily (10.3%) or some days (3.6%). Additionally, 27.6% of respondents were former
smokers and 58.5% said they had never smoked. Men (19.8%) were more likely to be current smokers than women
(7.5%). Men (14.8%) were also more likely to be daily smokers than women (5.4%). Adults aged 18-44 (66.9%)
were more likely to have never smoked than adults aged 60 years and older (45.9%).
FIGURE 5. SMOKING STATUS BY GENDER
The average age that smokers started smoking was 18 years and the average duration of smoking was 29.5 years;
smoking duration is influenced by age.
Among daily smokers, 83.3% of men and 100% of women smoked manufactured cigarettes. Daily smokers smoked
an average of 11 manufactured cigarettes per day.
Among current smokers, 78.5% smoke manufactured cigarettes and 17.3% smoke hand-rolled cigarettes. In the 12
months prior, 44.9% of current smokers had been advised by a healthcare provider to quit smoking and 45.4% had
tried to quit smoking. For former daily smokers, the average number of years since they had quit smoking was 22.4
years; this was influenced by age with the average being 9.8 years among respondents aged 18-44 years.
Respondents were asked if in the past 7 days someone had smoked in their home or in closed areas in their
workplace. Overall, 11.2% reported exposure to second-hand smoke in the home while 12.0% reported exposure
to second-hand smoke in the workplace.
14.8%
5.0%
29.1%
51.2%
5.4% 2.0%
25.9%
66.6%
10.3%
3.6%
27.6%
58.5%
Daily Smoker Non-daily Smoker Former Smoker Never Smoker
Men Women Both Sexes

STEPS TO A WELL BERMUDA 2014
16
Alcohol Consumption Respondents were asked about whether and how often they drank alcoholic beverages. They were also asked how
many times they had consumed six or more alcoholic drinks at a single occasion, which would be considered heavy
episodic drinking or binge drinking. Show cards were used to illustrate a standard drink as being equivalent to a 12-
ounce beer, a 5-ounce glass of wine or a drink with one shot of liquor.
Overall, 7.6% were lifetime abstainers, 15.0% were 12-month abstainers and 64.0% were current drinkers, having
consumed alcohol in the past 30 days. Women (12.7%) were more likely to be lifetime abstainers than men (2.9%)
and adults aged 18-44 (7.8%) were least likely to be 12-month abstainers. Men (75.5%) were more likely to be
current drinkers than women (51.4%) and adults aged 60 years and older (46.3%) were least likely to be current
drinkers.
FIGURE 6. CURRENT DRINKERS BY AGE-GROUP AND GENDER
Current drinkers drank on average 11 times during the past 30 days and drank an average of three standard
alcoholic drinks on each occasion. On average, the largest number of standard alcoholic drinks was five drinks for
men and three drinks for women.
While 13.5% of adults engaged in binge drinking overall, adults aged 60 years and older were least likely to engage
in binge drinking (3.5%). Men (21.4%) were more likely to engage in binge drinking than women (4.8%). Men
engaged in binge drinking an average of five times in a month.
Among respondents who drank alcohol in the last 12 months, 19.0% drank alcohol daily and 25.1% drank alcohol
less than once a month. Women (37.6%) were more likely to drink alcohol less than once a month than men
(15.9%).
Among former drinkers, 14.6% had stopped drinking due to health reasons, either negative impact on their health
or following the advice of a doctor or health care provider.
83.1%
61.7%
73.7% 74.1%
53.2%
63.6% 60.6%
33.4%
46.3%
75.5%
51.4%
64.0%
Men Women Both Sexes
18-44 45-59 60+ All ages
STEPS TO A WELL BERMUDA 2014
17
Oral Health Respondents were asked about their oral health status and dental hygiene.
Most of the respondents (86.4%) had 20 or more natural teeth. The proportion of respondents with 20 or more
natural teeth decreased with age from 98.6% of adults aged 18-44 years to 89.3% of adults aged 45-59 years to
59.6% of adults aged 60 years and older.
Denture usage among all respondents was 20.2%. Among those with dentures, 90.5% had an upper jaw denture,
74.3% had a lower jaw denture and 66.5% had both an upper jaw and a lower jaw denture.
Less than 1% (0.3%) of respondents had never received dental care while 68.9% had seen a dentist in the previous
year. The main reason for dental visits was routine check-up (61.6%), followed by pain or trouble with teeth
(14.6%) and follow-up treatments (13.0%). Overall, 19.4% reported having oral pain or discomfort in the previous
year. Women (25.7%) were more likely to report oral pain and discomfort than men (13.6%). Few respondents
reported having poor or very poor state of teeth (4.2%) or gums (2.8%).
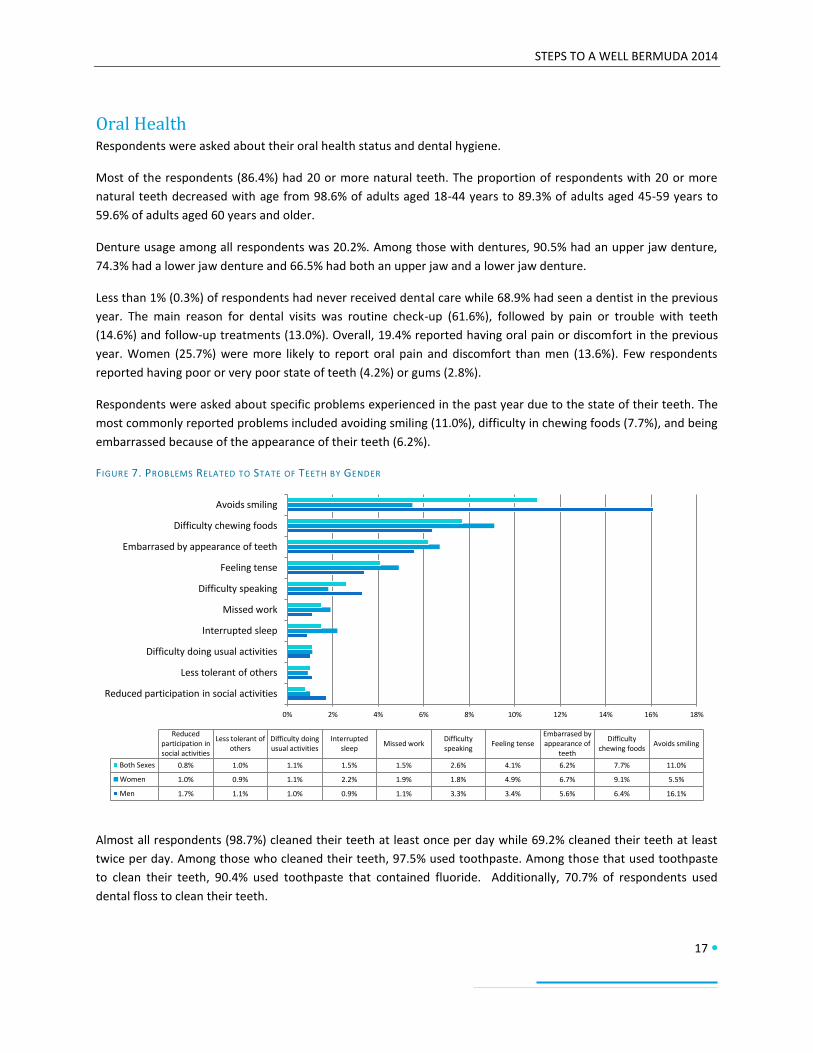
Respondents were asked about specific problems experienced in the past year due to the state of their teeth. The
most commonly reported problems included avoiding smiling (11.0%), difficulty in chewing foods (7.7%), and being
embarrassed because of the appearance of their teeth (6.2%).
FIGURE 7. PROBLEMS RELATED TO STATE OF TEETH BY GENDER
Almost all respondents (98.7%) cleaned their teeth at least once per day while 69.2% cleaned their teeth at least
twice per day. Among those who cleaned their teeth, 97.5% used toothpaste. Among those that used toothpaste
to clean their teeth, 90.4% used toothpaste that contained fluoride. Additionally, 70.7% of respondents used
dental floss to clean their teeth.
0% 2% 4% 6% 8% 10% 12% 14% 16% 18%
Reduced participation in social activities
Less tolerant of others
Difficulty doing usual activities
Interrupted sleep
Missed work
Difficulty speaking
Feeling tense
Embarrased by appearance of teeth
Difficulty chewing foods
Avoids smiling
Reduced participation in social activities
Less tolerant of others
Difficulty doing usual activities
Interrupted sleep
Missed work Difficulty speaking
Feeling tense Embarrased by appearance of
teeth
Difficulty chewing foods
Avoids smiling
Both Sexes 0.8% 1.0% 1.1% 1.5% 1.5% 2.6% 4.1% 6.2% 7.7% 11.0%
Women 1.0% 0.9% 1.1% 2.2% 1.9% 1.8% 4.9% 6.7% 9.1% 5.5%
Men 1.7% 1.1% 1.0% 0.9% 1.1% 3.3% 3.4% 5.6% 6.4% 16.1%

STEPS TO A WELL BERMUDA 2014
18
Dietary Habits Respondents were asked how many servings of fruit and vegetables they usually eat and how often they eat fruits
and vegetables. Show cards were used to demonstrate serving sizes of fruits and vegetables.
The largest proportion (48.3%) reported that they ate one to two servings of fruit and/or vegetables per day.
Additionally, 27.1% reported eating three to four servings of fruit and/or vegetables per day. However, 6.5%
reported eating less than one serving of fruits and vegetables per day and 18.1% reported eating five or more
servings of fruits and/or vegetables per day. Overall, 81.9% are eating less than five servings of fruit and/or
vegetables per day.
Separately, respondents reported eating fruits on an average of five days per week and vegetables on average six
days per week. On these days, they reported eating an average of one serving of fruit and two servings of
vegetables.
FIGURE 8. AVERAGE FRUIT AND VEGETABLE CONSUMPTION PER DAY
Respondents were also asked about consumption of sugary drinks. Nearly half of all respondents (49.6%) reported
having at least one sugary drink per day.
FIGURE 9. AVERAGE SUGARY DRINK CONSUMPTION PER DAY
Less than 1 serving, 6.5%
1-2 servings, 48.3% 3-4 servings, 27.1%
5 or more servings, 18.1%
0 sugary drinks, 50.4%
1-2 sugary drinks, 33.7%
3-5 sugary drinks, 13.5%
More than 5 sugary drinks, 2.4%
STEPS TO A WELL BERMUDA 2014
19
Respondents were asked about types of oils and fats used in meal preparation in their household. The most
commonly used oils or fats were olive or canola oil (69.2%) and vegetable oil (20.6%).
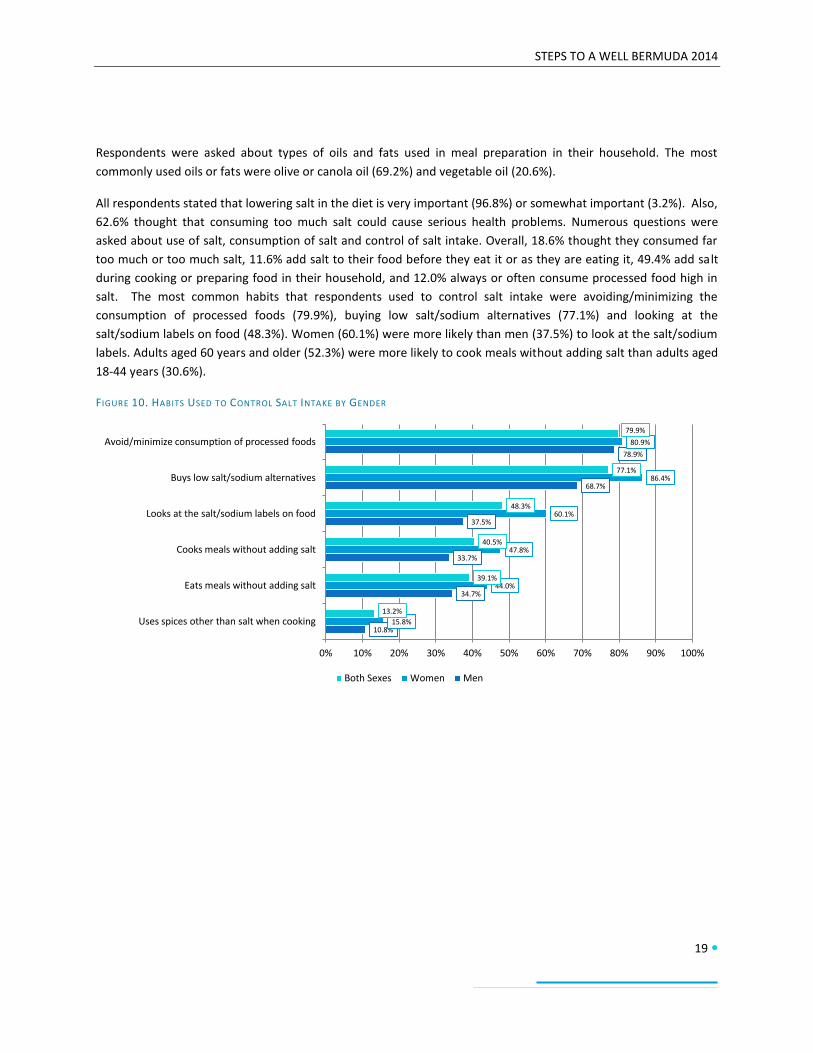
All respondents stated that lowering salt in the diet is very important (96.8%) or somewhat important (3.2%). Also,
62.6% thought that consuming too much salt could cause serious health problems. Numerous questions were
asked about use of salt, consumption of salt and control of salt intake. Overall, 18.6% thought they consumed far
too much or too much salt, 11.6% add salt to their food before they eat it or as they are eating it, 49.4% add salt
during cooking or preparing food in their household, and 12.0% always or often consume processed food high in
salt. The most common habits that respondents used to control salt intake were avoiding/minimizing the
consumption of processed foods (79.9%), buying low salt/sodium alternatives (77.1%) and looking at the
salt/sodium labels on food (48.3%). Women (60.1%) were more likely than men (37.5%) to look at the salt/sodium
labels. Adults aged 60 years and older (52.3%) were more likely to cook meals without adding salt than adults aged
18-44 years (30.6%).
FIGURE 10. HABITS USED TO CONTROL SALT INTAKE BY GENDER
10.8%
34.7%
33.7%
37.5%
68.7%
78.9%
15.8%
44.0%
47.8%
60.1%
86.4%
80.9%
13.2%
39.1%
40.5%
48.3%
77.1%
79.9%
0% 10% 20% 30% 40% 50% 60% 70% 80% 90% 100%
Uses spices other than salt when cooking
Eats meals without adding salt
Cooks meals without adding salt
Looks at the salt/sodium labels on food
Buys low salt/sodium alternatives
Avoid/minimize consumption of processed foods
Both Sexes Women Men

STEPS TO A WELL BERMUDA 2014
20
Physical Activity Respondents were asked numerous questions about their physical activity at work, during transport (such as
walking or cycling to or from places), and during recreation. This was used to determine total and relative levels of
physical activity.
The World Health Organization (WHO) has recommended that adults engage in no less than 150 minutes of
moderate physical activity per week, or equivalent. Overall, 27.1% were not meeting these WHO
recommendations on physical activity for health. Women (33.7%) were more likely to not meet the
recommendations than men (20.2%).
FIGURE 11. INSUFFICIENT PHYSICAL ACTIVITY FOR HEALTH (WHO RECOMMENDATIONS) BY AGE-GROUP AND GENDER
Additionally, 57.6% of respondents did not engage in any vigorous physical activity. There were differences by
gender with 45.5% of men not engaging in vigorous physical activity compared to 69.4% of women. Women
(68.9%) were also more likely to not engage in physical activity at work then men (50.8%). Overall, 60.0% do not
engage in any physical activity at work, 66.6% do not engage in any transport-related physical activity and 39.3%
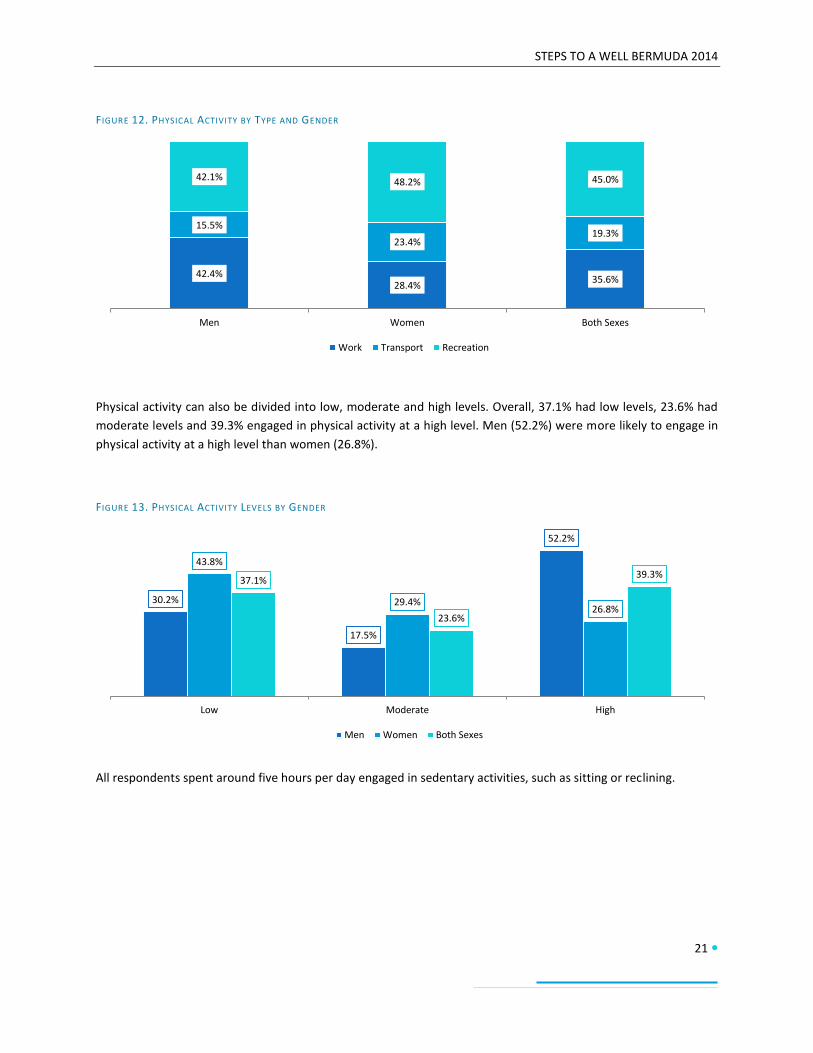
do not engage in any physical activity during recreation. The overall composition of physical activity showed that
most physical activity occurred during recreation (45.0%), followed by work (35.6%) and then transport (19.3%).
However, there were differences by gender with males engaging in physical activity at work (42.4%) and during
recreation (42.1%) almost equally.
12.6%
24.5%
18.6% 18.4%
37.1%
27.7%
35.3%
44.4%
40.1%
20.2%
33.7%
27.1%
Men Women Both Sexes
18-44 45-59 60+ All ages
STEPS TO A WELL BERMUDA 2014
21
FIGURE 12. PHYSICAL ACTIVITY BY TYPE AND GENDER
Physical activity can also be divided into low, moderate and high levels. Overall, 37.1% had low levels, 23.6% had
moderate levels and 39.3% engaged in physical activity at a high level. Men (52.2%) were more likely to engage in
physical activity at a high level than women (26.8%).
FIGURE 13. PHYSICAL ACTIVITY LEVELS BY GENDER
All respondents spent around five hours per day engaged in sedentary activities, such as sitting or reclining.
42.4% 28.4%
35.6%
15.5%
23.4% 19.3%
42.1% 48.2% 45.0%
Men Women Both Sexes
Work Transport Recreation
30.2%
17.5%
52.2%
43.8%
29.4% 26.8%
37.1%
23.6%
39.3%
Low Moderate High
Men Women Both Sexes

STEPS TO A WELL BERMUDA 2014
22
History of Non-Communicable Diseases
Blood Pressure Respondents were asked if they had ever had their blood pressure measured by a doctor or other health worker,
whether they had ever been told by a doctor or health worker they had raised blood pressure or hypertension, and
whether they were currently taking medication prescribed for raised blood pressure.
Only 1.4% reported that they had never had their blood pressure measured. Overall, 66.0% reported that they had
their blood pressure measured but had not been told they had raised blood pressure, and 32.7% reported being
told by a doctor or health worker that they had raised blood pressure. Specifically, 13.1% had been diagnosed over
a year ago and 19.6% had been diagnosed within the past 12 months.
FIGURE 14. SELF-REPORTED HISTORY OF BLOOD PRESSURE MEASUREMENT AND DIAGNOSIS OF RAISED BLOOD PRESSURE OR
HYPERTENSION BY AGE-GROUP
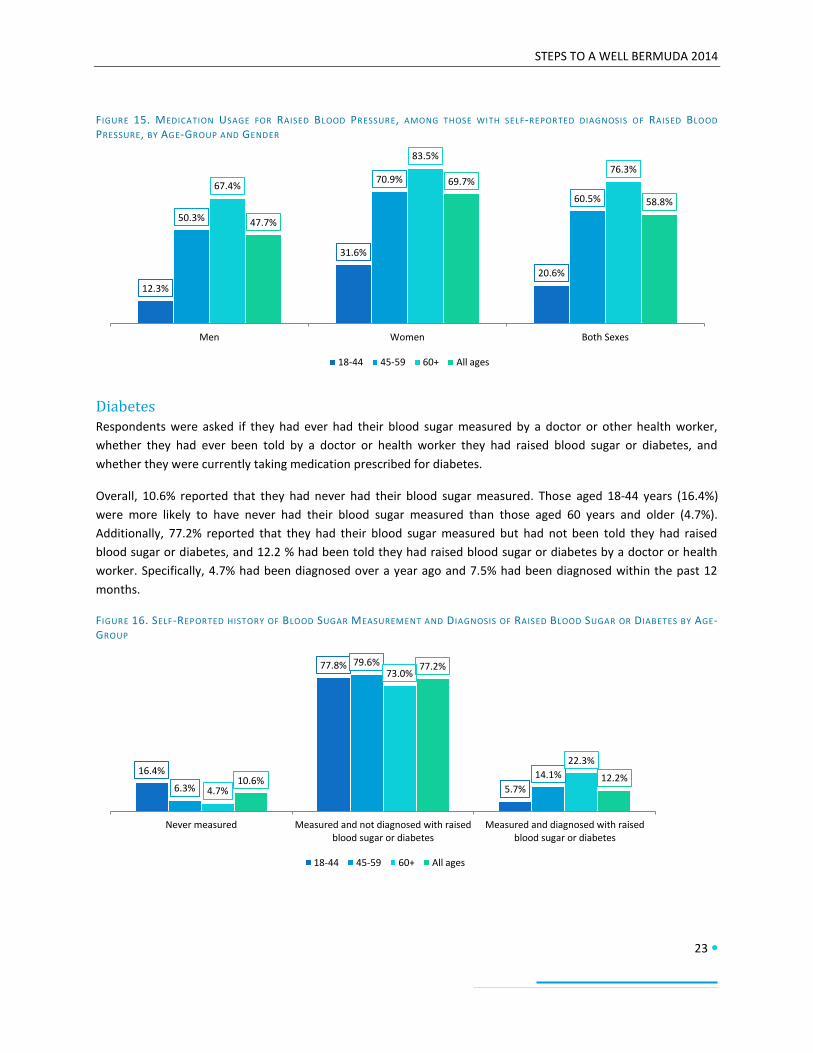
Of those reporting a diagnosis of raised blood pressure, 58.8% reported that they had taken medication for raised
blood pressure during the past two weeks. Medication usage increased with age and differed by gender. Among
those with high blood pressure, 20.6% of adults aged 18-44 years, 60.5% of those aged 45-59 years and 76.3% of
those aged 60 years older had taken medication for raised blood pressure in the past two weeks. More women
(69.7%) with raised blood pressure took blood pressure medication than men (47.7%).
Respondents were also asked about use of herbal or traditional remedies for their raised blood pressure. Overall,
8.1% reported taking a herbal or traditional remedy for their raised blood pressure.
2.0%
83.6%
14.4%
1.4%
55.0%
43.6%
0.2%
45.8%
54.0%
1.4%
66.0%
32.7%
Never measured Measured and not diagnosed with raised blood pressure
Measured and diagnosed with raised blood pressure
18-44 45-59 60+ All ages
STEPS TO A WELL BERMUDA 2014
23
FIGURE 15. MEDICATION USAGE FOR RAISED BLOOD PRESSURE, AMONG THOSE WITH SELF-REPORTED DIAGNOSIS OF RAISED BLOOD
PRESSURE, BY AGE-GROUP AND GENDER
Diabetes Respondents were asked if they had ever had their blood sugar measured by a doctor or other health worker,
whether they had ever been told by a doctor or health worker they had raised blood sugar or diabetes, and
whether they were currently taking medication prescribed for diabetes.
Overall, 10.6% reported that they had never had their blood sugar measured. Those aged 18-44 years (16.4%)
were more likely to have never had their blood sugar measured than those aged 60 years and older (4.7%).
Additionally, 77.2% reported that they had their blood sugar measured but had not been told they had raised
blood sugar or diabetes, and 12.2 % had been told they had raised blood sugar or diabetes by a doctor or health
worker. Specifically, 4.7% had been diagnosed over a year ago and 7.5% had been diagnosed within the past 12
months.
FIGURE 16. SELF-REPORTED HISTORY OF BLOOD SUGAR MEASUREMENT AND DIAGNOSIS OF RAISED BLOOD SUGAR OR DIABETES BY AGE-GROUP
12.3%
31.6%
20.6%
50.3%
70.9%
60.5% 67.4%
83.5%
76.3%
47.7%
69.7%
58.8%
Men Women Both Sexes
18-44 45-59 60+ All ages
16.4%
77.8%
5.7% 6.3%
79.6%
14.1%
4.7%
73.0%
22.3%
10.6%
77.2%
12.2%
Never measured Measured and not diagnosed with raised blood sugar or diabetes
Measured and diagnosed with raised blood sugar or diabetes
18-44 45-59 60+ All ages

STEPS TO A WELL BERMUDA 2014
24
Of those reporting a diagnosis of diabetes, 57.5% reported that they had taken medication for raised blood sugar
during the past two weeks and 15.4% reported current use of insulin. These respondents were also asked about
eye and foot examinations as part of their diabetes care. Although all respondents reported receiving eye and foot
examinations as part of their care, only 5.1 % reported having their eyes examined within the past two years while
93.4% reported having their feet examined within the past year.
Cholesterol Respondents were asked if they had ever had their cholesterol measured by a doctor or other health worker,
whether they had ever been told by a doctor or health worker they had raised cholesterol, and whether they were
currently taking medication prescribed for raised cholesterol.
Overall, 15.7% reported that they had never had their cholesterol measured. Additionally, 50.4% reported that
they had their cholesterol measured but had not been told they had raised cholesterol and, and 33.9% had been
told they had raised cholesterol by a doctor or health worker. Specifically, 14.0% had been diagnosed over a year
ago and 19.9% had been diagnosed within the past 12 months.
Of those reporting a diagnosis of raised cholesterol, 33.3% reported that they had taken medication for raised
cholesterol during the past two weeks. Respondents were also asked about use of herbal or traditional remedies
for their raised cholesterol. Overall, 5.4% reported taking a herbal or traditional remedy for their raised
cholesterol.
FIGURE 17. SELF-REPORTED HISTORY OF CHOLESTEROL MEASUREMENT AND DIAGNOSIS OF RAISED CHOLESTEROL BY AGE-GROUP
Cardiovascular Disease Respondents were asked if they had ever had a heart attack or chest pain from heart disease (angina) or stroke
(cerebrovascular accident or incident).
Overall, 6.0% reported a history of cardiovascular disease. This was influenced by age and ranged from 2.0% in
persons aged 18-44 years to 6.2% in persons aged 45-59 years to 13.4% in persons aged 60 years and older.
25.2%
47.9%
27.0%
9.5%
56.9%
33.6%
5.6%
47.1% 47.3%
15.7%
50.4%
33.9%
Never measured Measured and not diagnosed with raised cholesterol
Measured and diagnosed with raised cholesterol
18-44 45-59 60+ All ages

STEPS TO A WELL BERMUDA 2014
25
FIGURE 18. SELF-REPORTED HISTORY OF CARDIOVASCULAR DISEASE BY AGE-GROUP AND GENDER
Respondents were also asked about regular use of aspirin or statins to prevent or treat heart disease. Overall, 11.8
% regularly used aspirin and 6.6% regularly used statins. The use of aspirin and statins increased with increasing
age.
FIGURE 19. USE OF ASPIRIN OR STATINS TO PREVENT OR TREAT HEART DISEASE BY AGE-GROUP
Cervical Cancer Screening Female respondents were asked about ever having a screening test for cervical cancer. Overall 88.1% had ever had
a cervical cancer screening test. This increased to 91.2% when looking at only those respondents between the ages
of 30 and 49 years.
1.4%
2.9% 2.0%
8.6%
3.8%
6.2%
14.1%
12.8% 13.4%
6.2% 5.8% 6.0%
Men Women Both Sexes
18-44 45-59 60+ All ages
0.5% 1.4%
14.9%
7.9%
29.2%
14.8%
11.8%
6.6%
Regular use of aspirin Regular use of statins
18-44 45-59 60+ All ages

STEPS TO A WELL BERMUDA 2014
26
Family History of Chronic Disease Conditions Respondents were asked if any of their immediate family members had been diagnosed with any of the following
diseases: diabetes, raised blood pressure, stroke, cancer or malignant tumour, raised cholesterol, or early heart
attack (below age 55 for men and below age 65 for women). The most commonly reported chronic diseases or
conditions among family members were raised blood pressure (64.3%), diabetes or high blood sugar (52.2%),
raised cholesterol (48.1%) and cancer (46.7%).
FIGURE 20. FAMILY HISTORY OF SELECTED CHRONIC DISEASES BY GENDER
Lifestyle Advice Respondents were asked if a doctor or health care worker had advised them of certain lifestyle factors to reduce
their chronic disease risk during the past three years. These included advice about tobacco use, diet (salt, fat, fruits
and vegetables), physical activity and healthy body weight. The most commonly reported advice provided was
about physical activity (44.4%) and healthy body weight (38.1%).
FIGURE 21. L IFESTYLE ADVICE PROVIDED BY A DOCTOR OR HEALTH WORKER OVER THE PAST THREE YEARS, BY GENDER
56.8%
51.2% 48.8%
39.1%
15.3%
9.3%
71.1%
53.1%
47.3%
55.0%
31.0%
18.8%
64.3%
52.2% 48.1% 46.7%
22.8%
13.9%
Raised blood pressure Diabetes Raised cholesterol Cancer Stroke Early heart attack
Men Women Both Sexes
42.4%
33.0% 32.4%
22.5%
15.6% 14.7%
46.7% 43.6%
29.5% 28.8%
20.8%
8.8%
44.4%
38.1%
31.0%
25.5%
18.1%
11.9%
Start or do more physical activity
Lose weight or maintain a healthy
body weight
Eat at least five servings of fruit
and/or vegetables
Reduce fat in diet Reduce salt in the diet Quit or do not use tobacco
Men Women Both Sexes
STEPS TO A WELL BERMUDA 2014
27
Health Care
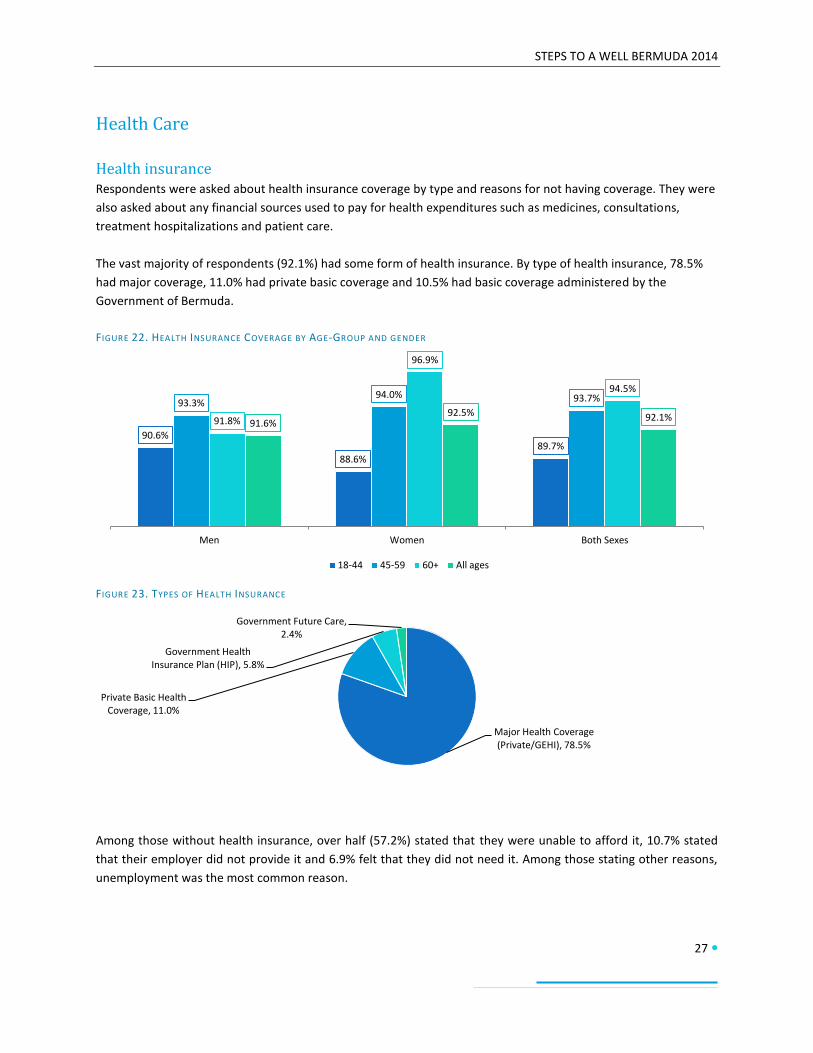
Health insurance Respondents were asked about health insurance coverage by type and reasons for not having coverage. They were
also asked about any financial sources used to pay for health expenditures such as medicines, consultations,
treatment hospitalizations and patient care.
The vast majority of respondents (92.1%) had some form of health insurance. By type of health insurance, 78.5%
had major coverage, 11.0% had private basic coverage and 10.5% had basic coverage administered by the
Government of Bermuda.
FIGURE 22. HEALTH INSURANCE COVERAGE BY AGE-GROUP AND GENDER
FIGURE 23. TYPES OF HEALTH INSURANCE
Among those without health insurance, over half (57.2%) stated that they were unable to afford it, 10.7% stated
that their employer did not provide it and 6.9% felt that they did not need it. Among those stating other reasons,
unemployment was the most common reason.
90.6%
88.6% 89.7%
93.3% 94.0% 93.7%
91.8%
96.9%
94.5%
91.6% 92.5% 92.1%
Men Women Both Sexes
18-44 45-59 60+ All ages
Major Health Coverage (Private/GEHI), 78.5%
Private Basic Health Coverage, 11.0%
Government Health Insurance Plan (HIP), 5.8%
Government Future Care, 2.4%

STEPS TO A WELL BERMUDA 2014
28
The main financial sources for health care expenditure were current income (63.4%), reimbursement from health
insurance (45.1%) and savings (28.5%). Few respondents reported selling items (0.5%), asking a friend or family
member (3.7%) or borrowing from someone (0.9%).
Care for Non-Communicable Diseases Respondents were asked if they ever had or currently have a non-communicable disease (NCD) such as
cardiovascular disease including heart disease and stroke, cancer, chronic respiratory disease or diabetes. These
persons were then asked about use of health care services, home care and any missed activity due to their NCD.
Overall, 17.3% reported having any of NCDs in question. Reporting of an NCD increased with age and adults aged
18-44 years (7.3%) were least likely to have an NCD. Of those reporting an NCD, 18.7% visited a health care facility
(doctor’s office or clinic) during the prior 30 days, 9.4% required hospitalization during the prior 12 months and
3.8% received home care from a family member or friend. Also, 8.2% missed time from usual activity, including
work.
FIGURE 24. REPORTED HISTORY OF OR CURRENT NCD BY AGE-GROUP AND GENDER
FIGURE 25. HEALTH CARE USE, HOME CARE AND MISSED USUAL ACTIVITY AMONG THOSE WITH AN NCD BY AGE-GROUP
5.0%
10.2% 7.3%
19.5% 21.6% 20.6%
34.1%
30.1% 32.0%
15.6%
19.1% 17.3%
Men Women Both Sexes
18-44 45-59 60+ All ages
13.4%
0.0% 0.0% 2.3%
17.3%
12.2%
3.6%
10.5%
22.4%
11.4%
5.6%
9.0%
18.7%
9.4%
3.8%
8.2%
Visited a health care facility within 30 days
Hospitalized within one year Received home care within 30 days
Missed usual activity within 30 days
18-44 45-59 60+ All ages

STEPS TO A WELL BERMUDA 2014
29
Physical Measurements Respondents had physical measurements of heart rate, blood pressure, waist circumference, height and weight
taken. Height and weight were used to calculate Body Mass Index (BMI).
Heart Rate The mean heart rate (beats per minute) was 73, which is within the normal resting heart rate range for adults of 60
to 100 beats per minute.
Blood pressure The mean blood pressure, including those currently on medication for raised blood pressure, was 123/80 mmHg.
This is higher than the classification for normal blood pressure which is between 90/60mmHg and 119/79 mmHg
and below the classification for raised blood pressure which is 140/90mmHg and above. However, the mean blood
pressure for adults aged 18-44 was within the normal blood pressure classification at 114/77mmHg. Additionally,
mean systolic blood pressure increased with age. The mean diastolic blood pressure was lowest in persons aged
18-44 years.
FIGURE 26. MEAN SYSTOLIC BLOOD PRESSURE BY AGE-GROUP AND GENDER
Excluding respondents on medication for raised blood pressure, 21.6% had raised blood pressure measurements of
140/90mmHG or above and 7.0% had raised blood pressure measurements of 160/100mmHG or above. Including
those on medication for raised blood pressure, 33.4% had raised blood pressure measurements of 140/90mmHG
or above and 21.0% had raised blood pressure measurements of 160/100mmHg or above. There were increases
with age for those respondents with raised blood pressure of 140/90mmHg or above.
18-44 45-59 60+
Men 117 132 140
Women 109 122 136
Both Sexes 114 127 138
100
105
110
115
120
125
130
135
140
Me
an S
ysto
lic B
loo
d P
ress
ure

STEPS TO A WELL BERMUDA 2014
30
FIGURE 27. MEASURED RAISED BLOOD PRESSURE (140/90MMHG OR ABOVE) BY AGE-GROUP
Among those with raised blood pressure (140/90mmHg or above) and/or on treatment for raised blood pressure,
21.9% were on medication and had their blood pressure measured as less than 140/90mmHg. Additionally, 23.1%
were on medication and had their blood pressure measured as 140/90mmHg or above, and 55.0% were not on
medication and had their blood pressure measured as 140/90mmHg or above. There were differences by gender
with men (66.0%) being more likely to have raised blood pressure and not be on medication than women (43.7%).
FIGURE 28. BLOOD PRESSURE TREATMENT AND CONTROL BY GENDER
Waist circumference The mean waist circumference was 94cm for men and 90cm for women. According to World Health Organization
standards, these measurements are within the classification of increased risk for certain non-communicable
diseases for both men (greater than or equal to 94cm) and women (greater than or equal to 80cm). Only men
aged 18-44 years had a mean waist circumference that was below the classification of increased risk. The mean
waist circumference for women aged 45-59 years (93cm) and 60 years and older (92cm) put them at substantially
increased risk (greater than or equal to 88cm) for certain non-communicable diseases.
9.1% 11.3%
28.2%
43.7% 47.0%
63.9%
21.6%
33.4%
Raised blood pressure, excluding those on medication Raised blood pressure, including those on medication
18-44 45-59 60+ All ages
15.6% 18.4%
66.0%
28.4% 28.0%
43.7%
21.9% 23.1%
55.0%
On medication and BP less than 140/90mmHg
On medication and BP 140/90mmHg or above
Not on medication and BP 140/90mmHg or above
Men Women Both Sexes

STEPS TO A WELL BERMUDA 2014
31
FIGURE 29. MEAN WAIST CIRCUMFERENCE BY AGE-GROUP AND GENDER
Body Mass Index (BMI) For BMI, underweight is classified as below 18.5 kg/m2, normal weight is classified between 18.5-24.9 kg/m
2,
overweight is classified between 25.0-29.9 kg/m2, and obese is classified as greater than or equal to 30 kg/m
2. The
mean BMI among the respondents was 29.0 kg/m2. This falls within the classification of overweight. According to
BMI classifications, 0.7% were underweight, 24.6% were of normal weight, 40.2% were overweight and 34.4%
were obese. Overall, 74.6% are overweight or obese. More men (49.6%) were overweight than women (29.6%).
FIGURE 30. BMI CLASSIFICATIONS BY GENDER
18-44 45-59 60+
Men 91 96 97
Women 86 93 92
80
82
84
86
88
90
92
94
96
98
100
Me
an W
aist
Cir
cum
fere
nce
0.3% 1.2% 0.7%
20.6% 29.1% 24.6%
49.6% 29.6% 40.2%
29.4% 40.0% 34.4%
Men Women Both Sexes
Underweight Normal Weight Overweight Obese

STEPS TO A WELL BERMUDA 2014
32
Combined Risk Factors The World Health Organization has selected five risk factors/conditions that increase the risk of non-communicable
diseases. These include:
Current daily smoking
Eating less than five servings of fruit and/or vegetables
Not meeting the WHO recommendations for physical activity for health
Overweight or obesity
Raised blood pressure of greater than or equal to 140/90mmHg or currently on medication for raised
blood pressure
Over half of all respondents (54.8%) had 1-2 of these risk factors, just under half (42.0%) had 3-5 of these risk
factors and 3.2% had none of these risk factors. Women (5.0%) were more likely than men (1.3%) to have none of
the selected risk factors. Adults aged 18-44 years were most likely to have 1-2 risk factors (70.8%) and least likely
to have 3-5 risk factors (24.8%). The number of risk factors generally increased with age, particularly among
women.
FIGURE 31. NUMBER OF SELECTED RISK FACTORS FOR NON-COMMUNICABLE DISEASES
FIGURE 32. INCREASED RISK OF NON-COMMUNICABLE DISEASES (3-5 RISK FACTORS) BY AGE-GROUP AND GENDER
0 risk factors, 3.2%
1-2 risk factors, 54.8% 3-5 risk factors, 42.0%
26.4% 23.2% 24.8%
53.5%
44.5% 49.0%
60.3% 63.0% 61.7%
43.7% 40.3% 42.0%
Men Women Both Sexes
18-44 45-59 60+ All ages

STEPS TO A WELL BERMUDA 2014
33
Biochemical Measurements
Fasting Blood Glucose Fasting blood glucose measurements were taken using capillary whole blood (finger-stick method). Normal blood
glucose was defined as less than 100mg/dL. Impaired fasting glycaemia was defined as greater than or equal to
100mg/dl but less than 110mg/dL. Raised blood glucose was defined as greater than or equal to 110mg/dL.
The mean fasting blood glucose value was 92.0 mg/dL. Overall, 8.6% of respondents were classified as having
impaired fasting glycaemia. Additionally, 10.3% had raised blood glucose or were currently on medication for
diabetes, having taken their medication on the day of the fasting blood glucose test.
FIGURE 33. FASTING BLOOD GLUCOSE LEVELS
Fasting Total Cholesterol Fasting total cholesterol measurements were taken using capillary whole blood (finger-stick method). Normal
cholesterol was defined as less than 190mg/dL. Elevated cholesterol (borderline high) was defined as greater than
or equal to 190mg/dl but less than 240mg/dL. Raised or high cholesterol was defined as greater than or equal to
240mg/dL.
The mean fasting total cholesterol value was 189 mg/dL. Overall, 56.9% of respondents had higher than normal
cholesterol levels, including 26.4% with raised or high cholesterol. Adults aged 18-44 years were least likely to have
elevated (35.6%) or raised cholesterol (9.9%).
FIGURE 34. FASTING CHOLESTEROL LEVELS
Normal fasting blood glucose, 81.1%
Impaired fasting glycaemia, 8.6%
Raised blood glucose, 10.3%
Normal Cholesterol, 43.1%
Borderline High Cholesterol, 30.5%
High Cholesterol, 26.4%
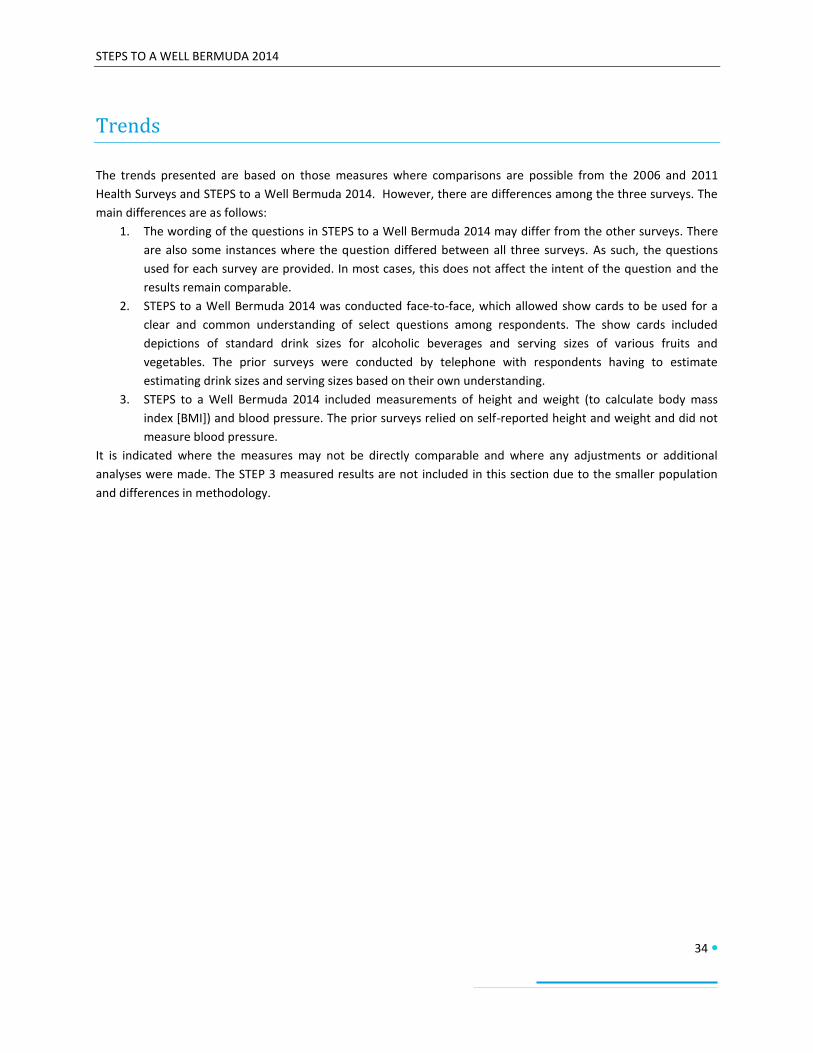
STEPS TO A WELL BERMUDA 2014
34
Trends
The trends presented are based on those measures where comparisons are possible from the 2006 and 2011
Health Surveys and STEPS to a Well Bermuda 2014. However, there are differences among the three surveys. The
main differences are as follows:
1. The wording of the questions in STEPS to a Well Bermuda 2014 may differ from the other surveys. There
are also some instances where the question differed between all three surveys. As such, the questions
used for each survey are provided. In most cases, this does not affect the intent of the question and the
results remain comparable.
2. STEPS to a Well Bermuda 2014 was conducted face-to-face, which allowed show cards to be used for a
clear and common understanding of select questions among respondents. The show cards included
depictions of standard drink sizes for alcoholic beverages and serving sizes of various fruits and
vegetables. The prior surveys were conducted by telephone with respondents having to estimate
estimating drink sizes and serving sizes based on their own understanding.
3. STEPS to a Well Bermuda 2014 included measurements of height and weight (to calculate body mass
index [BMI]) and blood pressure. The prior surveys relied on self-reported height and weight and did not
measure blood pressure.
It is indicated where the measures may not be directly comparable and where any adjustments or additional
analyses were made. The STEP 3 measured results are not included in this section due to the smaller population
and differences in methodology.

STEPS TO A WELL BERMUDA 2014
35
Tobacco use
The questions used to assess current smoking were as follows:
2006: Do you now smoke cigarettes every day, some days, or not at all?
2011: Do you now smoke cigarettes every day, some days, or not at all?
2014: Do you currently smoke any tobacco products, such as cigarettes, cigars, or pipes?
There have been no significant changes in the overall current use of tobacco from 2006 to 2014. However, during
the same time period, current smoking appears to have increased among men and decreased among women.
FIGURE 35. COMPARISON - CURRENT SMOKING (DAILY OR SOME DAYS)
The questions used to assess smoking cessation were as follows:
2006: During the past 12 months, have you stopped smoking for one day or longer because you were
trying to quit smoking?
2011: During the past 12 months, have you stopped smoking for one day or longer because you were
trying to quit smoking?
2014: During the past 12 months, have you tried to stop smoking?
There appears to be a steady decline in attempts to quit smoking from 2006 to 2014 overall. While attempts to
quit have remained relatively stable among men, there was a sharp decline in women attempting to quit from
2006 to 2011, which then remained stable through 2014.
FIGURE 36. COMPARISON - ATTEMPTS TO QUIT SMOKING
16.7%
10.4% 13.4%
18.6%
8.5%
13.3%
19.8%
7.5%
13.9%
Men Women Both Sexes
2006 2011 2014
47.9%
64.7%
54.6% 50.0% 47.2% 49.1%
45.2% 46.0% 45.4%
Men Women Both Sexes
2006 2011 2014

STEPS TO A WELL BERMUDA 2014
36
Alcohol Consumption
The questions used to assess current alcohol use were as follows:
2006: During the past 30 days, how many days did you have at least one drink of any alcoholic
beverage?
2011: During the past 30 days, how many days did you have at least one drink of any alcoholic
beverage?
2014: Have you consumed any alcohol in the past 30 days?
Alcohol use increased in 2014. This increase was sharpest among men although steady increases were seen among
women.
FIGURE 37. COMPARISON - CURRENT DRINKING
The questions used to assess binge drinking or heavy episodic drinking, among current drinkers, were as follows:
2006: Considering all types of alcoholic beverages, how many times during the past 30 days did you
have 5 or more drinks on an occasion?
2011: Considering all types of alcoholic beverages, how many times during the past 30 days did you
have (Men) 5 or more drinks (Women) 4 or more drinks on an occasion?
2014: During the past 30 days, how many times did you have six or more standard alcoholic drinks in a
single drinking occasion? [Show Card used to illustrate standard drink equivalents].
The definitions of binge drinking changed with each survey, and therefore direct comparisons cannot be made
based solely on the above questions.
FIGURE 38. COMPARISON - BINGE DRINKING (VARYING DEFINITIONS)
61.1%
46.1% 53.2% 51.4% 48.3% 49.6%
75.5%
51.4%
64.0%
Men Women Both Sexes
2006 2011 2014
32.3%
13.5%
23.6%
38.2% 33.3% 35.5%
28.3%
9.4%
21.1%
Men Women Both Sexes
2006 2011 2014

STEPS TO A WELL BERMUDA 2014
37
Additional analysis was conducted using the following question:
2014: During the past 30 days, what was the largest number of standard alcoholic drinks you
had on a single occasion? [Show Card used to illustrate standard drink equivalents].
Using the 2006 definition of binge drinking as 5 or more alcoholic drinks in a single occasion for both men and
women, there has been a slight increase in binge drinking from 2006 to 2014. Using the 2011 definition of binge
drinking as 5 or more alcoholic drinks for men and 4 or more for women in a single occasion, shows a slight
decrease. Overall, there has not been significant change in binge drinking.
FIGURE 39. COMPARISON - BINGE DRINKING (COMMON DEFINITION)
FIGURE 40. SHOW CARD - STANDARD ALCOHOLIC DRINKS
32.3%
13.5%
23.6%
36.6%
14.8%
28.2%
Men Women Both Sexes
2006 2014 (2006 Definition)
38.2% 33.3% 35.5% 36.6%
26.4%
32.7%
Men Women Both Sexes
2011 2014 (2011 Definition)

STEPS TO A WELL BERMUDA 2014
38
Oral Health
The questions used to assess dental care (visits to dentist) were as follows:
2011: During the past 12 months, about how many times have you consulted a dentist?
2014: How long has it been since you last saw a dentist?
There has been no significant change in annual dental visits from 2011 to 2014.
FIGURE 41. COMPARISON - DENTAL VISITS IN PRIOR YEAR
64.6%
73.5%
69.3%
64.5%
73.7%
68.9%
Men Women Both Sexes
2011 2014

STEPS TO A WELL BERMUDA 2014
39
Dietary Habits
The questions used to assess fruit consumption were as follows:
2006: How many servings of fruit do you usually eat (do not count fruit juice)? (For example, a portion
of fruit at breakfast would be one serving.) [Respondents could have responded per day, week,
month or year.]
2011: How many servings of fruit do you usually eat (do not count fruit juice)? (For example, a portion
of fruit at breakfast would be one serving.) [Respondents could have responded per day, week,
month or year.]
2014: In a typical week, on how many days do you eat fruit? How many servings of fruit do you eat on
those days? [Show Card used to illustrate serving sizes.]
Fruit consumption remains low. Although it appears that fruit consumption declined, the comparison is limited due
to the difference in methodology; show cards were used in 2014 to illustrate serving size, unlike prior surveys that
relied solely on respondent perception of serving size.
FIGURE 42. COMPARISON - FRUIT CONSUMPTION (3 OR MORE SERVINGS PER DAY)
FIGURE 43. SHOW CARD - SERVINGS OF FRUIT
13.8%
21.0%
17.6% 14.5%
25.3%
20.3%
9.5%
14.4% 11.8%
Men Women Both Sexes
2006 2011 2014
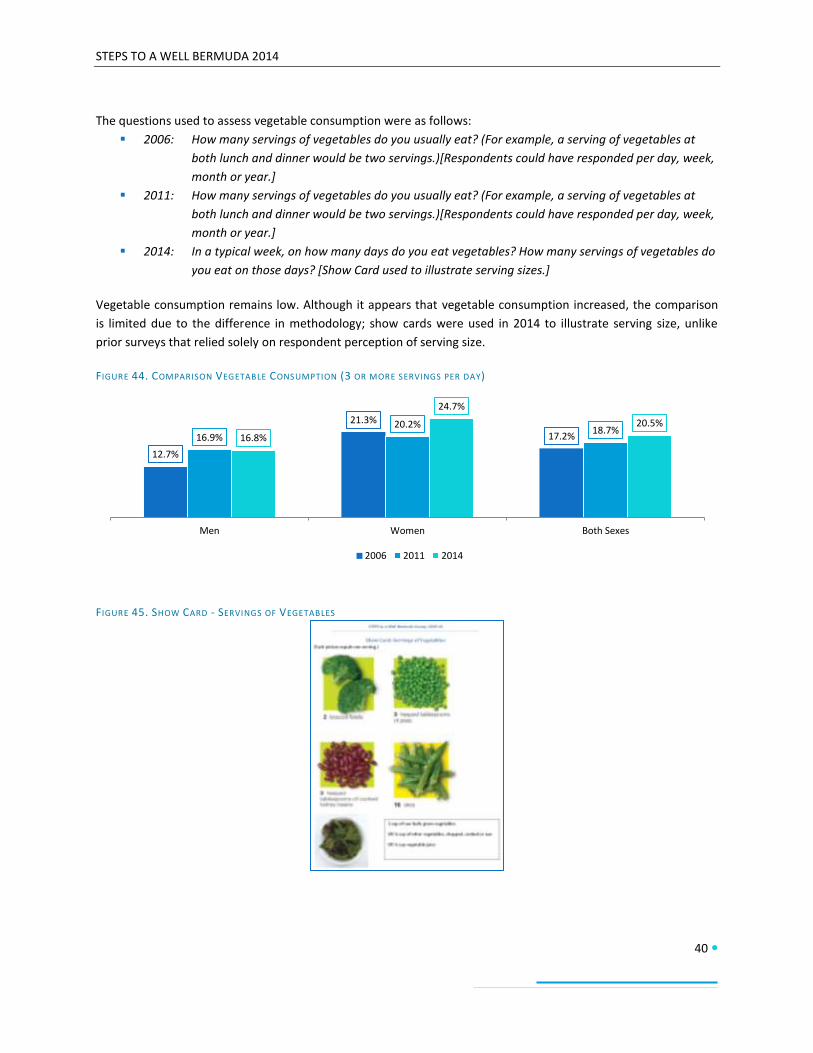
STEPS TO A WELL BERMUDA 2014
40
The questions used to assess vegetable consumption were as follows:
2006: How many servings of vegetables do you usually eat? (For example, a serving of vegetables at
both lunch and dinner would be two servings.)[Respondents could have responded per day, week,
month or year.]
2011: How many servings of vegetables do you usually eat? (For example, a serving of vegetables at
both lunch and dinner would be two servings.)[Respondents could have responded per day, week,
month or year.]
2014: In a typical week, on how many days do you eat vegetables? How many servings of vegetables do
you eat on those days? [Show Card used to illustrate serving sizes.]
Vegetable consumption remains low. Although it appears that vegetable consumption increased, the comparison
is limited due to the difference in methodology; show cards were used in 2014 to illustrate serving size, unlike
prior surveys that relied solely on respondent perception of serving size.
FIGURE 44. COMPARISON VEGETABLE CONSUMPTION (3 OR MORE SERVINGS PER DAY)
FIGURE 45. SHOW CARD - SERVINGS OF VEGETABLES
12.7%
21.3%
17.2% 16.9% 20.2%
18.7% 16.8%
24.7%
20.5%
Men Women Both Sexes
2006 2011 2014
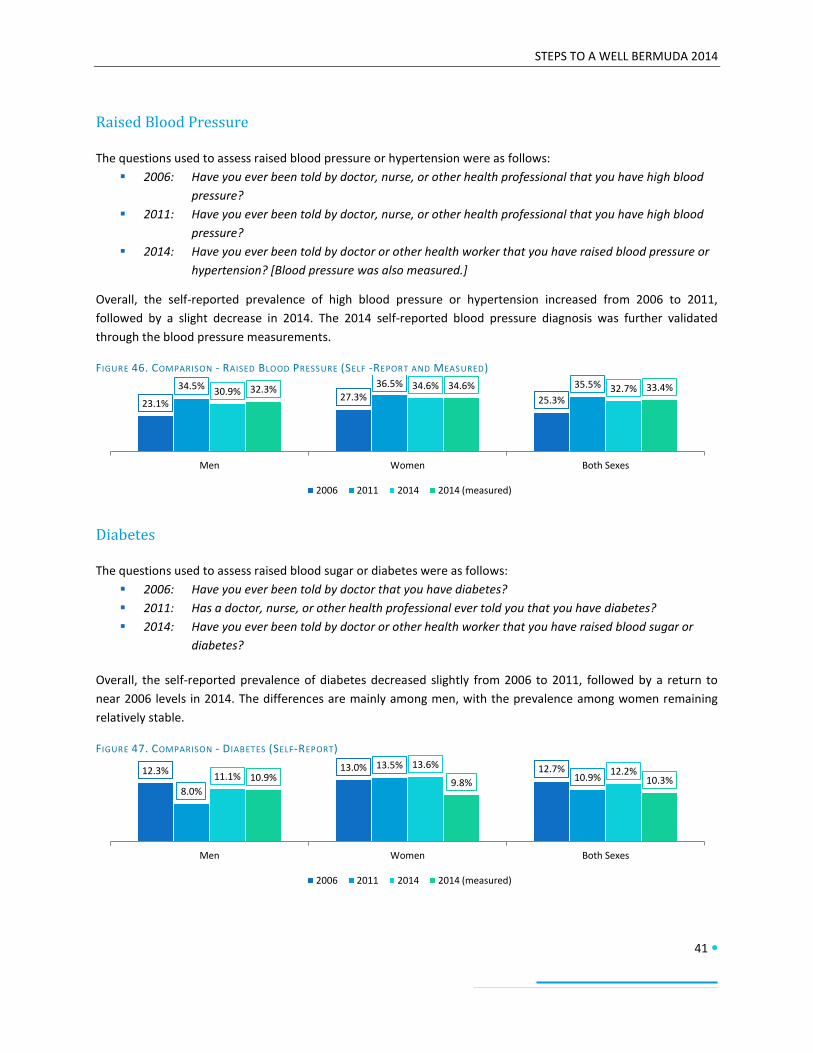
STEPS TO A WELL BERMUDA 2014
41
Raised Blood Pressure
The questions used to assess raised blood pressure or hypertension were as follows:
2006: Have you ever been told by doctor, nurse, or other health professional that you have high blood
pressure?
2011: Have you ever been told by doctor, nurse, or other health professional that you have high blood
pressure?
2014: Have you ever been told by doctor or other health worker that you have raised blood pressure or
hypertension? [Blood pressure was also measured.]
Overall, the self-reported prevalence of high blood pressure or hypertension increased from 2006 to 2011,
followed by a slight decrease in 2014. The 2014 self-reported blood pressure diagnosis was further validated
through the blood pressure measurements.
FIGURE 46. COMPARISON - RAISED BLOOD PRESSURE (SELF -REPORT AND MEASURED)
Diabetes
The questions used to assess raised blood sugar or diabetes were as follows:
2006: Have you ever been told by doctor that you have diabetes?
2011: Has a doctor, nurse, or other health professional ever told you that you have diabetes?
2014: Have you ever been told by doctor or other health worker that you have raised blood sugar or
diabetes?
Overall, the self-reported prevalence of diabetes decreased slightly from 2006 to 2011, followed by a return to
near 2006 levels in 2014. The differences are mainly among men, with the prevalence among women remaining
relatively stable.
FIGURE 47. COMPARISON - DIABETES (SELF-REPORT)
23.1% 27.3% 25.3%
34.5% 36.5% 35.5% 30.9%
34.6% 32.7% 32.3% 34.6% 33.4%
Men Women Both Sexes
2006 2011 2014 2014 (measured)
12.3% 13.0% 12.7%
8.0%
13.5% 10.9% 11.1%
13.6% 12.2%
10.9% 9.8% 10.3%
Men Women Both Sexes
2006 2011 2014 2014 (measured)

STEPS TO A WELL BERMUDA 2014
42
High Cholesterol
The questions used to assess high blood cholesterol were as follows:
2006: Have you ever been told by doctor, nurse, or other health professional that your blood cholesterol
is high?
2011: Have you ever been told by doctor, nurse, or other health professional that your blood cholesterol
is high?
2014: Have you ever been told by doctor or other health worker that you have raised cholesterol?
Overall, the self-reported prevalence of high cholesterol remained stable from 2006 through 2014. However, the
prevalence appears to have increased among men and decreased among women.
FIGURE 48. COMPARISON - HIGH CHOLESTEROL (SELF-REPORT)
Overweight and Obesity
The questions used to assess overweight and obesity were as follows:
2006: About how much do you weigh without shoes in pounds? About how tall are you without shoes in
feet and inches?
2011: About how much do you weigh without shoes in pounds? About how tall are you without shoes in
feet and inches?
2014: Measured height and weight
Overweight and obesity levels remain high. Although it appears that the prevalence of overweight and obesity has
increased, the comparison is limited due to the difference in methodology; height and weight were measured in
2014, unlike in prior surveys that relied solely on respondent response.
FIGURE 49. COMPARISON - OVERWEIGHT AND OBESITY [BMI≥ 25] (SELF-REPORT AND MEASURED)
32.7% 34.3% 33.6% 34.6% 33.6% 34.1% 39.5%
27.7% 33.9%
Men Women Both Sexes
2006 2011 2014
67.6% 60.6% 64.0% 72.2% 61.6% 66.7%
79.1% 69.6% 74.6%
Men Women Both Sexes
2006 2011 2014 (measured)

STEPS TO A WELL BERMUDA 2014
43
Cervical Cancer Screening
The questions used to assess cervical cancer screening among women were as follows:
2006: A Pap test is a test for cancer of the cervix. Have you ever had a Pap test?
2011: A Pap test is a test for cancer of the cervix. Have you ever had a Pap test?
2014: Have you ever had a screening test for cervical cancer?
There appears to be a decline in women having screening tests for cervical cancer.
FIGURE 50. COMPARISON - CERVICAL CANCER SCREENING
Health Insurance
The questions used to assess health insurance coverage were as follows:
2011: Are you covered by a private or government health insurance plan?
2014: Do you currently have health insurance?
There have been small declines in health insurance coverage.
FIGURE 51. COMPARISON - HEALTH INSURANCE COVERAGE
96.4%
90.1% 88.1%
Women
2006 2011 2014
92.0%
95.8% 94.0%
91.6% 92.5% 92.1%
Men Women Both Sexes
2011 2014
STEPS TO A WELL BERMUDA 2014
44
Discussion
The results of STEPS to a Well Bermuda indicate that chronic non-communicable diseases (NCDs) and their related
risk factors impact on the health and wellbeing of the residents of Bermuda. The results provide sufficient
evidence of the need for directed actions and policies that will assist in preventing and controlling NCDs in
Bermuda. These actions are needed to not only improve the overall health and well-being of our residents but also
to reduce the financial impact of NCDs on the economy.
Overall Risk of NCDs and Health Care Utilization Nearly one in five persons (17%) had an NCD such as cardiovascular disease, cancer, chronic respiratory disease or
diabetes. This value was 7% in adults aged 18-44 but ranged between 21% in those aged 45-59 years and 32% in
those aged over 60 years. This indicates that NCDs may be occurring in similar rates among middle-aged and older
adults, implying an earlier age of onset of these diseases. Of those with NCDs, nearly one in five (19%) required a
visit to a health facility, doctors office, or clinic, within any given month. Also, nearly one in ten (9%) required
hospitalization in the previous year or missed usual activity in the previous month (8%), and one in twenty-five
(4%) required home care by a family member or friend. These hospitalizations, missed activities, including work,
and need for home care affected the middle-aged adults almost the same as the older adults. This can have a
substantive impact on the productivity of the workforce.
A combined risk factor approach was used to assess the level of risk in developing an NCD. This combined risk
factor assessment looked at current daily smoking, inadequate fruit and vegetable intake, physical inactivity, being
above healthy body weight for height and raised blood pressure. It was found that the risk factor assessment had a
similar trend to NCD prevalence by age group. Particularly, a quarter of younger adults aged 18-44 years (25%) had
3 or more risk factors compared to half (49%) of those aged 45-59 years and two-thirds (62%) of those aged 60
years and older. This is concerning as it further demonstrates a greater likelihood of chronic diseases occurring at
younger ages and at higher rates within the working-age population. If these risk factors are not addressed, this
also has implications for loss of productive workforce. More people may develop NCDs at younger ages.
Behavioural Risk Factors
Smoking Although most have never smoked (58%) or were former smokers (28%), smoking remains an important public
health issue, especially among men where 20% are current smokers. Also of note is that overall, the mean age of
smoking initiation was 18 years. In addition, the most commonly used tobacco product was manufactured
cigarettes, less than half of current smokers had tried to quit, and more than one in ten persons were exposed to
second-hand smoke in the home or workplace. This indicates the need for further implementation, compliance
and enforcement of policies to reduce tobacco use and initiation, especially among youth. These policies should be
in compliance with the WHO Framework Convention on Tobacco Control and include limiting the access of
underage persons to tobacco products, providing support for comprehensive smoking cessation programs, banning
tobacco advertising, promotion and sponsorship and raising public awareness of tobacco control issues through
education, training and communication.
STEPS TO A WELL BERMUDA 2014
45
Alcohol Use Young adults were less likely than older adults to be lifetime abstainers and least likely to be 12-month abstainers.
The working age population, especially men, were also more likely to be current drinkers and engage in binge
drinking than those at or near retirement age. Men were also more likely to be daily drinkers. These age and
gender differences are reflective of societal norms. For example, it may be considered socially acceptable for men
to consume alcohol regularly and at high levels. It is possible that this drinking behaviour is contributed to by
“happy hours” which occur at the end of the workweek and costs of alcoholic drinks may be lower. The higher rate
of daily drinking among men can also be reflective of a socio-cultural context that rewards a hard day of work,
especially manual labour, with a beer or equivalent alcoholic beverage. The public health impact of these alcohol
use behaviours is significant as alcohol can lead to and complicate NCDs and often plays a role in traffic collisions,
which can result in disability, loss of productivity and premature death. This is especially problematic among
younger adults who are less likely to abstain from alcohol.
Oral Health In general, oral health status was favourable in terms of number of natural teeth, healthy state of teeth and gums,
teeth cleaning habits, and access to dental care. However, around one in five (19%) persons experienced oral pain
or discomfort. This is important as oral health is integral and essential to general health. Additionally, over one in
ten persons (11%) avoided smiling because of the appearance of their teeth which could affect their overall quality
of life.
Dietary Habits Consumption of fruits and vegetables is inadequate with only 18% consuming five or more servings of fruits and
vegetables per day. Fruits and vegetables were not consumed every day, and on the days they were consumed,
the number of servings was low. Additionally, half (50%) reported drinking at least one sugary drink per day. These
poor dietary habits are likely related to the cost of fruits and vegetables relative to other foods and the wide
availability of other unhealthy options. On the positive side, all persons were aware of the importance of lowering
salt in the diet and 80% reported that they try to avoid or minimize the consumption of processed foods. There
were also moderate successes in the use of other habits to control salt intake. It is important to build on these
healthy behaviours and extend them into other aspects of diet and healthy living.
Physical Activity Physical activity, which includes but is not the same as exercise, has significant health benefits and contributes to
the prevention of non-communicable diseases. About one in five men (20%) and one in three women (34%) are
not engaging in enough physical activity to receive these health benefits. These low levels of physical activity are
partly due to the overall environment – increasingly sedentary work environments, accessibility of passive modes
of transport and barriers to recreational activities, which can include fear of violence and crime in outdoor areas
and limited access to sidewalks and sports/recreation facilities. These issues should be addressed to increase
overall physical activity levels.

STEPS TO A WELL BERMUDA 2014
46
History of Non-Communicable Diseases (Self-Reported) Most persons have had their blood pressure, blood sugar and total cholesterol measured at some point in their
lives. Through these measurements, it was determined that approximately one in three persons have raised blood
pressure (34%) or raised total cholesterol (33%) and more than one in ten persons have raised blood sugar or
diabetes (12%). Also interesting is that most (around 60%) of these diagnoses were made within the past year for
all of these NCDs. Medication usage varied but use of herbal or traditional remedies was low. Among those with
diabetes, very few (5%) had their eyes examined within the last two years in contrast to the vast majority (93%)
having their feet examined within the past year. Loss of sight and limbs can affect productivity adding to the
economic burden of NCDs.
Fewer persons (6%) have a history of cardiovascular diseases although more than one in ten persons (12%) is
taking aspirin to prevent of treat heart disease. Measures such as this should be undertaken in consultation with
doctors and other health care workers who can assess the risk and provide appropriate advice.
Doctors and health care workers should also take into consideration family history of NCDs in assessing risk, as
many persons have family members with various NCDs. Additionally, it is often the case that family members may
also have similar lifestyle risk factors.
Lifestyle Advice Less than half of persons receive advice on risk factor reduction from their doctor or other health care worker.
Increasing both the amount of advice received during consultations with doctors and health care workers and the
details of such advice would be beneficial. It was shown that of the advice given, general advice on physical activity
(44%) and healthy body weight (38%) was given more regularly than specific advice regarding increasing
consumption of fruits and vegetables (31%), reduction of fat and salt in the diet (26% and 18%, respectively) and
discouraging the use of tobacco (12%).
Physical Measurements The average blood pressure measurement, waist circumference, and BMI are all above ideal levels for health. This
is significant as these are objective biological indicators of increased risk of NCDs and are likely the result of
engaging in a lifestyle that includes a number of the behavioural risk factors already demonstrated to be high in
the population, especially insufficient physical activity and inadequate dietary habits. It is of great concern that
three out of four persons (75%) are overweight or obese. Also of concern is the considerable number of persons
with raised blood pressure who are not on medication (55%) and the number of persons whose high blood
pressure is not controlled by their medication (23%).
Biochemical Measurements The biochemical measurements provided more information on those persons at risk for diabetes and high
cholesterol. Nearly one in ten (9%) had impaired fasting glycaemia, or could be classified as pre-diabetic, and
nearly one in three (31%) had borderline high cholesterol. Without lifestyle changes, these persons are likely to
develop diabetes or high cholesterol in future years.

STEPS TO A WELL BERMUDA 2014
47
Trends Overall, the trends are mixed. For example, overall tobacco use remained stable but less people are trying to quit,
and alcohol consumption increased but binge drinking remained stable. Fruit and vegetable consumption
remained low and the self-reported prevalence of chronic diseases remained stable. There were slight declines in
cervical cancer screening and health insurance coverage and annual dental visits remained stable. Overweight and
obesity are consistently high and may be increasing.
Conclusion Although the health surveys have shown some areas of stability, it is important to recognize that overall, more
than 95% of the population have at least one risk factor for an NCD. When looking at the risk factors individually
the leading risk factors are inadequate consumption of fruits and vegetables (82%), overweight and obesity (75%),
and alcohol consumption (64%). Raised cholesterol (34%) and blood pressure (33%) are also of concern, as is
physical inactivity (27%). All of these risk factors and conditions are interrelated and can lead to NCDs. If these risk
factors are not addressed then it is very likely that the prevalence of diabetes, heart disease, and other NCDs will
increase, thereby increasing the chronic disease burden. This has both health and economic implications. The risk
factors of today are the diseases of tomorrow.
Recommendations for Action The following recommendations for action are based on those outlined in the World Health Organization’s Global
Action Plan for the Prevention and Control of Non-Communicable Diseases 2013-2020. As stated in the Plan, a
multisectoral approach is required to deliver evidence-based strategies to prevent and control NCDs in Bermuda.
Overall, the prevention and control of non-communicable diseases should be integrated into health-planning
processes, with special attention given to the social determinants of health and the cultivation of health-enabling
environments. Environmental and social conditions should be such that the healthy choice is the easy choice.
Additionally, there should be a surveillance system to monitor essential NCD data in an ongoing and systematic
way. This can be through repeated surveys, the use of Electronic Health Records, and/or the development,
maintenance and strengthening of NCD registers for selected conditions, including diabetes and cancer. Health
services should be strengthened and oriented towards the prevention and control of NCDs. Social mobilization
efforts should be directed towards changing social norms and improving understanding and acceptance of the
individual and societal changes needed to address NCDs and their risk factors.
Food and nutrition policy measures should engage various sectors, including retailers, to increase availability,
affordability, and acceptability of healthier foods, including fruits and vegetables and products with reduced
content of salt/sodium, saturated fatty acids and free sugars. Health promotion efforts should be focused on public
campaigns using social marketing techniques to inform consumers about healthy dietary practices and motivates
them to adopt such practices. These campaigns should be linked to supporting actions and/or incentives for
improved health outcomes. Efforts should continue to be made to create health- and nutrition-promoting
environments in schools, healthcare facilities and public and private work-places.
Physical activity should be promoted as part of daily living, for example, “active transport” – walking or cycling to
or from places – and efforts should be made to improve the accessibility, acceptability and safety of individuals
engaging in such activities. Environments should be promoted that facilitate physical activity and supportive
STEPS TO A WELL BERMUDA 2014
48
infrastructures in place that increase access to, and use of, suitable facilities. This includes worksite wellness
programs and policies that foster work-life balance. Public campaigns should be conducted that inform the
population about the benefits of physical activity for all ages using simple, clear and direct messaging.
In terms of alcohol and tobacco use, a comprehensive and multisectoral approach should be used to end the
harmful use of alcohol and tobacco and eliminate environmental exposure to tobacco smoke. Health promotion
efforts should be aimed at warning persons about the dangers of alcohol and tobacco use and exposure to
environmental tobacco smoke. Social marketing should be utilized to make tobacco use and excessive alcohol
consumption socially unacceptable. Smoking cessation programs should also be available and accessible as well as
programs that aim to reduce the negative consequences of alcohol intoxication. Marketing of tobacco and alcohol
should be restricted. Strict control on the availability of tobacco and alcohol should be strengthened to protect
present and future generations.
Health care providers play a critical role in prevention and control of NCDs. Routine contacts with physicians and
other health care providers should include practical advice on the benefits of healthy living, including dietary
behaviours, physical activity, avoiding or minimizing alcohol and tobacco use. This should be combined with the
provision of simple, concise information with specific guidance on increasing fruit and vegetable consumption and
reducing consumption of unhealthy fats, salt and sugar. Health-care providers should also work with public health
partners to direct patients to skill-building initiatives that increase the likelihood of sustained behaviour change.
Secondary and tertiary prevention is also important in preventing NCD-related complications, loss of productivity,
and deaths. Persons with hypertension, high cholesterol and high blood glucose must be appropriately diagnosed
and treated so that these conditions can be controlled. Cost-effective non-communicable disease prevention
interventions should be available at all levels of care and the health care workforce capacity should be
strengthened for the comprehensive management of NCDs.
In summary, Bermuda’s current NCD risk factor profile paints an ominous picture. Therefore, there must be multi-
sectoral action for the prevention, control and management of non-communicable diseases to reduce overall
prevalence and related health care utilizations and costs. All sectors must be determined to create conditions that
allow the population to make healthy lifestyle choices so that we can achieve a Well Bermuda!
STEPS TO A WELL BERMUDA 2014
49
References
Department of Health (2007) Health Survey of Adults and Children in Bermuda 2006. Government of Bermuda.
Department of Health (2007) Well Bermuda Study 2007. Government of Bermuda.
Department of Statistics (2014) Bermuda’s Population Projections 2010 – 2020. Government of Bermuda.
Department of Statistics (2012)Report on the 2010 Census on Population and Housing. Government of Bermuda.
Mindmaps Ltd. (2011) Health Survey of Adults in Bermuda 2011. Bermuda Health Council and Ministry of Health:
Bermuda
World Health Organization (2005). WHO STEPS Surveillance Manual: The WHO STEPwise approach to chronic
disease risk factor surveillance. Geneva, World Health Organization.
World Health Organization (2013). Global Action Plan for the prevention and control of noncommunicable diseases
2013-2020. Geneva, World Health Organization.

Design and Prepress: Department of Communication and InformationPrinted in Bermuda by: Bermuda Blueprinting – January 2016