Botswana Mining Investment and Governance Review
92
THE MINING INVESTMENT AND GOVERNANCE REVIEW (MInGov) AUGUST 2016 Botswana Mining Investment and Governance Review
Transcript of Botswana Mining Investment and Governance Review
THE MINING INVESTMENT AND GOVERNANCE REVIEW (MInGov) AUGUST 2016
Botswana Mining Investment and Governance Review
ii
© 2016 International Bank for Reconstruction and Development / The World Bank
1818 H Street NWWashington, DC 20433Telephone: 202-473-1000Internet: www.worldbank.org
This work is a product of the staff of The World Bank with external contributions. The findings, interpretations, and conclusions expressed in this work do not necessarily reflect the views of The World Bank, its Board of Executive Directors, or the governments they represent.
The World Bank does not guarantee the accuracy of the data included in this work. The boundaries, colors, denominations, and other information shown on any map in this work do not imply any judgment on the part of The World Bank concerning the legal status of any territory or the endorsement or acceptance of such boundaries.
Rights and Permissions
The material in this work is subject to copyright. Because The World Bank encourages dissemination of its knowledge, this work may be reproduced, in whole or in part, for noncommercial purposes as long as full attribution to this work is given.
Any queries on rights and licenses, including subsidiary rights, should be addressed to:
World Bank PublicationsThe World Bank Group1818 H Street NWWashington, DC 20433USAFax: 202-522-2625Email: [email protected]
iii
Funded by:
Implemented by:
In association with:
iii
iviv
Abbreviations & Acronyms
AG Auditor General
ASM Artisanal and Small-scale Mining
BCL Bamangwato Concessions Ltd
CSR Corporate Social Responsibility
CDA Community Development Agreement
DBsa De Beers Société Anonyme
EITI Extractive Industries Transparency Initiative
EIA Environmental Impact Assessment
FDI Foreign Direct Investment
GDP Gross Domestic Product
GNI Gross National Income
GRB Government of the Republic of Botswana
ICSID International Center for Settlement of Investment Disputes
IMF International Monetary Fund
JV Joint Venture
MInGov Mining Investment and Governance Review
MMEWR Ministry of Minerals, Energy and Water Resources
PEFA Public Expenditure and Financial Accountability
PMO Programme Management Office
SADC Southern Africa Development Community
SOE State Owned Enterprise
SMME Small and Medium Micro Enterprises
VPSHR Voluntary Principles on Security and Human Rights
WB World Bank
BOTSWANA MINING INVESTMENT AND GOVERNANCE REVIEW
vv
Table of Contents
EXECUTIVE SUMMARY . . . . . . . . . . . . . . . . . . . . . . . . . . . . . . . . . . . . . . . . . . . . . . . . . . . . . . . . . . . 1
1 INTRODUCTION . . . . . . . . . . . . . . . . . . . . . . . . . . . . . . . . . . . . . . . . . . . . . . . . . . . . . . . . . . .4
2 MINING IN BOTSWANA – COUNTRY CONTEXT . . . . . . . . . . . . . . . . . . . . . . . . . . . . . . . .6
3 OVERVIEW of MInGov FINDINGS . . . . . . . . . . . . . . . . . . . . . . . . . . . . . . . . . . . . . . . . . . . .9
3.1 Introduction and Performance Summary . . . . . . . . . . . . . . . . . . . . . . . . . . . . . . .9
3.2 Overview of “Value Chain” and “Theme” Performance. . . . . . . . . . . . . . . . . . . .11
3.3 Mining Sector Importance . . . . . . . . . . . . . . . . . . . . . . . . . . . . . . . . . . . . . . . . . . . 12
3.4 Performance from a Value Chain Perspective. . . . . . . . . . . . . . . . . . . . . . . . . . . 12
3.4.1 Contracts, Licenses and Exploration . . . . . . . . . . . . . . . . . . . . . . . . . . . . 12
3.4.2 Operations . . . . . . . . . . . . . . . . . . . . . . . . . . . . . . . . . . . . . . . . . . . . . . . . . . 15
3.4.3 Taxation and State Participation . . . . . . . . . . . . . . . . . . . . . . . . . . . . . . . . 17
3.4.4 Revenue Distribution and Management . . . . . . . . . . . . . . . . . . . . . . . . . 19
3.4.5 Local Impact . . . . . . . . . . . . . . . . . . . . . . . . . . . . . . . . . . . . . . . . . . . . . . . . . 21
3.5 Performance of Cross-cutting Themes. . . . . . . . . . . . . . . . . . . . . . . . . . . . . . . . .23
3.5.1 Economic Environment. . . . . . . . . . . . . . . . . . . . . . . . . . . . . . . . . . . . . . . .24
3.5.2 Political Environment . . . . . . . . . . . . . . . . . . . . . . . . . . . . . . . . . . . . . . . . .25
3.5.3 Sustainable Development . . . . . . . . . . . . . . . . . . . . . . . . . . . . . . . . . . . . .26
3.6 Special Topic: Botswana’s Governance of the Diamond Industry . . . . . . . . . .27
4 STAKEHOLDER PRIORITIES . . . . . . . . . . . . . . . . . . . . . . . . . . . . . . . . . . . . . . . . . . . . . . . 30
5 CONCLUSIONS AND ACTION POINTS . . . . . . . . . . . . . . . . . . . . . . . . . . . . . . . . . . . . . . .35
5.1 Conclusions . . . . . . . . . . . . . . . . . . . . . . . . . . . . . . . . . . . . . . . . . . . . . . . . . . . . . . . .35
5.2 Action points. . . . . . . . . . . . . . . . . . . . . . . . . . . . . . . . . . . . . . . . . . . . . . . . . . . . . . .36
5.2.1 Recommended Follow-up Points . . . . . . . . . . . . . . . . . . . . . . . . . . . . . . .37
ANNEX 1 THE BOTSWANA MINGOV DATA COMPENDIUM . . . . . . . . . . . . . . . . . . . . . . . . . . 40
TABLE OF CONTENTS

vivi
FIGURES
Figure 1 Mining in Botswana at a Glance. . . . . . . . . . . . . . . . . . . . . . . . . . . . . . . . . . . . . . . . . . .6
Figure 2 Botswana Country Dashboard . . . . . . . . . . . . . . . . . . . . . . . . . . . . . . . . . . . . . . . . . . . 10
Figure 3 Performance by Value Chain Stage and Theme . . . . . . . . . . . . . . . . . . . . . . . . . . . . .11
Figure 4 Mining Sector Importance. . . . . . . . . . . . . . . . . . . . . . . . . . . . . . . . . . . . . . . . . . . . . . . 12
Figure 5 Overlap between Stakeholder-selected Priorities . . . . . . . . . . . . . . . . . . . . . . . . . .33
Figure 6 Stakeholder-selected Priorities (All Stakeholders). . . . . . . . . . . . . . . . . . . . . . . . . .34
TABLES
Table 1 Performance of the Contract, Licenses, and Exploration Stage. . . . . . . . . . . . . . . 13
Table 2 Performance of the Operations Stage . . . . . . . . . . . . . . . . . . . . . . . . . . . . . . . . . . . . 16
Table 3 Performance of the Taxation and State Participation Stage. . . . . . . . . . . . . . . . . . 18
Table 4 Performance of the Revenue Distribution and Management Stage . . . . . . . . . . 20
Table 5 Performance of the Local Impact Stage. . . . . . . . . . . . . . . . . . . . . . . . . . . . . . . . . . .22
Table 6 Economic Environment Performance . . . . . . . . . . . . . . . . . . . . . . . . . . . . . . . . . . . . .24
Table 7 Political Environment Performance. . . . . . . . . . . . . . . . . . . . . . . . . . . . . . . . . . . . . . .25
Table 8 Sustainable Development Performance . . . . . . . . . . . . . . . . . . . . . . . . . . . . . . . . . . .26
ANNEX 1 FIGURES AND TABLES
Table 1 Themes, Value Chain Stage, Topics, Indicators and Information Source . . . . . . . 41
Table 2 Theme Scores . . . . . . . . . . . . . . . . . . . . . . . . . . . . . . . . . . . . . . . . . . . . . . . . . . . . . . . . 46
Table 3 Value Chain Stages Scores . . . . . . . . . . . . . . . . . . . . . . . . . . . . . . . . . . . . . . . . . . . . . 46
Table 4 Topic Score . . . . . . . . . . . . . . . . . . . . . . . . . . . . . . . . . . . . . . . . . . . . . . . . . . . . . . . . . . .47
Table 5 Indicator Scores . . . . . . . . . . . . . . . . . . . . . . . . . . . . . . . . . . . . . . . . . . . . . . . . . . . . . . 49
Table 6 Question Scores . . . . . . . . . . . . . . . . . . . . . . . . . . . . . . . . . . . . . . . . . . . . . . . . . . . . . . .57
Figure 1 Topic Scores (Max-Min Chart) . . . . . . . . . . . . . . . . . . . . . . . . . . . . . . . . . . . . . . . . . . .48
Figure 2 Indicator Scores (Max-min Chart) . . . . . . . . . . . . . . . . . . . . . . . . . . . . . . . . . . . . . . . .52
Figure 3 Stakeholder prioritisation, Government . . . . . . . . . . . . . . . . . . . . . . . . . . . . . . . . . . .54
Figure 4 Stakeholder prioritisation, CSO . . . . . . . . . . . . . . . . . . . . . . . . . . . . . . . . . . . . . . . . . .55
Figure 5 Stakeholder prioritisation, Industry. . . . . . . . . . . . . . . . . . . . . . . . . . . . . . . . . . . . . . .56
BOTSWANA MINING INVESTMENT AND GOVERNANCE REVIEW
viivii
Acknowledgements and Report Effectiveness
This Botswana Report is a product of The Mining Investment and Governance Review for Botswana, which was under-taken between October 15-30, 2015 and then in May 2016 by a team led by Lois Hooge and consisting of Christianna Pangalos, Michael Baxter, Anne Claire Howard, Julia Baxter, Yann Lebrat, David Mihalyi and Antoniya Mihaylova. A wide range of stakeholders was interviewed during the review and the team wishes to thank all participants for their time and valuable comments.
This report presents data on mining investment and governance indicators for Botswana that are current as of October 30, 2015. Scores for any of the indicators in the review may have changed since that time.
ACKNOWLEDGEMENTS AND REPORT EFFECTIVENESS
11
The Botswana Mining Investment and Governance Review (MInGov) collects and shares information on mining sector governance, its attractiveness to investors, and how it contributes to national development. The review, based on data from primary and secondary sources and in-Botswana interviews, assesses sector performance from the perspective of three stakeholder groups – government, investors in the mining value chain and civil society – and identifies gaps between declared and actual government policy and practice. Findings are categorized by topics, and topics are grouped under stages of the mining “value chain” and “themes” relevant to mining investment and governance.
Mining is extremely important in Botswana, in particular the diamond resource that mostly has accounted for the country’s steady, significant growth rate from its discovery half a century ago to present day. This mineral has transformed a deeply poor country with few indus-trial prospects to an upper middle-income jurisdiction in under 50 years.
Diamond mining and trading have been Botswana’s most important wealth generating activities, but the country has also received revenue from the mining of base metals, gold, soda ash and coal. As diamond production has slowed in the last several years due to the downward commodity cycle, and recognizing that it will become increasingly costly to mine a declining diamond resource, government has intensified its efforts to diversify the economy. Distribution of revenue (which largely comes from the mineral sector) has been challenging and there is a high disparity between the wealthy, mostly urban population and the poor, mostly rural people. The
BOTSWANA MINING INVESTMENT AND GOVERNANCE REVIEW
EXECUTIVE SUMMARY
mining sector does not provide substantial employment in a country where the unemployment rate averages 20%. Better linkages between the mining sector and the economy as well as stronger capacity of the SMME sector, are needed. These are among government priorities to increase the impact of mining on local development and employment, particularly in rural areas.
The review’s key findings are:
• Performance across the minerals value chain is better in the latter stages related to investment, accumulation, and expenditure of mineral revenue. The assessment of the contracting and operational stages of mining exposed a few weaknesses, mostly around transparency, clarity of rules, and accounta-bility of decisions.
• The mining policy and legal framework are largely sound. Some “bottleneck” gaps in the regulatory regime have been identified including the need for greater detail and clarity around licensing; notably published timeframes for processing, an updated mineral law and the drafting of regulations to accompany a new law. The lack of disclosure of diamond and integrated project contracts has affected the scoring of transparency and accounta-bility in license allocation.
• The environmental protection legislation is quite current and mostly based on ‘good practice’ except in areas where greater efforts need to be made to ensure that Environmental Impact Assessments (EIAs) are accessible and interactive throughout the
EXECUTIVE SUMMARY
2
mining lifecycle; the public participation process is strengthened, requirements around biodiversity protection and mine closure are more defined; and some form of company-community development agreement is required.
• Land use issues, including resettlement and compensation, require a more inclusive process and stronger legislated framework, although the Land Board and Tribunal at least provide a local governance structure for the management of land. Competing land use (with mineral develop-ment) continues to be emotive, especially when values such as indigenous rights around traditional occupation of land and eco-tourism conflict with the development of minerals.
• A local content policy for the mining industry should be developed with mining sector participa-tion (to ensure that both the needs of government and of industry are met in this regard). This should build on the Citizen Economic Empowerment Policy but tailored to the procurement requirements of the mining industry; this would assist the development of upstream and potentially downstream linkages and strengthen the SMME sector, resulting in greater employment impact from mining.
• Institutions are for the most part staffed with trained, qualified people although sometimes there are not sufficient numbers of staff with the required experience. It is recognized that there is a small population in Botswana, and hence, a correspond-ingly small pool of qualified candidates; however, greater attention to education weaknesses would assist in increasing numbers of students in the mining sciences.
• The top shared priority by all three stakeholder groups is Sector Management and Intragovern-mental Coordination. From civil society’s point of view, this reflects the need for government to coordinate its development objectives with equal participation from all Ministries, instead of the current situation where minerals development dominates decisions around land use (where a more inclusive approach would consider other values such as eco-tourism, for example). From the indus-try’s perspective, better synergy between timing of applications for mining and environmental permit-
ting would be beneficial; and government wants to have sufficient resourcing to be able to manage the sector effectively.
Possible areas for action are identified in the review. A survey of priorities for stakeholder groups identifies six “low hanging fruit” to improve governance. These are:
• Update the Mines and Minerals Act, 1999 to reflect current good practices in mineral regulation. There are presently no regulations accompanying this Act and these should be drafted to accompany a new Act. As a precursor to a revision of the Act, a mineral policy should be developed that includes a wide range of stakeholder input at the national and local levels.
• Increase the Department of Mines’ HR capacity in licensing; in geo-data collection and management; and introduce an interactive mining cadastre.
• Publish mining contracts (large scale diamond and integrated projects) and subject them to audit by the Auditor General.
• Strengthen the EIA Act 2011 to ensure a stronger element of public participation, accessibility of EIAs, and a required iterative process throughout the life cycle of the mine. A separate but related policy should be developed around resettlement and compensation that reflects good practice (relevant WB Guidelines, for example). This latter policy component could be part of a national CSR policy for the EI sector, as noted below.
• Consider developing a national CSR Policy for the Extractives Sector in Botswana or include a CSR component in the national mineral policy. Many countries have created a policy framework to guide private sector contributions to local economic development. As part of this policy framework, increasingly countries are including guidelines for the negotiation of a community-company develop-ment plan. There are a number of different models, including the World Bank Community Develop-ment Agreement (CDA), the South African Social and Labour Plan and the Canadian Impacts and Benefits Agreements; emphasis needs to be on interventions that are negotiated with appropriate
stakeholders, aimed to address issues that emerge during different stages of the mining lifecycle, are sustainable, and coordinated with local government development planning.
• Develop a local content strategy specifically targeted toward the mining sector. This would include development of local suppliers and should have participation by the industry and ensure that industry needs are met as well as government localization objectives.
Four more somewhat challenging options – which remain fundamental to the good governance of the mining sector and its contribution to national development – are:
• Create an Access to Information Act to ensure public access to all relevant government information;
• Consider an initiative to improve transparency in the sector and create a forum to allow for on-going dialogue between government, civil society and industry stakeholders;
• Develop a national land use policy and strategy that has the input of a range of stakeholders, including civil society, community, industry, academic, government and traditional authorities. It should include a process for public input into government decisions on land use, and determine if mining is always the preferable option.
• Consider developing a protected areas strategy that would remove certain ecologically sensitive land from mineral exploration or development.
• Increase intra-governmental communication so that the timing of various types of mine permitting is coordinated; and to ensure that there is a “whole of government” approach to land use, consideration of mining compared to other socio-economic activities such as eco-tourism, and other opportunities for economic diversification.
• Consider the Africa Mining Vision’s recommendation that a portion of mineral revenue be returned to local government (through to communities) where mining has negatively impacted on the people and natural resources of a particular area.
BOTSWANA MINING INVESTMENT AND GOVERNANCE REVIEW
3
1 INTRODUCTION
4
The Botswana Mining Investment and Governance Review (MInGov) collects and shares information on mining sector governance, its attractiveness to investors and how its activities affect national development. It reviews sector performance from the perspective of three main stake-holder groups – government, investors in the mining value chain and civil society – and identifies gaps between declared and actual government policy and practice.
MInGov identifies the status and challenges facing mining governance and investment across seven themes and the extractive industry value chain. Three of these themes are assessed across five stages of the value chain—Contracts, Licenses and Exploration; Operations; Taxation and State Participation; Revenue Distribution and Management; and Local Impact.
The three value chain themes are:
A Policy, Legislation and Regulation. This theme measures de jure governance, or in other words the scope and quality of mining sector rules compared to good practice.
B Accountability and Inclusiveness. This theme measures accountability, transparency practices and the extent to which the public and other relevant stakeholders are involved in governance processes.
C Institutional Capacity and Effectiveness. This theme measures the quality of government organizations and their ability to effectively govern, including the extent to which the de jure intent of the rules is applied in practice (de facto governance).
The remaining four themes are either cross-cutting (D to F) or assess the importance of mining (M) in Botswana. These themes are:
D Economic Environment. This cross-cutting theme reviews broader economic factors, including cost competiveness, economic stability, the general investment climate, and skills and human capital.
E Political Environment. This cross-cutting theme measures political risks relevant to the mining sector and which include stability of mining and fiscal policy, political stability and security, and expropria-tion risk.
F Sustainable Development. This cross-cutting theme covers development planning, local supplier devel-opment, economic diversification and leveraging private sector investments in infrastructure.
M Mining Sector Importance. This theme measures the importance of the mining sector in Botswana in terms of geological potential, the level of foreign direct investment, and its contribution to national revenue and employment.
MInGov’s methodology focuses on the status of govern-ance and investment conditions in the mining sector from the perspective of stakeholders, and as reported in primary and secondary sources. However, while analysis is based on data from 314 questions, some areas important to the mining sector and government and civil society in relation to mining are not covered. These less-well-covered areas include the quality of its infra-
INTRODUCTION1
4
structure services, the security of property from theft, the underlying strength of institutions, and ways to enhance mining’s contribution to local and national development. The Botswana MInGov report has one annex: The Botswana MInGov Data Compendium. It contains scores for each of the 314 individual questions, and their aggre-gation to theme and value chain stage level. In time, the MInGov website will provide access to MInGov Botswana reports and their underlying data, as well as other infor-mation on MInGov.
Botswana review data is made available in this report (and in future on the website) to facilitate: (i) the user’s ability to drill down into the data; (ii) the identification
of countries that are similar in terms of mining sector importance, governance and investment attractiveness; and (iii) the identification of stakeholder priorities. This information should help stakeholders develop options to strengthen sector governance, investment and impact. However, it should be kept in mind that MInGov is neither a ranking nor an index: it does not present rankings of countries on the strength of their mining sector gover-nance or attractiveness for investment in the sector.
This report presents data on mining investment and governance indicators for Botswana that are current as of October 30, 2015.
BOTSWANA MINING INVESTMENT AND GOVERNANCE REVIEW
5
2 MINING IN BOTSWANA – COUNTRY CONTEXT
6
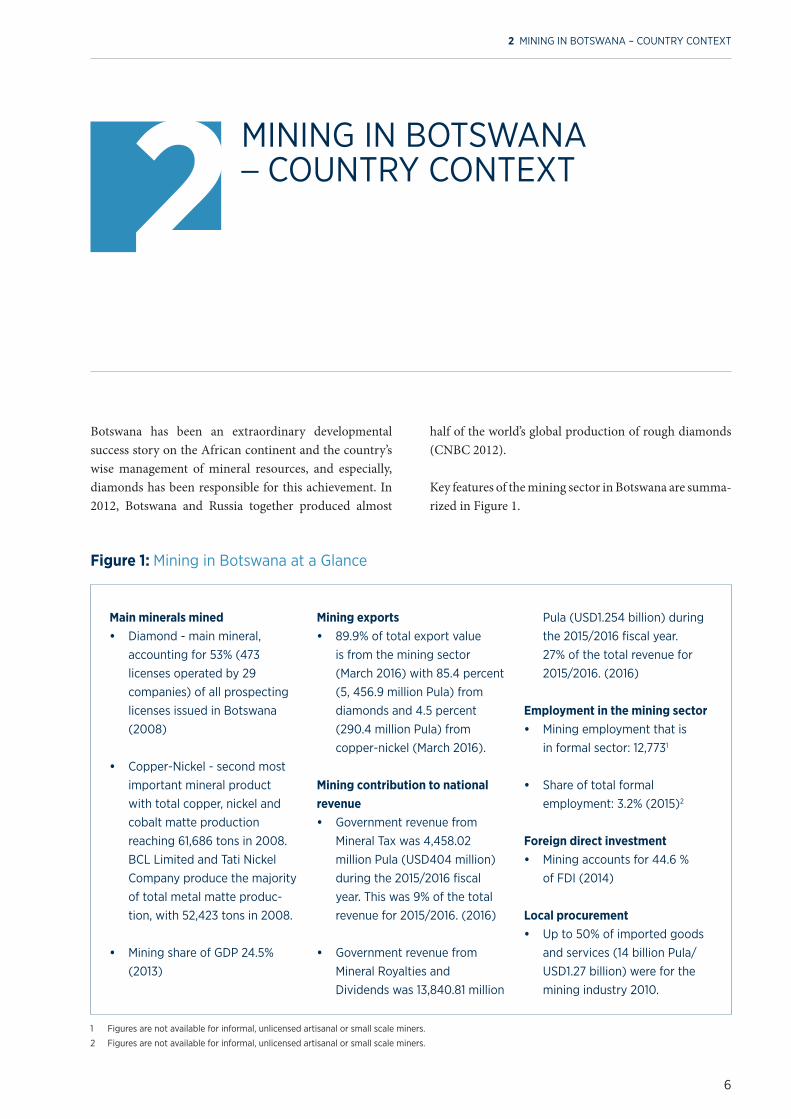
Botswana has been an extraordinary developmental success story on the African continent and the country’s wise management of mineral resources, and especially, diamonds has been responsible for this achievement. In 2012, Botswana and Russia together produced almost
half of the world’s global production of rough diamonds (CNBC 2012).
Key features of the mining sector in Botswana are summa-rized in Figure 1.
Figure 1: Mining in Botswana at a Glance
Main minerals mined • Diamond - main mineral,
accounting for 53% (473 licenses operated by 29 companies) of all prospecting licenses issued in Botswana (2008)
• Copper-Nickel - second most important mineral product with total copper, nickel and cobalt matte production reaching 61,686 tons in 2008. BCL Limited and Tati Nickel Company produce the majority of total metal matte produc-tion, with 52,423 tons in 2008.
• Mining share of GDP 24.5% (2013)
Mining exports• 89.9% of total export value
is from the mining sector (March 2016) with 85.4 percent (5, 456.9 million Pula) from diamonds and 4.5 percent (290.4 million Pula) from copper-nickel (March 2016).
Mining contribution to national revenue • Government revenue from
Mineral Tax was 4,458.02 million Pula (USD404 million) during the 2015/2016 fiscal year. This was 9% of the total revenue for 2015/2016. (2016)
• Government revenue from Mineral Royalties and Dividends was 13,840.81 million
Pula (USD1.254 billion) during the 2015/2016 fiscal year. 27% of the total revenue for 2015/2016. (2016)
Employment in the mining sector • Mining employment that is
in formal sector: 12,7731
• Share of total formal employment: 3.2% (2015)2
Foreign direct investment• Mining accounts for 44.6 %
of FDI (2014)
Local procurement • Up to 50% of imported goods
and services (14 billion Pula/USD1.27 billion) were for the mining industry 2010.
MINING IN BOTSWANA – COUNTRY CONTEXT2
1 Figures are not available for informal, unlicensed artisanal or small scale miners.
2 Figures are not available for informal, unlicensed artisanal or small scale miners.
The modern era of mining in Botswana began one year after independence in 1965 when De Beers discovered the first kimberlite pipe after decades of fruitless explo-ration activity. In 1971 the first diamonds were produced at Orapa, followed by copper-nickel production at the Bamangwato Concessions Ltd (BCL) at Selibe-Phikwe several years later. Currently diamonds provide 89.9% of export sales (Statistics Botswana, 2016). Mineral royalties and dividends account for 27% of government revenue and 24.5% of GDP. Debswana, the 50-50% joint venture between De Beers Consolidated Mines and the Govern-ment of the Republic of Botswana (GRB) diamond company, is the largest contributor to the national treasury. Botswana’s gross domestic product (GDP) has been growing at about 7% since diamonds were produced and has been one of the fastest growing economies in the world. Without the diamond trade, Botswana would lose approximately $500 million in export revenue per year.
The mining industry as a whole has provided the greatest contribution of all industrial sectors to GDP since the early 1980s, ranging from 30-50%. Although the industry contributes significantly to the country’s financial reserves, it provides 3.2% percent of formal employment (Statistics Botswana, 2015).
The GRB’s success in deriving significant benefit from its diamond resource, in particular, has been the envy of many resource rich developing countries. Not all devel-oping countries are successful in developing their nations due to the presence of mineral resources, as commen-tators on the “resource curse” have often noted.3 The government has been able to retain a significant portion of mineral wealth through a policy of profit-sharing and equity stakes in the Debswana mining operation (as well as the global De Beers diamond operations) as well as in other profitable mines. De Beers has been a collegial partner, recognizing the long-term benefit of maintaining a good relationship with the GRB.
Botswana has managed to use its mineral resources wisely, keeping long-term goals in mind, including
gaining an increasingly large share of the global diamond value chain. The GRB has established strong government institutions and has followed a careful macro-economic policy; it has sought to entrench democratic principles and has promoted adherence to the rule of law.
Today, Botswana enjoys an upper middle-income status and although there have been issues around health, high unemployment rates and international criticism around exploration and mining of diamonds in the ecologically sensitive Central Kalahari Game Reserve, the country’s economic progress has been remarkable. However, the country is also on a precipice regarding its reliance on diamonds for its future prosperity.
In the last several years, diamond production has declined due to lower global demand and falling commodity prices. The impact of this on the Botswana economy has been somewhat tempered by increased coal and gold production and sales. However, the declining revenue from diamond production has strengthened the GRB’s resolve to diversify the economy and to shift its reliance away from diamonds. The cost of extracting diamonds is expected to rise in about 15 years, due to conversion of some open cast mines to underground and the closure of several smaller diamond mines. Along with providing diamond cutting, polishing and marketing facilities,4
the country is currently focusing on the development of large coal reserves and base metals to offset its reliance on diamonds. It should be noted that mining’s contribu-tion to the GDP was 46.1% in 2006 (AfDB, 2012) and has declined to just under 25% in 2013. This would indicate that the development of other sectors in the economy is reducing the country’s reliance on mining.
The GRB’s commercially driven stance on mineral development has resulted in an investor-friendly invest-ment climate, but its concern about unemployment has increased the focus on local hiring practices. Companies have identified serious issues about their ability to hire specialized skills outside Botswana. The country will need to be careful to maintain its reputation as an investor
BOTSWANA MINING INVESTMENT AND GOVERNANCE REVIEW
7
3 There is some dispute as to whether Botswana has in fact managed to avoid the resource curse, given the economy’s high dependence on one commodity
– diamond production and trading. A full discussion of this issue goes beyond the purview of this assessment although it is discussed briefly under a later
section describing how diamonds have been used for development.
4 To diversify the industry’s products and export markets as well as encouraging downstream cutting and polishing activities, Botswana launched its own
diamond trading company, Diamond Trading Company Botswana (DTCB), in September 2013. The creation of the DTCB, a joint venture between De Beers
and the Botswana Government is bringing to an end the practice of sending rough diamonds to De Beers’ London-based main Diamond Trading Company
for sorting and marketing.
friendly investment regime if it is to encourage foreign investment in mining.
The mining industry in Botswana is governed through the Mines and Mineral Act of 1999. The Act is currently under review. Other relevant legislation includes the Mines, Quarries, Works and Machineries Act, 1973, that deals with the health and safety of employees involved in prospecting, mining and quarrying operations, and the Environmental Assessment Act, 2011 that requires environmental impact assessments of prospecting and mining activities. Prospecting and mining activities that result in discoveries of precious and semi-precious stones are subject to the provisions of the Precious and Semi-Precious Stones (Protection) Act, 1969. All of these Acts have had some chapters or sections of amendment over the past several decades.
Despite its ability to achieve sound resource-led growth and development over the decades since Independence, Botswana has not been without significant socio-eco-nomic challenges. Income disparity is one of the worst in the world (GINI index of 60.5 in 2009) and while great strides have been made to eradicate poverty, particu-larly in the last decade, inequality and exclusion are still serious issues in Botswana. The rurally based population in remote areas lacks access to employment opportuni-ties and to productive land. The unemployment rate has worsened in the last several years and is reported to be around 20% with youth particularly badly affected.
Botswana has had challenges controlling a number of serious diseases, chief among these, HIV/AIDS. Although the country still has a high HIV prevalence rate, the rate of new infections among the adult population is on the decline. More than 95% of the total population has access to a health centre; however, there is a high rate of infant (35 per 1,000 births in 2015) and maternal deaths caused
by inefficient management of health facilities, as well as high fertility rates and a high percentage of youth popula-tion infected by HIV (Africa Economic Outlook, 2015).
Companies operating in Botswana are not legally required to contribute to local economic development, including requirements for local procurement or hiring.5 However, a Citizen’s Economic Empowerment Policy (CEEP) has been drafted (2012) that includes a range of measures to increase the participation of Batswana in the economy, including local content requirements. This draft policy brings together existing disparate policies that encourage the development of local businesses at the SMME level as well as increasing participation of Batswana in large-scale industrial sectors, including mining. For example, the Localisation Policy gives preference to employment of Batswana over non-citizens given similar educational and training qualifications. Agencies such as the Local Enterprise Authority and Citizen Entrepreneurial Devel-opment Agency provide funding and other types of support to SMME development.6 Apart from the Local-isation Policy component of the draft CEEP, the GRB has not implemented fully this draft CEE policy in the mining sector, driven by concerns about increasing costs for the industry at a time when commodity prices are in a downward cycle. The draft policy emphasizes the need for local Batswana individuals and companies to develop the necessary skills and expertise to be able to take advantage of opportunities presented by sectors such as mining. However, it stops short of requiring a percentage of local company equity in exploration or mining projects, or a required percentage of local procurement spending.
Botswana supports a policy of equitable development where mineral revenue is deposited at the National Treasury where it is dispersed according to national developmental priorities (named in the five-year National Development Plans).
2 MINING IN BOTSWANA – COUNTRY CONTEXT
8
5 Such as would be provided through a negotiated community-company development agreement or compliance with national guidelines around private
sector participation in local economic development initiatives.
6 http://www.miti.gov.bw/content/citizen-economic-empowerment-policy
99
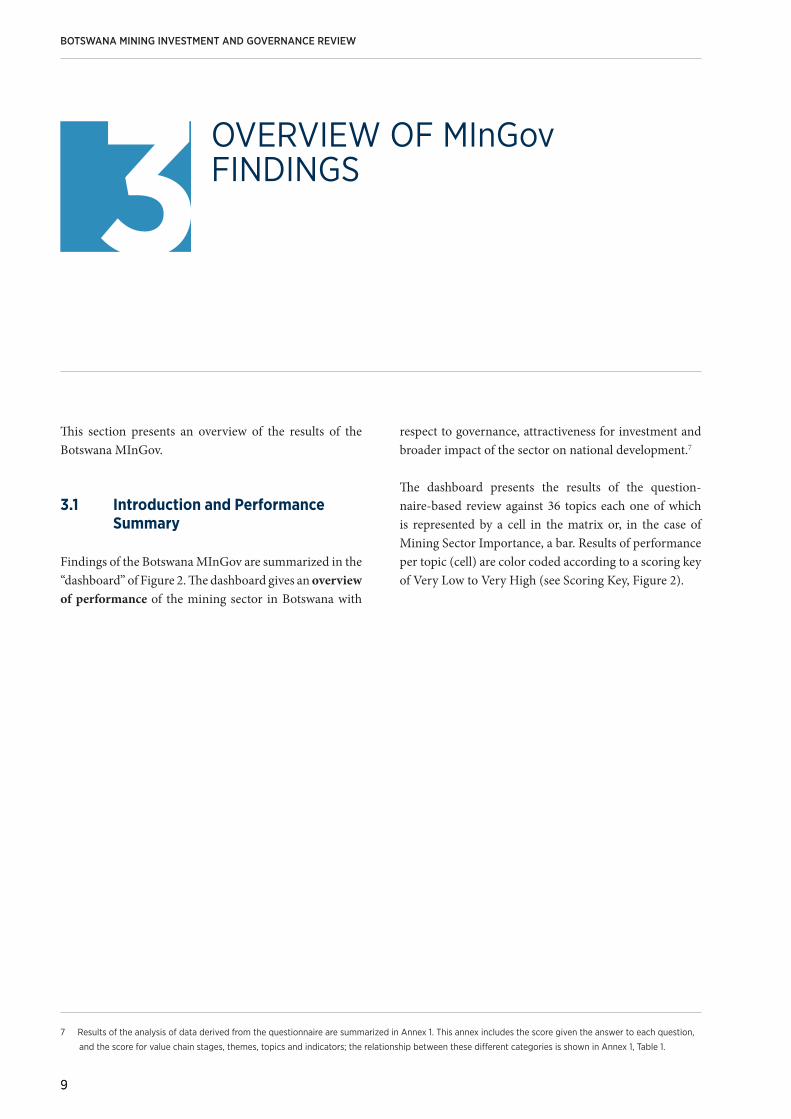
This section presents an overview of the results of the Botswana MInGov.
3.1 Introduction and Performance Summary
Findings of the Botswana MInGov are summarized in the “dashboard” of Figure 2. The dashboard gives an overview of performance of the mining sector in Botswana with
respect to governance, attractiveness for investment and broader impact of the sector on national development.7
The dashboard presents the results of the question-naire-based review against 36 topics each one of which is represented by a cell in the matrix or, in the case of Mining Sector Importance, a bar. Results of performance per topic (cell) are color coded according to a scoring key of Very Low to Very High (see Scoring Key, Figure 2).
BOTSWANA MINING INVESTMENT AND GOVERNANCE REVIEW
OVERVIEW OF MInGov FINDINGS3
7 Results of the analysis of data derived from the questionnaire are summarized in Annex 1. This annex includes the score given the answer to each question,
and the score for value chain stages, themes, topics and indicators; the relationship between these different categories is shown in Annex 1, Table 1.
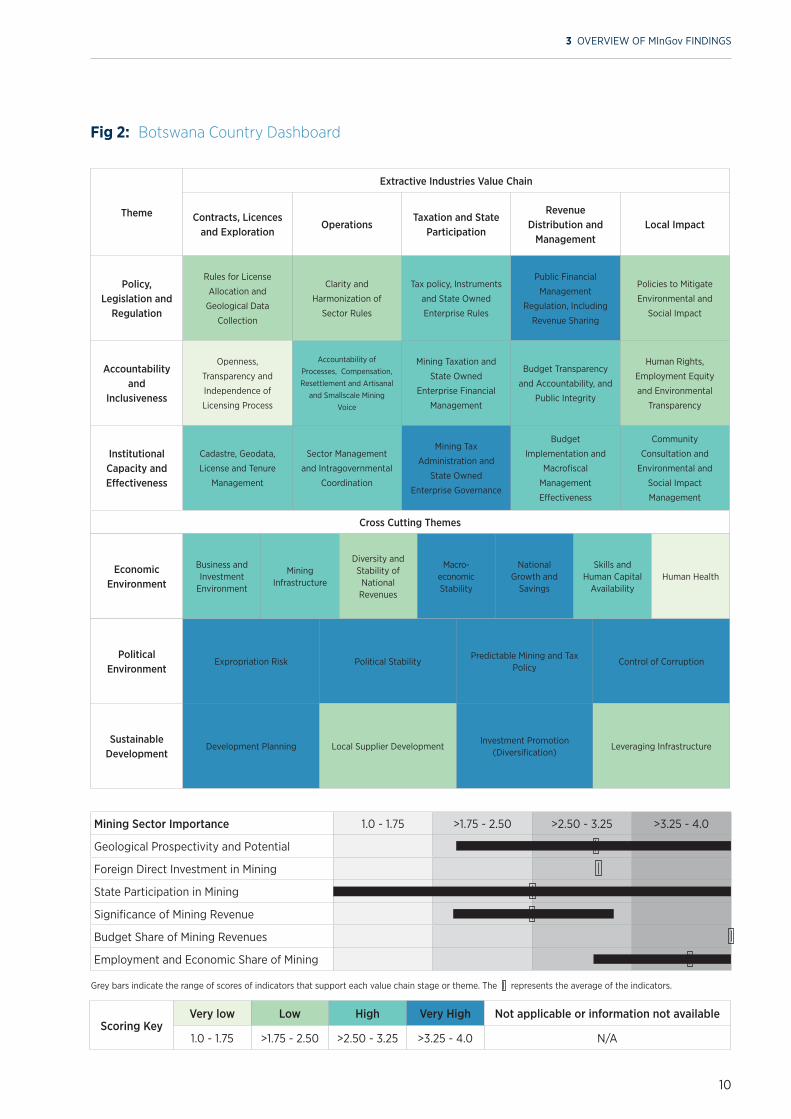
Fig 2: Botswana Country Dashboard
3 OVERVIEW OF MInGov FINDINGS
10
Theme
Extractive Industries Value Chain
Contracts, Licences and Exploration
OperationsTaxation and State
Participation
Revenue Distribution and
ManagementLocal Impact
Policy, Legislation and
Regulation
Rules for License
Allocation and
Geological Data
Collection
Clarity and
Harmonization of
Sector Rules
Tax policy, Instruments
and State Owned
Enterprise Rules
Public Financial
Management
Regulation, Including
Revenue Sharing
Policies to Mitigate
Environmental and
Social Impact
Accountability and
Inclusiveness
Openness,
Transparency and
Independence of
Licensing Process
Accountability of Processes, Compensation, Resettlement and Artisanal
and Smallscale Mining Voice
Mining Taxation and
State Owned
Enterprise Financial
Management
Budget Transparency
and Accountability, and
Public Integrity
Human Rights,
Employment Equity
and Environmental
Transparency
Institutional Capacity and Effectiveness
Cadastre, Geodata,
License and Tenure
Management
Sector Management
and Intragovernmental
Coordination
Mining Tax
Administration and
State Owned
Enterprise Governance
Budget
Implementation and
Macrofiscal
Management
Effectiveness
Community
Consultation and
Environmental and
Social Impact
Management
Cross Cutting Themes
Scoring Key Very low Low High Very High Not applicable or information not available
1.0 - 1.75 >1.75 - 2.50 >2.50 - 3.25 >3.25 - 4.0 N/A
Grey bars indicate the range of scores of indicators that support each value chain stage or theme. The represents the average of the indicators.
Mining Sector Importance 1.0 - 1.75 >1.75 - 2.50 >2.50 - 3.25 >3.25 - 4.0
Geological Prospectivity and Potential
Foreign Direct Investment in Mining
State Participation in Mining
Significance of Mining Revenue
Budget Share of Mining Revenues
Employment and Economic Share of Mining
Political Environment
Expropriation Risk Political StabilityPredictable Mining and Tax
PolicyControl of Corruption
Sustainable Development
Development Planning Local Supplier DevelopmentInvestment Promotion
(Diversification)Leveraging Infrastructure
Economic Environment
Business and Investment
Environment
Mining Infrastructure
Diversity and Stability of
National Revenues
Macro- economic Stability
National Growth and
Savings
Skills and Human Capital
AvailabilityHuman Health
3.2 Overview of “Value Chain” and “Theme” Performance
This section provides an overview of performance across the five value chain stages and the six cross-cut-ting themes.8 Subsequent sections present detailed results for each value chain stage and theme. The perfor-mance of each value chain stage and theme are discussed in subsequent sections. However, general comments on value chain stage and theme performance are:
• The Revenue Distribution and Management, Taxation and State Participation and Operation stages score higher than the Contracts, licenses and Exploration and Local Impact stages of the mineral value chain. The latter two both score in the “low” range.
• All themes score well, with Political Environment scored “very high”, while themes relating to legisla-tion and accountability both score borderline “high” scores. The Economic Environment theme scored slightly less high than the Political Environment due to the economic impact of HIV/Aids on the produc-tive population demographic.
• There are no value chain stages, nor themes that score very poorly, i.e. “very low”. The ones reflecting relatively lower scores are stages one and two of the value chain – Contracts, Licenses and Exploration; and Operations.
BOTSWANA MINING INVESTMENT AND GOVERNANCE REVIEW
11
8 Scores of questions, indicators, topics, value chain stages and themes are in Annex 1, the Data Compendium.
Notes:
1. Grey bars indicate the range of scores of indicators that support each value chain stage or theme. The represents the average of the indicators.
2. The scale for performance is: n Very low (1.0-1.75); n Low (>1.75-2.50); n High (>2.50-3.25); n Very High (>3.25-4.0). A higher score corresponds to better
governance and capacity.
3. A list of indicators comprising the value chain stage and themes can be found in Table 1, Annex 1
Value Chain Stage 1.0 - 1.75 >1.75 - 2.50 >2.50 - 3.25 >3.25 - 4.0
Contracts, Licences and Exploration
Operations
Taxation and State Participation
Revenue Distribution and Management
Local Impact
Theme 1.0 - 1.75 >1.75 - 2.50 >2.50 - 3.25 >3.25 - 4.0
Policy, Legislation and Regulation
Accountability and Inclusiveness
Institutional Capacity and Effectiveness
Economic Environment
Political Environment
Sustainable Development
Fig 3: Performance by Value Chain Stage and Theme
A range of performance exists across the value chain stage and across themes.
3.2 Performance from a Value Chain Perspective
This section presents findings against the five stages of the extractive industry value chain, it goes beyond presenting information at the topic level and shows the performance of the underlying indicators. Scores reflect mining governance performance and the attractive-ness of the sector to investment. The five value chain stages are assessed against three themes: Policy, Legisla-tion and Regulation; Accountability and Inclusiveness; and Institutional Capacity and Effectiveness. The other three cross-cutting themes are discussed in Section, 3.5.
3.4.1 Contracts, Licenses and Exploration
The Contracts, Licenses and Exploration stage obtained the second lowest score of all five stages. There were highly performing aspects of this phase of mining devel-opment, as well as areas where improvement is needed.
The Mines and Minerals Act, 1999 sets out a clear regula-tory framework for the licensing of mineral development in Botswana. The Act provides a level of detail for the awarding and managing of concessions that somewhat compensates for the lack of accompanying regulations that would be the norm in many mining jurisdictions. While the Act specifies the requirements in the licensing process for all minerals, a specific paragraph (51) notes that diamond mining licensing requires a negotiated process between the applicant and the government. The
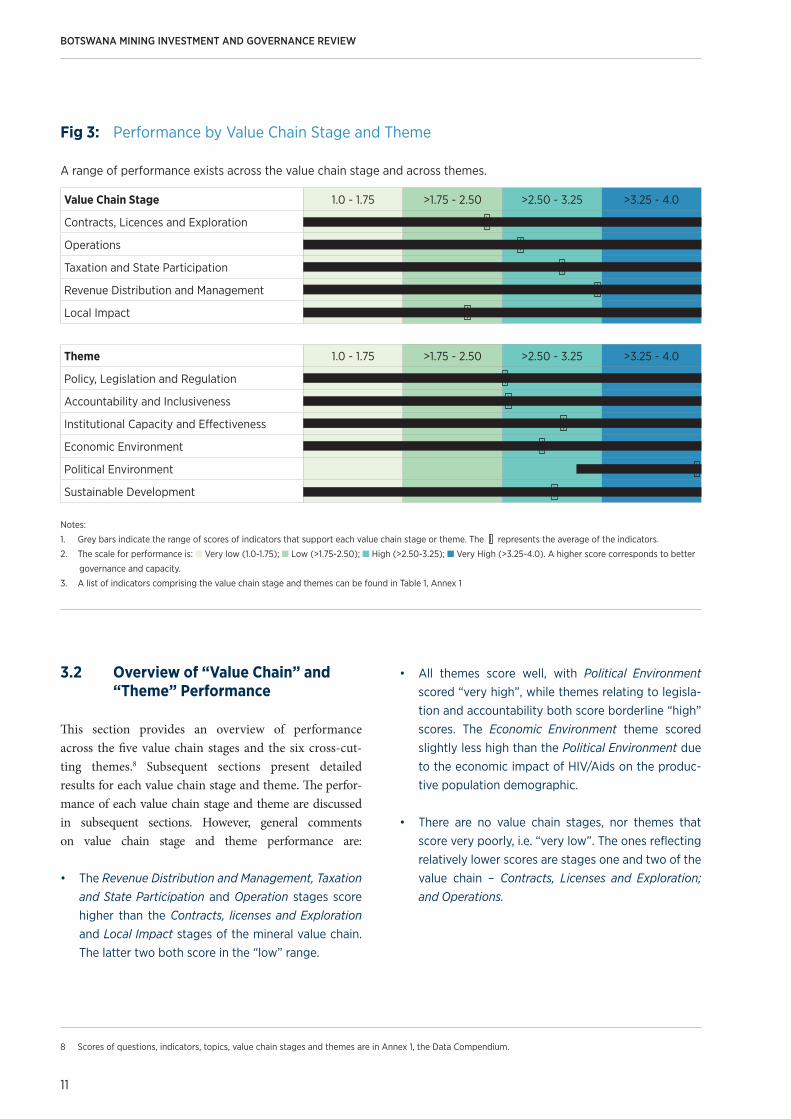
3.3 Mining Sector Importance
Mining Sector Importance (Figure 4, also represented in the dashboard, Figure 2), the seventh theme, is composed of six indicators: Geological Prospectivity and Potential, Foreign Direct Investment in Mining, State Participation in Mining, Significance of Mining Revenue, Budget Share of Mining Revenues and Employment and Economic Share of Mining. Scores for these indicators, which are based on primary and secondary data, indicate the importance of the mining sector in a given economy, from its geological potential to its impact on the economy and measure the potential for mining led growth.9
Diamond production in Botswana has been the backbone of its economy for many decades. However, there have been dips in its contribution to the country’s GDP in the last couple of years (currently is at about 25% of GDP) due to a global commodity price slowdown in demand and prices and to diversification efforts of the GRB to develop other sectors of the economy. It is anticipated, however, that demand for diamonds will strengthen and Botswana will continue to develop other mineral resources, notably base metals and coal. Additionally, employment in the mining sector is only 3.2% of total formal employment in Botswana. As diamond production is expected to slow by 2030, due to costs associated with extraction, it will be crucial for the GRB to intensify its efforts to diversify in these years leading up to the time when it can no longer rely on diamonds for its prosperity.
3 OVERVIEW OF MInGov FINDINGS
12
9 Intervals for scoring performance are as in the dashboard, that is: Very low (1.0-1.75); Low (>1.75-2.50); High (>2.50-3.25); and Very High (>3.25-4.0). A
higher score corresponds to better governance and capacity.
Fig 4: Mining Sector Importance
Mining Sector Importance 1.0 - 1.75 >1.75 - 2.50 >2.50 - 3.25 >3.25 - 4.0
Geological Prospectivity and Potential
Foreign Direct Investment in Mining
State Participation in Mining
Significance of Mining Revenue
Budget Share of Mining Revenues
Employment and Economic Share of Mining
difference in the way that diamonds are managed by the GRB accounts for a number of stakeholder concerns. This issue is discussed further as a “special topic” in this report.
Details of all licenses can be found on the Ministry of Minerals, Energy and Water Resources (MMEWR) Depart-ment of Mines’ website (www.mines.gov.bw). Various concession maps are displayed that include the name of the company, coordinates of the area under license, the type of license, the type of commodity, and the status of the license (i.e. original, renewal, etc.). The only contracts that exist are those negotiated for diamond mining as noted above.10
The concession map is updated every three months and
takes the place of an interactive, formal, mining cadastre.While the licensing authority resides in the Department of Mines and is not independent from the MMEWR, industry stakeholders interviewed indicated that Botswana has a fair and equitable licensing process (no discrim-ination of foreign owned companies, for example, in licensing allocation).
As referenced above, the Mines and Minerals Act, 1999 provides a clear “de jure” process regarding application requirements for prospecting,11 retention, and mining licenses for larger-scale mining; and a minerals permit for small scale mining. The Act ensures security of tenure,
BOTSWANA MINING INVESTMENT AND GOVERNANCE REVIEW
13
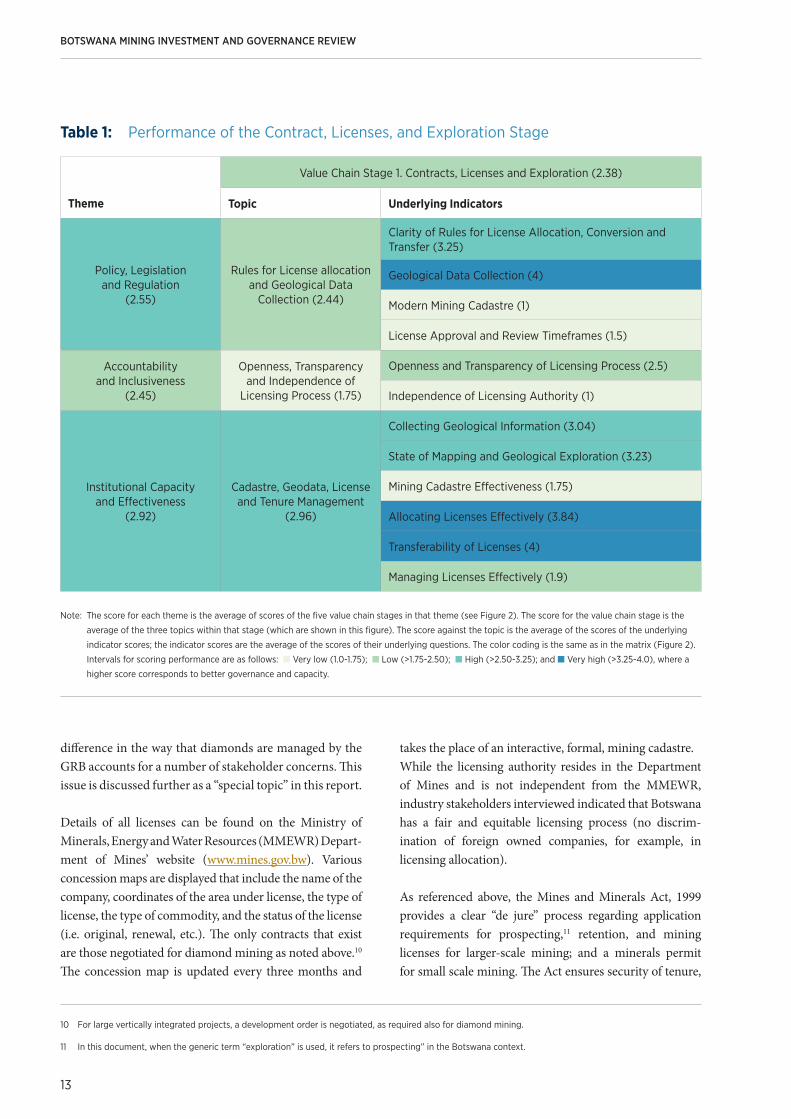
Table 1: Performance of the Contract, Licenses, and Exploration Stage
Note: The score for each theme is the average of scores of the five value chain stages in that theme (see Figure 2). The score for the value chain stage is the
average of the three topics within that stage (which are shown in this figure). The score against the topic is the average of the scores of the underlying
indicator scores; the indicator scores are the average of the scores of their underlying questions. The color coding is the same as in the matrix (Figure 2).
Intervals for scoring performance are as follows: n Very low (1.0-1.75); n Low (>1.75-2.50); n High (>2.50-3.25); and n Very high (>3.25-4.0), where a
higher score corresponds to better governance and capacity.
Theme
Value Chain Stage 1. Contracts, Licenses and Exploration (2.38)
Topic Underlying Indicators
Policy, Legislation and Regulation
(2.55)
Rules for License allocation and Geological Data
Collection (2.44)
Clarity of Rules for License Allocation, Conversion and Transfer (3.25)
Geological Data Collection (4)
Modern Mining Cadastre (1)
License Approval and Review Timeframes (1.5)
Accountability and Inclusiveness
(2.45)
Openness, Transparency and Independence of
Licensing Process (1.75)
Openness and Transparency of Licensing Process (2.5)
Independence of Licensing Authority (1)
Institutional Capacity and Effectiveness
(2.92)
Cadastre, Geodata, License and Tenure Management
(2.96)
Collecting Geological Information (3.04)
State of Mapping and Geological Exploration (3.23)
Mining Cadastre Effectiveness (1.75)
Allocating Licenses Effectively (3.84)
Transferability of Licenses (4)
Managing Licenses Effectively (1.9)
10 For large vertically integrated projects, a development order is negotiated, as required also for diamond mining.
11 In this document, when the generic term “exploration” is used, it refers to prospecting” in the Botswana context.
competitive tax rates, right to arbitration and other features of a modern mining regime. It allows for the transferability of licenses and provides clear instructions for the provision of geological data. It specifies that companies must report on the results of their prospecting work plans every three months, at the time of prospecting renewals and when the project has been completed.
Reflecting the aspects noted above regarding Botswana’s clear, “de jure” legal framework for mining, the indicator measuring Clarity of license allocation, conversion and transfer and data collection rules scored highly, (despite the lack of regulations accompanying the Mines and Minerals Act, 1999, which would be an improvement and raise the score of this indicator).
Botswana has a strong geological survey that has mapped most of the country and that maintains a library of geolog-ical data. Some companies acknowledged the information available but noted that better geological data would facil-itate prospecting and exploration efforts. The Survey is in the process of converting to a parastatal12 that will be conducted along business lines with its own salary scale and with an enhanced cost recovery objective.13 This should improve the attraction of skilled geologists to the Survey and help to maintain critical staff; this has been a problem as mining companies provide more competitive compen-sation. Cadastre, Geodata, License and Tenure Management is thus the highest scoring topic, containing two underlying indicators performing at maximum strength.
One of the areas cited most often by mining companies as requiring attention was the lack of legal timeframes for the processing of various types of licenses. “De facto”, the MMEWR applies administrative service guidelines (that include aspirational timeframes) to the processing of these exploration and mining applications. However, the
lack of legal timeframes included in the legislation means that companies have no legal recourse mechanisms to hold the Ministry to account. The Geological Survey in the past managed exploration licenses but this function has been transferred to the Department of Mines. It appears that adequate resourcing for this new responsibility has not been sufficient to perform this function in a timely manner. The “de jure” topic of Rules for License Allocation and Geological Data Collection therefore scored “low” due to the lack of a fully functioning mining cadastre and to the absence of license approval and review timeframes in the legal framework. This factor also contributed to a low score under Managing Licenses Effectively. Mining companies cited this issue as one of their highest priorities.
Most modern mining legislation includes timeframes for processing of applications for prospecting, mining and other types of licenses. Examples of these from the Southern African region include the South African14 Minerals and Petroleum Resources Development Act (2002) and the Zambian Mineral Development Act (2008).15 An example from the Canadian province of Ontario includes license application approval timeframes in the Regulations accompanying the Mining Act (2012).16 The insertion of timeframes into either a mining Act or Regulations is important for a number of reasons. Primarily it ensures that companies that are seeking decisions on exploration, mining or other types of licenses can provide a degree of certainty regarding the decision-making horizon to the investor or financier. When companies are seeking financing for a project, this type of assurance can increase investor confidence and also provide companies with a legal framework in which to lodge appeals, should these timeframes not be honoured.
For civil society, including the union responsible for mineworkers, transparency and holding government to
3 OVERVIEW OF MInGov FINDINGS
14
12 During the World Bank Botswana Mingov validation meeting of August 11, 2016, it was confirmed that the Geological Survey had become a parastatal in
December 2015. It is now called the Botswana Geoscience Institute.
13 At the validation review with government held on 11th August 2016, it was confirmed this reform was completed.
14 Granting and Duration of a Prospecting Right: 17.(3) If the Minister refuses to grant a prospecting right, the Minister must, within 30 days of the decision, in
writing notify the applicant of the decision with reasons.Granting and Duration of a Mining Right: 23. (4) If the Minister refuses to grant a mining right, the
Minister must, within 30 days of the decision, in writing notify the applicant of the decision and the reasons. (South Africa MPRDA, 2002)
15 16 (1): The Director of the Geological Survey, within 60 days of receipt of an application…must grant a prospecting license to the applicant where the appli-
cant meets the requirements of this Act (Zambia Mineral Development Act, 2008).
16 15 (1) Within 50 days of the circulation date…the Director shall make a decision as to whether to issue an exploration permit…and if so what terms and
conditions apply to the permit. (Ontario Mining Act Regulations, 2012).
account for decisions on mineral resource development in the country was one of the highest stakeholder priorities (see Section 4). Representatives from civil society groups cited the lack of transparency around closed government negotiations for large scale diamond and integrated project contracts as a governance weakness. This concern was expressed also by government representatives, notably the Auditor General’s office that is not allowed to audit these contracts as part of their mandated auditing function. Publishing contracts and making them subject to an AG audit (with an accompanying publicly available report) would improve the country’s scoring on this theme and align them with international best practices.
To address issues regarding transparency and accountability in the licensing allocation process, some developing country jurisdictions have sought to separate the licensing function from the overar-ching MMEWR. This separation can reduce potential for political interference in the licensing process and reduces opportunities for irregular transactions. However, in jurisdictions with a very low incidence of perceived corruption, such as Botswana, this may not be necessary.
Not surprisingly, the lowest scoring topic under this stage of the value chain that reflects the concerns and priorities of a number of respondents throughout all stakeholder groups interviewed was Openness, Trans-parency and Independence of the Licensing Process.
It should be noted that while Botswana does provide details on concessions, it has not completed the process of installing a permanent mining cadastre, although it has been investigating various trial period options, including Flexi-Cadastre for some time. While the mineral concession map is updated regularly, it does not provide for an interactive process between the concession holder and licensing officials or provide up-to-date information on the cadastre for potential mineral investors. This is why this indicator (Mining Cadastre Effectiveness) scores in the “very low” to “low” range.
3.4.2 Operations
The Operations stage is a high performing stage of the mineral value chain in Botswana. However, there are some gaps in the regulatory framework and areas of weakness
in the institutional capacity to regulate this phase of the minerals value chain. These are discussed below.
Mining activity at the operations stage is managed by different divisions within the Department of Mines. These divisions allocate licenses, inspect operations and generally monitor compliance with the regulatory framework for mining operations. Well trained staff are comparatively well paid (within the SADC country context) and are supported by good physical and telecommunications infrastructure.
It is clear that the GRB wants to encourage investment into the mining sector and strives to be an efficient responder to industry concerns; companies indicated that when they have completed their exploration work and move into the opera-tional (or productive) stage of mining, they are regulated by quite a competent and adequately resourced Department of Mines. Mostly, it does not want to deter the industry in reaching production targets as tax revenue will be held up if operations are in any way delayed. Therefore, the Depart-ment of Mines tends to take a non-punitive approach generally to the management of mining operations, without clearly contravening its own regulatory requirements. Therefore, the monitoring of production, sales and trade aspects at this stage of mine development appears to include ample opportunity for company compliance.
The mining legislation is clear (as it was for the first stage of the value chain) at the operations phase. There are no conflicting legislative requirements across government institutions regulating the sector and government appears to be well coordinated in managing different aspects of the licensing process throughout the operational phase of mining. Inter-ministerial committees are set up to coordi-nate licensing requirements for large-scale integrated projects that require a number of ministries to approve various aspects of licensing (including, energy, water, transportation). Thus, the topic of Sector Management and Intragovernmental Coordination that assesses these issues received a “high” score.
While there are some areas (as outlined above) where there is strong institutional capacity, there are negative impacts from the lack of “de jure” time frames for license renewal approvals. This aspect was discussed in the previous stage of the minerals value chain also. This affects the industry’s ability to operate without breaks in continuity. Delays in exploration license renewals, for example, appear to have resulted in situations where some exploration companies operated for a period illegally when renewals were not
BOTSWANA MINING INVESTMENT AND GOVERNANCE REVIEW
15
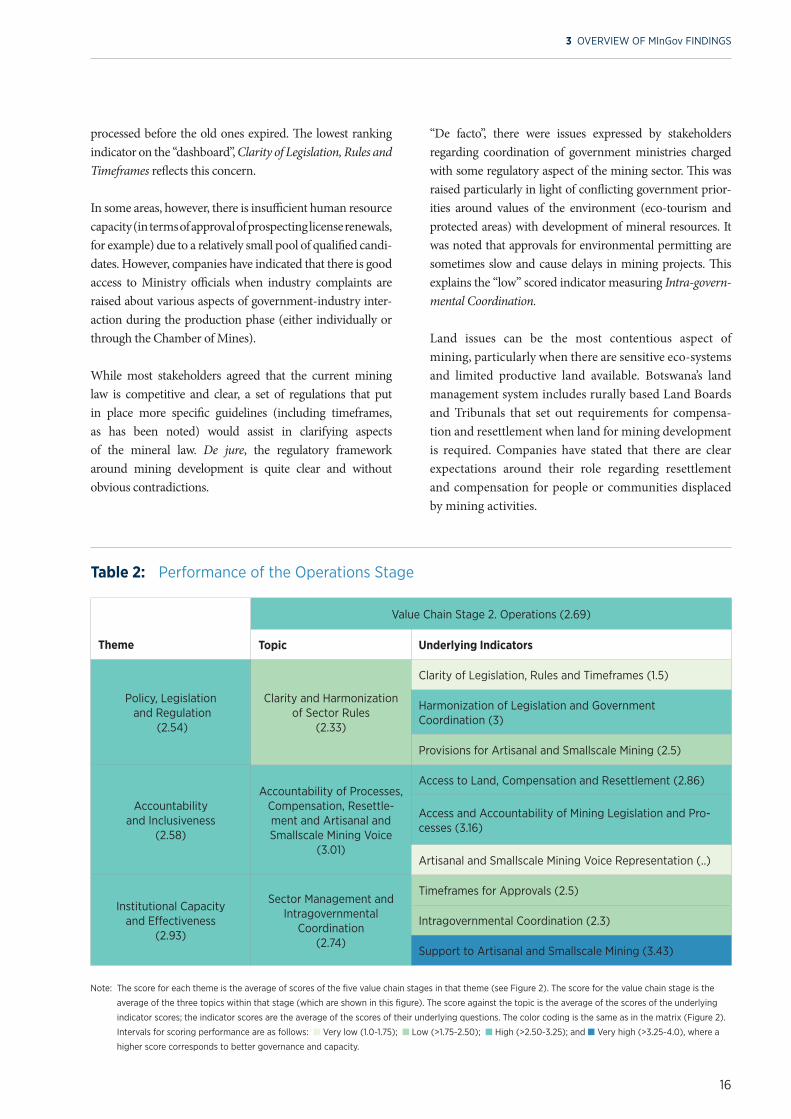
processed before the old ones expired. The lowest ranking indicator on the “dashboard”, Clarity of Legislation, Rules and Timeframes reflects this concern.
In some areas, however, there is insufficient human resource capacity (in terms of approval of prospecting license renewals, for example) due to a relatively small pool of qualified candi-dates. However, companies have indicated that there is good access to Ministry officials when industry complaints are raised about various aspects of government-industry inter-action during the production phase (either individually or through the Chamber of Mines).
While most stakeholders agreed that the current mining law is competitive and clear, a set of regulations that put in place more specific guidelines (including timeframes, as has been noted) would assist in clarifying aspects of the mineral law. De jure, the regulatory framework around mining development is quite clear and without obvious contradictions.
“De facto”, there were issues expressed by stakeholders regarding coordination of government ministries charged with some regulatory aspect of the mining sector. This was raised particularly in light of conflicting government prior-ities around values of the environment (eco-tourism and protected areas) with development of mineral resources. It was noted that approvals for environmental permitting are sometimes slow and cause delays in mining projects. This explains the “low” scored indicator measuring Intra-govern-mental Coordination.
Land issues can be the most contentious aspect of mining, particularly when there are sensitive eco-systems and limited productive land available. Botswana’s land management system includes rurally based Land Boards and Tribunals that set out requirements for compensa-tion and resettlement when land for mining development is required. Companies have stated that there are clear expectations around their role regarding resettlement and compensation for people or communities displaced by mining activities.
3 OVERVIEW OF MInGov FINDINGS
16
Table 2: Performance of the Operations Stage
Note: The score for each theme is the average of scores of the five value chain stages in that theme (see Figure 2). The score for the value chain stage is the
average of the three topics within that stage (which are shown in this figure). The score against the topic is the average of the scores of the underlying
indicator scores; the indicator scores are the average of the scores of their underlying questions. The color coding is the same as in the matrix (Figure 2).
Intervals for scoring performance are as follows: n Very low (1.0-1.75); n Low (>1.75-2.50); n High (>2.50-3.25); and n Very high (>3.25-4.0), where a
higher score corresponds to better governance and capacity.
Theme
Value Chain Stage 2. Operations (2.69)
Topic Underlying Indicators
Policy, Legislation and Regulation
(2.54)
Clarity and Harmonization of Sector Rules
(2.33)
Clarity of Legislation, Rules and Timeframes (1.5)
Harmonization of Legislation and Government Coordination (3)
Provisions for Artisanal and Smallscale Mining (2.5)
Accountability and Inclusiveness
(2.58)
Accountability of Processes, Compensation, Resettle-ment and Artisanal and Smallscale Mining Voice
(3.01)
Access to Land, Compensation and Resettlement (2.86)
Access and Accountability of Mining Legislation and Pro-cesses (3.16)
Artisanal and Smallscale Mining Voice Representation (..)
Institutional Capacity and Effectiveness
(2.93)
Sector Management and Intragovernmental
Coordination (2.74)
Timeframes for Approvals (2.5)
Intragovernmental Coordination (2.3)
Support to Artisanal and Smallscale Mining (3.43)
Some companies noted, however, that they voluntarily pay higher rates for land compensation that are stipu-lated by the Land Board, mostly to achieve a “social license” to mine, especially in ecologically sensitive areas (around the Okavango Delta or in the Central Kalahari Game Reserve). Companies have also called for better guidelines around resettlement and compensation for displaced people. However, companies have also noted that they are able to access land that has been allocated through the formal licensing process, unlike many developing countries when land access is blocked by traditional authorities or illegal miners. The access to land as well as clear guidelines (while somewhat less detailed that desired) explain the “high” scoring on the indicator related to Access to Land, Compensation and Resettlement.
In addition to compensation for land used for mining, there are also issues related to competing water uses. Mining is a water-intensive activity and thus the industry is a major user of the resource. With extremely low precipitation in most parts of Botswana, access to groundwater provides water resources for all water users, including communities as well as industry. The regulatory framework in the country provides for compensation when mining depths reach the level of aquifers (large stores of water under the saturated water table level below the surface). Farmers are the primary beneficiaries of this compensation. Impacts and mitigation strategies related to mining’s impact on water resources are included in the mining project EIA process.
While government has noted that the mining sector is carefully monitored in its water use, there have been instances where communities have expressed concern. There were community issues around access to water at the Debswana Orapa mine, for example, in the past. Debswana has addressed the issue through construction of sophisticated recycling facilities and use of storm water as alternatives to groundwater use. Some other companies operating in the Kalahari area have provided desalination plants for community access to water. Government has noted that the mining sector is largely compliant with water management regulations due to the high profile nature of this resource.
Another issue that has potential to result in conflict over land use relates to the presence and management of artisanal and small scale mining. The Department of Mines does not formally recognize the presence of informal artisanal mining in Botswana and has stated
that all small-scale mining is licensed. Hence, there does not appear to be an illegal artisanal/small scale mining sector as is found in many other mining jurisdictions in the developing world. There was some dispute over this official government stance expressed by other stake-holders.
For the purposes of this report, only governance issues related to licensed small scale mining will be scored and discussed. This explains why the indicator related to the Voice of Artisanal and Small Scale Mining Representa-tion has not been included in the evaluation of this stage of the mining value chain. This mineral governance aspect usually relates to countries that have large, illegal, artisanal mining activity. In such cases, these miners can be vulnerable to exploitation by mining lease owners due to lack of education and conditions of poverty. In some of these instances, governments have not put in place sufficient socio-economic protection policies regarding the human rights of these miners. This is not the case in Botswana; therefore, this indicator has been scored as non-applicable to this country’s assessment.
In terms of the regulatory framework for ASM, the Mines and Minerals Act, 1999 does include provision for Minerals Permits (as distinguished from Mining Licenses for larger scale mining). This part of the Law specifically aims to allow small scale miners access to smaller plots of mineral rich land to mine industrial minerals through mechanized means. Therefore, there are regulatory provi-sions for small scale miners, but because artisanal mining does not exist in Botswana, nothing appears in the legisla-tion relevant to artisanal mining. Therefore the Provisions for Artisanal and Small Scale Mining Sector indicator was ranked according to the constraints posed by the methodology that groups these two types of mining into one category.
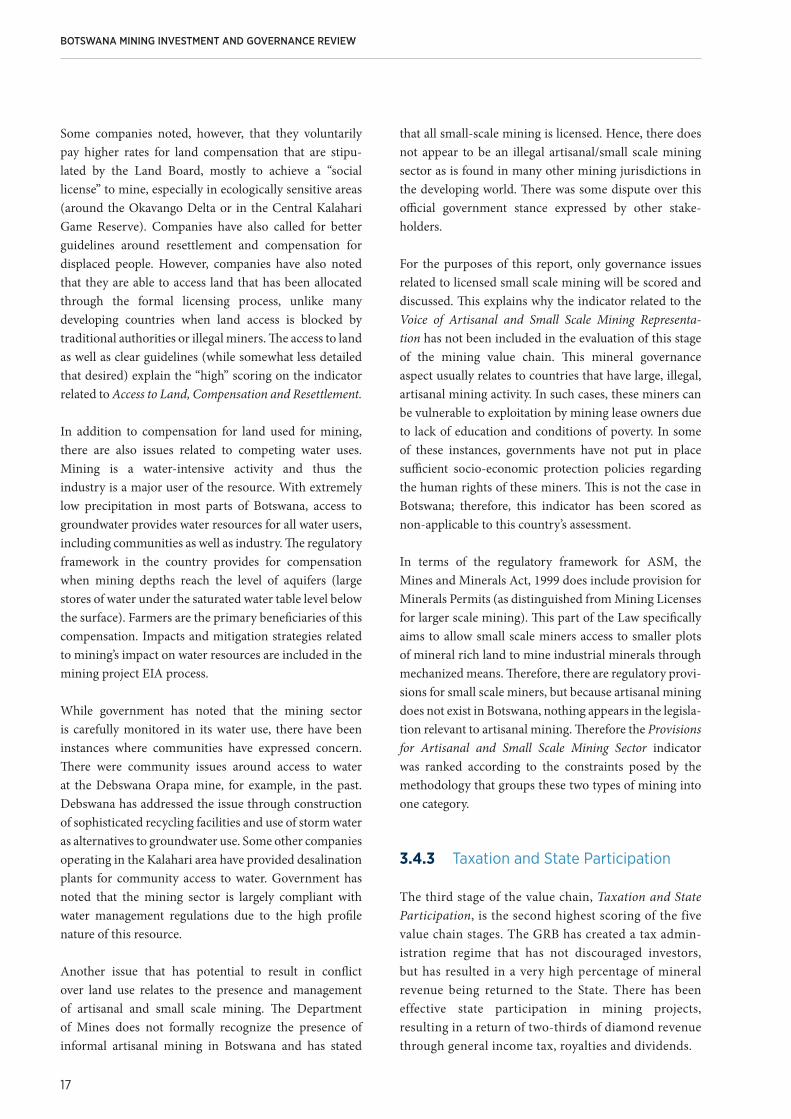
3.4.3 Taxation and State Participation
The third stage of the value chain, Taxation and State Participation, is the second highest scoring of the five value chain stages. The GRB has created a tax admin-istration regime that has not discouraged investors, but has resulted in a very high percentage of mineral revenue being returned to the State. There has been effective state participation in mining projects, resulting in a return of two-thirds of diamond revenue through general income tax, royalties and dividends.
BOTSWANA MINING INVESTMENT AND GOVERNANCE REVIEW
17
The high scoring of the topic that describes mining tax administration and SOE governance mostly confirms the effectiveness of Botswana’s tax administration. The GRB has clear laws put in place regarding tax collection and payments required from resource companies and the mining fiscal regime includes progressive fiscal instruments.
Botswana has had a stable and competitive tax policy in place for several decades that has been successful in attracting a healthy number of exploration and mining companies to the country. The indicators, Tax Policy and Instruments and Rules for Auditing, Base Erosion and Profit Sharing have scored in the “high” range, reflecting the solid “de jure” tax regime.
However, with regard to the component State Owned Enter-prise Governance, it should be noted that there are no true17
State Owned Enterprises in the mining sector in Botswana.18 Government does not consider the BCL mine to be an SOE in the same category as other parastatals such as Bank of Botswana or Air Botswana, for example. Secondly, the government does participate in Debswana, a 50-50% joint venture with De Beers Consolidated Mines, Ltd. However, for the purpose of MInGov, this is not considered an SOE, as De Beers is the operator in the JV. Therefore, the state partic-ipation component of the scoring of the relevant indicators in this stage must be considered in this light.
As has been the pattern in these first two stages of mine development, the theme, Accountability and Inclu-siveness has scored the lowest of the three themes. The indicator, Accountability of Mining Taxation score received a “low” score, indicating a lack of openness regarding the disclosure of mining tax payments and
3 OVERVIEW OF MInGov FINDINGS
18
Table 3: Performance of the Taxation and State Participation Stage
Note: The score for each theme is the average of scores of the five value chain stages in that theme (see Figure 2). The score for the value chain stage is the
average of the three topics within that stage (which are shown in this figure). The score against the topic is the average of the scores of the underlying
indicator scores; the indicator scores are the average of the scores of their underlying questions. The color coding is the same as in the matrix (Figure 2).
Intervals for scoring performance are as follows: n Very low (1.0-1.75); n Low (>1.75-2.50); n High (>2.50-3.25); and n Very high (>3.25-4.0), where a
higher score corresponds to better governance and capacity.
Theme
Value Chain Stage 3. Taxation and State Participation (2.91)
Topic Underlying Indicators
Policy, Legislation and Regulation
(2.54)
Tax policy, Instruments and State Owned
Enterprise Rules (2.58)
Tax Policy and Instruments (3)
Rules for Auditing, Base Erosion and Profit Shifting (3)
State Owned Enterprise Governance Rules (1.75)
Accountability and Inclusiveness
(2.58)
Mining Taxation and State Owned Enterprise Financial
Management (2.78)
Accountability of Mining Taxation (2.25)
State-Owned Enterprise Financial Management (3.3)
Institutional Capacity and Effectiveness
(2.93)
Mining Tax Administration and State Owned Enterprise
Governance (3.38)
Mining Tax Administration (3.08)
State-Owned Enterprise Governance (3.67)
17 In Botswana, SOEs are created by an Act in Parliament and are required to report their finances and operations to Parliament. SOEs, by this definition, do
not exist in the mining sector in Botswana. However, for the purpose of MinGov, the definition of an SOE includes a company with a significant percentage
of government ownership and falls under the Botswana Companies Act 2007
18 During the Botswana MInGov validation meeting of August 11, 2016, it was reported that the Minerals Development Company Botswana (MDCB) is currently
taking transfer of BCL, the Morupule Coal Mine and 15% interest in the De Beers Group. MDCB is a fully government owned Holding Company that was
incorporated under the Companies Act in October 2012. It began its limited operations in 2015 and first key appointments were made in 2016.
the receipt of these by government. The GRB annually discloses aggregate mineral revenues in the Budget Speech made to Parliament and the Bank of Botswana posts quarterly budget tables with mineral revenues on their website. From the industry side, mining companies are not required to disclose their revenue, payments and/or losses in Botswana, though some companies report this information to their countries of origination, as per the requirements of their home governments.
To improve the “low” score in this section, the govern-ment could consider requiring the government and companies to disclose all significant payments made, and material benefits given, to government. As encour-aged in international best practice, the information would be disaggregated by revenue stream including, but not limited to, profits, production entitlements, royalties, dividends, bonuses, and license fees. This information could then be made publicly available online and through the media, to ensure citizen access and also audited by the Auditor General’s office.
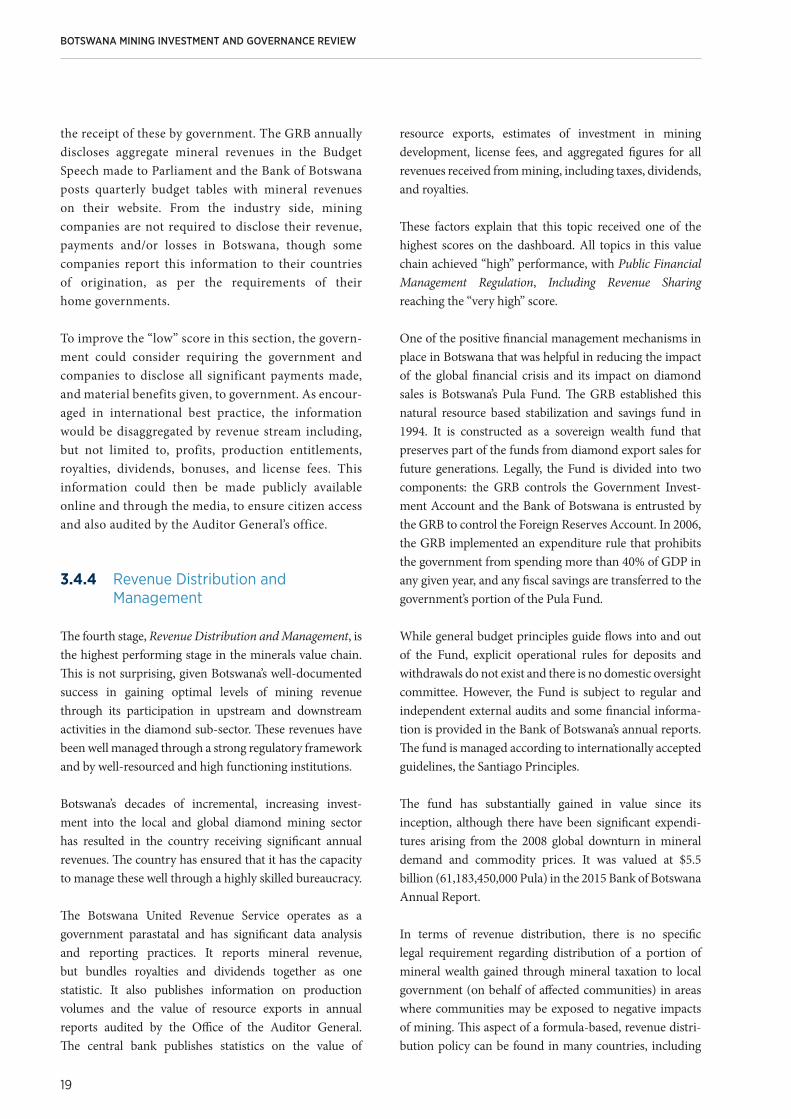
3.4.4 Revenue Distribution and Management
The fourth stage, Revenue Distribution and Management, is the highest performing stage in the minerals value chain. This is not surprising, given Botswana’s well-documented success in gaining optimal levels of mining revenue through its participation in upstream and downstream activities in the diamond sub-sector. These revenues have been well managed through a strong regulatory framework and by well-resourced and high functioning institutions.
Botswana’s decades of incremental, increasing invest-ment into the local and global diamond mining sector has resulted in the country receiving significant annual revenues. The country has ensured that it has the capacity to manage these well through a highly skilled bureaucracy.
The Botswana United Revenue Service operates as a government parastatal and has significant data analysis and reporting practices. It reports mineral revenue, but bundles royalties and dividends together as one statistic. It also publishes information on production volumes and the value of resource exports in annual reports audited by the Office of the Auditor General. The central bank publishes statistics on the value of
resource exports, estimates of investment in mining development, license fees, and aggregated figures for all revenues received from mining, including taxes, dividends, and royalties.
These factors explain that this topic received one of the highest scores on the dashboard. All topics in this value chain achieved “high” performance, with Public Financial Management Regulation, Including Revenue Sharing reaching the “very high” score.
One of the positive financial management mechanisms in place in Botswana that was helpful in reducing the impact of the global financial crisis and its impact on diamond sales is Botswana’s Pula Fund. The GRB established this natural resource based stabilization and savings fund in 1994. It is constructed as a sovereign wealth fund that preserves part of the funds from diamond export sales for future generations. Legally, the Fund is divided into two components: the GRB controls the Government Invest-ment Account and the Bank of Botswana is entrusted by the GRB to control the Foreign Reserves Account. In 2006, the GRB implemented an expenditure rule that prohibits the government from spending more than 40% of GDP in any given year, and any fiscal savings are transferred to the government’s portion of the Pula Fund.
While general budget principles guide flows into and out of the Fund, explicit operational rules for deposits and withdrawals do not exist and there is no domestic oversight committee. However, the Fund is subject to regular and independent external audits and some financial informa-tion is provided in the Bank of Botswana’s annual reports. The fund is managed according to internationally accepted guidelines, the Santiago Principles.
The fund has substantially gained in value since its inception, although there have been significant expendi-tures arising from the 2008 global downturn in mineral demand and commodity prices. It was valued at $5.5 billion (61,183,450,000 Pula) in the 2015 Bank of Botswana Annual Report.
In terms of revenue distribution, there is no specific legal requirement regarding distribution of a portion of mineral wealth gained through mineral taxation to local government (on behalf of affected communities) in areas where communities may be exposed to negative impacts of mining. This aspect of a formula-based, revenue distri-bution policy can be found in many countries, including
BOTSWANA MINING INVESTMENT AND GOVERNANCE REVIEW
19
Ghana, Mozambique, Papua New Guinea, the Canadian province of British Columbia, and many other advanced mining jurisdictions. Most compelling, it has been included in the Africa Mining Vision Implementation Plan (2011) that states under Programme Cluster 1 on Managing Mineral Revenue and Rents: “Develop rent distribution systems for allocating part of mineral revenue to commu-nities near mining areas and local authorities.”
Fair distribution of national mineral revenue has been raised as a priority issue by some civil society groups operating in Botswana and could be raised under a discus-sion on a national CSR policy for the EI sector. It should be noted, however, that this specific revenue sharing approach is not consistent with the national development direction that the GRB is currently pursing (i.e. equitable develop-ment where all share equally in the benefits of mineral revenue). Still, reference to such a formula-based, mineral revenue sharing policy is included here as an international benchmark of good minerals governance practice.
One of the few weaknesses uncovered in the assessment of this stage of the value chain concerns how large scale public investment is managed. There is less rigorous accountability built into the procurement of large scale projects than would
be expected. The relatively low performance of this indicator reflects some issues in the public procurement process, including the frequency of cost-overruns on public infra-structure projects and the somewhat uneven approach to procurement contract audits, particularly.
Other institutional weaknesses in the management of large-scale public investment include lack of full implementation of the government’s objective to place a Program Manage-ment Office within each Ministry. The PMO is made up of officials from the Ministry of Finance, the Ministry of Justice and the Auditor/General’s office. The intention is to empower ministries to make their own project and procure-ment decisions beneath a certain ceiling of expense.
The only underlying indicator that does not achieve a definitively high score is the Large Scale Public Investment indicator. With the full implementation of the PMO process, performance regarding management of large-scale public investment projects would be better.
As has been noted earlier in this report, the GRB has taken a prudent fiscal approach that has resulted in a budget surplus for many recent years. The Botswana Overview provided by the WBG noted that Botswana also achieved a current
3 OVERVIEW OF MInGov FINDINGS
20
Table 4: Performance of the Revenue Distribution and Management Stage
Note: The score for each theme is the average of scores of the five value chain stages in that theme (see Figure 2). The score for the value chain stage is the
average of the three topics within that stage (which are shown in this figure). The score against the topic is the average of the scores of the underlying
indicator scores; the indicator scores are the average of the scores of their underlying questions. The color coding is the same as in the matrix (Figure 2).
Intervals for scoring performance are as follows: n Very low (1.0-1.75); n Low (>1.75-2.50); n High (>2.50-3.25); and n Very high (>3.25-4.0), where a
higher score corresponds to better governance and capacity.
Theme
Value Chain Stage 4. Revenue Distribution and Management (3.21)
Topic Underlying Indicators
Policy, Legislation and Regulation (2.54)
Public Financial Manage-ment Regulation, Including
Revenue Sharing (3.5)
Public Financial Management and Revenue Sharing (3)
Macrofiscal Management Rules and Stabilization (4)
Accountability and Inclusiveness
(2.58)
Budget Transparency and Accountability, and Public
Integrity (3.13)
Budget Transparency and Accountability (3)
Public Investment Integrity (3.25)
Institutional Capacity and Effectiveness
(2.93)
Budget Implementation and Macrofiscal Manage-
ment Effectiveness (3.01)
Budget Implementation (3.29)
Large Scale Public Investment (2.5)
Macrofiscal Management and Revenue Stabilization Effec-tiveness (3.25)
account surplus of 15.7% of GDP in 2014. While the surplus is expected to continue to narrow until there is an upswing in the commodity cycle, the country is still expected to register a current account surplus in the next few years.
Government also follows an inclusive and complex process of consultation regarding budget/spending priorities from the national level down to the village level of governance structures and population. High performance of this topic reflects the country’s approach to national planning through the National Development Plan framework, where devel-opment priorities are outlined and budgets are applied to ensure these are addressed (and reported on) annually. The “very high” performance of the Budget Implementation indicator reflects these factors.
3.4.5 Local Impact
The final stage of the value chain is Local Impact, earning an overall “low” performance score, although the “de facto” practices indicate a greater attention to these issues than the legislative framework would suggest.
Underlying most of the analysis of the mining govern-ance regime in Botswana is the GRB’s business-like, investor friendly approach to mining development. The GRB has chosen to focus on attracting and facilitating mining development; and on investing tax and dividend revenues in developmental priorities. It does not consider that the mining industry should take over its role as provider of basic services in rural areas or local economic development, unlike most other resource-rich developing countries. In this light, the GRB has paid relatively less attention to the impacts of mining on local communities than on other stages of the mineral value chain.
Although there are no legislated social obligation require-ments laid out in law except regarding the environmental impact assessment process, “de facto”, many companies understand that to achieve a “social license to mine”, they need to engage with local communities as early as the prospecting phase. This is especially true when companies are in the advanced exploration stage and intend to mine an area in future. Some companies have
financed CSR activities (notably provision of bore holes to access ground water) before there is a revenue stream from mining activity. Where there are competing land use priorities such as eco-tourism in the Okavango Delta or traditional indigenous use of the land in the Central Kalahari Game Reserve, companies are even more sensitive to international NGO scrutiny.
Many companies (most visible being Debswana) provide health and education facilities to mineworkers, their families, and surrounding communities, as well as other local economic development initiatives. Smaller, less well-resourced companies, however, may not provide this type of voluntary community development assis-tance. The lack of a policy framework around CSR has meant that there is no formal framework to apply across the whole mining sector. This has resulted in an uneven application of social development contributions and a lack of formal measurement systems to determine the effectiveness of these programs. Guidance in the form of a required community-company development agreement would raise the score of this topic.
There have been complaints by civil society that the relationship between government and industry is too close (given the state involvement in the mining sector) and that community needs and aspirations are not adequately taken into account when large-scale mining projects are developed. For example, the issue of land use (mineral development versus aboriginal rights) in the Central Kalahari Game Reserve garnered significant attention and international activists protested against the removal of the San people.19
Botswana’s EIA Act, 2011 prescribes the requirement for an environmental impact assessment (including a mitigation plan) when proposed activities will have a serious negative impact on the environment. There is a public consultation process laid out and a requirement for publishing summaries of the EIA in the Gazette and in local newspapers. Policies to Mitigate Environmental Impact ranked “high”, reflecting these requirements. However, there are elements of discretion in the legis-lation regarding the public consultation process20 that partly account for a “low” score under Community Impact,
BOTSWANA MINING INVESTMENT AND GOVERNANCE REVIEW
21
19 It must be noted that the BCL, Ltd mine has not been a profitable venture for many years and government has had to provide financial support to keep it
going, mostly because it supports such a large number of mineworkers and the effects on the community of closure would be severe.
20 The EIA Act, 2011: Article 11 1) notes that a public hearing may be held depending on the degree of negative public response.
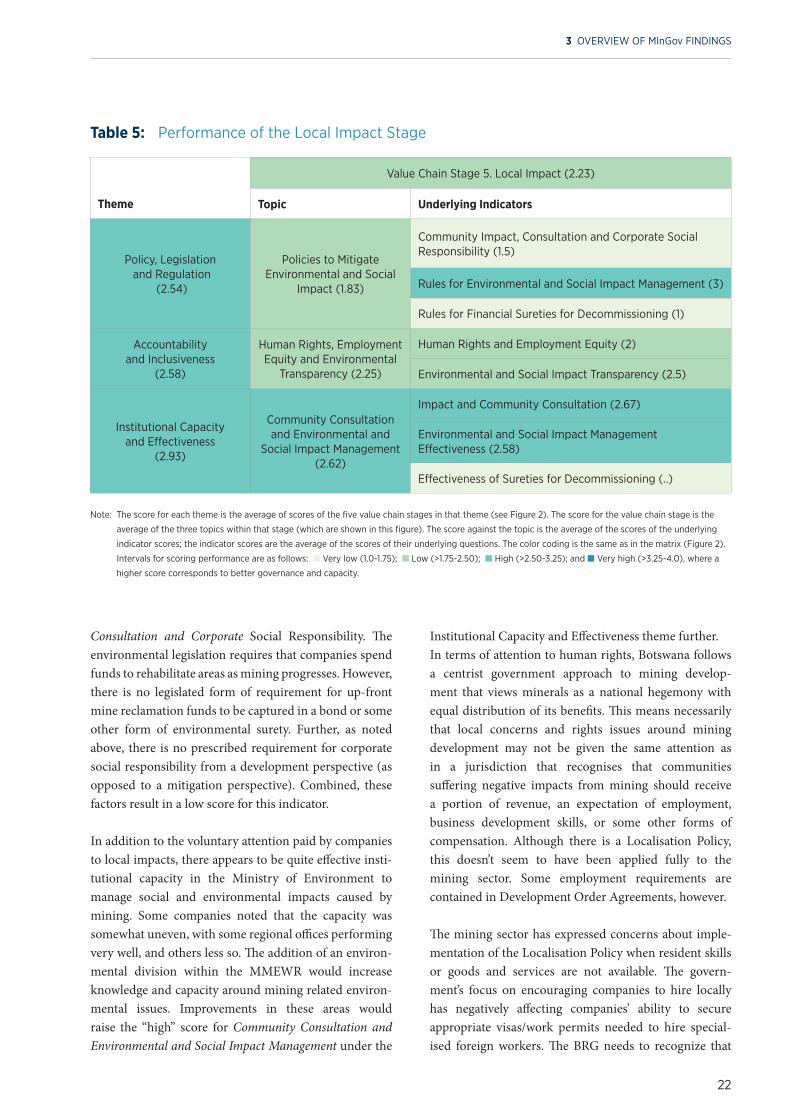
Consultation and Corporate Social Responsibility. The environmental legislation requires that companies spend funds to rehabilitate areas as mining progresses. However, there is no legislated form of requirement for up-front mine reclamation funds to be captured in a bond or some other form of environmental surety. Further, as noted above, there is no prescribed requirement for corporate social responsibility from a development perspective (as opposed to a mitigation perspective). Combined, these factors result in a low score for this indicator.
In addition to the voluntary attention paid by companies to local impacts, there appears to be quite effective insti-tutional capacity in the Ministry of Environment to manage social and environmental impacts caused by mining. Some companies noted that the capacity was somewhat uneven, with some regional offices performing very well, and others less so. The addition of an environ-mental division within the MMEWR would increase knowledge and capacity around mining related environ-mental issues. Improvements in these areas would raise the “high” score for Community Consultation and Environmental and Social Impact Management under the
Institutional Capacity and Effectiveness theme further.In terms of attention to human rights, Botswana follows a centrist government approach to mining develop-ment that views minerals as a national hegemony with equal distribution of its benefits. This means necessarily that local concerns and rights issues around mining development may not be given the same attention as in a jurisdiction that recognises that communities suffering negative impacts from mining should receive a portion of revenue, an expectation of employment, business development skills, or some other forms of compensation. Although there is a Localisation Policy, this doesn’t seem to have been applied fully to the mining sector. Some employment requirements are contained in Development Order Agreements, however.
The mining sector has expressed concerns about imple-mentation of the Localisation Policy when resident skills or goods and services are not available. The govern-ment’s focus on encouraging companies to hire locally has negatively affecting companies’ ability to secure appropriate visas/work permits needed to hire special-ised foreign workers. The BRG needs to recognize that
3 OVERVIEW OF MInGov FINDINGS
22
Table 5: Performance of the Local Impact Stage
Note: The score for each theme is the average of scores of the five value chain stages in that theme (see Figure 2). The score for the value chain stage is the
average of the three topics within that stage (which are shown in this figure). The score against the topic is the average of the scores of the underlying
indicator scores; the indicator scores are the average of the scores of their underlying questions. The color coding is the same as in the matrix (Figure 2).
Intervals for scoring performance are as follows: n Very low (1.0-1.75); n Low (>1.75-2.50); n High (>2.50-3.25); and n Very high (>3.25-4.0), where a
higher score corresponds to better governance and capacity.
Theme
Value Chain Stage 5. Local Impact (2.23)
Topic Underlying Indicators
Policy, Legislation and Regulation
(2.54)
Policies to Mitigate Environmental and Social
Impact (1.83)
Community Impact, Consultation and Corporate Social Responsibility (1.5)
Rules for Environmental and Social Impact Management (3)
Rules for Financial Sureties for Decommissioning (1)
Accountability and Inclusiveness
(2.58)
Human Rights, Employment Equity and Environmental
Transparency (2.25)
Human Rights and Employment Equity (2)
Environmental and Social Impact Transparency (2.5)
Institutional Capacity and Effectiveness
(2.93)
Community Consultation and Environmental and
Social Impact Management (2.62)
Impact and Community Consultation (2.67)
Environmental and Social Impact Management Effectiveness (2.58)
Effectiveness of Sureties for Decommissioning (..)
there is an impact on the mining industry’s ability to operate when government insists on local hiring, regard-less of the skills or experience needed by a mining company.
The creation of an employment equity policy that deals with requirements around gender or other types of discrimination in the workplace would be helpful.
Another key aspect of the human rights component of this indicator relates to the treatment of indigenous people living off land resources in various protected areas in Botswana. Exploration and mining are allowed in national parks, for example where indigenous peoples are still living. There have been problems around balancing the priorities for development of resources (especially in light of the government’s concern about dwindling diamond reserves) with other socio-economic activi-ties such as eco-tourism. The sensitive issue regarding competing land uses in Botswana is underpinned by the handling of the rights of inhabitants who have an occupational relationship to the land. Civil society groups have expressed concerns about the extent to which local communities can affect decisions that may be perceived as having already been made by government concerning mining projects. There are also concerns about the relative power and influence at a GRB level of the MMEWR relative to other Ministries with less economically signif-icant mandates. These weaknesses are reflected in the Human Rights, Employment Equity and Environmental Transparency topic that scored “low”.
A number of topics in this section that relate to the management of social and environmental impacts have been identified as priority areas by governments, CSO and Industry representatives.
3.5 Performance of Cross-cutting Themes
Performance of the cross-cutting themes is summarized in the matrix (Figure 2).21 A more detailed review is presented below.
3.5.1 Economic Environment
The cross-cutting theme of Economic Environment covers elements relevant to investment in the mining sector and the national economy. The overall performance of the Economic Environment theme is at the lower end of the “high” range and performance per topic is variable. National Growth and Savings is the highest scoring topic rating, followed by Macroeconomic Stability.
Botswana ranked well on the WBG Doing Business Index, 2016. It scored 72 out of 189 economies. This is indicative of the GRB’s interest in facilitating private sector-led growth and development. However, the Doing Business ranking indicated that although Botswana provided a favourable business climate for some issues of high importance to the mining sector such as protection of minority investors, trading across borders and ease of tax payments, other issues such as accessing electricity scored much worse. The mining sector’s ability to access water, electricity and transportation infrastructure is an on-going challenge. Therefore, Mining Infrastructure scored somewhat lower than the Business and Invest-ment Environment indicator, although both scored in the “high” range.
In terms of the impact of the national health status on society, Botswana has the third highest prevalence of HIV worldwide and a relatively low ranking on international life expectancy indicators. The impact of a high incidence of HIV in the younger, productive segment of the popula-tion on the economy can be severe. Prevalence has declined slightly in recent years, however, and Botswana has demon-strated a strong national commitment in responding to its HIV and AIDS epidemic through provision of universal free antiretroviral treatment. The impact of govern-ment efforts to address this challenge has been almost a 40% decline in new infections from 2005. However, the government’s treatment programs are not reaching all people in Botswana infected by HIV; in fact less than 50% are receiving treatment. These factors have contributed to a “low” score for the Human Health indicator.
Regarding availability of skills and human capital, the results of the assessment were somewhat mixed.
BOTSWANA MINING INVESTMENT AND GOVERNANCE REVIEW
23
21 Information on cross-cutting themes is collected from a similar range of primary, secondary and in-Botswana interview sources as other themes. However,
given the nature of information required and available, secondary sources are more significant to cross-cutting themes than to other themes (see Annex 2,
Table 1).
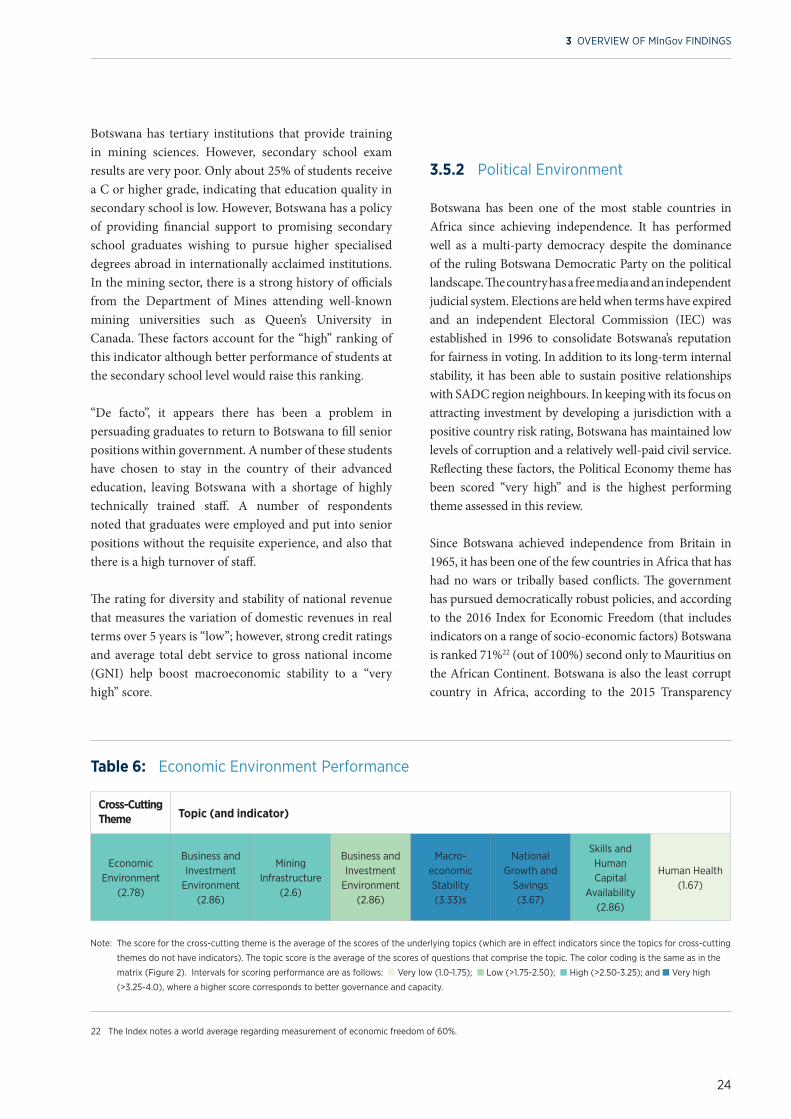
Botswana has tertiary institutions that provide training in mining sciences. However, secondary school exam results are very poor. Only about 25% of students receive a C or higher grade, indicating that education quality in secondary school is low. However, Botswana has a policy of providing financial support to promising secondary school graduates wishing to pursue higher specialised degrees abroad in internationally acclaimed institutions. In the mining sector, there is a strong history of officials from the Department of Mines attending well-known mining universities such as Queen’s University in Canada. These factors account for the “high” ranking of this indicator although better performance of students at the secondary school level would raise this ranking.
“De facto”, it appears there has been a problem in persuading graduates to return to Botswana to fill senior positions within government. A number of these students have chosen to stay in the country of their advanced education, leaving Botswana with a shortage of highly technically trained staff. A number of respondents noted that graduates were employed and put into senior positions without the requisite experience, and also that there is a high turnover of staff.
The rating for diversity and stability of national revenue that measures the variation of domestic revenues in real terms over 5 years is “low”; however, strong credit ratings and average total debt service to gross national income (GNI) help boost macroeconomic stability to a “very high” score.
3.5.2 Political Environment
Botswana has been one of the most stable countries in Africa since achieving independence. It has performed well as a multi-party democracy despite the dominance of the ruling Botswana Democratic Party on the political landscape. The country has a free media and an independent judicial system. Elections are held when terms have expired and an independent Electoral Commission (IEC) was established in 1996 to consolidate Botswana’s reputation for fairness in voting. In addition to its long-term internal stability, it has been able to sustain positive relationships with SADC region neighbours. In keeping with its focus on attracting investment by developing a jurisdiction with a positive country risk rating, Botswana has maintained low levels of corruption and a relatively well-paid civil service. Reflecting these factors, the Political Economy theme has been scored “very high” and is the highest performing theme assessed in this review.
Since Botswana achieved independence from Britain in 1965, it has been one of the few countries in Africa that has had no wars or tribally based conflicts. The government has pursued democratically robust policies, and according to the 2016 Index for Economic Freedom (that includes indicators on a range of socio-economic factors) Botswana is ranked 71%22 (out of 100%) second only to Mauritius on the African Continent. Botswana is also the least corrupt country in Africa, according to the 2015 Transparency
3 OVERVIEW OF MInGov FINDINGS
24
Table 6: Economic Environment Performance
Note: The score for the cross-cutting theme is the average of the scores of the underlying topics (which are in effect indicators since the topics for cross-cutting
themes do not have indicators). The topic score is the average of the scores of questions that comprise the topic. The color coding is the same as in the
matrix (Figure 2). Intervals for scoring performance are as follows: n Very low (1.0-1.75); n Low (>1.75-2.50); n High (>2.50-3.25); and n Very high
(>3.25-4.0), where a higher score corresponds to better governance and capacity.
Cross-Cutting Theme Topic (and indicator)
Economic Environment
(2.78)
Business and Investment
Environment (2.86)
Mining Infrastructure
(2.6)
Business and Investment
Environment (2.86)
Macro- economic Stability (3.33)s
National Growth and
Savings (3.67)
Skills and Human Capital
Availability (2.86)
Human Health (1.67)
22 The Index notes a world average regarding measurement of economic freedom of 60%.

International Index on Corruption. Performance questions in the review related to actual experiences of corrup-tion - particularly regarding the exploration and mining licensing process - were posed to various respondents from different stakeholder groups. There was no indication that government officials were co-opting applicants for personal gain. There was also no indication that companies had to pay bribes to officials at any stage throughout the mine permitting process as the mine developed. The GRB has a strong Anti-Corruption Commission (DCEC) which looks into corruption allegations. This explains the “very high” ranking on the Control of Corruption topic.
Botswana is a signatory country of the International Centre for the Settlement of Investment Disputes (ICSID) Convention and has put in place a good domestic law for the international arbitration of foreign investment disputes. According to the World Economic Forum and the OECD, Botswana is also in the top 25 percent countries when it comes to managing expropriation risk, transfer and convertibility risk and protecting property rights and investors. Companies have indicated that there is security of tenure in mineral rights, even to the extent that they can be operating without licenses for short periods of time (between renewals) without fear of losing property. These factors have contributed to the “very high” performance under Expropriation Risk.
As has been noted in earlier sections of this report, the country has enjoyed a stable mining regulatory regime and a consistently applied tax policy that has been carried on by successive governments. The indicator, Predictable Mining and Tax Policy has achieved the highest ranked score. There is a cautionary note to this governance aspect, however, in that countries need to update their mining legislation
periodically to ensure that new trends in international good practise are taken into account. Also, shifts in policy related to the changing focus on different minerals can mean that legislation may have to become more dynamic and be amended according to the country’s current prior-ities. In this regard, the coal sector in Botswana is one that is receiving a degree of interest, particularly in light of the government’s intention to diversify away from its reliance on diamonds. Some coal producers noted that the current legal framework does not take into account aspects of coal mining. For example, there is a cost base for exporting a bulk commodity such as coal (that differs from exporting precious gemstones) as the Minerals and Mining Law of 1999 was drafted with a focus on the development of diamonds.
3.5.3 Sustainable Development
Botswana scored “high” overall on its approach to sustain-able development regarding the mining sector. Given the importance of mining to national and local economies, the GRB has ensured that the sector is integrated well in national development planning (the indicator Develop-ment Planning received just under a “very high” score) and government uses mining rents effectively to address developmental priorities throughout the country.
Botswana has had a strong history of prudent financial management, recruitment of highly skilled and competent senior officials and applying a far-sighted outlook in terms of economic development. Therefore, it has anticipated the need to diversify from its reliance on diamonds and has concentrated on developing base metal and coal resources effectively. In addition, it was successful in relocating the
BOTSWANA MINING INVESTMENT AND GOVERNANCE REVIEW
25
Table 7: Political Environment Performance
Note: The score for the cross-cutting theme is the average of the scores of the underlying topics (which are in effect indicators since the topics for cross-cutting
themes do not have indicators). The topic score is the average of the scores of questions that comprise the topic. The color coding is the same as in the
matrix (Figure 2). Intervals for scoring performance are as follows: n Very low (1.0-1.75); n Low (>1.75-2.50); n High (>2.50-3.25); and n Very high
(>3.25-4.0), where a higher score corresponds to better governance and capacity.
Cross-Cutting Theme Topic (and indicator)
Political Environment (3.96)
Expropriation Risk (3.83)
Political Stability (4)
Predictable Mining and Tax Policy
(4)
Control of Corruption (4)
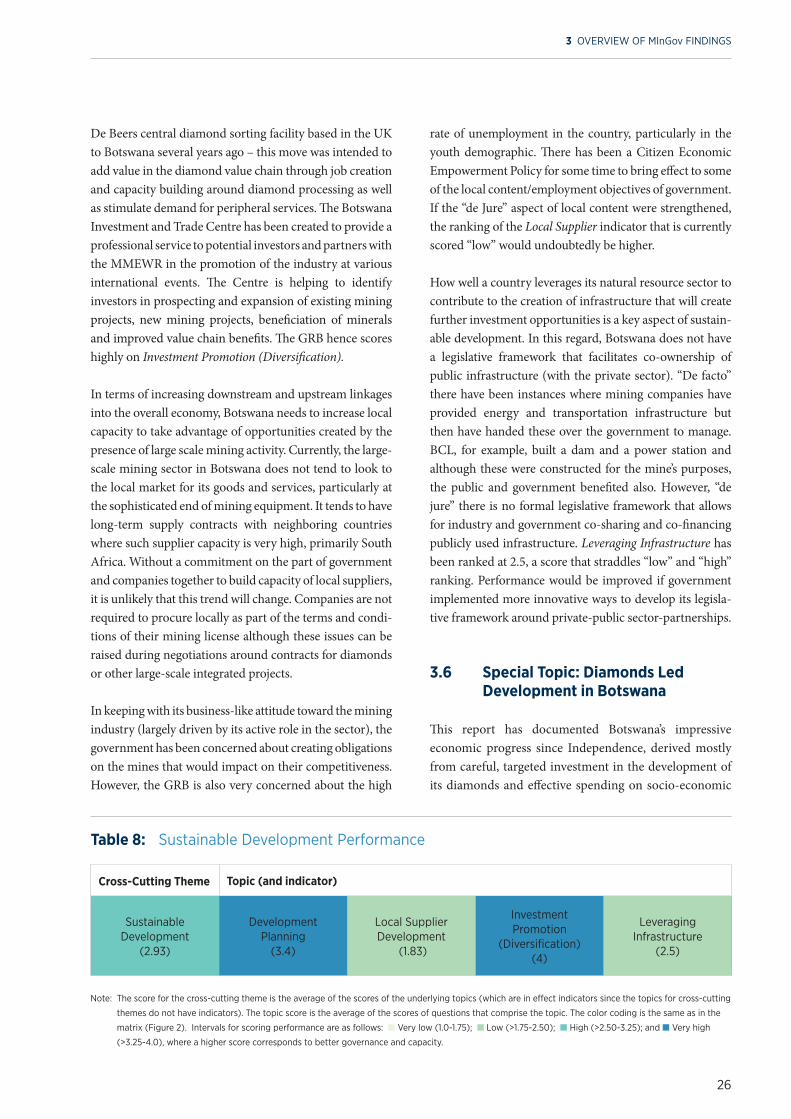
De Beers central diamond sorting facility based in the UK to Botswana several years ago – this move was intended to add value in the diamond value chain through job creation and capacity building around diamond processing as well as stimulate demand for peripheral services. The Botswana Investment and Trade Centre has been created to provide a professional service to potential investors and partners with the MMEWR in the promotion of the industry at various international events. The Centre is helping to identify investors in prospecting and expansion of existing mining projects, new mining projects, beneficiation of minerals and improved value chain benefits. The GRB hence scores highly on Investment Promotion (Diversification).
In terms of increasing downstream and upstream linkages into the overall economy, Botswana needs to increase local capacity to take advantage of opportunities created by the presence of large scale mining activity. Currently, the large-scale mining sector in Botswana does not tend to look to the local market for its goods and services, particularly at the sophisticated end of mining equipment. It tends to have long-term supply contracts with neighboring countries where such supplier capacity is very high, primarily South Africa. Without a commitment on the part of government and companies together to build capacity of local suppliers, it is unlikely that this trend will change. Companies are not required to procure locally as part of the terms and condi-tions of their mining license although these issues can be raised during negotiations around contracts for diamonds or other large-scale integrated projects.
In keeping with its business-like attitude toward the mining industry (largely driven by its active role in the sector), the government has been concerned about creating obligations on the mines that would impact on their competitiveness. However, the GRB is also very concerned about the high
rate of unemployment in the country, particularly in the youth demographic. There has been a Citizen Economic Empowerment Policy for some time to bring effect to some of the local content/employment objectives of government. If the “de Jure” aspect of local content were strengthened, the ranking of the Local Supplier indicator that is currently scored “low” would undoubtedly be higher.
How well a country leverages its natural resource sector to contribute to the creation of infrastructure that will create further investment opportunities is a key aspect of sustain-able development. In this regard, Botswana does not have a legislative framework that facilitates co-ownership of public infrastructure (with the private sector). “De facto” there have been instances where mining companies have provided energy and transportation infrastructure but then have handed these over the government to manage. BCL, for example, built a dam and a power station and although these were constructed for the mine’s purposes, the public and government benefited also. However, “de jure” there is no formal legislative framework that allows for industry and government co-sharing and co-financing publicly used infrastructure. Leveraging Infrastructure has been ranked at 2.5, a score that straddles “low” and “high” ranking. Performance would be improved if government implemented more innovative ways to develop its legisla-tive framework around private-public sector-partnerships.
3.6 Special Topic: Diamonds Led Development in Botswana
This report has documented Botswana’s impressive economic progress since Independence, derived mostly from careful, targeted investment in the development of its diamonds and effective spending on socio-economic
3 OVERVIEW OF MInGov FINDINGS
26
Table 8: Sustainable Development Performance
Note: The score for the cross-cutting theme is the average of the scores of the underlying topics (which are in effect indicators since the topics for cross-cutting
themes do not have indicators). The topic score is the average of the scores of questions that comprise the topic. The color coding is the same as in the
matrix (Figure 2). Intervals for scoring performance are as follows: n Very low (1.0-1.75); n Low (>1.75-2.50); n High (>2.50-3.25); and n Very high
(>3.25-4.0), where a higher score corresponds to better governance and capacity.
Cross-Cutting Theme Topic (and indicator)
Sustainable Development
(2.93)
Development Planning
(3.4)
Local Supplier Development
(1.83)
InvestmentPromotion
(Diversification)(4)
LeveragingInfrastructure
(2.5)
priorities. The way that the GRB has harnessed diamonds for development through partnership with the private sector is particularly interesting, given the tendency of African governments in post-colonial years to focus on state-led development. The partnership between the GRB and De Beers has enabled government to take advantage of what industry does best: sourcing and mining diamonds, creating a viable global market and developing demand focused strategies. Through this partnership, government has been able to grow the economy, create employment and secure significant levels of revenue throughout the diamond value chain.
The GRB put in place a number of measures over the years that reduced the danger of “Dutch Disease” that has afflicted many resource-rich countries. These initiatives were central to the success of its effective management of diamond revenue.
• A revenue stabilization fund was introduced in 1970 to account for revenue fluctuations and to store budget surpluses.
• International reserves were allowed to accumulate and the national currency, the Pula, was pegged to a basket of currencies to prevent rapid currency appreciation.
• A sovereign wealth fund was created as an offshore investment vehicle for diamond revenues (the aforementioned “Pula Fund”).
To explain the significance of the diamond resource in Botswana and the GRB’s governance decisions around its development, it is instructive to present a brief chronology of historical events. Botswana has managed to secure revenues from diamonds that has sustained a rapid economic growth rate for half a century through a combination of capitalizing on historical fluctuations in the diamond market, and on its long-term relationship with De Beers, arguably the most powerful and influen-tial diamond company worldwide.
De Beers and the GRB currently maintain a portfolio of four companies in Botswana – De Beers Holdings, Debswana, Diamond Trading Company Botswana and De Beers Global Sightholder Sales. Combined, these
companies are involved in the exploration, mining, manufacturing, and trading of diamonds. Although the GRB pays 50% of capital for equity ownership in Debswana, it receives 80.8% of profits.
The long term relationship with De Beers has evolved over time – both locally in Botswana, and internation-ally through the GRB’s shareholding in Debswana’s parent company, De Beers Société Anonyme (DBsa). Following low international demand for diamonds in the 1980’s, Debswana accumulated a significant stockpile of diamonds. De Beers bought the stockpile when the market grew stronger, paying partly by cash and partly through shares of DBsa. The GRB thus initially became a 5% owner of global De Beers, then in 2001 De Beers delisted and the GRB took a total of 15% interest in the global company. In 2006 the Diamond Trading Company Botswana was launched, creating more than 3000 new local manufacturing jobs in the country.23
Through its joint venture operations with De Beers, the GRB (represented by the Bank of Botswana) has been granted a seat on the Board of Directors of DBsa. This advantageous position gave the GRB access to high-level information about the international diamond market and other important insights into the global diamond industry.
In 2011 an agreement was negotiated that transferred the sorting and marketing of Botswana’s diamonds to Gaborone, Botswana. The relocation of these functions from London to Gaborone was effected in 2013 and represented a significant transfer of professionals, skills, equipment and technology. The move secured a new 10-year contract for the sorting, valuing and sales of diamonds from Debswana’s mines by DTC Botswana, and transferred the sorting, aggregation and sale of more than $6 billion of annual rough diamond sales to the office in Gaborone. The deal allows Botswana to sell 10% of its production directly to the local market. This has been one of the most successful examples of a country successfully beneficiating raw mineral resources and retaining optimal value and profits.
Although the GRB has a healthy level of fiscal savings and international reserves, the anticipated decline in
BOTSWANA MINING INVESTMENT AND GOVERNANCE REVIEW
27
23 Information on De Beers’ involvement in Botswana is sourced from: http://www.debeersgroup.com/botswana/en/who-we-are/de-beers-in-botswana.html

diamond production by 2030 has meant that govern-ment is focusing strongly on diversification efforts. It has introduced an economic stimulus initiative and is being supported by international donors in its efforts to develop the SSME sector of the economy. The comments presented earlier in this document relate to the low level of capacity within the local supplier development topic are applicable in this context.
In addition to its 50% stake in the country’s largest diamond operation, Debswana, the GRB has the option to acquire up to 15% paid working interest of all other diamond projects (as well as other minerals).24
One of the major issues of contention expressed by different stakeholder groups in Botswana (including some government institutions) concerns the government’s
decision to keep the negotiation process around contracts for diamond mining (and large integrated projects) confidential and secretive. Government negotiates the terms and conditions of these agreements, including the percentage of ownership stake it will purchase. These contracts are not published and even the Auditor General is not allowed to audit these agreements. A more open process, including published contracts, would assist Botswana in becoming a more transparent and account-able jurisdiction. Further, a “Freedom of Information” Act would provide a “de jure” instrument that the public could use to access this type of information.
Despite the positive success story of development through diamond mining, the only theme out of the MInGov review of the Botswana minerals value chain that scored “low” instead of “high” was Accountability and Inclusiveness. It
3 OVERVIEW OF MInGov FINDINGS
28
24 Botswana Mines and Minerals Act, 1999; 40.(1) a.
Government of Botswana Anglo American
De BeersInvestments
De Beers Societe Anonyme (Lux)
Debswana
Joint Control
DTC Botswana
50%
50%
50%
50%
80.8
% o
f pro
fits
50%
of d
ivid
ends
Cor
pora
te t
axes
~10% ofrevenue
15%
would seem that this ranking reflects concerns that have been raised by civil society, some industry members and ministries involved with land and other socio-economic issues. Concerns raised by these stakeholders have focused on the lack of meaningful public forums where various land use options, including mining, can be debated and considered at national and local levels. There are complaints that due to the decades of successful devel-opment led by Botswana diamonds, the GRB has become somewhat myopic, failing to take into account other potential income generating activities, such as eco-tourism. This single-minded focus on diamonds also may have resulted in environmental values taking a back seat to industrial development. An open process around a national land use framework would allow for a more fulsome debate around the viability of one economically generating use of land versus another.
The GRB is aware that a number of developmental weaknesses exist and these have been articulated throughout this report, but include problems such as a wide disparity of income levels and displacement of
indigenous people from ecologically sensitive areas. It is not surprising that rural populations feel somewhat marginalized in the face of the GRB’s determination to maintain the level of mining revenues from diamonds that has supported the country’s prosperity to date.
Botswana is highly urbanized, with almost 60% of the 2.2 million population living in urban areas. The rest of the population is spread out over a large landmass.25
This means that the cities, Gaborone and Francistown in particular, are resident to the highest numbers of educated people, the best standard of living and the most high-paying, professional-level government and private sector occupations. However, mining takes place in rural areas and the people living in these areas feel disenfran-chised and cut off from the powerful government and political base resident in the country’s capital. Therefore, it is not surprising that the disconnect between these two realities in Botswana accounts for the low indicators on government accountability and transparency in terms of how decisions on mining activity (and particularly the secrecy around diamond mine development) are made.
BOTSWANA MINING INVESTMENT AND GOVERNANCE REVIEW
29
25 Botswana has a very low rural population density of 3.9% (roughly four people live in one square kilometre).
Stakeholders who participated in in-Botswana inter-views were asked to indicate topics from among those on the matrix that are priorities, in their view, for sound governance of the mining sector in Botswana, including for attracting investment to the sector and to facilitate the sector’s development impact. Stakeholders were requested to identify their top five priorities.
The results of this prioritization are shown below, for all stakeholder groups combined (Figure 7). Similar figures for three stakeholder groups (government, mining industry and civil society) are in Annex 1, Figures 4-6. The figure shows the importance that stakeholders attach to review topics, the larger the size of a topic “cell”, the more important it is regarded for sound sector govern-ance and investment; the color key is used throughout this report and is explained in Figure 2.26
Points that stand out from stakeholder priorities at a value chain stage and theme level include:
• The top shared priority by all three stakeholder groups is Sector Management and Intragovern-mental Coordination. However, each group has somewhat different reasons for naming this as a top priority. Industry is concerned about government management capacity and “de jure” weaknesses regarding processing times for applications and
other permits required throughout the lifecycle of the mine. This concern relates to the high staff turnover and the lack of experienced personnel as well as to insufficient coordination of permitting (i.e. the EIA approval can lag behind the awarding of an exploration or mining license). Government is concerned about weaknesses in sector manage-ment arising from insufficient resourcing, industry pressure, and potential lowering of Botswana’s country risk profile as a good destination for mining investment. Civil society’s concern about sector management and intragovernmental coordination mostly involves the lack of transparency in contract negotiations; and in how decisions about land use are made that invariably favour the mining sector.
• There are three more overlapping topics that have been identified as priority areas by governments, CSO and Industry representatives: Community Consultation and Environmental and Social Impact Management, Policies to Mitigate Environmental and Social Impact and Human Health. It is inter-esting that all three stakeholder groups have identified the area of community and environ-mental impacts from mining as a priority area. This likely refers to the lack of a “de jure” framework for managing community consultation, except as it exists under the EIA Act, 2011. It appears that all
4 STAKEHOLDER PRIORITIES
30
26 Stakeholders indicate their priority topics from a list of the 30 topics in the matrix. Weighted scores (see, the MInGov Methodology document on the World
Bank’s website) are grouped within their respective value chain stage or cross-cutting theme, the size of each topic representing its weighted value: the
larger the topic and theme/value chain is portrayed, the greater the priority assigned to it by stakeholders. The color of individual topics is as it appears on
the matrix which indicates the performance of topics (and not, for example, the performance of them from the stakeholder perspective).
STAKEHOLDER PRIORITIES4
BOTSWANA MINING INVESTMENT AND GOVERNANCE REVIEW
31
There is a very clear process of compensation for displacement of land or economically generated activities implemented by Land Boards and Tribunals; however, it is true that there is contention around amounts of compensation charged for various forms of land (cattle grazing, etc.) and its products. This is an issue that is broader than the mining sector and needs to be considered within a land management/land use strategy. More “de jure” guidance on resettlement would improve the rankings for the topic of Policies for Management of Social and Environmental Impacts. Regarding ASM, there is a small artisanal mining population in Botswana that is mostly involved with sand and gravel mining. This does not appear to be a large or contentious mining sub-sector in Botswana.
• Unsurprisingly, government and industry stake-holders identify Skills and Human Capital Availability as a leading priority, while CSOs do not include it in their priority list. As has been noted elsewhere in this report, the government is sometimes forced to hire inexperienced people to occupy positions of responsibility within the mining and related regulatory ministries. This impacts the capacity of the ministries to oversee and monitor mining operations to ensure proper implementation of environmental, safety and other regulations. With competition from industry’s higher compensation packages, government can find it difficult to attract and retain sufficient skills. Industry is worried about the impending local content regulations where it would be forced to procure locally (without sufficient supplier capacity) and to hire locally when special-ised mining skills, and work experience in some of these highly technical areas are not available.
• Industry and CSO stakeholders have two overlap-ping priorities – Budget Transparency and Accountability, and Public Integrity and Business and Investment Environment. Both of these topics reflect the relatively lower score across the stages under the theme of Accountability and Inclusive-ness. All stakeholders want greater openness around budget allocation decisions and for government to undertake a more iterative process of consultation around spending priorities. Industry will always be concerned about the political risk assessment of a jurisdiction and needs to ensure a high degree of safety and minimized risk of investment to shareholders.
stakeholders recognise that more attention needs to be given to the social aspects of mining, particularly.
• The industry appears to need more guidance in terms of CSR, given that there is high community expectation around benefit sharing; and civil society has certainly called out for greater local development around mining projects. This is an ideological issue for the GRB as it does not want to burden the mining sector with legislated community development requirements; and secondly, it funda-mentally believes that it is the government’s role to provide basic services, local economic development, etc. through revenue partly derived from the mining sector’s tax payments.
• CSO stakeholders emphasize more strongly than government that Accountability of Processes, Compensation, Resettlement and Artisanal and Small scale Mining Voice is of vital significance, especially considering its low performance. Industry stakeholders have not identified the topic as a priority. It should be noted that civil society’s mandate in general is to increase accountability of government, and to ensure that communities and marginalised segments of society have a “voice” in their society. Therefore, it is not surprising that this topic was the priority for CSO stakeholders.
In Botswana, there is a strong centralised govern-ment with highly developed capacity throughout the national government. There is a traditional system of consultation that links the national level of government down to the “kgotla” or village level on development issues and decisions. However, because there is a somewhat “top down” approach to gathering feedback from local areas, mechanisms to ensure a two-way consultative process may be lacking. Hence, communities may feel that they have provided insufficiently considered input into economic development policies and strategies that may affect them. Government does provide its socio-economic priorities in the National Development Plans, however, and may believe that this is sufficient response to input gathered from the public. Civil society and some other stakeholders interviewed indicated that the consultative process tends to be “one way” and not iterative. This likely accounts for the concerns of civil society regarding the process of consultation and the accountability of government within those processes.
4 STAKEHOLDER PRIORITIES
32
• Civil society is the only stakeholder group that has named Political Stability, Human Rights, Employ-ment Equity and Environmental Transparency, Control of Corruption, Mining Taxation and State Owned Enterprise Financial Management, and Public Financial Management Regulation, Including Revenue Sharing as priority areas. Again, these priorities reflect the business of civil society as an advocate body that strives for better openness and transparency in government as well as more social protection around human rights, etc.
• The government’s priorities mostly overlap with those of other stakeholders, with the exception of Openness, Transparency and Independence of Licensing Process and Clarity and Harmonization of Sector Rules. Government wants the licensing system to reflect positively on the industry experi-ence, as it knows this is a key aspect of mineral governance that affects the country risk factor for
mining investment. Industry needs to have a strong regulatory system that is well managed, staffed appropriately and resourced sufficiently. Otherwise, there will be project delays and uncertainty around mineral tenure. Civil society has called for more openness and transparency around license allocation to increase accountability and public participation in the sector.
• As expected, industry stakeholders give further priority to topics related to overall improved business climate, capacity building and infrastruc-ture, i.e. Leveraging Infrastructure, Local Supplier Development, Tax policy, Instruments and State Owned Enterprise Rules, and Mining Infrastructure.
Figure 5 indicates in visual form where stakeholder priorities overlap to better understand areas of possible interest, as described above.
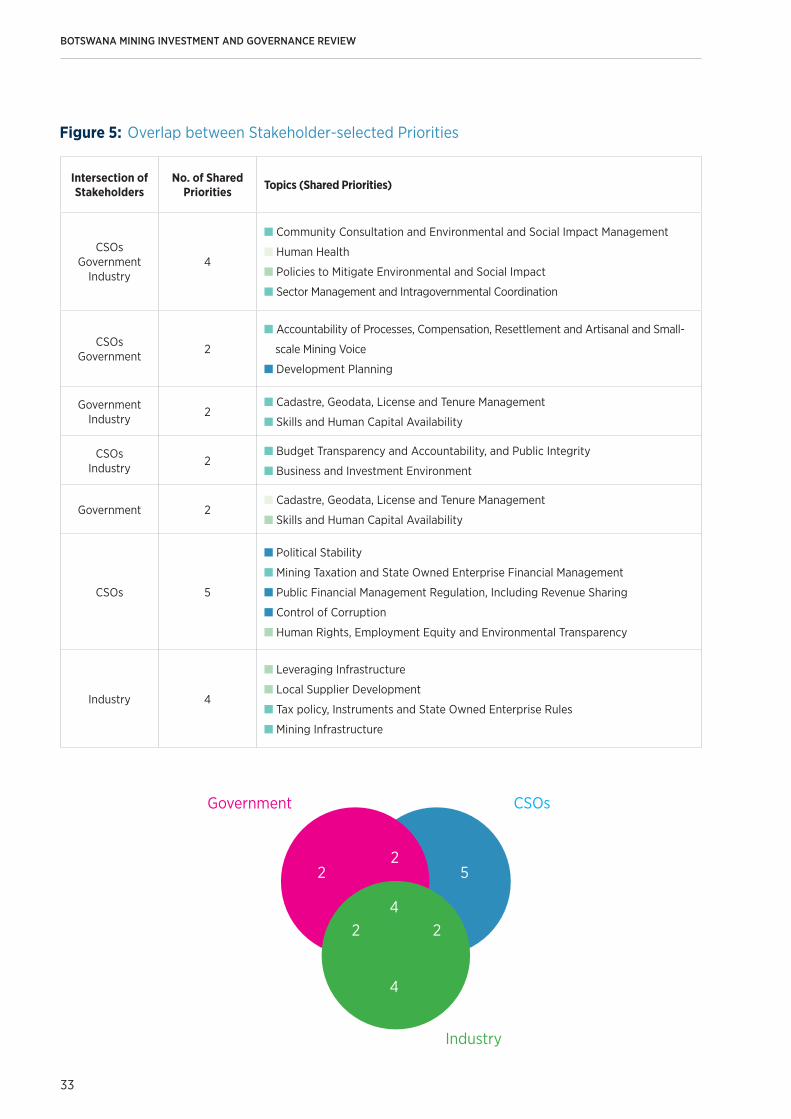
BOTSWANA MINING INVESTMENT AND GOVERNANCE REVIEW
33
Intersection of Stakeholders
No. of Shared Priorities Topics (Shared Priorities)
CSOs Government
Industry4
n Community Consultation and Environmental and Social Impact Management
n Human Health
n Policies to Mitigate Environmental and Social Impact
n Sector Management and Intragovernmental Coordination
CSOs Government
2
n Accountability of Processes, Compensation, Resettlement and Artisanal and Small-
scale Mining Voice
n Development Planning
Government Industry
2n Cadastre, Geodata, License and Tenure Management
n Skills and Human Capital Availability
CSOs Industry
2n Budget Transparency and Accountability, and Public Integrity
n Business and Investment Environment
Government 2n Cadastre, Geodata, License and Tenure Management
n Skills and Human Capital Availability
CSOs 5
n Political Stability
n Mining Taxation and State Owned Enterprise Financial Management
n Public Financial Management Regulation, Including Revenue Sharing
n Control of Corruption
n Human Rights, Employment Equity and Environmental Transparency
Industry 4
n Leveraging Infrastructure
n Local Supplier Development
n Tax policy, Instruments and State Owned Enterprise Rules
n Mining Infrastructure
Government
Industry
CSOs
2
2 2
2
4
4
5
Figure 5: Overlap between Stakeholder-selected Priorities
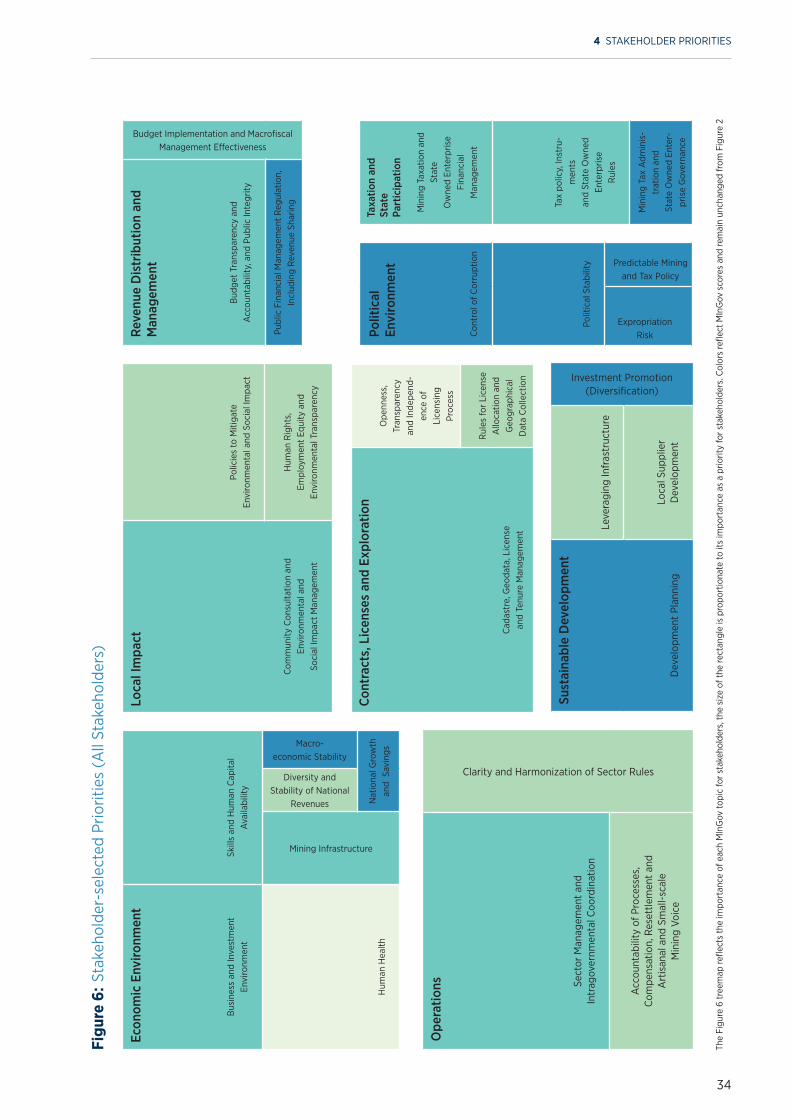
34
4 STAKEHOLDER PRIORITIES
Figu
re 6
: Sta
keho
lder
-sel
ecte
d Pr
iorit
ies
(All
Stak
ehol
ders
)
Bus
ines
s an
d In
vest
men
t
Envi
ronm
ent
Skill
s an
d H
uman
Cap
ital
Ava
ilabi
lity
Hum
an H
ealth
Mining Infrastructure
Diversity and Stability of National
Revenues
Macro- economic Stability
Nat
iona
l Gro
wth
an
d S
avin
gs
Econ
omic
Env
ironm
ent
Com
mun
ity C
onsu
ltatio
n an
d
Envi
ronm
enta
l and
So
cial
Impa
ct M
anag
emen
t
Polic
ies
to M
itiga
te
Envi
ronm
enta
l and
Soc
ial I
mpa
ct
Hum
an R
ight
s,
Empl
oym
ent
Equi
ty a
nd
Envi
ronm
enta
l Tra
nspa
renc
y
Loca
l Im
pact
Cad
astr
e, G
eoda
ta, L
icen
se
and
Tenu
re M
anag
emen
t
Ope
nnes
s,
Tran
spar
ency
an
d In
depe
nd-
ence
of
Lice
nsin
g Pr
oces
s
Rul
es fo
r Li
cens
e A
lloca
tion
and
Geo
grap
hica
l D
ata
Col
lect
ion
Cont
ract
s, L
icen
ses
and
Expl
orat
ion
Dev
elop
men
t Pl
anni
ng
Leve
ragi
ng In
fras
truc
ture
Investment Promotion (Diversification)
Loca
l Sup
plie
r
Dev
elop
men
t
Sust
aina
ble
Dev
elop
men
tSe
ctor
Man
agem
ent
and
In
trag
over
nmen
tal C
oord
inat
ion
Clarity and Harmonization of Sector Rules
Acc
ount
abili
ty o
f Pro
cess
es,
Com
pens
atio
n, R
eset
tlem
ent
and
A
rtis
anal
and
Sm
all-
scal
e
Min
ing
Voic
e
Ope
ratio
ns
Bud
get
Tran
spar
ency
and
A
ccou
ntab
ility
, and
Pub
lic In
tegr
ity
Budget Implementation and Macrofiscal Management Effectiveness
Publ
ic F
inan
cial
Man
agem
ent
Reg
ulat
ion,
In
clud
ing
Rev
enue
Sha
ring
Reve
nue
Dis
trib
utio
n an
d M
anag
emen
t
Con
trol
of C
orru
ptio
n
Polit
ical
Sta
bilit
y
Expropriation Risk
Predictable Mining and Tax Policy
Polit
ical
Envi
ronm
ent
Min
ing
Taxa
tion
and
Stat
e
Ow
ned
Ente
rpris
e Fi
nanc
ial
Man
agem
ent
Tax
polic
y, In
stru
-m
ents
an
d St
ate
Ow
ned
Ente
rpris
e
Rul
es
Min
ing
Tax
Adm
inis
-tr
atio
n an
d
Stat
e O
wne
d En
ter-
pris
e G
over
nanc
e
Taxa
tion
and
St
ate
Pa
rtic
ipat
ion
The
Figu
re 6
tree
map
refle
cts
the
impo
rtan
ce o
f eac
h M
InG
ov to
pic
for s
take
hold
ers,
the
size
of t
he re
ctan
gle
is p
ropo
rtio
nate
to it
s im
port
ance
as
a pr
iorit
y fo
r sta
keho
lder
s. C
olor
s re
flect
MIn
Gov
sco
res
and
rem
ain
unch
ange
d fr
om F
igur
e 2
BOTSWANA MINING INVESTMENT AND GOVERNANCE REVIEW
35
• Delays in approvals for exploration and mining (especially renewals) licenses are restricting the industry’s ability to conduct activities with certainty of tenure. There is inadequate resourcing of this function in the Department of Mines and a lack of legislated timeframes for application processing.
• The lack of an on-line and interactive mining cadastre means that investors cannot source information easily on available mineral rich land in Botswana; nor can other users have an up-to-date status of concession holders and their details. This decreases transparency around land allocation for mineral development.
• Geological data is insufficiently robust as the geological survey does not always receive complete geological information from company reports. This bureaucratic bottleneck appears to be caused by lack of sufficient staff to monitor the submission of exploration and mining reports and to ensure compliance when companies fail to submit these.
Environmental Protection, Social Issues and Human Rights
• The environmental legislation (EIA Act 2011) is not sufficiently strong to ensure that the public have access to relevant information regarding the potential impacts of a mining project; and are clearly entitled to participate in a public hearing process regarding EIAs and throughout the lifecycle of the mine (post-EIAs). There is insuffi-cient focus on ensuring that issues of biodiversity
5.1 Conclusions
Botswana has been a notable example of where a small, poor, landlocked country achieving Independence some 50 years ago has reached an upper middle-income status from resource-based growth and development. Botswana remains an attractive mining investment destination with large remaining diamond resources and undeveloped coal and other mineral resources, however, the country will need to intensify its diversification efforts to offset the eventual decline of its diamond reserves and associated mineral revenue. Botswana must ensure that it remains a desirable destination for international investment into the further development of its diamonds, base metals, uranium, gold, natural gas and coal resources. To improve on its already high country risk rating and continue to attract FDI into the mineral sector, Botswana should pay attention to the human rights, social and environmental aspects of mining development, to ensure that all its people benefit from mineral resource development.
The following are areas where governance of the mining sector could be improved:
Exploration and Mining Administration
• The mining regulatory framework is out-dated as the current Mines and Minerals Act was passed in 1999; further, there have never been regula-tions drafted to bring effect to this Act. While there is a Mineral Investment Policy, there is no comprehensive mineral policy that deals with all socio-economic, environmental and commercial issues related to mining development.
CONCLUSIONS AND ACTION POINTS5
36
5 CONCLUSIONS AND ACTION POINTS
and mine closure are specifically included in an EIA. The level of understanding of environmental issues throughout the general population could be improved through environmental awareness and education efforts.
• There is insufficient policy, legislative or procedural guidance for companies to follow when they are required to resettle and compensate communities displaced by mining activities. A more detailed framework is required around these issues so that industry gains social acceptance for its mining projects, and individuals are not left without alter-native land or other compensatory assets, especially in remote areas where there is no cash based economy.
• Companies are not required to contribute to corporate social development initiatives through a national CSR policy for the extractive sector in Botswana, which may include a requirement for a negotiated company-community development agreement. While large companies that have a significant level of government participation such as Debswana have extensive CSR programming, some smaller, less visible companies are not always contributing to local socio-economic development.
• The current Local Content policy and Citizen’s Empowerment Act have not been applied to the mining sector in a way that meets both govern-ment and industry objectives. This has resulted in a low development of local suppliers of goods and services to the mine; and a shortage of certain mining skills that has not been developed locally.
• Companies are increasingly noting that the govern-ment’s focus on local hiring (even in the face of an absence of certain mining skills); has resulted in difficulty sourcing specialised mining skills outside the country if these are not available locally.
• There is no legislated mineral revenue sharing formula or mechanism from the national level to mining affected areas. While Botswana pursues a policy of equitable development, there may be advantages to ensuring that the communities suffering the negative impacts from mining also benefit specifically from mineral development.
Currently, the distribution of mineral revenue is not reaching the poorest segments of society, resulting in a high level of rural poverty and a high disparity of income between wealthy and poor.
• The contract negotiation process for diamond mining and integrated projects is “closed” and confidential. Contracts are not published, nor are they available to the Auditor General for auditing. This process lessens the ability of public watchdogs and the public generally to hold government to account. In an open and transparent kind of mining administration regime, the public would be able to have access to information on the development of the country’s most important natural resources.
5.2 Action points
Areas for action by government and other stakeholders are apparent from this review. Based on the views of the main stakeholder groups – government, industry and civil society – the review provides a shared view of the status mining governance.
Six low-hanging fruit actions that government could take in the near to medium term are:
• Update the Mines and Minerals Act, 1999 to reflect modern best practises in mineral regulation. There are currently no regulations accompanying this Act and these should be drafted to accompany a new Act. As a precursor to a revision of the Act, a mineral policy should be developed that includes a wide range of stakeholder input at the national and local levels.
• Increase the Department of Mines’ human resource capacity in licensing; in geo-data collection and management; and introduce an interactive mining cadastre.
• Publish mining contracts (large scale diamond and integrated projects) and subject them to audit by the Auditor General.
• Strengthen the Environmental Impact Assessment Act 2011 to ensure a stronger element of public participation, accessibility of EIAs, and a required iterative process throughout the life cycle of the
BOTSWANA MINING INVESTMENT AND GOVERNANCE REVIEW
37
• The country should consider developing a protected areas strategy that would remove certain ecolog-ically sensitive land from mineral exploration or development.
• Increase intra-governmental coordination so that timing of various types of mine permitting is coordinated; and to ensure that there is a “whole of government” approach to land use, consideration of mining compared to other socio-economic activities such as eco-tourism, and other opportunities for economic diversification.
• Consider the Africa Mining Vision’s recommendation that a portion of mineral revenue be returned to local government (through to communities) where mining has negatively impacted on the people and natural resources of a particular area.
5.2.1 Recommended Follow-up Points by Value Chain Stage and Theme
Below is a list of the key follow-up points broken down by Value Chain Stage and Theme.
Contracts, Licenses and Exploration Value Chain Stage
• Improve legislative framework: Review current mining legislation and update; include timeframes for processing exploration and mining applica-tions; create regulations to accompany a revised mining act.
• Increase transparency around diamond and other large-scale mining contracts: Publish mining contracts negotiated on a case-by-case basis with government and allow the Auditor General to audit these.
• Strengthen Institutional Response: Provide stronger institutional service regarding industry needs for security of tenure including: better human resource capacity to ensure quicker turnaround times for exploration and mining appli-cations; and implementation of a fully functioning mining cadastre that is interactive and includes details on all mining concessions currently active in Botswana.
mine; a separate but related policy should be developed around resettlement and compensation that reflects best practise (for example relevant World Bank Guidelines). Introduce environmental awareness programmes at the high school and tertiary levels where appropriate.
• Develop a national CSR policy for the extractive sector – there are a number of different models including the Canadian CSR Strategy for the EI Sector and the Mozambique National CSR policy for the extractive sector. The Africa Mining Vision implementation plan also provides guidance on this issue. Should the policy contain a requirement for a mining company-community development plan, there are also a number of models currently demon-strating international best practise in this area. They include the World Bank Community Development Agreement template, the South African Social and Labour Plan, the Canadian Impacts and Benefits Agreements, etc.; emphasis needs to be on inter-ventions that are sustainable, based on the specific stage of the mining lifecycle, and negotiated with appropriate stakeholders.
• Develop a local content strategy specifically targeted toward the mining sector – this should have participation by the industry and ensure that industry needs are met as well as government local-ization objectives.
Somewhat more challenging or longer-term actions would include:
• Create a freedom or access to information Act to ensure public access to all relevant government information.
• Consider an initiative to improve transparency in the sector and create a forum to allow for on-going dialogue between government, civil society and industry stakeholders;
• Develop a national land use policy and strategy that has the input of a range of civil society, community, industry, academic, government, traditional author-ities, etc. stakeholders. It should include a process for public input into government decisions on land use, and determine if mining is always the prefer-able option.
38
• Improve collection and management of geo-data: Improve collection and compilation of geo-data for a more complete geological database; establish clear roles on who collects, compiles and shares data; increase human resource capacity in Licensing Section to monitor company reports on compliance with work plans and submit geological data to the Geological Survey Department; and complete process of turning the Geological Survey into a parastatal27 to make it more focused on its mandate to provide geological information/mapping.
Operations Value Chain Stage
• Ensure security of tenure: Provide sufficient human resource capacity to process exploration permit renewals on a timely basis and monitor these for compliance.
• Improve intra-ministerial coordination: Coordi-nate timeframes of permitting required for mining such as the EIA; ensure that there is a “whole of government” approach to mine development so that competing land use values (such as mining in nature reserves, etc.) are resolved.
• Reduce negative impacts of mining develop-ment: Provide clearer guidelines on the process of displacing people from land required for mining purpose, including provision of fair compensation valuations for different types of land and products.
Taxation and State Participation Value Chain Stage
• Provide greater transparency around mining tax payments and receipts: Consider implementing systems to improve disclosure of disaggregated data on mining tax paid by companies and receipt of these by government.
Revenue Distribution and Management Value Chain Stage
• Better expenditure controls on creation of public infrastructure: Improve procurement on large scale infrastructure projects: Complete process of
installing a Procurement Management Office in each Ministry to address weaknesses in the public procurement system
• Refine guidelines for distribution of revenue from national to local levels: Consider returning a portion of mineral tax revenue to those commu-nities most negatively impacted by mining (including resettled populations).
Local Impact Value Chain Stage
• Provide greater mining sector contribution to local economic development: Provide guidance to companies to respond to community devel-opment issues: 1) Develop a national CSR Policy for the EI sector that could include a prescribed framework for some sort of site-spe-cific community development agreement; and 2) Provide a local content policy tailored to the mining sector and implement this in consultation with the mining sector.
• Increase accountability of government to protect the environment: Amend the EIA Act 2011 to include stronger provisions on public participa-tion; access to information; requirements around protection of biodiversity and mine closure planning. Ensure that environmental management courses are included in the delivery of geoscience and mining engineering courses at tertiary level.
• Pay greater attention to human rights issues: Botswana should consider signing the U.N. Voluntary Principles on Security and Human Rights; this would signal better accountability and raise the country’s mining investment political risk rating; it would provide a framework for addressing human rights issues regarding develop-ment of mining projects.
Cross Cutting Themes
• Encourage Public-Private Sector Partnerships: Provide a legislative framework for PPP with regard to mining related infrastructure (transportation,
27 During the World Bank Botswana MInGov validation meeting of August 11, 2016, it was confirmed that the Geological Survey had become a parastatal as of
December 2015 and first key appointments were made during the first quarter of 2016. It is now called the Botswana Geoscience Institute.
5 CONCLUSIONS AND ACTION POINTS

BOTSWANA MINING INVESTMENT AND GOVERNANCE REVIEW
39
• Increase mining linkages downstream: Provide greater support to the development of local suppliers of goods and services in the mining industry; include investment incentives as part of the package to encourage mining companies to procure locally.
water, energy, telecommunications, etc).• Address health issues, especially in the youth:
Accelerate efforts to ensure that HIV antiretroviral medication reaches a greater percentage of the population through improved medical facilities – especially in remote areas of the country.
40
ANNEX 1 THE BOTSWANA MInGov DATA COMPENDIUM
ANNEX 1THE BOTSWANA MInGov DATA COMPENDIUM
Table of Contents
TABLE 1: Themes, Value Chain Stage, Topics, Indicators and Information Source . . . . . 41
TABLE 2: Theme Scores . . . . . . . . . . . . . . . . . . . . . . . . . . . . . . . . . . . . . . . . . . . . . . . . . . . . . 46
TABLE 3: Value Chain Stages Scores . . . . . . . . . . . . . . . . . . . . . . . . . . . . . . . . . . . . . . . . . . 46
TABLE 4: Topic Score . . . . . . . . . . . . . . . . . . . . . . . . . . . . . . . . . . . . . . . . . . . . . . . . . . . . . . . .47
TABLE 5: Indicator Scores . . . . . . . . . . . . . . . . . . . . . . . . . . . . . . . . . . . . . . . . . . . . . . . . . . . 49
TABLE 6: Question Scores . . . . . . . . . . . . . . . . . . . . . . . . . . . . . . . . . . . . . . . . . . . . . . . . . . . .57
FIGURE 1: Topic Scores (Max-Min Chart) . . . . . . . . . . . . . . . . . . . . . . . . . . . . . . . . . . . . . . . .48
FIGURE 2: Indicator Scores (Max-Min Chart) . . . . . . . . . . . . . . . . . . . . . . . . . . . . . . . . . . . . .52
FIGURE 3: Stakeholder Prioritisation, Government . . . . . . . . . . . . . . . . . . . . . . . . . . . . . . . .54
FIGURE 4: Stakeholder Prioritisation, Cso. . . . . . . . . . . . . . . . . . . . . . . . . . . . . . . . . . . . . . . .55
FIGURE 5: Stakeholder Prioritisation, Industry. . . . . . . . . . . . . . . . . . . . . . . . . . . . . . . . . . . .56
A
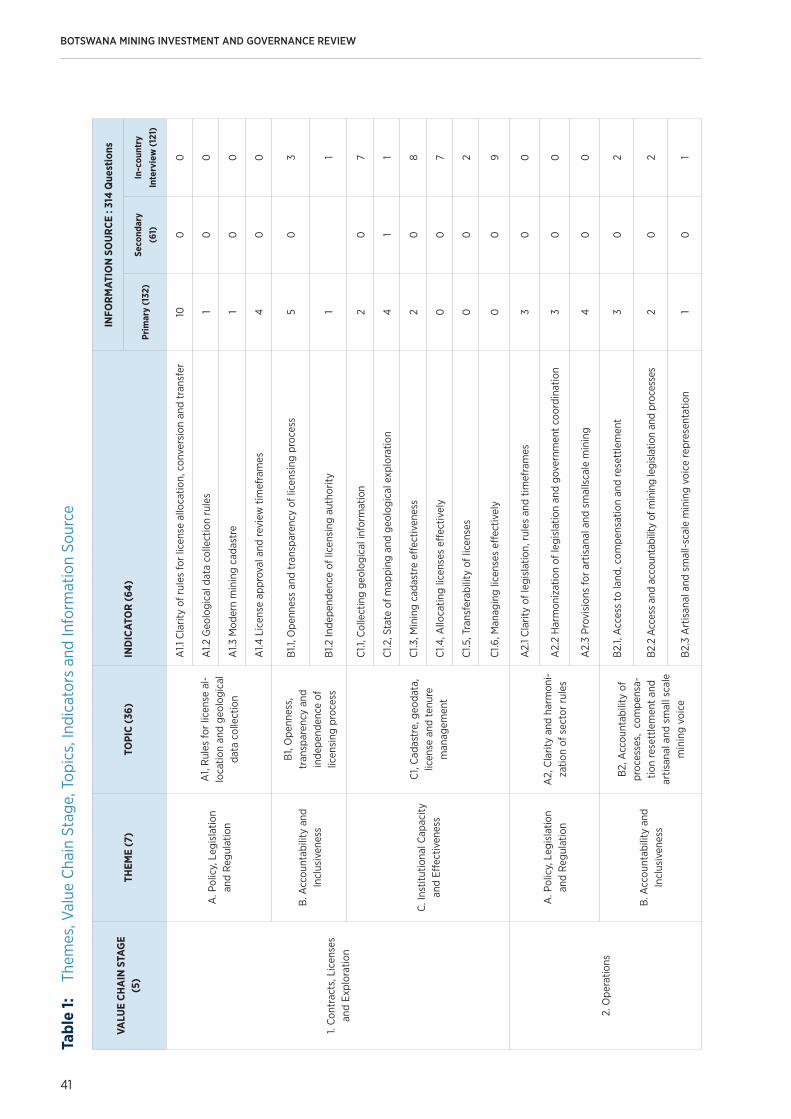
BOTSWANA MINING INVESTMENT AND GOVERNANCE REVIEW
41
VALU
E CH
AIN
STA
GE
(5)
THEM
E (7
)TO
PIC
(36)
IND
ICAT
OR
(64)
INFO
RMAT
ION
SO
URC
E : 3
14 Q
uest
ions
Prim
ary
(132
)Se
cond
ary
(61)
In-c
ount
ry
Inte
rvie
w (1
21)
1. C
ontr
acts
, Lic
ense
s an
d Ex
plor
atio
n
A. P
olic
y, L
egis
latio
n an
d R
egul
atio
n
A1,
Rul
es fo
r lic
ense
al-
loca
tion
and
geol
ogic
al
data
col
lect
ion
A1.1
Cla
rity
of r
ules
for
licen
se a
lloca
tion,
con
vers
ion
and
tran
sfer
100
0
A1.2
Geo
logi
cal d
ata
colle
ctio
n ru
les
10
0
A1.3
Mod
ern
min
ing
cada
stre
10
0
A1.4
Lic
ense
app
rova
l and
revi
ew t
imef
ram
es4
00
B. A
ccou
ntab
ility
and
In
clus
iven
ess
B1,
Ope
nnes
s,
tran
spar
ency
and
in
depe
nden
ce o
f lic
ensi
ng p
roce
ss
B1.1
, Ope
nnes
s an
d tr
ansp
aren
cy o
f lic
ensi
ng p
roce
ss5
03
B1.2
Inde
pend
ence
of l
icen
sing
aut
horit
y1
1
C. I
nstit
utio
nal C
apac
ity
and
Effec
tiven
ess
C1,
Cad
astr
e, g
eoda
ta,
licen
se a
nd te
nure
m
anag
emen
t
C1.1
, Col
lect
ing
geol
ogic
al in
form
atio
n2
07
C1.2
, Sta
te o
f map
ping
and
geo
logi
cal e
xplo
ratio
n4
11
C1.3
, Min
ing
cada
stre
eff
ectiv
enes
s2
08
C1.4
, Allo
catin
g lic
ense
s eff
ectiv
ely
00
7
C1.5
, Tra
nsfe
rabi
lity
of li
cens
es0
02
C1.6
, Man
agin
g lic
ense
s eff
ectiv
ely
00
9
2. O
pera
tions
A. P
olic
y, L
egis
latio
n an
d R
egul
atio
nA
2, C
larit
y an
d ha
rmon
i-za
tion
of s
ecto
r ru
les
A2.
1 Cla
rity
of le
gisl
atio
n, r
ules
and
tim
efra
mes
30
0
A2.
2 H
arm
oniz
atio
n of
legi
slat
ion
and
gove
rnm
ent
coor
dina
tion
30
0
A2.
3 Pr
ovis
ions
for
artis
anal
and
sm
alls
cale
min
ing
40
0
B. A
ccou
ntab
ility
and
In
clus
iven
ess
B2,
Acc
ount
abili
ty o
f pr
oces
ses,
com
pens
a-tio
n re
sett
lem
ent
and
artis
anal
and
sm
all s
cale
m
inin
g vo
ice
B2.
1, A
cces
s to
land
, com
pens
atio
n an
d re
sett
lem
ent
30
2
B2.2
Acc
ess
and
acco
unta
bilit
y of
min
ing
legi
slat
ion
and
proc
esse
s2
02
B2.
3 A
rtis
anal
and
sm
all-
scal
e m
inin
g vo
ice
repr
esen
tatio
n1
01
Tabl
e 1:
Th
emes
, Val
ue C
hain
Sta
ge, T
opic
s, In
dica
tors
and
Info
rmat
ion
Sour
ce

42
ANNEX 1 THE BOTSWANA MInGov DATA COMPENDIUM
VALU
E CH
AIN
STA
GE
(5)
THEM
E (7
)TO
PIC
(36)
IND
ICAT
OR
(64)
INFO
RMAT
ION
SO
URC
E : 3
14 Q
uest
ions
Prim
ary
(132
)Se
cond
ary
(61)
In-c
ount
ry
Inte
rvie
w (1
21)
2. O
pera
tions
C. I
nstit
utio
nal C
apac
ity
and
Effec
tiven
ess
C2,
Sec
tor
man
agem
ent
and
intr
a-go
vern
men
tal
coor
dina
tion
C2.
1, Ti
mef
ram
es fo
r ap
prov
als
00
2
C2.
2, In
tra-
gove
rnm
enta
l coo
rdin
atio
n1
03
C2.
3 Su
ppor
t to
art
isan
al a
nd s
mal
l-sc
ale
min
ing
20
4
3. T
axat
ion
and
Stat
e Pa
rtic
ipat
ion
A. P
olic
y, L
egis
latio
n an
d R
egul
atio
n
A3,
Tax
pol
icy,
inst
ru-
men
ts a
nd s
tate
ow
ned
ente
rpris
e ru
les
A3.
1, Ta
x po
licy
and
inst
rum
ents
90
0
A3.
2 R
ules
for
audi
ting,
bas
e er
osio
n an
d pr
ofit
shift
ing
60
0
A3.
3 St
ate
owne
d en
terp
rise
gove
rnan
ce r
ules
20
0
B. A
ccou
ntab
ility
and
In
clus
iven
ess
B3,
Min
ing
taxa
tion
and
stat
e ow
ned
ente
rpris
e fin
anci
al m
anag
emen
t
B3.
1, A
ccou
ntab
ility
of m
inin
g ta
xatio
n 2
02
B3.
2, S
tate
ow
ned
ente
rpris
e fin
anci
al m
anag
emen
t3
02
C. I
nstit
utio
nal C
apac
ity
and
Effec
tiven
ess
C3,
Min
ing
tax
ad
min
istr
atio
n an
d st
ate
owne
d en
terp
rise
gove
rnan
ce
C3.
1, M
inin
g ta
x ad
min
istr
atio
n2
113
C3.
2, S
tate
ow
ned
ente
rpris
e go
vern
ance
10
4
4. R
even
ue D
istr
ibut
ion
and
Man
agem
ent
A. P
olic
y, L
egis
latio
n an
d R
egul
atio
n
A4,
Pub
lic fi
nanc
ial
man
agem
ent r
egul
atio
n,
incl
udin
g re
venu
e sh
arin
g
A4.
1, Pu
blic
fina
ncia
l man
agem
ent
and
reve
nue
shar
ing
30
1
A4.
2, A
4.2
Mac
rofis
cal m
anag
emen
t ru
les
and
stab
iliza
tion
10
0
B. A
ccou
ntab
ility
and
In
clus
iven
ess
B4, B
udge
t tra
nspa
renc
y an
d ac
coun
tabi
lity,
and
pu
blic
inte
grity
B4.
1, B
udge
t tr
ansp
aren
cy a
nd a
ccou
ntab
ility
01
0
B4.
2, P
ublic
inve
stm
ent
inte
grity
40
1
C. I
nstit
utio
nal C
apac
ity
and
Effec
tiven
ess
C4,
Bud
get
impl
emen
-ta
tion
and
mac
rofis
cal
man
agem
ent
effec
tive-
ness
C4.
1, B
udge
t im
plem
enta
tion
07
2
C4.
2, L
arge
-sca
le p
ublic
inve
stm
ent
00
6
C4.3
Mac
rofis
cal m
anag
emen
t and
reve
nue
stab
iliza
tion
eff
ectiv
enes
s0
02
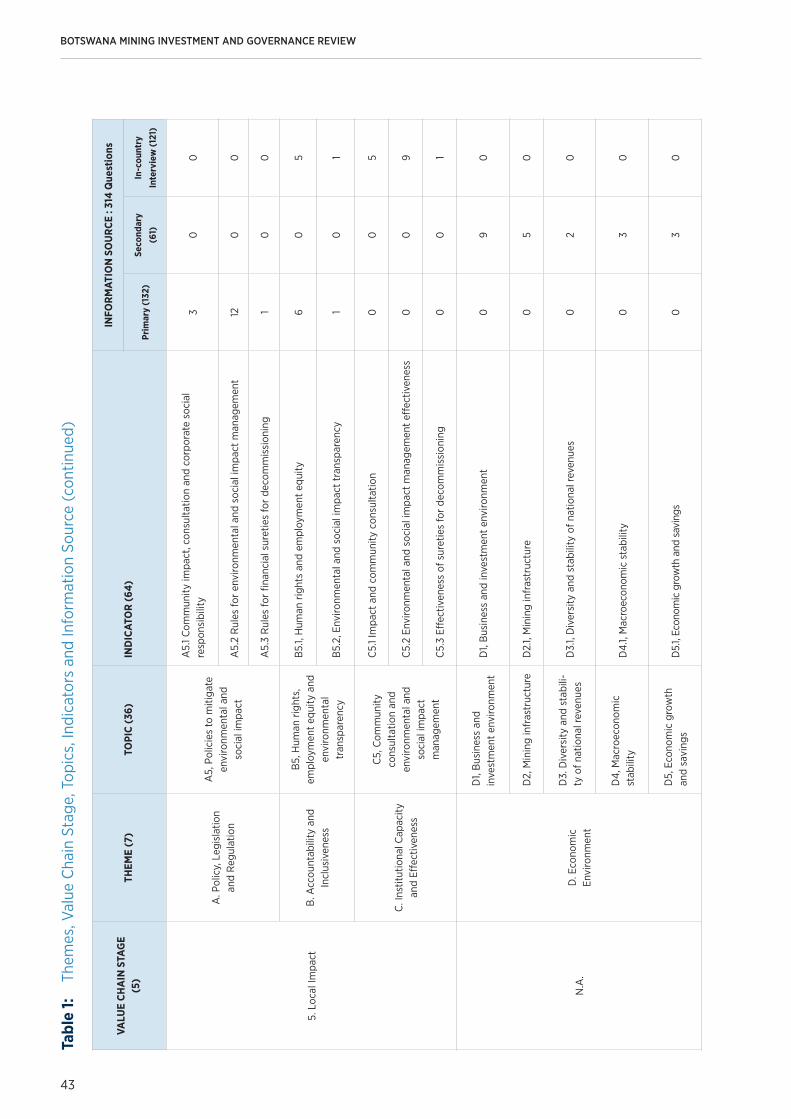
BOTSWANA MINING INVESTMENT AND GOVERNANCE REVIEW
43
VALU
E CH
AIN
STA
GE
(5)
THEM
E (7
)TO
PIC
(36)
IND
ICAT
OR
(64)
INFO
RMAT
ION
SO
URC
E : 3
14 Q
uest
ions
Prim
ary
(132
)Se
cond
ary
(61)
In-c
ount
ry
Inte
rvie
w (1
21)
5. L
ocal
Impa
ct
A. P
olic
y, L
egis
latio
n an
d R
egul
atio
n
A5,
Pol
icie
s to
miti
gate
en
viro
nmen
tal a
nd
soci
al im
pact
A5.
1 Com
mun
ity im
pact
, con
sulta
tion
and
corp
orat
e so
cial
re
spon
sibi
lity
30
0
A5.
2 R
ules
for
envi
ronm
enta
l and
soc
ial i
mpa
ct m
anag
emen
t12
00
A5.
3 R
ules
for
finan
cial
sur
etie
s fo
r de
com
mis
sion
ing
10
0
B. A
ccou
ntab
ility
and
In
clus
iven
ess
B5,
Hum
an r
ight
s,
empl
oym
ent
equi
ty a
nd
envi
ronm
enta
l tr
ansp
aren
cy
B5.
1, H
uman
rig
hts
and
empl
oym
ent
equi
ty6
05
B5.
2, E
nviro
nmen
tal a
nd s
ocia
l im
pact
tra
nspa
renc
y1
01
C. I
nstit
utio
nal C
apac
ity
and
Effec
tiven
ess
C5,
Com
mun
ity
cons
ulta
tion
and
en
viro
nmen
tal a
nd
soci
al im
pact
m
anag
emen
t
C5.
1 Im
pact
and
com
mun
ity c
onsu
ltatio
n0
05
C5.
2 En
viro
nmen
tal a
nd s
ocia
l im
pact
man
agem
ent
effec
tiven
ess
00
9
C5.
3 Eff
ectiv
enes
s of
sur
etie
s fo
r de
com
mis
sion
ing
00
1
N.A
.D
. Eco
nom
ic
Envi
ronm
ent
D1,
Bus
ines
s an
d
inve
stm
ent
envi
ronm
ent
D1,
Bus
ines
s an
d in
vest
men
t en
viro
nmen
t0
90
D2,
Min
ing
infr
astr
uctu
re
D2.
1, M
inin
g in
fras
truc
ture
05
0
D3.
Div
ersi
ty a
nd s
tabi
li-ty
of n
atio
nal r
even
ues
D3.
1, D
iver
sity
and
sta
bilit
y of
nat
iona
l rev
enue
s0
20
D4,
Mac
roec
onom
ic
stab
ility
D4.
1, M
acro
econ
omic
sta
bilit
y0
30
D5,
Eco
nom
ic g
row
th
and
savi
ngs
D5.
1, Ec
onom
ic g
row
th a
nd s
avin
gs0
30
Tabl
e 1:
Th
emes
, Val
ue C
hain
Sta
ge, T
opic
s, In
dica
tors
and
Info
rmat
ion
Sour
ce (
cont
inue
d)
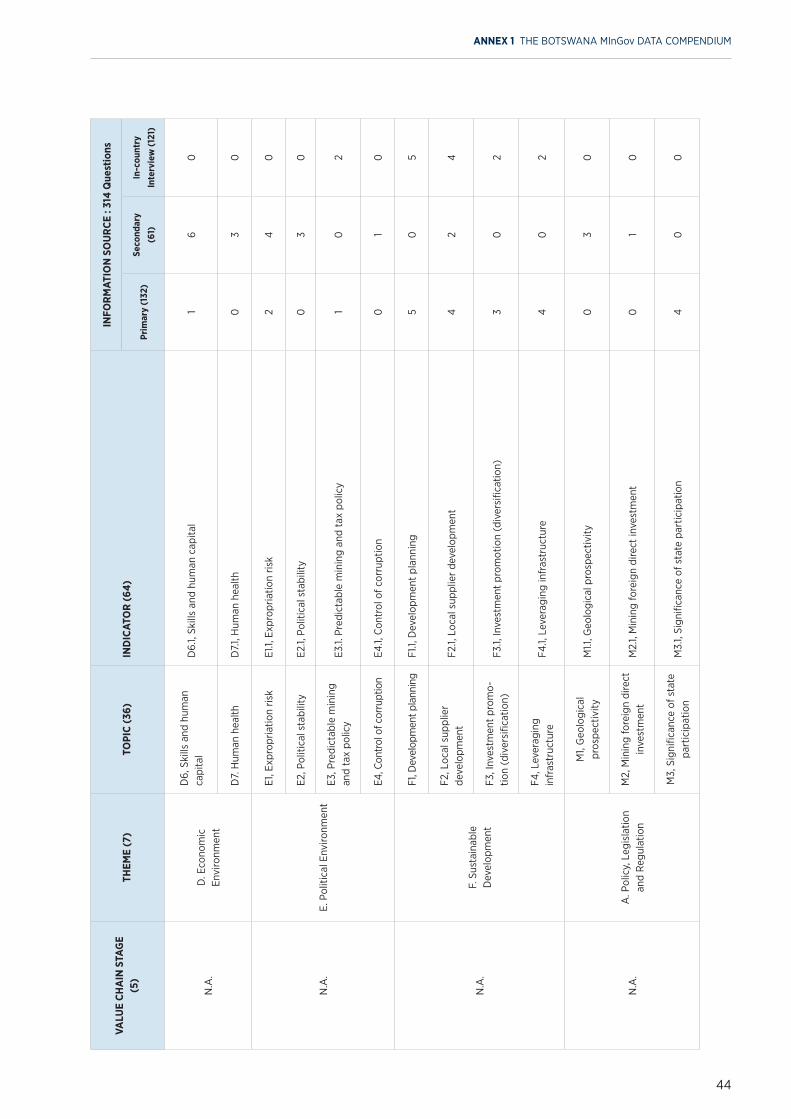
44
ANNEX 1 THE BOTSWANA MInGov DATA COMPENDIUM
VALU
E CH
AIN
STA
GE
(5)
THEM
E (7
)TO
PIC
(36)
IND
ICAT
OR
(64)
INFO
RMAT
ION
SO
URC
E : 3
14 Q
uest
ions
Prim
ary
(132
)Se
cond
ary
(61)
In-c
ount
ry
Inte
rvie
w (1
21)
5. L
ocal
Impa
ct
A. P
olic
y, L
egis
latio
n an
d R
egul
atio
n
A5,
Pol
icie
s to
miti
gate
en
viro
nmen
tal a
nd
soci
al im
pact
A5.
1 Com
mun
ity im
pact
, con
sulta
tion
and
corp
orat
e so
cial
re
spon
sibi
lity
30
0
A5.
2 R
ules
for
envi
ronm
enta
l and
soc
ial i
mpa
ct m
anag
emen
t12
00
A5.
3 R
ules
for
finan
cial
sur
etie
s fo
r de
com
mis
sion
ing
10
0
B. A
ccou
ntab
ility
and
In
clus
iven
ess
B5,
Hum
an r
ight
s,
empl
oym
ent
equi
ty a
nd
envi
ronm
enta
l tr
ansp
aren
cy
B5.
1, H
uman
rig
hts
and
empl
oym
ent
equi
ty6
05
B5.
2, E
nviro
nmen
tal a
nd s
ocia
l im
pact
tra
nspa
renc
y1
01
C. I
nstit
utio
nal C
apac
ity
and
Effec
tiven
ess
C5,
Com
mun
ity
cons
ulta
tion
and
en
viro
nmen
tal a
nd
soci
al im
pact
m
anag
emen
t
C5.
1 Im
pact
and
com
mun
ity c
onsu
ltatio
n0
05
C5.
2 En
viro
nmen
tal a
nd s
ocia
l im
pact
man
agem
ent
effec
tiven
ess
00
9
C5.
3 Eff
ectiv
enes
s of
sur
etie
s fo
r de
com
mis
sion
ing
00
1
N.A
.D
. Eco
nom
ic
Envi
ronm
ent
D1,
Bus
ines
s an
d
inve
stm
ent
envi
ronm
ent
D1,
Bus
ines
s an
d in
vest
men
t en
viro
nmen
t0
90
D2,
Min
ing
infr
astr
uctu
re
D2.
1, M
inin
g in
fras
truc
ture
05
0
D3.
Div
ersi
ty a
nd s
tabi
li-ty
of n
atio
nal r
even
ues
D3.
1, D
iver
sity
and
sta
bilit
y of
nat
iona
l rev
enue
s0
20
D4,
Mac
roec
onom
ic
stab
ility
D4.
1, M
acro
econ
omic
sta
bilit
y0
30
D5,
Eco
nom
ic g
row
th
and
savi
ngs
D5.
1, Ec
onom
ic g
row
th a
nd s
avin
gs0
30
VALU
E CH
AIN
STA
GE
(5)
THEM
E (7
)TO
PIC
(36)
IND
ICAT
OR
(64)
INFO
RMAT
ION
SO
URC
E : 3
14 Q
uest
ions
Prim
ary
(132
)Se
cond
ary
(61)
In-c
ount
ry
Inte
rvie
w (1
21)
N.A
.D
. Eco
nom
ic
Envi
ronm
ent
D6,
Ski
lls a
nd h
uman
ca
pita
l D
6.1,
Skill
s an
d hu
man
cap
ital
16
0
D7.
Hum
an h
ealth
D7.
1, H
uman
hea
lth0
30
N.A
.E.
Pol
itica
l Env
ironm
ent
E1, E
xpro
pria
tion
risk
E1.1,
Exp
ropr
iatio
n ris
k 2
40
E2, P
oliti
cal s
tabi
lity
E2.1,
Pol
itica
l sta
bilit
y0
30
E3, P
redi
ctab
le m
inin
g an
d ta
x po
licy
E3.1.
Pre
dict
able
min
ing
and
tax
polic
y1
02
E4, C
ontr
ol o
f cor
rupt
ion
E4.1,
Con
trol
of c
orru
ptio
n0
10
N.A
.F.
Sus
tain
able
D
evel
opm
ent
F1, D
evel
opm
ent p
lann
ing
F1.1,
Dev
elop
men
t pl
anni
ng5
05
F2, L
ocal
sup
plie
r
deve
lopm
ent
F2.1,
Loc
al s
uppl
ier
deve
lopm
ent
42
4
F3, I
nves
tmen
t pr
omo-
tion
(div
ersi
ficat
ion)
F3
.1, In
vest
men
t pr
omot
ion
(div
ersi
ficat
ion)
30
2
F4, L
ever
agin
g
infr
astr
uctu
reF4
.1, L
ever
agin
g in
fras
truc
ture
40
2
N.A
.A
. Pol
icy,
Leg
isla
tion
and
Reg
ulat
ion
M1,
Geo
logi
cal
pros
pect
ivity
M1.1
, Geo
logi
cal p
rosp
ectiv
ity0
30
M2,
Min
ing
fore
ign
dire
ct
inve
stm
ent
M2.
1, M
inin
g fo
reig
n di
rect
inve
stm
ent
01
0
M3,
Sig
nific
ance
of s
tate
pa
rtic
ipat
ion
M3.
1, Si
gnifi
canc
e of
sta
te p
artic
ipat
ion
40
0
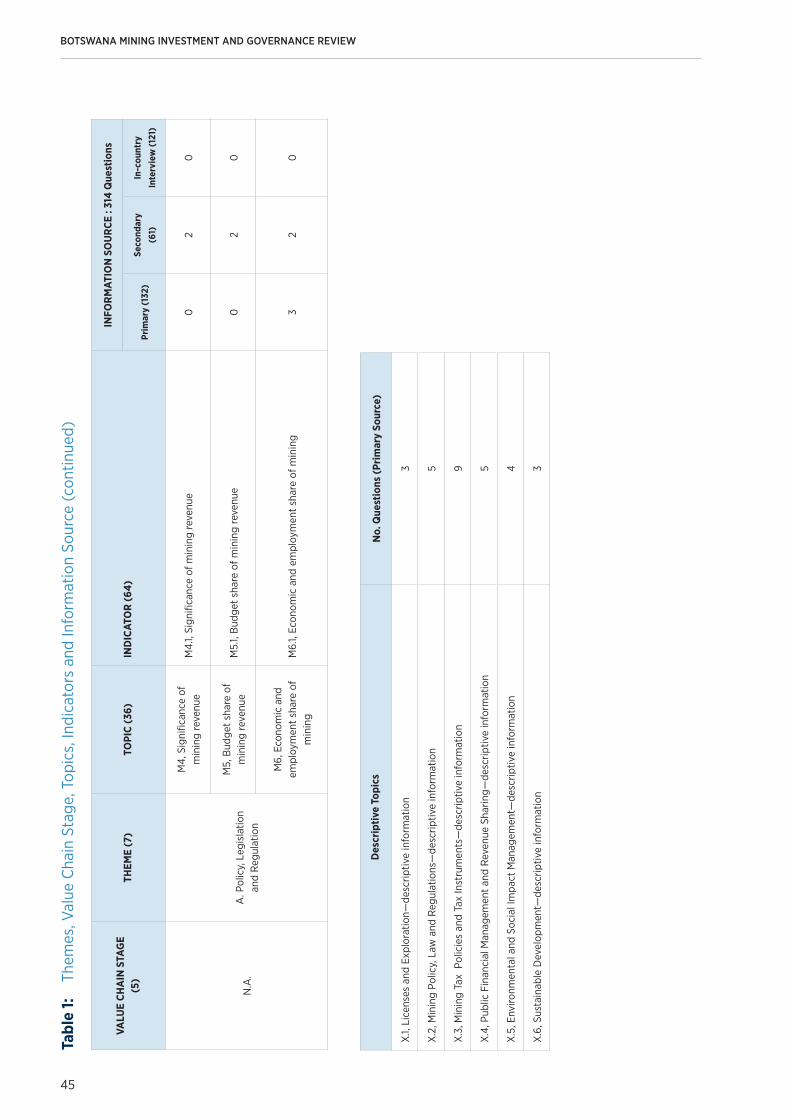
BOTSWANA MINING INVESTMENT AND GOVERNANCE REVIEW
45
VALU
E CH
AIN
STA
GE
(5)
THEM
E (7
)TO
PIC
(36)
IND
ICAT
OR
(64)
INFO
RMAT
ION
SO
URC
E : 3
14 Q
uest
ions
Prim
ary
(132
)Se
cond
ary
(61)
In-c
ount
ry
Inte
rvie
w (1
21)
N.A
.A
. Pol
icy,
Leg
isla
tion
and
Reg
ulat
ion
M4,
Sig
nific
ance
of
min
ing
reve
nue
M4.
1, Si
gnifi
canc
e of
min
ing
reve
nue
02
0
M5,
Bud
get
shar
e of
m
inin
g re
venu
eM
5.1,
Bud
get
shar
e of
min
ing
reve
nue
02
0
M6,
Eco
nom
ic a
nd
empl
oym
ent
shar
e of
m
inin
gM
6.1,
Econ
omic
and
em
ploy
men
t sh
are
of m
inin
g3
20
Des
crip
tive
Topi
csN
o. Q
uest
ions
(Prim
ary
Sour
ce)
X.1,
Lic
ense
s an
d Ex
plor
atio
n—de
scrip
tive
info
rmat
ion
3
X.2
, Min
ing
Polic
y, L
aw a
nd R
egul
atio
ns—
desc
riptiv
e in
form
atio
n5
X.3
, Min
ing
Tax
Pol
icie
s an
d Ta
x In
stru
men
ts—
desc
riptiv
e in
form
atio
n9
X.4
, Pub
lic F
inan
cial
Man
agem
ent
and
Rev
enue
Sha
ring—
desc
riptiv
e in
form
atio
n5
X.5
, Env
ironm
enta
l and
Soc
ial I
mpa
ct M
anag
emen
t—de
scrip
tive
info
rmat
ion
4
X.6
, Sus
tain
able
Dev
elop
men
t—de
scrip
tive
info
rmat
ion
3
Tabl
e 1:
Th
emes
, Val
ue C
hain
Sta
ge, T
opic
s, In
dica
tors
and
Info
rmat
ion
Sour
ce (
cont
inue
d)
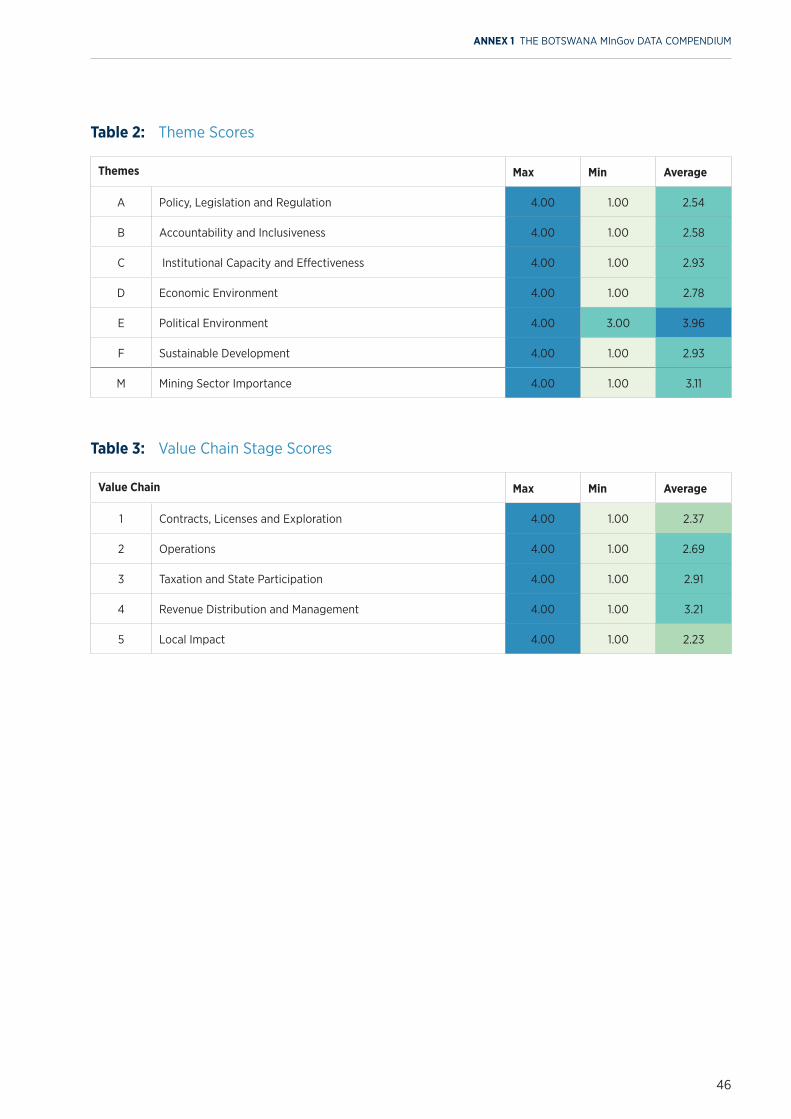
46
Themes Max Min Average
A Policy, Legislation and Regulation 4.00 1.00 2.54
B Accountability and Inclusiveness 4.00 1.00 2.58
C Institutional Capacity and Effectiveness 4.00 1.00 2.93
D Economic Environment 4.00 1.00 2.78
E Political Environment 4.00 3.00 3.96
F Sustainable Development 4.00 1.00 2.93
M Mining Sector Importance 4.00 1.00 3.11
Value Chain Max Min Average
1 Contracts, Licenses and Exploration 4.00 1.00 2.37
2 Operations 4.00 1.00 2.69
3 Taxation and State Participation 4.00 1.00 2.91
4 Revenue Distribution and Management 4.00 1.00 3.21
5 Local Impact 4.00 1.00 2.23
Table 2: Theme Scores
Table 3: Value Chain Stage Scores
ANNEX 1 THE BOTSWANA MInGov DATA COMPENDIUM
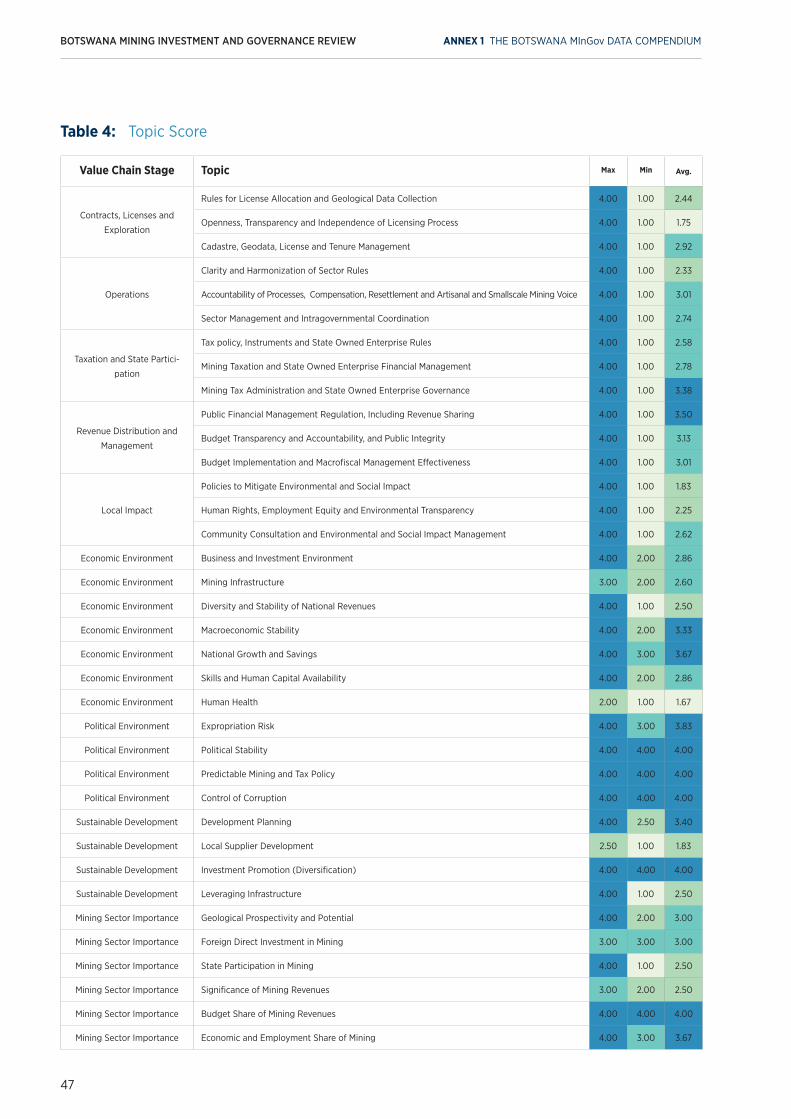
BOTSWANA MINING INVESTMENT AND GOVERNANCE REVIEW
47
Value Chain Stage Topic Max Min Avg.
Contracts, Licenses and
Exploration
Rules for License Allocation and Geological Data Collection 4.00 1.00 2.44
Openness, Transparency and Independence of Licensing Process 4.00 1.00 1.75
Cadastre, Geodata, License and Tenure Management 4.00 1.00 2.92
Operations
Clarity and Harmonization of Sector Rules 4.00 1.00 2.33
Accountability of Processes, Compensation, Resettlement and Artisanal and Smallscale Mining Voice 4.00 1.00 3.01
Sector Management and Intragovernmental Coordination 4.00 1.00 2.74
Taxation and State Partici-
pation
Tax policy, Instruments and State Owned Enterprise Rules 4.00 1.00 2.58
Mining Taxation and State Owned Enterprise Financial Management 4.00 1.00 2.78
Mining Tax Administration and State Owned Enterprise Governance 4.00 1.00 3.38
Revenue Distribution and
Management
Public Financial Management Regulation, Including Revenue Sharing 4.00 1.00 3.50
Budget Transparency and Accountability, and Public Integrity 4.00 1.00 3.13
Budget Implementation and Macrofiscal Management Effectiveness 4.00 1.00 3.01
Local Impact
Policies to Mitigate Environmental and Social Impact 4.00 1.00 1.83
Human Rights, Employment Equity and Environmental Transparency 4.00 1.00 2.25
Community Consultation and Environmental and Social Impact Management 4.00 1.00 2.62
Economic Environment Business and Investment Environment 4.00 2.00 2.86
Economic Environment Mining Infrastructure 3.00 2.00 2.60
Economic Environment Diversity and Stability of National Revenues 4.00 1.00 2.50
Economic Environment Macroeconomic Stability 4.00 2.00 3.33
Economic Environment National Growth and Savings 4.00 3.00 3.67
Economic Environment Skills and Human Capital Availability 4.00 2.00 2.86
Economic Environment Human Health 2.00 1.00 1.67
Political Environment Expropriation Risk 4.00 3.00 3.83
Political Environment Political Stability 4.00 4.00 4.00
Political Environment Predictable Mining and Tax Policy 4.00 4.00 4.00
Political Environment Control of Corruption 4.00 4.00 4.00
Sustainable Development Development Planning 4.00 2.50 3.40
Sustainable Development Local Supplier Development 2.50 1.00 1.83
Sustainable Development Investment Promotion (Diversification) 4.00 4.00 4.00
Sustainable Development Leveraging Infrastructure 4.00 1.00 2.50
Mining Sector Importance Geological Prospectivity and Potential 4.00 2.00 3.00
Mining Sector Importance Foreign Direct Investment in Mining 3.00 3.00 3.00
Mining Sector Importance State Participation in Mining 4.00 1.00 2.50
Mining Sector Importance Significance of Mining Revenues 3.00 2.00 2.50
Mining Sector Importance Budget Share of Mining Revenues 4.00 4.00 4.00
Mining Sector Importance Economic and Employment Share of Mining 4.00 3.00 3.67
Table 4: Topic Score
ANNEX 1 THE BOTSWANA MInGov DATA COMPENDIUM
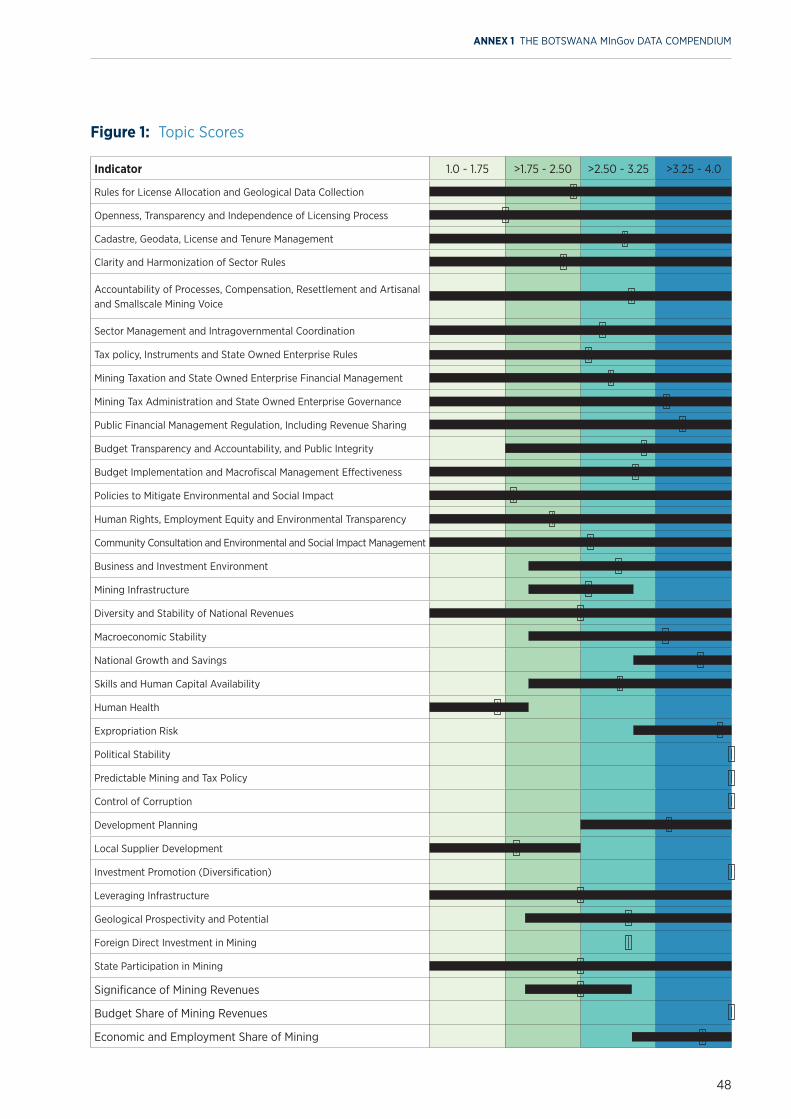
48
Figure 1: Topic Scores
ANNEX 1 THE BOTSWANA MInGov DATA COMPENDIUM
Indicator 1.0 - 1.75 >1.75 - 2.50 >2.50 - 3.25 >3.25 - 4.0
Rules for License Allocation and Geological Data Collection
Openness, Transparency and Independence of Licensing Process
Cadastre, Geodata, License and Tenure Management
Clarity and Harmonization of Sector Rules
Accountability of Processes, Compensation, Resettlement and Artisanal and Smallscale Mining Voice
Sector Management and Intragovernmental Coordination
Tax policy, Instruments and State Owned Enterprise Rules
Mining Taxation and State Owned Enterprise Financial Management
Mining Tax Administration and State Owned Enterprise Governance
Public Financial Management Regulation, Including Revenue Sharing
Budget Transparency and Accountability, and Public Integrity
Budget Implementation and Macrofiscal Management Effectiveness
Policies to Mitigate Environmental and Social Impact
Human Rights, Employment Equity and Environmental Transparency
Community Consultation and Environmental and Social Impact Management
Business and Investment Environment
Mining Infrastructure
Diversity and Stability of National Revenues
Macroeconomic Stability
National Growth and Savings
Skills and Human Capital Availability
Human Health
Expropriation Risk
Political Stability
Predictable Mining and Tax Policy
Control of Corruption
Development Planning
Local Supplier Development
Investment Promotion (Diversification)
Leveraging Infrastructure
Geological Prospectivity and Potential
Foreign Direct Investment in Mining
State Participation in Mining
Significance of Mining Revenues
Budget Share of Mining Revenues
Economic and Employment Share of Mining
BOTSWANA MINING INVESTMENT AND GOVERNANCE REVIEW
49
Them
eVa
lue
Chai
n St
age
Topi
cL5
Indi
cato
r M
axM
inAv
g.
Polic
y, L
egis
latio
n an
d
Reg
ulat
ion
Con
trac
ts, L
icen
ses
and
Expl
orat
ion
Rul
es fo
r Li
cens
e A
lloca
tion
and
Geo
logi
cal D
ata
Col
lect
ion
A1.1
Cla
rity
of R
ules
for
Lice
nse
Allo
catio
n, C
onve
rsio
n an
d Tr
ansf
er4.
00
1.00
3.25
A1.2
Geo
logi
cal D
ata
Col
lect
ion
Rul
es4.
00
4.0
04.
00
A1.3
Mod
ern
Min
ing
Cad
astr
e1.0
01.0
01.0
0
A1.4
Lice
nse
App
rova
l and
Rev
iew
Tim
efra
mes
2.50
1.00
1.50
Acc
ount
abili
ty a
nd
Incl
usiv
enes
s
Ope
nnes
s, T
rans
pare
ncy
and
Inde
pend
ence
of L
icen
sing
Proc
ess
B1.1
Ope
nnes
s an
d Tr
ansp
aren
cy o
f Lic
ensi
ng P
roce
ss4.
00
1.00
2.50
B1.2
Inde
pend
ence
of L
icen
sing
Aut
horit
y1.0
01.0
01.0
0
Inst
itutio
nal C
apac
ity a
nd
Effec
tiven
ess
Cad
astr
e, G
eoda
ta, L
icen
se a
nd
Tenu
re M
anag
emen
t
C1.1
Col
lect
ing
Geo
logi
cal I
nfor
mat
ion
4.0
01.0
02.
82
C1.2
Stat
e of
Map
ping
and
Geo
logi
cal E
xplo
ratio
n 4.
00
1.67
3.23
C1.3
Min
ing
Cad
astr
e Eff
ectiv
enes
s2.
501.0
01.7
5
C1.4
Allo
catin
g Li
cens
es E
ffec
tivel
y4.
00
3.40
3.84
C1.5
Tran
sfer
abili
ty o
f Lic
ense
s4.
00
4.0
04.
00
C1.6
Man
agin
g Li
cens
es E
ffec
tivel
y4.
00
1.00
1.90
Polic
y, L
egis
latio
n an
d
Reg
ulat
ion
Ope
ratio
ns
Cla
rity
and
Har
mon
izat
ion
of
Sect
or R
ules
A2.
1C
larit
y of
Leg
isla
tion,
Rul
es a
nd T
imef
ram
es2.
501.0
01.5
0
A2.
2H
arm
oniz
atio
n of
Leg
isla
tion
and
Gov
ernm
ent
Coo
rdin
atio
n4.
00
2.50
3.0
0
Acc
ount
abili
ty a
nd
Incl
usiv
enes
s
Acc
ount
abili
ty o
f Pro
cess
es,
Com
pens
atio
n, R
eset
tlem
ent
and
Art
isan
al a
nd S
mal
lsca
le
Min
ing
Voic
e
A2.
3Pr
ovis
ions
for
Art
isan
al a
nd S
mal
lsca
le M
inin
g2.
502.
502.
50
B2.
1A
cces
s to
Lan
d, C
ompe
nsat
ion
and
Res
ettle
men
t4.
00
1.00
2.86
B2.
2A
cces
s an
d A
ccou
ntab
ility
of M
inin
g Le
gisl
atio
n an
d Pr
oces
ses
4.0
02.
503.
16
B2.
3A
rtis
anal
and
Sm
alls
cale
Min
ing
Voic
e R
epre
sent
atio
n0.
00
0.0
0..
Inst
itutio
nal C
apac
ity a
nd
Effec
tiven
ess
Sect
or M
anag
emen
t an
d
Intr
agov
ernm
enta
l
Coo
rdin
atio
n
C2.
1Ti
mef
ram
es fo
r A
ppro
vals
4.0
01.0
02.
50
C2.
2In
trag
over
nmen
tal C
oord
inat
ion
4.0
01.0
02.
30
C2.
3Su
ppor
t to
Art
isan
al a
nd S
mal
lsca
le M
inin
g4.
00
2.50
3.43
Tabl
e 5:
In
dica
tor
Scor
es
50
ANNEX 1 THE BOTSWANA MInGov DATA COMPENDIUM
Them
eVa
lue
Chai
n St
age
Topi
cL5
Indi
cato
r M
axM
inAv
g.
Polic
y, L
egis
latio
n an
d
Reg
ulat
ion
Taxa
tion
and
Stat
e
Part
icip
atio
n
Tax
polic
y, In
stru
men
ts a
nd
Stat
e O
wne
d En
terp
rise
Rul
es
A3.
1Ta
x Po
licy
and
Inst
rum
ents
4.0
01.0
03.
00
A3.
2R
ules
for
Aud
iting
, Bas
e Er
osio
n an
d Pr
ofit
Shift
ing
4.0
01.0
03.
00
A3.
3St
ate
Ow
ned
Ente
rpris
e G
over
nanc
e R
ules
2.50
1.00
1.75
Acc
ount
abili
ty a
nd
Incl
usiv
enes
s
Min
ing
Taxa
tion
and
Stat
e
Ow
ned
Ente
rpris
e Fi
nanc
ial
Man
agem
ent
B3.
1A
ccou
ntab
ility
of M
inin
g Ta
xatio
n 4.
00
1.00
2.25
B3.
2St
ate-
Ow
ned
Ente
rpris
e Fi
nanc
ial M
anag
emen
t4.
00
2.50
3.30
Inst
itutio
nal C
apac
ity a
nd
Effec
tiven
ess
Min
ing
Tax
Adm
inis
trat
ion
and
Stat
e O
wne
d En
terp
rise
Gov
erna
nce
C3.
1M
inin
g Ta
x A
dmin
istr
atio
n4.
00
1.00
3.0
8
C3.
2St
ate-
Ow
ned
Ente
rpris
e G
over
nanc
e4.
00
2.33
3.67
Polic
y, L
egis
latio
n an
d
Reg
ulat
ion
Rev
enue
Dis
trib
utio
n
and
Man
agem
ent
Publ
ic F
inan
cial
Man
agem
ent
Reg
ulat
ion,
Incl
udin
g R
even
ue
Shar
ing
A4.
1Pu
blic
Fin
anci
al M
anag
emen
t an
d R
even
ue S
harin
g4.
00
1.00
3.0
0
A4.
2M
acro
fisca
l Man
agem
ent
Rul
es a
nd S
tabi
lizat
ion
4.0
04.
00
4.0
0
Acc
ount
abili
ty a
nd
Incl
usiv
enes
s
Bud
get
Tran
spar
ency
and
Acc
ount
abili
ty, a
nd P
ublic
Inte
grity
B4.
1B
udge
t Tr
ansp
aren
cy a
nd A
ccou
ntab
ility
3.0
03.
00
3.0
0
B4.
2Pu
blic
Inve
stm
ent
Inte
grity
4.0
01.7
53.
25
Inst
itutio
nal C
apac
ity a
nd
Effec
tiven
ess
Bud
get
Impl
emen
tatio
n an
d
Mac
rofis
cal M
anag
emen
t
Effec
tiven
ess
C4.
1B
udge
t Im
plem
enta
tion
4.0
01.0
03.
29
C4.
2La
rge
Scal
e Pu
blic
Inve
stm
ent
4.0
01.0
02.
50
C4.
3M
acro
fisca
l Man
agem
ent
and
Rev
enue
Sta
biliz
atio
n Eff
ectiv
enes
s4.
00
2.50
3.25
Polic
y, L
egis
latio
n an
d
Reg
ulat
ion
Loc
al Im
pact
Polic
ies
to M
itiga
te
Envi
ronm
enta
l and
Soci
al Im
pact
A5.
1C
omm
unity
Impa
ct, C
onsu
ltatio
n an
d C
orpo
rate
Soc
ial R
espo
nsib
ility
2.50
1.00
1.50
A5.
2R
ules
for
Envi
ronm
enta
l and
Soc
ial I
mpa
ct M
anag
emen
t4.
00
1.00
3.0
0
A5.
3R
ules
for
Fina
ncia
l Sur
etie
s fo
r D
ecom
mis
sion
ing
1.00
1.00
1.00
Acc
ount
abili
ty a
nd
Incl
usiv
enes
s
Hum
an R
ight
s, E
mpl
oym
ent
Equi
ty a
nd E
nviro
nmen
tal
Tran
spar
ency
B5.
1H
uman
Rig
hts
and
Empl
oym
ent
Equi
ty4.
00
1.00
2.0
0
B5.
2En
viro
nmen
tal a
nd S
ocia
l Im
pact
Tra
nspa
renc
y4.
00
1.00
2.50
Inst
itutio
nal C
apac
ity a
nd
Effec
tiven
ess
Com
mun
ity C
onsu
ltatio
n an
d
Envi
ronm
enta
l and
Soc
ial
Impa
ct M
anag
emen
t
C5.
1Im
pact
and
Com
mun
ity C
onsu
ltatio
n4.
00
1.75
2.67
C5.
2En
viro
nmen
tal a
nd S
ocia
l Im
pact
Man
agem
ent
Effec
tiven
ess
4.0
01.0
02.
58
C5.
3Eff
ectiv
enes
s of
Sur
etie
s fo
r D
ecom
mis
sion
ing
0.0
00.
00
..
BOTSWANA MINING INVESTMENT AND GOVERNANCE REVIEW
51
Valu
e Ch
ain
Stag
e L5
Indi
cato
r M
axM
inAv
g.
Econ
omic
Env
ironm
ent
D1.1
Bus
ines
s an
d In
vest
men
t En
viro
nmen
t4.
00
2.0
02.
86
D2.
1M
inin
g In
fras
truc
ture
3.0
02.
00
2.60
D3.
1D
iver
sity
and
Sta
bilit
y of
Nat
iona
l Rev
enue
s4.
00
1.00
2.50
D4.
1M
acro
econ
omic
Sta
bilit
y4.
00
2.0
03.
33
D5.
1N
atio
nal G
row
th a
nd S
avin
gs4.
00
3.0
03.
67
D6.
1Sk
ills
and
Hum
an C
apita
l Ava
ilabi
lity
4.0
02.
00
2.86
D7.
1H
uman
Hea
lth2.
00
1.00
1.67
Polit
ical
Env
ironm
ent
E1.1
Expr
opria
tion
Ris
k4.
00
3.0
03.
83
E2.1
Polit
ical
Sta
bilit
y4.
00
4.0
04.
00
E3.1
Pred
icta
ble
Min
ing
and
Tax
Polic
y4.
00
4.0
04.
00
E4.1
Con
trol
of C
orru
ptio
n4.
00
4.0
04.
00
Sust
aina
ble
Dev
elop
men
t
F1.1
Dev
elop
men
t Pl
anni
ng4.
00
2.50
3.40
F2.1
Loca
l Sup
plie
r D
evel
opm
ent
2.50
1.00
1.83
F3.1
Inve
stm
ent
Prom
otio
n (D
iver
sific
atio
n)4.
00
4.0
04.
00
F4.1
Leve
ragi
ng In
fras
truc
ture
4.0
01.0
02.
50
Min
ing
Sect
or Im
port
ance
M1.1
Geo
logi
cal P
rosp
ectiv
ity a
nd P
oten
tial
4.0
02.
00
3.0
0
M2.
1Fo
reig
n D
irect
Inve
stm
ent
in M
inin
g3.
00
3.0
03.
00
M3.
1St
ate
Part
icip
atio
n in
Min
ing
4.0
01.0
02.
50
M4.
1Si
gnifi
canc
e of
Min
ing
Rev
enue
s3.
00
2.0
02.
50
M5.
1B
udge
t Sh
are
of M
inin
g R
even
ues
4.0
04.
00
4.0
0
M6.
1Ec
onom
ic a
nd E
mpl
oym
ent
Shar
e of
Min
ing
4.0
03.
00
3.67
Tabl
e 5:
In
dica
tor
Scor
es (
cont
inue
d)
52
ANNEX 1 THE BOTSWANA MInGov DATA COMPENDIUM
Underlying Indicators 1.0 - 1.75 >1.75 - 2.50 >2.50 - 3.25 >3.25 - 4.0
Clarity of Rules for License Allocation, Conversion and Transfer
Geological Data Collection Rules
Modern Mining Cadastre
License Approval and Review Timeframes
Openness and Transparency of Licensing Process
Independence of Licensing Authority
Collecting Geological Information
State of Mapping and Geological Exploration
Mining Cadastre Effectiveness
Allocating Licenses Effectively
Transferability of Licenses
Managing Licenses Effectively
Clarity of Legislation, Rules and Timeframes
Harmonization of Legislation and Government Coordination
Provisions for Artisanal and Smallscale Mining
Access to Land, Compensation and Resettlement
Access and Accountability of Mining Legislation and Processes
Artisanal and Smallscale Mining Voice Representation
Timeframes for Approvals
Intragovernmental Coordination
Support to Artisanal and Smallscale Mining
Tax Policy and Instruments
Rules for Auditing, Base Erosion and Profit Shifting
State Owned Enterprise Governance Rules
Accountability of Mining Taxation
State-Owned Enterprise Financial Management
Mining Tax Administration
State-Owned Enterprise Governance
Public Financial Management and Revenue Sharing
Macrofiscal Management Rules and Stabilization
Budget Transparency and Accountability
Public Investment Integrity
Figure 2: Indicator Scores
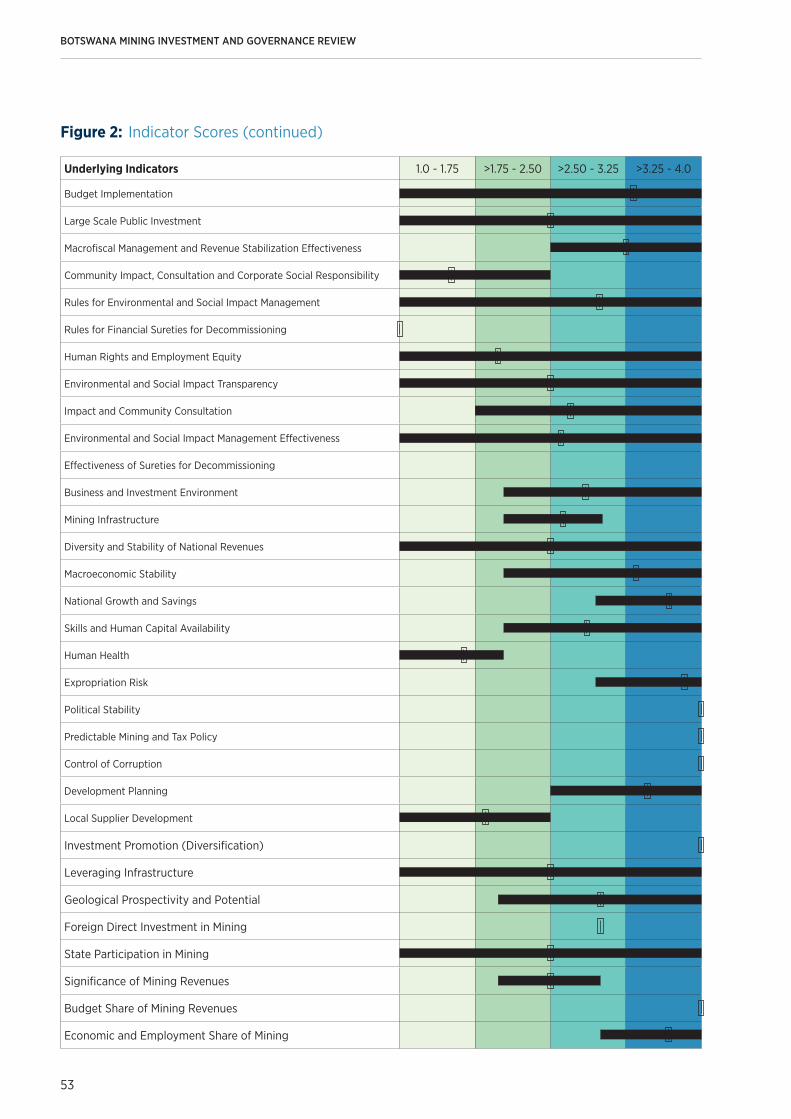
BOTSWANA MINING INVESTMENT AND GOVERNANCE REVIEW
53
Underlying Indicators 1.0 - 1.75 >1.75 - 2.50 >2.50 - 3.25 >3.25 - 4.0
Budget Implementation
Large Scale Public Investment
Macrofiscal Management and Revenue Stabilization Effectiveness
Community Impact, Consultation and Corporate Social Responsibility
Rules for Environmental and Social Impact Management
Rules for Financial Sureties for Decommissioning
Human Rights and Employment Equity
Environmental and Social Impact Transparency
Impact and Community Consultation
Environmental and Social Impact Management Effectiveness
Effectiveness of Sureties for Decommissioning
Business and Investment Environment
Mining Infrastructure
Diversity and Stability of National Revenues
Macroeconomic Stability
National Growth and Savings
Skills and Human Capital Availability
Human Health
Expropriation Risk
Political Stability
Predictable Mining and Tax Policy
Control of Corruption
Development Planning
Local Supplier Development
Investment Promotion (Diversification)
Leveraging Infrastructure
Geological Prospectivity and Potential
Foreign Direct Investment in Mining
State Participation in Mining
Significance of Mining Revenues
Budget Share of Mining Revenues
Economic and Employment Share of Mining
Figure 2: Indicator Scores (continued)

54
ANNEX 1 THE BOTSWANA MInGov DATA COMPENDIUM
Figu
re 3
: St
akeh
olde
r pr
iorit
isat
ion,
Gov
ernm
ent
Cla
rity
and
Har
mon
izat
ion
of S
ecto
r R
ules
Accountability of Processes, Compensation, Resettlement and
Artisanal and Small-scale Mining Voice
Sect
or M
anag
emen
t an
d
Intr
agov
ernm
enta
l Coo
rdin
atio
n
Ope
ratio
ns Cad
astr
e, G
eoda
ta, L
icen
se
and
Tenu
re M
anag
emen
t
Ope
nnes
s, T
rans
pare
ncy
an
d In
depe
nden
ce o
f Li
cens
ing
Proc
ess
Rul
es fo
r Li
cens
e A
lloca
tion
and
Geo
grap
hica
l Dat
a C
olle
ctio
n
Cont
ract
s, L
icen
ses
and
Expl
orat
ion
Hum
an H
ealth
Skill
s an
d H
uman
Cap
ital
Ava
ilabi
lity
Econ
omic
Env
ironm
ent
Bus
ines
s an
d
Inve
stm
ent
En
viro
nmen
tM
acro
econ
omic
St
abili
tyNational Growth
and Savings
Div
ersi
ty a
nd S
tabi
lity
of N
atio
nal R
even
ues
Min
ing
Infr
astr
uctu
re
Dev
elop
men
t Pl
anni
ng
Inve
stm
ent
Prom
otio
n
(Div
ersi
ficat
ion)
Leve
ragi
ng
Infr
astr
uctu
re
Loca
l Sup
plie
r D
evel
opm
ent
Sust
aina
ble
Dev
elop
men
t
Com
mun
ity C
onsu
ltatio
n an
d
Envi
ronm
enta
l and
So
cial
Impa
ct M
anag
emen
t
Polic
ies
to M
itiga
te
Envi
ronm
enta
l and
Soc
ial
Impa
ct
Human Rights, Employment Equity and
Environmental Transparency
Loca
l Im
pact
Con
trol
of
Cor
rupt
ion
Political Stability
Predictable Mining and Tax Policy
Expr
opria
tion
Ris
k
Polit
ical
Envi
ronm
ent
Min
ing
Tax
Adm
in-
istr
atio
n an
d St
ate
Ow
ned
Ente
rpris
e G
over
nanc
e
Min
ing
Taxa
tion
and
Stat
e O
wne
d En
terp
rise
Fina
ncia
l M
anag
emen
t
Tax
polic
y, In
stru
-m
ents
and
Sta
te
Ow
ned
Ente
rpris
e R
ules
Taxa
tion
and
St
ate
Pa
rtic
ipat
ion
Bud
get
Impl
emen
tatio
n an
d M
ac-
rofis
cal M
anag
emen
t Eff
ectiv
enes
s
Bud
get
Tran
spar
ency
and
Acc
ount
a-bi
lity,
and
Pub
lic In
tegr
ity
Publ
ic F
inan
cial
Man
agem
ent
Reg
u-la
tion,
Incl
udin
g R
even
ue S
harin
g
Reve
nue
Dis
trib
utio
n
and
Man
agem
ent
Not
e: T
he F
igur
e 3
tree
map
refle
cts
the
impo
rtan
ce o
f eac
h M
InG
ov to
pic
for
stak
ehol
ders
, the
siz
e of
the
rect
angl
e is
pro
port
iona
te to
its
impo
rtan
ce a
s a
prio
rity
for
stak
ehol
ders
. Col
ours
refle
ct M
InG
ov s
core
s.
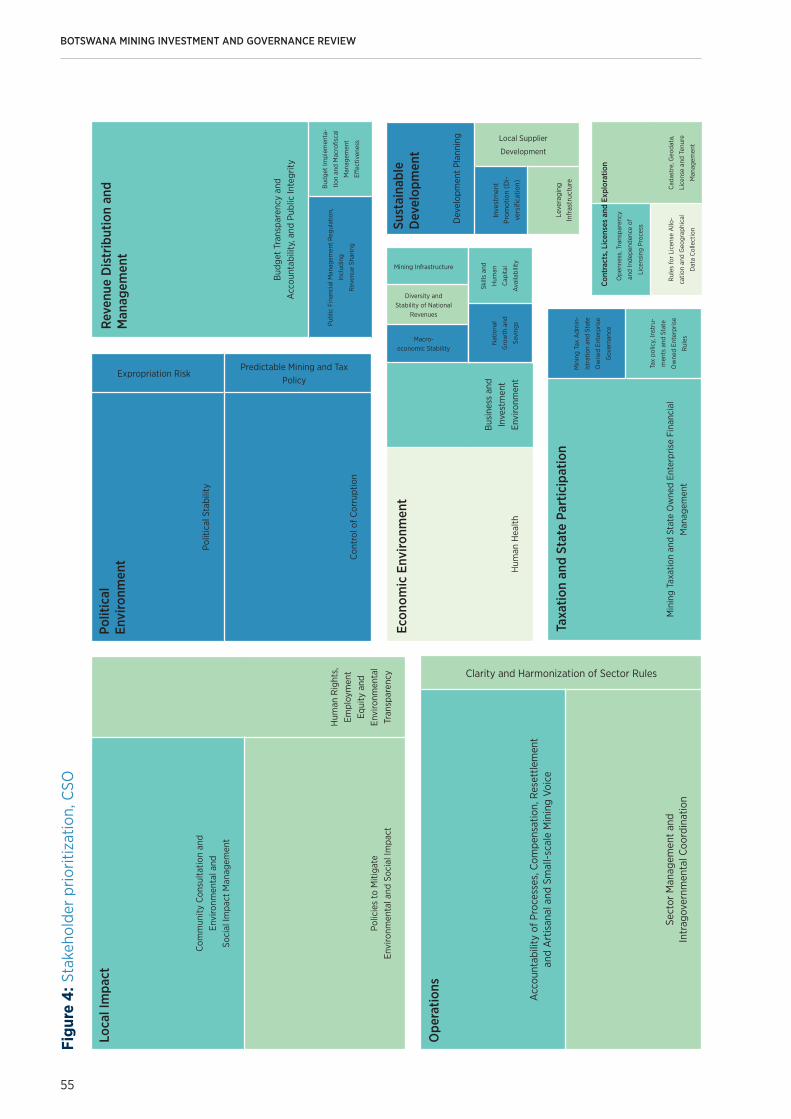
BOTSWANA MINING INVESTMENT AND GOVERNANCE REVIEW
55
Com
mun
ity C
onsu
ltatio
n an
d
Envi
ronm
enta
l and
So
cial
Impa
ct M
anag
emen
t
Hum
an R
ight
s,
Empl
oym
ent
Equi
ty a
nd
Envi
ronm
enta
l Tr
ansp
aren
cyPo
licie
s to
Miti
gate
En
viro
nmen
tal a
nd S
ocia
l Im
pact
Loca
l Im
pact
Figu
re 4
: Sta
keho
lder
prio
ritiz
atio
n, C
SO
Acc
ount
abili
ty o
f Pro
cess
es, C
ompe
nsat
ion,
Res
ettle
men
t
and
Art
isan
al a
nd S
mal
l-sc
ale
Min
ing
Voic
e
Clarity and Harmonization of Sector RulesSe
ctor
Man
agem
ent
and
In
trag
over
nmen
tal C
oord
inat
ion
Ope
ratio
ns
Polit
ical
Sta
bilit
y
Expropriation Risk
Con
trol
of C
orru
ptio
n
Predictable Mining and Tax Policy
Polit
ical
Envi
ronm
ent
Hum
an H
ealth
Bus
ines
s an
d In
vest
men
t
Envi
ronm
ent
Macro- economic Stability
Diversity and Stability of National
Revenues
Mining Infrastructure
Nat
iona
l
Gro
wth
and
Savi
ngs
Skill
s an
d
Hum
an
Cap
ital
Ava
ilabi
lity
Econ
omic
Env
ironm
ent
Min
ing
Taxa
tion
and
Stat
e O
wne
d En
terp
rise
Fina
ncia
l M
anag
emen
t
Min
ing
Tax
Adm
in-
istr
atio
n an
d St
ate
Ow
ned
Ente
rpris
e
Gov
erna
nce
Tax
polic
y, In
stru
-
men
ts a
nd S
tate
Ow
ned
Ente
rpris
e
Rul
es
Taxa
tion
and
Stat
e Pa
rtic
ipat
ion
Bud
get
Tran
spar
ency
and
A
ccou
ntab
ility
, and
Pub
lic In
tegr
ity
Publ
ic F
inan
cial
Man
agem
ent
Reg
ulat
ion,
Incl
udin
g
Rev
enue
Sha
ring
Bud
get
Impl
emen
ta-
tion
and
Mac
rofis
cal
Man
agem
ent
Effec
tiven
ess
Reve
nue
Dis
trib
utio
n an
d M
anag
emen
t
Dev
elop
men
t Pl
anni
ng
Inve
stm
ent
Prom
otio
n (D
i-ve
rsifi
catio
n)
Local Supplier
Development
Leve
ragi
ng
Infr
astr
uctu
re
Sust
aina
ble
D
evel
opm
ent
O
penn
ess,
Tra
nspa
renc
y
and
Inde
pend
ence
of
Lice
nsin
g Pr
oces
s
Cad
astr
e, G
eoda
ta,
Lice
nse
and
Tenu
re
Man
agem
ent
Rul
es fo
r Li
cens
e A
llo-
catio
n an
d G
eogr
aphi
cal
Dat
a C
olle
ctio
n
Cont
ract
s, L
icen
ses
and
Expl
orat
ion
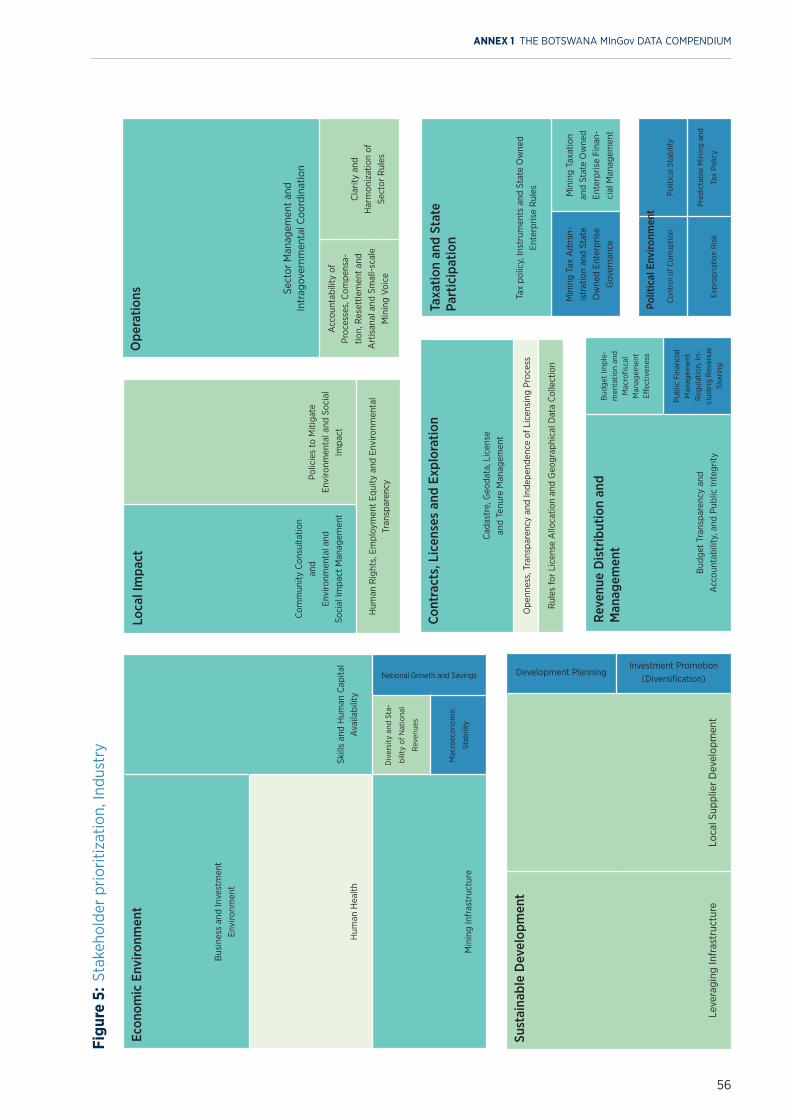
56
Tax
polic
y, In
stru
men
ts a
nd S
tate
Ow
ned
Ente
rpris
e R
ules
Min
ing
Tax
Adm
in-
istr
atio
n an
d St
ate
Ow
ned
Ente
rpris
e G
over
nanc
e
Min
ing
Taxa
tion
and
Stat
e O
wne
d En
terp
rise
Fina
n-ci
al M
anag
emen
t
Figu
re 5
: St
akeh
olde
r pr
iorit
izat
ion,
Indu
stry
Bus
ines
s an
d In
vest
men
t
Envi
ronm
ent
Skill
s an
d H
uman
Cap
ital
Ava
ilabi
lity
Hum
an H
ealth
Min
ing
Infr
astr
uctu
re
Div
ersi
ty a
nd S
ta-
bilit
y of
Nat
iona
l
Rev
enue
s
National Growth and Savings
Mac
roec
onom
ic
Stab
ility
Econ
omic
Env
ironm
ent
Leve
ragi
ng In
fras
truc
ture
Lo
cal S
uppl
ier
Dev
elop
men
t
Development PlanningInvestment Promotion
(Diversification)
Sust
aina
ble
Dev
elop
men
t
Com
mun
ity C
onsu
ltatio
n an
d
Envi
ronm
enta
l and
So
cial
Impa
ct M
anag
emen
t
Polic
ies
to M
itiga
te
Envi
ronm
enta
l and
Soc
ial
Impa
ct
Hum
an R
ight
s, E
mpl
oym
ent
Equi
ty a
nd E
nviro
nmen
tal
Tran
spar
ency
Loca
l Im
pact
Taxa
tion
and
Stat
e
Part
icip
atio
n
Cad
astr
e, G
eoda
ta, L
icen
se
and
Tenu
re M
anag
emen
t
Ope
nnes
s, T
rans
pare
ncy
and
Inde
pend
ence
of L
icen
sing
Pro
cess
Rul
es fo
r Li
cens
e A
lloca
tion
and
Geo
grap
hica
l Dat
a C
olle
ctio
n
Cont
ract
s, L
icen
ses
and
Expl
orat
ion
Bud
get
Tran
spar
ency
and
A
ccou
ntab
ility
, and
Pub
lic In
tegr
ity
Bud
get
Impl
e-m
enta
tion
and
Mac
rofis
cal
Man
agem
ent
Effec
tiven
ess
Publ
ic F
inan
cial
M
anag
emen
t R
egul
atio
n, In
-cl
udin
g R
even
ue
Shar
ing
Reve
nue
Dis
trib
utio
n an
d M
anag
emen
t
Sect
or M
anag
emen
t an
d
Intr
agov
ernm
enta
l Coo
rdin
atio
n
Acc
ount
abili
ty o
f Pr
oces
ses,
Com
pens
a-tio
n, R
eset
tlem
ent
and
Art
isan
al a
nd S
mal
l-sc
ale
Min
ing
Voic
e
Cla
rity
and
H
arm
oniz
atio
n of
Se
ctor
Rul
es
Ope
ratio
ns Con
trol
of C
orru
ptio
nPo
litic
al S
tabi
lity
Expr
opria
tion
Ris
k
Pred
icta
ble
Min
ing
and
Tax
Polic
y
Polit
ical
Env
ironm
ent
ANNEX 1 THE BOTSWANA MInGov DATA COMPENDIUM
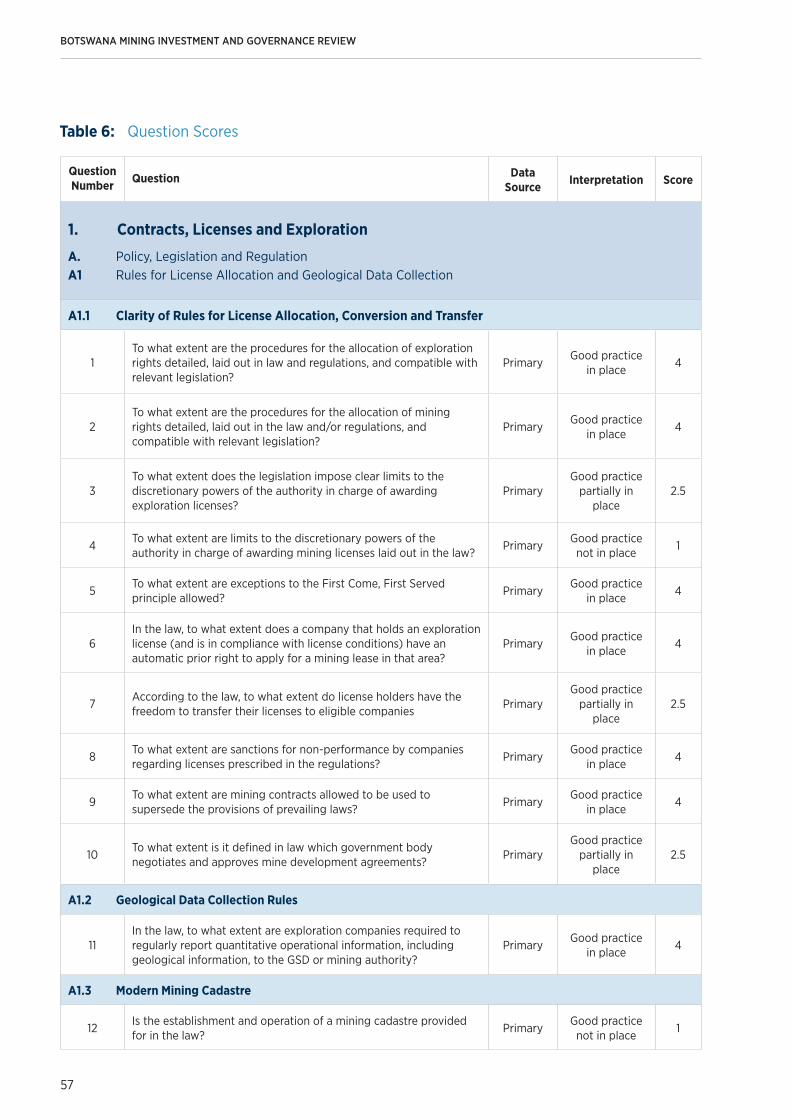
BOTSWANA MINING INVESTMENT AND GOVERNANCE REVIEW
57
Question Number Question Data
Source Interpretation Score
1. Contracts, Licenses and Exploration
A. Policy, Legislation and Regulation A1 Rules for License Allocation and Geological Data Collection
A1.1 Clarity of Rules for License Allocation, Conversion and Transfer
1To what extent are the procedures for the allocation of exploration rights detailed, laid out in law and regulations, and compatible with relevant legislation?
PrimaryGood practice
in place4
2To what extent are the procedures for the allocation of mining rights detailed, laid out in the law and/or regulations, and compatible with relevant legislation?
PrimaryGood practice
in place4
3To what extent does the legislation impose clear limits to the discretionary powers of the authority in charge of awarding exploration licenses?
PrimaryGood practice
partially in place
2.5
4To what extent are limits to the discretionary powers of the authority in charge of awarding mining licenses laid out in the law?
PrimaryGood practice not in place
1
5To what extent are exceptions to the First Come, First Served principle allowed?
PrimaryGood practice
in place4
6In the law, to what extent does a company that holds an exploration license (and is in compliance with license conditions) have an automatic prior right to apply for a mining lease in that area?
PrimaryGood practice
in place4
7According to the law, to what extent do license holders have the freedom to transfer their licenses to eligible companies
PrimaryGood practice
partially in place
2.5
8To what extent are sanctions for non-performance by companies regarding licenses prescribed in the regulations?
PrimaryGood practice
in place4
9To what extent are mining contracts allowed to be used to supersede the provisions of prevailing laws?
PrimaryGood practice
in place4
10To what extent is it defined in law which government body negotiates and approves mine development agreements?
PrimaryGood practice
partially in place
2.5
A1.2 Geological Data Collection Rules
11In the law, to what extent are exploration companies required to regularly report quantitative operational information, including geological information, to the GSD or mining authority?
PrimaryGood practice
in place4
A1.3 Modern Mining Cadastre
12Is the establishment and operation of a mining cadastre provided for in the law?
PrimaryGood practice not in place
1
Table 6: Question Scores
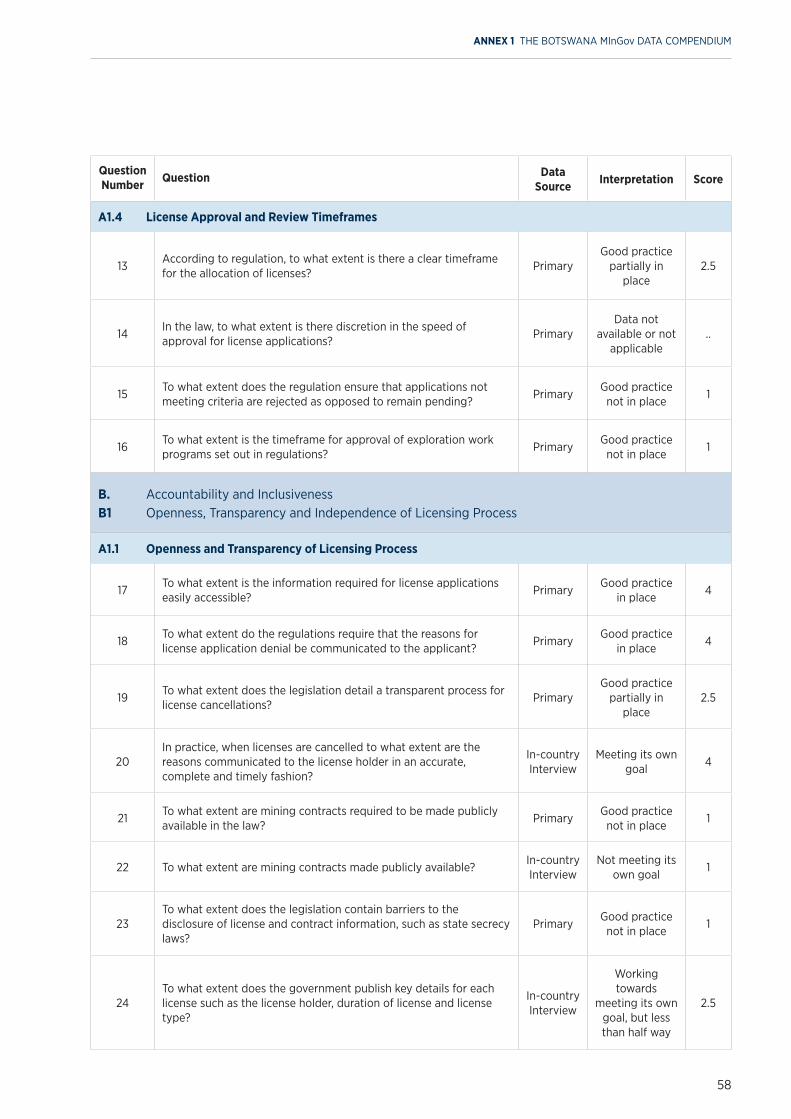
58
Question Number Question Data
Source Interpretation Score
A1.4 License Approval and Review Timeframes
13According to regulation, to what extent is there a clear timeframe for the allocation of licenses?
PrimaryGood practice
partially in place
2.5
14In the law, to what extent is there discretion in the speed of approval for license applications?
PrimaryData not
available or not applicable
..
15To what extent does the regulation ensure that applications not meeting criteria are rejected as opposed to remain pending?
PrimaryGood practice not in place
1
16To what extent is the timeframe for approval of exploration work programs set out in regulations?
PrimaryGood practice not in place
1
B. Accountability and InclusivenessB1 Openness, Transparency and Independence of Licensing Process
A1.1 Openness and Transparency of Licensing Process
17To what extent is the information required for license applications easily accessible?
PrimaryGood practice
in place4
18To what extent do the regulations require that the reasons for license application denial be communicated to the applicant?
PrimaryGood practice
in place4
19To what extent does the legislation detail a transparent process for license cancellations?
PrimaryGood practice
partially in place
2.5
20In practice, when licenses are cancelled to what extent are the reasons communicated to the license holder in an accurate, complete and timely fashion?
In-country Interview
Meeting its own goal
4
21To what extent are mining contracts required to be made publicly available in the law?
PrimaryGood practice not in place
1
22 To what extent are mining contracts made publicly available?In-country Interview
Not meeting its own goal
1
23To what extent does the legislation contain barriers to the disclosure of license and contract information, such as state secrecy laws?
PrimaryGood practice not in place
1
24To what extent does the government publish key details for each license such as the license holder, duration of license and license type?
In-country Interview
Working towards
meeting its own goal, but less than half way
2.5
ANNEX 1 THE BOTSWANA MInGov DATA COMPENDIUM
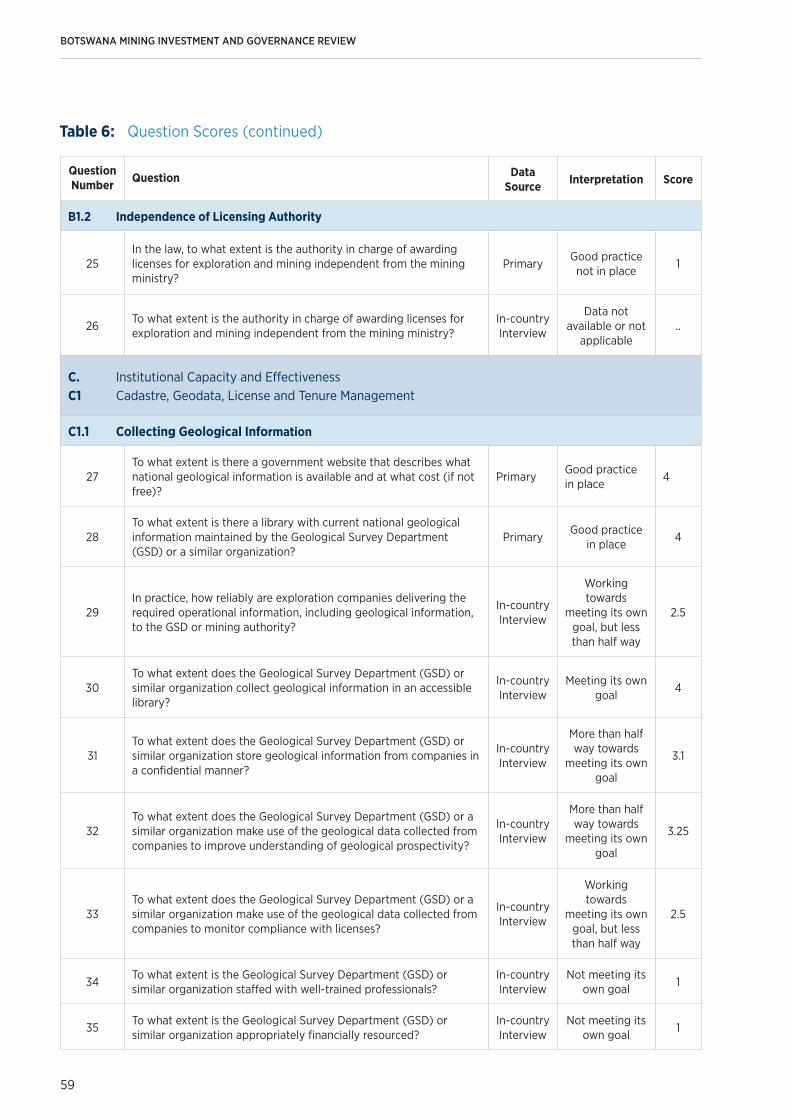
BOTSWANA MINING INVESTMENT AND GOVERNANCE REVIEW
59
Question Number Question Data
Source Interpretation Score
B1.2 Independence of Licensing Authority
25In the law, to what extent is the authority in charge of awarding licenses for exploration and mining independent from the mining ministry?
PrimaryGood practice not in place
1
26To what extent is the authority in charge of awarding licenses for exploration and mining independent from the mining ministry?
In-country Interview
Data not available or not
applicable..
C. Institutional Capacity and Effectiveness C1 Cadastre, Geodata, License and Tenure Management
C1.1 Collecting Geological Information
27To what extent is there a government website that describes what national geological information is available and at what cost (if not free)?
PrimaryGood practice in place
4
28To what extent is there a library with current national geological information maintained by the Geological Survey Department (GSD) or a similar organization?
PrimaryGood practice
in place4
29In practice, how reliably are exploration companies delivering the required operational information, including geological information, to the GSD or mining authority?
In-country Interview
Working towards
meeting its own goal, but less than half way
2.5
30To what extent does the Geological Survey Department (GSD) or similar organization collect geological information in an accessible library?
In-country Interview
Meeting its own goal
4
31To what extent does the Geological Survey Department (GSD) or similar organization store geological information from companies in a confidential manner?
In-country Interview
More than half way towards
meeting its own goal
3.1
32To what extent does the Geological Survey Department (GSD) or a similar organization make use of the geological data collected from companies to improve understanding of geological prospectivity?
In-country Interview
More than half way towards
meeting its own goal
3.25
33To what extent does the Geological Survey Department (GSD) or a similar organization make use of the geological data collected from companies to monitor compliance with licenses?
In-country Interview
Working towards
meeting its own goal, but less than half way
2.5
34To what extent is the Geological Survey Department (GSD) or similar organization staffed with well-trained professionals?
In-country Interview
Not meeting its own goal
1
35To what extent is the Geological Survey Department (GSD) or similar organization appropriately financially resourced?
In-country Interview
Not meeting its own goal
1
Table 6: Question Scores (continued)
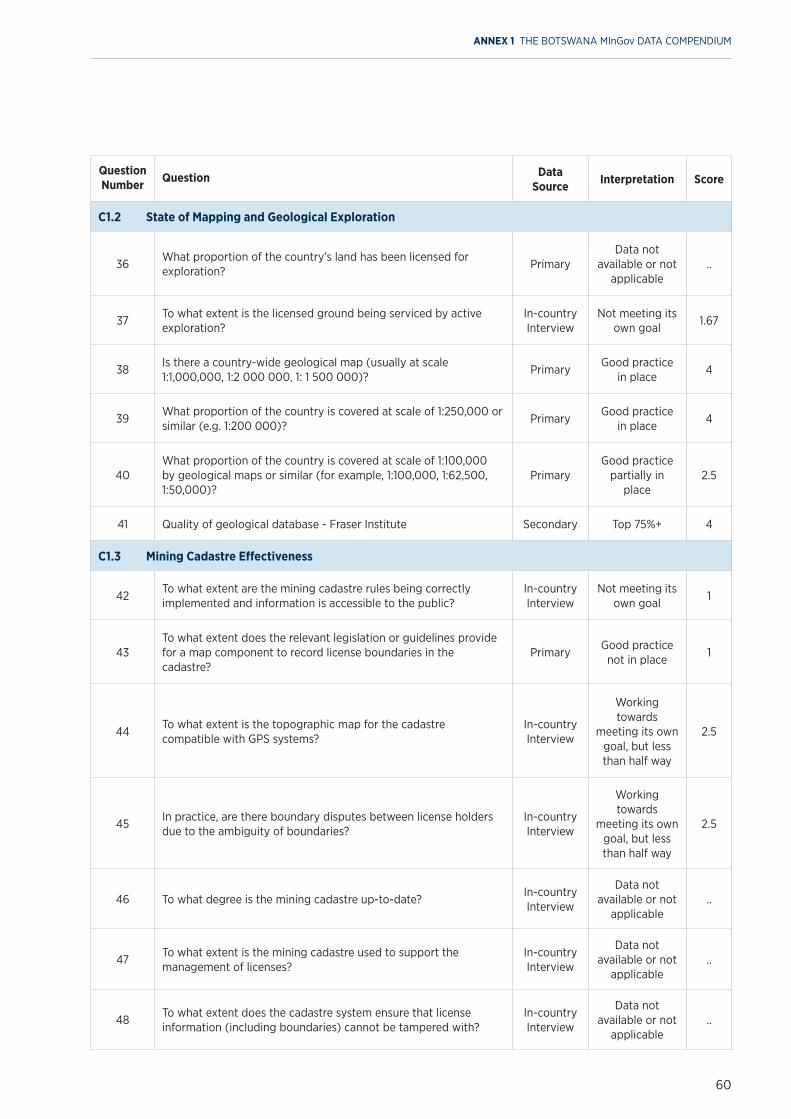
60
Question Number Question Data
Source Interpretation Score
C1.2 State of Mapping and Geological Exploration
36What proportion of the country’s land has been licensed for exploration?
PrimaryData not
available or not applicable
..
37To what extent is the licensed ground being serviced by active exploration?
In-country Interview
Not meeting its own goal
1.67
38Is there a country-wide geological map (usually at scale 1:1,000,000, 1:2 000 000, 1: 1 500 000)?
PrimaryGood practice
in place4
39What proportion of the country is covered at scale of 1:250,000 or similar (e.g. 1:200 000)?
PrimaryGood practice
in place4
40What proportion of the country is covered at scale of 1:100,000 by geological maps or similar (for example, 1:100,000, 1:62,500, 1:50,000)?
PrimaryGood practice
partially in place
2.5
41 Quality of geological database - Fraser Institute Secondary Top 75%+ 4
C1.3 Mining Cadastre Effectiveness
42To what extent are the mining cadastre rules being correctly implemented and information is accessible to the public?
In-country Interview
Not meeting its own goal
1
43To what extent does the relevant legislation or guidelines provide for a map component to record license boundaries in the cadastre?
PrimaryGood practice not in place
1
44To what extent is the topographic map for the cadastre compatible with GPS systems?
In-country Interview
Working towards
meeting its own goal, but less than half way
2.5
45In practice, are there boundary disputes between license holders due to the ambiguity of boundaries?
In-country Interview
Working towards
meeting its own goal, but less than half way
2.5
46 To what degree is the mining cadastre up-to-date?In-country Interview
Data not available or not
applicable..
47To what extent is the mining cadastre used to support the management of licenses?
In-country Interview
Data not available or not
applicable..
48To what extent does the cadastre system ensure that license information (including boundaries) cannot be tampered with?
In-country Interview
Data not available or not
applicable..
ANNEX 1 THE BOTSWANA MInGov DATA COMPENDIUM
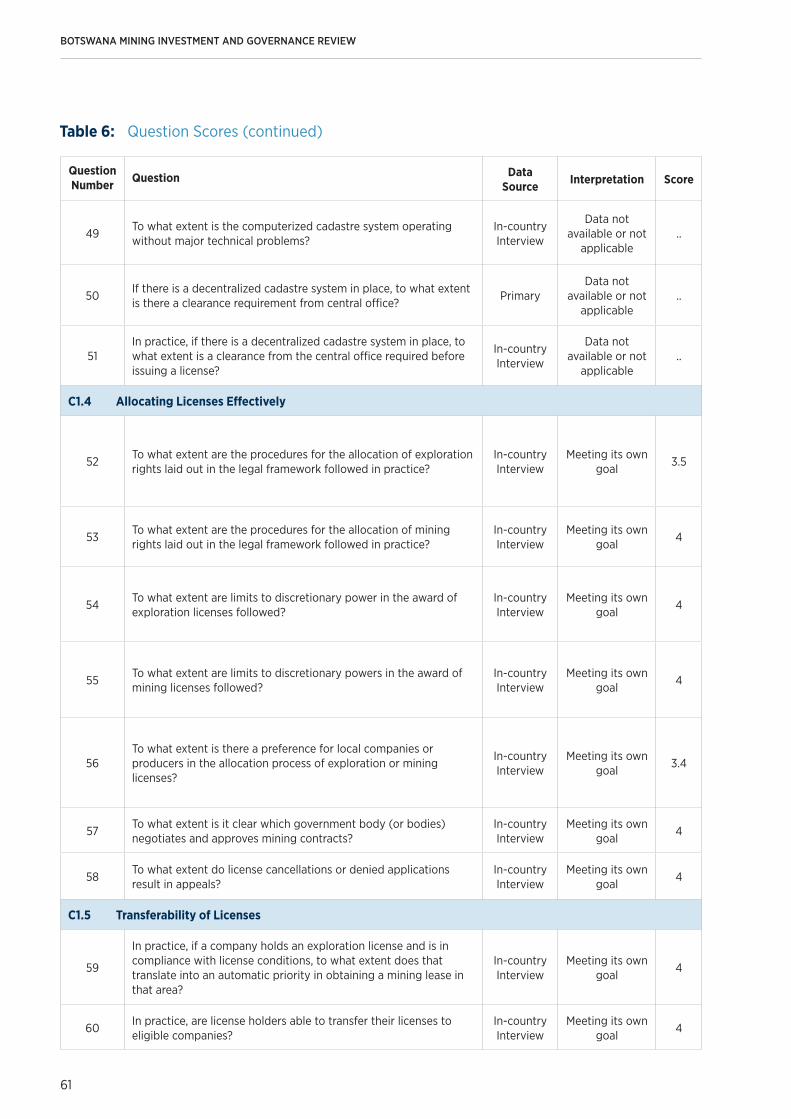
BOTSWANA MINING INVESTMENT AND GOVERNANCE REVIEW
61
Question Number Question Data
Source Interpretation Score
49To what extent is the computerized cadastre system operating without major technical problems?
In-country Interview
Data not available or not
applicable..
50If there is a decentralized cadastre system in place, to what extent is there a clearance requirement from central office?
PrimaryData not
available or not applicable
..
51In practice, if there is a decentralized cadastre system in place, to what extent is a clearance from the central office required before issuing a license?
In-country Interview
Data not available or not
applicable..
C1.4 Allocating Licenses Effectively
52To what extent are the procedures for the allocation of exploration rights laid out in the legal framework followed in practice?
In-country Interview
Meeting its own goal
3.5
53To what extent are the procedures for the allocation of mining rights laid out in the legal framework followed in practice?
In-country Interview
Meeting its own goal
4
54To what extent are limits to discretionary power in the award of exploration licenses followed?
In-country Interview
Meeting its own goal
4
55To what extent are limits to discretionary powers in the award of mining licenses followed?
In-country Interview
Meeting its own goal
4
56To what extent is there a preference for local companies or producers in the allocation process of exploration or mining licenses?
In-country Interview
Meeting its own goal
3.4
57To what extent is it clear which government body (or bodies) negotiates and approves mining contracts?
In-country Interview
Meeting its own goal
4
58To what extent do license cancellations or denied applications result in appeals?
In-country Interview
Meeting its own goal
4
C1.5 Transferability of Licenses
59
In practice, if a company holds an exploration license and is in compliance with license conditions, to what extent does that translate into an automatic priority in obtaining a mining lease in that area?
In-country Interview
Meeting its own goal
4
60In practice, are license holders able to transfer their licenses to eligible companies?
In-country Interview
Meeting its own goal
4
Table 6: Question Scores (continued)
62
Question Number Question Data
Source Interpretation Score
C1.6 Managing Licenses Effectively
61To what extent are the legislated timeframes for license application and allocation followed?
In-country Interview
Not meeting its own goal
1.75
62To what extent is the cadastre system mostly free of long-standing pending applications?
In-country Interview
Data not available or not
applicable..
63In the case of FCFS (First Come, First Served), to what extent are applications time-stamped as they are received?
In-country Interview
Meeting its own goal
4
64To what extent are the sanctions regarding licenses for non-performance by companies enforced?
In-country Interview
Working towards
meeting its own goal, but less than half way
2.5
65To what extent are the timelines for deciding on exploration and/or mining rights applications compatible with the timelines of other required permits?
In-country Interview
Not meeting its own goal
1
66To what extent is the timeframe for the approval of exploration work programs followed?
In-country Interview
Data not available or not
applicable..
67To what extent is the unit managing the monitoring of licenses staffed appropriately to perform its duties?
In-country Interview
Not meeting its own goal
1.15
68To what extent is the unit managing the monitoring of licenses receiving an adequate operational budget to perform its duties?
In-country Interview
Not meeting its own goal
1
69In practice, how long does the approval for exploration license applications take?
In-country Interview
Data not available or not
applicable..
2. Operations
A. Policy, Legislation and Regulation A2 Clarity and Harmonization of Sector Rules
A2.1 Clarity of Legislation, Rules and Timeframes
70To what extent do regulations cover all relevant mining procedures (exploration, license issuance, work programs, mines inspection, health and safety, explosives, emergency, mine closure, etc.)?
PrimaryGood practice
partially in place
2.5
71To what extent is the timeframe for the approval of mine development plans set out in the regulations?
PrimaryGood practice not in place
1
72To what extent is the timeframe for the approval of extensions of mining operations set out in the regulations?
PrimaryGood practice not in place
1
ANNEX 1 THE BOTSWANA MInGov DATA COMPENDIUM
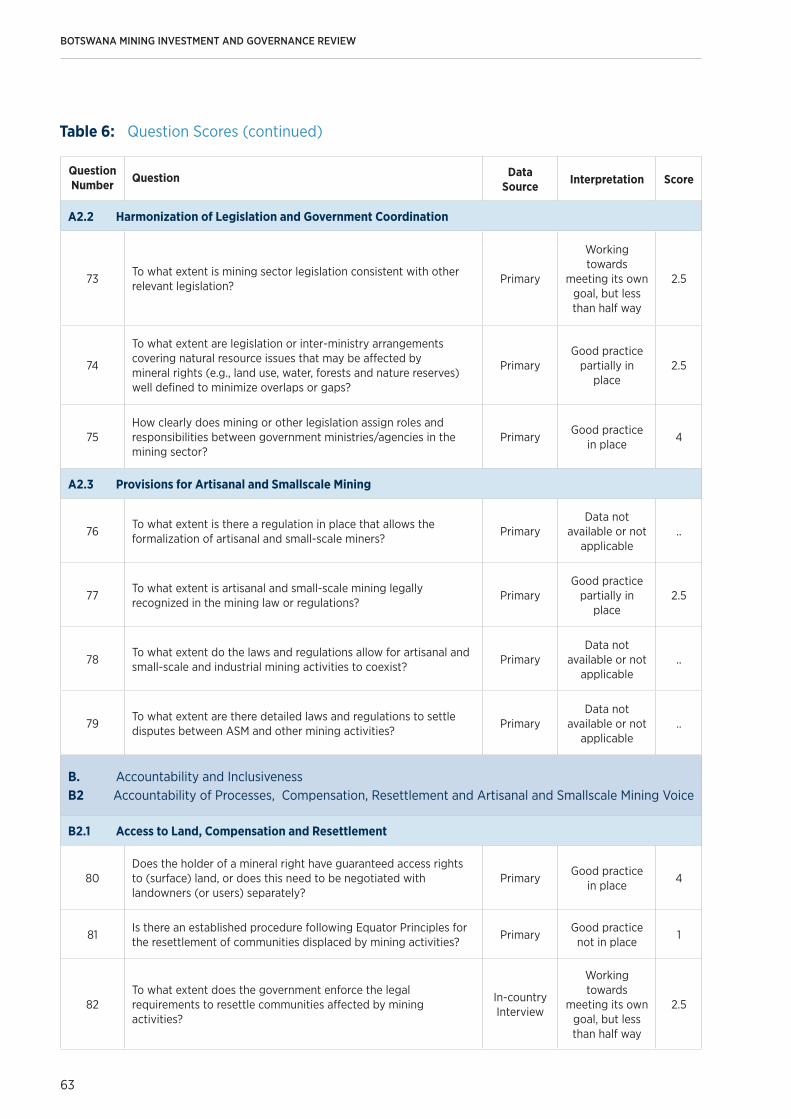
BOTSWANA MINING INVESTMENT AND GOVERNANCE REVIEW
63
Question Number Question Data
Source Interpretation Score
A2.2 Harmonization of Legislation and Government Coordination
73To what extent is mining sector legislation consistent with other relevant legislation?
Primary
Working towards
meeting its own goal, but less than half way
2.5
74
To what extent are legislation or inter-ministry arrangements covering natural resource issues that may be affected by mineral rights (e.g., land use, water, forests and nature reserves) well defined to minimize overlaps or gaps?
PrimaryGood practice
partially in place
2.5
75How clearly does mining or other legislation assign roles and responsibilities between government ministries/agencies in the mining sector?
PrimaryGood practice
in place4
A2.3 Provisions for Artisanal and Smallscale Mining
76To what extent is there a regulation in place that allows the formalization of artisanal and small-scale miners?
PrimaryData not
available or not applicable
..
77To what extent is artisanal and small-scale mining legally recognized in the mining law or regulations?
PrimaryGood practice
partially in place
2.5
78To what extent do the laws and regulations allow for artisanal and small-scale and industrial mining activities to coexist?
PrimaryData not
available or not applicable
..
79To what extent are there detailed laws and regulations to settle disputes between ASM and other mining activities?
PrimaryData not
available or not applicable
..
B. Accountability and Inclusiveness B2 Accountability of Processes, Compensation, Resettlement and Artisanal and Smallscale Mining Voice
B2.1 Access to Land, Compensation and Resettlement
80Does the holder of a mineral right have guaranteed access rights to (surface) land, or does this need to be negotiated with landowners (or users) separately?
PrimaryGood practice
in place4
81Is there an established procedure following Equator Principles for the resettlement of communities displaced by mining activities?
PrimaryGood practice not in place
1
82To what extent does the government enforce the legal requirements to resettle communities affected by mining activities?
In-country Interview
Working towards
meeting its own goal, but less than half way
2.5
Table 6: Question Scores (continued)
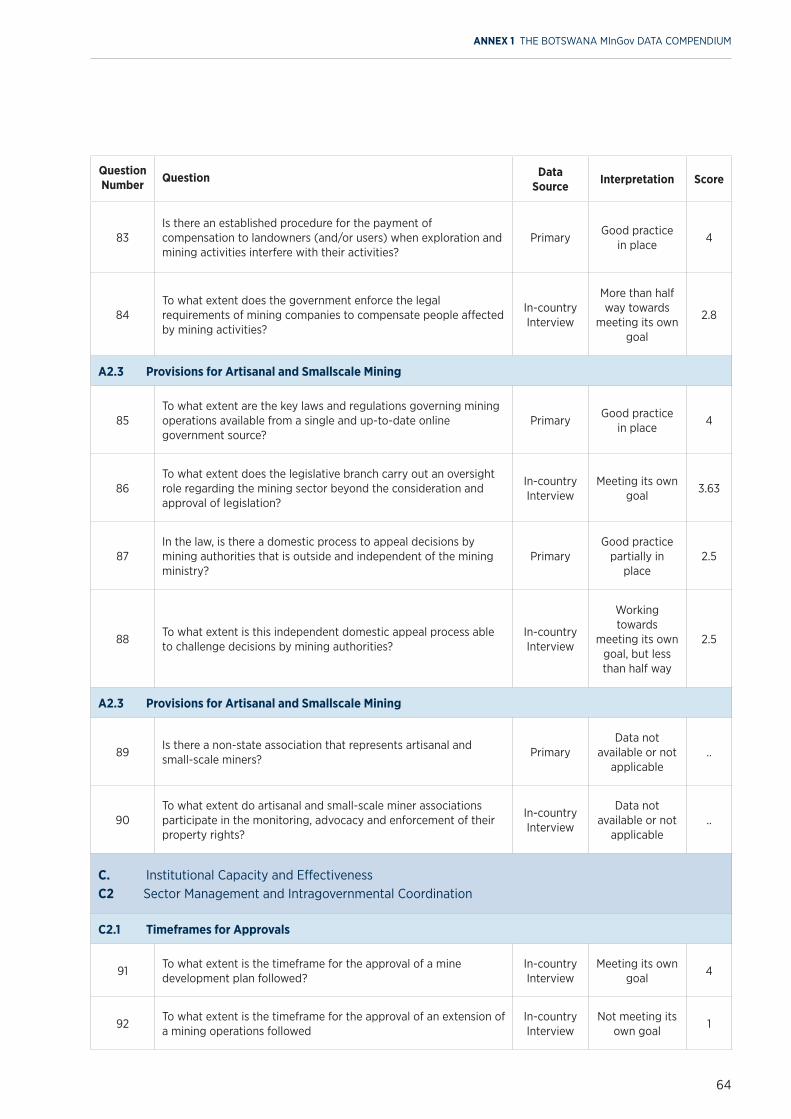
64
Question Number Question Data
Source Interpretation Score
83Is there an established procedure for the payment of compensation to landowners (and/or users) when exploration and mining activities interfere with their activities?
PrimaryGood practice
in place4
84To what extent does the government enforce the legal requirements of mining companies to compensate people affected by mining activities?
In-country Interview
More than half way towards
meeting its own goal
2.8
A2.3 Provisions for Artisanal and Smallscale Mining
85To what extent are the key laws and regulations governing mining operations available from a single and up-to-date online government source?
PrimaryGood practice
in place4
86To what extent does the legislative branch carry out an oversight role regarding the mining sector beyond the consideration and approval of legislation?
In-country Interview
Meeting its own goal
3.63
87In the law, is there a domestic process to appeal decisions by mining authorities that is outside and independent of the mining ministry?
PrimaryGood practice
partially in place
2.5
88To what extent is this independent domestic appeal process able to challenge decisions by mining authorities?
In-country Interview
Working towards
meeting its own goal, but less than half way
2.5
A2.3 Provisions for Artisanal and Smallscale Mining
89Is there a non-state association that represents artisanal and small-scale miners?
PrimaryData not
available or not applicable
..
90To what extent do artisanal and small-scale miner associations participate in the monitoring, advocacy and enforcement of their property rights?
In-country Interview
Data not available or not
applicable..
C. Institutional Capacity and Effectiveness C2 Sector Management and Intragovernmental Coordination
C2.1 Timeframes for Approvals
91To what extent is the timeframe for the approval of a mine development plan followed?
In-country Interview
Meeting its own goal
4
92To what extent is the timeframe for the approval of an extension of a mining operations followed
In-country Interview
Not meeting its own goal
1
ANNEX 1 THE BOTSWANA MInGov DATA COMPENDIUM
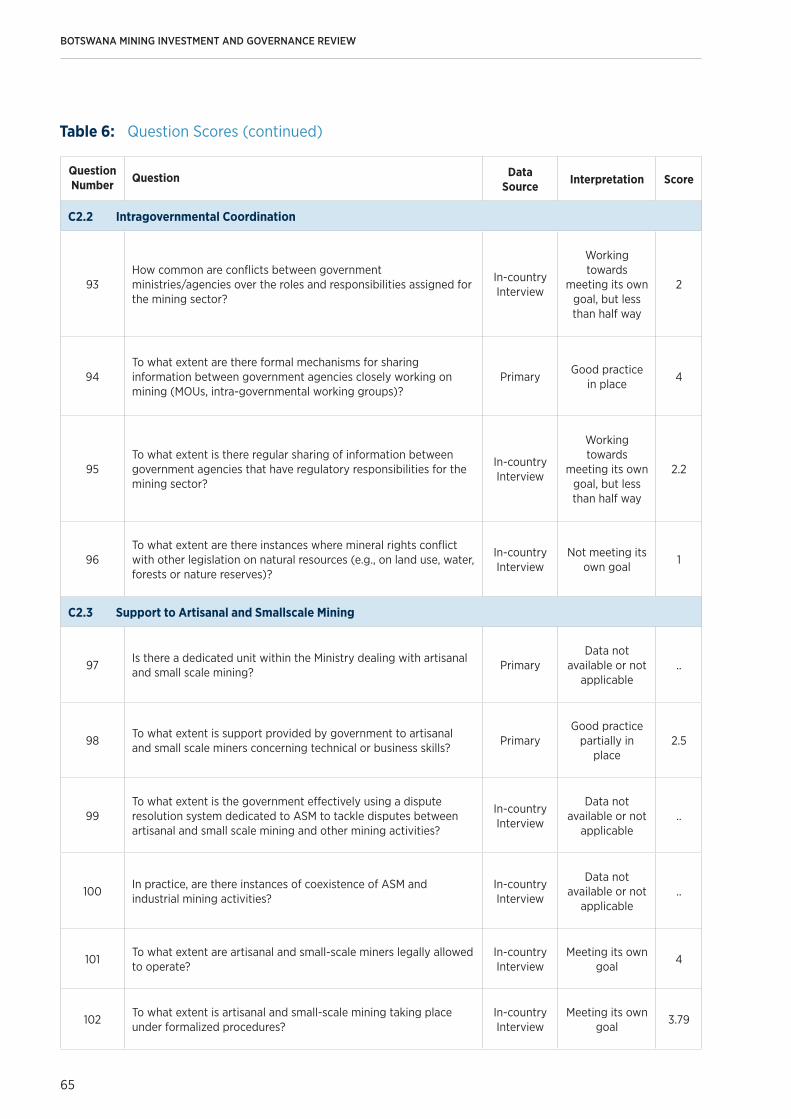
BOTSWANA MINING INVESTMENT AND GOVERNANCE REVIEW
65
Question Number Question Data
Source Interpretation Score
C2.2 Intragovernmental Coordination
93How common are conflicts between government ministries/agencies over the roles and responsibilities assigned for the mining sector?
In-country Interview
Working towards
meeting its own goal, but less than half way
2
94To what extent are there formal mechanisms for sharing information between government agencies closely working on mining (MOUs, intra-governmental working groups)?
PrimaryGood practice
in place4
95To what extent is there regular sharing of information between government agencies that have regulatory responsibilities for the mining sector?
In-country Interview
Working towards
meeting its own goal, but less than half way
2.2
96To what extent are there instances where mineral rights conflict with other legislation on natural resources (e.g., on land use, water, forests or nature reserves)?
In-country Interview
Not meeting its own goal
1
C2.3 Support to Artisanal and Smallscale Mining
97Is there a dedicated unit within the Ministry dealing with artisanal and small scale mining?
PrimaryData not
available or not applicable
..
98To what extent is support provided by government to artisanal and small scale miners concerning technical or business skills?
PrimaryGood practice
partially in place
2.5
99To what extent is the government effectively using a dispute resolution system dedicated to ASM to tackle disputes between artisanal and small scale mining and other mining activities?
In-country Interview
Data not available or not
applicable..
100In practice, are there instances of coexistence of ASM and industrial mining activities?
In-country Interview
Data not available or not
applicable..
101To what extent are artisanal and small-scale miners legally allowed to operate?
In-country Interview
Meeting its own goal
4
102To what extent is artisanal and small-scale mining taking place under formalized procedures?
In-country Interview
Meeting its own goal
3.79
Table 6: Question Scores (continued)
66
Question Number Question Data
Source Interpretation Score
3. Taxation and State Participation
A. Policy, Legislation and Regulation A3 Tax policy, Instruments and State Owned Enterprise Rules
A3.1 Tax Policy and Instruments
103Is it clear in the law which government agencies have the authority to collect taxes and payments from resource companies?
PrimaryGood practice
in place4
104To what extent are taxes from mining required by law to be placed in the national treasury?
PrimaryGood practice
in place4
105Does the legislation prescribe rates, formulas and bases for the main elements of the fiscal regime?
PrimaryGood practice
in place4
106To what extent are there well-defined provisions for the renegotiation or review of fiscal terms?
PrimaryGood practice
partially in place
2.5
107To what extent does the mining or investment legislation provide clear rules on the types of tax incentives that can be granted to large investors?
PrimaryGood practice not in place
1
108To what extent does the fiscal regime ensure that the government has an adequate minimum revenue stream in all production periods?
PrimaryGood practice
in place4
109To what extent does the mining fiscal regime include progressive fiscal instruments?
PrimaryGood practice
in place4
110To what extent are there clear rules in the tax code or regulations for the following payment processes:
PrimaryGood practice
partially in place
2.5
111Does the government have a simplified tax collection system for ASM?
PrimaryGood practice not in place
1
A3.2 Rules for Auditing, Base Erosion and Profit Shifting
112According to regulations, to what extent are regular tax, cost or physical audits required to be conducted of small-scale operators and large mining companies?
PrimaryGood practice
in place4
113Is there a legal provision providing for an arm’s-length principle for regulation of transfer-pricing practices?
PrimaryGood practice
in place4
114To what extent are there clear documentation requirements to demonstrate compliance with transfer pricing rules?
PrimaryGood practice
in place4
115To what extent are there clear procedures for using advanced pricing agreements to limit transfer pricing?
PrimaryGood practice not in place
1
ANNEX 1 THE BOTSWANA MInGov DATA COMPENDIUM
BOTSWANA MINING INVESTMENT AND GOVERNANCE REVIEW
67
Question Number Question Data
Source Interpretation Score
116Is there an annual disclosure requirement for related party transactions?
PrimaryGood practice not in place
1
117To what extent do the legal provisions limit the risk from thin capitalization?
PrimaryGood practice
in place4
A3.3 State Owned Enterprise Governance Rules
118To what extent does law or regulation require mining sector SOEs to adhere to good corporate governance when examining the Board’s composition?
PrimaryGood practice
partially in place
2.5
119
Where the mining SOE engages in quasi-fiscal activities, to what extent are the roles and responsibilities of the SOE to provide subsidies or social expenditures (quasi-fiscal activities) clearly set out?
PrimaryGood practice not in place
1
B. Accountability and Inclusiveness B3 Mining Taxation and State Owned Enterprise Financial Management
B3.1 Accountability of Mining Taxation
120To what extent are changes to mining tax legislation done through a consultative process that is timely, meaningful, comprehensive and transparent?
In-country Interview
Data not available or not
applicable..
121Does the country disclose through EITI or another disclosure process, details of mining revenues?
PrimaryGood practice not in place
1
122Are government officials with a role in the oversight of the mining sector required to disclose information about their financial interests in any extractive activity or project?
PrimaryGood practice
in place4
123To what extent do government officials with a role in the oversight of the mining sector disclose information about their financial interests in any extractive activity or project?
In-country Interview
Not meeting its own goal
1.75
B3.2 State-Owned Enterprise Financial Management
124If there are State Owned Enterprises (SOEs) in the mining sector, do such SOEs have a legal obligation to publish financial reports?
PrimaryGood practice
in place4
125To what extent do mining sector SOEs publish annual financial reports?
In-country Interview
Meeting its own goal
4
126Are mining SOEs subject by law to annual audits by an independent external auditor?
PrimaryGood practice
partially in place
2.5
127In practice, are annual audits of mining SOEs undertaken by an independent external auditor?
In-country Interview
Meeting its own goal
3.5
128Do mining SOEs have to follow internationally recognized accounting standards?
PrimaryGood practice
partially in place
2.5
Table 6: Question Scores (continued)
68
Question Number Question Data
Source Interpretation Score
C. Institutional Capacity and Effectiveness C3 Mining Tax Administration and State Owned Enterprise Governance
C3.1 Mining Tax Administration
129To what extent does the taxation authority issue guidance notes or interpretations?
PrimaryGood practice
in place4
130To what extent are the bases on which taxes are levied subject to disputes between companies and government?
In-country Interview
Working towards
meeting its own goal, but less than half way
2.5
131To what extent, are tax, cost or physical audits of mining companies conducted systematically?
In-country Interview
Meeting its own goal
4
132To what extent are the timing of physical audits and cost audits of mining companies coordinated?
In-country Interview
Not meeting its own goal
1
133 To what extent are transfer pricing rules enforced in practice? In-country Interview
Not meeting its own goal
1.75
134To what extent are there regular audits for transfer pricing of related party transactions and advanced pricing rules for regularly occurring transactions?
In-country Interview
More than half way towards
meeting its own goal
3.25
135To what extent are the advanced pricing rules followed for regularly occurring transactions?
In-country Interview
Data not available or not
applicable..
136To what extent are there regular audits of companies following thin capitalization rules?
In-country Interview
More than half way towards
meeting its own goal
3.25
137Does the tax administration have a large taxpayer unit/office or one specialized in natural resources/mining?
PrimaryGood practice
in place4
138To what extent is the unit specialized in taxation of natural resources/mining staffed appropriately to carry out its activities?
In-country Interview
Working towards
meeting its own goal, but less than half way
2.5
139To what extent, is the unit specialized in natural resources/mining receiving appropriate funding to carry out its mandate?
In-country Interview
Working towards
meeting its own goal, but less than half way
2.5
140Effectiveness in the collection of tax payments—Public Expenditure and Financial Accounting (PEFA) indicator
SecondaryHigher 50%-
75%3
ANNEX 1 THE BOTSWANA MInGov DATA COMPENDIUM
BOTSWANA MINING INVESTMENT AND GOVERNANCE REVIEW
69
Question Number Question Data
Source Interpretation Score
141In practice, are taxes and payments only collected by the mandated agencies?
In-country Interview
Meeting its own goal
4
142In practice, are taxes from mining only placed in the national treasury?
In-country Interview
Meeting its own goal
4
143 To what extent are the fiscal terms in the law followed? In-country Interview
Meeting its own goal
4
144To what extent are the terms for investment incentives in the law followed?
In-country Interview
Working towards
meeting its own goal, but less than half way
2.5
C3.2 State-Owned Enterprise Governance
145
To what extent do mining sector SOEs have a board with: independent expert members with private sector experience, separate positions of chair and chief executive officer, and a board of a reasonable size?
In-country Interview
Meeting its own goal
4
146 Is there an internal audit department within mining SOEs? PrimaryGood practice
in place4
147In practice, does the internal audit department of mining SOEs review the effectiveness of internal controls annually?
In-country Interview
Meeting its own goal
4
148To what extent do mining SOEs follow the role (including any subsidies or social expenditures) set out for them?
In-country Interview
Meeting its own goal
4
149To what extent, are mining SOEs or state equity partners honoring their financial obligations?
In-country Interview
Working towards
meeting its own goal, but less than half way
2.33
4. Revenue Distribution and Management
A. Policy, Legislation and Regulation A4 Public Financial Management Regulation, Including Revenue Sharing
A4.1 Public Financial Management and Revenue Sharing
150Are arrangements for resource revenue sharing between central and sub-national governments defined by legislation?
PrimaryGood practice not in place
1
151Are ministries required to undertake procurement plans for infrastructure projects according to the laws and regulation?
PrimaryGood practice
in place4
152In the regulation, to what extent is it clear when and how yearly budget allocations to sub-national governments should be disbursed?
PrimaryGood practice
in place4
Table 6: Question Scores (continued)
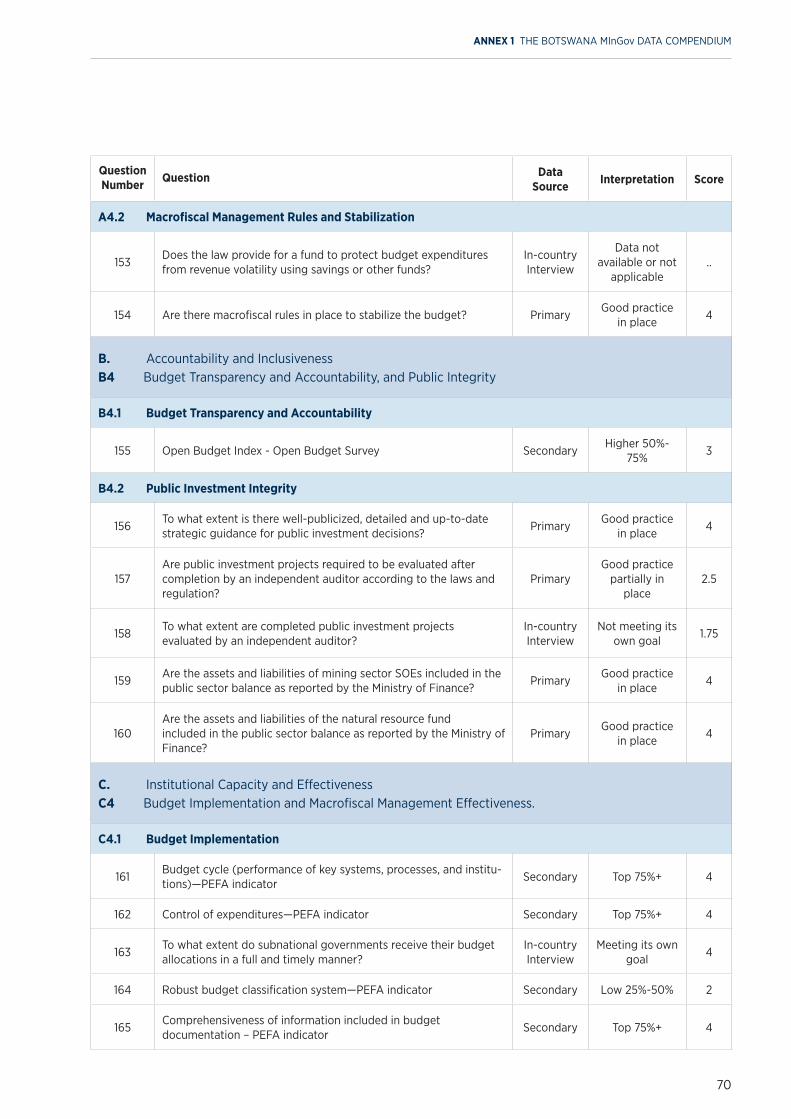
70
Question Number Question Data
Source Interpretation Score
A4.2 Macrofiscal Management Rules and Stabilization
153Does the law provide for a fund to protect budget expenditures from revenue volatility using savings or other funds?
In-country Interview
Data not available or not
applicable..
154 Are there macrofiscal rules in place to stabilize the budget? PrimaryGood practice
in place4
B. Accountability and InclusivenessB4 Budget Transparency and Accountability, and Public Integrity
B4.1 Budget Transparency and Accountability
155 Open Budget Index - Open Budget Survey SecondaryHigher 50%-
75%3
B4.2 Public Investment Integrity
156To what extent is there well-publicized, detailed and up-to-date strategic guidance for public investment decisions?
PrimaryGood practice
in place4
157Are public investment projects required to be evaluated after completion by an independent auditor according to the laws and regulation?
PrimaryGood practice
partially in place
2.5
158To what extent are completed public investment projects evaluated by an independent auditor?
In-country Interview
Not meeting its own goal
1.75
159Are the assets and liabilities of mining sector SOEs included in the public sector balance as reported by the Ministry of Finance?
PrimaryGood practice
in place4
160Are the assets and liabilities of the natural resource fund included in the public sector balance as reported by the Ministry of Finance?
PrimaryGood practice
in place4
C. Institutional Capacity and EffectivenessC4 Budget Implementation and Macrofiscal Management Effectiveness.
C4.1 Budget Implementation
161Budget cycle (performance of key systems, processes, and institu-tions)—PEFA indicator
Secondary Top 75%+ 4
162 Control of expenditures—PEFA indicator Secondary Top 75%+ 4
163To what extent do subnational governments receive their budget allocations in a full and timely manner?
In-country Interview
Meeting its own goal
4
164 Robust budget classification system—PEFA indicator Secondary Low 25%-50% 2
165Comprehensiveness of information included in budget documentation – PEFA indicator
Secondary Top 75%+ 4
ANNEX 1 THE BOTSWANA MInGov DATA COMPENDIUM
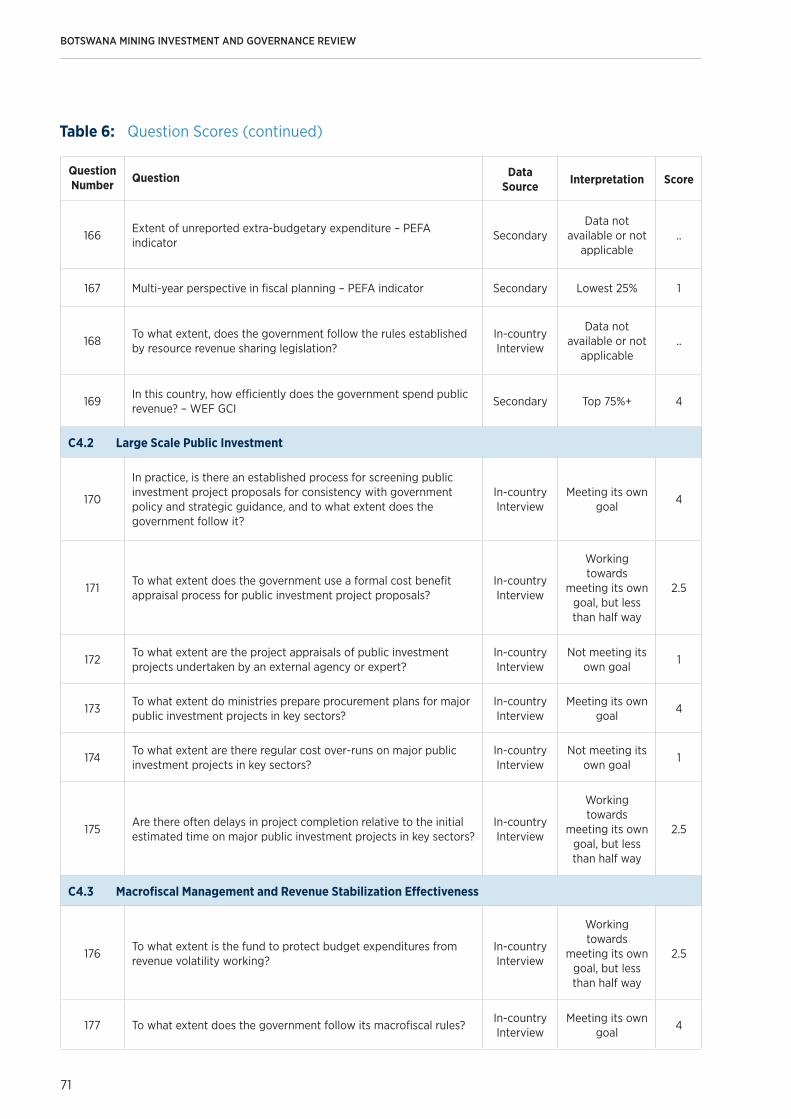
BOTSWANA MINING INVESTMENT AND GOVERNANCE REVIEW
71
Question Number Question Data
Source Interpretation Score
166Extent of unreported extra-budgetary expenditure – PEFA indicator
SecondaryData not
available or not applicable
..
167 Multi-year perspective in fiscal planning – PEFA indicator Secondary Lowest 25% 1
168To what extent, does the government follow the rules established by resource revenue sharing legislation?
In-country Interview
Data not available or not
applicable..
169In this country, how efficiently does the government spend public revenue? – WEF GCI
Secondary Top 75%+ 4
C4.2 Large Scale Public Investment
170
In practice, is there an established process for screening public investment project proposals for consistency with government policy and strategic guidance, and to what extent does the government follow it?
In-country Interview
Meeting its own goal
4
171To what extent does the government use a formal cost benefit appraisal process for public investment project proposals?
In-country Interview
Working towards
meeting its own goal, but less than half way
2.5
172To what extent are the project appraisals of public investment projects undertaken by an external agency or expert?
In-country Interview
Not meeting its own goal
1
173To what extent do ministries prepare procurement plans for major public investment projects in key sectors?
In-country Interview
Meeting its own goal
4
174To what extent are there regular cost over-runs on major public investment projects in key sectors?
In-country Interview
Not meeting its own goal
1
175Are there often delays in project completion relative to the initial estimated time on major public investment projects in key sectors?
In-country Interview
Working towards
meeting its own goal, but less than half way
2.5
C4.3 Macrofiscal Management and Revenue Stabilization Effectiveness
176To what extent is the fund to protect budget expenditures from revenue volatility working?
In-country Interview
Working towards
meeting its own goal, but less than half way
2.5
177 To what extent does the government follow its macrofiscal rules?In-country Interview
Meeting its own goal
4
Table 6: Question Scores (continued)
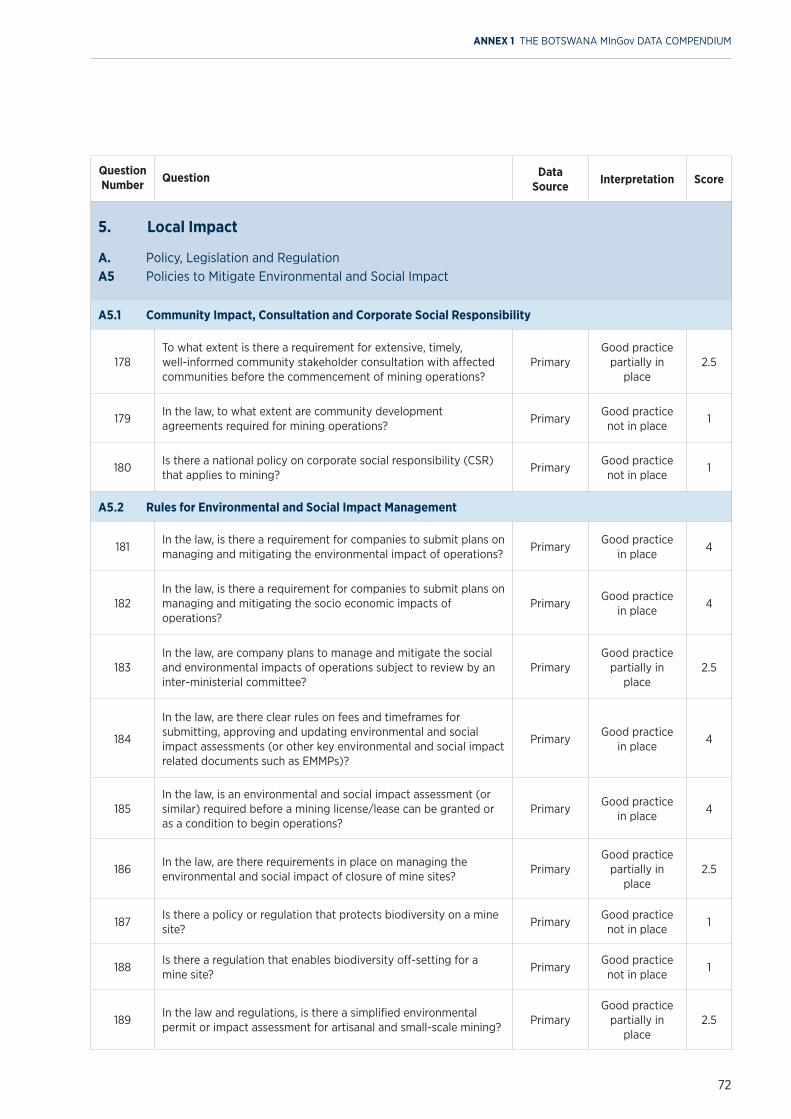
72
Question Number Question Data
Source Interpretation Score
5. Local Impact
A. Policy, Legislation and Regulation A5 Policies to Mitigate Environmental and Social Impact
A5.1 Community Impact, Consultation and Corporate Social Responsibility
178To what extent is there a requirement for extensive, timely, well-informed community stakeholder consultation with affected communities before the commencement of mining operations?
PrimaryGood practice
partially in place
2.5
179In the law, to what extent are community development agreements required for mining operations?
PrimaryGood practice not in place
1
180Is there a national policy on corporate social responsibility (CSR) that applies to mining?
PrimaryGood practice not in place
1
A5.2 Rules for Environmental and Social Impact Management
181In the law, is there a requirement for companies to submit plans on managing and mitigating the environmental impact of operations?
PrimaryGood practice
in place4
182In the law, is there a requirement for companies to submit plans on managing and mitigating the socio economic impacts of operations?
PrimaryGood practice
in place4
183In the law, are company plans to manage and mitigate the social and environmental impacts of operations subject to review by an inter-ministerial committee?
PrimaryGood practice
partially in place
2.5
184
In the law, are there clear rules on fees and timeframes for submitting, approving and updating environmental and social impact assessments (or other key environmental and social impact related documents such as EMMPs)?
PrimaryGood practice
in place4
185In the law, is an environmental and social impact assessment (or similar) required before a mining license/lease can be granted or as a condition to begin operations?
PrimaryGood practice
in place4
186In the law, are there requirements in place on managing the environmental and social impact of closure of mine sites?
PrimaryGood practice
partially in place
2.5
187Is there a policy or regulation that protects biodiversity on a mine site?
PrimaryGood practice not in place
1
188Is there a regulation that enables biodiversity off-setting for a mine site?
PrimaryGood practice not in place
1
189In the law and regulations, is there a simplified environmental permit or impact assessment for artisanal and small-scale mining?
PrimaryGood practice
partially in place
2.5
ANNEX 1 THE BOTSWANA MInGov DATA COMPENDIUM

BOTSWANA MINING INVESTMENT AND GOVERNANCE REVIEW
73
Question Number Question Data
Source Interpretation Score
190In the law, does the agency or ministry responsible for environmental protection have a say in the approval of exploration rights?
PrimaryGood practice
partially in place
2.5
191Is an agency independent from the mining authorities responsible for environmental protection and rehabilitation?
PrimaryGood practice
in place4
192In the law, is there a grievance and complaints mechanism defined in the environmental regulations?
PrimaryGood practice
in place4
A5.3 Rules for Financial Sureties for Decommissioning
193Does legislation require the posting of environmental bonds or similar financial assurance methods to cover the cost of environmental rehabilitation post-mining?
PrimaryGood practice not in place
1
B. Accountability and InclusivenessB5 Human Rights, Employment Equity and Environmental Transparency
B5.1 Human Rights and Employment Equity
194Is government implementing the African Charter for Human Rights?
PrimaryGood practice
partially in place
2.5
195Is the state’s duty to protect human rights (Pillar I of the UN Guiding Principles on Business and Human Rights, UNGP) implemented through a National Action Plan?
PrimaryGood practice
partially in place
2.5
196Is the government a signatory to the Voluntary Principles on Security and Human Rights (VPSHR)?
PrimaryGood practice not in place
1
197In practice, if government is a signatory to the VPSHR, to what extent is it monitoring VPSHR implementation?
In-country Interview
Data not available or not
applicable..
198In practice, does the government require companies to carry out human rights due diligence as part of the licensing process?
In-country Interview
Not meeting its own goal
1.5
199 Is there an independent Human Rights Commission? PrimaryGood practice not in place
1
200To what extent is the Human Rights Commission adequately staffed to facilitate a grievance and complaint mechanism?
In-country Interview
Data not available or not
applicable..
201To what extent is the Human Rights Commission receiving an adequate budget to facilitate a grievance and complaint mechanism?
In-country Interview
Data not available or not
applicable..
202Are there adequate government rules to promote employment equity?
PrimaryGood practice
partially in place
2.5
Table 6: Question Scores (continued)
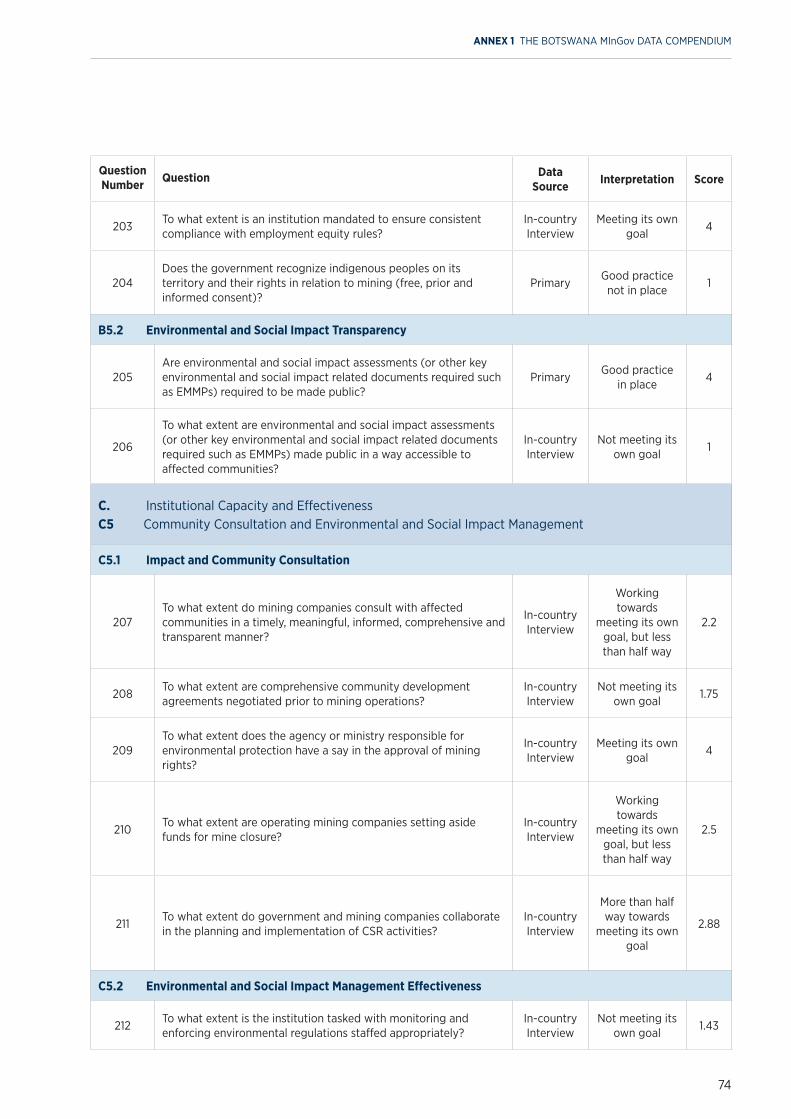
74
Question Number Question Data
Source Interpretation Score
203To what extent is an institution mandated to ensure consistent compliance with employment equity rules?
In-country Interview
Meeting its own goal
4
204Does the government recognize indigenous peoples on its territory and their rights in relation to mining (free, prior and informed consent)?
PrimaryGood practice not in place
1
B5.2 Environmental and Social Impact Transparency
205Are environmental and social impact assessments (or other key environmental and social impact related documents required such as EMMPs) required to be made public?
PrimaryGood practice
in place4
206
To what extent are environmental and social impact assessments (or other key environmental and social impact related documents required such as EMMPs) made public in a way accessible to affected communities?
In-country Interview
Not meeting its own goal
1
C. Institutional Capacity and EffectivenessC5 Community Consultation and Environmental and Social Impact Management
C5.1 Impact and Community Consultation
207To what extent do mining companies consult with affected communities in a timely, meaningful, informed, comprehensive and transparent manner?
In-country Interview
Working towards
meeting its own goal, but less than half way
2.2
208To what extent are comprehensive community development agreements negotiated prior to mining operations?
In-country Interview
Not meeting its own goal
1.75
209To what extent does the agency or ministry responsible for environmental protection have a say in the approval of mining rights?
In-country Interview
Meeting its own goal
4
210To what extent are operating mining companies setting aside funds for mine closure?
In-country Interview
Working towards
meeting its own goal, but less than half way
2.5
211To what extent do government and mining companies collaborate in the planning and implementation of CSR activities?
In-country Interview
More than half way towards
meeting its own goal
2.88
C5.2 Environmental and Social Impact Management Effectiveness
212To what extent is the institution tasked with monitoring and enforcing environmental regulations staffed appropriately?
In-country Interview
Not meeting its own goal
1.43
ANNEX 1 THE BOTSWANA MInGov DATA COMPENDIUM
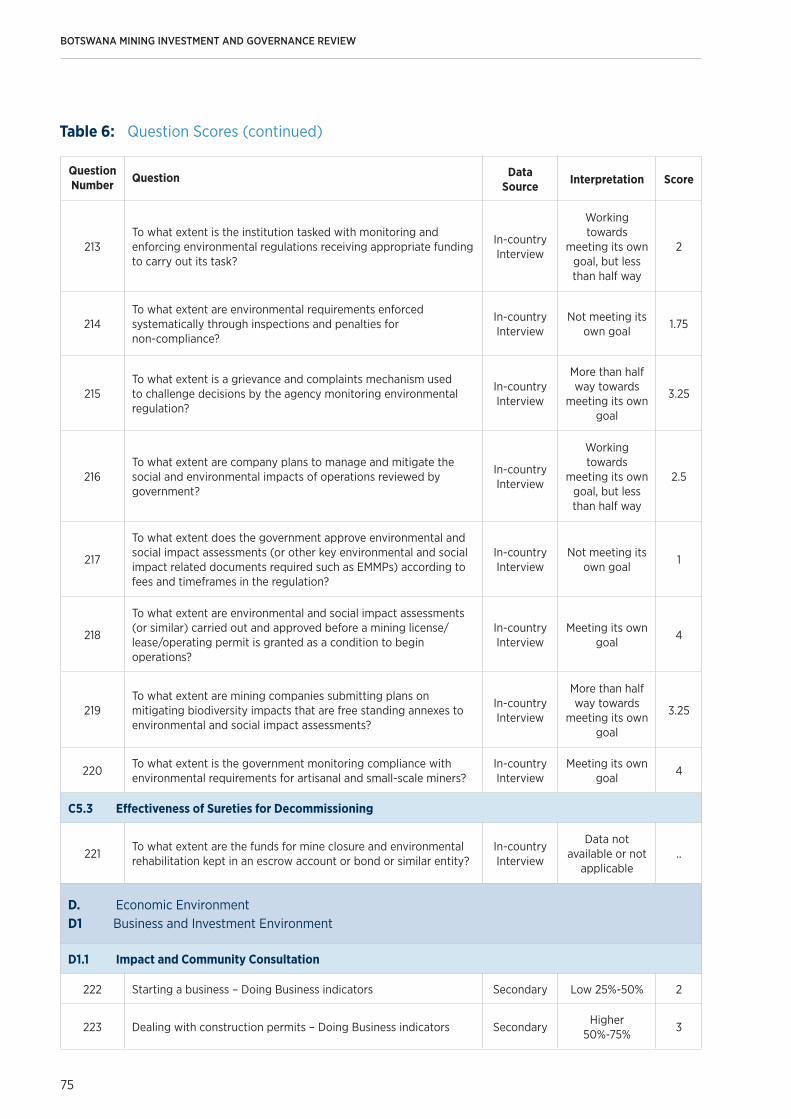
BOTSWANA MINING INVESTMENT AND GOVERNANCE REVIEW
75
Question Number Question Data
Source Interpretation Score
213To what extent is the institution tasked with monitoring and enforcing environmental regulations receiving appropriate funding to carry out its task?
In-country Interview
Working towards
meeting its own goal, but less than half way
2
214To what extent are environmental requirements enforced systematically through inspections and penalties for non-compliance?
In-country Interview
Not meeting its own goal
1.75
215To what extent is a grievance and complaints mechanism used to challenge decisions by the agency monitoring environmental regulation?
In-country Interview
More than half way towards
meeting its own goal
3.25
216To what extent are company plans to manage and mitigate the social and environmental impacts of operations reviewed by government?
In-country Interview
Working towards
meeting its own goal, but less than half way
2.5
217
To what extent does the government approve environmental and social impact assessments (or other key environmental and social impact related documents required such as EMMPs) according to fees and timeframes in the regulation?
In-country Interview
Not meeting its own goal
1
218
To what extent are environmental and social impact assessments (or similar) carried out and approved before a mining license/lease/operating permit is granted as a condition to begin operations?
In-country Interview
Meeting its own goal
4
219To what extent are mining companies submitting plans on mitigating biodiversity impacts that are free standing annexes to environmental and social impact assessments?
In-country Interview
More than half way towards
meeting its own goal
3.25
220To what extent is the government monitoring compliance with environmental requirements for artisanal and small-scale miners?
In-country Interview
Meeting its own goal
4
C5.3 Effectiveness of Sureties for Decommissioning
221To what extent are the funds for mine closure and environmental rehabilitation kept in an escrow account or bond or similar entity?
In-country Interview
Data not available or not
applicable..
D. Economic EnvironmentD1 Business and Investment Environment
D1.1 Impact and Community Consultation
222 Starting a business – Doing Business indicators Secondary Low 25%-50% 2
223 Dealing with construction permits – Doing Business indicators SecondaryHigher
50%-75%3
Table 6: Question Scores (continued)
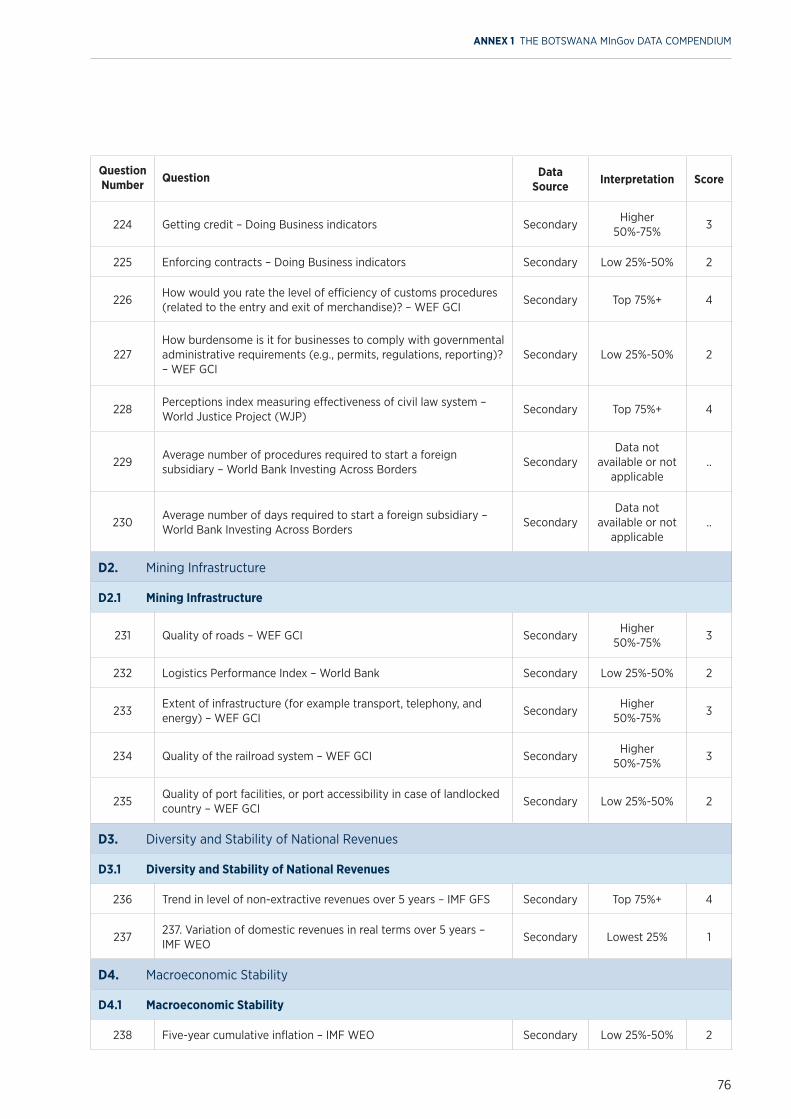
76
Question Number Question Data
Source Interpretation Score
224 Getting credit – Doing Business indicators SecondaryHigher
50%-75%3
225 Enforcing contracts – Doing Business indicators Secondary Low 25%-50% 2
226How would you rate the level of efficiency of customs procedures (related to the entry and exit of merchandise)? – WEF GCI
Secondary Top 75%+ 4
227How burdensome is it for businesses to comply with governmental administrative requirements (e.g., permits, regulations, reporting)? – WEF GCI
Secondary Low 25%-50% 2
228Perceptions index measuring effectiveness of civil law system – World Justice Project (WJP)
Secondary Top 75%+ 4
229Average number of procedures required to start a foreign subsidiary – World Bank Investing Across Borders
SecondaryData not
available or not applicable
..
230Average number of days required to start a foreign subsidiary – World Bank Investing Across Borders
SecondaryData not
available or not applicable
..
D2. Mining Infrastructure
D2.1 Mining Infrastructure
231 Quality of roads – WEF GCI SecondaryHigher
50%-75%3
232 Logistics Performance Index – World Bank Secondary Low 25%-50% 2
233Extent of infrastructure (for example transport, telephony, and energy) – WEF GCI
SecondaryHigher
50%-75%3
234 Quality of the railroad system – WEF GCI SecondaryHigher
50%-75%3
235Quality of port facilities, or port accessibility in case of landlocked country – WEF GCI
Secondary Low 25%-50% 2
D3. Diversity and Stability of National Revenues
D3.1 Diversity and Stability of National Revenues
236 Trend in level of non-extractive revenues over 5 years – IMF GFS Secondary Top 75%+ 4
237237. Variation of domestic revenues in real terms over 5 years – IMF WEO
Secondary Lowest 25% 1
D4. Macroeconomic Stability
D4.1 Macroeconomic Stability
238 Five-year cumulative inflation – IMF WEO Secondary Low 25%-50% 2
ANNEX 1 THE BOTSWANA MInGov DATA COMPENDIUM
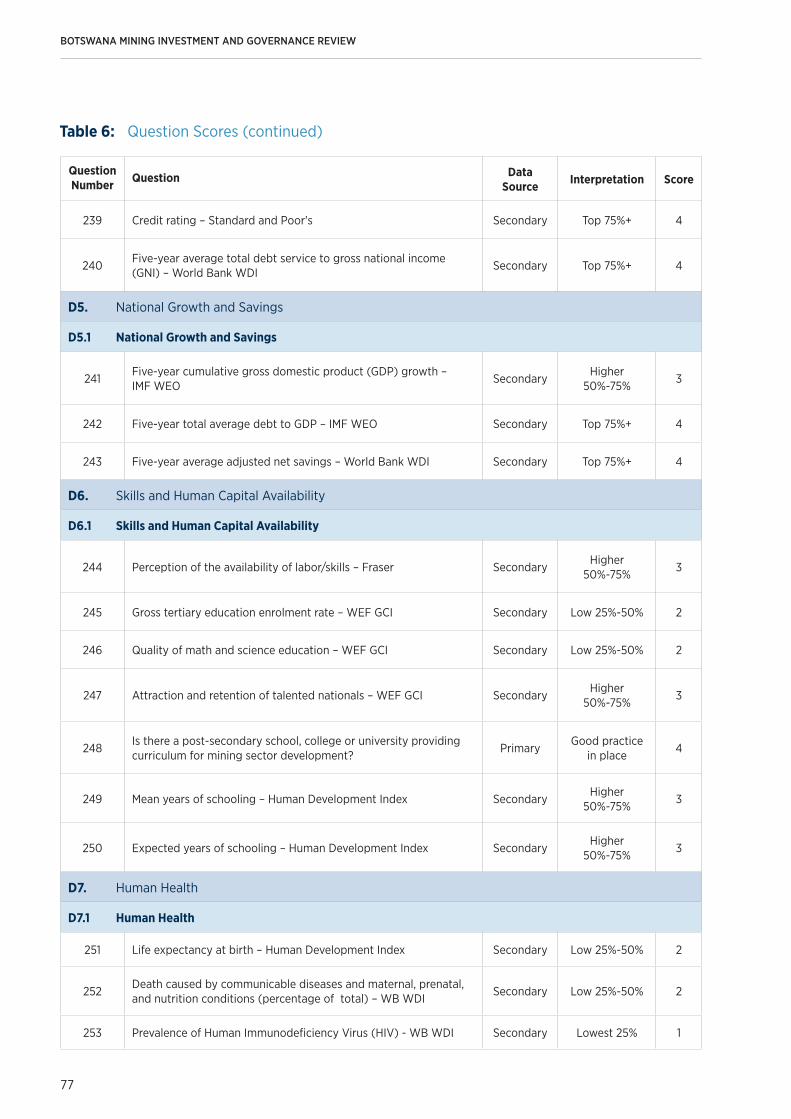
BOTSWANA MINING INVESTMENT AND GOVERNANCE REVIEW
77
Question Number Question Data
Source Interpretation Score
239 Credit rating – Standard and Poor's Secondary Top 75%+ 4
240Five-year average total debt service to gross national income (GNI) – World Bank WDI
Secondary Top 75%+ 4
D5. National Growth and Savings
D5.1 National Growth and Savings
241Five-year cumulative gross domestic product (GDP) growth – IMF WEO
SecondaryHigher
50%-75%3
242 Five-year total average debt to GDP – IMF WEO Secondary Top 75%+ 4
243 Five-year average adjusted net savings – World Bank WDI Secondary Top 75%+ 4
D6. Skills and Human Capital Availability
D6.1 Skills and Human Capital Availability
244 Perception of the availability of labor/skills – Fraser SecondaryHigher
50%-75%3
245 Gross tertiary education enrolment rate – WEF GCI Secondary Low 25%-50% 2
246 Quality of math and science education – WEF GCI Secondary Low 25%-50% 2
247 Attraction and retention of talented nationals – WEF GCI SecondaryHigher
50%-75%3
248Is there a post-secondary school, college or university providing curriculum for mining sector development?
PrimaryGood practice
in place4
249 Mean years of schooling – Human Development Index SecondaryHigher
50%-75%3
250 Expected years of schooling – Human Development Index SecondaryHigher
50%-75%3
D7. Human Health
D7.1 Human Health
251 Life expectancy at birth – Human Development Index Secondary Low 25%-50% 2
252Death caused by communicable diseases and maternal, prenatal, and nutrition conditions (percentage of total) – WB WDI
Secondary Low 25%-50% 2
253 Prevalence of Human Immunodeficiency Virus (HIV) - WB WDI Secondary Lowest 25% 1
Table 6: Question Scores (continued)
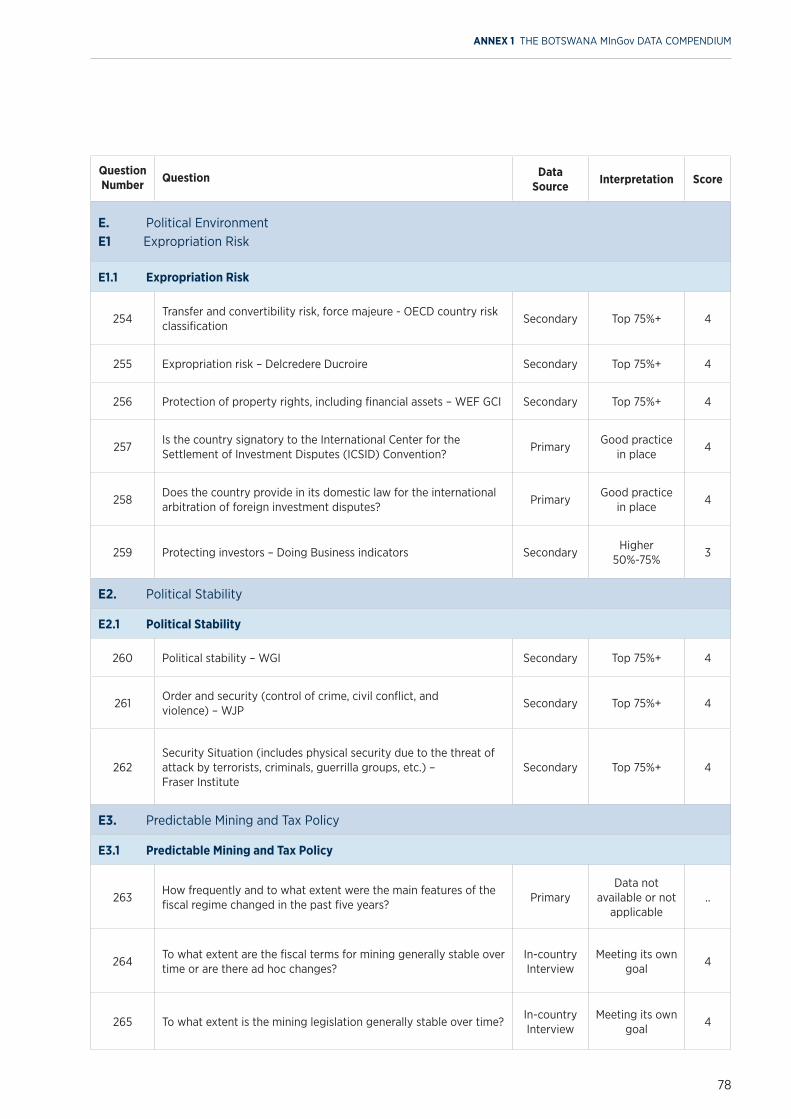
78
Question Number Question Data
Source Interpretation Score
E. Political EnvironmentE1 Expropriation Risk
E1.1 Expropriation Risk
254Transfer and convertibility risk, force majeure - OECD country risk classification
Secondary Top 75%+ 4
255 Expropriation risk – Delcredere Ducroire Secondary Top 75%+ 4
256 Protection of property rights, including financial assets – WEF GCI Secondary Top 75%+ 4
257Is the country signatory to the International Center for the Settlement of Investment Disputes (ICSID) Convention?
PrimaryGood practice
in place4
258Does the country provide in its domestic law for the international arbitration of foreign investment disputes?
PrimaryGood practice
in place4
259 Protecting investors – Doing Business indicators SecondaryHigher
50%-75%3
E2. Political Stability
E2.1 Political Stability
260 Political stability – WGI Secondary Top 75%+ 4
261Order and security (control of crime, civil conflict, and violence) – WJP
Secondary Top 75%+ 4
262Security Situation (includes physical security due to the threat of attack by terrorists, criminals, guerrilla groups, etc.) – Fraser Institute
Secondary Top 75%+ 4
E3. Predictable Mining and Tax Policy
E3.1 Predictable Mining and Tax Policy
263How frequently and to what extent were the main features of the fiscal regime changed in the past five years?
PrimaryData not
available or not applicable
..
264To what extent are the fiscal terms for mining generally stable over time or are there ad hoc changes?
In-country Interview
Meeting its own goal
4
265 To what extent is the mining legislation generally stable over time?In-country Interview
Meeting its own goal
4
ANNEX 1 THE BOTSWANA MInGov DATA COMPENDIUM
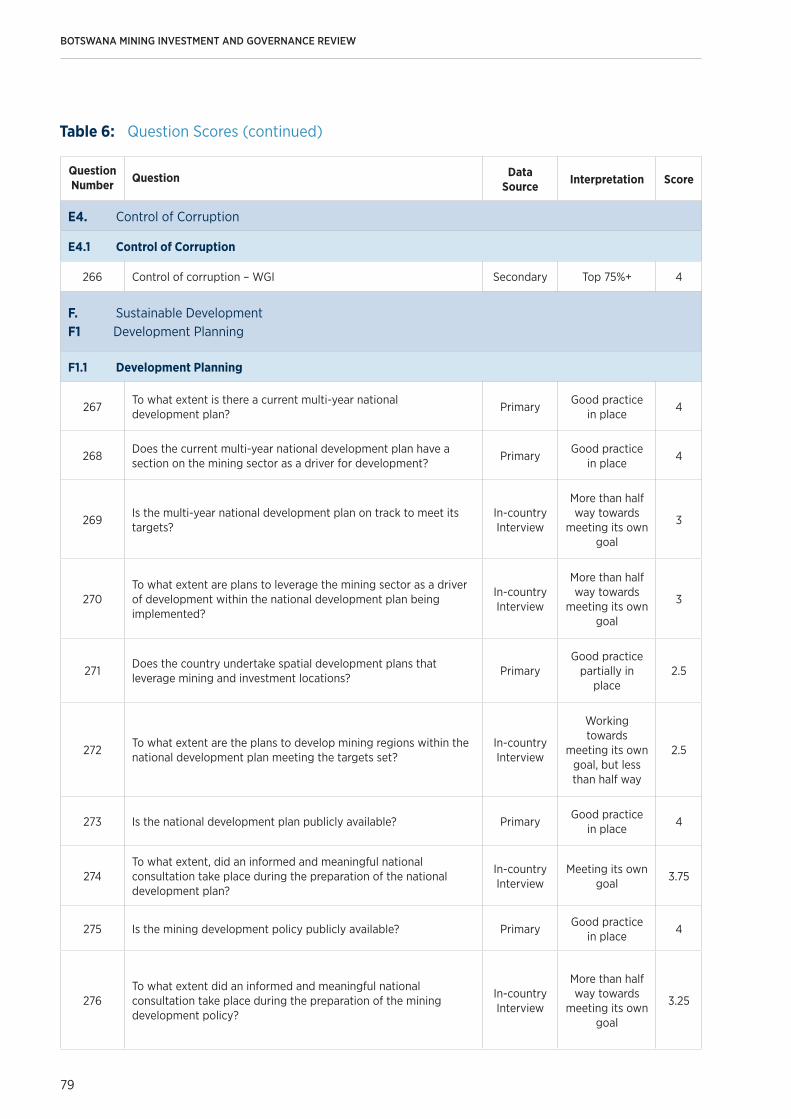
BOTSWANA MINING INVESTMENT AND GOVERNANCE REVIEW
79
Question Number Question Data
Source Interpretation Score
E4. Control of Corruption
E4.1 Control of Corruption
266 Control of corruption – WGI Secondary Top 75%+ 4
F. Sustainable DevelopmentF1 Development Planning
F1.1 Development Planning
267To what extent is there a current multi-year national development plan?
PrimaryGood practice
in place4
268Does the current multi-year national development plan have a section on the mining sector as a driver for development?
PrimaryGood practice
in place4
269Is the multi-year national development plan on track to meet its targets?
In-country Interview
More than half way towards
meeting its own goal
3
270To what extent are plans to leverage the mining sector as a driver of development within the national development plan being implemented?
In-country Interview
More than half way towards
meeting its own goal
3
271Does the country undertake spatial development plans that leverage mining and investment locations?
PrimaryGood practice
partially in place
2.5
272To what extent are the plans to develop mining regions within the national development plan meeting the targets set?
In-country Interview
Working towards
meeting its own goal, but less than half way
2.5
273 Is the national development plan publicly available? PrimaryGood practice
in place4
274To what extent, did an informed and meaningful national consultation take place during the preparation of the national development plan?
In-country Interview
Meeting its own goal
3.75
275 Is the mining development policy publicly available? PrimaryGood practice
in place4
276To what extent did an informed and meaningful national consultation take place during the preparation of the mining development policy?
In-country Interview
More than half way towards
meeting its own goal
3.25
Table 6: Question Scores (continued)
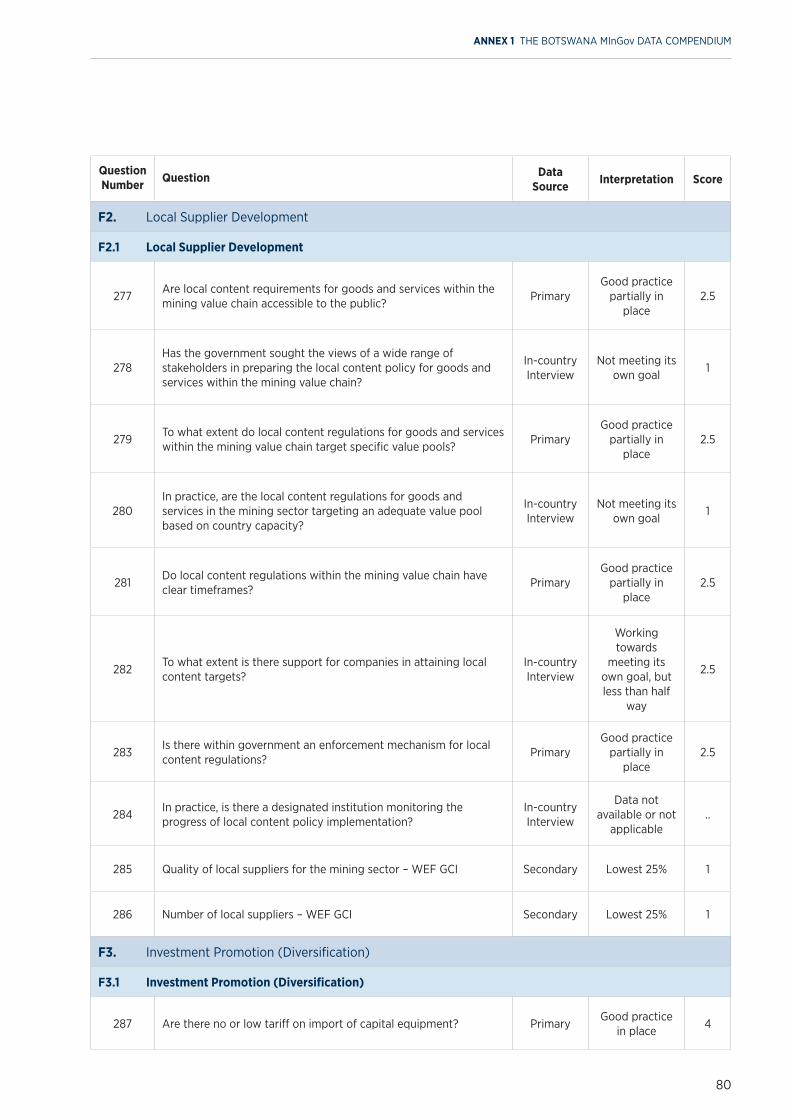
80
Question Number Question Data
Source Interpretation Score
F2. Local Supplier Development
F2.1 Local Supplier Development
277Are local content requirements for goods and services within the mining value chain accessible to the public?
PrimaryGood practice
partially in place
2.5
278Has the government sought the views of a wide range of stakeholders in preparing the local content policy for goods and services within the mining value chain?
In-country Interview
Not meeting its own goal
1
279To what extent do local content regulations for goods and services within the mining value chain target specific value pools?
PrimaryGood practice
partially in place
2.5
280In practice, are the local content regulations for goods and services in the mining sector targeting an adequate value pool based on country capacity?
In-country Interview
Not meeting its own goal
1
281Do local content regulations within the mining value chain have clear timeframes?
PrimaryGood practice
partially in place
2.5
282To what extent is there support for companies in attaining local content targets?
In-country Interview
Working towards
meeting its own goal, but less than half
way
2.5
283Is there within government an enforcement mechanism for local content regulations?
PrimaryGood practice
partially in place
2.5
284In practice, is there a designated institution monitoring the progress of local content policy implementation?
In-country Interview
Data not available or not
applicable..
285 Quality of local suppliers for the mining sector – WEF GCI Secondary Lowest 25% 1
286 Number of local suppliers – WEF GCI Secondary Lowest 25% 1
F3. Investment Promotion (Diversification)
F3.1 Investment Promotion (Diversification)
287 Are there no or low tariff on import of capital equipment? PrimaryGood practice
in place4
ANNEX 1 THE BOTSWANA MInGov DATA COMPENDIUM
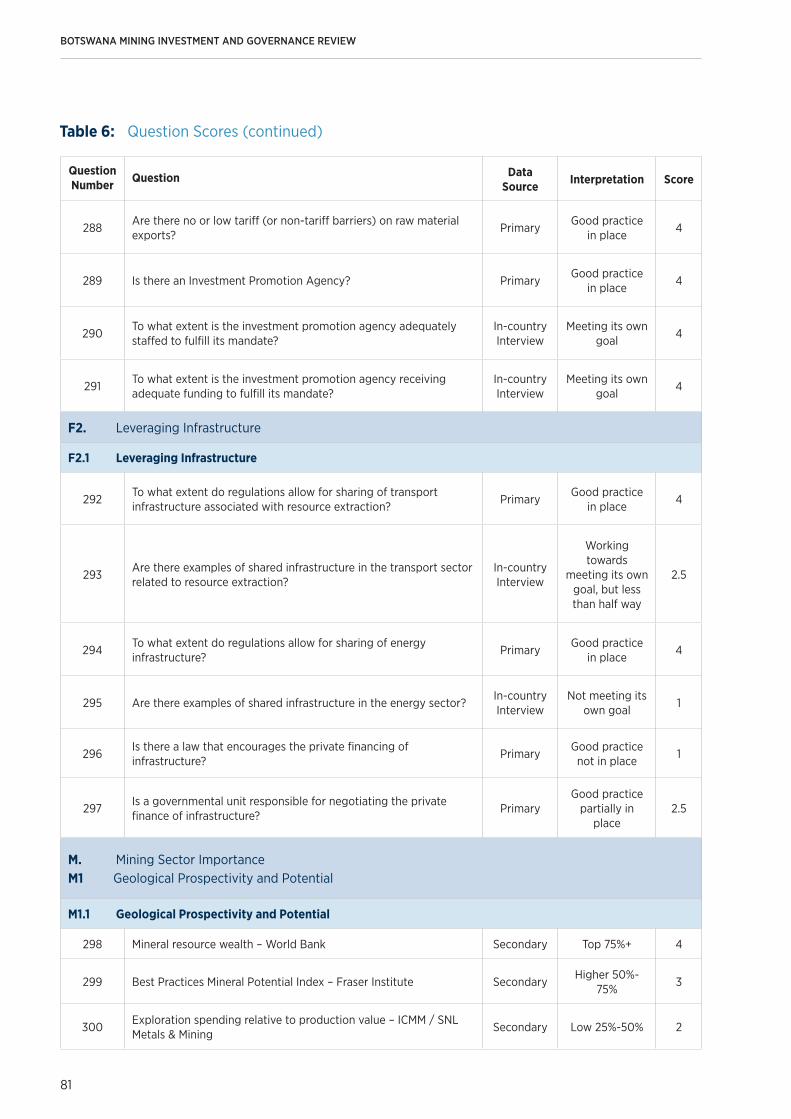
BOTSWANA MINING INVESTMENT AND GOVERNANCE REVIEW
81
Question Number Question Data
Source Interpretation Score
288Are there no or low tariff (or non-tariff barriers) on raw material exports?
PrimaryGood practice
in place4
289 Is there an Investment Promotion Agency? PrimaryGood practice
in place4
290To what extent is the investment promotion agency adequately staffed to fulfill its mandate?
In-country Interview
Meeting its own goal
4
291To what extent is the investment promotion agency receiving adequate funding to fulfill its mandate?
In-country Interview
Meeting its own goal
4
F2. Leveraging Infrastructure
F2.1 Leveraging Infrastructure
292To what extent do regulations allow for sharing of transport infrastructure associated with resource extraction?
PrimaryGood practice
in place4
293Are there examples of shared infrastructure in the transport sector related to resource extraction?
In-country Interview
Working towards
meeting its own goal, but less than half way
2.5
294To what extent do regulations allow for sharing of energy infrastructure?
PrimaryGood practice
in place4
295 Are there examples of shared infrastructure in the energy sector?In-country Interview
Not meeting its own goal
1
296Is there a law that encourages the private financing of infrastructure?
PrimaryGood practice not in place
1
297Is a governmental unit responsible for negotiating the private finance of infrastructure?
PrimaryGood practice
partially in place
2.5
M. Mining Sector Importance M1 Geological Prospectivity and Potential
M1.1 Geological Prospectivity and Potential
298 Mineral resource wealth – World Bank Secondary Top 75%+ 4
299 Best Practices Mineral Potential Index – Fraser Institute SecondaryHigher 50%-
75%3
300Exploration spending relative to production value – ICMM / SNL Metals & Mining
Secondary Low 25%-50% 2
Table 6: Question Scores (continued)
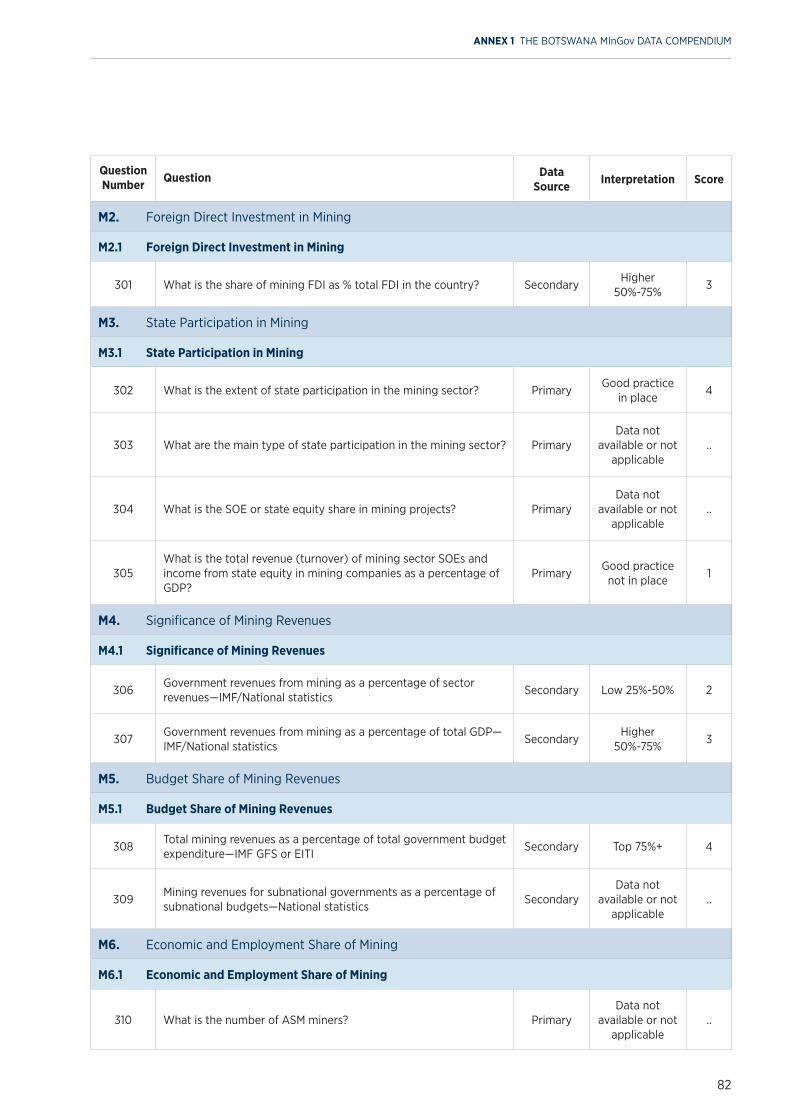
82
Question Number Question Data
Source Interpretation Score
M2. Foreign Direct Investment in Mining
M2.1 Foreign Direct Investment in Mining
301 What is the share of mining FDI as % total FDI in the country? SecondaryHigher
50%-75%3
M3. State Participation in Mining
M3.1 State Participation in Mining
302 What is the extent of state participation in the mining sector? PrimaryGood practice
in place4
303 What are the main type of state participation in the mining sector? PrimaryData not
available or not applicable
..
304 What is the SOE or state equity share in mining projects? PrimaryData not
available or not applicable
..
305What is the total revenue (turnover) of mining sector SOEs and income from state equity in mining companies as a percentage of GDP?
PrimaryGood practice not in place
1
M4. Significance of Mining Revenues
M4.1 Significance of Mining Revenues
306Government revenues from mining as a percentage of sector revenues—IMF/National statistics
Secondary Low 25%-50% 2
307Government revenues from mining as a percentage of total GDP—IMF/National statistics
SecondaryHigher
50%-75%3
M5. Budget Share of Mining Revenues
M5.1 Budget Share of Mining Revenues
308Total mining revenues as a percentage of total government budget expenditure—IMF GFS or EITI
Secondary Top 75%+ 4
309Mining revenues for subnational governments as a percentage of subnational budgets—National statistics
SecondaryData not
available or not applicable
..
M6. Economic and Employment Share of Mining
M6.1 Economic and Employment Share of Mining
310 What is the number of ASM miners? PrimaryData not
available or not applicable
..
ANNEX 1 THE BOTSWANA MInGov DATA COMPENDIUM
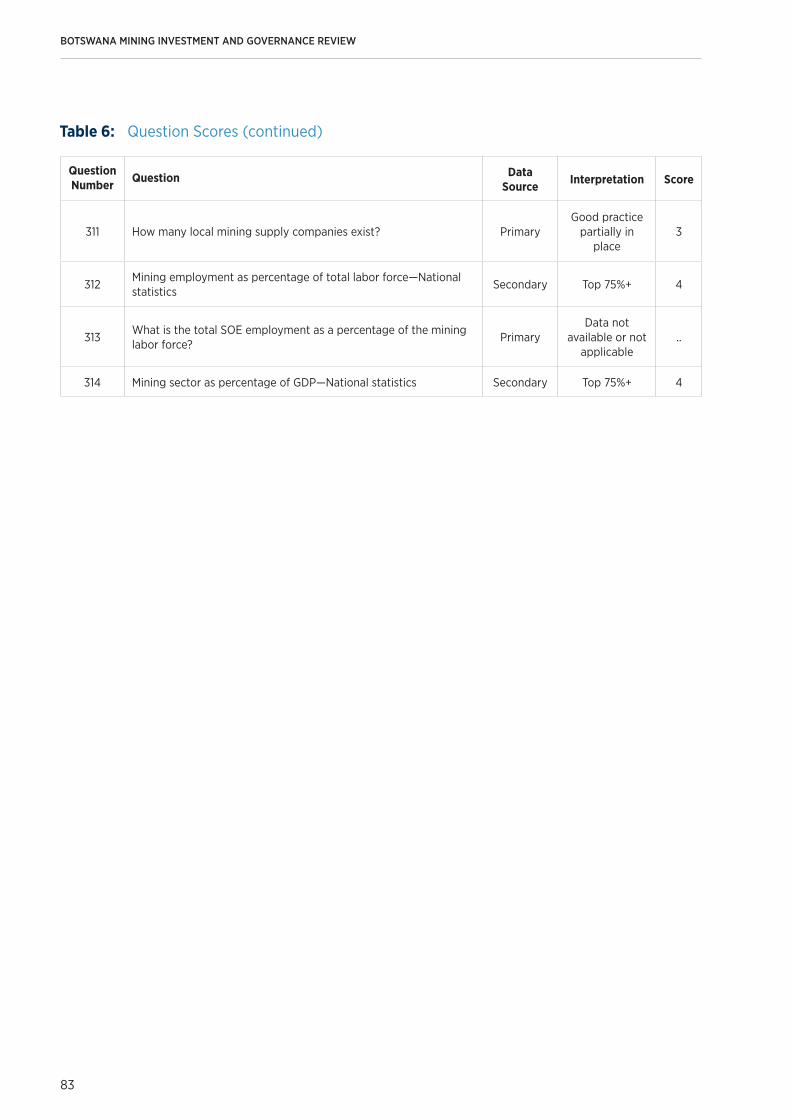
BOTSWANA MINING INVESTMENT AND GOVERNANCE REVIEW
83
Question Number Question Data
Source Interpretation Score
311 How many local mining supply companies exist? PrimaryGood practice
partially in place
3
312Mining employment as percentage of total labor force—National statistics
Secondary Top 75%+ 4
313What is the total SOE employment as a percentage of the mining labor force?
PrimaryData not
available or not applicable
..
314 Mining sector as percentage of GDP—National statistics Secondary Top 75%+ 4
Table 6: Question Scores (continued)


www.worldbank.org/mingov