BOTSWANA ECONOMY: RECENT DEVELOPMENTS AND...
60
BOTSWANA ECONOMY: RECENT DEVELOPMENTS AND PROSPECTS Keith Jefferis – August 15 th , 2016
Transcript of BOTSWANA ECONOMY: RECENT DEVELOPMENTS AND...

BOTSWANA ECONOMY: RECENT DEVELOPMENTS AND PROSPECTS
Keith Jefferis – August 15th, 2016

Contents
¨ Structure of economy ¤ Growth drivers; mining/non-mining
¨ External account ¤ Exports, imports, balance of trade ¤ Exchange rates
¨ Money & prices ¤ Inflation & interest rates
¨ Fiscal accounts ¤ Revenues, spending & budget balance; savings
¨ Banking/financial sector ¤ Credit growth, profitability, liquidity.
¨ Employment, poverty etc ¨ Economic Prospects

Economic Structure & Growth
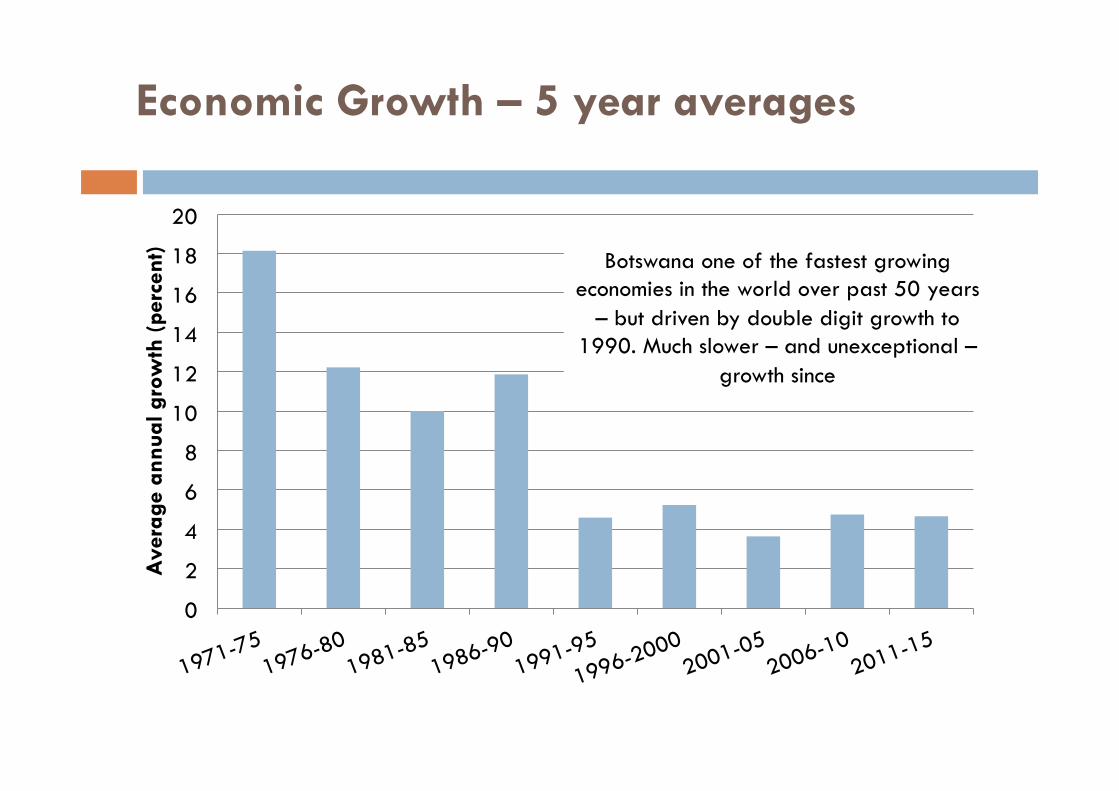
Economic Growth – 5 year averages
0
2
4
6
8
10
12
14
16
18
20
Ave
rage
ann
ual g
row
th (
perc
ent) Botswana one of the fastest growing
economies in the world over past 50 years – but driven by double digit growth to
1990. Much slower – and unexceptional – growth since

Long-term structural change
0%
20%
40%
60%
1966
71
/72
75/7
6 78
/79
81/8
2 84
/85
87/8
8 90
/91
93/9
4 19
96
1999
20
02
2005
20
08
2011
20
14
Mining
0%
20%
40%
60%
1966
71
/72
75/7
6 78
/79
81/8
2 84
/85
87/8
8 90
/91
93/9
4 19
96
1999
20
02
2005
20
08
2011
20
14
Agriculture
0% 5%
10% 15% 20% 25%
1966
71
/72
75/7
6 78
/79
81/8
2 84
/85
87/8
8 90
/91
93/9
4 19
96
1999
20
02
2005
20
08
2011
20
14
Manuf, Constr. Utilities
0% 10% 20% 30% 40% 50%
1966
71
/72
75/7
6 78
/79
81/8
2 84
/85
87/8
8 90
/91
93/9
4 19
96
1999
20
02
2005
20
08
2011
20
14
Services (excl. govt.)
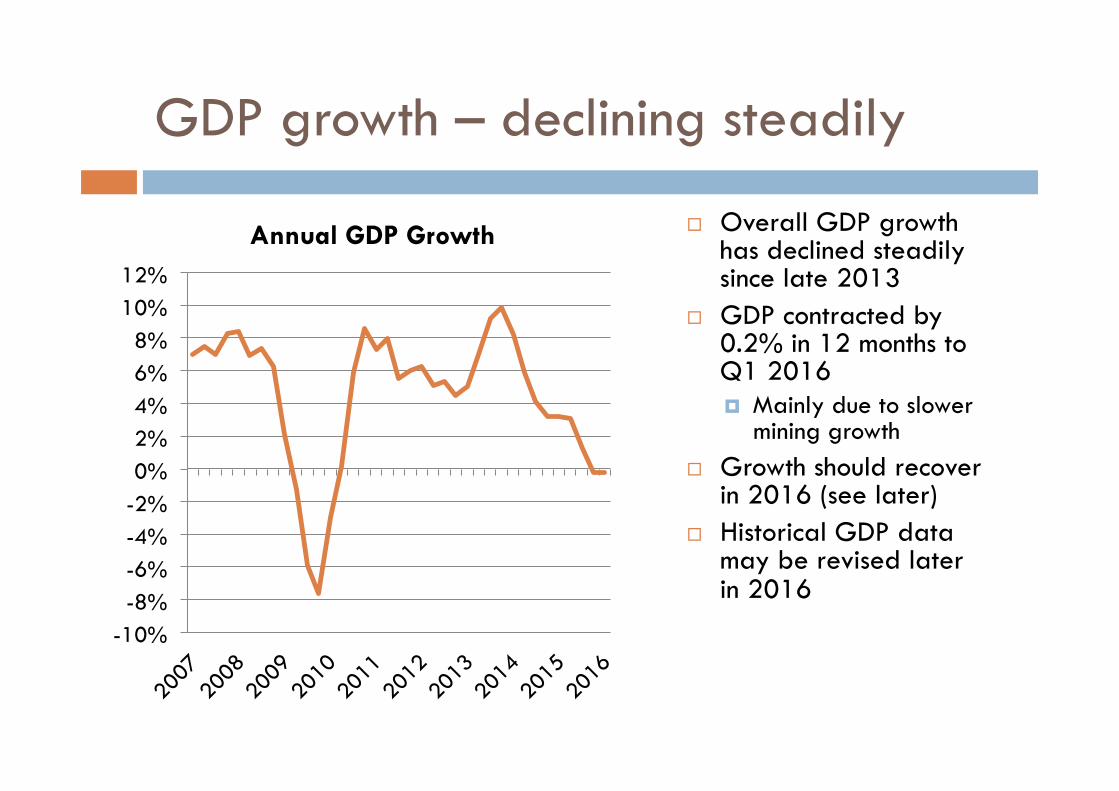
GDP growth – declining steadily
-10% -8% -6% -4% -2% 0% 2% 4% 6% 8%
10% 12%
Annual GDP Growth ¨ Overall GDP growth has declined steadily since late 2013
¨ GDP contracted by 0.2% in 12 months to Q1 2016 ¤ Mainly due to slower
mining growth ¨ Growth should recover
in 2016 (see later) ¨ Historical GDP data
may be revised later in 2016

Mining the main reason for lower growth
-50%
-40%
-30%
-20%
-10%
0%
10%
20%
30% Annual GDP Growth
Mining NMPS-VA
¨ In March 2016: ¤ Annual growth of
mining was minus 21.4%
¤ NMPS was the main driver of growth, at 3.9%
¤ NMPS growth is steady, but is offset by significant mining contractions

Sectoral growth: services still the main driver
-64%
-21%
Water & Elec.
Mining
Agriculture
Total VA
Manuf
Construction
Soc. & Pers. Serv.
Govt
Fin. & Bus. Serv.
Trans. & Comm.
Trade etc ¨ Mixed picture across sectors
¨ Strongest growth in various services sectors
¨ Relatively weak performance in primary/secondary sectors
Source: Stats Botswana

Economic structure – increasingly diversified
Agric 2%
Mining 20%
Manuf 6%
Water & elec 0%
Construc-tion 7% Trade etc
18% Transp. & comms
7%
Fin. & bus. Serv. 16%
Govt 17%
Soc & pers. Serv.
7%
¨ Mining less than one quarter of national output (value added) – 20% in 2015
¨ Economy is more diversified – in terms of production – than is often recognised
¨ Has been becoming more diversified over time
¨ Services now almost 50% (47% in 2015)

Agriculture
Live Stock 63%
Crops 11%
Other 26%
Share of Output – 2015
-6 -5 -4 -3 -2 -1 0 1 2 3 4
Live Stock
Crops Other Agric
perc
ent
Annual Growth Rates
2014 2015
Unstable performance of sub-sectors; weak policy environment; BMC – highly politicised, reforms difficult Other policies – focused on social welfare not commercialisation

Mining
Diamonds 81%
Copper 10%
Coal 0.8%
Soda Ash 3%
Prospecting 3%
Other 2%
Share of Output – 2015
14.2
-40 -35 -30 -25 -20 -15 -10 -5 0
perc
ent
Annual Growth Rates
2014 2015
Overall performance still driven by diamonds; copper-nickel performing badly

Manufacturing
Meat etc 16% Beverage
s 13%
Textiles 3%
Tanning &
Leather 0.3%
Other Manuf 68%
Share of Output – 2015
-10 -8 -6 -4 -2 0 2 4 6 8
10
perc
ent
Annual Growth Rates
2014 2015 Poor data – no breakdown of “other”; doesn’t include diamond cutting yet; textiles highly volatile..

Construction – conflicting data signals
-15% -10% -5% 0% 5%
10% 15% 20% 25% 30% 35% 40%
2007
20
08
2009
20
10
2011
20
12
2013
20
14
2015
20
16
Ann
ual G
row
th
Cement Imports (vol.)
Construction Output (real)
¨ Construction activity has slowed sharply, although still positive growth as recorded by GDP data
¨ Cement import data shows sharper slowdown and negative growth, but more of a recent recovery
¨ Lack of major government projects squeezes whole industry
¨ No sign of ESP impact yet

Services (excl. govt)
Whole-sale 4%
Retail 13%
Hotels & Rest. 15%
Petrol Stn 2.2%
Vehicle deal. 3%
Road 2%
Rail 1%
Air 1%
Communic.
6%
Banks 8%
Insurance 3%
Real Est. 3%
Business Serv. 13%
Other 26%
Share of Output – 2015
-15%
-10%
-5%
0%
5%
10%
15%
Who
lesa
le
Reta
il H
otel
s &
Res
t. Pe
trol S
tn
Vehi
cle
deal
. Ro
ad
Rail
Air
Com
mun
ic.
Bank
s In
sura
nce
Real
Est
. Bu
sines
s Se
rv.
Oth
er
Annual Growth Rates
2014 2015 NB does not fully reflect diamond-related services, e.g.
DBGSS and ODC not yet included

Where is growth coming from?
-6% -4% -2% 0% 2% 4% 6% 8%
10%
Avg. real growth, 2005-15 ¨ Botswana increasingly services driven
¨ Is that growth sustainable, with strong domestic focus?
¨ Long-term services growth will depend on: ¤ Services exports (e.g.
tourism, some business services)
¤ External (regional/international) investment

Sources of growth 2005-2015 – also diversified
-30%
-20%
-10%
0%
10%
20%
30%
Con
tribu
tion
to o
vera
ll VA
gro
wth

External Sector

Exports & Imports – weak performance in 2015H2 but recovery in 2016
¨ Both exports and imports volatile due to impact of diamond aggregation – diamonds now the largest import as well as largest export
¨ Softening of minerals prices (copper, diamonds) as well as Chinese economic slowdown negatively affected mineral exports in second half of 2015
¨ Import bill benefitting from lower international fuel prices
¨ Diamond slowdown apparent in both imports and exports
¨ Strong diamond recovery in Q1 2016
0 2,000 4,000 6,000 8,000
10,000 12,000 14,000 16,000 18,000 20,000 22,000
P m
illio
n/qu
arte
r
Exports Imports

Global Diamond Market - DBGSS sights
0
100
200
300
400
500
600
700
800
900
1000
US$
mill
ion
¨ Dismal H2 2015 apparent in De Beers total sales figures ¤ Price margins between polished and
rough diamonds very narrow ¤ Limited purchasing by cutters &
polishers ¤ Weak final demand (mainly
jewellery) ¤ Diamond pipeline not flowing ¤ Debswana forced to cut production in
response
¨ Strong recovery in 1st 5 sights of 2016 (to June) ¤ Averaging over $600m ¤ Enabling stocks accumulated in 2015
to be sold ¤ Cautious optimism about recovery ¤ Production not yet increased to higher
levels – guidance of 20mcts for 2016 remains, unchanged from 2015

Diamond Exports (Rough, Polished & Re-exports)
-5,000
0
5,000
10,000
15,000
20,000
P m
illio
n
Rough Polished Re-exports
¨ Diamond exports of rough diamond increased drastically in 2016 ¤ From P1,198 at the
end of 2015 to P9,130 in March
¨ Other categories of diamond exports (polished and re-exports) declined in Q1 2016
¨ Botswana is the “swing” producer – sales of BW rough dropped faster than total sales
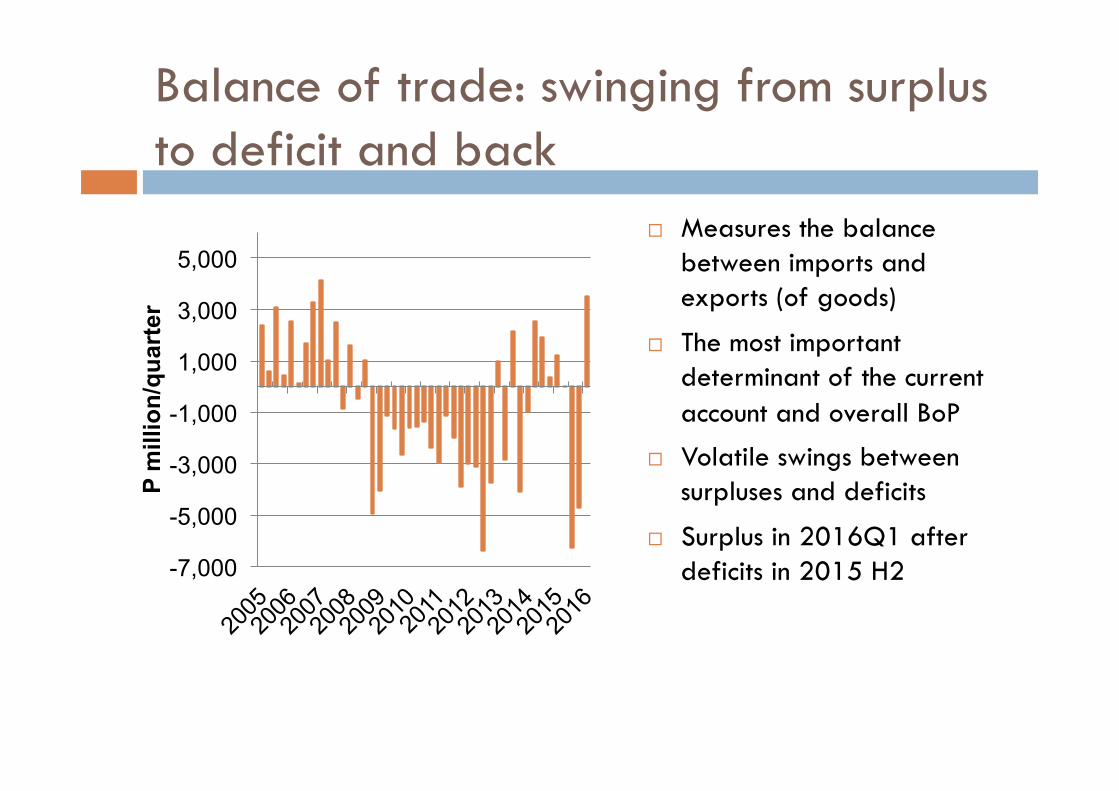
Balance of trade: swinging from surplus to deficit and back
¨ Measures the balance between imports and exports (of goods)
¨ The most important determinant of the current account and overall BoP
¨ Volatile swings between surpluses and deficits
¨ Surplus in 2016Q1 after deficits in 2015 H2
-7,000
-5,000
-3,000
-1,000
1,000
3,000
5,000
P m
illio
n/qu
arte
r

Composition of exports
Diamonds still dominate – but services (mainly
tourism) increasingly important
Meat 2%
Soda Ash 1%
Gold 1%
Textiles 1%
Vehicles and parts 1%
Machinery & electrical eq.
4%
Other manufactures 3%
Copper-nickel 7%
Polished Diamonds 8%
Rough Diamonds 48%
Services 24%
Composition of Exports, 2015 (exc. aggregation)

Exchange Rates
¨ Exchange rates dominated by ZAR weakness & volatility
¨ Trend of depreciation vs USD through to early 2016 has been reversed with ZAR strength
¨ ZAR caught up in EM XR weakness / volatility, compounded by SA specific issues
¨ BWP up from lowest ever level vs USD
¨ Small change in rate of crawl in Jan 2016 (to +0.38%) will have little impact
6
7
8
9
10
11
12 1.00
1.05
1.10
1.15
1.20
1.25
1.30
1.35
1.40
1.45 20
08
2009
2010
2011
2012
2013
2014
2015
2016
ZAR per BWP(LHS) BWP per USD (RHS)

Inflation and Monetary Policy

Inflation ... at unprecedented low levels but has probably bottomed out
0% 2% 4% 6% 8%
10% 12% 14% 16%
2007
20
08
2009
20
10
2011
20
12
2013
20
14
2015
20
16
2017
BoB upper BoB lower
Forecast Inflation
¨ Inflation fell below 6% in June 2013 and has been below the upper end of the BoB range for almost 3 years
¨ At 2.7% in June 2016, inflation is below the lower end of the BoB range.
¨ Main drivers: ¤ Declining international fuel prices ¤ Generally low international inflation ¤ Weak domestic inflationary pressures
¨ Risks: ¤ Water & electricity ¤ Regional food prices
¨ Inflation expected to rise slowly over the next 12 months
¨ Medium-term inflation expectation – around 4%
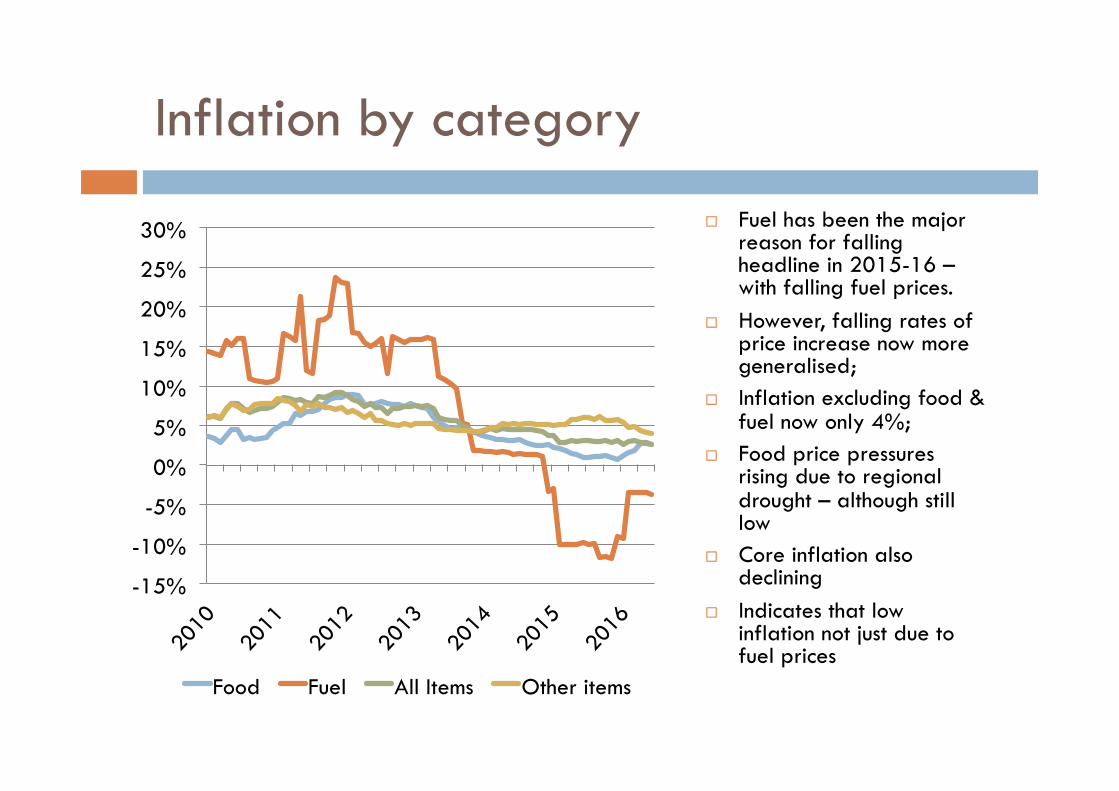
Inflation by category
-15%
-10%
-5%
0%
5%
10%
15%
20%
25%
30%
Food Fuel All Items Other items
¨ Fuel has been the major reason for falling headline in 2015-16 – with falling fuel prices.
¨ However, falling rates of price increase now more generalised;
¨ Inflation excluding food & fuel now only 4%;
¨ Food price pressures rising due to regional drought – although still low
¨ Core inflation also declining
¨ Indicates that low inflation not just due to fuel prices
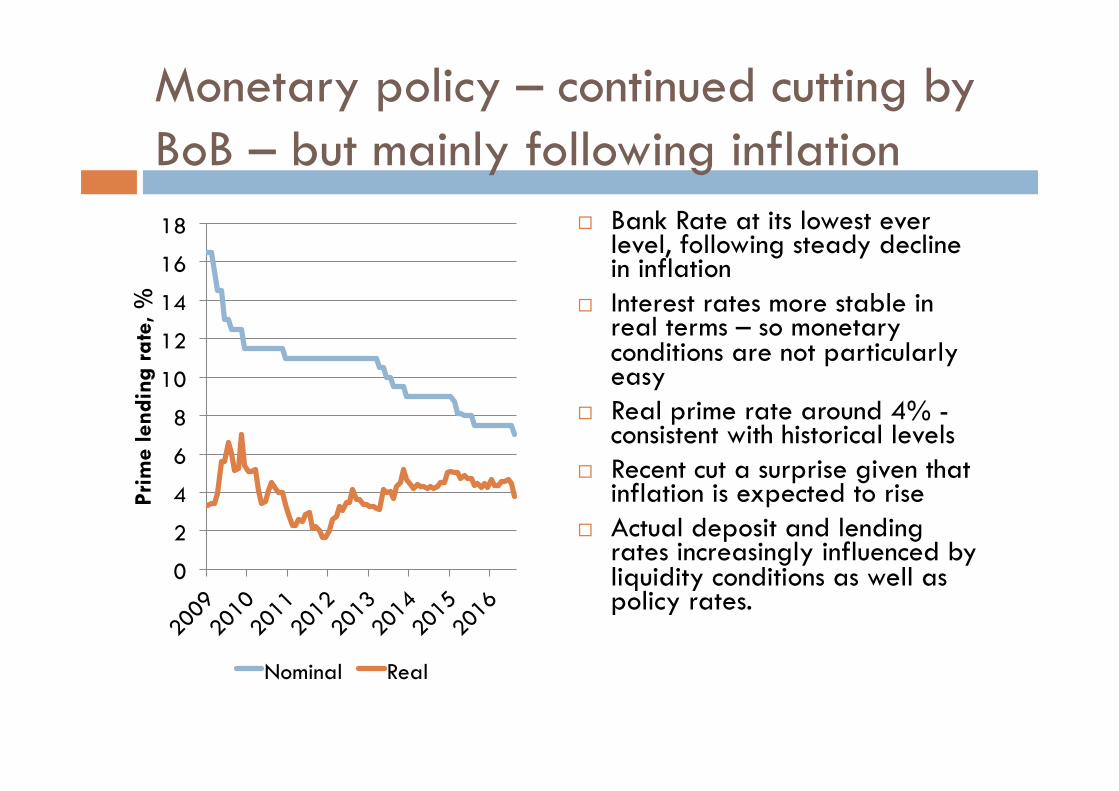
Monetary policy – continued cutting by BoB – but mainly following inflation
0
2
4
6
8
10
12
14
16
18
Prim
e le
ndin
g ra
te, %
Nominal Real
¨ Bank Rate at its lowest ever level, following steady decline in inflation
¨ Interest rates more stable in real terms – so monetary conditions are not particularly easy
¨ Real prime rate around 4% - consistent with historical levels
¨ Recent cut a surprise given that inflation is expected to rise
¨ Actual deposit and lending rates increasingly influenced by liquidity conditions as well as policy rates.
Government Budget
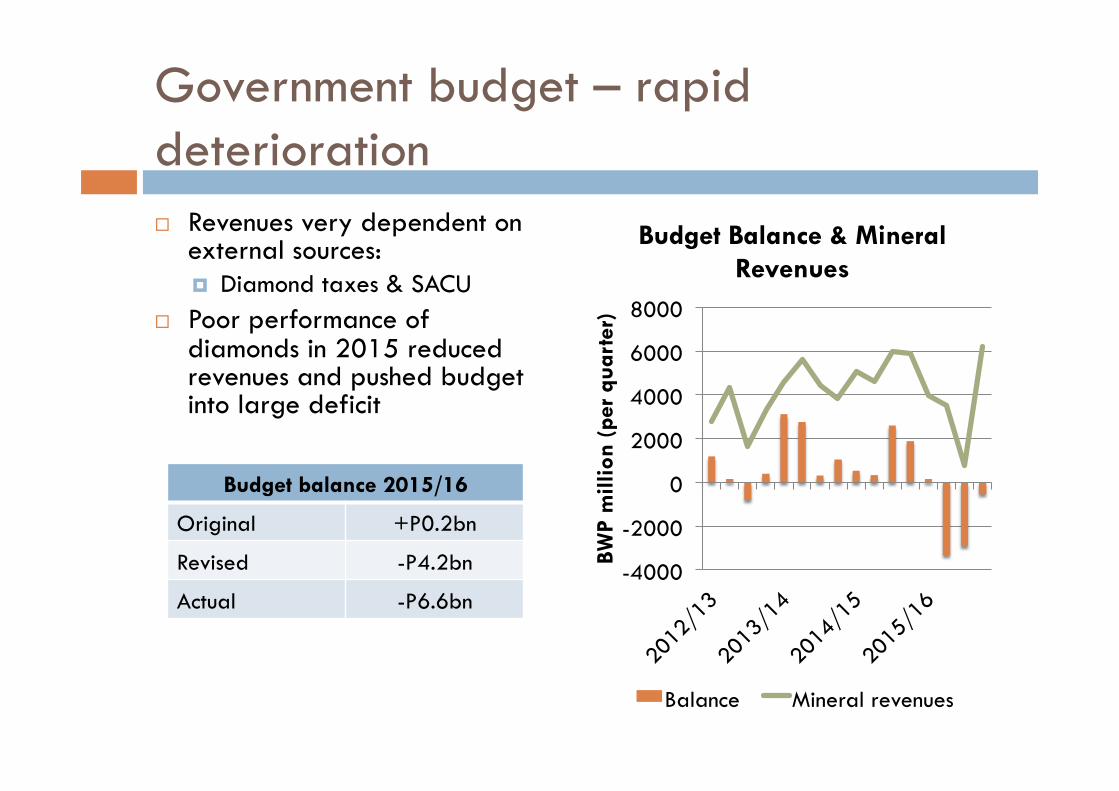
Government budget – rapid deterioration ¨ Revenues very dependent on
external sources: ¤ Diamond taxes & SACU
¨ Poor performance of diamonds in 2015 reduced revenues and pushed budget into large deficit
-4000
-2000
0
2000
4000
6000
8000
BWP
mill
ion
(per
qua
rter
)
Budget Balance & Mineral Revenues
Balance Mineral revenues
Budget balance 2015/16
Original +P0.2bn
Revised -P4.2bn
Actual -P6.6bn

Government budget – entering era of prolonged deficits ¨ Revenues in long-term
decline ¨ Spending also has to be
cut (as % of GDP) ¨ MTEF projects deficits
through to 2018 ¨ Revised projections for
NDP11 suggests deficits throughout
¨ Deficit can be funded but will require both additional borrowing and drawdown of savings
-20%
-10%
0%
10%
20%
30%
40%
50%
60%
2009
20
10
2011
20
12
2013
20
14
2015
20
16
2017
20
18
Perc
ent o
f G
DP
Balance Spending Revenue
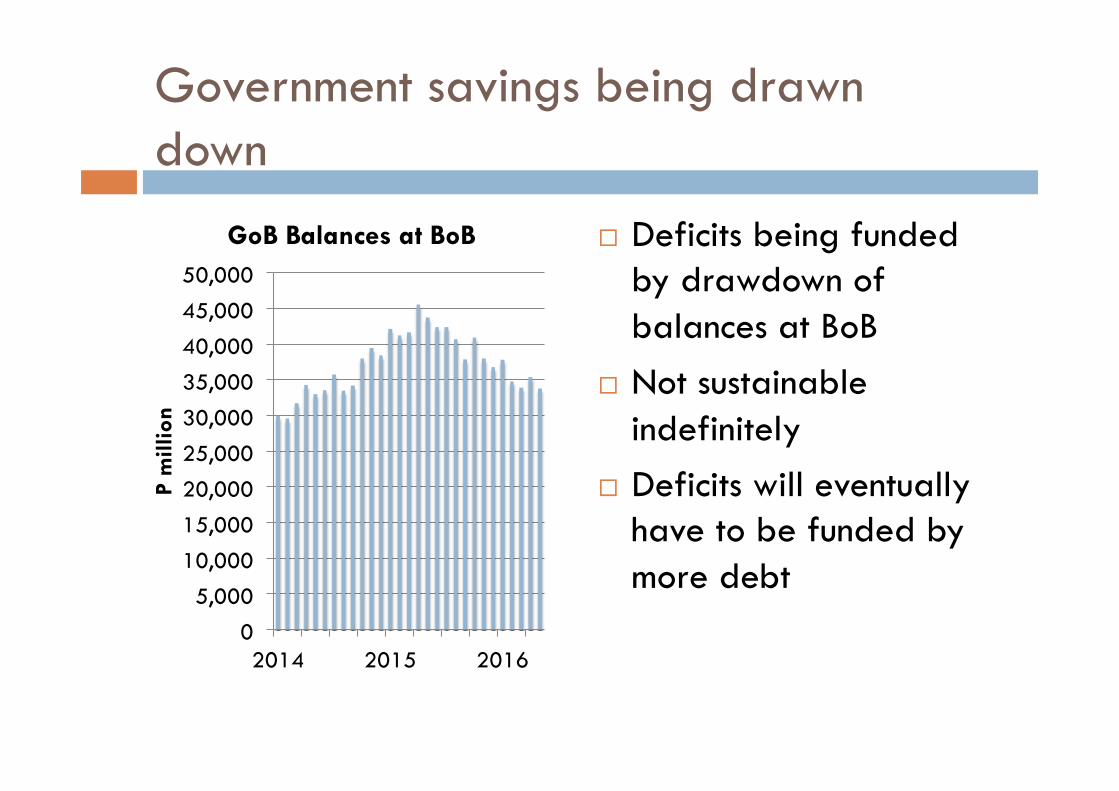
Government savings being drawn down
0 5,000
10,000 15,000 20,000 25,000 30,000 35,000 40,000 45,000 50,000
2014 2015 2016
P m
illio
n
GoB Balances at BoB ¨ Deficits being funded by drawdown of balances at BoB
¨ Not sustainable indefinitely
¨ Deficits will eventually have to be funded by more debt

How much does government have to finance budget deficits?
¨ Pula Fund: P61.1 billion (December 2015)
¨ o/w GoB share: P35.0 billion (=GIA balance)
¨ Approx. 24% of GDP
¨ Statutory limit: 40% of GDP
¨ Current borrowing: 22% of GDP (March 2016)
¨ In principle, could raise a further 18% of GDP (P27bn)
¨ Commitments to g’tee BCL USD bond will exhaust FX borrowing limit – additional borrowing will have to be in BWP
Financial Assets (Gross) Borrowing Capacity
Pula Fund and GIA have dual purposes: - short-term stabilisation - to provide long-term income once diamonds run out (Fund for Future Generations) - no rules on allocation between two functions - can easily be depleted for short-term gain

NDP 11 – behind schedule
¨ NDP 11 still being finalised ¤ Updating of macro projections, expenditure ceiling ¤ Project list and funding ¤ Co-ordination with Vision 2036
¨ Has been presented to Cabinet ¨ Will be presented to Parliament in Nov/Dec ¨ List of approved development projects will be
crucial

The Banking Sector

Rapidly declining profitability
0%
10%
20%
30%
40%
50%
60%
2003
20
04
2005
20
06
2007
20
08
2009
20
10
2011
20
12
2013
20
14
2015
Return on Equity (post-tax) ¨ Profitability (RoE) has been declining for a long period
¨ Dropped further to 12.5% 2015.
¨ Profits decline due to: ¤ Competition ¤ Saturation of key
market segments ¤ Lower policy interest
rates ¤ Regulatory
interventions
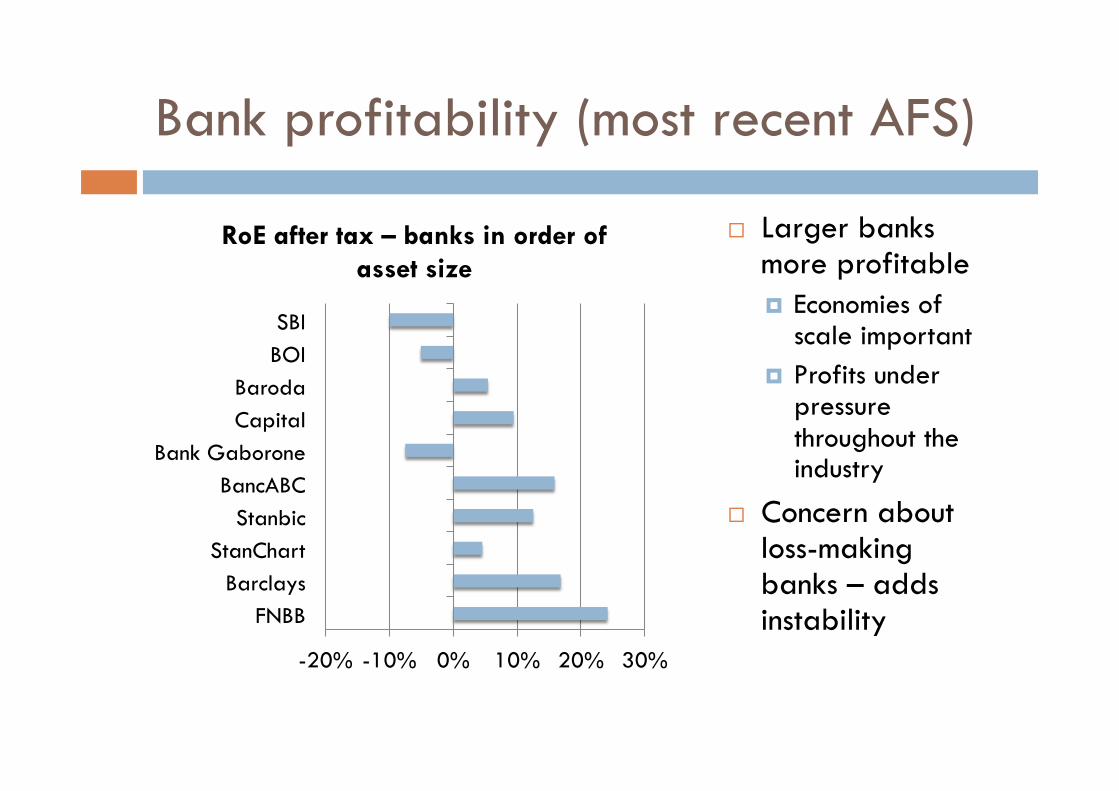
Bank profitability (most recent AFS)
-20% -10% 0% 10% 20% 30%
FNBB Barclays
StanChart Stanbic
BancABC Bank Gaborone
Capital Baroda
BOI SBI
RoE after tax – banks in order of asset size
¨ Larger banks more profitable ¤ Economies of
scale important ¤ Profits under
pressure throughout the industry
¨ Concern about loss-making banks – adds instability

Bank credit: slowdown continues, but stabilised
¨ Overall credit growth declining from early 2012 to May 2016
¨ Decline appears to have bottomed out
¨ Annual growth of 9.7% in May 2016
¨ Comparable to nominal non-mining GDP growth (10.5% in yr to March)
0%
5%
10%
15%
20%
25%
30%
35%
Year
on
year
gro
wth

Bank credit: divergence between household and business credit
¨ Households the main driver of credit growth
¨ Growth in credit to businesses still very weak
¨ Growth in year to May: ¤ Private business:
4.3% ¤ Households:
12.9%
0% 5%
10% 15% 20% 25% 30% 35% 40% 45% 50%
Year
on
year
gro
wth

Arrears on bank credit
0% 1% 2% 3% 4% 5% 6% 7% 8% 9%
10%
Business HH Total
¨ Sharp upturn in arrears in 2016Q1 (but new reporting?)
¨ Across all categories – business & households
¨ Business arrears (March 2016): ¤ Agriculture 13.8% ¤ Manufacturing 1.8% ¤ Construction 8.6% ¤ Trade 4.0% ¤ Real estate 1.9%

Banking environment volatility – especially deposits
0
10,000
20,000
30,000
40,000
50,000
60,000
70,000
P m
illio
n
Deposits Lending
¨ Bank deposit base much less stable than lending ¤ BPOPF funds ¤ Parastatals
¨ Reflects maturity differences
¨ Deposit-lending gap highly unstable

Liquidity environment – volatile
0%
2%
4%
6%
8%
10%
12%
14%
Perc
ent o
f to
tal a
sset
s
Excess banking liquid assets
¨ Banking liquidity: ¤ Recovered strongly after
2014 crisis, ¤ Due to regulatory changes
and faster deposit growth ¤ Has since fallen back
somewhat ¤ Has largely stabilized at
manageable level ¤ Banks no longer chasing
deposits with high interest rates
¨ Still concerns that deposit base will prove unstable – hence caution in lending

Payments Trends (volumes)
0
1,000
2,000
3,000
4,000
5,000
6,000
7,000
No.
of
tran
sact
ions
(‘0
00)
Cheques EFTs
0
5,000
10,000
15,000
20,000
25,000
30,000
35,000
2006
20
07
2008
20
09
2010
20
11
2012
20
13
2014
20
15
No.
of
tran
sact
ions
(‘0
00)
EFT-POS ATM

Pension Funds
0
10
20
30
40
50
60
70
80 20
04
2005
20
06
2007
20
08
2009
20
10
2011
20
12
2013
20
14
2015
Assets (P bn) Offshore %
¨ Still growing in BWP terms – P74.8bn in 2015
¨ Almost as large as banking system (P76.7bn)
¨ 2015 increase largely driven by exchange rates – steady at just over USD$6bn in recent years
¨ Offshore proportion steady around 60% - unlikely to change dramatically

Labour Market

Formal employment – very slow growth
¨ Very little increase in formal employment in past four years
¨ Average employment growth rate less than 0.5% p.a.
¨ Approx 1,500 new jobs a year
¨ Compares with approx 20,000 net new entrants to the labour force each year
¨ Unemployment officially around 20% but in reality much higher 0
50,000
100,000
150,000
200,000
250,000
300,000
350,000
2004
20
05
2006
20
07
2008
20
09
2010
20
11
2012
20
13
2014
20
15
Form
al S
ecto
r Em
ploy
men
t
Private Parastatal Govt

Entry to and exit from labour force
New entrants (40k)
Labour Force (26k)
Formal sector (3k) Unemployed,
informal, agric (23k)
Not in LF (14k)
About 6,000 retirees from labour force, releasing around 1,500 formal jobs

Importance of Govt. wage and welfare payments Category Number (‘000) Total Value (per year)
Employees
Employment – private sector 190 12,000
Employment – public sector 150 18,000
Govt Transfer Recipients
Old Age Pensioners* 100 400
WW2 vets*
Destitutes* 32 150
Ipelegeng 60 350
OVC carers* 40 200
Tertiary students 40 600
ISPAAD farmers 130 400
LIMID farmers 18 100
Total welfare recipients 420 2,200
Total Govt Dependents (transfers + employees)
570 20,000

Economic Outlook

Business Confidence % of firms rating current business conditions satisfactory
0% 10% 20% 30% 40% 50% 60% 70% 80% 90%
100%
Exporters Non-Exporters All
¨ Volatile confidence levels, especially amongst exporters (small sample?)
¨ Long-term downward trend
¨ No real recovery since global financial crisis
¨ Private sector concerns about water & electricity shortages

Growth forecasts - IMF
-2
0
2
4
6
8
10
12
2012
20
13
2014
20
15
2016
20
17
2018
20
19
2020
perc
ent
Actual Projected
¨ IMF and GoB forecasting a reasonable recovery in 2016 ¤ Diamond market
stability ¤ ESP
¨ Medium-term growth rates of 4-5% (NDP11)

Global Diamond Market
¨ 2015 was very difficult : ¤ Weakening final demand (for jewellery), with global growth slowdown,
especially China ¤ Cutters/polishers squeezed between high rough prices (De Beers) and weak
final demand (cannot pass on high input prices) ¤ Reduction in prices mid-year, with sharp reduction in rough supply in H2 ¤ Enabled excess stock to be run down
¨ First half of 2016 much better ¤ Christmas 2015 season was positive ¤ Re-stocking lifted the market in early 2016 ¤ Pipeline now flowing again, albeit at lower levels
¨ Still high risk and uncertainty ¤ Shortage of financing – Stanchart withdrawal from diamond chain financing ¤ Final demand still weak ¤ Not enough recovery to lift rough production

Botswana diamond industry
¨ Failure of downstream market to recover in mid 2015, and small sights forced Debswana to cut back production (could not continue to stockpile)
¨ 2016 production target cut by 20% from 24 to 20mcts. ¨ Still maintained despite some market recovery ¨ ODC also experienced weak market in 2015, better in 2016 ¨ Mixed picture from small mines
¤ Karowe (Lucara) lifted by large stones ¤ Ghagoo (Gem) struggling – production cut back ¤ Lerala (Kimberley) restarting production
¨ Cutting & polishing still under pressure – employment only half of peak

Domestic growth outlook – balance shifting towards positives ¨ Positive news:
¤ Inflation and interest rates at historic lows, should remain ¤ Fears of large fiscal and BoP deficits in 2015H2 somewhat alleviated ¤ Diamond market stabilised, although not yet recovering ¤ Copper-nickel prices off lows, although still weak ¤ ESP impact on construction, infrastructure ¤ Alleviation of power, water supply problems
¨ Negative news: ¤ Increased global uncertainty; risks mostly on the downside ¤ Regional drought impact on food prices ¤ Regional economies: SA slow growth, Zimbabwe crisis, Zambia downturn ¤ BCL sustainability issues ¤ Ability to implement changes envisaged in NDP 11 & V2036

Regional Expansion – BSE-listed companies Company Industry Country
Letshego Financial Services Uganda, Swaziland, Tanzania, Zambia, Namibia, Mozambique, Kenya, Lesotho, Rwanda, South Sudan*
Turnstar Property Tanzania
Funeral Services Group (FSG)
Consumer Services, Financial Services Zambia, South Africa
Sefalana Retail Zambia, Namibia
PrimeTime Property Zambia
RDCP Property, Tourism Madagascar, South Africa
Choppies Retail South Africa, Zimbabwe, Zambia, Kenya
Chobe Tourism Namibia
Cresta Marakanelo Tourism Zambia
Furnmart Retail South Africa, Namibia, Zambia
Wilderness Tourism Namibia, South Africa, Malawi, Zimbabwe, Zambia, Seychelles, Congo, Kenya
BIHL Financial Services Zambia, Malawi, Mozambique, Tanzania, Uganda, Zambia
Imara Financial Services UK, Malawi, South Africa, Namibia, Zambia, Zimbabwe, Mauritius, Angola, Kenya, Nigeria
Drivers of Regional Expansion
¨ Limits of BW market reached ¨ Mostly services (non-tradeables) – cannot be
exported directly – hence outward FDI needed ¨ Domestic success ¨ Strong management teams ¨ Good business model ¨ BW suited to regional HQ ¨ Capital on balance sheet ¨ Access to competitive loan funding

SSA growth projections 2016-20 (IMF)
0 1,000 2,000 3,000 4,000 5,000 6,000 7,000 8,000 9,000 10,000
0
1
2
3
4
5
6
7
8
9
Swaz
iland
So
uth
Afr
ica
Rep.
of
Con
go
Ang
ola
Seyc
helle
s N
iger
ia
Com
oros
Zi
mba
bwe
Eritr
ea
Cha
d C
abo
Verd
e Le
soth
o M
aurit
ius
The
Gam
bia
Botsw
ana
Buru
ndi
Mal
awi
Gab
on
Mad
agas
car
Cam
eroo
n M
ali
Sier
ra L
eone
Za
mbi
a G
uine
a-Bi
ssau
N
amib
ia
Sout
h Su
dan
Beni
n To
go
Cen
t. A
f. Re
p.
Libe
ria
São
Tom
é D
RC
Gui
nea
Burk
ina
Faso
U
gand
a G
hana
Ke
nya
Tanz
ania
N
iger
Et
hiop
ia
Rwan
da
Sene
gal
Moz
ambi
que
Côt
e d'
Ivoi
re
GD
P/ca
pita
(U
SD)
2015
Ave
rage
ann
ual g
row
th
Average 2016-20 GDP/cap SADC countries In brown

Macroeconomic Forecasts (Econsult)
2016 2017
GDP growth (real) 3.2% 3.1%
- mining -2.0% 2.0%
- non-mining 4.1% 3.3%
Govt. spending growth (real)
0% 0%
Bank rate (eoy) 5.5% 6.0%
Inflation rate (eoy) 3.5% 4.2%
BWP per USD 10.5 ..
ZAR per BWP 1.33 ..

Economic Stimulus Package
¨ Not much public information has been provided, other than what is contained in the initial transcript, and brochure listing broad ESP initiatives
¨ Plan will target tourism, manufacturing, farming, building of roads and homes, education and health facilities
¨ Key aspects (in theory): ¤ High impact projects that have substantial ROI ¤ Firm M&E Framework (so as to avoid cost overruns and
delivery of quality products efficiently and effectively)

Economic Stimulus Package - 2
¨ ESP is a medium-term project (3 years), so will take a while to have an impact
¨ Very few “shovel-ready” projects – major new projects need detailed design and specification (e.g. by-passes) or organisational development (SEZs)
¨ Initial ESP projects are those that had already been planned & designed, but postponed due to lack of funds
¨ Some re-packaging of projects that would have happened anyway (e.g. SEZs)
¨ Approx P1.4 bn of ESP money in 2015/16 budget, P2.2bn in 2016/17 budget, which should contribute around 1.5% to GDP growth.
¨ Concerns that proper project appraisal and procurement may be overlooked

Thank You