BOREHOLE GEOPHYSICAL METHODS - School of …engr.uconn.edu/~lanbo/G228378Lect0511BH.pdf · –...
60
BOREHOLE GEOPHYSICAL METHODS The simplified version of the lecture by Carole D. Johnson USGS, Office of Ground Water Branch of Geophysics Storrs, Connecticut
Transcript of BOREHOLE GEOPHYSICAL METHODS - School of …engr.uconn.edu/~lanbo/G228378Lect0511BH.pdf · –...
BOREHOLE GEOPHYSICAL METHODS
The simplified version of the lecture by Carole D. Johnson
USGS, Office of Ground WaterBranch of Geophysics
Storrs, Connecticut

BOREHOLE GEOPHYSICAL METHODS
• Characterize:– Borehole conditions – Formation – Fractures – Fluid
• Tools:– Conventional– Borehole-Wall Imaging and deviation– Flowmeter– Radar Methods– Tomography
• Hydrologic Testing

Conventional Borehole Methods
• Caliper• Gamma• Temperature• Fluid resistivity• Formation resistivity• Electric and electromagnetic

Geophysical Logs
• Continuous• Unbiased• High resolution• Synergistic
EM CONDUCTIVITY (mS/m)0 50 100 150
0
8
6
4
2
DEP
TH (
MET
ERS)
Background
Contaminated
Conventional screened interval

CALIPER– Diameter of borehole
– Changes related to drilling and well construction, lithology, fractures, and solution zones
– Mechanical caliper - three arm averaging
– Acoustic caliper – calculated from acoustic transit time and velocity
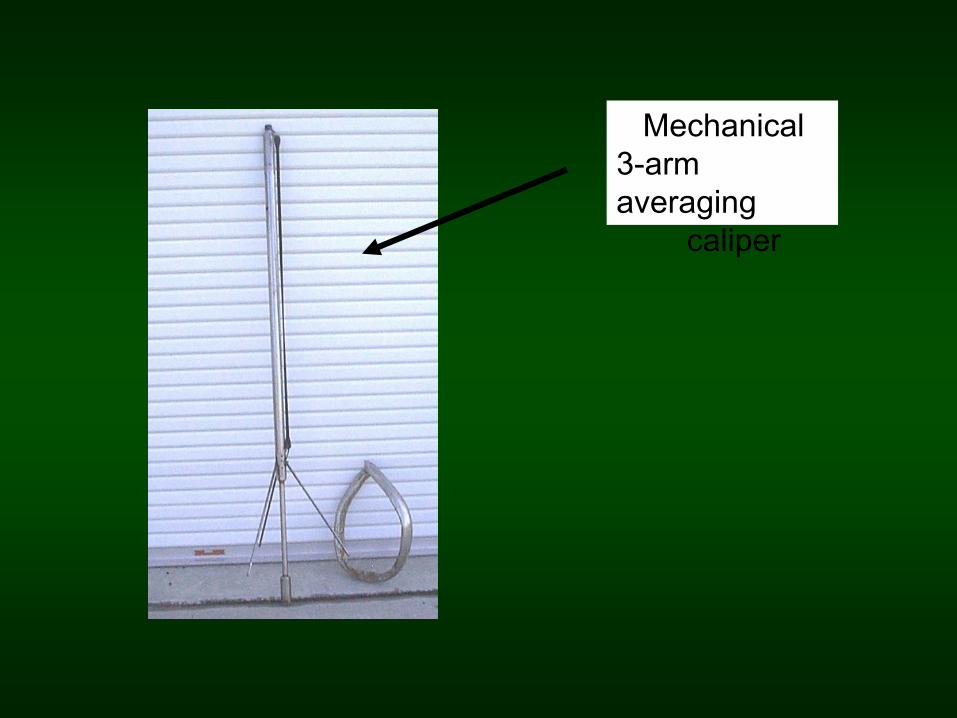
Mechanical3-arm averaging
caliper
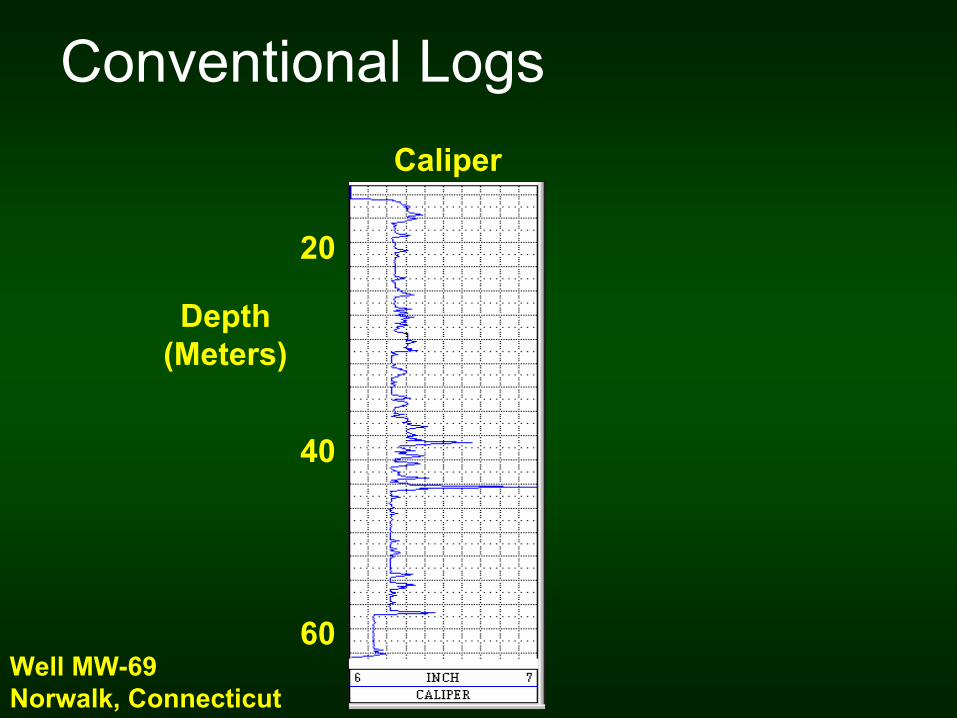
Caliper
Conventional Logs
Well MW-69Norwalk, Connecticut
20
40
60
Depth(Meters)

GAMMA LOGS– Natural emission (cps or API units)
– Uranium, thorium, and potassium 40
– Clay content, alteration, and mineralogy, stratigraphic correlation
– Vertical resolution 1 to 2 ft– Used in:
– Air , water, or mud filled; – Open, PVC or steel cased

Dep
thGamma
Counts per secondLithology
Sand andGravel
Silt andClay
Water Table

Spectral Gamma – Counts gamma emissions (0.1-3 MeV)– Can be used in air , water, or mud filled;
open, PVC or steel cased borheoles– High vertical resolution– Identify uranium, thorium, and potassium 40
sources for: –Structural and stratigraphic correlation –Water-rock interaction studies–Clay content and mineralogy
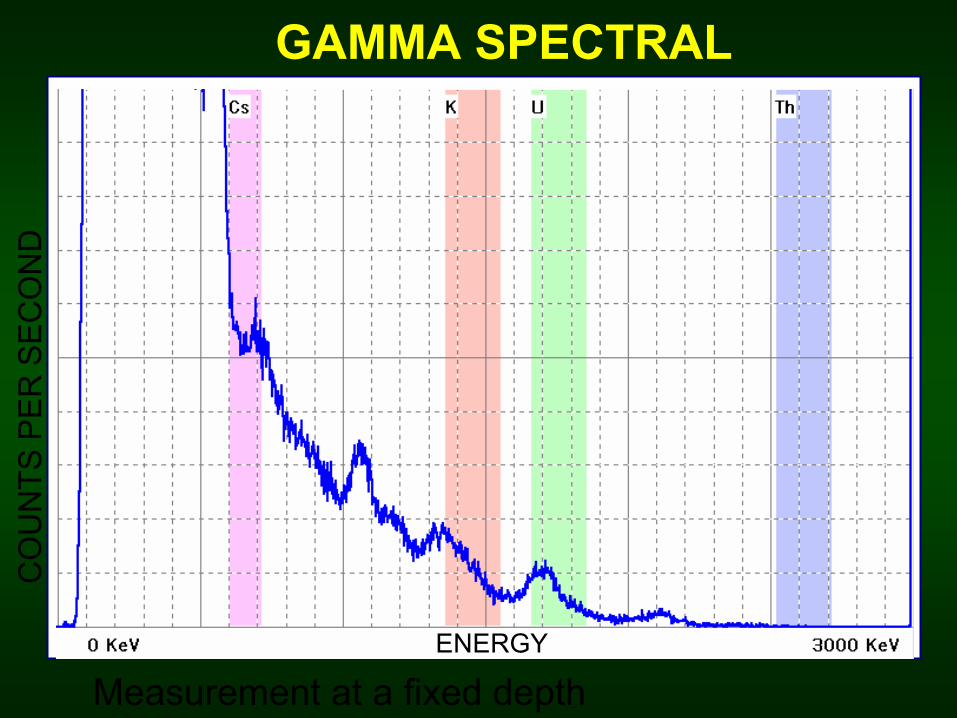
GAMMA SPECTRAL
Measurement at a fixed depthENERGY
CO
UN
TS P
ER
SE
CO
ND

• Continuous profile in the borehole• Indicates potential inflow or outflow zones• Gradually increases with geothermal
gradient usually 1oF per 100 feet• Sometimes shown as del Temp, which is
the first derivative of the temp. plot –helps identify changes in slope of the line
TEMPERATURE
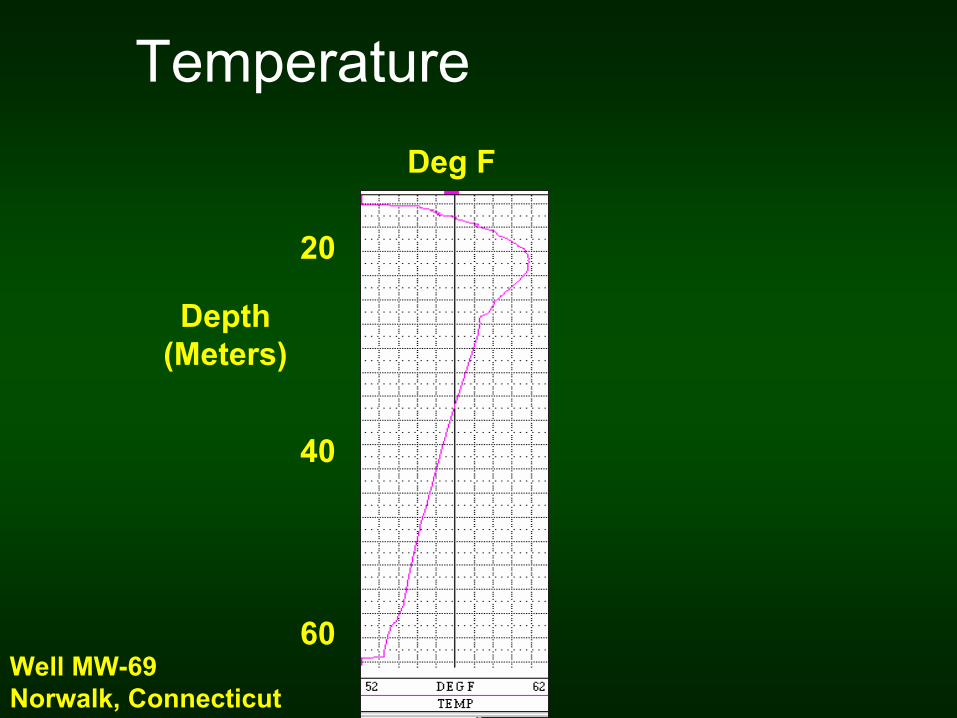
Deg F
Temperature
Well MW-69Norwalk, Connecticut
20
40
60
Depth(Meters)

• Fluid resistivity • Single-Point Resistance• Long and Short Normal Resistivity• Electromagnetic Induction
RESISTIVITY LOGS

DE
PTH
IN F
EE
T
TEMPERATURE49 (DEG F) 53
GAMMA0 (CPS) 500
ATVN E S W N
OTVN E S W N
SPECIFIC CONDUCTANCE300 (uS/cm) 700
FORMATION CONDUCTIVITY
0 (mS/m) 250MW105R
MECHANICAL CALIPER
5.7 (INCHES) 6.6
FM Fluid Physical characteristics
Hydraulic Tests
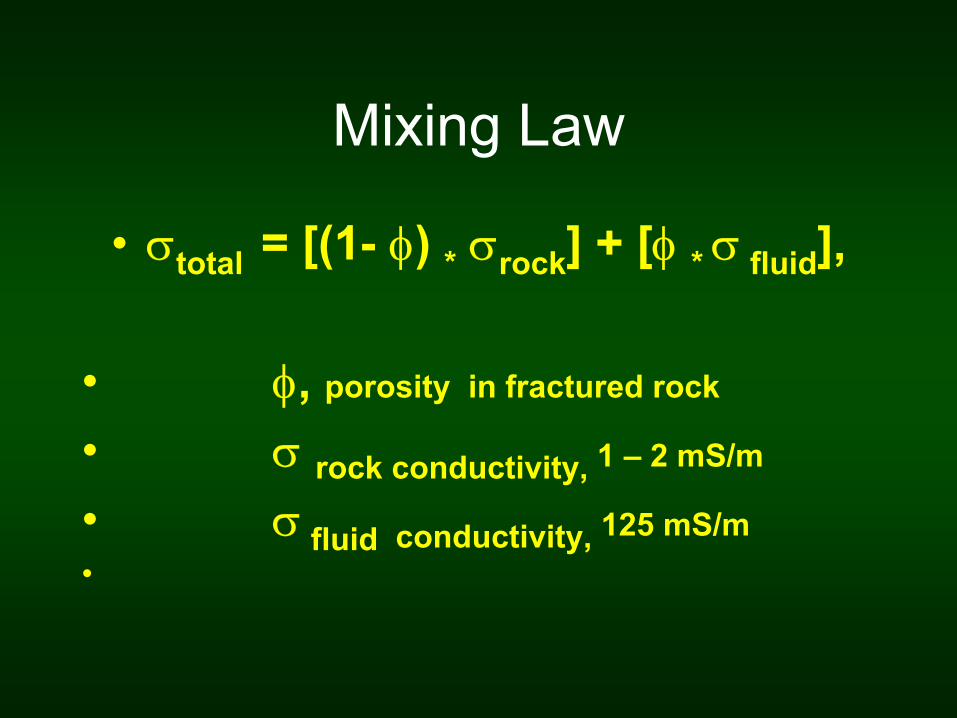
Mixing Law
• σtotal = [(1- φ) * σrock] + [φ * σ fluid],
• φ, porosity in fractured rock
• σ rock conductivity, 1 – 2 mS/m
• σ fluid conductivity, 125 mS/m•
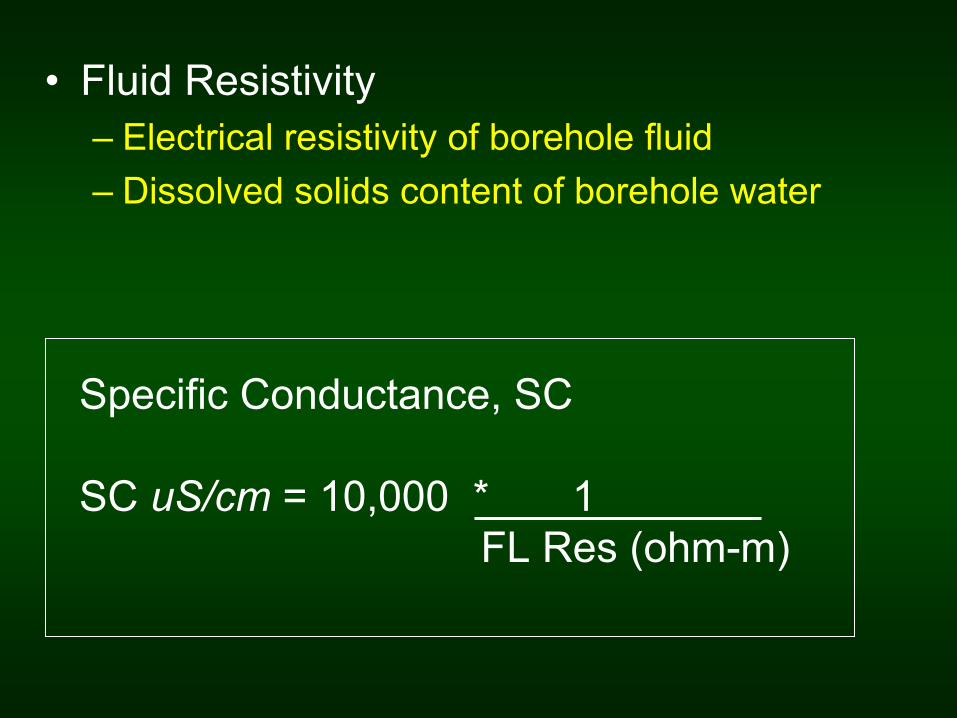
• Fluid Resistivity– Electrical resistivity of borehole fluid– Dissolved solids content of borehole water
Specific Conductance, SC
SC uS/cm = 10,000 * 1FL Res (ohm-m)

• Fluid Resistivity– Electrical resistivity of borehole fluid– Dissolved solids content of borehole water
– Compensate to 25 deg C with temperature logSPEC COND uS/cm @ 25 deg C
= 10000/((1 + 0.022 * (((5 * (TEMP deg F - 32))/9) - 25)) * FL RES ohm-m)
Specific Conductance, SC
SC uS/cm = 10,000 * 1FL Res (ohm-m)
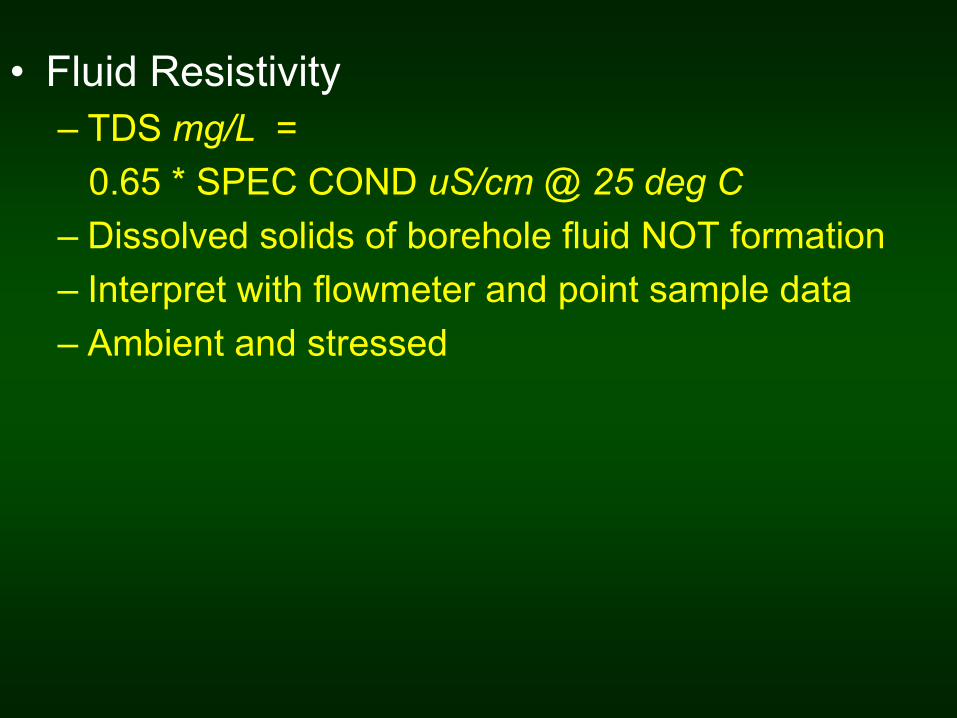
• Fluid Resistivity– TDS mg/L =
0.65 * SPEC COND uS/cm @ 25 deg C– Dissolved solids of borehole fluid NOT formation– Interpret with flowmeter and point sample data– Ambient and stressed

CaliperTemperatureFluid
Conductivity
Fluid and Caliper Logs
Well MW-69Norwalk, Connecticut
20
40
60
Depth(Meters)

FLUID LOGGING - DIFFERENCINGCALIPER TEMPERATURE FLUID
RESISTIVITY
Ambient
Pumping

• Single-Point Resistance– Electrical resistance between a surface electrode
and a downhole electrode – Clay content, porosity,
and dissolved solids– Resistance(ohms)
NOT resistivity(ohms-m)– Affected by borehole fluid
and diameter– Water or mud filled
open hole – High vertical resolution

Single-Point Resistance
Depth of Investigation

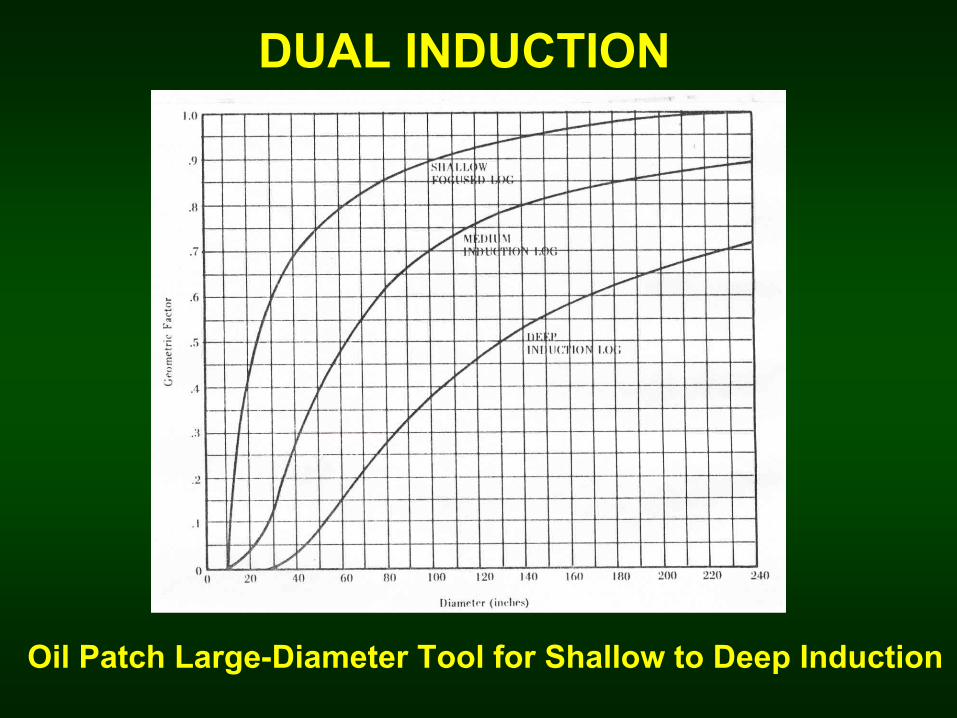
DUAL INDUCTION
Oil Patch Large-Diameter Tool for Shallow to Deep Induction

DUAL INDUCTION
Slimhole Tool for Medium and Deep EM Conductivity

CALIBRATION MSI DIL45-NG
~ 6.5 ft
~ To
ol le
n gth
2.7
5 m
or
9ft
ILM 1980 mS/m and ILD 582 mS/m

Dep
thGamma
EM Conductivity Lithology
Sand andGravel
Silt andClay
Water Table

EM Conductivity, in mS/m Gamma, in cps
Dep
th, i
n M
eter
s0
0
4
8
16
20
12
40 80 0 40 80 120

Dep
thEM
ConductivityGamma Lithology and Water Quality
Sand andGravel
Silt andClay
Water Table
Zone withelectricallyconductivecontamination
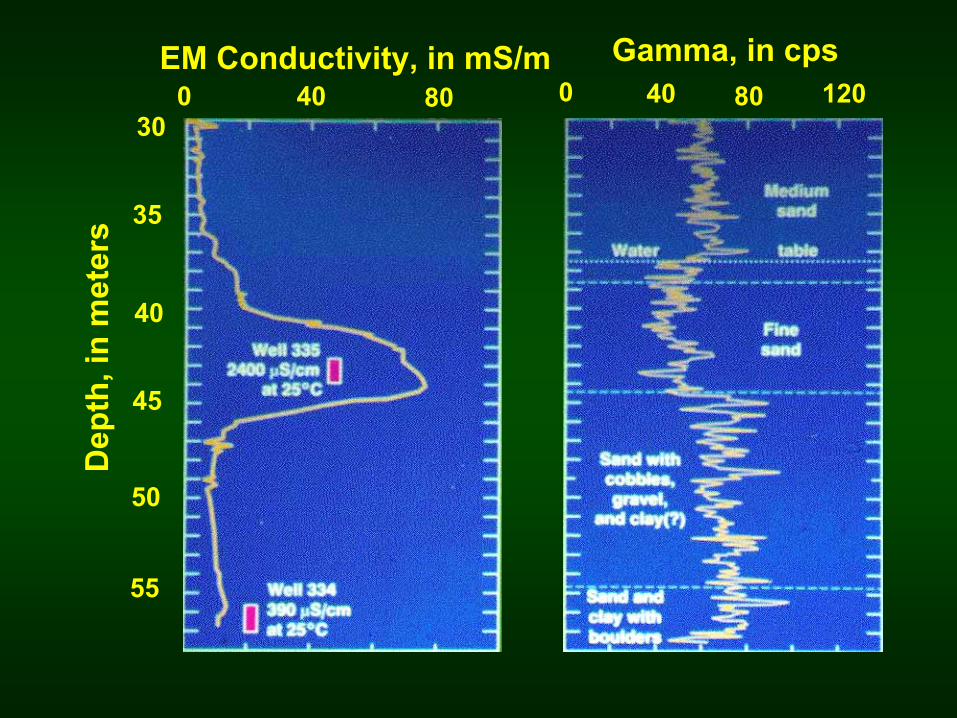
EM Conductivity, in mS/m Gamma, in cpsD
epth
, in
met
ers
30
45
40
50
55
35
0 40 80 0 40 80 120

GAMMA and EM Signatures
• Lithology / stratigraphy• Contamination• Radioactive signatures• Saline intrusions• Well construction
100
20
120
60
40
80
0
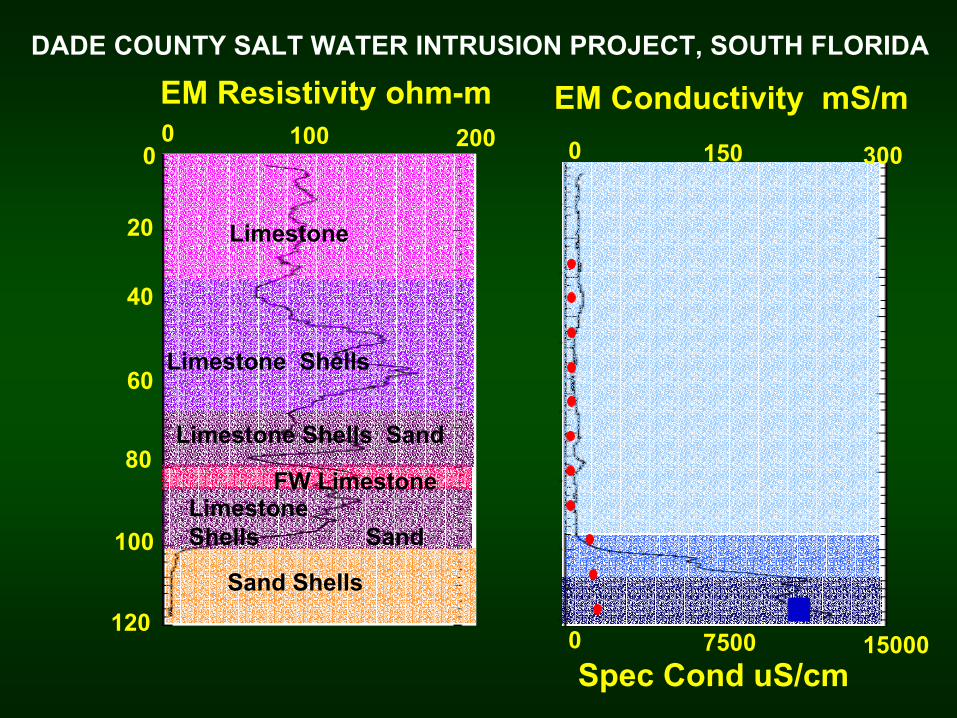
EM Resistivity ohm-m1000 200
Limestone Shells
Limestone
Limestone Shells Sand
FW Limestone Limestone Shells Sand
Sand Shells
EM Conductivity mS/m
75000 15000
0
20
40
60
80
100
120
Spec Cond uS/cm
1500 300
DADE COUNTY SALT WATER INTRUSION PROJECT, SOUTH FLORIDA

BOREHOLE GEOPHYSICAL METHODS
• Characterize:– Borehole conditions – Formation – Fractures – Fluid
• Tools:– Conventional–– BoreholeBorehole--Wall Imaging and deviationWall Imaging and deviation– Flowmeter– Radar Methods– Tomography
• Hydrologic Testing

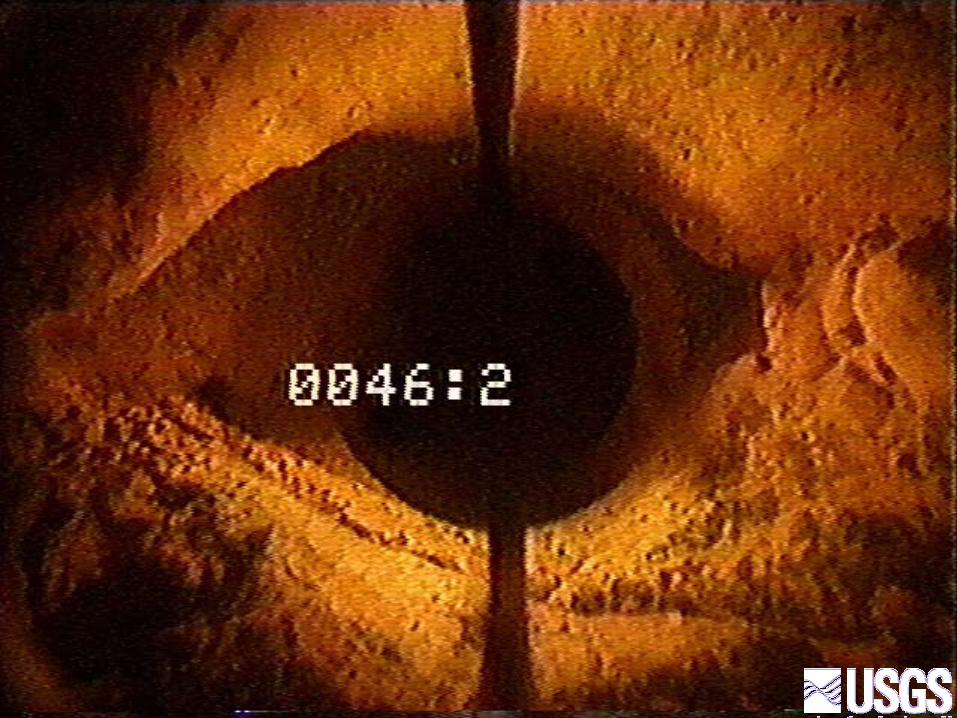
BOREHOLE-WALL IMAGING
• Submersible cameras• Acoustic and optical televiewers• Continuous and oriented 360-degree
image of the borehole wall• Character and orientation of lithologic
and structural features• Borehole diameter, construction, and
deviation

Projected image3-D wrapped image
NW
E
SOUTH
Amplitude
N NS WE
Dipo = tan -1 amplitudediameter
Strike = (175 - 90)o = 85o
N E S W N
BOREHOLE-WALL IMAGING
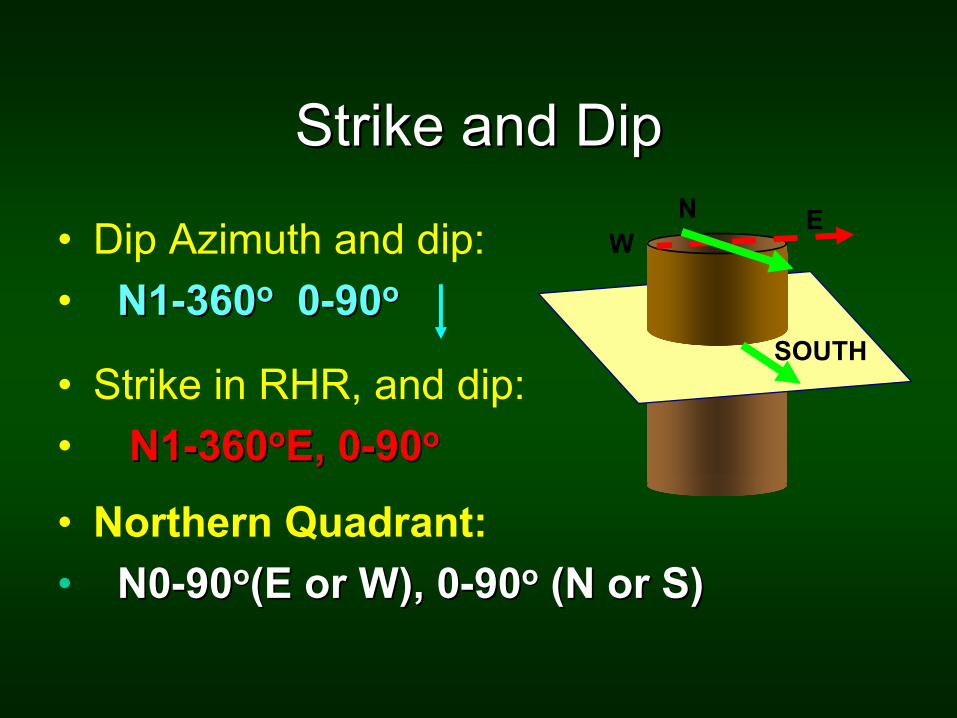
Strike and DipStrike and Dip
• Dip Azimuth and dip: • N1N1--360360oo 00--9090oo
• Strike in RHR, and dip: • N1N1--360360ooE, 0E, 0--9090oo
• Northern Quadrant:• N0N0--9090oo(E or W), 0(E or W), 0--9090oo (N or S)(N or S)
NW
E
SOUTH

OPTICAL TELEVIEWER
• CCD camera • Conical or hyperbolic reflector• High resolution (RGB)• Uphole or downhole digital• Downhole digital slower speeds but greater
range of cable types and lengths• Water- or air-filled holes• Less affected by water clarity than fisheye,
but more sensitive than ATV’s • Direct viewing of lithology and structure

DE
PTH
BE
LOW
TO
P O
F C
AS
ING
IN M
ETE
RS
N WE NSN WE NS
31
32
33
OPTICALTELEVIEWER
In Color
6-in diameter borehole in sandstone
Uphole digitizedConical mirror
Downhole digitalConical mirror
Uphole digitalHyperbolic mirror
N WE NS
ACOUSTIC TELEVIEWER
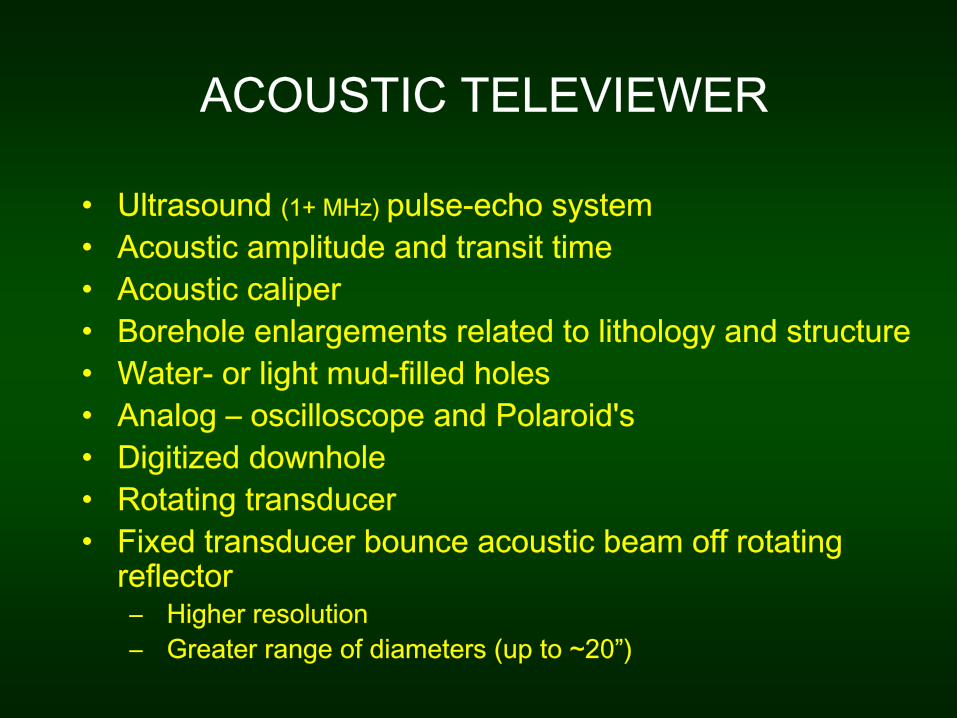
• Ultrasound (1+ MHz) pulse-echo system• Acoustic amplitude and transit time• Acoustic caliper• Borehole enlargements related to lithology and structure• Water- or light mud-filled holes• Analog – oscilloscope and Polaroid's• Digitized downhole• Rotating transducer• Fixed transducer bounce acoustic beam off rotating
reflector– Higher resolution– Greater range of diameters (up to ~20”)
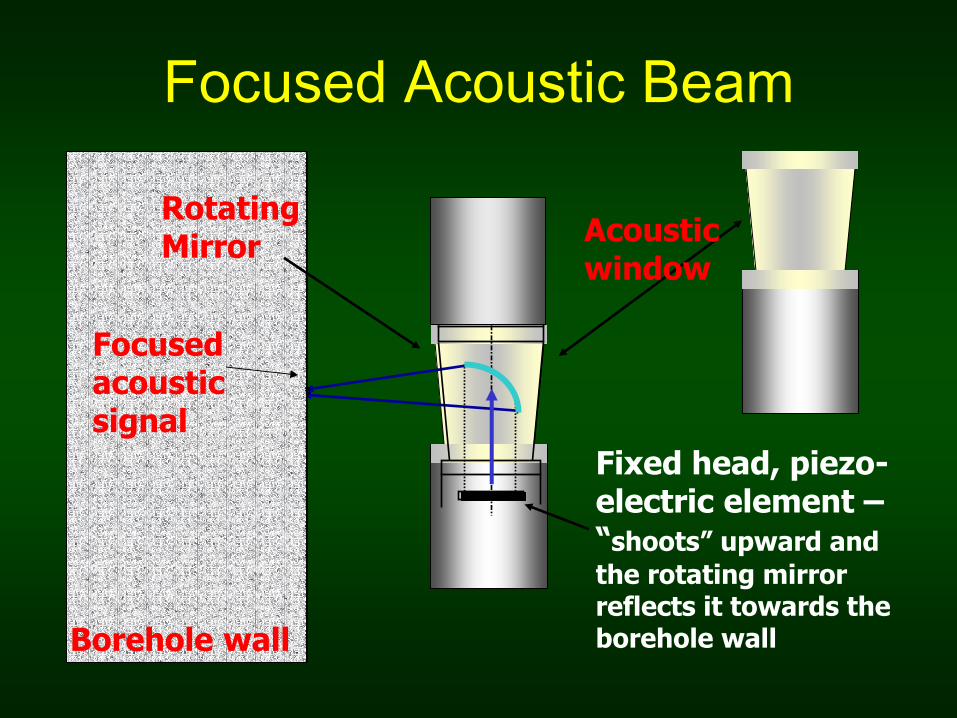
Focused Acoustic Beam
Focused acoustic signal
Fixed head, piezo-electric element –“shoots” upward and the rotating mirror reflects it towards the borehole wall
RotatingMirror Acoustic
window
Borehole wall
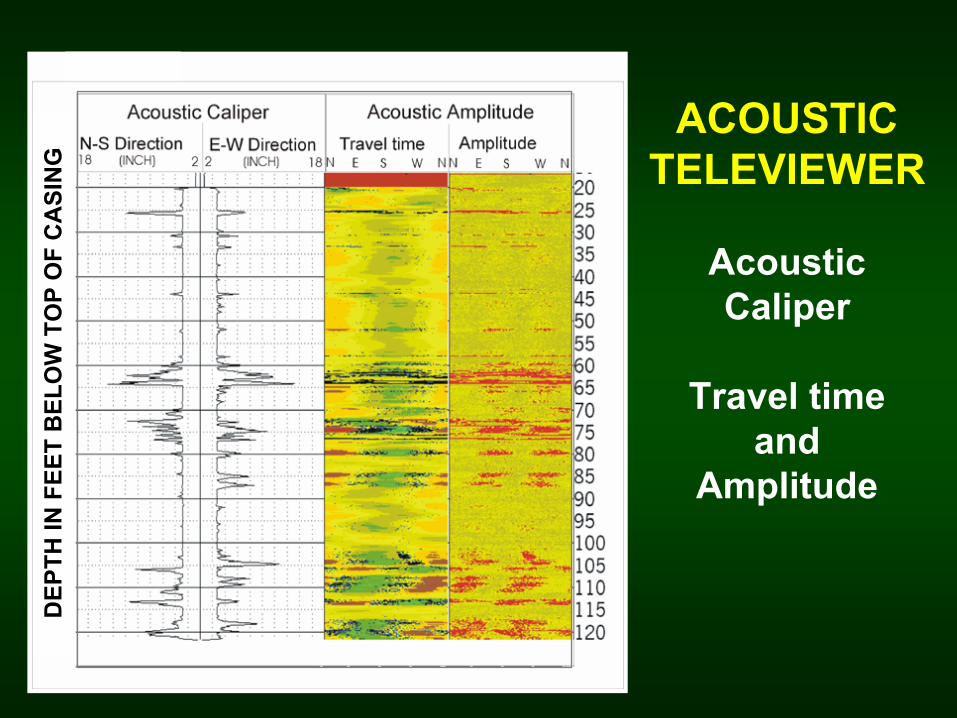
ACOUSTIC TELEVIEWER
Acoustic Caliper
Travel time and
Amplitude
DEP
TH IN
FEE
T B
ELO
W T
OP
OF
CA
SIN
G

28.5
N E S W N N E S W N
28.0
SECOND THIRDPLOTS OF ARRIVAL TIME
DEP
TH B
ELO
W T
OP
OF
CA
SIN
G IN
MET
ERS MULTI-ECHO ATV
Single trace showing first, second, and third arrivals
Tool
Radial plot of arrival times at a single depth
Tool

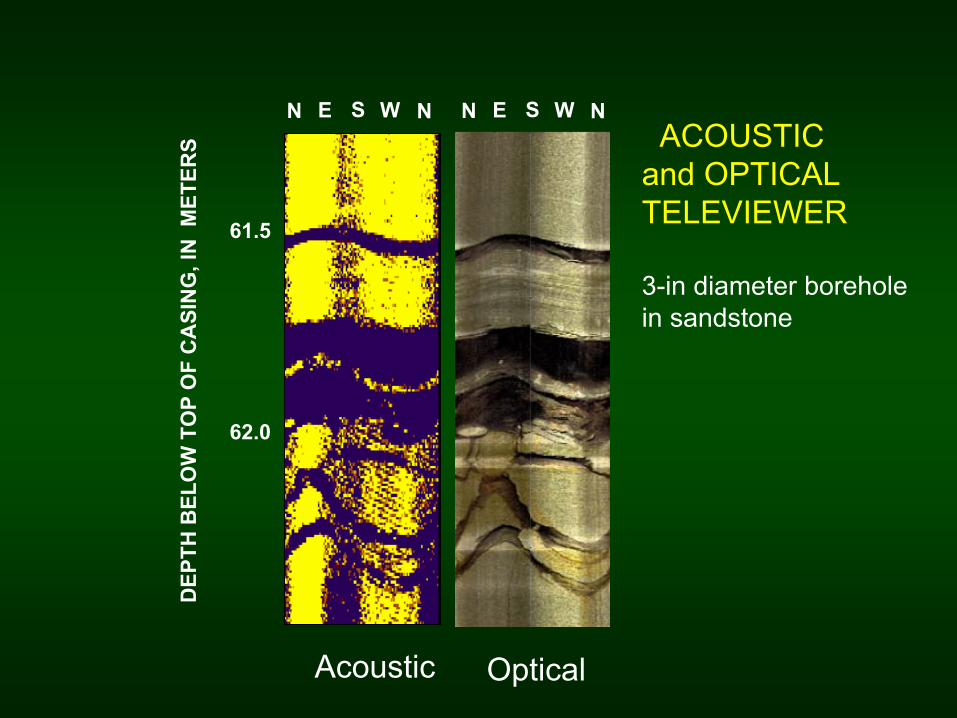
COMPARISON OF ACOUSTIC AND OPTICAL TELEVIEWER
IMAGES• ATV and OTV - fractures generally
recognizable• OTV – direct viewing of the relation between
lithology and structure• OTV – view redox conditions, free product,
and other indicators of flow and contamination
• ATV – resolution of fractures under a wider range of conditions (dark-colored rocks,
cloudy water, or coated borehole walls)
N WE NSN WE NS
DEP
TH B
ELO
W T
OP
OF
CA
SIN
G, I
N M
ETER
S
Acoustic Optical
61.5
62.0
ACOUSTICand OPTICALTELEVIEWER
3-in diameter borehole in sandstone

COMMON PROBLEMS
• Centralization• Deviation • Magnetic minerals and steel casing

DE
PTH
BE
LOW
TO
P O
F C
AS
ING
IN M
ETE
RS
31
32
33
If the tool is de-centered, the ATV data will have
characteristic banding and a trace laid on top of the
features not be a sinusoid.
OTV
N WE NS N WE NS
ATV
Centralization
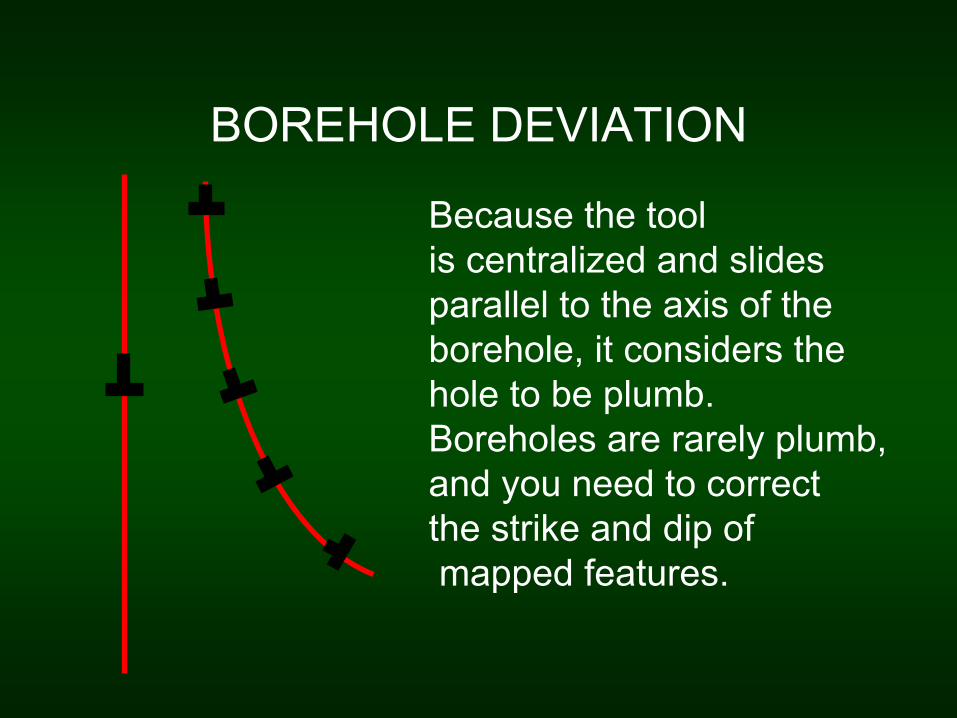
BOREHOLE DEVIATION
Because the tool is centralized and slidesparallel to the axis of the borehole, it considers the hole to be plumb.Boreholes are rarely plumb,and you need to correctthe strike and dip ofmapped features.

100
200
100 ft depth
200
0
400
600
800
0 100 200 Distance (feet)
Depth (feet)
N
Borehole Deviation

6.0
6.5
7.0
7.5
8.0
DEP
TH B
ELO
W T
OP
OF
CAS
ING
, IN
MET
ERS
N WE NS N WE NS
Spliced at 7.5 m
Correctedto feature at 8.0 m depth
Bottom of casing at 6 m
Mag. Off and Spliced
Mag. On

ANALYSIS OF ACOUSTIC AND OPTICAL TELEVIEWER IMAGES
• Independent analysis produces data sets with multiple discrepancies
• Combined analysis most efficient and powerful• Integration with other data
– Geophysical logs – flowmeter– Core samples – typically not oriented and missing in
fractured intervals– Hydraulic measurements – packer placement
• Tadpole and stereo plots

Projected image3-D wrapped image
NW
E
SOUTH
Amplitude
N NS WE
Dipo = tan -1 amplitudediameter
Strike = (175 - 90)o = 85o
N E S W N
BOREHOLE-WALL IMAGING
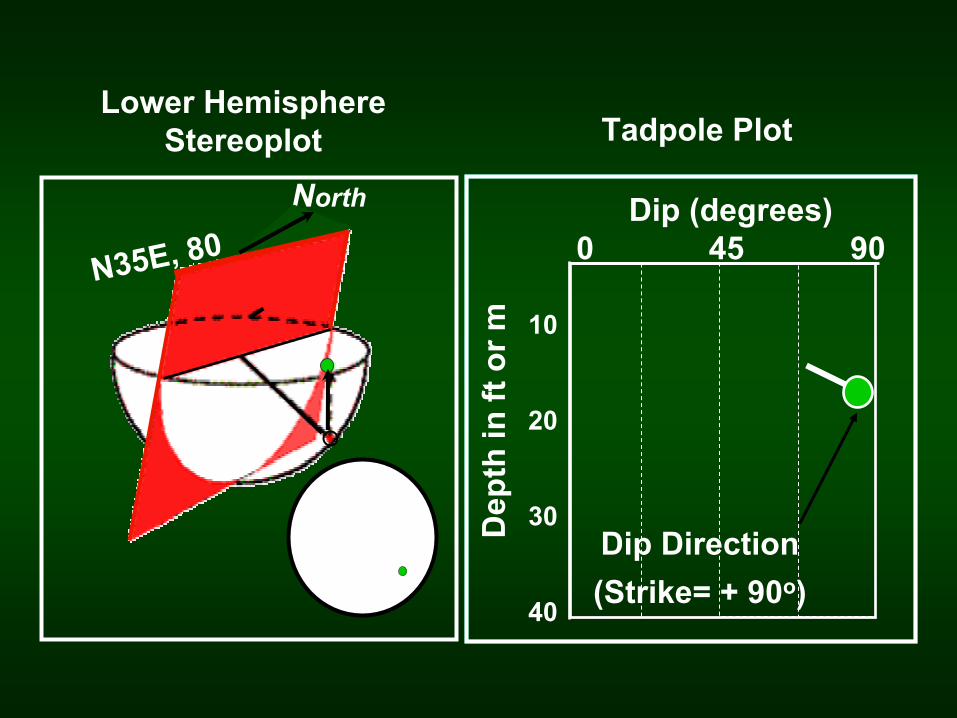
Lower HemisphereStereoplot
N35E, 80North
Tadpole Plot
10
20
30
40
Dip Direction(Strike= + 90o)
Dip (degrees)0 45 90
Dep
th in
ft o
r m

Side by side comparisons, interpretations, and display data
StereographicProjection
Tadpole Plot
ProjectionPlot
N E S W N 0 30 60 90N E S W N
Image Plot

Bedding and Fractures in Sandstone
BeddingBedding
FracturesFractures
NFracturesFractures
Combined interpretation - after hydraulic logging

ALL FEATURES
FOLIATION and LITHOLOGY Shown for different depth rangesOf the borehole
FRACTURES
DE
PTH
IN F
EE
T B
ELO
W T
OP
OF
CA
SIN
G
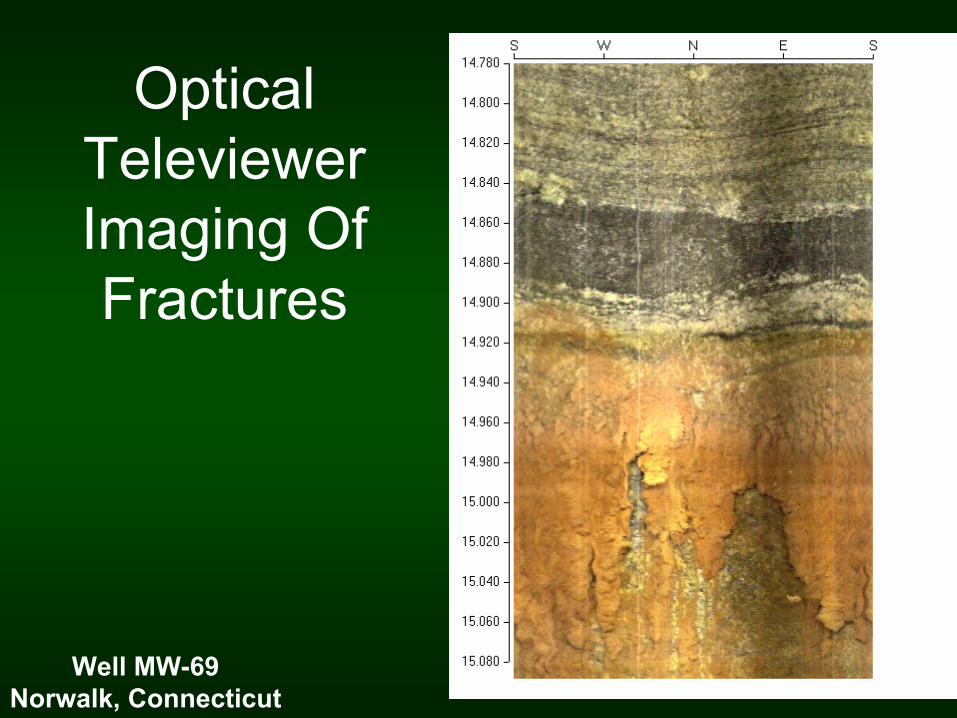
Optical Televiewer Imaging Of Fractures
Well MW-69Norwalk, Connecticut
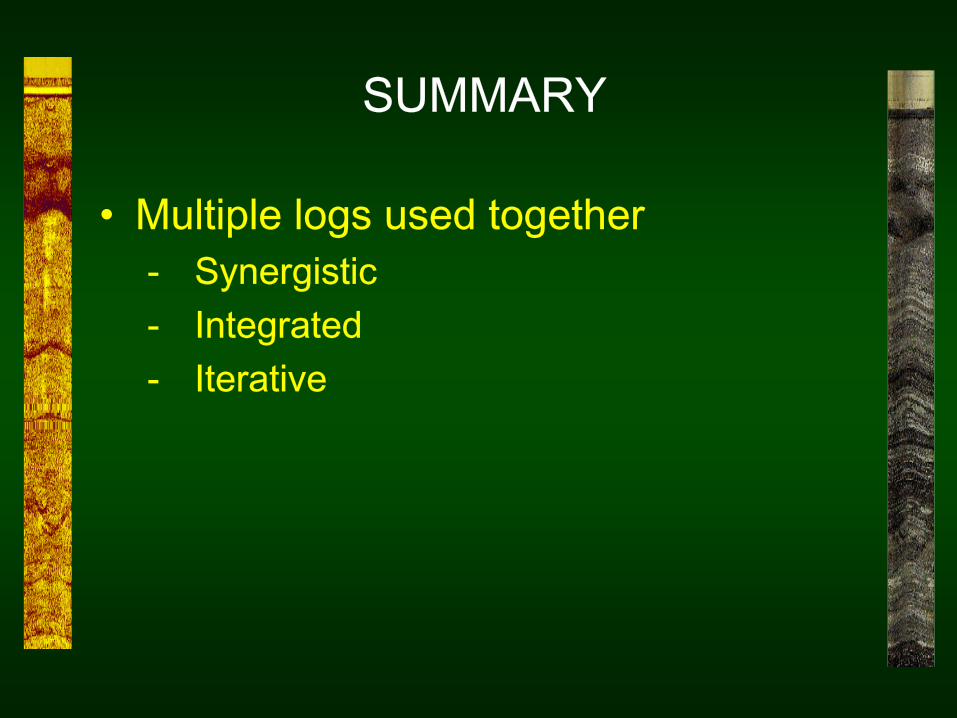
SUMMARY
• Multiple logs used together - Synergistic- Integrated- Iterative


![Deep Borehole Field Test Laboratory and Borehole Testing ... · The characterization borehole (CB) is the smaller-diameter borehole (i.e., 21.6 cm [8.5”] diameter at total depth),](https://static.fdocuments.in/doc/165x107/5ebe68817151f10bcd35645a/deep-borehole-field-test-laboratory-and-borehole-testing-the-characterization.jpg)