BOP Report 2011
70
ISSN 1990-8849 2011
Transcript of BOP Report 2011

ISSN 1990-8849
2011

Published by:
The Central Bank of Trinidad and Tobago Eric Williams Plaza Independence Square Port of Spain P.O. Box 1250 Trinidad and Tobago
Copyright 2013
Data from tables may be reproducedwith acknowledgements from source

BALANCE OF PAYMENTS REPORT 2011 Page i
PREFACE
This report highlights the Balance of Payments transactions of Trinidad and Tobago for the year 2011. For analytical purposes the years 2005-2010 are included. In addition, the Report contains an overview of the economic situation and policies in the year 2011 and a summary analysis of the Balance of Payments position. This publication was prepared by the “International” Unit of the Research Department of the Central Bank in close collaboration with the Central Statistical Office.
The Bank began preparation of Quarterly Balance of Payments statements as of the first quarter of 1989. These statements have been published in the Bank’s Economic Bulletin (formerly Quarterly Economic Bulletin) since the June 1990 issue. Consequently, the Balance of Payments Report for 2011 has been compiled from a consolidation of the quarterly data for the year.
The Balance of Payments Report conforms, as closely as possible, with the methodology recommended by the International Monetary Fund in the fifth edition of the Balance of Payments Manual. For consistency, data for 2005 to 2010 have been revised and may differ from data presented in previous publications.
The Research Department wishes to express its appreciation to all suppliers of data, both in the public and private sectors, for their cooperation, without which the publication of this report would not have been possible. Criticisms and suggestions for improvement of both the database and the analysis would be welcomed and any communication of this sort should be directed to:
The Chief Economist & Director of Research Research Department Central Bank of Trinidad and Tobago P.O. Box 1250 PORT OF SPAIN
ATTN: BOP Statistics
Director of Statistics Chief Economist & Director of ResearchCentral Statistical Office Research Department Central Bank of Trinidad & Tobago
APRIL 2013
(i) (i)


THE BALANCE OF PAYMENTS OF TRINIDAD AND TOBAGO, 2011
TABLE OF CONTENTS
Pages
Preface (i)
Overview of Economic Developments 1
Balance of Payments: Summary Analysis 4
STATISTICAL TABLES
1A Standard Presentation, 2005-2011 17
1B Analytic Summary Table, 2005-2011 19
1C Analytic Summary Table, 2005-2011 20
2 Merchandise Transactions, 2005-2011 21
3 Transportation, 2005-2011 22
4 Travel, 2005-2011 23
5A Investment Income, 2005-2011 24
5B Private Sector – Investment Income of Direct Investment Enterprises in Trinidad and Tobago by Sector of Activity, 2005-2011 25
6 Other Government, 2005-2011 27
7 Other Services, 2005-2011 28
8 Unrequited Transfers: Private, 2005-2011 29
9 Unrequited Transfers: Government, 2005-2011 30
10A Direct Investment Capital in Private Sector Enterprises by Sector of Activity, 2005-2011 31
10B Direct Foreign Investment by Country of Origin, 2005-2011 32
10C Components of Direct Foreign Investment, 2005-2011 32
11 Central Government External Debt, 2005-2011 33
12 Foreign Reserves, 2005-2011 34
13 Commercial Banks: Foreign Assets and Liabilities, 2005-2011 35
14 Exchange Rates for Selected Currencies, 2005-2011 36

APPENDICES
1 Import (C.I.F.) by S.I.T.C. Sections, 2005-2011 39 2 Export (F.O.B.) by S.I.T.C. Sections, 2005-2011 40 3 Direction of Trade – Adjusted Imports (C.I.F.), 2005-2011 414 Direction of Trade – Adjusted Exports (F.O.B.), 2005-2011 42 5 Imports by Sections and Major Trading Partners, 2005-2011 43 6 Exports by Sections and Major Trading Partners, 2005-2011 45 7 Extended Balance of Payments Classification, 2011 478 International Investment Position, 2011 49
LIST OF CHARTS
Chart No.1 Trinidad & Tobago Current Account 6 2 Merchandise Trade 7 3 Sources of Imports 8 4 Foreign Investment Flows 12
Explanatory Notes 49
Sources of Data 55
NOTES
1. Symbols used in this report:
0.0 - means negligible or nil - - means nil p - means provisional data r - means revised data ... - means not available
2. The figures in some tables are rounded off to the nearest final digit and hence totals may not agree with the addition of components.
3. The following Exchange Rates were used for converting to $US: 2005: US$1 = TT$6.2658 2006: US$1 = TT$6.2809 2007: US$1 = TT$6.3009 2008: US$1 = TT$6.2563 2009: US$1 = TT$6.2997 2010: US$1 = TT$6.3480 2011: US$1 = TT$6.3995

BALANCE OF PAYMENTS REPORT 2011 Page 1
REVIEW OF THE NATIONAL ECONOMYOverview of Economic Developments in 20111
1 This Section was adapted from the Central Bank of Trinidad and Tobago Annual Economic Survey, 2011.
In 2011, the recovery in the international economy was hindered by the deepening of the European sovereign debt crisis and the slow growth of the US economy. The crisis threatened the European integration movement and countries such as Greece, Spain and Italy agreed to austerity measures to significantly alter their fiscal situations and lower their debt burdens. However, skepticism remained about their willingness or ability to undertake the fundamental reforms required. In the US the slow recovery in economic growth was accompanied by a high (though gradually lowering) unemployment rate. In light of these developments, the International Monetary Fund (IMF) and the Organization for Economic Co-operation and Development (OECD) reduced their forecasts for global economic growth in 2011.
Though developing nations such as Brazil, Russia, China and India (BRIC nations) continued to experience positive economic growth in 2011, they nonetheless slowed when compared to previous years. Lower growth rates were accompanied by rising inflation, causing some concern for the monetary authorities. Inflationary pressures were largely driven by the rising cost of energy, and food prices, which for most of the year were higher than in 2010. Not surprisingly, the Caribbean economies recorded low growth rates, given their economic ties to both the US and the EU. However, two bright spots in the Caribbean were Guyana and Suriname, who were able to leverage rising international gold prices, and increased demand for agricultural products to propel their economies forward.
The Trinidad and Tobago economy contracted in 2011. Real Gross Domestic Product (GDP) decreased by 2.6 per cent in 2011, following positive growth of 0.2 per cent in 2010 and a 4.4 per cent contraction in 2009. Both the energy
and non-energy sectors declined. The less-than-stellar performance of the energy sector resulted from a combination of factors including lower domestic crude production from the mature oil fields and the stoppage of production of methanol and natural gas due to maintenance and improvement activities. Economic activity in Trinidad and Tobago was also impacted by the slowdown in the international environment as many of the country’s main markets were affected. On the domestic front, lower-than-anticipated government expenditure in the first half of the year, as well as a State of Emergency in the latter part of 2011 also negatively impacted sectors such as construction, manufacturing and distribution.
The contraction of the Trinidad and Tobago economy did not support an improvement in the labour market, and job losses during the year were accompanied by reduced working hours in some sectors due to the curfew. Additionally the industrial climate remained difficult as wage negotiations in various sectors including the public service, and the petroleum and electricity sectors escalated into strikes and other protests. However, there was some resolution as the Public Services Association, the Trinidad and Tobago Civil Aviation Authority, Regional Health Authority (RHA) and the Port Authority of Trinidad and Tobago wage negotiations were successfully concluded. Trinidad and Tobago’s average unemployment rate for 2011 was 4.9 per cent.
Unlike in 2010 when inflation accelerated as the year progressed, the inflation rate in 2011 fell from double digits in January (12.5 per cent) to a historic low in August (0.6 per cent) before rebounding somewhat by the end of the year to 5.3 per cent. The decline in the inflation rate was attributed, in the first instance, to the base

BALANCE OF PAYMENTS REPORT 2011 Page 2
effect of the high prices that occurred in 2010 due to supply shocks, and second, to the positive impact of favourable weather on domestic food production. As is common, the movements in the overall Retail Price Index (RPI) were largely driven by movements in food prices as core inflation remained relatively sticky. The slow movement of the core price index can be related to the relatively stagnant consumer demand evident throughout the year.
In the 2011/2012 National Budget presented in September 2011 the government sought to provide an impetus for economic expansion. The budget anticipated a deficit of $7,642.4 million, with expected revenue and expenditure of $46,959.9 million and $54,602.3 million respectively. Some key initiatives of the budget included an increase in the minimum pension benefit payable under the National Insurance Act from $2,000 to $3,000 per month, an increase in the New Home Purchase Subsidy up to a maximum of $50,000 for homes costing up to $200,000 in Trinidad and $220,000 in Tobago, VAT exemptions for offshore drilling rigs, drill ships and other vessels associated with offshore activity, and the introduction of tax allowances to encourage the increased use of alternative energy sources. A review of the state of the government finances in FY 2010/2011 shows that as in FY 2009/2010, elevated revenue due to higher international commodity prices combined with a lower-than-budgeted expenditure resulted in a better than anticipated fiscal position. The anticipated fiscal deficit in FY 2010/2011 was $7,732.2 million while the final reported figure was $1,101.9 million. This budget deficit was financed from the Central Government’s deposits at the Central Bank, and thus did not increase the country’s debt obligations.
Unlike many developed and developing countries, Trinidad and Tobago has managed over
the years to maintain a low public debt to GDP ratio, which in FY 2010/2011 was 37.4 per cent. During the financial year given that the statutory limits for domestic borrowing were reached in FY 2009/2010 there was little activity domestically. However, the country’s international debt obligations increased as the Government received several loans from the Inter-American Development Bank to pursue initiatives in areas such as the development of a settlement operation to deal with squatter upgrading and home improvement, and the modernization of the public capital expenditure management programme. Even with this increased borrowing the external debt to GDP ratio remained low, falling to 6.5 per cent.
The Central Bank maintained an accommodative monetary policy stance during 2011 in an effort to stimulate growth in the domestic economy. The lowering of the repo rate on three occasions and the continued high excess liquidity resulted in a reduction of the commercial banks’ lending rate and rates in the government securities market. While consumer lending continued to grow during the year, business credit continued to decline. Meanwhile, movements in the monetary aggregates indicated that both individuals and businesses preferred to hold highly liquid assets as the low deposit interest rates offered by the financial institutions made less liquid deposits less attractive.
As in previous years Trinidad and Tobago recorded a surplus in its transactions with the rest of the world. For 2011 the country’s Balance of Payments recorded a surplus of US$752.6 million. As has been the case for many years the surplus was largely due to the country’s export of energy products. The positive developments on the international energy markets and in some CARICOM member states proved beneficial to Trinidad and Tobago exporters.
BALANCE OF PAYMENTS REPORT 2011 Page 3
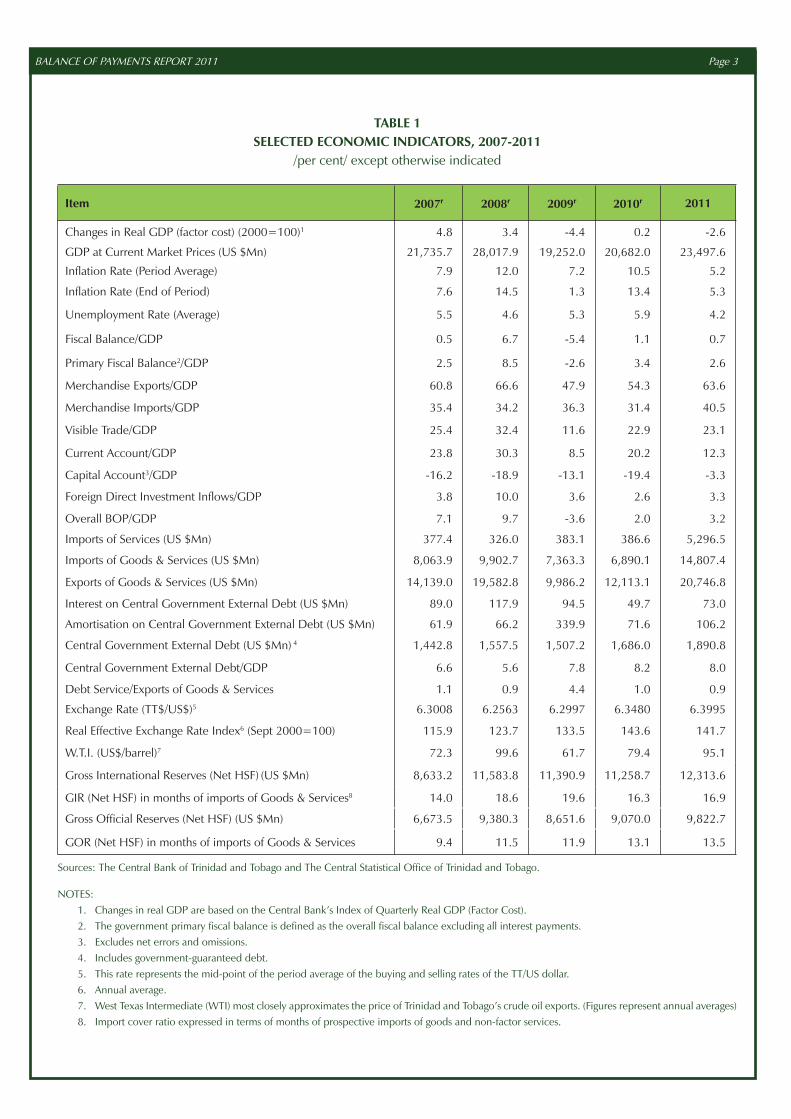
TABLE 1 SELECTED ECONOMIC INDICATORS, 2007-2011
/per cent/ except otherwise indicated
Item 2007r 2008r 2009r 2010r 2011
Changes in Real GDP (factor cost) (2000=100)1 4.8 3.4 -4.4 0.2 -2.6
GDP at Current Market Prices (US $Mn) 21,735.7 28,017.9 19,252.0 20,682.0 23,497.6
Inflation Rate (Period Average) 7.9 12.0 7.2 10.5 5.2
Inflation Rate (End of Period) 7.6 14.5 1.3 13.4 5.3
Unemployment Rate (Average) 5.5 4.6 5.3 5.9 4.2
Fiscal Balance/GDP 0.5 6.7 -5.4 1.1 0.7
Primary Fiscal Balance2/GDP 2.5 8.5 -2.6 3.4 2.6
Merchandise Exports/GDP 60.8 66.6 47.9 54.3 63.6
Merchandise Imports/GDP 35.4 34.2 36.3 31.4 40.5
Visible Trade/GDP 25.4 32.4 11.6 22.9 23.1
Current Account/GDP 23.8 30.3 8.5 20.2 12.3
Capital Account3/GDP -16.2 -18.9 -13.1 -19.4 -3.3
Foreign Direct Investment Inflows/GDP 3.8 10.0 3.6 2.6 3.3
Overall BOP/GDP 7.1 9.7 -3.6 2.0 3.2
Imports of Services (US $Mn) 377.4 326.0 383.1 386.6 5,296.5
Imports of Goods & Services (US $Mn) 8,063.9 9,902.7 7,363.3 6,890.1 14,807.4
Exports of Goods & Services (US $Mn) 14,139.0 19,582.8 9,986.2 12,113.1 20,746.8
Interest on Central Government External Debt (US $Mn) 89.0 117.9 94.5 49.7 73.0
Amortisation on Central Government External Debt (US $Mn) 61.9 66.2 339.9 71.6 106.2
Central Government External Debt (US $Mn) 4 1,442.8 1,557.5 1,507.2 1,686.0 1,890.8
Central Government External Debt/GDP 6.6 5.6 7.8 8.2 8.0
Debt Service/Exports of Goods & Services 1.1 0.9 4.4 1.0 0.9
Exchange Rate (TT$/US$)5 6.3008 6.2563 6.2997 6.3480 6.3995
Real Effective Exchange Rate Index6 (Sept 2000=100) 115.9 123.7 133.5 143.6 141.7
W.T.I. (US$/barrel)7 72.3 99.6 61.7 79.4 95.1
Gross International Reserves (Net HSF) (US $Mn) 8,633.2 11,583.8 11,390.9 11,258.7 12,313.6
GIR (Net HSF) in months of imports of Goods & Services8 14.0 18.6 19.6 16.3 16.9
Gross Official Reserves (Net HSF) (US $Mn) 6,673.5 9,380.3 8,651.6 9,070.0 9,822.7
GOR (Net HSF) in months of imports of Goods & Services 9.4 11.5 11.9 13.1 13.5
Sources: The Central Bank of Trinidad and Tobago and The Central Statistical Office of Trinidad and Tobago.
NOTES:1. Changes in real GDP are based on the Central Bank’s Index of Quarterly Real GDP (Factor Cost).2. The government primary fiscal balance is defined as the overall fiscal balance excluding all interest payments.3. Excludes net errors and omissions.4. Includes government-guaranteed debt.5. This rate represents the mid-point of the period average of the buying and selling rates of the TT/US dollar.6. Annual average.7. West Texas Intermediate (WTI) most closely approximates the price of Trinidad and Tobago’s crude oil exports. (Figures represent annual averages)8. Import cover ratio expressed in terms of months of prospective imports of goods and non-factor services.

BALANCE OF PAYMENTS REPORT 2011 Page 4
BALANCE OF PAYMENTSSummary Analysis – 2011
Unless otherwise stated ‘dollar’ refers to United States Dollar (US$)
TABLE 2 SUMMARY OF BALANCE OF PAYMENTS, 2007-2011
2007r 2008r 2009r 2010r 2011
Current Account 5,166.5 8,499.0 1,632.8 4,172.3 2,898.5 Merchandise 5,528.7 9,070.4 2,241.2 4,735.4 5,433.0 Services 546.4 609.7 381.7 487.6 506.3 Income -968.8 -1,228.0 -1,017.1 -1,079.5 -3,073.9 Transfers 60.2 46.9 27.0 28.8 33.1 Capital and Financial Account -3,625.8 -5,793.5 -2,345.4 -3,753.9 -2,145.9 Public Sector -280.8 -1,017.4 277.4 -540.9 -295.4 Private Sector (incl. Errors & Omissions) -3,345.0 -4,776.1 -2,622.8 -3,213.0 -1,850.5 Overall Balance 1,540.7 2,705.5 -712.6 418.4 752.6 Memo Items: Gross Official Reserves (Net HSF) 6,673.5 9,380.3 8,651.6 9,070.0 9,822.7Import Cover (Net HSF) (months) 9.4 11.5 11.9 13.1 13.5
Source: Statistical Tables 1B and 1C.
The Central Bank of Trinidad and Tobago is reviewing and improving the Balance of Payments Statistics and aims to adopt the reporting standards as contained in the Balance of Payments and International Investment Position Manual (BPM6). These improvements will be implemented on a phased basis over 2011-2014. The Balance of Payments Report (BOP) for 2011 will therefore reflect some of these improvements, including a more detailed International Investment Position (IIP) framework and an extended BOP
classification (EBOPs) (See Box 1).
In 2011, the external accounts of Trinidad and Tobago registered a surplus of $752.6 million. The level of gross official reserves at the end of the year was $9.8 billion, or 13.5 months of prospective imports of goods and non-factor services. The current account recorded a surplus of $2,898.5 million while the capital and financial account recorded a deficit of $2,145.9 billion.

BALANCE OF PAYMENTS REPORT 2011 Page 5
BOX 1METHODOLOGICAL CHANGES TO THE BALANCE OF PAYMENTS ACCOUNTS
IN TRINIDAD AND TOBAGO
The first edition of the Balance of Payments (BOP) manual was published in 1948 to serve as the standard
framework for statistics on the transactions and positions between an economy and the rest of the world.
Since then, there have been five versions of the manual. The latest edition was published in 2009 and is
entitled the Balance of Payments Manual and International Investment Position Manual (BPM6). Trinidad
and Tobago, like many other countries, will be phasing out the production of the BOP according to
the format in the old manual (BPM5) and will be transitioning to the BPM6 methodology. The Bank
has developed an action plan for the phased improvement of the Balance of Payments statistics which
commenced in the year 2011 and is expected to be completed in 2014.
As part of the process, the Bank has adopted better methods of data capture and validation. The
implementation of the systemic improvements starting in 2011, means that data for previous years may
not be strictly comparable in some instances. This is particularly true for the investment income and the
capital and financial account. Going forward, the Bank intends to revise data for years before 2011.
An important change in the BOP Report 2011 is the enhanced compilation of the IIP statement. Data
at the Central Bank of Trinidad and Tobago, and supervisory data for commercial banks, nonbanks and
insurance companies, has been used to develop a new compilation system for the IIP using the sixth
edition of the Balance of Payments Manual (BPM6) framework. The new compilation system extends the
coverage of Trinidad and Tobago’s external assets and liabilities and provides greater detail in general.

BALANCE OF PAYMENTS REPORT 2011 Page 6
CURRENT ACCOUNT
In 2011, the current account surplus amounted to $2.9 billion, (equivalent to 12.3 per cent of GDP) following a surplus of $4.2 billion or 20.2 per cent of GDP in 2010. The deterioration in
the current account mainly reflected significantly larger outflows of investment income, but the services account improved despite lower net earnings from communication and insurance services (See Chart 1).
Chart 1Trinidad and Tobago Current Account
Sources: The Central Bank of Trinidad and Tobago and The Central Statistical Office of Trinidad and Tobago.
Merchandise Trade
According to the World Trade Organisation (WTO), in 2011 global trade grew by 5.0 per cent, a sharp deceleration following the rebound in 2010 when global trade expanded by 13.8 per cent. The WTO attributed this sharp slowdown in 2011 to slower global economic growth induced by a number of shocks, including the European sovereign debt crisis2.
Notwithstanding the global economic lethargy, Trinidad and Tobago’s merchandise exports increased substantially, by 33.0 per cent
2 World Trade Organisation. 2012. “Trade growth to slow in 2012 after strong deceleration in 2011.” Available at http://www.wto.org/english/news_e/pres12_e/pr658_e.htm.
following a 21.9 per cent increase in 2010. The major categories of exports recording significant increases were food, crude materials, chemicals and manufactured goods (See Appendix 2). More specifically, energy exports (mineral fuels and lubricants, and chemicals) which accounted for 84.3 per cent of total exports increased by 35.2 per cent to total $12.6 billion compared to $9.3 billion in 2010. Energy sector exports benefitted from the buoyancy in energy prices throughout the year (See Table 4). Non-energy exports also increased, by 22.0 per cent, to $2.3 billion compared to $1.9 billion in 2010 (See Appendix 2).

BALANCE OF PAYMENTS REPORT 2011 Page 7
Trinidad and Tobago’s largest trading partner, the US, purchased 47.8 per cent of Trinidad and Tobago’s total exports in 2011, which was about the same proportion as in the previous year, although the actual value of these exports was higher by about $1.9 billion. The dollar value of Trinidad and Tobago’s exports to CARICOM on the other hand remained about the same as in 2010, following an increase of 43.7 per cent in 2010 (See Appendix 4). Most of the country’s exports to the region involved energy or energy-related products, which were valued at $1.5 billion, a modest decrease from $1.6 billion in 2010 (See Appendix 6). Increases in regional exports were recorded for food (33.3 per cent) and manufactured goods (39.1 per cent). Among the larger CARICOM countries, exports to
Chart 2Merchandise Trade
Source: The Central Statistical Office of Trinidad and Tobago.
Jamaica, (the country’s largest regional market), declined by 12.4 per cent, while exports to Guyana and Barbados increased by 6.7 per cent and 4.1 per cent, respectively (See Appendix 4).
After two successive years of decline, merchandise imports increased sharply in 2011, rising by $3.0 billion or 46.2 per cent. This was partly associated with higher imports of crude oil for refining locally as domestic crude oil production declined, but also reflected higher non-energy imports (35.5 per cent) particularly of food (18.0 per cent) and transport equipment (57.0 per cent). In respect to the rise in imports of transport equipment, 24 new buses were imported by the Public Transport Service Corporation (PTSC) and the Defence Force purchased 2 helicopters (See Appendix 1).

BALANCE OF PAYMENTS REPORT 2011 Page 8
TABLE 3COMPOSITION OF MERCHANDISE TRADE, 2010-2011
/per cent/
SITC CategoriesShare in Imports Share in Exports
(%) (%)2010 2011 2010 2011
0. Food 9.64 7.78 1.30 1.29
1. Beverage & Tobacco 0.85 0.68 1.04 1.32
2. Crude materials 5.07 5.25 5.15 4.69
3. Minerals, fuel, lubricants and related materials 33.09 38.63 61.22 55.73
4. Oils & fats 0.56 0.57 0.02 0.02
5. Chemicals 7.68 6.48 21.63 28.53
6. Manufactured goods 11.52 8.44 5.89 6.59
7. Machinery and transport equipment 26.02 27.93 3.17 1.34
8. Miscellaneous manufactured articles 5.50 4.16 0.57 0.48
9. Miscellaneous items 0.08 0.07 0.00 0.01
Sources: Appendices 1 and 2.
The US is also this country’s main source of imports but the share of imports from that country continued to decline in 2011, falling to 26.2 per cent (in 2009 the share was 30.8 per cent) (See Chart 3). Meanwhile, the share of imports from Latin America and the CARICOM region continued to grow: imports from Latin America reached 21.1 per cent in 2011, from 19.9 per cent in 2009, while imports from CARICOM increased
to $241.5 million from $125.0 million in 2010, an increase of 93.3 per cent. This increase mainly reflected higher mineral fuels, and machinery and transportation equipment imports (See Chart 3 and Appendix 5). Barbados remained the largest source market for Trinidad and Tobago’s imports from the CARICOM region, while imports from Jamaica increased to $17.0 million from $10.9 million in 2010 (See Appendix 3).
Chart 3Source of Imports, 2010-2011
Source: Appendix 3.

BALANCE OF PAYMENTS REPORT 2011 Page 9
TABLE 4PRICES OF SELECTED COMMODITIES, 1999-2011
Period
Crude Oil
WTI
Natural Gas
Henry Hub
Ammonia
fob Caribbean
Urea
fob Caribbean
Methanol
fob Rotterdam
Billets
fob Latin America
Wire rods
fob Latin America
(US$/bbl) (US$/mmbtu) (US$/tonne) (US$/tonne) (US$/tonne) (US$/tonne) (US$/tonne)
1999 19 2.3 91 82 109 177 226
2000 30 4.3 146 130 168 190 221
2001 26 4.0 138 114 203 171 221
2002 26 3.4 111 116 164 194 221
2003 31 5.5 201 157 257 245 278
2004 41 5.9 252 230 265 367 453
2005 57 8.9 281 232 284 334 396
2006 66 6.7 278 227 376 392 448
2007 72 7.0 291 324 434 494 530
2008 100 8.7 545 564 504 863 1174
2009 62 4.0 228 265 241 427 517
2010 79 4.4 363 311 338 541 616
2011 95 4.0 534 436 430 649 710
2011
Jan 89 4.5 435 385 427 613 640
Feb 90 4.1 475 389 434 638 695
Mar 103 4.0 507 371 441 645 682
Apr 110 4.2 515 356 441 634 686
May 101 4.3 523 379 433 631 720
Jun 96 4.5 524 446 441 657 720
Jul 97 4.4 522 473 413 690 740
Aug 86 4.1 526 510 424 694 746
Sep 87 3.9 556 509 405 705 765
Oct 86 3.6 623 499 441 655 750
Nov 97 3.3 651 491 437 615 699
Dec 99 3.2 553 422 425 610 678
Sources: Bloomberg, Green Markets; Fertilizer Week; European Chemical News; Monthly Methanol Newsletter (TECNON); Metal Bulletin.
NOTE: All prices are monthly averages of published quotations and not necessarily realized prices.

BALANCE OF PAYMENTS REPORT 2011 Page 10
3 World Tourism Organisation. 2012. “International tourism receipts surpass US$ 1 trillion in 2011.” Available at http://media.unwto.org/en/press-release/2012-05-07/international-tourism-receipts-surpass-us-1-trillion-2011.
4 World Tourism Organisation. 2012. “International tourism to reach one billion in 2012.” Available at http://media.unwto.org/en/press-release/2012-01-16/international-tourism-reach-one-billion-2012.
Trade in Services
The services sector remained a net revenue earner for Trinidad and Tobago in 2011 with net earnings from the export of services increasing by 3.8 per cent to total $506.3 million. Transportation and travel services remained in surplus in 2011, while communication and insurance services recorded deficits for the first time in several years. Other government services recorded its ninth consecutive year of deficit.
Travel
The recovery in international tourism, that began in 2010, when arrivals increased by 6.7 per cent, continued in 2011. This follows the sharp decline of 4.0 per cent in 2009 – the year hardest hit by the global economic crisis. According to the World Tourism Organisation (UNWTO), in 2011, international tourism receipts exceeded $1 trillion for the first time, up from $928 billion in 20103. This increase in tourism receipts was facilitated by the 4.6 per cent increase in international tourist arrivals which totalled 980 million persons in 2011, up from 939 million in 20104.
In contrast to the positive global trend, in 2011, the net earnings from international visitors to Trinidad and Tobago decreased by 15.1 per cent. Net earnings totalled $321.7 million, $57.3 million less than in 2010 when net earnings increased by 45.0 per cent. This poor performance in the tourism sector reflected the relatively small increase (4.9 per cent) in the export of travel services, and the more-than-doubling in the import of such services. Estimated expenditures by visitors to Trinidad and Tobago increased to $471.6 million in 2011 compared to $449.6 in 2010. Meanwhile, travel expenditure by Trinidad and Tobago residents abroad amounted to $149.9 million, up from $70.6 million in 2010 (See Statistical Tables, Table 4).
After declining in 2010, expenditure by hotel and business visitors rose in 2011 and was the basis for the higher total visitor expenditure. There was also a reversal in the level of spending by private home visitors in 2011 as expenditure in this category declined by 18.7 per cent to $232.7 million following a 48.3 per cent increase in the previous year.
In 2011, expenditure by Trinidad and Tobago residents on foreign travel increased sharply by 112.4 per cent. This surge was due largely to increased expenditure by Trinidad and Tobago residents on tourism abroad, which rose to $144.0 million, much higher than the $67.2 million spent in 2010. Meanwhile, expenditure by Trinidad and Tobago students living abroad rose to $5.6 million in 2011 from $3.0 million in 2010.
Transportation
In 2011, Trinidad and Tobago’s net provision of transportation services increased by 25.2 per cent to $124.9 million, following an increase of 17.0 per cent in 2010. Earnings from the provision of transportation services totalled $264.1 million, an increase of 18.3 per cent over 2010’s earnings. This was mainly on account of increases in earnings from charges at the sea ports and on cargo. Expenditure on transportation services amounted to $139.2 million in 2011, 12.8 per cent higher than in 2010 ($123.4 million) – See Statistical Tables, Table 3.
Other Services
Two thousand and eleven represents an aberration to the trend of the Other Services sub-account being in deficit (See Box 1 on Methodological Changes). In 2011, the Other Services account recorded a surplus for the first time in many years, which amounted to $357.5 million compared to an average deficit of $115.4 million over the

BALANCE OF PAYMENTS REPORT 2011 Page 11
period 2005-2010 (See Statistical Tables, Table 7). The overall surplus in the Other Services account was a result of improved data capture which revealed much higher expenditures and earnings for merchanting5 services being conducted in the energy sector (see Credit line item 5 and Debit line item 13).
Unrequited Transfers
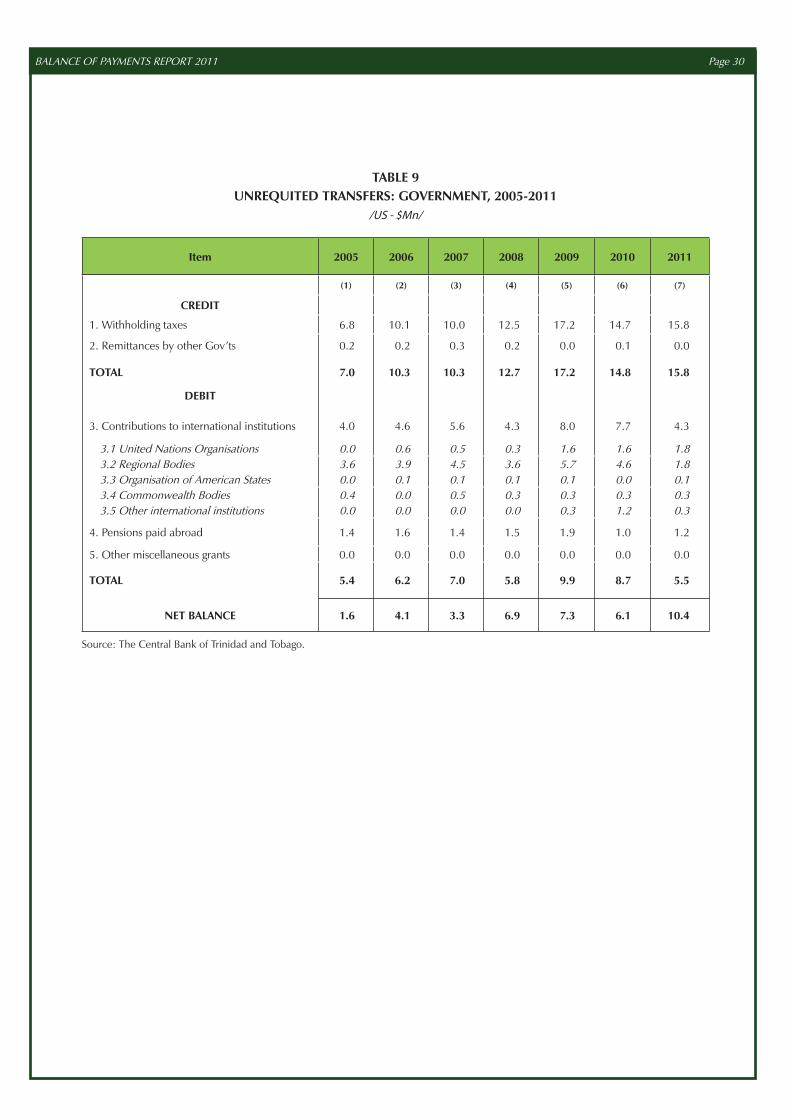
In 2011, Trinidad and Tobago continued to record net inflows from both private ($22.7 million) and government unrequited transfers ($10.4 million). On the private side, locals received $129.3 million in remittances, which represented a 37.6 per cent increase over the previous year. Outbound remittances also increased sharply, to $106.6 million from $71.3 million in 20106. In terms of government unrequited transfers, the overall surplus increased due to lower government contributions to regional institutions. These fell to $1.8 million from $4.6 million in the previous year (See Statistical Tables, Tables 8 and 9).
Income
In 2011, net factor payments abroad were estimated at $3.0 billion, which were higher than the $1.1 billion reported in 2010. In particular, income accruing to foreigners from their investments locally totaled $3,519.4 million. Total interest payments abroad was $450.8 million, $101.4 million lower than in 2010. While interest paid by the Central Government and by direct foreign enterprises on external loans was higher in 2011, there was a significant fall off in “other” interest payments. Dividends and profits repatriated by foreign enterprises rose in 2011, to $1,987.9 million, which was significantly higher than in 2010. With respect to inflows, investment income earned by residents
5 Following the International Monetary Fund’s, Balance of Payments Compilation Guide, the companion document to the Balance of Payments Manual, fifth edition (BPM5), merchanting transactions – that is, the buying and selling of goods that do not cross national borders – should be recorded in the BOP as service transactions. (Source: http://www.imf.org/external/np/sta/bop/bopcg.pdf).
6 In 2011, the number of remittance service provider companies surveyed increased.7 United Nations Conference on Trade and Development. 2012. “World Investment Report 2012,” Last accessed January
24, 2013. http://www.unctad-docs.org/files/UNCTAD-WIR2012-Full-en.pdf.
rose from the previous year mainly on account of higher interest earned abroad by the Central Bank and commercial banks.
CAPITAL AND FINANCIAL ACCOUNT
Trinidad and Tobago recorded a capital account (excluding net errors and omissions) deficit of $772.8 million (3.3 per cent of GDP), compared with $4,012.9 million in 2010 (See Table 1B). Net inflows from foreign direct investment (FDI) rose to $770.7 million, reflecting higher reinvestments by foreign owned energy companies.
Commercial banks’ net foreign assets increased as the banks augmented their holdings of foreign treasury bills and time deposits. The other private sector sub-account posted a deficit of $938 million mainly on account of outflows of loans ($623.6 million) and transactions involving currency and deposits ($616.4 million) conducted mainly by firms in the energy sector.
The public sector account reflects the international transactions of the Government of Trinidad and Tobago in the form of official borrowing and foreign investments of the Heritage and Stabilization Fund. The deficit on this sub-account moved from US$540.9 million in 2010 to $295.4 million in 2011 largely due to lower foreign investments of the Heritage and Stabilization Fund.
Investment Flows
According to UNCTAD’s World Investment Report 20127, both global FDI inflows and outflows rose in 2011. In 2011 compared to 2010, inflows rose by 16.5 per cent to $1.52 trillion, while outflows rose by 16.7 per cent to $1.69 trillion.

BALANCE OF PAYMENTS REPORT 2011 Page 12
Chart 4Foreign Investment Flows, 2005-2011
Source: The Central Bank of Trinidad and Tobago.
8 ECLAC. 2012. “Foreign Direct Investment in Latin America and the Caribbean 2011,” Last accessed January 24 2013. http://www.eclac.org/publicaciones/xml/2/46572/liei2011eng.pdf.
9 An effective exchange rate is an index that describes the relative strength of a currency relative to a basket of other currencies. The effective exchange rate is usually a trade-weighted average of a basket of foreign currencies, and the index can be viewed as an overall measure of the country’s external competitiveness. An increase in the value of the index represents a loss of competitiveness, while a decrease represents a gain in competitiveness. See Central Bank of Trinidad and Tobago’s publication, Annual Economic Survey, 2005, Box 5 for further details. Available at http://www.central-bank.org.tt/pdf/Research%20and%20Publications/Annual%20Economic%20Survey%202005.pdf.
FDI flows to Latin America and the Caribbean increased by 28 per cent during the year, with the strongest increase being registered in South America. The US and countries from the European Union remained the main investors in the region8.
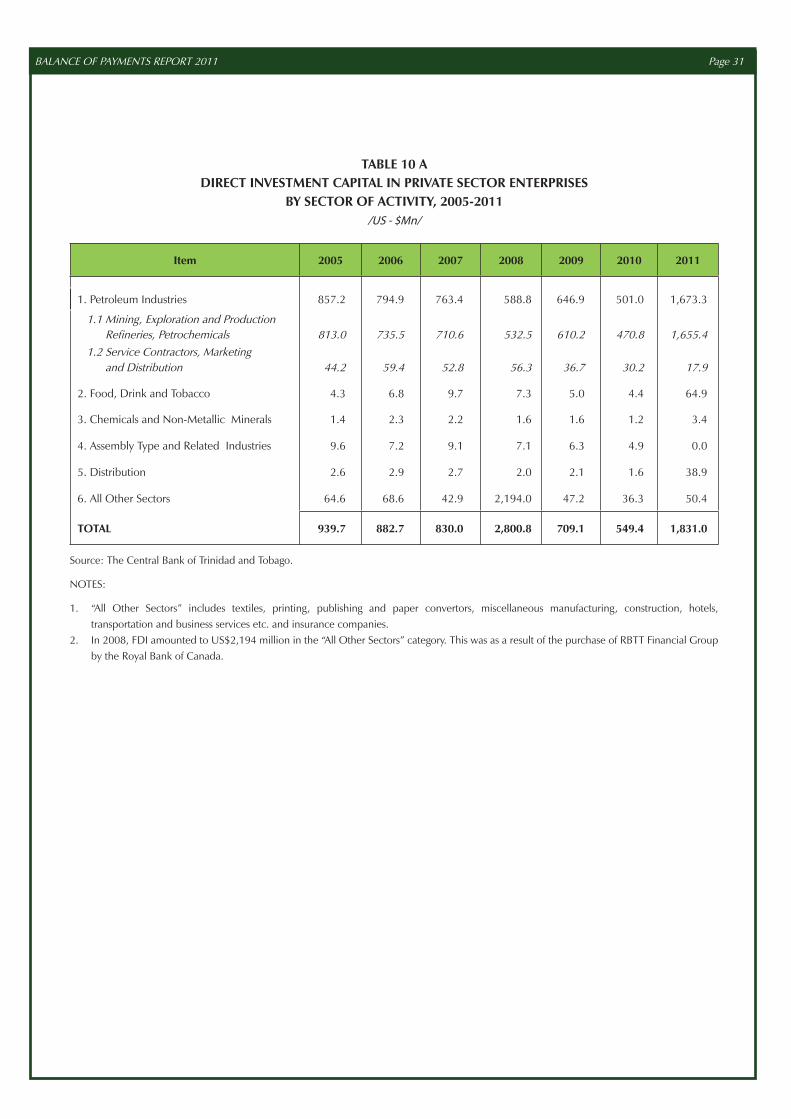
Domestically, net foreign direct investment inflows increased from $549.4 million in 2010 to $770.6 million in 2011 (See Chart 4). Consistent with the historical trend, the petroleum sector received the bulk of inward FDI in 2011 ($1,673.3 million) (See Table 10A). During the year, the bulk of foreign direct investment originated from North America.
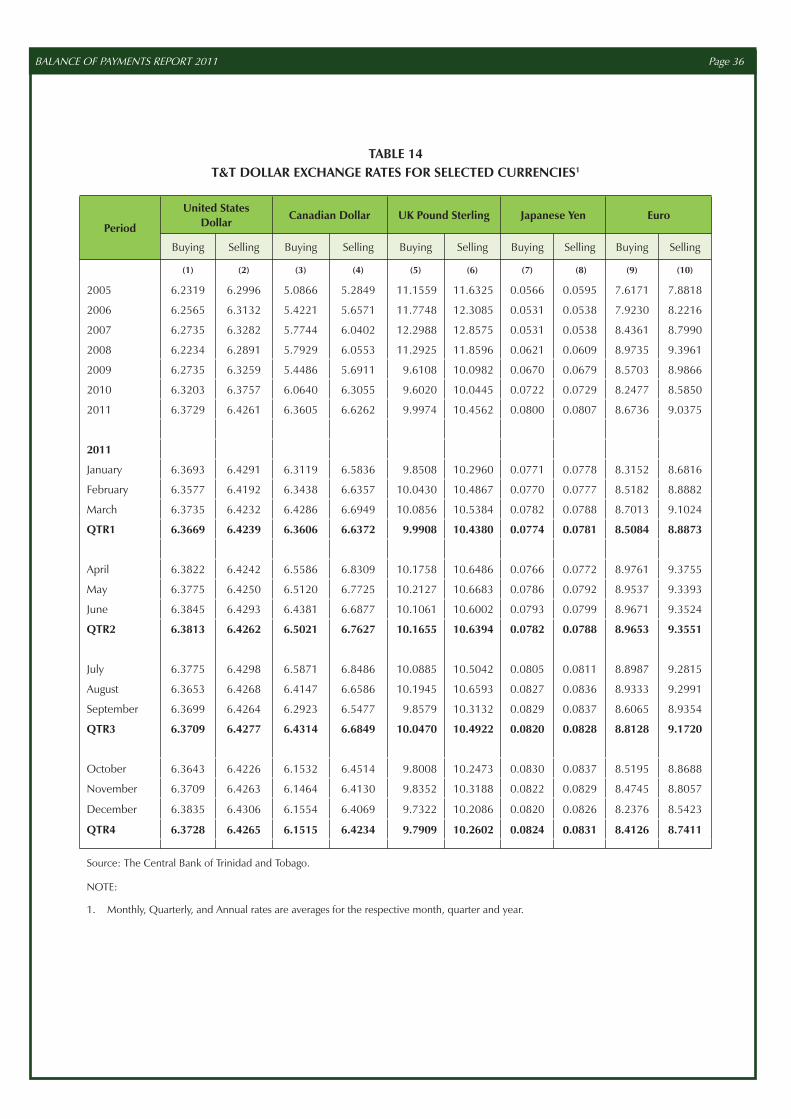
Effective Exchange Rates
During 2011, Trinidad and Tobago’s currency depreciated slightly, on average, by 1.3 per cent in real effective terms9 (See Table 5). Movements in the trade-weighted real effective exchange rate (TWREER) can be decomposed into two effects, an exchange rate effect which is measured by the trade-weighted nominal exchange rate (TWNEER) and an inflation effect which is measured by the effective inflation rate (EIR). The depreciation in real terms was mostly a result of movements in the average trade-weighted nominal exchange
rate (TWNEER), which depreciated during the year by 2.3 per cent. The slight depreciation in the Trinidad and Tobago dollar in real effective terms would have been indirectly influenced by the weakening of the US dollar against other major currencies, including the Japanese Yen (9.1 per cent), the Chinese Renminbi (4.6 per cent), the Canadian dollar (4.0 per cent) and the British pound (3.6 per cent). All other things remaining constant, the depreciation in the exchange rate in real effective terms would have increased the competitiveness of Trinidad and Tobago’s exports.

BALANCE OF PAYMENTS REPORT 2011 Page 13
TABLE 5EFFECTIVE EXCHANGE RATES, 2007-2011
Period AverageTrade Weighted
REER NEER EIR
Index (2000=100)
2007 115.92 98.8 117.35
2008 123.72 98.83 125.08
2009 133.48 101.13 131.99
2010 143.58 101.29 141.75
2011 141.66 99.01 143.07
Annual Percentage Change
2007 2.36 -1.93 4.38
2008 6.73 0.03 6.59
2009 7.89 2.33 5.52
2010 7.57 0.16 7.39
2011 -1.34 -2.25 0.93
Source: The Central Bank of Trinidad & Tobago.
NOTES:
1. REER – Real Effective Exchange Rate.
2. NEER - Nominal Effective Exchange Rate.
3. EIR – Effective Inflation Rate.


BALANCE OF PAYMENTS REPORT 2011 Page 15
STATISTICAL TABLES


BALANCE OF PAYMENTS REPORT 2011 Page 17
TABLE 1ASTANDARD PRESENTATION 2005-2011
/US - $Mn/
Item2005r 2006r 2007r 2008r
Credit Debit Credit Debit Credit Debit Credit Debit(1) (2) (3) (4) (5) (6) (7) (8)
A. CURRENT ACCOUNT 11,078.3 7,197.0 15,265.7 8,140.9 14,527.5 9,361.0 20,001.4 11,502.4
Goods1. Merchandise 9,995.6 5,727.6 14,085.5 6,510.6 13,215.2 7,686.5 18,647.1 9,576.7
Services 896.9 540.7 813.7 362.8 923.8 377.4 935.7 326.02. Transportation 215.2 191.4 202.3 160.5 229.4 171.9 218.0 128.73. Travel 453.0 180.0 382.2 92.8 463.1 93.7 396.9 75.34. Communication 37.6 16.4 33.9 5.6 33.9 1.4 31.1 6.75. Insurance 135.2 30.5 133.3 0.3 139.9 0.3 225.2 7.36. Other Government 14.0 69.9 13.3 52.1 13.9 57.2 18.2 54.67. Other Services 41.9 52.5 48.7 51.5 43.6 52.9 46.3 53.4
Income 83.8 876.8 261.9 1,218.1 267.1 1,235.9 309.9 1,537.98. Investment Income 83.8 876.8 261.9 1,218.1 267.1 1,235.9 309.9 1,537.9
Current Unrequited Transfers 102.0 51.9 104.6 49.4 121.4 61.2 108.7 61.89. Private 95.0 46.5 94.3 43.2 111.1 54.2 96.0 56.010. Government 7.0 5.4 10.3 6.2 10.3 7.0 12.7 5.8
B. CAPITAL AND FINANCIAL (Exc. Reserves & Debited Items) 1,522.3 2,691.8 1,169.8 6,489.6 1,317.0 4,570.6 2,981.7 8,192.0 Private Sector 1,450.7 2,171.9 959.9 5,705.6 1,133.9 4,106.7 2,800.8 6,993.7
11. Direct Investment 939.7 341.0 882.7 370.0 830.0 0.0 2,800.8 700.012. Commercial Banks 411.2 145.2 0.0 741.4 120.7 13.9 0.0 360.113. Other Private Sector Capital1 99.8 1,685.7 77.2 4,594.2 183.2 4,092.8 0.0 5,933.6
Public Sector 71.6 519.9 209.9 784.0 183.1 463.9 180.9 1,198.3 14. Official Borrowing 71.6 92.3 209.9 247.3 183.1 61.9 180.9 66.2
15. Official Loans 0.0 0.0 0.0 0.0 0.0 0.0 0.0 0.016. State Enterprises Borrowing 0.0 10.7 0.0 10.7 0.0 10.5 0.0 10.717.Heritage Stabilization Fund 0.0 416.9 0.0 526.0 0.0 391.5 0.0 1,121.418. Other Assets 0.0 0.0 0.0 0.0 0.0 0.0 0.0 0.019. Other Liabilities 0.0 0.0 0.0 0.0 0.0 0.0 0.0 0.0
C. NET ERRORS & OMISSIONS 0.0 1,237.1 0.0 686.0 0.0 372.2 0.0 583.2 D. COUNTERPART ITEMS
21. Allocation of S.D.R. 0.0 0.0 0.0 0.0 0.0 0.0 0.0 0.0
E. FINANCING – Change In Reserves2 0.0 1,474.7 0.0 1,119.0 0.0 1,540.7 0.0 2,705.5
22. Government 0.0 0.0 0.0 0.0 0.0 0.0 0.0 0.023. Central Bank 0.0 1,474.7 0.0 1,119.0 0.0 1,540.7 0.0 2,705.5 23.1 Reserve Assets 0.0 1,474.7 0.0 1,119.0 0.0 1,540.7 0.0 2,705.5 23.2 I.M.F. Reserve Tranche 0.0 0.0 0.0 0.0 0.0 0.0 0.0 0.0 23.3 S.D.R. Holdings 0.0 0.0 0.0 0.0 0.0 0.0 0.0 0.0
TOTAL 12,600.6 12,600.6 16,435.5 16,435.5 15,844.5 15,844.5 22,983.1 22,983.1
Notes:
1. Includes Other Investment and Portfolio Investment
2. Excluding balances in the Heritage and Stabilization Fund (HSF).
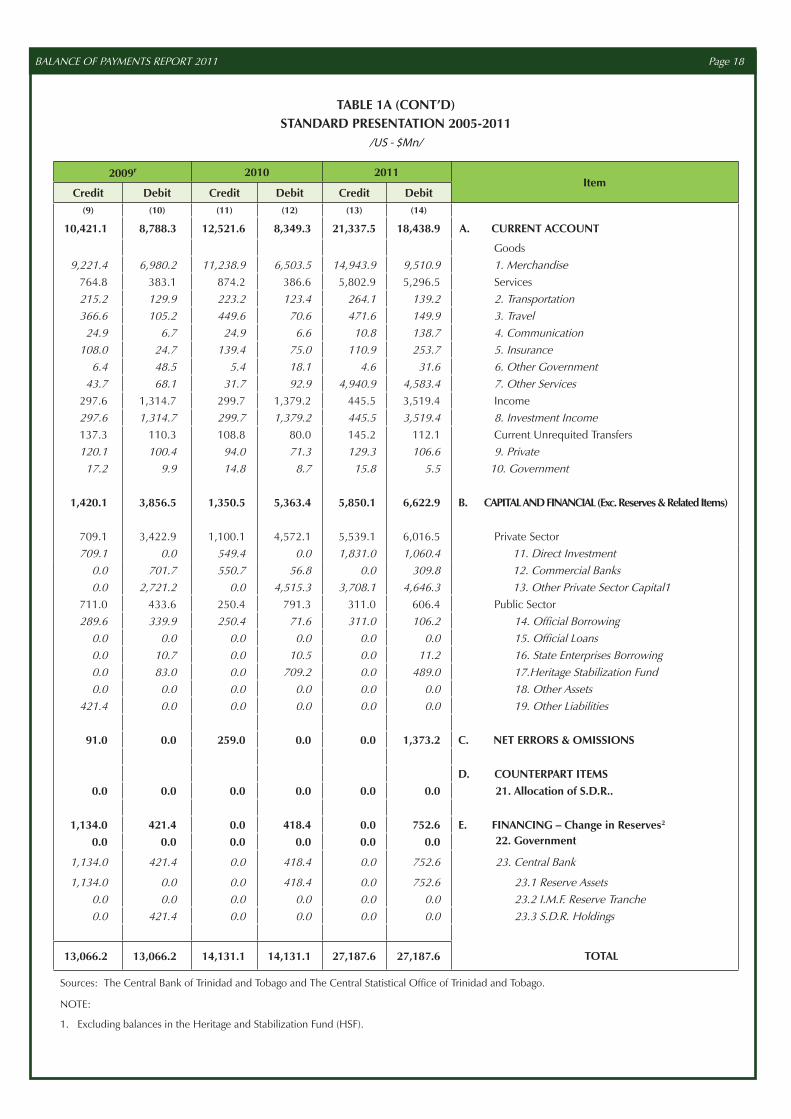
BALANCE OF PAYMENTS REPORT 2011 Page 18
TABLE 1A (CONT’D)STANDARD PRESENTATION 2005-2011
/US - $Mn/
2009r 2010 2011Item
Credit Debit Credit Debit Credit Debit(9) (10) (11) (12) (13) (14)
10,421.1 8,788.3 12,521.6 8,349.3 21,337.5 18,438.9 A. CURRENT ACCOUNT
Goods9,221.4 6,980.2 11,238.9 6,503.5 14,943.9 9,510.9 1. Merchandise
764.8 383.1 874.2 386.6 5,802.9 5,296.5 Services215.2 129.9 223.2 123.4 264.1 139.2 2. Transportation366.6 105.2 449.6 70.6 471.6 149.9 3. Travel
24.9 6.7 24.9 6.6 10.8 138.7 4. Communication108.0 24.7 139.4 75.0 110.9 253.7 5. Insurance
6.4 48.5 5.4 18.1 4.6 31.6 6. Other Government43.7 68.1 31.7 92.9 4,940.9 4,583.4 7. Other Services
297.6 1,314.7 299.7 1,379.2 445.5 3,519.4 Income297.6 1,314.7 299.7 1,379.2 445.5 3,519.4 8. Investment Income137.3 110.3 108.8 80.0 145.2 112.1 Current Unrequited Transfers120.1 100.4 94.0 71.3 129.3 106.6 9. Private
17.2 9.9 14.8 8.7 15.8 5.5 10. Government
1,420.1 3,856.5 1,350.5 5,363.4 5,850.1 6,622.9 B. CAPITAL AND FINANCIAL (Exc. Reserves & Related Items)
709.1 3,422.9 1,100.1 4,572.1 5,539.1 6,016.5 Private Sector709.1 0.0 549.4 0.0 1,831.0 1,060.4 11. Direct Investment
0.0 701.7 550.7 56.8 0.0 309.8 12. Commercial Banks0.0 2,721.2 0.0 4,515.3 3,708.1 4,646.3 13. Other Private Sector Capital1
711.0 433.6 250.4 791.3 311.0 606.4 Public Sector289.6 339.9 250.4 71.6 311.0 106.2 14. Official Borrowing
0.0 0.0 0.0 0.0 0.0 0.0 15. Official Loans0.0 10.7 0.0 10.5 0.0 11.2 16. State Enterprises Borrowing0.0 83.0 0.0 709.2 0.0 489.0 17.Heritage Stabilization Fund0.0 0.0 0.0 0.0 0.0 0.0 18. Other Assets
421.4 0.0 0.0 0.0 0.0 0.0 19. Other Liabilities
91.0 0.0 259.0 0.0 0.0 1,373.2 C. NET ERRORS & OMISSIONS
D. COUNTERPART ITEMS0.0 0.0 0.0 0.0 0.0 0.0 21. Allocation of S.D.R..
1,134.0 421.4 0.0 418.4 0.0 752.6 E. FINANCING – Change in Reserves2
0.0 0.0 0.0 0.0 0.0 0.0 22. Government
1,134.0 421.4 0.0 418.4 0.0 752.6 23. Central Bank
1,134.0 0.0 0.0 418.4 0.0 752.6 23.1 Reserve Assets0.0 0.0 0.0 0.0 0.0 0.0 23.2 I.M.F. Reserve Tranche0.0 421.4 0.0 0.0 0.0 0.0 23.3 S.D.R. Holdings
13,066.2 13,066.2 14,131.1 14,131.1 27,187.6 27,187.6 TOTAL
Sources: The Central Bank of Trinidad and Tobago and The Central Statistical Office of Trinidad and Tobago.
NOTE:
1. Excluding balances in the Heritage and Stabilization Fund (HSF).

BALANCE OF PAYMENTS REPORT 2011 Page 19
TABLE 1BANALYTIC SUMMARY 2005-2011
/US -$Mn/
Item 2005r 2006r 2007r 2008r 2009r 2010 2011
(1) (2) (3) (4) (5) (6) (7)
1. Merchandise (Net) 4,268.0 7,574.9 5,528.7 9,070.4 2,241.2 4,735.4 5,433.0 Exports 9,995.6 14,085.5 13,215.2 18,647.1 9,221.4 11,238.9 14,943.9 Imports 5,727.6 6,510.6 7,686.5 9,576.7 6,980.2 6,503.5 9,510.9
2. Services (Net) 356.2 450.9 546.4 609.7 381.7 487.6 506.3
Transportation 23.8 41.8 57.5 89.3 85.3 99.8 124.9 Travel 273.0 289.4 369.4 321.6 261.4 379.0 321.7 Communication 21.2 28.3 32.5 24.4 18.2 18.3 -127.9 Insurance 104.7 133.0 139.6 217.9 83.3 64.4 -142.8 Other Government -55.9 -38.8 -43.3 -36.4 -42.1 -12.7 -27.0 Other Services -10.6 -2.8 -9.3 -7.1 -24.4 -61.2 357.5
3. Income (Net) -793.0 -956.2 -968.8 -1,228.0 -1,017.1 -1,079.5 -3,073.9
Investment Income -793.0 -956.2 -968.8 -1,228.0 -1,017.1 -1,079.5 -3,073.9
4. Unrequited Transfers (Net) 50.1 55.2 60.2 46.9 27.0 28.8 33.1
Private 48.5 51.1 56.9 40.0 19.7 22.7 22.7 Government 1.6 4.1 3.3 6.9 7.3 6.1 10.4
CURRENT ACCOUNT (1+2+3+4) 3,881.3 7,124.8 5,166.5 8,499.0 1,632.8 4,172.3 2,898.5 5. Net Capital Movement (excl. Reserves) -1,169.5 -5,319.8 -3,253.6 -5,210.3 -2,436.4 -4,012.9 -772.8
Direct Investment 598.7 512.7 830.0 2,100.8 709.1 549.4 770.6 Commercial Banks 266.0 -741.4 106.8 -360.1 -701.7 493.9 -309.8 Other Private Sector Capital1 -1,585.9 -4,517.0 -3,909.6 -5,933.6 -2,721.2 -4,515.3 -938.2 Official Borrowing -20.7 -37.4 121.2 114.7 -50.3 178.8 204.8 Official Loans 0.0 0.0 0.0 0.0 0.0 0.0 0.0 State Enterprises Borrowing -10.7 -10.7 -10.5 -10.7 -10.7 -10.5 -11.2 Heritage Stabilization Fund -416.9 -526.0 -391.5 -1,121.4 -83.0 -709.2 -489.0 Other Assets 0.0 0.0 0.0 0.0 0.0 0.0 0.0 Other Liabilities 0.0 0.0 0.0 0.0 421.4 0.0 0.0
6. Net Errors & Omissions -1,237.1 -686.0 -372.2 -583.2 91.0 259.0 -1,373.2
7. Overall Surplus or Deficit 1,474.7 1,119.0 1,540.7 2,705.5 -712.6 418.4 752.5
8. Change in Reserves2 (- means increase) -1,474.7 -1,119.0 -1,540.7 -2,705.5 712.6 -418.4 -752.6 Government 0.0 0.0 0.0 0.0 0.0 0.0 0.0 Central Bank (Net) -1,474.7 -1,119.0 -1,540.7 -2,705.5 712.6 -418.4 -752.6 Reserve Assets -1,474.7 -1,119.0 -1,540.7 -2,705.5 1,134.0 -418.4 -752.6 I.M.F. Reserve Tranche 0.0 0.0 0.0 0.0 0.0 0.0 0.0 Special Drawing Rights 0.0 0.0 0.0 0.0 -421.4 0.0 0.0
Sources: The Central Bank of Trinidad and Tobago and The Central Statistical Office of Trinidad and Tobago.
NOTE:
1. Includes Other Investment and Portfolio Investment. 2. Excluding balances in the Heritage and Stabilization Fund (HSF).

BALANCE OF PAYMENTS REPORT 2011 Page 20
TABLE 1CANALYTIC SUMMARY 2005-2011
/US - $Mn/
Item 2005r 2006r 2007r 2008r 2009r 2010 2011
(1) (2) (3 (4) (5 (6) (7)
CURRENT ACCOUNT 3,881.3 7,124.8 5,166.5 8,499.0 1,632.8 4,172.3 2,898.5 Trade Account 4,268.0 7,574.9 5,528.7 9,070.4 2,241.2 4,735.4 5,433.0
Exports, f.o.b. 9,995.6 14,085.5 13,215.2 18,647.1 9,221.4 11,238.9 14,943.9o/w: Petroleum 4,391.0 5,942.5 3,878.7 7,152.5 3,099.3 4,856.3 5,095.2Chemicals 1,911.3 2,053.4 2,582.7 3,415.5 879.8 2,426.8 4,255.1
Imports, c.i.f. 5,727.6 6,510.6 7,686.5 9,576.7 6,980.2 6,503.5 9,510.9Services (net) 356.2 450.9 546.4 609.7 381.7 487.6 506.3Income (net) -793.0 -956.2 -968.8 -1,228.0 -1,017.1 -1,079.5 -3,073.9
Interest -242.8 -242.1 -310.4 -331.1 -246.9 -263.6 -5.3Other -550.2 -714.1 -658.4 -896.9 -770.2 -815.9 -3,068.6
Transfers 50.1 55.2 60.2 46.9 27.0 28.8 33.1
CAPITAL ACCOUNT -2,406.6 -6,005.8 -3,625.8 -5,793.5 -2,345.4 -3,753.9 -2,145.9 Private Sector -1,958.3 -5,431.7 -3,345.0 -4,776.1 -2,622.8 -3,213.0 -1,850.5
Direct Investment (net) 598.7 512.7 830.0 2,100.8 709.1 549.4 770.6 Inward 939.7 882.7 830.0 2,800.8 709.1 549.4 1,831.0 Outward 341.0 370.0 0.0 700.0 0.0 0.0 1,060.4
Commercial banks (net) 266.0 -741.4 106.8 -360.1 -701.7 493.9 -309.8Other Private Sector Capital (net)1 -2,823.0 -5,203.0 -4,281.8 -6,516.8 -2,630.2 -4,256.3 -2,311.3
Of which: Net Errors and Omissions -1,237.1 -686.0 -372.2 -583.2 91.0 259.0 -1,373.2Public Sector -448.3 -574.1 -280.8 -1,017.4 277.4 -540.9 -295.4
Official Borrowing -20.7 -37.4 121.2 114.7 -50.3 178.8 204.8 Disbursements 71.6 209.9 183.1 180.9 289.6 250.4 311.0 Amortizations -92.3 -247.3 -61.9 -66.2 -339.9 -71.6 -106.2Official Loans 0.0 0.0 0.0 0.0 0.0 0.0 0.0State Enterprises Borrowing -10.7 -10.7 -10.5 -10.7 -10.7 -10.5 -11.2
Heritage and Stabilization Fund -416.9 -526.0 -391.5 -1,121.4 -83.0 -709.2 -489.0Other Assets 0.0 0.0 0.0 0.0 0.0 0.0 0.0Other Liabilities 0.0 0.0 0.0 0.0 421.4 0.0 0.0
OVERALL BALANCE 1,474.7 1,119.0 1,540.7 2,705.5 -712.6 418.4 752.6
FINANCING -1,474.7 -1,119.0 -1,540.7 -2,705.5 712.6 -418.4 -752.6
Change in Gross Off. Res.
( - = increase)2 -1,474.7 -1,119.0 -1,540.7 -2,705.5 712.6 -418.4 -752.6Use of Fund Credit 0.0 0.0 0.0 0.0 0.0 0.0 0.0Central Government 0.0 0.0 0.0 0.0 0.0 0.0 0.0
Sources: The Central Bank of Trinidad and Tobago and The Central Statistical Office of Trinidad and Tobago.
NOTE:
1. Includes Other Investment, Portfolio Investment and Net Errors and Omissions.2. Excluding balances in the Heritage and Stabilization Fund (HSF).

BALANCE OF PAYMENTS REPORT 2011 Page 21
TABLE 2MERCHANDISE TRANSACTIONS, 2005-2011
/US - $Mn/
Item 2005r 2006r 2007r 2008r 2009r 2010 2011
(1) (2 (3) (4) (5) (6) (7)
CREDIT
EXPORTS
Exports f.o.b. 9,995.6 14,085.5 13,215.2 18,647.1 9,221.4 11,238.9 14,943.9
o/w Stores and Bunkers 110.4 163.9 78.1 291.1 55.2 120.3 112.2
Repairs on Goods 0.0 0.0 0.0 0.0 0.0 0.0 0.0
Non-Monetary Gold 0.0 0.0 0.0 0.0 0.0 0.0 0.0
1. Total exports f.o.b. 9,995.6 14,085.5 13,215.2 18,647.1 9,221.4 11,238.9 14,943.9
DEBIT
IMPORTS
Imports c.i.f. 5,727.6 6,510.6 7,686.5 9,576.7 6,980.2 6,503.5 9,510.9
o/w Stores and Bunkers 0.0 0.0 0.0 0.0 0.0 0.0 0.0
Repairs on Goods 0.0 0.0 0.0 0.0 0.0 0.0 0.0
Non-Monetary Gold 0.0 0.0 0.0 0.0 0.0 0.0 0.0
2. Total imports c.i.f. 5,727.6 6,510.6 7,686.5 9,576.7 6,980.2 6,503.5 9,510.9
TRADE BALANCE 4,268.0 7,574.9 5,528.7 9,070.4 2,241.2 4,735.4 5,433.0
Sources: The Central Bank of Trinidad and Tobago,The Central Statistical Office of Trinidad and Tobago and Petroleum Company of Trinidad and Tobago Limited.

BALANCE OF PAYMENTS REPORT 2011 Page 22
TABLE 3TRANSPORTATION, 2005- 2011
/US - $Mn/
Item 2005 2006 2007 2008 2009 2010 2011
(1) (1) (3) (4) (5) (6) (7)
CREDIT
1. Passenger Fares 139.9 134.5 158.2 159.5 181.1 179.7 178.3
2. Port Disbursements 63.6 57.3 57.8 45.0 20.6 30.1 72.6
2.1 Port Charges 4.4 4.9 6.9 7.0 0.6 1.1 6.9
2.2 Airport Charges 4.7 4.5 6.7 7.6 8.2 11.9 7.5
2.3 Pilotage 0.7 0.7 0.7 0.7 0.7 0.7 0.9
2.4 Cargo Charges 53.4 46.7 43.4 28.9 10.8 16.3 57.0
2.5 Other Port Disbursements 0.4 0.5 0.1 0.8 0.3 0.1 0.3
3. Sale of Consignment Notes 11.3 10.1 13.3 13.4 13.4 13.3 13.2
4. Sale of Consignment Notes on behalf of foreign airlines 0.0 0.0 0.0 0.0 0.0 0.0 0.0
5. Other Miscellaneous Receipts 0.4 0.4 0.1 0.1 0.1 0.1 0.1
5.1 Mail 0.0 0.0 0.0 0.0 0.0 0.0 0.0
5.2 Other 0.4 0.4 0.1 0.1 0.1 0.1 0.1
TOTAL 215.2 202.3 229.4 218.0 215.2 223.2 264.1
DEBIT
6. Passenger Fares 54.2 52.9 61.0 27.1 31.3 25.7 42.1
7. Port Disbursements 89.8 82.0 81.7 82.3 83.6 82.9 82.2
8. Other Miscellaneous Payments 47.4 25.6 29.2 19.3 15.0 14.8 14.8
TOTAL 191.4 160.5 171.9 128.7 129.9 123.4 139.2
NET BALANCE 23.8 41.8 57.5 89.3 85.3 99.8 124.9
Sources: The Central Bank of Trinidad and Tobago.

BALANCE OF PAYMENTS REPORT 2011 Page 23
TABLE 4TRAVEL, 2005-2011
/US - $Mn/
Item 2005 2006 2007 2008 2009 2010 2011
(1) (2) (3) (4) (5) (6) (7)
CREDIT 1. Hotel visitors 41.7 48.2 66.9 45.6 93.1 89.3 129.2
2. Business visitors 88.6 95.1 107.3 207.9 56.6 53.4 89.2
3. Private home and others 308.2 213.7 271.9 126.4 192.9 286.1 232.7
4. Students 13.7 20.9 14.7 15.3 22.9 20.4 20.1
5. Advances to crew 0.8 4.3 2.3 1.7 1.1 0.4 0.3
TOTAL 453.0 382.2 463.1 396.9 366.6 449.6 471.6
DEBIT
6. Advances to crew 0.1 0.1 0.1 0.4 0.1 0.1 0.1
7. Students 3.4 6.9 7.7 7.9 25.8 3.0 5.6
8. Government officials 0.3 0.4 0.2 0.1 0.2 0.3 0.2
9. Tourists and other travelers 176.2 85.4 85.7 66.9 79.1 67.2 144.0
TOTAL 180.0 92.8 93.7 75.3 105.2 70.6 149.9
NET BALANCE 273.0 289.4 369.4 321.6 261.4 379.0 321.7
Sources: The Central Bank of Trinidad and Tobago and The Central Statistical Office of Trinidad and Tobago.

BALANCE OF PAYMENTS REPORT 2011 Page 24
TABLE 5AINVESTMENT INCOME, 2005-2011
/US - $Mn/
Item 2005r 2006r 2007r 2008r 2009r 2010r 2011
(1) (2) (3) (4) (5) (6) (7)
CREDIT
INTEREST 74.9 254.3 261.1 303.2 286.8 288.6 445.5
(i) Central Government - Interest earned on external securities 0.1 0.1 0.1 0.1 0.1 0.1 0.1
(ii) Central Bank - Interest earned on investments abroad 55.3 239.7 246.4 282.7 259.9 244.6 255.9
(iii) Commercial Banks - Interest on foreign investment 15.8 10.1 10.1 11.3 18.6 19.7 178.8
(iv) Other 3.7 4.4 4.5 9.1 8.2 24.2 10.7
DIVIDENDS AND PROFITS 8.9 7.6 6.0 6.7 10.8 11.1 0.0
TOTAL 83.8 261.9 267.1 309.9 297.6 299.7 445.5
DEBIT
INTEREST 317.7 496.4 571.5 634.3 533.7 552.2 450.8
(i) Central government - Interest paid on external loans 93.6 103.8 89.0 117.9 94.5 49.7 54.3
(ii) State Enterprises - Interest paid on external loans 0.0 0.0 0.0 0.0 0.0 0.0 0.0
(iii) Direct Foreign Investment - Interest paid on external loans 182.5 283.8 336.3 368.9 273.9 116.3 379.2
(iv) Other 41.6 108.8 146.2 147.5 165.3 386.2 17.3
DIVIDENDS AND PROFITS 266.9 315.3 367.8 409.1 485.1 575.9 1,987.9
REINVESTED EARNINGS 292.2 406.4 296.6 494.5 295.9 251.1 1,080.7
TOTAL 876.8 1,218.1 1,235.9 1,537.9 1,314.7 1,379.2 3,519.4
NET BALANCE -793.0 -956.2 -968.8 -1,228.0 -1,017.1 -1,079.5 -3,073.9
Source: The Central Bank of Trinidad and Tobago.

BALANCE OF PAYMENTS REPORT 2011 Page 25
TABLE 5BPRIVATE SECTOR - INVESTMENT INCOME OF DIRECT INVESTMENT ENTERPRISES
IN TRINIDAD AND TOBAGO BY SECTOR OF ACTIVITY, 2005-2011/US - $Mn/
Item TotalREMITTANCES ABROAD Estimated
ReinvestedEarningsTotal Dividends Interest Profits
2 0 0 5
1. Petroleum Industries 613.9 333.7 83.5 178.0 72.2 280.2
1.1 Mining, Exploration and Production, Refineries Petrochemicals 404.4 223.7 51.1 109.1 63.5 180.7
1.2 Service Contractors Marketing and Distribution 209.5 110.0 32.4 68.9 8.7 99.5
2. Food, Drink and Tobacco 1.2 1.2 0.0 0.0 1.2 0.0
3. Chemicals and Non-Metallic Minerals 2.7 0.0 0.0 0.0 0.0 2.7
4. Assembly Type and Related Industries 81.4 72.6 61.4 4.5 6.7 8.8
5. Distribution 0.7 0.2 0.0 0.0 0.2 0.5
6. All Other Sectors 41.7 41.7 22.9 0.0 18.8 0.0
TOTAL 741.6 449.4 167.8 182.5 99.1 292.2
2 0 0 6
1. Petroleum Industries 740.5 385.4 127.5 185.3 72.6 355.1
1.1 Mining, Exploration and Production, Refineries Petrochemicals 459.5 244.8 70.6 105.8 68.4 214.7
1.2 Service Contractors Marketing and Distribution 281.0 140.6 56.9 79.5 4.2 140.4
2. Food, Drink and Tobacco 0.5 0.5 0.0 0.0 0.5 0.0
3. Chemicals and Non-Metallic Minerals 21.2 18.5 10.4 8.1 0.0 2.7
4. Assembly Type and Related Industries 155.3 132.8 40.7 75.1 17.0 22.5
5. Distribution 7.8 7.8 0.0 5.8 2.0 0.0
6. All Other Sectors 80.2 54.1 24.1 9.5 20.5 26.1
TOTAL 1,005.5 599.1 202.7 283.8 112.6 406.4
2 0 0 7
1. Petroleum Industries 704.9 467.5 162.5 234.9 70.1 237.4
1.1 Mining, Exploration and Production, Refineries Petrochemicals 400.6 267.6 101.4 103.9 62.3 133.0
1.2 Service Contractors Marketing and Distribution 304.3 199.9 61.1 131.0 7.8 104.4
2. Food, Drink and Tobacco 0.5 0.5 0.0 0.0 0.5 0.0
3. Chemicals and Non-Metallic Minerals 32.8 28.5 11.5 17.0 0.0 4.3
4. Assembly Type and Related Industries 171.2 151.4 66.1 73.7 11.6 19.8
5. Distribution 19.8 9.8 5.7 0.2 3.9 10.0
6. All Other Sectors 71.5 46.4 21.5 10.5 14.4 25.1
TOTAL 1,000.7 704.1 267.3 336.3 100.5 296.6
2 0 0 8
1. Petroleum Industries 1,055.5 601.2 206.6 288.0 106.6 454.3
1.1 Mining, Exploration and Production, Refineries Petrochemicals 683.5 411.0 155.1 157.1 98.8 272.5
1.2 Service Contractors Marketing and Distribution 372.0 190.2 51.5 130.9 7.8 181.8
2. Food, Drink and Tobacco 3.8 3.8 0.0 0.0 3.8 0.0
3. Chemicals and Non-Metallic Minerals 22.6 14.2 0.0 13.0 1.2 8.4
4. Assembly Type and Related Industries 102.4 98.3 15.0 60.5 22.8 4.1
5. Distribution 28.7 14.4 10.9 0.3 3.2 14.3
6. All Other Sectors 59.5 46.1 16.3 7.1 22.7 13.4
TOTAL 1,272.5 778.0 248.8 368.9 160.3 494.5
Source: The Central Bank of Trinidad and Tobago.

BALANCE OF PAYMENTS REPORT 2011 Page 26
TABLE 5B CONT’DPRIVATE SECTOR - INVESTMENT INCOME OF DIRECT INVESTMENT ENTERPRISES
IN TRINIDAD AND TOBAGO BY SECTOR OF ACTIVITY, 2005-2011/US - $Mn/
Item Total REMITTANCES ABROAD Estimated
ReinvestedEarningsTotal Dividends Interest Profits
2 0 0 9
1. Petroleum Industries 700.3 503.8 241.8 181.4 80.6 196.5
1.1 Mining, Exploration and Production, Refineries Petrochemicals 400.6 288.2 138.3 103.8 46.1 112.4
1.2 Service Contractors Marketing and Distribution 299.7 215.6 103.5 77.6 34.5 84.1
2. Food, Drink and Tobacco 0.6 0.5 0.2 0.2 0.1 0.1
3. Chemicals and Non-Metallic Minerals 40.5 30.7 14.7 11.1 4.9 9.8
4. Assembly Type and Related Industries 214.1 163.2 78.3 58.8 26.1 50.9
5. Distribution 16.5 10.6 5.1 3.8 1.7 5.9
6. All Other Sectors 82.9 50.2 23.7 18.6 7.9 32.7
TOTAL 1,054.9 759.0 363.8 273.9 121.3 295.9
2 0 1 0
1. Petroleum Industries 604.4 443.6 174.2 74.5 194.9 160.8
1.1 Mining, Exploration and Production, Refineries Petrochemicals 400.7 294.1 115.5 49.4 129.2 106.6
1.2 Service Contractors Marketing and Distribution 203.7 149.5 58.7 25.1 65.7 54.2
2. Food, Drink and Tobacco 1.1 0.8 0.4 0.1 0.3 0.3
3. Chemicals and Non-Metallic Minerals 23.6 17.3 6.8 2.9 7.6 6.3
4. Assembly Type and Related Industries 194.2 142.5 55.9 23.9 62.7 51.7
5. Distribution 12.1 8.9 3.5 1.5 3.9 3.2
6. All Other Sectors 107.9 79.1 30.9 13.4 34.8 28.8
TOTAL 943.3 692.2 271.7 116.3 304.2 251.1
2 0 1 1
1. Petroleum Industries 6,482.1 5,474.5 1,847.3 359.9 3,267.3 1,007.6
1.1 Mining, Exploration and Production, Refineries Petrochemicals 6,278.5 5,301.1 1,836.0 238.9 3,226.3 977.4
1.2 Service Contractors Marketing and Distribution 203.5 173.4 11.4 121.0 41.0 30.2
2. Food, Drink and Tobacco 30.8 0.0 0.0 0.0 0.0 30.8
3. Chemicals and Non-Metallic Minerals 10.6 7.6 0.0 0.0 7.6 3.1
4. Assembly Type and Related Industries 199.2 184.6 76.1 17.9 90.6 14.5
5. Distribution 69.1 44.3 9.1 1.4 33.8 24.7
6. All Other Sectors 98.3 98.3 31.3 0.0 67.1 0.0
TOTAL 6,890.1 5,809.4 1,963.8 379.2 3,466.4 1,080.7
Source: The Central Bank of Trinidad and Tobago.

BALANCE OF PAYMENTS REPORT 2011 Page 27
TABLE 6OTHER GOVERNMENT, 2005-2011
/US - $Mn/
Item 2005 2006 2007 2008 2009 2010 2011
(1) (2) (3) (4) (5) (6) (7)
CREDIT
1. Receipts from International Institutions 12.2 11.5 12.1 16.4 5.8 5.4 4.6
2. Receipts from Foreign Diplomatic Agencies 1.8 1.8 1.8 1.8 0.6 0.0 0.0
3. Signature Bonuses 0.0 0.0 0.0 0.0 0.0 0.0 0.0
TOTAL 14.0 13.3 13.9 18.2 6.4 5.4 4.6
DEBIT
4. Central Government - Diplomatic and Other Foreign Expenditures 64.0 46.8 50.0 47.1 47.3 17.4 30.8
5. Payments to International Institutions 5.9 5.3 7.2 7.5 1.2 0.7 0.8
TOTAL 69.9 52.1 57.2 54.6 48.5 18.1 31.6
NET BALANCE -55.9 -38.8 -43.3 -36.4 -42.1 -12.7 -27.0
Source: The Central Bank of Trinidad and Tobago.

BALANCE OF PAYMENTS REPORT 2011 Page 28
TABLE 7OTHER SERVICES, 2005-2011
/US - $Mn/
Item 2005 2006 2007 2008 2009 2010 2011
(1) (2) (3) (4) (5) (6) (7)
CREDIT
1. Advertising 9.1 10.2 8.1 10.5 10.8 4.9 1.9
2. Agents Fees 11.8 13.8 10.4 8.5 7.7 6.7 8.4
3. Oil processing fees 2.0 2.1 2.1 2.0 2.1 0.6 96.9
4. Charter Hire 0.0 0.0 0.0 0.0 0.5 0.1 0.1
5. Other 19.0 22.6 23.0 25.3 22.6 19.4 4,833.6
TOTAL 41.9 48.7 43.6 46.3 43.7 31.7 4,940.9
DEBIT
6. Personal Income 1.4 1.4 1.4 1.4 1.2 0.5 61.5
7. Management Fees 0.2 0.2 0.4 0.6 1.6 7.1 181.2
8. Commissions 1.7 1.7 1.7 1.7 8.1 7.7 0.0
9. Royalties, Patents & Similar Fees 1.5 2.8 4.4 4.3 10.2 12.3 60.1
10. Advertising 5.7 7.4 7.4 7.5 9.7 8.3 7.1
11. Rentals 0.8 0.8 0.7 0.8 0.8 12.5 49.4
12. Charter Hire 0.1 0.4 0.3 0.1 0.0 0.0 0.0
13. Other Misc. Payments 41.1 36.8 36.6 37.0 36.5 44.5 4,224.1
TOTAL 52.5 51.5 52.9 53.4 68.1 92.9 4,583.4
NET BALANCE -10.6 -2.8 -9.3 -7.1 -24.4 -61.2 357.5
Source: The Central Bank of Trinidad and Tobago.

BALANCE OF PAYMENTS REPORT 2011 Page 29
TABLE 8UNREQUITED TRANSFERS: PRIVATE, 2005-2011
/US - $Mn/
Item 2005 2006 2007 2008 2009 2010 2011
(1) (2) (3) (4) (5) (6) (7)
CREDIT
1. Migrants Transfers 1.1 1.1 1.0 1.1 1.0 1.0 1.0
2. Remittances to Institutions 1.5 2.0 0.7 0.4 9.8 2.1 2.2
3. Remittances to Individuals 92.4 91.2 109.4 94.5 109.3 90.9 126.1
TOTAL 95.0 94.3 111.1 96.0 120.1 94.0 129.3
DEBIT
4. Remittances Abroad 46.3 43.0 53.8 55.6 100.4 71.3 106.6
4.1 Maintenance 1.3 1.3 1.3 1.4 1.3 1.3 1.3 4.2 Gifts and Donations 1.8 1.7 1.6 1.2 10.2 2.7 0.0 4.3 Emigrants Transfers 5.2 5.1 3.5 3.1 0.9 0.1 0.0 4.4 Legacies and Settlements of Trust 2.6 2.6 2.6 2.6 2.6 2.6 2.6 4.5 Other Remittances 35.4 32.3 44.8 47.3 85.4 64.6 102.7
5. Payments to Foreign Diplomatic Agencies 0.2 0.2 0.4 0.4 0.0 0.0 0.0
TOTAL 46.5 43.2 54.2 56.0 100.4 71.3 106.6
NET BALANCE 48.5 51.1 56.9 40.0 19.7 22.7 22.7
Source: The Central Bank of Trinidad and Tobago.
BALANCE OF PAYMENTS REPORT 2011 Page 30
TABLE 9UNREQUITED TRANSFERS: GOVERNMENT, 2005-2011
/US - $Mn/
Item 2005 2006 2007 2008 2009 2010 2011
(1) (2) (3) (4) (5) (6) (7)
CREDIT
1. Withholding taxes 6.8 10.1 10.0 12.5 17.2 14.7 15.8
2. Remittances by other Gov’ts 0.2 0.2 0.3 0.2 0.0 0.1 0.0
TOTAL 7.0 10.3 10.3 12.7 17.2 14.8 15.8
DEBIT
3. Contributions to international institutions 4.0 4.6 5.6 4.3 8.0 7.7 4.3
3.1 United Nations Organisations 0.0 0.6 0.5 0.3 1.6 1.6 1.83.2 Regional Bodies 3.6 3.9 4.5 3.6 5.7 4.6 1.83.3 Organisation of American States 0.0 0.1 0.1 0.1 0.1 0.0 0.13.4 Commonwealth Bodies 0.4 0.0 0.5 0.3 0.3 0.3 0.33.5 Other international institutions 0.0 0.0 0.0 0.0 0.3 1.2 0.3
4. Pensions paid abroad 1.4 1.6 1.4 1.5 1.9 1.0 1.2
5. Other miscellaneous grants 0.0 0.0 0.0 0.0 0.0 0.0 0.0
TOTAL 5.4 6.2 7.0 5.8 9.9 8.7 5.5
NET BALANCE 1.6 4.1 3.3 6.9 7.3 6.1 10.4
Source: The Central Bank of Trinidad and Tobago.
BALANCE OF PAYMENTS REPORT 2011 Page 31
TABLE 10 ADIRECT INVESTMENT CAPITAL IN PRIVATE SECTOR ENTERPRISES
BY SECTOR OF ACTIVITY, 2005-2011/US - $Mn/
Item 2005 2006 2007 2008 2009 2010 2011
1. Petroleum Industries 857.2 794.9 763.4 588.8 646.9 501.0 1,673.3
1.1 Mining, Exploration and Production Refineries, Petrochemicals 813.0 735.5 710.6 532.5 610.2 470.8 1,655.4 1.2 Service Contractors, Marketing and Distribution 44.2 59.4 52.8 56.3 36.7 30.2 17.9
2. Food, Drink and Tobacco 4.3 6.8 9.7 7.3 5.0 4.4 64.9
3. Chemicals and Non-Metallic Minerals 1.4 2.3 2.2 1.6 1.6 1.2 3.4
4. Assembly Type and Related Industries 9.6 7.2 9.1 7.1 6.3 4.9 0.0
5. Distribution 2.6 2.9 2.7 2.0 2.1 1.6 38.9
6. All Other Sectors 64.6 68.6 42.9 2,194.0 47.2 36.3 50.4
TOTAL 939.7 882.7 830.0 2,800.8 709.1 549.4 1,831.0
Source: The Central Bank of Trinidad and Tobago.
NOTES:
1. “All Other Sectors” includes textiles, printing, publishing and paper convertors, miscellaneous manufacturing, construction, hotels, transportation and business services etc. and insurance companies.
2. In 2008, FDI amounted to US$2,194 million in the “All Other Sectors” category. This was as a result of the purchase of RBTT Financial Group by the Royal Bank of Canada.

BALANCE OF PAYMENTS REPORT 2011 Page 32
TABLE 10 BDIRECT FOREIGN INVESTMENT BY COUNTRY OF ORIGIN, 2005-2011
/US - $Mn/
Country 2005 2006 2007 2008 2009 2010 2011
(1) (2) (3) (4) (5) (6) (7)
U.S.A. 693.8 626.7 574.4 403.4 468.6 363.2 523.2
U.K. 164.5 150.1 159.1 145.8 152.4 118.2 22.8
Canada 1.4 2.6 2.9 2,194.0 3.5 2.7 990.3
Germany 41.4 37.6 43.1 30.4 31.9 24.7 77.2
Japan 0.2 0.2 0.2 0.2 0.1 0.5 18.1
India 16.4 26.5 21.2 15.9 17.3 13.2 1.8
Other 22.0 39.0 29.1 11.1 35.3 26.9 197.5
TOTAL 939.7 882.7 830.0 2,800.8 709.1 549.4 1,831.0
Source: The Central Bank of Trinidad and Tobago.
TABLE 10 CCOMPONENTS OF DIRECT FOREIGN INVESTMENT, 2005-2011
/US - $Mn/
Item 2005 2006 2007 2008 2009 2010 2011
(1) (2) (3) (4) (5) (6) (7)
Direct Investment 939.7 882.7 830.0 2,800.8 709.1 549.4 1,831.0
Equity Capital 663.9 496.6 554.4 2,322.1 425.6 308.9 0.0
Reinvested Earnings 292.2 406.4 296.6 494.5 295.9 251.1 1,695.6
Other -16.4 -20.3 -21.0 -15.8 -12.4 -10.6 135.4
Source: The Central Bank of Trinidad and Tobago.

BALANCE OF PAYMENTS REPORT 2011 Page 33
TABLE 11CENTRAL GOVERNMENT EXTERNAL DEBT, 2005-2011
/US - $Mn/
SECTOREND OF PERIOD
2005 2006 2007 2008 2009 2010 2011
(1) (2) (3) (4) (5) (6) (7)
CENTRAL GOVERNMENT
Receipts 71.6 209.9 183.1 180.9 289.6 250.4 311.0
of which: Leases 0.0 0.0 0.0 0.0 0.0 0.0 0.0Amortization 92.3 247.3 61.9 66.2 339.9 71.6 106.2
of which: Leases 0.0 0.0 0.0 0.0 0.0 0.0 0.0 Debt Conversion 0.0 0.0 0.0 0.0 0.0 0.0 0.0Rescheduling 0.0 0.0 0.0 0.0 0.0 0.0 0.0
Valuation Adjustment 0.0 0.0 0.0 0.0 0.0 0.0 0.0
Balance Outstanding 1,308.0 1,270.6 1,442.8 1,557.5 1,507.2 1,686.0 1,890.8
of which: Leases 0.0 0.0 0.0 0.0 0.0 0.0 0.0Interest 93.6 103.8 89.0 117.9 94.5 49.7 73.0
GOVERNMENT GUARANTEED1
Receipts 0.0 0.0 0.0 0.0 0.0 0.0 0.0
Amortization 0.0 0.0 0.0 0.0 0.0 0.0 0.0
Rescheduling* 0.0 0.0 0.0 0.0 0.0 0.0 0.0
Balance Outstanding 51.0 51.0 0.0 0.0 0.0 0.0 0.0
Interest 0.0 0.0 0.0 0.0 0.0 0.0 0.0
NON-GOVERNMENT GUARANTEED2
Receipts 0.0 0.0 0.0 0.0 0.0 0.0 0.0
Amortization 0.0 0.0 0.0 0.0 0.0 0.0 0.0
Balance Outstanding 0.0 0.0 0.0 0.0 0.0 0.0 0.0
Interest 0.0 0.0 0.0 0.0 0.0 0.0 0.0
CENTRAL BANK
Receipts 0.0 0.0 0.0 0.0 0.0 0.0 0.0
Amortization 0.0 0.0 0.0 0.0 0.0 0.0 0.0
Balance Outstanding 0.0 0.0 0.0 0.0 0.0 0.0 0.0
Interest 0.0 0.0 0.0 0.0 0.0 0.0 0.0
TOTAL
Receipts 71.6 209.9 183.1 180.9 289.6 250.4 311.0
Amortization 92.3 247.3 61.9 -66.2 339.9 71.6 106.2
of which: Debt Conversion 0.0 0.0 0.0 0.0 0.0 0.0 0.0Rescheduling 0.0 0.0 0.0 0.0 0.0 0.0 0.0
Valuation Adjustment 0.0 0.0 0.0 0.0 0.0 0.0 0.0
Balance Outstanding 1,359.0 1,321.6 1,442.8 1,557.5 1,507.2 1,686.0 1,890.8
Interest 93.6 103.8 89.0 117.9 94.5 49.7 73.0
Source: The Central Bank of Trinidad and Tobago.
NOTES:* Once rescheduled, the external debt of the state enterprises becomes the external liability of the central government.1. External debt of state enterprises and public utilities guaranteed by the government.2. Non-guaranteed debt of state enterprises and public utilities.

BALANCE OF PAYMENTS REPORT 2011 Page 34
TABLE 12FOREIGN RESERVES1, 2005- 2011
/US-$Mn/
END OF PERIOD
CENTRAL BANK
ForeignAssets
of whichForeign
Liabilities
International Reserves
(1-4)
Central Government
Net Official Reserves
(5+6)IMF Reserve
Tranche PositionSDR
Holdings
(1) (2) (3) (4) (5) (6) (7)
2005 4,015.0 0.0 1.6 16.1 3,998.9 0.1 3,999.0
2006 5,134.0 0.0 1.1 16.1 5,117.9 0.1 5,118.0
2007 6,673.4 0.0 0.9 14.8 6,658.6 0.1 6,658.7
2008 9,380.2 0.0 1.1 16.1 9,364.1 0.1 9,364.2
2009 8,651.5 0.0 421.4 0.0 8,651.5 0.1 8,651.6
2010* 9,069.8 0.0 424.3 0.0 9,069.8 0.2 9,070.0
2011 9,822.4 0.0 423.2 0.0 9,822.4 0.3 9,822.7
END OF
PERIOD
COMMERCIAL BANKS
Foreign AssetsForeign
Liabilities
Net Foreign Position
(8-9)
GrossForeign Assets
(1+6+8)
Total Liabilities
(4+9)
Net Foreign Position(11-12)
(8) (9) (10) (11) (12) (13)
2005 1,407.2 1,151.6 255.6 5,422.3 1,167.7 4,254.6
2006 1,945.8 948.8 997.0 7,079.9 964.9 6,115.0
2007 1,959.7 1,069.5 890.2 8,633.2 1,084.3 7,548.9
2008 2,203.5 953.3 1,250.2 11,583.8 969.4 10,614.5
2009 2,739.3 787.3 1,952.0 11,390.9 787.3 10,603.6
2010 2,188.6 730.6 1,458.1 11,258.7 730.6 10,528.1
2011 2,490.9 723.0 1,767.8 12,313.6 723.0 11,590.5
Source: The Central Bank of Trinidad and Tobago.
NOTES:
1. Excluding balances in the Heritage and Stabilization Fund (HSF).* Reserves in 2009 includes an IMF SDR Allocation of US$421.4 million in September.

BALANCE OF PAYMENTS REPORT 2011 Page 35
TABLE 13COMMERCIAL BANKS - FOREIGN ASSETS AND LIABILITIES
(Stock as at the end of the period), 2005-2011/US - $Mn/
Item 2005 2006 2007 2008 2009 2010 2011
(1) (2) (3) (4) (5) (6) (7)
ASSETS
1. Cash 12.3 14.4 13.9 18.9 20.9 24.8 25.2
2. Due from Banks 434.9 766.0 625.6 974.3 1,294.3 902.3 665.2
3. Cash Items in the Process of Collection 14.2 8.3 7.6 10.7 4.8 1.8 2.3
3. Investments (Net) 355.7 498.5 549.2 354.5 700.8 646.8 1,136.2
4. Loans (Net) 254.2 331.7 452.3 479.0 417.8 317.9 328.8
5. Other 335.9 326.9 311.1 366.1 300.6 295.1 333.1
TOTAL 1,407.2 1,945.8 1,959.7 2,203.5 2,739.3 2,188.6 2,490.9
LIABILITIES
7. Deposits 173.1 192.0 184.3 161.0 204.9 191.8 226.3
8. Due to Financial Institutions 449.1 248.8 438.0 419.9 239.8 140.9 153.4
9. Other 529.4 507.9 447.2 372.5 342.6 397.8 343.3
Sub-Total 1,151.6 948.8 1,069.5 953.3 787.3 730.6 723.0
10.Capital 0.0 0.0 0.0 0.0 0.0 0.0 0.0
TOTAL 1,151.6 948.8 1,069.5 953.3 787.3 730.6 723.0
NET BALANCE 255.6 997.1 890.1 1,250.2 1,952.0 1,458.1 1,767.8
Source: The Central Bank of Trinidad and Tobago.
BALANCE OF PAYMENTS REPORT 2011 Page 36
TABLE 14T&T DOLLAR EXCHANGE RATES FOR SELECTED CURRENCIES1
Period
United States Dollar
Canadian Dollar UK Pound Sterling Japanese Yen Euro
Buying Selling Buying Selling Buying Selling Buying Selling Buying Selling
(1) (2) (3) (4) (5) (6) (7) (8) (9) (10)
2005 6.2319 6.2996 5.0866 5.2849 11.1559 11.6325 0.0566 0.0595 7.6171 7.8818
2006 6.2565 6.3132 5.4221 5.6571 11.7748 12.3085 0.0531 0.0538 7.9230 8.2216
2007 6.2735 6.3282 5.7744 6.0402 12.2988 12.8575 0.0531 0.0538 8.4361 8.7990
2008 6.2234 6.2891 5.7929 6.0553 11.2925 11.8596 0.0621 0.0609 8.9735 9.3961
2009 6.2735 6.3259 5.4486 5.6911 9.6108 10.0982 0.0670 0.0679 8.5703 8.9866
2010 6.3203 6.3757 6.0640 6.3055 9.6020 10.0445 0.0722 0.0729 8.2477 8.5850
2011 6.3729 6.4261 6.3605 6.6262 9.9974 10.4562 0.0800 0.0807 8.6736 9.0375
2011
January 6.3693 6.4291 6.3119 6.5836 9.8508 10.2960 0.0771 0.0778 8.3152 8.6816
February 6.3577 6.4192 6.3438 6.6357 10.0430 10.4867 0.0770 0.0777 8.5182 8.8882
March 6.3735 6.4232 6.4286 6.6949 10.0856 10.5384 0.0782 0.0788 8.7013 9.1024
QTR1 6.3669 6.4239 6.3606 6.6372 9.9908 10.4380 0.0774 0.0781 8.5084 8.8873
April 6.3822 6.4242 6.5586 6.8309 10.1758 10.6486 0.0766 0.0772 8.9761 9.3755
May 6.3775 6.4250 6.5120 6.7725 10.2127 10.6683 0.0786 0.0792 8.9537 9.3393
June 6.3845 6.4293 6.4381 6.6877 10.1061 10.6002 0.0793 0.0799 8.9671 9.3524
QTR2 6.3813 6.4262 6.5021 6.7627 10.1655 10.6394 0.0782 0.0788 8.9653 9.3551
July 6.3775 6.4298 6.5871 6.8486 10.0885 10.5042 0.0805 0.0811 8.8987 9.2815
August 6.3653 6.4268 6.4147 6.6586 10.1945 10.6593 0.0827 0.0836 8.9333 9.2991
September 6.3699 6.4264 6.2923 6.5477 9.8579 10.3132 0.0829 0.0837 8.6065 8.9354
QTR3 6.3709 6.4277 6.4314 6.6849 10.0470 10.4922 0.0820 0.0828 8.8128 9.1720
October 6.3643 6.4226 6.1532 6.4514 9.8008 10.2473 0.0830 0.0837 8.5195 8.8688
November 6.3709 6.4263 6.1464 6.4130 9.8352 10.3188 0.0822 0.0829 8.4745 8.8057
December 6.3835 6.4306 6.1554 6.4069 9.7322 10.2086 0.0820 0.0826 8.2376 8.5423
QTR4 6.3728 6.4265 6.1515 6.4234 9.7909 10.2602 0.0824 0.0831 8.4126 8.7411
Source: The Central Bank of Trinidad and Tobago.
NOTE:
1. Monthly, Quarterly, and Annual rates are averages for the respective month, quarter and year.
BALANCE OF PAYMENTS REPORT 2011 Page 37
APPENDICES


BALANCE OF PAYMENTS REPORT 2011 Page 39
APPENDIX 1IMPORTS (C.I.F.) BY S.I.T.C. SECTIONS, 2005-2011
/US -$Mn/
Sections 2005r 2006r 2007r 2008r 2009r 2010r 2011
(1) (2) (3) (4) (5) (6) (7)
0. Food 434.8 439.2 541.3 675.3 605.4 625.1 737.5
1. Beverage and Tobacco 42.2 39.5 39.9 51.8 54.0 54.8 64.8
2. Crude materials, inedible except fuels 265.8 298.8 573.3 552.9 214.8 328.5 498.0
3. Minerals, fuel, lubricants and related materials (net import u.p.a.) 1,974.5 2,261.7 2,551.1 3,314.7 2,281.3 2,144.8 3,661.6
4. Animal and vegetable oils and fats 18.0 21.1 29.3 46.5 32.9 36.3 53.7
5. Chemicals 420.5 527.9 581.1 775.4 546.7 497.5 614.3
6. Manufactured goods classified chiefly by material 719.0 798.8 1,007.5 1,322.2 912.6 746.6 799.9
7. Machinery and transport equipment 1,515.4 1,739.3 1,924.7 2,333.7 1,927.0 1,686.3 2,647.4
8. Miscellaneous manufactured articles 313.0 356.9 406.6 470.3 378.7 356.3 394.5
9. Miscellaneous transactions and commodities n.e.s. 6.6 7.6 7.5 8.3 9.2 5.2 6.6
TOTAL IMPORTS 5,709.8 6,490.8 7,662.3 9,551.1 6,962.6 6,481.4 9,478.3
Source: The Central Statistical Office of Trinidad and Tobago.

BALANCE OF PAYMENTS REPORT 2011 Page 40
APPENDIX 2EXPORTS (F.O.B.) BY S.I.T.C. SECTIONS, 2005-20111
/US- $Mn/
Sections 2005r 2006r 2007r 2008r 2009r 2010r 2011
(1) (2) (3) (4) (5) (6) (7)
0. Food 167.5 186.0 193.7 204.5 153.2 146.1 192.6
1. Beverage and Tobacco 127.8 138.2 147.6 159.8 139.9 116.5 196.6
2. Crude materials, inedible except fuels 40.8 45.1 379.7 513.7 277.9 577.9 699.4
3. Minerals, fuel, lubricants and related materials (net export u.p.a.) 6,927.9 10,748.2 8,834.0 13,039.9 6,987.4 6,868.5 8,311.6
4. Animal and vegetable oils and fats 7.9 2.4 2.3 1.7 2.6 1.9 2.5
5. Chemicals 1,911.3 2,053.4 2,582.7 3,415.5 879.8 2,426.8 4,255.1
6. Manufactured goods classified chiefly by material 475.3 661.1 683.9 844.8 428.9 660.9 982.6
7. Machinery and transport equipment 240.4 150.1 294.1 358.3 263.7 355.9 200.0
8. Miscellaneous manufactured articles 82.6 79.7 79.1 82.0 70.2 64.3 71.5
9. Miscellaneous transactions and commodities n.e.s. 0.3 0.4 0.5 0.4 0.4 0.5 1.2
TOTAL EXPORTS 9,981.7 14,064.6 13,197.7 18,620.7 9,204.0 11,219.3 14,913.1
Source: The Central Statistical Office of Trinidad and Tobago.
1. In keeping with international standards issued by the International Monetary Fund (IMF), Stores and Bunkers are now included in Total Exports.

BALANCE OF PAYMENTS REPORT 2011 Page 41
APPENDIX 3DIRECTION OF TRADE
ADJUSTED IMPORTS (C.I.F.) 2005-2011/US -$Mn/
AREAS 2005r 2006r 2007r 2008r 2009r 2010r 2011
(1) (2) (3) (4) (5) (6) (7)
A. United States of America 1,645.0 1,772.8 1,914.8 2,285.7 2,152.1 1,800.0 2,530.8
B. Commonwealth Non-Caribbean Countries 531.9 688.1 811.1 700.1 459.4 561.2 836.6
1. Australia 9.7 15.7 18.1 16.4 15.7 112.4 24.8 2. New Zealand 23.4 18.4 30.0 42.7 28.6 37.5 47.9 3. Canada 123.1 144.9 314.5 261.5 149.5 184.8 322.1 4. India 37.0 51.0 47.2 60.6 144.5 137.1 64.4 5. Other*1 338.7 458.1 401.3 318.8 121.2 89.5 377.4
C. Caricom Countries 111.8 97.3 121.0 123.4 111.1 125.0 241.5
1. Jamaica 14.9 17.5 15.9 16.0 22.1 10.9 17.0 2. Guyana 22.0 18.7 25.5 31.6 25.9 25.3 31.0 3. Barbados 28.7 32.5 44.5 36.5 30.1 38.2 51.0 4. Belize 10.4 6.9 8.9 9.1 7.1 11.2 11.7 5. Other*2 35.8 21.6 26.2 30.1 25.8 39.4 130.9
D. Other Commonwealth Caribbean Countries*3 0.2 3.6 1.5 1.7 0.5 0.3 0.4
E. Non-Commonwealth Caribbean Countries*4 91.9 68.9 49.9 75.2 35.4 43.1 104.5
F. European Union 27*5 669.9 681.4 901.9 1,234.6 793.3 587.2 675.2
G. European Free Trade Association*6 28.9 25.4 25.9 36.7 28.7 30.0 36.4
H. Latin American Free Trade 1,599.4 1,717.5 1,967.6 2,452.9 1,323.8 1,275.1 1,906.5
1. Venezuela 345.5 279.3 299.5 231.1 65.5 12.4 11.2 2. Brazil 775.5 903.9 815.6 1,121.6 352.6 468.5 611.0 3. Other*7 478.5 534.3 852.4 1,100.2 905.8 794.2 1,284.3
I. Central American Common Market*8 27.8 28.3 38.8 41.4 58.4 67.5 67.6
J. Rest of Latin America*9 6.6 11.2 8.6 9.2 8.2 7.4 30.5
K. Rest of the World*10 1,014.1 1,416.0 1,845.3 2,616.0 2,009.1 2,006.6 3,080.7
1. China 169.0 243.6 356.4 488.1 354.2 374.8 442.6
TOTAL ALL COUNTRIES 5,727.6 6,510.6 7,686.5 9,576.7 6,980.2 6,503.5 9,510.9
Source: The Central Statistical Office of Trinidad and Tobago.
NOTE:
*1 - *10 - See Explanatory Notes, Section F.

BALANCE OF PAYMENTS REPORT 2011 Page 42
APPENDIX 4DIRECTION OF TRADE
ADJUSTED EXPORTS (F.O.B.) 2005-2011/US -$Mn/
AREAS 2005r 2006r 2007r 2008r 2009r 2010r 2011
(1) (2) (3) (4) (5) (6) (7)
A. United States of America 5,791.4 7,963.4 7,584.2 8,255.8 4,878.4 5,280.0 7,140.4
B. Commonwealth Non-Caribbean Countries 115.3 239.6 302.0 451.9 275.0 433.8 378.3
1. Australia 2.1 3.5 4.3 22.5 3.5 3.7 5.3 2. New Zealand 0.1 0.2 0.3 0.0 0.0 0.0 0.1 3. Canada 105.9 171.3 146.3 192.6 66.5 189.6 213.6 4. India 2.0 0.6 78.3 84.7 95.3 52.0 50.7 5. Other*1 5.2 64.1 72.9 152.2 109.7 188.5 108.6
C. Caricom Countries 2,099.2 2,472.3 1,819.2 3,393.7 1,451.1 2,085.5 2,100.6
1. Jamaica 721.1 812.8 613.0 1,244.2 478.1 714.7 626.3 2. Guyana 275.8 339.9 240.7 319.0 170.5 269.8 288.0 3. Barbados 417.4 470.4 301.1 546.7 276.2 375.2 390.5 4. Belize 8.0 5.3 8.9 9.0 5.0 14.7 18.3 5. Other*2 676.8 843.9 655.4 1,274.7 336.6 410.3 484.7
D. Other Commonwealth Caribbean Countries*3 184.0 166.4 139.6 146.6 40.9 34.5 35.5
E. Non-Commonwealth Caribbean Countries*4 680.3 823.3 830.3 1,452.5 404.8 549.6 684.7
F. European Union 27*5 281.8 1,408.0 1,310.8 2,455.9 1,291.0 881.6 2,123.5
G. European Free Trade Association*6 0.2 17.5 80.2 21.9 3.2 74.9 6.2
H. Latin American Free Trade 413.8 535.8 624.9 1,225.0 411.7 917.5 1,588.5
1. Venezuela 30.7 14.3 13.8 22.5 7.3 40.5 139.7 2. Brazil 73.3 94.7 88.9 157.0 38.4 219.4 295.5 3. Other*7 309.9 426.8 522.2 1,045.5 366.1 657.7 1,153.4
I. Central American Common Market*8 169.0 85.8 159.8 213.3 89.1 181.7 139.7
J. Rest of Latin America*9 26.0 72.6 98.1 195.1 50.4 161.7 55.2
K. Rest of the World*10 124.1 136.9 188.1 544.4 270.4 517.8 578.9
1. China 3.8 7.3 22.3 12.3 51.2 33.4 79.2
Total All Countries 9,885.1 13,921.6 13,137.1 18,356.0 9,166.2 11,118.6 14,831.7
Stores/Bunkers for Ships & Aircraft 110.4 163.9 78.1 291.1 55.2 120.3 112.2
GRAND TOTAL 9,995.5 14,085.5 13,215.2 18,647.1 9,221.4 11,238.9 14,943.9
Source: The Central Statistical Office of Trinidad and Tobago.
NOTE:
*1 - *10 - See Explanatory Notes, Section F.

BALANCE OF PAYMENTS REPORT 2011 Page 43
APPENDIX 5IMPORTS BY SECTIONS AND MAJOR TRADING PARTNERS, 2005-2011
/US -$Mn/
CATEGORIES 2005r 2006r 2007r 2008r 2009r 2010r 2011
UNITED STATES OF AMERICA
0. Food and Live Animals 188.8 174.2 226.7 308.0 272.1 260.6 300.9
1. Beverages and Tobacco 6.0 6.7 6.8 8.4 10.2 11.0 13.7
2. Crude Materials inedible except fuels 40.1 27.6 39.0 48.8 40.0 35.7 36.7
3. Minerals, fuel, lubricants & related materials 31.0 31.8 57.9 37.0 46.5 82.7 214.2
4. Animal and vegetable oils and fats 6.0 7.3 9.2 16.6 13.6 16.0 19.6
5. Chemicals 199.5 219.2 253.3 302.3 255.6 253.5 299.2
6. Manufactured goods classified by materials 251.0 273.6 303.3 465.0 323.2 254.8 260.7
7. Machinery and transport equipment 780.1 882.8 821.6 883.2 1,014.3 731.6 1,213.3
8. Miscellaneous manufactured articles 137.4 145.8 182.4 212.1 171.6 151.5 169.0
9. Miscellaneous transactions and commodities 3.3 3.8 4.4 4.6 5.0 2.8 3.5
TOTAL ALL SECTIONS 1,643.2 1,772.8 1,904.6 2,286.0 2,152.1 1,800.0 2,530.8
COMMONWEALTH CARIBBEAN COUNTRIES
0. Food and Live Animals 40.6 34.0 42.9 50.7 42.5 52.7 59.0
1. Beverages and Tobacco 7.7 4.1 3.7 5.5 7.0 6.5 9.0
2. Crude Materials inedible except fuels 16.6 7.2 9.8 12.3 5.3 4.3 3.8
3. Minerals, fuel, lubricants & related materials 20.2 25.3 28.2 23.4 16.1 22.2 34.2
4. Animal and vegetable oils and fats 0.6 0.5 0.7 0.7 0.5 0.1 0.3
5. Chemicals 13.0 14.8 21.8 14.2 14.1 13.7 16.9
6. Manufactured goods classified by materials 9.0 7.9 8.7 12.2 18.2 8.1 9.6
7. Machinery and transport equipment 0.6 3.1 1.9 2.3 2.7 13.2 104.6
8. Miscellaneous manufactured articles 3.3 3.8 4.4 3.5 4.4 4.0 3.7
9. Miscellaneous transactions and commodities 0.2 0.3 0.3 0.2 0.3 0.1 0.4
TOTAL ALL SECTIONS 111.8 101.0 122.4 125.0 111.1 125.0 241.5
UNITED KINGDOM
0. Food and Live Animals 10.7 9.1 11.9 14.7 16.4 11.4 14.2
1. Beverages and Tobacco 12.1 10.2 8.0 11.0 9.1 10.9 11.2
2. Crude Materials inedible except fuels 0.8 0.6 1.0 1.0 6.0 0.5 0.6
3. Minerals, fuel, lubricants & related materials 46.0 0.2 0.2 0.6 29.7 0.5 0.5
4. Animal and vegetable oils and fats 0.0 0.1 0.1 0.0 0.1 0.0 0.0
5. Chemicals 30.2 26.9 33.1 53.0 33.1 38.0 28.0
6. Manufactured goods classified by materials 24.4 25.1 50.4 36.6 20.0 18.4 24.3
7. Machinery and transport equipment 74.5 70.9 80.4 74.2 53.7 42.0 47.4
8. Miscellaneous manufactured articles 26.6 26.5 27.2 26.4 23.3 15.2 16.3
9. Miscellaneous transactions and commodities 0.7 0.7 0.8 0.8 0.9 0.5 0.6
TOTAL ALL SECTIONS 226.0 170.3 213.1 218.3 192.2 137.5 143.2
Source: The Central Statistical Office of Trinidad and Tobago.

BALANCE OF PAYMENTS REPORT 2011 Page 44
APPENDIX 5 (CONT’D)IMPORTS BY SECTIONS AND MAJOR TRADING PARTNERS, 2005-2011
/US -$Mn/
CATEGORIES 2005 20056 2007 2008 2009 2010 2011
CHINA
0. Food and Live Animals 3.8 4.9 4.7 5.6 5.8 11.4 11.6
1. Beverages and Tobacco 2.2 3.0 3.6 3.6 4.1 3.6 4.1
2. Crude Materials inedible except fuels 2.5 1.2 1.2 2.3 1.7 1.5 2.0
3. Minerals, fuel, lubricants & related materials 0.2 0.2 0.4 0.5 0.5 0.6 1.1
4. Animal and vegetable oils and fats 0.0 0.0 0.1 0.2 0.1 0.1 0.2
5. Chemicals 9.4 27.8 17.7 21.7 15.5 15.4 19.9
6. Manufactured goods classified by materials 54.9 76.4 151.3 243.7 125.3 130.8 155.7
7. Machinery and transport equipment 38.3 51.9 91.5 112.0 117.1 125.9 149.9
8. Miscellaneous manufactured articles 57.6 78.1 85.4 98.5 84.2 85.6 98.1
9. Miscellaneous transactions and commodities 0.0 0.1 0.4 0.0 0.1 0.1 0.0
TOTAL ALL SECTIONS 168.9 243.6 356.3 488.1 354.2 374.8 442.6
INDIA
0. Food and Live Animals 4.3 4.1 3.5 5.6 3.9 4.9 8.0
1. Beverages and Tobacco 0.0 0.0 0.0 0.0 0.3 1.5 2.6
2. Crude Materials inedible except fuels 2.5 0.3 3.3 0.2 0.2 0.3 0.3
3. Minerals, fuel, lubricants & related materials 0.0 0.0 0.0 0.2 0.0 82.3 0.4
4. Animal and vegetable oils and fats 0.0 0.0 0.0 0.0 0.0 0.0 0.0
5. Chemicals 8.1 13.3 11.3 14.4 11.7 9.8 15.3
6. Manufactured goods classified by materials 14.9 22.7 21.1 26.6 118.3 31.9 27.4
7. Machinery and transport equipment 3.3 5.7 3.8 9.1 5.2 2.2 4.9
8. Miscellaneous manufactured articles 3.9 4.8 4.0 4.2 4.7 4.1 5.4
9. Miscellaneous transactions and commodities 0.0 0.0 0.0 0.3 0.0 0.0 0.1
TOTAL ALL SECTIONS 37.0 50.9 47.0 60.6 144.5 137.1 64.4
BRAZIL
0. Food and Live Animals 18.2 14.9 24.1 33.3 28.5 20.7 23.2
1. Beverages and Tobacco 3.1 1.3 1.0 3.8 6.5 4.3 4.4
2. Crude Materials inedible except fuels 170.9 223.6 372.3 315.2 112.1 181.0 304.0
3. Minerals, fuel, lubricants & related materials 425.5 465.6 207.0 482.4 73.9 184.8 157.8
4. Animal and vegetable oils and fats 1.6 2.3 3.2 5.0 2.2 1.6 3.7
5. Chemicals 25.7 68.0 76.9 167.7 56.8 11.8 50.2
6. Manufactured goods classified by materials 83.0 80.7 82.9 87.5 49.8 50.6 50.8
7. Machinery and transport equipment 40.3 42.5 42.3 20.1 18.6 8.6 13.8
8. Miscellaneous manufactured articles 6.7 5.0 5.8 6.5 4.3 5.0 3.2
9. Miscellaneous transactions and commodities 0.3 0.0 0.0 0.0 0.1 0.1 0.0
TOTAL ALL SECTIONS 775.3 903.9 815.5 1,121.5 352.6 468.5 611.0
Source: The Central Statistical Office of Trinidad and Tobago.

BALANCE OF PAYMENTS REPORT 2011 Page 45
APPENDIX 6EXPORTS BY SECTIONS AND MAJOR TRADING PARTNERS, 2005-2011
/US -$Mn/
CATEGORIES 2006r 2006r 2007r 2008r 2009r 2010 2011
UNITED STATES OF AMERICA
0. Food and Live Animals 9.6 11.1 12.7 12.2 10.6 9.6 12.1
1. Beverages and Tobacco 14.7 10.4 11.5 11.5 10.5 10.2 15.0
2. Crude Materials inedible except fuels 24.6 21.6 347.7 454.3 231.7 519.0 624.5
3. Minerals, fuel, lubricants & related materials 4,044.1 6,296.8 5,291.4 5,052.0 3,913.0 2,899.7 3,305.4
4. Animal and vegetable oils and fats 0.0 0.0 0.0 0.0 0.0 0.0 0.0
5. Chemicals 1,543.3 1,434.4 1,665.6 2,365.6 500.3 1,716.7 2,932.5
6. Manufactured goods classified by materials 97.7 122.6 96.9 97.0 14.6 31.8 121.1
7. Machinery and transport equipment 44.4 56.4 149.1 244.8 185.4 84.7 117.2
8. Miscellaneous manufactured articles 9.0 11.1 10.2 13.4 12.2 8.2 12.4
9. Miscellaneous transactions and commodities 0.0 0.1 0.1 0.1 0.1 0.1 0.2
TOTAL ALL SECTIONS 5,787.4 7,964.5 7,585.2 8,250.9 4,878.3 5,280.0 7,140.4
COMMONWEALTH CARIBBEAN COUNTRIES
0. Food and Live Animals 116.0 131.3 144.9 168.3 123.8 117.5 156.6
1. Beverages and Tobacco 87.2 100.0 100.6 118.8 98.5 80.4 129.5
2. Crude Materials inedible except fuels 4.7 3.9 3.1 7.3 4.8 4.0 8.0
3. Minerals, fuel, lubricants & related materials 1,759.9 2,070.3 1,319.9 2,852.8 943.8 1,655.0 1,504.9
4. Animal and vegetable oils and fats 7.2 2.0 1.5 1.6 2.5 1.9 2.1
5. Chemicals 62.8 67.1 87.1 88.1 65.2 61.4 74.9
6. Manufactured goods classified by materials 153.4 168.3 188.2 202.9 145.3 103.2 143.5
7. Machinery and transport equipment 32.1 35.7 52.9 39.8 18.8 20.6 30.0
8. Miscellaneous manufactured articles 58.2 60.4 60.6 58.3 48.2 41.5 50.9
9. Miscellaneous transactions and commodities 0.0 0.0 0.1 0.1 0.0 0.1 0.2
TOTAL ALL SECTIONS 2,281.5 2,639.0 1,958.9 3,538.0 1,451.1 2,085.5 2,100.6
UNITED KINGDOM
0. Food and Live Animals 25.7 23.2 17.1 0.3 0.1 0.2 0.3
1. Beverages and Tobacco 3.0 2.3 4.5 3.0 2.5 4.5 21.3
2. Crude Materials inedible except fuels 0.4 0.4 0.3 0.8 0.1 0.2 0.4
3. Minerals, fuel, lubricants & related materials 3.9 0.0 51.1 202.4 348.2 181.8 219.3
4. Animal and vegetable oils and fats 0.0 0.0 0.0 0.0 0.0 0.0 0.0
5. Chemicals 34.7 82.5 124.6 117.0 38.4 31.9 99.1
6. Manufactured goods classified by materials 0.3 0.6 0.6 4.0 2.6 0.8 3.5
7. Machinery and transport equipment 5.1 3.1 13.7 5.0 12.6 2.1 4.9
8. Miscellaneous manufactured articles 0.5 0.6 2.1 2.0 2.1 1.9 1.0
9. Miscellaneous transactions and commodities 0.0 0.0 0.0 0.0 0.0 0.1 0.0
TOTAL ALL SECTIONS 73.6 112.7 214.0 334.5 406.7 223.3 349.7
Source: The Central Statistical Office of Trinidad and Tobago.

BALANCE OF PAYMENTS REPORT 2011 Page 46
APPENDIX 6 (CONT’D)EXPORTS BY SECTIONS AND MAJOR TRADING PARTNERS, 2005-2011
/US -$Mn/
CATEGORIES 2005 2006 2007 2008 2009 20010 2011
CHINA
0. Food and Live Animals 0.0 0.0 0.0 0.0 0.0 0.0 0.0
1. Beverages and Tobacco 0.0 0.0 0.0 0.0 0.1 0.0 0.0
2. Crude Materials inedible except fuels 2.4 4.8 10.7 9.2 18.4 14.5 27.7
3. Minerals, fuel, lubricants & related materials 0.0 0.0 0.0 0.0 19.4 8.6 46.3
4. Animal and vegetable oils and fats 0.0 0.0 0.0 0.0 0.0 0.0 0.0
5. Chemicals 0.0 0.0 7.6 0.0 11.6 9.2 0.3
6. Manufactured goods classified by materials 0.7 0.9 1.8 1.1 0.4 0.7 4.5
7. Machinery and transport equipment 0.6 1.5 2.2 1.8 1.0 0.3 0.2
8. Miscellaneous manufactured articles 0.0 0.0 0.0 0.1 0.3 0.0 0.1
9. Miscellaneous transactions and commodities 0.0 0.0 0.0 0.0 0.0 0.0 0.0
TOTAL ALL SECTIONS 3.7 7.2 22.3 12.2 51.2 33.4 79.2
INDIA
0. Food and Live Animals 0.0 0.0 0.0 0.1 0.0 0.0 0.0
1. Beverages and Tobacco 0.0 0.0 0.0 0.0 0.0 0.1 0.0
2. Crude Materials inedible except fuels 0.6 0.1 1.2 6.0 1.9 2.4 3.6
3. Minerals, fuel, lubricants & related materials 0.0 0.0 75.4 78.0 86.6 48.9 46.4
4. Animal and vegetable oils and fats 0.0 0.0 0.0 0.0 0.0 0.0 0.0
5. Chemicals 0.0 0.0 0.0 0.0 5.3 0.0 0.0
6. Manufactured goods classified by materials 1.4 0.4 1.5 0.3 1.3 0.5 0.5
7. Machinery and transport equipment 0.0 0.0 0.1 0.1 0.0 0.0 0.1
8. Miscellaneous manufactured articles 0.0 0.0 0.0 0.0 0.0 0.0 0.2
9. Miscellaneous transactions and commodities 0.0 0.0 0.0 0.0 0.0 0.0 0.0
TOTAL ALL SECTIONS 2.0 0.5 78.2 84.5 95.3 52.0 50.7
BRAZIL
0. Food and Live Animals 0.0 0.0 0.0 0.0 0.0 0.0 0.7
1. Beverages and Tobacco 0.0 0.0 0.0 0.0 0.2 0.0 0.0
2. Crude Materials inedible except fuels 0.0 0.0 0.1 0.0 0.1 5.7 0.1
3. Minerals, fuel, lubricants & related materials 0.0 0.0 0.0 0.0 16.7 65.7 115.3
4. Animal and vegetable oils and fats 0.0 0.0 0.0 0.0 0.0 0.0 0.0
5. Chemicals 63.0 64.0 85.5 94.3 5.4 115.7 110.1
6. Manufactured goods classified by materials 6.6 30.1 0.8 50.8 10.8 29.7 64.8
7. Machinery and transport equipment 3.6 0.4 2.1 10.8 4.7 1.9 3.7
8. Miscellaneous manufactured articles 0.0 0.1 0.2 0.8 0.5 0.7 0.6
9. Miscellaneous transactions and commodities 0.0 0.0 0.0 0.0 0.0 0.0 0.0
TOTAL ALL SECTIONS 73.2 94.6 88.7 156.7 38.4 219.3 295.5
Source: The Central Statistical Office of Trinidad and Tobago.

BALANCE OF PAYMENTS REPORT 2011 Page 47
APPENDIX 7EXTENDED BALANCE OF PAYMENTS CLASSIFICATION, 2011
/US -$Mn/
COMPONENT2011
Credit Debit
TOTAL SERVICES 1,205.0 1,705.8
1. Manufacturing Services on Physical Inputs Owned by Others 96.9 0.01.1 In compiling economy 96.9 0.0 1.1.1 Processing of crude oil 96.9 0.0 1.1.2 Assembling of garments 0.0 0.0 1.1.3 Assembling of electronic parts 0.0 0.0 1.1.4 Labelling and packaging of goods for reexport 0.0 0.0 1.2 On inputs sent abroad 0.0 0.0 1.2.1 Processing of oil 0.0 0.0 1.2.2 Assembling of garments 0.0 0.0 1.2.3 Assembling of electronic parts 0.0 0.0 1.2.4 Labelling and packaging of goods for reimport 0.0 0.0
2. Maintenance and Repair Services (n.i.e) 0.0 0.0
3. Transport 264.1 139.23.1 Sea Transport 63.4 97.0 3.1.1 Passenger 0.0 0.0 3.1.2 Freight 55.3 0.0 3.1.3 Other 8.1 97.03.2 Air Transport 200.7 42.2 3.2.1 Passenger 178.3 42.1 3.2.2 Freight 14.9 0.1 3.2.3 Other 7.5 0.03.3 Other Transport 0.0 0.0 3.3.1 Passenger 0.0 0.0 3.3.2 Freight 0.0 0.0 3.3.3 Other 0.0 0.0 3.4 Other supporting auxiliary transport services 0.0 0.0 3.5 Postal and Courier services 0.0 0.0
4. Travel 471.6 149.94.1 Business travel 218.7 0.3 4.1.1 Expenditure by seasonal and border workers 0.0 0.0 4.1.2 Other 218.7 0.34.2 Personal travel 252.9 149.6 4.2.1 Health-related expenditure 0.0 6.8 4.2.2 Education-related expenditure 20.1 5.6 4.2.3 Other 232.7 137.2
5. Construction 5.9 58.65.1 Construction abroad 0.0 0.05.2 Construction in the reporting economy 5.9 58.6
6. Insurances and Pension Services 110.9 253.76.1 Direct insurance 110.9 253.7 6.1.1 Life 0.0 0.0 6.1.2 Freight 0.0 0.0 6.1.3 Other 110.9 253.76.2 Reinsurance 0.0 0.06.3 Auxiliary Insurance services 0.0 0.06.4 Pension and standardised guarantee services 0.0 0.0
7. Financial Services 2.7 8.17.1 Explicitly charged and other financial services 2.7 8.17.2 Financial intermediation services indirectly measured (FISIM) 0.0 0.0
8. Charges for Use of Intellectual Property 0.4 60.18.1 Franchises and trademarks licensing fees 0.4 60.18.2 Licences for the use of outcomes of research and development 0.0 0.08.3 Licences to reproduce and/or distribute computer software 0.0 0.08.4 Licences to reproduce and or distribute audio visual and related products 0.0 0.0 8.4.1 Licences to reproduce and/or distribute audio visual products 0.0 0.0 8.4.2 Licences to reproduce and/or distribute other products 0.0 0.0
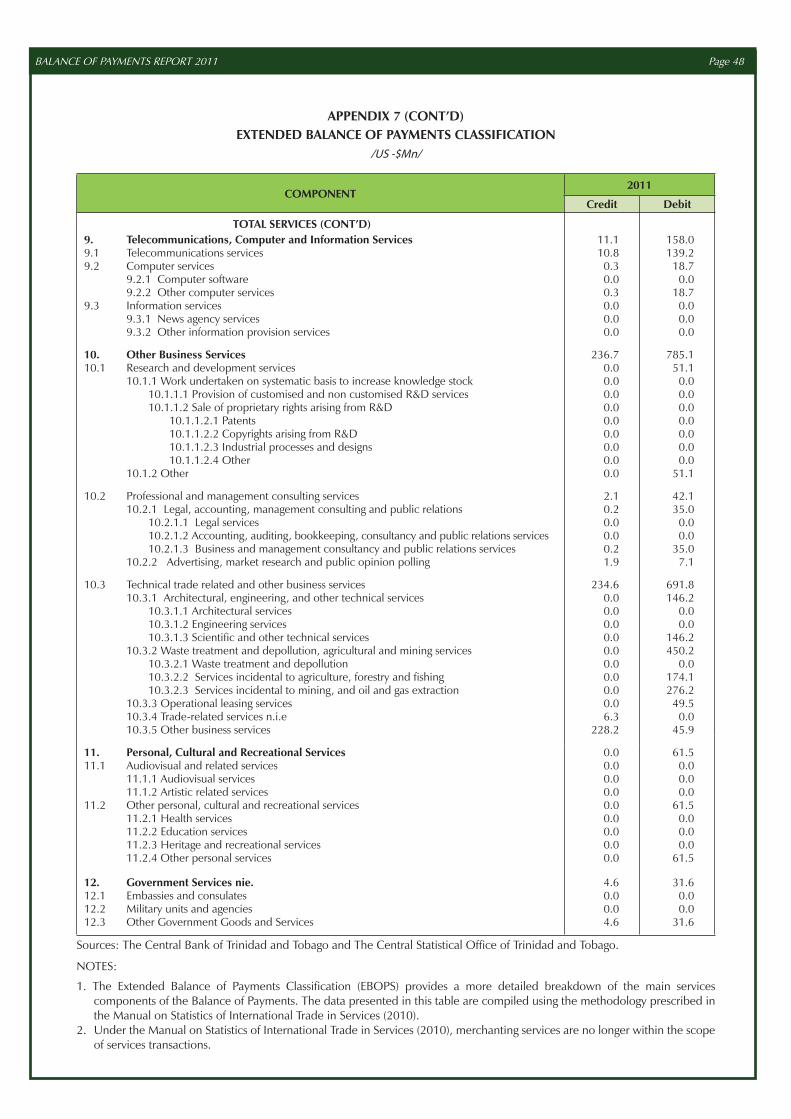
BALANCE OF PAYMENTS REPORT 2011 Page 48
APPENDIX 7 (CONT’D)EXTENDED BALANCE OF PAYMENTS CLASSIFICATION
/US -$Mn/
COMPONENT2011
Credit Debit
TOTAL SERVICES (CONT’D)9. Telecommunications, Computer and Information Services 11.1 158.09.1 Telecommunications services 10.8 139.29.2 Computer services 0.3 18.7 9.2.1 Computer software 0.0 0.0 9.2.2 Other computer services 0.3 18.79.3 Information services 0.0 0.0 9.3.1 News agency services 0.0 0.0 9.3.2 Other information provision services 0.0 0.0
10. Other Business Services 236.7 785.110.1 Research and development services 0.0 51.1 10.1.1 Work undertaken on systematic basis to increase knowledge stock 0.0 0.0 10.1.1.1 Provision of customised and non customised R&D services 0.0 0.0 10.1.1.2 Sale of proprietary rights arising from R&D 0.0 0.0 10.1.1.2.1 Patents 0.0 0.0 10.1.1.2.2 Copyrights arising from R&D 0.0 0.0 10.1.1.2.3 Industrial processes and designs 0.0 0.0 10.1.1.2.4 Other 0.0 0.0 10.1.2 Other 0.0 51.1
10.2 Professional and management consulting services 2.1 42.1 10.2.1 Legal, accounting, management consulting and public relations 0.2 35.0 10.2.1.1 Legal services 0.0 0.0 10.2.1.2 Accounting, auditing, bookkeeping, consultancy and public relations services 0.0 0.0 10.2.1.3 Business and management consultancy and public relations services 0.2 35.0 10.2.2 Advertising, market research and public opinion polling 1.9 7.1
10.3 Technical trade related and other business services 234.6 691.8 10.3.1 Architectural, engineering, and other technical services 0.0 146.2 10.3.1.1 Architectural services 0.0 0.0 10.3.1.2 Engineering services 0.0 0.0 10.3.1.3 Scientific and other technical services 0.0 146.2 10.3.2 Waste treatment and depollution, agricultural and mining services 0.0 450.2 10.3.2.1 Waste treatment and depollution 0.0 0.0 10.3.2.2 Services incidental to agriculture, forestry and fishing 0.0 174.1 10.3.2.3 Services incidental to mining, and oil and gas extraction 0.0 276.2 10.3.3 Operational leasing services 0.0 49.5 10.3.4 Trade-related services n.i.e 6.3 0.0 10.3.5 Other business services 228.2 45.9
11. Personal, Cultural and Recreational Services 0.0 61.511.1 Audiovisual and related services 0.0 0.0 11.1.1 Audiovisual services 0.0 0.0 11.1.2 Artistic related services 0.0 0.011.2 Other personal, cultural and recreational services 0.0 61.5 11.2.1 Health services 0.0 0.0 11.2.2 Education services 0.0 0.0 11.2.3 Heritage and recreational services 0.0 0.0 11.2.4 Other personal services 0.0 61.5
12. Government Services nie. 4.6 31.612.1 Embassies and consulates 0.0 0.012.2 Military units and agencies 0.0 0.012.3 Other Government Goods and Services 4.6 31.6
Sources: The Central Bank of Trinidad and Tobago and The Central Statistical Office of Trinidad and Tobago.
NOTES:
1. The Extended Balance of Payments Classification (EBOPS) provides a more detailed breakdown of the main services components of the Balance of Payments. The data presented in this table are compiled using the methodology prescribed in the Manual on Statistics of International Trade in Services (2010).
2. Under the Manual on Statistics of International Trade in Services (2010), merchanting services are no longer within the scope of services transactions.

BALANCE OF PAYMENTS REPORT 2011 Page 49
APPENDIX 8INTERNATIONAL INVESTMENT POSITION: EXTERNAL ASSETS AND LIABILITIES
AT END OF PERIOD, 2011/US -$Mn/
COMPONENT 2011
INTERNATIONAL INVESTMENT POSITION, NET 6,115.1
ASSETS 22,148.2
1. Direct Investment Abroad 534.91.1 Equity capital and reinvested earnings 298.5 1.1.1 Claims on affiliated enterprises 298.5 Of which: Banks and non-banks 208.6 Of which: Insurance companies 83.4 Of which: Private non-financial corporations 6.6 1.1.2 Liabilities to affiliated enterprises (-) 0.01.2 Other capital 236.5 1.2.1 Claims on affiliated enterprises 236.5 Of which: Banks and non-banks 112.6 Of which: Insurance companies 58.2 Of which: Private non-financial corporations 65.6 1.2.2 Liabilities to affiliated enterprises (-) 0.0
2. Portfolio Investment 5,508.3
2.1 Equity securities 1,661.6 2.1.1 Monetary authorities 23.3 2.1.2 General government 0.0 2.1.3 Banks 27.2 2.1.4 Other sectors 1,611.2 Of which: Insurance companies 66.1 Of which: Pension funds 0.0 Of which: Mutual funds 0.0 Of which: Heritage and Stabilization Fund 1,431.6 Of which: Private non-financial corporations 113.42.2 Debt securities 3,846.6 2.2.1 Bonds and notes 3,408.6
2.2.1.1 Monetary authorities 0.02.2.1.2 General government 0.0 2.2.1.3 Banks 356.8 2.2.1.4 Other sectors 3,051.8
Of which: Insurance companies 267.3Of which: Pension funds 0.0Of which: Mutual funds 0.0Of which: Heritage and Stabilization Fund 2,677.4Of which: Private non-financial corporations 107.2
2.2.2 Money-market instruments 438.0 2.2.2.1 Monetary authorities 0.0 2.2.2.2 General government 0.0 2.2.2.3 Banks 402.6 2.2.2.4 Other sectors 35.4
Of which: Insurance companies 15.5Of which: Pension funds 0.0Of which: Mutual funds 0.0Of which: Heritage and Stabilization Fund 0.0Of which: Private non-financial corporations 19.8
3. Financial Derivatives 2.3
3.1 Monetary authorities 0.03.2 General government 0.03.3 Banks 0.03.4 Other sectors 2.3 Of which: Heritage and Stabilization Fund 2.3

BALANCE OF PAYMENTS REPORT 2011 Page 50
APPENDIX 8 (CONT’D)INTERNATIONAL INVESTMENT POSITION: EXTERNAL ASSETS AND LIABILITIES
AT END OF PERIOD, 2011/US -$Mn/
2011
ASSETS (CONT’D)4. Other Investment 5,843.94.1 Trade credits 697.6 4.1.1 General government 0.0
4.1.1.1 Long-term 0.0 4.1.1.2 Short-term 0.0 4.1.2 Other sectors 697.6 4.1.2.1 Long-term 11.6 4.1.2.2 Short-term 686.14.2 Loans 677.4 4.2.1 Monetary authorities 0.0 4.2.1.1 Long-term 0.0 4.2.1.2 Short-term 0.0 4.2.2 General government 0.0 4.2.2.1 Long-term 0.0 4.2.2.2 Short-term 0.0 4.2.3 Banks 457.6 4.2.3.1 Long-term 452.6 4.2.3.2 Short-term 4.9 4.2.4 Other sectors 219.8 4.2.4.1 Long-term 3.5 Of which: Insurance companies 0.5 Of which: Pension funds 0.0 Of which: Private non-financial corporations 3.0 4.2.4.2 Short-term 216.3 Of which: Insurance companies 0.0 Of which: Pension funds 0.0 Of which: Private non-financial corporations 216.34.3 Currency and deposits 3,035.0 4.3.1 Monetary authorities 0.4 4.3.2 General government 0.0 4.3.3 Banks 980.3 4.3.4 Other sectors 2,054.4 Of which: Insurance companies 39.4 Of which: Pension funds 0.0 Of which: Heritage and Stabilization Fund 148.5 Of which: Private non-financial corporations 1,866.54.4 Other assets 1,433.8 4.4.1Monetary authorities 957.5 4.4.1.1 Long-term 0.0 4.4.1.2 Short-term 957.5 4.4.2 General government 0.0 4.4.2.1 Long-term 0.0 4.4.2.2 Short-term 0.0 4.4.3 Banks 62.1 4.4.3.1 Long-term 0.0 4.4.3.2 Short-term 62.1 4.4.4 Other sectors 414.3 4.4.4.1 Long-term 0.0 4.4.4.2 Short-term 414.3 Of which: Insurance companies 85.7 Of which: Pension funds 0.0 Of which: Heritage and Stabilization Fund 328.6Reserve Assets 10,258.85.1 Monetary gold 96.85.2 Special drawing rights 424.25.3 Reserve position in the Fund 160.65.4 Foreign exchange 9,577.1 5.4.1 Currency and deposits 4,880.6 5.4.1.1 With monetary authorities 4,880.6 5.4.1.2 With banks 0.0 5.4.2 Securities 4,696.5 5.4.2.1 Equities 0.0 5.4.2.2 Bonds and notes 4,696.5 5.4.2.3 Money-market instruments 0.0 5.4.2.4 Financial derivatives ,net 0.0 5.4.3 Other claims 0.0

BALANCE OF PAYMENTS REPORT 2011 Page 51
APPENDIX 8 (CONT’D)INTERNATIONAL INVESTMENT POSITION: EXTERNAL ASSETS AND LIABILITIES
AT END OF PERIOD, 2011/US -$Mn/
2011
LIABILITIES 16,033.1
6. Direct Investment In Reporting Economy 3,670.16.1 Equity capital and reinvested earnings 2,071.9 6.1.1 Claims on direct investors (-) 0.0 6.1.2 Liabilities to direct investors 2,071.9 Of which: Banks and non-banks 591.9 Of which: Insurance companies 0.0 Of which: Private non-financial corporations 1,480.06.2 Other capital 1,598.2 6.2.1 Claims on direct investors (-) 0.0 6.2.2 Liabilities to direct investors 1,598.2 Of which: Banks and non-banks 103.3 Of which: Insurance companies 0.2 Of which: Private non-financial corporations 1,494.7 7. Portfolio Investment 4,509.87.1 Equity securities 2.6 7.1.1 Banks 0.0 7.1.2 Other sectors 2.6 Of which: Insurance companies 0.0 Of which: Private non-financial corporations 2.67.2 Debt securities 4,507.2 7.2.1 Bonds and notes 3,006.2 7.2.1.1 Monetary authorities 0.0 7.2.1.2 General government 594.6 7.2.1.3 Banks 287.6 7.2.1.4 Other sectors 2,123.9 Of which: Insurance companies 0.3 Of which: Private non-financial corporations 2,123.7 7.2.2 Money-market instruments 1,501.1 7.2.2.1 Monetary authorities 0.0 7.2.2.2 General government 0 7.2.2.3 Banks 5.0 7.2.2.4 Other sectors 1,496.0 Of which: Insurance companies 0.0 Of which: Private non-financial corporations 1,496.0
8. Financial Derivatives 0.0
8.1 Monetary authorities 0.08.2 General government 0.08.3 Banks 0.08.4 Other sectors 0.0
9. Other Investment 7,853.19.1 Trade credits 541.9 9.1.1 General government 0.0 9.1.1.1 Long-term 0.0 9.1.1.2 Short-term 0.0 9.1.2 Other sectors 541.9 9.1.2.1 Long-term 30.6 9.1.2.2 Short-term 511.29.2 Loans 5,091.5 9.2.1 Monetary authorities 0.3 9.2.1.1 Use of Fund credit & loans from the Fund 0.0 9.2.1.2 Other long-term 0.0 9.2.1.3 Short-term 0.3

BALANCE OF PAYMENTS REPORT 2011 Page 52
APPENDIX 8 (CONT’D)INTERNATIONAL INVESTMENT POSITION: EXTERNAL ASSETS AND LIABILITIES
AT END OF PERIOD, 2011/US -$Mn/
2011
LIABILITIES (CONT’D)
9.2.2 General government 1,546.9 9.2.2.1 Use of Fund credit & loans from the Fund 0.0 9.2.2.2 Other Long-term 1,546.9 9.2.2.3 Short-term 0.0 9.2.3 Banks 693.2 9.2.3.1 Long-term 296.7 9.2.3.2 Short-term 396.5 9.2.4 Other sectors 2,851.2 9.2.4.1 Long-term 2,348.2 Of which: Insurance companies 21.7 Of which: Private non-financial corporations 2,326.5 9.2.4.2 Short-term 503.0 Of which: Insurance companies 0.0 Of which: Private non-financial corporations 503.09.3 Currency and deposits 215.0 9.3.1 Monetary authorities 8.6 9.3.2 General government 0.0 9.3.3 Banks 206.3 9.3.4 Other sectors 0.09.4 Other liabilities 2,004.8 9.4.1 Monetary authorities 1,476.5 9.4.1.1 Long-term 494.3 Of which Allocations of SDRs 494.3 9.4.1.2 Short-term 982.2 9.4.2 General government 0.0 9.4.2.1 Long-term 0.0 Of which Allocations of SDRs 0.0 9.4.2.2 Short-term 0.0 9.4.3 Banks 107.3 9.4.3.1 Long-term 0.0 9.4.3.2 Short-term 107.3 9.4.4 Other sectors 421.0 9.4.4.1 Long-term 399.9 Of which: Insurance companies 0.0 Of which: Heritage and Stabilization Fund 399.9 9.4.4.2 Short-term 21.2 Of which: Insurance companies 21.2
NOTE:
1. 0 denotes data are either zero or not available.

BALANCE OF PAYMENTS REPORT 2011 Page 53
EXPLANATORY NOTES
Definition This Balance of Payments Report has been designed, as far as possible, along the lines recommended by the International Monetary Fund (IMF) in its manuals and other documents. As such the IMF’s concept of Balance of Payments is employed as a base from which springs the whole system appearing in this report.
The IMF, in its Balance of Payments Manual (Fifth Edition - 1993) defines Balance of Payments as “a statistical statement, covering a given period, that is intended to record systematically:
(a) Transactions in goods, services and income between an economy and the rest of the world;
(b) Changes of ownership and other changes in that economy’s monetary gold, special drawing rights, and claims on and liabilities to the rest of the world;
(c) Unrequited transfers and counterpart entries that are needed to balance, in the accounting sense, any entries for the foregoing transactions and changes which are not mutually offsetting.”
Period This report highlights the economic transactions occuring between the residents of Trinidad and Tobago and the rest of the world for the year 2011. For analytical purposes, the time series 2005-2010 has also been presented. The data presented have been recorded on a calendar year basis. However, information emanating from the private sector has in some instances been accepted on a financial year basis, no attempt being made at adjustment.
The Balance of Payments system of accounts covers the economic and financial transactions of residents of Trinidad and Tobago with the rest of the world or non-residents over a given period of time. In this report, a non-resident is generally defined as a person or company whose normal place of residence (or registered office) is outside of Trinidad and Tobago.
Coverage Branches and subsidiaries of foreign-owned enterprises, including foreign-owned commercial banks and insurance companies, are regarded as resident institutions. Therefore, transactions between such institutions and their head offices or parent companies abroad are included as balance of payments transactions. Non-resident institutions include local offices of International institutions such as the United Nations Organization, foreign diplomatic agencies and other similar regional institutions and agencies, as those operated by foreign-owned carriers.
In the case of direct investment transactions, a direct investment enterprise is defined as an enterprise (branch or subsidiary) in which 10 per cent or more of the voting stock is held or controlled by non-residents.
Summary Tables In Table 1A - the summary is presented in the form of a set of double
entry accounts, where both sides of each transaction are recorded, one as a credit and the other as a debit. However, as a result of
BALANCE OF PAYMENTS REPORT 2011 Page 54
different sources of data and inadequate coverage, there will be discrepancies between the two sides of any transaction. In order to deal with this problem, an item “Net Errors and Omissions” is included to maintain balance between the debit and credit sides. In the case of countries like Trinidad and Tobago, with large inflows and outflows of capital emanating primarily from the private sector, this item “Net Errors and Omissions” may also include unidentified flows of private capital. It should be noted that, as an empirical rule of thumb, the methodology considers the “Net Errors and Omissions” as large when it exceeds the equivalent of 5 per cent of the sum of the gross debit and credit entries for merchandise.
Table 1B - the Analytic Summary table has been compiled using one version of the overall balance in which the net foreign position of the commercial banks is included as international reserves. The rationale behind the use of this measure of balance is that the foreign assets held by the commercial banks are subject to the authorities’ direct and effective control. However, from 1993 and onwards the commercial banks are classified as part of private sector capital following the change in the Exchange Rate regime in April 1993.
A. GOODS, SERVICES AND UNREQUITED TRANSFERS
Item A1 - Merchandise Data on exports f.o.b. (credit) and imports c.i.f. (debit), shown in this report, were obtained from a publication of the Central Statistical Office - the Trade Bulletin, which is compiled from the trade documents of the Customs Division. Following the IMF stipulation, the exports of crude petroleum are valued at market prices.
In order to maintain conformity with the IMF’s definition of merchandise transactions for Balance of Payments purposes, certain adjustments have to be made to the trade data. The value of ships’ stores and bunkers is included in total exports whereas it was previously included in Other Transportation.
The second adjustment to be made to the trade data to maintain conformity with the IMF’s definition of merchandise is the deduction of returned exports/imports, of personal baggage and household effects of travellers. The rationale behind this treatment is that no change of ownership has been effected and hence these are not exports/imports per se.
The final adjustment reflects an exception to the change of ownership principle above. Exports and imports of crude petroleum and petroleum products traded under processing agreements are included in goods although no change of ownership has been effected, and only the processing fee accrues to nationals as a service payment. This fee is recorded in Item A7 - Other Services.
Item A2 - Transportation Passenger fares (credit) cover the passenger fares and excess baggage receipts by Trinidad and Tobago (Caribbean Airlines) from non-residents.
Passenger fares (debit) cover the passenger fares and excess baggage payments made by residents to foreign-owned carriers.
Port disbursements (credit) cover all port and cargo receipts from non-resident carriers excluding stores and bunkers which are included in merchandise.

BALANCE OF PAYMENTS REPORT 2011 Page 55
Item A3 – Travel Port disbursements (debit) cover all operating expenditure outside of Trinidad and Tobago (Caribbean Airlines).
The Credit entries reflect estimated expenditures in Trinidad and Tobago by foreign visitors including students. The estimated expenditure of non-resident travellers are derived from surveys conducted by the travel section of the Central Statistical Office and are applied to the number of departing travellers. The number of foreign students enrolled at University of the West Indies and other colleges is applied to their estimated expenditure obtained from the respective schools. Advances to crew which were previously taken into account in “Other Transportation” are now classified as “Travel”.
Item A4 – Communication This item includes Trinidad and Tobago’s receipts and payments for international communications services. Estimates are based on surveys of the main providers.
Item A5 – Insurance Included here are entries for merchandise and non-merchandise insurance.
Item A6 – Other Government According to IMF specifications, this item covers “Other Government” transactions abroad, that is, transactions of the resident and foreign governments and international bodies not included elsewhere. The credit entries record the receipts of residents of Trinidad and Tobago from international institutions and diplomatic agencies, while the debit entries reflect the payments by residents of Trinidad and Tobago to international institutions and diplomatic agencies. In the corresponding detailed table, (Table 6), data on Item 3: Debit “Central Government - diplomatic and other foreign expenditures” are sourced from the Comptroller of Accounts.
Item A7 – Other Services This item, like the aforementioned “Other Government” is a residual category, comprising flows not recorded elsewhere. Item 3: “Oil Processing Fees” on the credit side of Table 7, represents the service income accruing to residents from the processing of crude petroleum imported under the processing agreement.
Item A8 – Investment Income Inflows of investment income have been identified as accruing to the Central Bank, the commercial banks, the Central Government and State Enterprises in the form of interest on investments, deposits and Foreign Currency Account balances held abroad.
Outflows of investment income represent interest accruing to foreigners for loans made to the Central Government, Central Bank, State Enterprises, Commercial Banks, direct investment firms and other private sector enterprises.
Substantial outflows of investment income emanate from direct investment enterprises in the form of repatriated dividends, interests, profits and reinvested earnings. Profits here refer to sums actually remitted, while reinvested earnings refer to sums payable to non-resident shareholders on the basis of their percentage shareholding in the company. Data on actual remittances of dividends, interest and profits are reported by the companies in the Survey of Direct Foreign Investment Enterprises, while reinvested earnings are calculated as the companies’ net profit after tax payable to non-residents less profits and dividends remitted. The methodology
BALANCE OF PAYMENTS REPORT 2011 Page 56
assumes that these retained earnings are remitted abroad only to be reinvested in the company as a capital inflow (Table 5A - Reinvested Earnings).
Item A9 & A10 – Unrequited These tables have been designed to provide a counterpart Transfers Private & Government to flows of goods, services and income provided to or received
from the rest of the world without any quid pro quo, in an effort to conform to the system of double entry bookkeeping. The necessary information has been extracted from, the records of the Postmaster General, the Comptroller of Accounts, Survey of Private Non-profit Institutions, and Survey of International Organizations.
From 1985, the University of the West Indies has not been treated as an International Institution.
B. CAPITAL (EXCLUDING RESERVES AND RELATED ITEMS)
The capital and financial account has been divided into the monetary and non-monetary sectors, each of which has been further disaggregated: the non-monetary sector into the public and private sectors and the monetary sector into the central monetary institutions and other institutions. The monetary sector has been recorded separately, since these transactions play a prominent role in the settlement of international transactions.
Private Sector Item B11 - Direct Investment in Trinidad and Tobago The documentation of capital movements, particularly from
direct investment enterprises, is of great importance to a developing country like Trinidad and Tobago. Note that a direct investment enterprise is defined as an enterprise (branch or subsidiary) in which 10 per cent or more of the voting stock is held or controlled by non-residents.
Item B14 - Other Private Sector Capital These entries cover loan drawdowns and repayments by direct
investment firms, other private capital flows identified from the direct foreign investment survey and the survey of local companies.
Public Sector Item B15 - Official Borrowing Item B15 reflects the international capital transactions of the
Government of Trinidad and Tobago in the form of loan drawdowns and repayments on the external debt, brought to account in the consolidated Fund of the Comptroller of Accounts, Investments Division.
Item B16 - Official Loans The debit entries of this item reflect Trinidad and Tobago’s position,
in keeping with the Caribbean policy of regional co-operation, to extend loans directly to other Caribbean Governments and indirectly to them via loans to International Institutions. On the credit side, the repayments are recorded. These loans are considered as non-reserve assets.
Item B17 - State Enterprises Sector The credit and debit entries are drawings and repayments on external
loans by State Enterprises and Statutory Boards. These items were included in private sector capital but are now shown separately for analytical purposes.

BALANCE OF PAYMENTS REPORT 2011 Page 57
Item B19 - Other Assets The entries record changes in the sinking fund investments
held against external loans and changes in the public sector’s assets as a result of the nationalization of private enterprises.
Item B20 - Other Liabilities The short-term liabilities of the Central Government comprise
increases in liabilities to international institutions mainly in the form of Trinidad and Tobago dollars and issued by the Government in payment of its membership subscriptions. Also included are any short-term debts incurred by the Government as a result of its acquisition of any private sector enterprises.
D. COUNTERPART ITEMS Item D19 - Allocation of Special Drawing Rights The Special Drawing Rights (SDR) Account is a facility established
within the framework of the IMF in the late 1960’s to provide a supplement to existing reserve assets as and when needed. An agreed amount of SDR is issued and allocated to members in proportion to the size of their quotas in the IMF. An allocation is reflected as a credit entry in the capital account of the Balance of Payments while changes in SDR holdings, or the usage of SDR are reflected in the monetary section of the table as changes in the official reserves of the country. On January 1, 1970 Trinidad and Tobago received its first allocation of $14.8 million and its second of $13.48 million on January 1, 1971. In 2009 there was a general SDR allocation on August 28 and a special allocation on September 09, of SDR 248.8 million and SDR 26.1 million, respectively. These allocations were equivalent to US$421.4 million.
E. FINANCING As stated above, the monetary sector, which reflects official
transactions, has been recorded separately, since only these transactions are recognized as accommodating, that is, acting in response to movements in the autonomous transactions. In this report, the reserves of the country include the foreign balances of (a) the Central Monetary Authority - the Central Bank, (b) the Central Government and (c) the Commercial Banks. However, from 1993 the foreign assets of the commercial banks are no longer considered as reserve assets and are therefore reflected in the non-monetary sector. (See Tables 1A and 1B)
1. Change in Reserves The Central Bank performs the functions of (1) custodian of the nation’s reserves and (2) banker of the Government. As such its foreign balances comprise its reserves assets, held in the form of balances and securities, IMF Gold Tranche Position and SDR Holdings. IMF Gold Tranche Position measures the extent to which Trinidad and Tobago may draw on the available gold reserves held by the IMF to finance balance of payments deficits. This figure is regulated by the Articles of the Fund and relates to the Fund quota contribution of the country. A member’s purchases of currency from the Fund must be repaid by repurchases or by the purchase of that member’s currency by another member. The repayment period is specified. SDR Holdings, as stated above were designed to meet the need, as and when it arises, for a supplement to existing reserve assets.

BALANCE OF PAYMENTS REPORT 2011 Page 58
The Central Government’s foreign balances consist of its investments of sinking funds and of other funds, for example Special and Trust funds.
The reserve position of the commercial banks (Item B13) is computed as the change in their net foreign asset position. The liabilities of these banks comprise the deposits of non-residents, foreign share capital and the net balances due to head offices and to other banks abroad by Trinidad and Tobago banks. The assets cover the net balances held by Trinidad and Tobago banks with their head offices and other banks abroad, holdings of foreign notes and coins, foreign securities, commercial bills and loans and advances made to non-residents.
F. APPENDICES 3 AND 4 - DIRECTION OF TRADE
*1 Includes Bangladesh, Botswana, British Africa, Brunei Darussalam, Cameroon, Cyprus, Fiji (not after 2009), Gambia, Ghana, Kenya, Kiribati, Lesotho, Malawi, Malaysia, Maldives, Malta, Mauritius, Mozambique, Myanmar, Namibia, Nauru, Nigeria, Pakistan, Papau New Guinea, Rwanda, Seychelles, Sierra Leone, Singapore, Samoa, Solomon Island, Sri Lanka, South Africa, Swaziland, Tonga, Tuvalu, Uganda, Tanzania, Vanuatu and Zambia.
*2 Includes St. Lucia, Grenada, St. Vincent and Grenadines, Dominica, St. Kitts and Nevis, Montserrat, Bahamas, Antigua and Barbuda, Haiti and Suriname.
*3 Includes British Virgin Islands, Anguilla, Cayman Islands, Turks and Caicos Islands and Bermuda.
*4 Includes Puerto Rico and U.S. Virgin Islands, Dominican Republic, Cuba, Martinique, Guadeloupe and French Guiana, Netherlands Antilles, Aruba and Curacao.
*5 Includes Austria, Belgium, Bulgaria (joined in 2007), Cyprus, Czech Republic, Denmark, Estonia, Finland, France, Germany, Greece, Hungary, Ireland, Italy, Latvia, Lithuania, Luxembourg, Malta, Netherlands, Poland, Portugal, Romania (joined in 2007), Slovakia, Slovenia, Spain, Sweden and United Kingdom.
*6 Includes Iceland, Liechtenstein, Norway and Switzerland.
*7 Includes Argentina, Chile, Colombia, Mexico, Ecuador, Bolivia, Uruguay, Paraguay and Peru.
*8 Includes Nicaragua, Honduras, Costa Rica, El Salvador and Guatemala.
*9 Includes Panama Republic.
*10 Includes Japan, Iran, Libya and Possessions, Indonesia, Saudi Arabia and other foreign countries.
Source: Trade Bulletin.

BALANCE OF PAYMENTS REPORT 2011 Page 59
ITEM SOURCE OF DATA
TABLE 2 Merchandise 1. Trade Bulletin
TABLE 3 Transportation Credit Item 1. Passenger Fares 1. Trinidad and Tobago (Caribbean Airlines) Item 2. Time Charters 1. Trinidad and Tobago (Caribbean Airlines)
2. Survey of Foreign Airlines
Item 3. Port Disbursements 3.1 Port Charges Port Authority 3.2 Airport Charges Airports Authority 3.3 Pilotage Trinidad Pilots’ and Berthing Masters Association 3.4 Cargo Charges 1. Port Authority 2. Survey of Foreign Airlines 3. PLIPDECO 4. Airports Authority 3.5 Other Port Disbursements Survey of Shipping Agents 1. Port Authority
Item 4. Other Miscellaneous Receipts 4.1 Mail Trinidad and Tobago (Caribbean Airlines) 4.2 Other Receipts 1. Survey of Shipping Agents 2. Survey of Foreign Airlines 3. Trinidad and Tobago (Caribbean Airlines) Debit
Item 5. Passenger Fares 1. Survey of Foreign Airlines 2. Survey of Shipping Agents
Item 6. Time Charters 1. Survey of Foreign Airlines 2. Trinidad and Tobago (Caribbean Airlines)
Item 7. Port Disbursements 1. Trinidad and Tobago (Caribbean Airlines)
Item 8. Other Miscellaneous Payments 1. Trinidad and Tobago (Caribbean Airlines)
TABLE 4. Travel
Credit
Items 1.,2.,3. 1. Various Surveys of Foreign Visitors by the Central Statistical Office of Trinidad and Tobago
Item 4. Students 1. University of the West Indies, St. Augustine 2. College of Science, Technology and Applied Arts 3. University of the Southern Caribbean
SOURCES OF DATA

BALANCE OF PAYMENTS REPORT 2011 Page 60
ITEM SOURCE OF DATA
Item 5. Advances to Crew 1. Survey of Shipping Agents 2. Survey of Foreign Airlines
Debit
Item 4. Business Travellers Returns from Commercial Banks
Item 5. Students Same as Item 4
Item 6. Government Officials Comptroller of Accounts
Item 7. Tourists and Other Travellers Same as Item 4
TABLE 5A. Investment Income
Credit
Item 1. Central Government - Interest Investments Division, Ministry of Finance and the Economy
Item 2. Central Bank - Interest Central Bank of Trinidad and Tobago
Item 3. Commercial Banks - Interest Returns from Commercial Banks
Item 4. Other Survey of Direct Foreign Investment
Item 5. Dividends and Profits Suvey of Direct Foreign Investment
Debit
Item 1. Central Government - Interest Public Finances and Debt Unit, Central Bank of Trinidad and Tobago Item 2. Public Enterprises - Interest Public Finances and Debt Unit, Central Bank of Trinidad and Tobago Item 3. Direct Foreign Investment - Interest Survey of Direct Foreign Investment
Item 4. Other Public Finances and Debt Unit, Central Bank of Trinidad and Tobago and Returns from Commercial Banks Item 5. Dividends and Profits Survey of Direct Foreign Investment Returns from Commercial Banks
Item 6. Reinvested Earnings Survey of Direct Foreign Investment
SOURCES OF DATA

BALANCE OF PAYMENTS REPORT 2011 Page 61
ITEM SOURCE OF DATA
TABLE 6. Other Government
Credit
Item 1. Receipts from International Institutions Survey of International Institutions
Item 2. Receipts from Foreign Diplomatic Agencies Survey of Foreign Diplomatic Agencies
Debit
Item 3. Central Government - Diplomatic and Other Foreign Expenditures Comptroller of Accounts
Item 4. Payments to International Institutions Survey of International Institutions
TABLE 7. Other Services
Credit
Item 1. Advertising 1. Survey of Advertising Establishments 2. Caribbean Communications Network (CCN) 3. Guardian Media Limited
Item 2. Agents’ Fees 1. Survey of Foreign Airlines 2. Survey of Shipping Agents
Item 3. Oil Processing Fees Petroleum Company of Trinidad and Tobago
Item 4. Charter Hire 1. Trinidad and Tobago (Caribbean Airlines) 2. Survey of Foreign Airlines
Item 5. Other Survey of Direct Foreign Investment
Debit
All Items Survey of Direct Foreign Investment except Charter Hire (Trinidad and Tobago (Caribbean Airlines) and Survey of Foreign Airlines)
TABLE 8. Unrequited Transfers - Private
Credit
Item 1. Migrants’ Transfers Trade Bulletin/Central Statistical Office of Trinidad and Tobago
SOURCES OF DATA

BALANCE OF PAYMENTS REPORT 2011 Page 62
ITEM SOURCE OF DATA
Item 2. Remittances to Institutions Survey of Private Non-Profit Institutions
Item 3. Remittances to Individuals 1. Trinidad and Tobago Postal Corporation 2. Survey of Remittance Survey Providers 3. Returns from Commercial Banks
Debit
Item 4. Remittances Abroad 1. Trinidad and Tobago Postal Corporation 2. Survey of Remittance Survey Providers 3. Returns from Commercial Banks
Item 5. Payments to Foreign Diplomatic Agencies Survey of Foreign Diplomatic Agencies
TABLE 9. Unrequited Transfers - Government
Credit
Item 1. Withholding Taxes Survey of Direct Foreign Investment
Item 2. Remittances by Other Governments Survey of Foreign Students
Debit
Item 3. Contributions to International Institutions Comptroller of Accounts
Item 4. Pension Paid Abroad 1. Comptroller of Accounts - Pension Branch 2. Police Service 3. Fire Services 4. Defence Force 5. Ministry of Works
Item 5. Other Miscellaneous Grants Comptroller of Accounts
TABLE 10. Private Sector - Direct Investment Capital Survey of Direct Foreign Investment
TABLE 11. Central Government Debt Public Finances and Debt, Central Bank
TABLE 12. Foreign Reserves Central Bank and Returns from Commercial Banks
TABLE 13. Commercial Banks Foreign Assets and Liabilities Returns from Commercial Banks
TABLE 14. TT Dollar Exchange Rates Central Bank
SOURCES OF DATA