Book Layout Chery - oregon.gov · Hydrogeomorphic (HGM) Assessment Guidebook for Tidal Wetlands of...
90
PART 1 RAPID ASSESSMENT METHOD Oregon Plan for Salmon & Watersheds OREGON DEPARTMENT OF STATE LANDS
Transcript of Book Layout Chery - oregon.gov · Hydrogeomorphic (HGM) Assessment Guidebook for Tidal Wetlands of...

PART 1
RAPIDASSESSMENT
METHOD
Oregon Plan for Salmon & Watersheds
OREGON DEPARTMENT OFS T AT E L A N D S

Hydrogeomorphic (HGM) Assessment Guidebookfor Tidal Wetlands of the Oregon Coast, Part 1:Rapid Assessment Method
Paul Adamus, Ph.D., Adamus Resource Assessment, Inc., Corvallis, OR 97330; [email protected] 2006
produced byCoos Watershed AssociationP.O. Box 5860Charleston, OR 97420541.888.5922 (phone)541.888.6111 (fax)[email protected] Souder, Executive Director
author’s acknowledgements
Copyright © 2006 by the Coos Watershed Association. This work is licensed under the Creative Commons Attribution-NonCommercial-ShareAlike License. To view a copy of this license, visit http://creativecommons.org/licenses/by-nc-sa/1.0/ or send a letter to Creative Commons, 559 Nathan Abbott Way; Stanford, CA 94305, USA.
photographs byPaul AdamusRussell ScrantonAdam Demarzo
suggested citationAdamus, P.R. 2006. Hydrogeomorphic (HGM) Assessment Guidebook for Tidal Wetlands of the Oregon Coast, Part 1: RapidAssessment Method. Produced for the Coos Watershed Association, Oregon Department of State Lands, and U.S.E.P.A.-Region10. Charleston, OR: Coos Watershed Association.
the Coos Watershed Association......is a 501(c)(3) non-profit organization whose mission is “to provide a framework to coordinate andimplement proven management practices, and test promising new management practices, designed tosupport environmental integrity and economic stability for communities of the Coos watershed.” TheAssociation, founded in 1994, works through a unanimous consensus process to support the goals of theOregon Plan for Salmon and Watersheds. Our 20 member Executive Council includes representatives from
agricultural, small woodland, waterfront industries, fisheries, aquaculture, local government, environmental industrialtimberland, and state and Federal land managers.
A practical need for a method to rapidly assess Oregon’s tidal wetlands was first identified by Jon A. Souder, Ph.D., ExecutiveDirector of the Coos Watershed Association (CWA), who procured funding for the project and served as project administrator.Funding came primarily through a competitive grants program of the US Environmental Protection Agency (Region 10, YvonneVallette). The project has been implemented as an independent component of EPA’s West Coast Tidal Monitoring Venture.Under the guidance of Janet Morlan, the Oregon Department of State Lands (Wetlands Program) provided additional assis-tance, funding, and coordination. Outstanding for their voluntary assistance, equipment loans, data sharing, and good advicehave been the staff of South Slough NERR (notably Steve Rumrill, Craig Cornu, Sue Powell, and Michele Koehler), as well asDan Bottom, Laura Brophy, Larry Caton, Gareth Ferdun, Bob Frenkel, Jim Good, Neal Hadley, Jon Hall, Roy Lowe, Neal Maine,Jim Mundell, Lori Robertson, Heather Stout, participants at the “tidal wetland experts workshop,” the Tenmile WatershedCouncil, and the hundreds of landowners who said “yes” to our requests to access their properties. Also appreciated havebeen the contributions of John Baham, Jamie Carter, Leandra Cleveland, Greg Coffeen, Nick Coffey, Trevan Cornwell, JohnChristy, Adam Demarzo, Ralph Garono, Ren Jacob, David King, Pete Klingeman, Emily Kolkemo, Jennifer Larsen, BradLivingston, Jay Lorenz, Tonya Haddad, Jennifer Taylor Hennessey, Justin Miner, Karen Nelson, Nancy Nichols, MikePatterson, Phil Quarterman, Doug Ray, Migs Scalici, Russell Scranton, Miranda Shapiro, Stan van de Wetering, and DawnWright. We particularly appreciate and acknowledge the 198 private landowners and public agencies who allowed accessto their wetland properties for this project. We have offered those private landowners a guarantee of confidentiality regardingthe location, details, and functional conditions of their specific sites. We request the users of this guide respect thisconfidentiality.
Paul Adamus, Ph.D., Adamus Resource Assessment, Inc.
produced byCoos Watershed Association
August 2006
Hydrogeomorphic (HGM) Assessment Guidebookfor Tidal Wetlands of the Oregon Coast
Part 1: Rapid Assessment Method
Editor Marty Giles, Sharp Point Writing & Editing Services; Coos Bay, Oregon
Graphics & Layout Designer Anne Farrell-Matthews, South Coast Printing & Graphics; Coos Bay, Oregon
Project Manager Jon A. Souder, Ph.D., Coos Watershed Association; Charleston, Oregon
This project was funded byU.S. Environmental Protection Agency Grant #CB9702800-1
to the Oregon Department of State Lands.
This project was managed bythe Coos Watershed Association under a Cooperative Agreementwith the Oregon Department of State Lands, dated June 20, 2002.
Additional support to the Coos Watershed Associationfor their work on this project was provided by
Oregon Watershed Enhancement Board (OWEB) Grants #204-010 and #206-010.
OREGON DEPARTMENT OFS T A T E L A N D S

1August 2006 – Hydrogeomorphic Assessment Guidebook for Tidal Wetlands of the Oregon Coast, Part 1
This is the first of a five part assessmentguide for tidal wetlands of the OregonCoast. This document presents a methodfor assigning scores to a tidal wetland basedon twelve functions‡ that are (potentially)performed naturally by wetlands. Thismethod also assesses: 1) the potentialvalues‡ of these functions, 2) the indicators‡
of a wetland’s biological and geomorphiccondition, and 3) the potential risks‡ to awetland’s integrity‡. Intended for use bytrained natural resource professionals, thismethod can generate usable results from asingle day-long visit to a wetland.
Development of this rapid assessmentmethod (RAM) complied generally withguidelines for developing regionalhydrogeomorphic (HGM)‡ methods asissued by the U.S. Army Corps of Engi-neers in coordination with other agencies.During this method’s development, mul-tiple regional subclasses of the “TidalFringe” wetland class were defined, and thecandidate indicators of functions wereproposed and peer-reviewed in a workshopof regional scientists. Reference data forthese indicators were then collected from120 reference wetlands from the Californiaborder north to, but not including, theColumbia River estuary. The reference datawere subsequently analyzed to help cali-brate the scoring models‡. Perhaps uniqueamong wetland rapid assessment methods,an accompanying spreadsheet appliesregression models to specific sites‡ to setmore realistic expectations for some vari-ables‡, and to partially distinguish humanimpacts to wetland integrity‡ from naturalinfluences. The method also introduces theidea of a “certainty index” for indicator andfunction scores.
This RAM guide allows users to identifywhich of several functions most distinguisha particular tidal wetland from others of its
subclass. Although it is sensitive to differ-ences among different subclasses of tidalwetlands, the method does not allow users tocompare different tidal wetland subclassesdirectly (e.g., high vs. low marsh‡), nor tocompare non-tidal wetlands with tidal wet-lands (e.g., undiked vs. completely-dikedsites). The method is applicable to severalresource management needs, including—
• designing and evaluating tidal wetlandrestoration projects in a consistent,standardized manner
• prioritizing tidal wetlands based on theircondition (level of degradation or integ-rity)—either potential (i.e., risk) or actual
• providing a standardized and transparentprocedure for assessing the capacity of aparticular wetland to perform severalvaluable functions (such as when alter-ations that would require a federal and/orstate wetland permit are proposed)
As far as possible, this method should beused in concert with watershed-scale assess-ments of wetland functions and with more-intensive procedures that monitor individualwetlands over the long term.
Restoration project designers who prefer notto use this RAM may nonetheless find thereference data accompanying the RAM guideuseful. This method is intended to serve asan operational draft and may be revisedat future times in response to user feed-back and evolving scientific understand-ing of tidal wetlands. As of the publicationdate, this document, the supporting files offield and GIS data, and the spreadsheetneeded to compute scores for the rapidassessment method, may be downloadedfrom: www.oregonstate.edu/~adamusp/HGMtidal . Users should regularly check forupdates at this internet location and at theOregon Department of State Lands (DSL)website: www.oregonstatelands.us .
Summary
Summary
‡ Terms defined in Glossary are indicated by a ‡ at first usage in text.

2 Hydrogeomorphic Assessment Guidebook for Tidal Wetlands of the Oregon Coast, Part 1 – August 2006
For more information about this method and opportunities to be trained in its use, please contact:
Dr. Paul AdamusAdamus Resource Assessment, Inc.6028 NW Burgundy Dr.Corvallis, OR 97330phone: (541) 745-7092email: [email protected]
Janet Morlan, Wetlands Program ManagerOregon Department of State Lands775 Summer St. NE, Ste. 100Salem, OR 97301-1279phone: (503) 378-3805, ext. 236email: [email protected]
Summary

3August 2006 – Hydrogeomorphic Assessment Guidebook for Tidal Wetlands of the Oregon Coast, Part 1
ACKNOWLEDGMENTS INSIDE COVER
SUMMARY 1
CONTENTS 3
1 INTRODUCTION 4
Purpose and Need 4
Background: the HGM Approach for Assessing Wetland Functions 11
2 THE HGM RAPID ASSESSMENT METHOD 14
How to Use the Method 14
Classifying the Wetland 17
Delimiting the Assessment Units 19
Description of Data Forms 23
3 CORRECTLY INTERPRETING AND APPLYING RESULTS
OF THIS METHOD 27
4 LITERATURE CITED 33
APPENDIX A. DATA FORMS 34
Data Form A1. Rapid Indicators of Risks to Tidal Wetland Integrity and Sustainability
Data Form A2. Direct Indicators of Wetland Integrity that Require More-Intensive Field Work
Data Form B1. Rapid Indicators of Function That May be Estimated
Data Form B2. Rapid Indicators of Function Requiring Aerial Photographs or Measuring Equipment
Data Form C. Rapid Indicators of the Values of Functions
Vegetation Quadrat Data Form
APPENDIX B. ABBREVIATIONS USED IN THIS DOCUMENT 72
APPENDIX C. SCORING MODELS AND SCALES USED TOASSESS THE FUNCTIONS SCORING MODELS 73
APPENDIX D. GLOSSARY 76
TABLE OF CONTENTS
Contents

4 Hydrogeomorphic Assessment Guidebook for Tidal Wetlands of the Oregon Coast, Part 1 – August 2006
E
E
E
EE
E
J
JJ
J
J
EE
DW
DW
DW
PP
P
J
J
JJ
J
1 Introduction
Purpose and Need
Tidal wetlands are widely recognized for theservices and values they provide to society(Teal 1962, Costanza et al. 1997; also see“Potential functions of tidal marshes of theOregon coast, and their associated values,”page 9). In Oregon, tidal wetlands arevalued for their capacity to passively modifyrunoff before it reaches productive coastalwaters, as well as for their key role in sup-porting salmon and other marine resources(Seliskar & Gallagher 1983, Thom 1982,Good 2000). Yet, not all tidal wetlands areequal: they differ in their intrinsic capacityto provide these vital services and values.They also differ in the degree to which theircapacity to function properly has been
altered by human activities. Understandingand representing fairly these differences isimportant to the people whose land includesor borders tidal wetlands, as well as to thosewho benefit from the values and servicesthese wetlands support. Understanding thesedifferences is also important to agenciesresponsible for managing human activities intidal wetlands, as well as to agencies andgroups interested in restoring or enhancing
their ecological functions.Even among tidal marshes‡
that are relatively pristine,not every marsh performsevery function to the samedegree or consistentlythrough time. Recognizingthis, agencies are increas-ingly attempting to tailortheir wetland managementand regulatory decisions tocharacteristics of individualwetland sites and water-sheds. This fine-tuning ofwetland management isbeing done in the context ofthe overriding national andstate policy objectives ofachieving “no net loss” (ornet gain) of the importantfunctions of America’s andthe states’ wetlands.
What is a RAM?A Rapid Assessment Methodassigns numbers to specific fieldobservations and then organizesthose numbers to quantitativelyevaluate particular functions andvalues.
Figure 1. Aerial infrared photograph of a Nehalem tidal marshshowing geomorphic indicators. The 10 “junctions”(J) measuredalong the longest interval channel; the 8 “exits”(E) of channelsalong the external edge‡; complexes of dozens of marsh pannes‡
(P); and a driftwood (DW) line along the upland edge.
Introduction

5August 2006 – Hydrogeomorphic Assessment Guidebook for Tidal Wetlands of the Oregon Coast, Part 1
1. Rapid AssessmentMethod for Tidal Wet-lands of the OregonCoast
2. Science Review and DataAnalysis Results for TidalWetlands of the OregonCoast
3. Wetland Profiles ofOregon’s Coastal Water-sheds and Estuaries
4. Software and Databasefor Selected Tidal Wet-lands of the OregonCoast
5. Revised Maps of TidalWetlands of the OregonCoast
A method that may be applied during a single visit to assess indicators of thefunctions and condition of a particular tidal wetland relative to others of its subclass.Print document with accompanying spreadsheet program CD-ROM.
A detailed synopsis of literature and data upon which the rapid assessment method ispartially based, with emphasis on research from the Pacific Northwest, includingstatistical analyses of new field data collected for calibrating the rapid assessmentmethod indicated above. Print document.
Tabular and narrative summaries and interpretations, by watershed and estuary, ofthe distribution, properties, and geomorphic settings of wetlands (not just tidalwetlands) as derived from GIS analyses of available spatial data layers. Printdocument.
A CD-ROM containing: a) a spreadsheet that automatically calculates scores forfunctions and condition, b) a database of raw data collected from 120 tidal wetlandsof the Oregon coast, and c) photographs of representative sites on public lands.
A DVD containing refinements of the National Wetlands Inventory maps, specifi-cally: a) increased detail in boundaries of intertidal emergent and intertidal forestedwetlands based on enlarged May 2002 color infrared aerial photographs (1:24,000original scale), field observations, and other data sources; b) labeling of thesewetlands to conform with a hydrogeomorphic classification‡; c) labeling of somenon-tidal wetlands as “Restoration Consideration Area” if they might havegeotechnical potential for restoration of tidal circulation; and d) improved depictionof tidal creeks within some wetlands. The DVD also includes spatial data on otherthemes pertinent to assessing condition and function of Oregon tidal wetlands.Some of this information may also be available at: www.coastalatlas.net orwww.coastalatlas.net/metadata/TidalWetlandsofOregonsCoastalWatersheds.Scranton.2004.htm .
Introduction
To address the need for distinguishing differences among tidal wetlands, a series of five productshas been prepared. Together these products comprise a “Hydrogeomorphic (HGM) AssessmentGuidebook” for tidal wetlands of the Oregon Coast––

6 Hydrogeomorphic Assessment Guidebook for Tidal Wetlands of the Oregon Coast, Part 1 – August 2006
The particular rapid assessment methodprovided by this part of the guidebook isapplicable mainly to tidal marshes–herba-ceous emergent wetlands whose salinity mayrange from fresh (less than 0.5ppt salt) tosaline (up to 35ppt salt, rarely above). It alsoencompasses shrub‡ and forested wetlandsthat are occasionally inundated‡ by tides, aswell as narrow tidal channels‡ that existwithin tidal wetlands. Vegetated wetlandsclassified as “Palustrine” on National Wet-land Inventory maps (Cowardin et al. 1979;www.nwi.fws.gov) are included if they areinundated at least monthly. Eelgrass bedsare not included, nor are coastal backdunewetlands, even though their underlying watertable may sometimes be influenced by tidalvariation. Also excluded are other wetlandsthat are not inundated at least annually bytides, such as most marshes located behindtidegated‡ dikes. Tidal wetlands of theColumbia River estuary are not covered bythis method because logistical considerations
prevented collecting data from that region asnecessary for calibrating the scoring models.
The method is intended partly for use inassessing–in a consistent, standardizedmanner–the quality of work in projectsinvolving tidal marsh restoration and cre-ation in Oregon. Assessments of the successor failure of restoration and creation projectsare needed to justify the financial investmentin these projects and to identify ways ofimproving the success of similar futureprojects.
Moreover, there is a need for tools to assesstidal wetland condition (i.e., naturalness of awetland as defined by its water quality,animals, and/or plants) in order to trackpossible degradation of tidal marshes result-ing from gradual urbanization and the cumu-lative effects of other factors in their water-sheds and region. Under Section 401 of thefederal Clean Water Act, states and tribes arejust as responsible for maintaining thequality and beneficial uses of jurisdictionalwetlands as they are for maintaining thequality and designated uses of streams,rivers, lakes, and estuaries.
Figure 2. Example of geodatabase map prepared as part of this HGM project. Such maps wereprepared for all estuaries of the Oregon Coast and are available on the accompanying DVD.
Introduction
Legend Tidal WetlandClassification
Water
Marine Sourced High Tidal Wetland
Marine Sourced Low Tidal Wetland
River Sourced Tidal Wetland
Potential Forested Tidal Wetland
Restoration Consideration Area
Fill
Non Tidal Wetland
Unconsolidated
Upland
DSL Head of Tide
Railroad
1995 Roads
1995 Highway
N
S
EW

7August 2006 – Hydrogeomorphic Assessment Guidebook for Tidal Wetlands of the Oregon Coast, Part 1
The need to assess wetland functions–notjust wetland condition or integrity–is men-tioned explicitly in numerous laws andpolicies of state and federal agencies, e.g.,December 2002 Regulatory Guidance Letterpertaining to Section 404 of the FederalClean Water Act, Oregon Removal-Fill Law,and Oregon Watershed Assessment Manual.The capacity of some functions correlatespositively with the condition or naturalnessof the particular wetland site. Thus, therequirement to assess functions is viewed asgenerally compatible with the requirementfor assessing aquatic life uses (or “wetlandintegrity”) in waters so designated. How-ever, “function capacity‡” and “naturalness”should not automatically be assumed to besynonymous. Exceptions to their generalcorrelation are numerous and important.Moreover, the strength of correlation de-pends strongly on how “naturalness” and“function capacity” are defined and mea-sured. Some ecological goals potentiallyapplicable to Oregon’s tidal marshes areshown in “Components of healthy tidalmarshes,” page 10.
It is hoped that routine use of this guidebookand complementary methods will helpOregon assess the ecological condition forfreshwater wetlands (Morlan 2000) andestuarine systems (Good 2000), as high-lighted in Oregon’s State of the EnvironmentReport 2000—
• change in area, diversity, and distributionof wetland types
• changes in hydrologic characteristics
• changes in water quality
• changes in native wetland plant andanimal assemblages (e.g., changes due toinvasive species)
• degree of connectivity with other aquaticresources and upland‡ habitats
Increasingly, protocols are being publishedthat describe–often in great detail–a particu-
lar researcher’s or group’s opinion on howbest to sample tidal marshes (see Appendix Aof Part 2). Some such protocols are designedspecifically for monitoring restoration sites.However, many fail to demonstrate specifi-cally how the collected data can be manipu-lated so as to characterize the levels offunctions a wetland is performing relative toother wetlands of its type. Consequently,they fail to demonstrate on a site-specificbasis how the collected data relate to specificservices, values, beneficial uses, and end-points important to society. Indeed, somedata collection protocols claim to be measur-ing wetland “function” (singular), as ifsomehow the diverse and sometimes con-flicting functions a wetland performs couldbe unified into one cosmic measure.
This guidebook is not primarily intended toextend our knowledge of tidal wetlands(although some new findings are presented inParts 2 and 3), but rather to compile, orga-nize, and cross-reference existing knowledgein a manner that focuses it effectively intools for assessing tidal wetlands of theOregon Coast. In a national report on wet-land mitigation, the National ResearchCouncil (2001) highlighted a need for theaugmentation of “best professional judgmentapproaches” with procedures that—
• effectively monitor the attainment ofgoals of wetland mitigation projects
• assess a full suite of recognized functions
• incorporate effects of wetland position inthe landscape
• scale the assessment data to data from aseries of reference sites‡
• are sensitive and integrative to changesin performance over a dynamic range ofspace and time
• reliably indicate important wetlandprocesses, or at least, structural indica-tors of those processes
• generate parametric and dimensionedunits, rather than non-parametric rank
Introduction

8 Hydrogeomorphic Assessment Guidebook for Tidal Wetlands of the Oregon Coast, Part 1 – August 2006
This method attempts to address all of theabove while still filling the practical need forcompleting a preliminary site assessmentbased on a single visit to a wetland site. Asingle-visit assessment method is neededbecause the Oregon Department of StateLands (DSL) and the U.S. Army Corps ofEngineers, in cooperation with the U.S.Environmental Protection Agency, are re-quired to make hundreds of decisions eachyear regarding applications to alter Oregonwetlands. Each decision must be madewithin a limited time period, sometimes withlittle flexibility to collect data at other sea-sons. Oftentimes, the severely-limitedavailability of personnel, time, and funds donot allow the monitoring agencies or partiesresponsible for these projects to collect moreintensive, robust, and process-oriented fielddata (such as recommended by Zedler &Lindig-Cisneros 2000, Neckles et al. 2002,and others, and as implied by the last of thebulleted items above).
In addition, because wetland decisions areoften controversial, the technical reasons fora particular decision must be explicit andconsistent in order to maintain public trust.
The method presented in this guidebook isintended to make assessments more explicitand consistent, as well as incorporate themost current and relevant scientific knowl-edge. Ideally, the method should be used aspart of a more comprehensive wetlandmonitoring strategy.
A need also exists for site-specific assess-ment methods that address the values offunctions, not just the capacity of thosefunctions. “Values” are the economic,ecological, and social expressions of afunction as a result of context-related oppor-tunity to provide the function and the likelysignificance of the function to local andregional users or resources. Values include,but aren’t limited to, features that some rapidassessment methods call “red flags,” “ser-vices,” or “value added” features. Themethod presented in this guide attempts tocarefully distinguish values from theirfunctions because any function may havemultiple, sometimes conflicting values, and
Although focused mainly on tidal marshes, thisguidebook includes tidal wetlands partiallyforested with Sitka spruce – currently a rare typeon the Oregon Coast.
Introduction

9August 2006 – Hydrogeomorphic Assessment Guidebook for Tidal Wetlands of the Oregon Coast, Part 1
because assessment of values is considerablymore subjective and context-dependent thanassessment of functions. The considerationof values by this guidebook’s method (thisdocument), as well as the data compilationsin the third document in this series, representa response to one of the most frequentcriticisms of wetland assessment methods:that they do not sufficiently address theimportance of wetlands at landscape, water-shed, and regional scales.
Potential functions of tidal marshes of the Oregon coast and theirassociated values
Notes:1. Definitions of these functions and discussions of their values are provided in Part 2 of this guidebook.2. This is not a complete list of functions and values of tidal marshes, but rather a list of functions whose relativecapacity may reasonably be assessed across a set of marshes using a set of characteristics (indicators) that can beassessed rapidly with limited technical skills and equipment. The only function not addressed herein, but described inthe National Guidebook for Application of Hydrogeomorphic Assessment to Tidal Fringe Wetlands (Shafer & Yozzo1998), is Tidal Surge Attenuation. Also, some functions have been aggregated for the sake of practicality. Accuracy ofthe assessments is diminished somewhat by aggregating functions, species, or elements, each with slightly differentrequirements or pathways. If species- or element-specific predictions are needed, users should refer to other assessmentmethods and models.
This guidebook is intended to be used bywetland specialists for government agencies,natural resource organizations, and consult-ing companies–people who are skilled inconducting jurisdictional delineations ofwetlands. Some basic skills in plant identifi-cation are required to address one of thismethod’s 12 functions (Botanical Condi-tion). Users also should be able to recognizefeatures that characterize soils as hydric anddelineate drainage area boundaries from atopographic map‡.
Introduction
function potentially associated values
Produce Aboveground Organic Matter forage for livestock; supporting biodiversity
Export Aboveground Plant & Animal Production supporting commercial fisheries & biodiversity
Maintain Element Cycling Rates and Pollutant minimizing costs for dredging & shore stabilization,Processing; Stabilize Sediment purifying water, supporting commercial fisheries & biodiversity
Maintain Habitat for Native Invertebrates supporting commercial fisheries & biodiversity
Maintain Habitat for Anadromous Fish supporting commercial fisheries & biodiversity
Maintain Habitat for Visiting Marine Fish supporting commercial fisheries & biodiversity
Maintain Habitat for Other Visiting and Resident Fish supporting commercial fisheries & biodiversity
Maintain Habitat for Nekton-feeding Wildlife supporting biodiversity & ecotourism
Maintain Habitat for Ducks and Geese supporting biodiversity & ecotourism
Maintain Habitat for Shorebirds supporting biodiversity & ecotourism
Maintain Habitat for Native Landbirds, supporting biodiversity & ecotourismSmall Mammals, & Their Predators
Maintain Natural Botanical Conditions supporting biodiversity & ecotourism

10 Hydrogeomorphic Assessment Guidebook for Tidal Wetlands of the Oregon Coast, Part 1 – August 2006
Large stable logs provide an elevated surface whererelatively salt-sensitive woody plants can germinateand grow in tidal marshes.
(a.k.a.: “good quality,” “intact,” “functionallyequivalent,” “mature,” etc.)
A “healthy” tidal marsh …
• …is inundated at a tidal frequency, duration,season, magnitude, and extent that is characteris-tic for the site’s elevation and position in theestuary.
• …exhibits salinity regimes and experiencesfreshwater inputs in spatial and temporalpatterns that are seasonally and diurnally appro-priate for the site’s vertical and horizontalposition in the estuary.
• …exhibits erosional/depositional regimes andhas sediment particle size distributions that areappropriate for the site’s position in the estuaryand watershed geology/soils.
• …exhibits a channel cross-section and mor-phological complexity, and/or a shoreline slopeand complexity, that is appropriate, at multiplescales, for the age of the site and its geologic/hydrologic setting.
• …receives sustained inputs of characteristicquantities, sizes, and decay classes of largewoody debris.
• …receives inputs of nitrogen, phosphorus, andother naturally-occurring elements in formsand seasonal patterns that are appropriate for thesite’s landscape setting, and converts these inputsbetween inorganic and organic forms (andgaseous forms, for N and C) at rates appropriatefor the age of the site and its elevation, substrate,exposure, and salinity.
• …exhibits levels and decomposition rates of soilorganic matter and dissolved oxygen that areappropriate for the age of the site and its eleva-tion, substrate, exposure, temperature, andsalinity.
• …exhibits a resilient assemblage of nativewetland-associated plants whose speciescomposition, diversity (structural, functional, andtaxonomic), percent-cover, productivity, andpatch heterogeneity/zonation are appropriate forthe age of the site and its elevation, substrate,exposure, and salinity.
• …exhibits a resilient assemblage of nativewetland-associated vertebrates and inverte-brates whose species composition, diversity(both taxonomic and functional), density, tissuecontaminant levels, production, and health areappropriate for the age of the site and its eleva-tion, substrate, exposure, and salinity.
• …is located within characteristic distances ofother tidal marshes and other important estuarinehabitats such as native eelgrass beds and freshwa-ter seeps.
Introduction
Components of healthy tidal marshes
Deeply-incised channels are characteristic ofmany Oregon tidal marshes and provide a cool,sheltered microhabitat for foraging fish.

11August 2006 – Hydrogeomorphic Assessment Guidebook for Tidal Wetlands of the Oregon Coast, Part 1
location or type, or on the typically-recom-mended but problematic approach of com-paring a particular mitigation wetland withmerely a single reference (“control”) site,e.g., Mitchell 1981, Neckles et al. 2002.
The national initiative began with publica-tion of a nationwide scheme for HGMclassification (Brinson 1993), and broadguidance for developing regional HGM-based assessment methods (Smith 1983,Smith et al. 1995, Smith et al. 2001). Subse-quently, “HGM projects” were initiated inover a dozen states, largely with fundingfrom the USEPA. Guidebooks from some ofthese efforts are now available, includingones for assessing functions of tidal wetlandsin other regions (Shafer and Yozzo 1998,Shafer et al. 2002).
In 1997 Oregon’s Department of State Lands,after meeting with other agencies and actingupon a key recommendation of a report(Recommendations for a Nonregulatory
Introduction
Figure 3. Idealized depiction of the configuration of transects, quadrats, andchannel cross-sections used to survey 120 Oregon tidal marshes.
Background: the HGM Approach for Assessing Wetland Functions
Oregon is not unique in attempting to de-velop methods for rapidly assessing thefunctions or condition of tidal wetlands. Inthe early 1990s, the federal agency respon-sible for issuing permits for wetland alter-ation, the U.S. Army Corps of Engineers,announced a “National Action Plan” (FederalRegister 62(119):33607; www.epa.gov/OWOW/wetlands/science/hgm.html) todevelop improved methods for representingthe functions of all wetlands. The newassessment methods would be developedregion-by-region and be organized aroundhydrogeomorphic (HGM) principles forwetland classification. The methods wouldfeature scoring models that would attempt torepresent the relative capacity of a particularwetland to provide each of several functions,as rated on a scale of 0 (low capacity) to 1(high capacity). The model scales would becalibrated using data collected from regionalreference sites. This approach was viewed asa more sophisticated and improved alterna-tive to approaches based simply on wetland

12 Hydrogeomorphic Assessment Guidebook for Tidal Wetlands of the Oregon Coast, Part 1 – August 2006
Wetland Restoration Program for Oregon,Good & Sawyer 1998), proposed that Oregonalso begin developing HGM methods andguidebooks appropriate for various regionsof Oregon. A statewide HGM frameworkdescribing Oregon’s wetland types, theirfunctions, and potential indicators of thesefunctions was developed (Adamus 2001b).
From 1998 to 2000, Oregon’s first effort todevelop HGM methods focused on two typesof wetlands common in the WillametteValley (Adamus and Field 2001, Adamus2001a). Field data were collected from 109wetlands belonging to these types and thefirst regional guidebook for Oregon waspublished. Subsequently, regulatory staffs ofthe U.S. Army Corps of Engineers (PortlandDistrict), Oregon Department of State Lands(DSL), various other agencies, and consult-ing firms received training in the WillametteValley HGM method. In January 2003, DSLadopted rule revisions to the Removal-FillLaw which require that applicants for wet-land Removal-Fill permits indicate the HGMsubclass‡ to which the impacted and pro-posed mitigation wetland belong. Oregon’s
HGM guidebook for the Willamette Valleyecoregion‡ provided peer-reviewed, cali-brated models for assessing wetland func-tions in the Willamette Valley, as well as anextensive reference data set for potential usein developing performance standards forwetland restoration projects there. DSL’sadministrative rules currently encourage useof these products for assessing wetlandfunctions in the context of permit decisionsin the Willamette Valley. However, no suchmodels of wetland functions (or region-wide
reference data sets that pertain towetland functions) were produced forother Oregon regions and wetlandtypes.
The project that is the focus of thisguidebook has attempted to fill thatneed for tidal wetlands of the Oregoncoast. Using the terminology ofEPA’s national monitoring strategyfor wetlands, the method presented
Both erosion and deposition are naturally-occurringprocesses in tidal marshes.
Introduction

13August 2006 – Hydrogeomorphic Assessment Guidebook for Tidal Wetlands of the Oregon Coast, Part 1
herein may be considered a “Tier 2”method1. No rapid methods are available forassessing tidal wetlands in neighboringWashington, but California has recentlydrafted a method, California Rapid Assess-ment Method, or CRAM (Collins et al.2004), that includes an assessment compo-nent for estuarine wetlands. As presented inthis guidebook, Oregon’s rapid method fortidal wetlands has some structural similari-ties to CRAM and similarly was calibratedusing a large reference set of field data. Itdiffers from CRAM partly in that it explicitlyassesses individual functions as well aswetland condition, and uses a more diversearray of indicators in order to enhance itssensitivity to differences among individualwetlands. Also, the Oregon Watershed
Enhancement Board, in concert with theOregon Department of Land Conservationand Development, has recently supportedrevision of parts of the Oregon WatershedAssessment Manual that deal with estuariesand tidal wetland restoration (Brophy 2005).That document provides a field-based ap-proach for identifying (but not assessingfunctions of) wetlands that formerly weretidal and which might have potential forrestoration of their tidal circulation. It useslandscape-scale tools to provide broadguidance for estuary-wide decision making,integrating concepts of biogeography, land-scape ecology, and land use history to focuson historical and current connectivity be-tween tidal flows, wetlands, and streamnetworks.
Introduction
__________________________________1 “Tier 1” involves measurement at broad spatial scales, e.g., use of GIS to describe wetland distribution at a watershedscale. “Tier 2” involves design, testing, and application of methods for rapidly estimating wetland condition andfunctions at a site-specific scale. “Tier 3” involves detailed, direct measurements of wetland processes and structure,e.g., sampling of wetland invertebrates.

14 Hydrogeomorphic Assessment Guidebook for Tidal Wetlands of the Oregon Coast, Part 1 – August 2006
for Selected Tidal Wetlands of the OregonCoast Excel™ spreadsheet. The spreadsheetautomatically calculates scores for individualfunctions and other attributes. Data entrynormally takes no more than one hour perwetland. Using the method is straightfor-ward:
A variety of equipment was used to access andsurvey the 120 tidal marshes.
2 The HGM Rapid Assessment Method
This method uses separate data forms toassess functions, values, and risks to wetlandintegrity. Begin by copying the data forms(Appendix A1; use Appendix A2 only if youwish to assess values as well). After fillingthese out while visiting a wetland, you mustenter the data in the Software and Database
Method
How to Use the HGM Rapid Assessment Method
In brief, this method has three sequential components—1) recording field observations on standardized data sheets (offered in Appendix A1)2) entering the calculated numeric scores (with a measure of relative certainty) into a specially
designed Excel™ spreadsheet3) employing the spreadsheet to derive numbers that represent the relative level of function of the
wetland assessed

15August 2006 – Hydrogeomorphic Assessment Guidebook for Tidal Wetlands of the Oregon Coast, Part 1
1. Confirm wetland status. First, be surethe site you’re assessing currently meetsfederal and state technical criteria forbeing a wetland at this time. Also besure the wetland you’re assessing is atidal wetland. That is, most of the sitemust be flooded by tides (either fresh orsaltwater) at least once a year and mustmeet jurisdictional criteria for being awetland.
2. Delimit the site. Delimit the “assess-ment unit‡” (wetland site) boundariesfollowing the guidance in Classifying theWetland, below. In some instances theseboundaries may be more restricted thanboundaries determined as part of aregulatory wetland delineation.
3. Gather existing information. Assembleexisting information most relevant to thewetland site. This may include—
• map of the site’s location in the con-text of its estuary
• polygon boundaries of the wetland asshown in the accompanying DVD oron National Wetlands Inventory (NWI)map server: http://wetlandsfws.er.usgs.gov/NWI/index.html
• county soil survey maps (available atNRCS offices, libraries, and online at:www.or.nrcs.usda.gov/pnw_soil/or_data.html)
• aerial photographs (available at officesof some state and federal resourceagencies, university libraries, andfrom private vendors)
• discussions with local residents andresource agency staff
• data from other investigators andresource agencies
4. Visit the site. Visit the site at least oncefor a 6-hour period. If you can visit itonly once and have flexibility in schedul-ing a date, visit it on or near the day ofthe month when high tides are highest(spring tide‡). During the visit, observeconditions described on the field forms.Walk as much of the site as is necessary
to make the specified observations withreasonable certainty. If one repeat visit isfeasible, schedule it for the month’slowest tide. If a third visit is possible butnot urgent, schedule it for the highest tideof the year. Assessment by amultidisciplinary team is encouraged butnot required. Prior training in the use ofthis method also is encouraged but notrequired at this time. For such scheduledtraining, contact the Department of StateLands or check on the Internet at: http://epp.esr.pdx.edu/calendar.html.
5. Fill out the data sheets. While in thefield, use your observations and bestjudgment to fill out the forms completely,e.g., putting an appropriate number inevery box marked “score” and “cer-tainty.” Be sure to read any explanatorynotes in the last column of each form,and refer to the Glossary (Appendix D) ifnecessary. Supplement your field obser-vations using the resources in #3 asnecessary. If you decide to assess thefunction called “Maintain Natural Bo-tanical Conditions,” be sure to followthe protocol described in “Protocol forassessing botanical indicators shown onData Form A2” (below) and Figure 3(page 11).
6. Transfer data to Excel™. Transfer thedata from your field forms to matchingparts of the Excel™ spreadsheet(TidalWet_Assess.xls) contained on theCD. For the most recent version of thespreadsheet and this guidebook, visit:www.oregonstate.edu/~adamusp/HGMtidal .
8. Print the results. After all data havebeen entered, print the resulting scoresfor the site’s functions, values, and/orecological risk. These were calculatedautomatically by the Excel™ program. Ifyou prefer not to use the spreadsheet, youmay calculate some of the summaryscores using a pocket calculator, insertingdata from your field forms into theformulas (scoring models) shown in
Method

16 Hydrogeomorphic Assessment Guidebook for Tidal Wetlands of the Oregon Coast, Part 1 – August 2006
Appendix C, taking careful note of themathematical order of operations in eachformula. One exception is the function,“Maintain Natural Botanical Condi-tions,” which must be calculated usingthe spreadsheet.
9. Interpret the results. Interpret theresults, partly by comparing your scoreswith those for other Oregon tidal wet-lands of the same subclass (shown inPart 2).
10. Annotate the results. Write a short sitedescription as an addition to your sitedata sheets, discussing any unusualconditions present at the time of yourvisit. Note other factors important tofunctions that might not be apparentfrom the scores generated by this rapidassessment method. Describe in wordsthe Values component of the assessment,if you chose to do that as well. Note thatthe Values assessment does not havescoring models associated with it.
Protocol for assessing botanical indicators shown on Data Form A2.
Dozens of protocols have been proposed for surveying vegetation, and the choice of any par-ticular one will depend on the objectives of the project. The following protocol features square-meter quadrats‡ placed along marsh transects. It is intended for use specifically for the objec-tives of this guidebook, and is required so data from future assessments using this guidebook’smethod may be compared with reference data that were collected using the same protocolduring guidebook development. If possible, vegetation data should be collected sometimeduring May–August.
1. In most instances, establish two parallel transects per wetland (Figure 3). One end of eachtransect should be at a point containing wetland vegetation that is nearest the adjoiningunvegetated bay or river; the other end should be at the approximate upper annual limit of tidalinundation (i.e., “upland”), as usually indicated by the tree line or driftwood line. If the wetlandoccupies all of an island with no upland, extend each transect the width of the island (if fea-sible). Transects should be relatively straight, but precise alignment is not essential.
2. Situate the two transects near the widest part of the wetland. Situate them to minimize oravoid crossing major channels and non-wetland spots (dikes, fills) within the wetland. Avoidplacing the transects within 2m of each other; much wider spacing (at least 10m) is preferred iflogistically possible. Do not try to “aim” the transects to intercept particular plant communitiesor attempt to make the transects “representative” of the wetland. Random placement, whiledesirable statistically, often presents logistical headaches and is relatively meaningless given thelimited replication (of only two transects).
3. In exactly 20 quadrats (square plots), each 1m x 1m, identify and estimate relative coverage(by percent) of each plant species. Each of the two transects should contain 10 quadrats,spaced equidistantly along the transect beginning at the vegetated transition from unvegetatedbay/river. However, if it becomes evident that less than 20% of a quadrat is vegetated, move tothe left or right of the transect until a spot is found where this criterion is met. (The botanicalprotocol in this guidebook is not intended to assess extent of unvegetated area in a wetland; thatis addressed only by indicator #28.)
4. In narrow marshes, the use of only two short transects could result in quadrats along eachtransect being closer than 2m to each other. To avoid this, deploy additional transects perpen-dicular to the bay or river until at least the 2m spacing is established between quadrats as wellas between transects. In rare instances, it may also be necessary to change transect orientationfrom perpendicular to oblique.
Method

17August 2006 – Hydrogeomorphic Assessment Guidebook for Tidal Wetlands of the Oregon Coast, Part 1
Classifying the Wetland
The national guidebook for HGMassessment of tidal fringe wetlands(Shafer & Yozzo 1998) does notdefine any subclasses of the nationaltidal fringe class, nor does its regionalversion for the Gulf of Mexico (Shaferet al. 2002). Nonetheless, this Oregonguidebook recognizes threehydrogeomorphic subclasses of tidalfringe wetlands—
• Marine-sourced Low Marsh,sometimes called simply “lowmarsh”
• Marine-sourced High Marsh‡,sometimes called simply “highmarsh”
• River-sourced Tidal Wetland
These are defined using the key below. Formost purposes, tidal wetlands should beassigned to an HGM subclass based on theirpresent condition, not what is documented,believed, or imagined to have existed histori-cally. The classification of each Oregon tidalwetland polygon with regard to these threesubclasses is labeled provisionally on thedigital maps accompanying this document.However, the maps provide only a coarserendition of subclass boundaries and werenot comprehensively field-verified.
This guide may be used for assessing bothherbaceous (emergent marsh) and wooded(scrub-shrub, forested) tidal wetlands. How-ever, note that throughout this guide, theterms “tidal marsh” and “tidal wetland” areused interchangeably to denote both herba-ceous and wooded tidal wetlands; thoseterms do not include tidal aquatic-bed wet-lands, such as eelgrass beds (habitats thataren’t covered by this guide). Also note thatthe nouns “variable” and “indicator” are usedinterchangeably.
Method
Portions of wetlands flooded at least once annually byspring high tides are considered tidal wetlands in thisguidebook.
In summary, this method allows you to quickly assign an HGM subclassto many, but not all, tidal wetlands. Although it is impossible to assign aparticular wetland to a specific tidal fringe subclass quickly and un-equivocally, this method is expected to be flexible enough to accommo-date this uncertainty. Assigning a tidal wetland a priori to one of thethree HGM tidal fringe subclasses is not required by this method, butattempting to do so will help clarify your understanding of the wetlandand its functions.

18 Hydrogeomorphic Assessment Guidebook for Tidal Wetlands of the Oregon Coast, Part 1 – August 2006
1. Tidal forces cause the wetland to be flooded with surface water at least once annually, duringmost years. Excluded are wetlands whose water level or soil saturation may be influenced by tidalfluctuations but which lack a regular (at least annual) surface connection to tidal waters. Plantspecies that typically characterize upland habitats are absent or nearly so, and some wetland speciesthat are present may be characteristically tolerant of brackish as well as fresh salinity conditions.Channels, if present, are often narrow, winding, or branched, and may be deeply incised as a resultof tidal action. Regardless of the wetland’s salinity, it is located downriver from the recognizedhead-of-tide2 of its associated estuary. Drift logs and growth of trees‡ and moss often mark theupper boundary of annual flooding, particularly in the transition to non-tidal wetland or upland.
YES: Estuarine Fringe Wetland HGM Class; go to #2.NO: Other wetland classes; this guidebook is not applicable.
2. Tidal forces cause the wetland to be flooded at least once annually with saline or brackish surfacewater originating partly or wholly from the ocean. Often located within or along the fringes of amajor estuarine embayment or a slough off the embayment. Typically located within zones classi-fied as “Marine” or “Brackish” on maps published by Hamilton (1984), the National EstuarineInventory (1985, NOAA 1985; http://spo.nos.noaa.gov/projects/cads), and/or as “Estuarine” onNational Wetlands Inventory maps (http://wetlandsfws.er.usgs.gov/NWI/index.html). The wetlandand/or its immediate receiving waters may have one or more of the following indicators suggestiveof marine water: barnacles, seaweed wrack‡, salt marsh‡ plant species (halophytes such asSalicornia, Triglochin, Distichlis, Plantago maritima), springtide‡ minimum salinities of >5 ppt, ora preponderance (in adjacent flats) of rounded sediment particles indicative of marine-derivedsediments.
YES: Marine-sourced Fringe Wetland; go to #3.NO: River-sourced Tidal Fringe Wetland (RS).
3. All of the wetland is inundated at high tide‡ at least once during the majority of days during eachmonth of the year. This may be indicated by a combination of direct observation of tidal inunda-tion, predominance‡ of plant species characteristic of “low marsh” marine environments in Oregon,absence of woody plants, and/or by reference to data on local tidal range‡ paired with precise mea-surements of elevation and tidal fluctuations relative to an established geodetic benchmark. Lessdefinitively, a boundary between low and high marsh may be evidenced by a vertical break in themarsh surface or by accumulations of fresh wrack [seaweed, plant litter].
YES: Marine-sourced Low Tidal Fringe Wetland (MSL)‡, commonly called “low marsh.”NO: Marine-sourced High Tidal Fringe Wetland (MSH)‡, commonly called “high marsh.”
Method
Dichotomous Key to subclasses of tidal wetlands of the Oregon Coast
____________________________________________________________2 Locations of major heads of tide are shown on the accompanying DVD, or are available from the Department ofState Lands.
1
23

19August 2006 – Hydrogeomorphic Assessment Guidebook for Tidal Wetlands of the Oregon Coast, Part 1 Method
Marine-sourced low and high marshes on sandy substrates often have assemblages of plant speciesthat differ from those in finer-substrate marshes.
Marine-sourced high marshes, like thesepictures, usually have greater richness ofplant species than marine-sourced lowmarshes.

20 Hydrogeomorphic Assessment Guidebook for Tidal Wetlands of the Oregon Coast, Part 1 – August 2006
The area assessed is termed the “assessmentunit” (or “wetland site”). Normally youshould sketch at least a rough version of theassessment unit on a map oraerial photograph before you visitthe site. For larger wetlands,marking of “waypoints” alongwetland boundaries using ahandheld GPS can expeditemapping and improve its accu-racy. For purposes of using thismethod, it is not necessary todelineate the wetland boundarywith the high level of precisioncustomary for jurisdictionaldeterminations.
Where you draw the boundariesof the assessment unit(s) willinfluence the resulting scores.When assessing activities thataffect only part of a wetland,you may assess and score sepa-rately at least two spatial units.In all cases, one of the units youassess must be the entire tidal wetland. Thisshould include both low and high marsh(when both are present), as well as internaltidal channels‡; it should never include anyadjoining non-tidal marsh. The other spatialunit, if desired, may be either (a) the portionof the wetland where construction or vegeta-tion management has been proposed, or (b)spatial units within the wetland based ontheir functionally-distinct HGM subclass(e.g., high vs. low marsh). Using the latter(subclass-based units) may be particularlyhelpful if one of those subclasses comprisesmore than 20% of the total wetland polygon.However, be aware that results for (a) and (b)are likely to be less accurate than for the firsttype of assessment unit because the first typemethod was based on data collected inwhole-wetland units.
The “default” boundaries you use for assess-ing the entire wetland should be the poly-gon boundaries of that wetland shown in the
accompanying DVD. However, adjoining ornearly-adjoining polygons should be consid-ered distinct wetlands whenever appearing tobe separated from each other by––
• a road or dike (even if it containsbridges, culverts, or tidegates), or
• upland, tideflat, rocky shore, orunvegetated water wider than about 100feet, or
• patches of salt-intolerant vegetationwider than 100 feet (e.g., dunegrass,freshwater marsh plants)
Boundaries of the entire assessment unitshould never be based solely on propertylines, fence lines, mapped soil series, vegeta-tion associations, elevation zones, or landuse designations.
Method
River-sourced tidal wetlands often occur as a narrow fringewith sharp transitions among vegetation assemblages.
Delimiting the Assessment Units

21August 2006 – Hydrogeomorphic Assessment Guidebook for Tidal Wetlands of the Oregon Coast, Part 1
Usually the boundary between tidal marshand upland is clearly evidenced by a topo-graphic break, driftwood line, and/or shiftfrom predominantly‡ herbaceous to woodyvegetation. However, in the upper parts ofestuaries the spatial boundary between tidalwetlands (covered by this guidebook) andnon-tidal wetlands (not covered by thisguidebook) is often extremely difficult todelimit. Such identification relies uponbeing able to define a line between areasflooded more than once a year and thoseflooded less than once a year. When flood-ing appears to occur more than once annu-ally, you will need to determine whetherdaily tidal fluctuations had any role in thatflooding, either directly or by “backing up” ariver that otherwise flows unimpeded into its
estuary. Salinity alone cannot be used as acriterion, not only because of its extremetemporal variability, but also because manytidally-influenced wetlands register nosalinity, especially during times of peakflooding. Similarly, vegetation cannot beused alone because many woody plants (e.g.,
Sitka spruce, red alder) tolerate tidal floodingprovided salinity is not extreme. There areno salt-intolerant (freshwater) plants thatoccur only in tidal situations and wouldtherefore be useful indicators. Althoughdriftwood found in a riverine wetland mighthave been brought in by tides, it also couldhave been carried into the wetland solely byriver flooding.
The optional process for assigning bound-aries to subunits within the large wetlandpolygon can be equally challenging and issometimes arbitrary. If based on the tidalHGM subclasses, the boundaries will bedefined by the line between low marsh areas(inundated by tides at least once daily duringthe majority of the days in each month of the
year), and high marsh areas(flooded by tides less often).Often there is no clearseparation line and theseHGM subclasses are discon-tinuous within a wetland.That is, within a largerwetland polygon, “islands”or zones of high marsh orupland may be interspersedamid areas of extensive lowmarsh, and vice-versa. Inthe usual case, where nodata are available describingtidal frequency at variouspoints (elevations) within amarsh, subunits will need tobe based on prevailing plantspecies. If you’ve surveyedmarsh vegetation using theprotocol prescribed on page16 of this guidebook, the
determination of high vs. low marsh can bemade generally using the five indices calcu-lated by the spreadsheet accompanying thisguidebook: the species wetness index, andthe percent-cover and frequency indices forsalt-tolerant and salt-intolerant species.However, no thresholds have been deter-
Accumulations of driftwood along the edge between tidal wetlandsand uplands may mark the upland edge of the assessment unit;driftwood provides cover for small mammals and insects.
Method

22 Hydrogeomorphic Assessment Guidebook for Tidal Wetlands of the Oregon Coast, Part 1 – August 2006
mined for using these or other indices toclearly distinguish high marsh from lowmarsh. Such thresholds would undoubtedlybe influenced by factors such as substratetype and local climate. Uncommonly, visiblebreaks in marsh topography can provideclues for distinguishing high marsh from lowmarsh. Encrustations of sand or barnacleson older driftwood suggest marine origin andsupport the likelihood the wetland is marine-sourced.
Although the rapid method provided in thisguidebook can be applied at multiple scales(entire wetland, plus subunit within based onproposed activity or HGM subclass), thescores it yields are expected to be much moreaccurate for the entire wetland. That isbecause of the considerable subjectivityinvolved in defining boundaries of anysubunits and because field data used tocalibrate this method were collected at thescale of the entire wetland, not smallersubunits. Thus, this method is expected tobe less reliable when comparing high vs. low
marsh subunits within a marsh, or whencomparing different vegetation communitiesor development parcels within a marsh. Asnoted by authors of the HGM guidebook fortidal wetlands of the Gulf of Mexico (Shaferet al. 2002), “Since many of the modelvariables focus on geomorphological orlandscape characteristics, separation ofwetland subclasses based on elevation andsalinity did not seem justified.”
Nonetheless, this method is not blind toimportant distinctions between high and lowmarsh in scoring individual indicators ofmarsh function. Where supported by thefield data, scales for scoring the botanicalindicators took into account HGM subclassof the assessed unit. This was done by usingthe species wetness index and other indices(all presumed to indicate the HGM subclass)to statistically adjust the botanical scales.Likewise, the scoring scale for channel cross-sectional morphology took into account therelative location of the cross-section withinthe marsh.
Method

23August 2006 – Hydrogeomorphic Assessment Guidebook for Tidal Wetlands of the Oregon Coast, Part 1
The first four data forms each have fourcolumns regarding each indicator––
1) identifier number and code for theindicator
2) description of the indicator with numericvalues
3) score boxes for the indicator and cer-tainty estimate, sometimes with interme-diate scale to translate raw numericvalues
4) guidance for interpreting the indicator
The fifth data form has three columns foreach value––
1) description of characteristics exemplify-ing the highest value of that function
2) your score
3) description of characteristics exemplify-ing the lowest value of that function
Method
Description of Data Forms
This method includes five data forms corre-sponding to its three major themes—
Data Form A1. Rapid Indicators ofRisks to Integrity and Sustainability ofTidal Wetlands
Data Form A2. Direct Indicators ofWetland Integrity That Require More-intensive Field Work
Data Form B1. Rapid Indicators ofFunction That May Be Estimated
Data Form B2. Rapid Indicators ofFunction Requiring Aerial Photographsor Measuring Equipment
Data Form C. Rapid Indicators of theValues of Functions
Data Form D. Vegetation Quadrat DataForm
The bottom of each row in the Guidance column contains abbreviations indicating the functions orother attribute that row’s indicator is associated with. The function codes are:
Function abbreviations
used in this document
description
Afish Maintain Habitat for Anadromous Fish
AProd Produce Aboveground Organic Matter
BotC Maintain Natural Botanical Conditions
Dux Maintain Habitat for Ducks and Geese
Inv Maintain Habitat for Native Invertebrates
LbirdM Maintain Habitat for Native Landbirds, Small Mammals, & Their Predators
Mfish Maintain Habitat for Visiting Marine Fish
NFW Maintain Habitat for Nekton-feeding Birds
RA Assessment of Risks to Wetland Integrity & Sustainability
Rfish Maintain Habitat for Other Visiting and Resident Fish
Sbird Maintain Habitat for Shorebirds
WI Wetland Integrity
WQ Maintain Element Cycling Rates and Pollutant Processing; Stabilize Sediment
Xpt Export Aboveground Plant & Animal Production

24 Hydrogeomorphic Assessment Guidebook for Tidal Wetlands of the Oregon Coast, Part 1 – August 2006
Brackets around these codes in the lastcolumn of data forms A1, A2, B1, B2 denotethat the indicator is not associated with thefunction directly, but is associated indirectlywith another function through which it isassessed. Part 2 of this guidebook definesand documents each of these functions, andgives the reasons each indicator in DataForms A1, A2, B1, and B2 was used, i.e.,documents its linkage to one or more func-tions.
Each indicator row has a box in which,optionally, you may enter a numeric estimate(as a decimal from 0 to 1) for scoring cer-tainty. Factors to consider when assigning acertainty score might include ones shown in“Considerations in assigning a certainlyscore to your site-specific assessment,”below. This guidance for scoring certainty isprovided to minimize the role of user person-ality, and maximize the consideration of
more objective factors, in scoring the cer-tainty for a specified indicator. The certaintyscores do not reflect overall scientific uncer-tainty underlying the use of each indicator,but rather the certainty of the user applyingthis method to a specific wetland site. Thecertainty scores should not be combinedmathematically with scores for functions,risk, condition, or value. The uncertaintyscores are intended to give an overall senseof the relative strength of the other reportedscores. They also should be used to helpprioritize collection of additional data asneeded to strengthen the results of a particu-lar assessment.
Method
Forested upland areas help protect tidal wetlands from extreme tempera-tures, erratic runoff regimes, and invasive plants.

25August 2006 – Hydrogeomorphic Assessment Guidebook for Tidal Wetlands of the Oregon Coast, Part 1 Method
Considerations in assigning a certainty score to your site-specificassessment
consideration
low certainty ( = 0)
high certainty ( = 1.0)
How much of the site were you able to view?
little, from a distance all of the site, covering all of it on foot
How many visits were you able to make—and for how long?
one visit, less than 1 hour visits at 2+ seasons (high & low runoff), at monthly highest and lowest tides, 6 hours each
What is your experience & skill with this indicator?
minimal have been trained and/or have assessed many tidal wetlands
How observable is this indicator?
subjective, varies greatly in time, or nearly invisible (e.g., contamination)
objectively measurable (e.g., tributary lengths) or reliable measured data are available from other sources

26 Hydrogeomorphic Assessment Guidebook for Tidal Wetlands of the Oregon Coast, Part 1 – August 2006Method
Tidal wetlands largely surrounded by develop-ment are often ditched or have atypical waterrunoff regimes.
27August 2006 – Hydrogeomorphic Assessment Guidebook for Tidal Wetlands of the Oregon Coast, Part 1
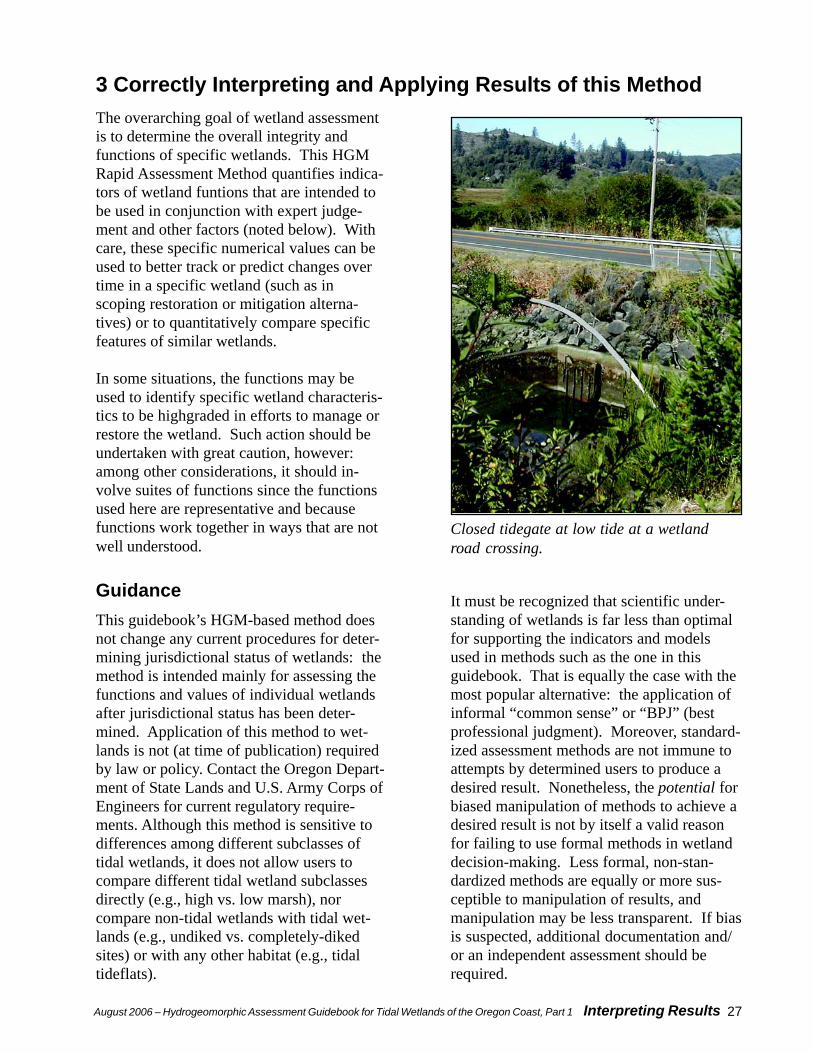
3 Correctly Interpreting and Applying Results of this Method
Closed tidegate at low tide at a wetlandroad crossing.
The overarching goal of wetland assessmentis to determine the overall integrity andfunctions of specific wetlands. This HGMRapid Assessment Method quantifies indica-tors of wetland funtions that are intended tobe used in conjunction with expert judge-ment and other factors (noted below). Withcare, these specific numerical values can beused to better track or predict changes overtime in a specific wetland (such as inscoping restoration or mitigation alterna-tives) or to quantitatively compare specificfeatures of similar wetlands.
In some situations, the functions may beused to identify specific wetland characteris-tics to be highgraded in efforts to manage orrestore the wetland. Such action should beundertaken with great caution, however:among other considerations, it should in-volve suites of functions since the functionsused here are representative and becausefunctions work together in ways that are notwell understood.
Guidance
This guidebook’s HGM-based method doesnot change any current procedures for deter-mining jurisdictional status of wetlands: themethod is intended mainly for assessing thefunctions and values of individual wetlandsafter jurisdictional status has been deter-mined. Application of this method to wet-lands is not (at time of publication) requiredby law or policy. Contact the Oregon Depart-ment of State Lands and U.S. Army Corps ofEngineers for current regulatory require-ments. Although this method is sensitive todifferences among different subclasses oftidal wetlands, it does not allow users tocompare different tidal wetland subclassesdirectly (e.g., high vs. low marsh), norcompare non-tidal wetlands with tidal wet-lands (e.g., undiked vs. completely-dikedsites) or with any other habitat (e.g., tidaltideflats).
It must be recognized that scientific under-standing of wetlands is far less than optimalfor supporting the indicators and modelsused in methods such as the one in thisguidebook. That is equally the case with themost popular alternative: the application ofinformal “common sense” or “BPJ” (bestprofessional judgment). Moreover, standard-ized assessment methods are not immune toattempts by determined users to produce adesired result. Nonetheless, the potential forbiased manipulation of methods to achieve adesired result is not by itself a valid reasonfor failing to use formal methods in wetlanddecision-making. Less formal, non-stan-dardized methods are equally or more sus-ceptible to manipulation of results, andmanipulation may be less transparent. If biasis suspected, additional documentation and/or an independent assessment should berequired.
Interpreting Results

28 Hydrogeomorphic Assessment Guidebook for Tidal Wetlands of the Oregon Coast, Part 1 – August 2006
The consistency of results produced by thismethod among various independent users–with various levels of expertise, local knowl-edge, and training–has not been tested.Although every effort has been made in theselection and wording of indicators to createa rapid method that should provide accept-ably consistent results among unbiased users,all methods that rely on casual observation ofnonparametric indicators, rather than directmeasurement of natural phenomena, tend tobe imprecise. (In other words, while we didour best to pick sound indicators, anythingeasy to measure will likely not be veryprecise.) There exists no widely acceptedstandard of “adequate” consistency, and thisshould depend partly on the applicationobjective. Perhaps this issue is better statedas: “Is a new method more consistent andaccountable than the current method?”–thecurrent method often being solely the appli-cation of unstandardized personal judgmentsby diverse specialists.
The function indicators and scoring modelspresented in this guidebook are based on theauthor’s experience and interpretation ofscientific literature, as well as on the opin-ions of experts who attended DSL-sponsoredworkshops during development of themethod. The models (largely constructed ofindependent variables) do not measure actualprocesses or describe the statistical probabil-ity of a function occurring. They are notdeterministic equations, dynamic simulationmodels, statistical probability models, orother mathematical representations of pro-cesses taking place. The scoring models arenumeric representations of systematic quali-tative constructs and are intended to assist aspecific decision-making context. Thus, thescoring models are conceptually quite similarto models economists use to illustrate theeconomy that are based on leading economicindicators.
As is true of all other rapid assessmentmethods applicable to this region, thisguidebook’s scoring models and their indica-tors have not been validated. The time andcost of making the measurements necessaryto fully determine the model’s accuracywould be exorbitant. Nonetheless, the lackof indicator validation, as well as uncertaintyregarding repeatability of results, are not bythemselves sufficient reasons to avoid usingthis method; the alternative–relying entirelyon unstructured judgments of wetland tech-nicians–is not demonstrably better. Whenproperly applied, the models and their indi-cators are believed to adequately describerelative levels of function among sites, aswell as make some wetland decision-makingprocesses more standardized, accountable,and technically complete. Results of anyfuture scientific studies of functions of theregion’s tidal wetlands should be reviewedcarefully and often for ideas for indicatorsthat may improve upon ones now used.
It is recognized that this guidebook’s methodwill often need to be used at seasons or timesof day when conditions are less than ideal forthe required observations. Moreover, it isrecognized that the “snapshot” kind ofportrayal of a site obtained during a singlevisit is unlikely to adequately assess thelong-term natural disturbance regimes thatensure the viability of many sites and theirfunctions. Many indicators change to somedegree depending on the time of day, month,and year. These temporal changes poten-tially confound the interpretation of datafrom multiple sites visited at different times,and ultimately complicate the use of the datafor describing reference standard conditions.Indicators that describe plant species compo-sition and percent cover are especially likelyto vary within the sampling window (Junethrough September), and indicators such assalinity will vary greatly within a site duringa tidal cycle.
Interpreting Results

29August 2006 – Hydrogeomorphic Assessment Guidebook for Tidal Wetlands of the Oregon Coast, Part 1
Formerly diked wetlands whose tidal circulation isrestored often pond water for longer periods each tidalcycle because their substrate has subsided to a lowerelevation.
Some indicators tend to correlatestrongly with the size of the marsh.Because function indices that use theseindicators may later be multiplied bymarsh area, the correlation of theseindicators with marsh area needs to be“factored out” or marsh area will implic-itly be double-counted. We have at-tempted to accomplish this by applyingparticular statistical procedures to thedata, and reflecting this in the manner inwhich the rapid method is configured inthe spreadsheet and in this document.These adjustment procedures and theirapplications are described further in Part2 (Science Review and Data AnalysisResults for Tidal Wetlands of the Or-egon Coast).
As noted elsewhere, the number of functionsthat wetlands perform far exceeds thosedescribed in this guidebook (see Adamus2001b for further discussion of this), so theguidebook focuses on a few that are easiestto assess in the short time periods requiredby the wetland permitting process.
The numeric scores should not be used alonewith expert judgment because the scoresreflect only a subset of factors vital todecisions about wetlands. In addition toexpert judgment and the functions andvalues from this method, factors that must beweighed in many wetland decisions, butwhich are addressed only partly or not at allby this method, include—
• availability of alternatives for the pro-posed development (potential for impactavoidance)
• availability and cost of appropriatenearby sites for compensatory mitigation
• intrinsic sensitivity of the site to naturaland human-related disturbance
• cost of any measures required to main-tain a wetland over time
• navigability of the site, or if the site isitself legally considered non-navigable,its perceptible influence on aquatic life(or other “uses” designated by the state)in nearby navigable waters
• relative contribution of the site’s floraand fauna to regional biodiversity
• special legal status of any of the site’sspecies
• actual or potential ability of the site toproduce timber, crops, fur, or othermarketable products
• recreational, open space, aesthetic, oreducational use of the site
• status of the site as a natural hazard area
• status of the site as a hazard or potentialhazard due to known accumulations ofchemical wastes
• existence of a conservation easement,deed restriction, local zoning designa-tion, or other legal instrument that limitsor allows particular uses of the site and/or its contributing watershed
• percent of total site acreage potentiallyaffected by a proposed alteration, andlocation of impacts within the site
Interpreting Results

30 Hydrogeomorphic Assessment Guidebook for Tidal Wetlands of the Oregon Coast, Part 1 – August 2006
• the magnitude of the proposed alteration,after accounting for the likely reliabilityof its impact minimization strategies
• technical “replaceability” or “manage-ability” of the site’s functions
• likelihood of compensatory mitigationbeing physically and biologically suc-cessful
• potential for the alteration to create apublic nuisance (directly, or through lossof wetland functions) either on-site or(especially) off-site
• potential for the alteration to imposeunreasonable burdens on local infrastruc-ture
• potential for cumulative impacts (e.g.,consideration of local loss rate of thissubclass of wetland)
• rules and policies of agencies involved inreviewing permit applications
Despite the limitations noted here,this method is believed to be one ofonly a few that expresses the bestavailable science in the format of asemi-quantitative rapid assessmentmethod. Draft versions of the methodwere reviewed by several wetlandscientists and were tested by manyusers. The method is the only rapidmethod applicable to Oregon thatdirectly incorporates reference datacollected from Oregon tidal marshes.It provides a structured means forconsidering many factors believedimportant to the condition and func-tions of tidal marshes, and can serveas a tool for educating resourcemanagers having limited experiencewith some tidal marsh functions.
Interpreting Results
31August 2006 – Hydrogeomorphic Assessment Guidebook for Tidal Wetlands of the Oregon Coast, Part 1
Evaluating the HGM Method
The Oregon Department of State Landswelcomes feedback on how well the processand application of this HGM Rapid Assess-ment Method fulfills wetland managementneeds. Specific comments and input shouldbe directed to:
Janet Morlan, Wetlands Program ManagerOregon Department of State Lands775 Summer St. NE, Ste. 100Salem, OR 97301-1279phone: (503) 378-3805, ext. 236email: [email protected]
Interpreting Results
Scores generated by this method, as well asthe data from its accompanying referencedatabases, have several potential applicationsfor both regulatory and non-regulatoryprograms. The questions they can helpaddress include, but are not limited to—
• What effect might restoring or enhancingthe natural structure in a degraded marsh(by improving circulation, adding woodto its channels, etc.) have on the marsh’sfunctions?
• Which of several tidal marshes has likelysuffered the most degradation of itsfunctions, and therefore might benefit themost from restoration or enhancement?
• Which of several tidal marshes has likelysuffered the least degradation of itsfunctions, and therefore might be the bestchoice for conservation or to use as areference site?
• Should a permit application for alterationof a tidal marsh be denied altogether, orwill a proposed tidal marsh mitigationproject located elsewhere adequatelycompensate for loss of its functions?
• What is a realistic “target” orperformance standard for plant speciesrichness in a restored low marsh onsandy substrate on the outer coast?
• To inform the design of a tidal channelbeing created as part of a marshrestoration project, what channeldimensions have been found to be typicalof natural marshes in similar situationson the Oregon Coast?
• What proportion of the tidal marshes in aparticular watershed or estuary is at highrisk of long-term degradation?
• In terms of capacity to perform each ofthe 12 identified functions, how does thistidal marsh rank when compared with120 others that were already sampled onthe Oregon Coast?
• Over many years’ time, which functionsare probably increasing or decreasing asa result of structural changes made to agiven tidal marsh and its surroundings?
Agencies and consultants have already begunusing test versions of this method to examinesome of these questions.
Applying the Results of the HGM Method

32 Hydrogeomorphic Assessment Guidebook for Tidal Wetlands of the Oregon Coast, Part 1 – August 2006Literature Cited
4 Literature Cited
Adamus, P.R. 1983. A Method for Wetland Functional Assessment. Vol. II. Methodology. Report No. FHWA-IP-82-24. Federal Highway Administration; Washington, D.C.
Adamus, P.R. 2001a. Guidebook for Hydrogeomorphic (HGM)–based Assessment of Oregon Wetland and RiparianSites. I. Willamette Valley Ecoregion, Riverine Impounding and Slope/Flat Subclasses. Volume IB: Technical Report.Oregon Division of State Lands; Salem, OR.
Adamus, P.R. 2001b. Guidebook for Hydrogeomorphic (HGM)–based Assessment of Oregon Wetland and RiparianSites. Statewide Classification and Profiles. Oregon Division of State Lands; Salem, OR.
Adamus, P.R. and D. Field. 2001. Guidebook for Hydrogeomorphic (HGM)–based Assessment of Oregon Wetlandand Riparian Sites. I. Willamette Valley Ecoregion, Riverine Impounding and Slope/Flat Subclasses. Volume IA:Assessment Methods. Oregon Division of State Lands; Salem, OR.
Brinson, M.M. 1993. A Hydrogeomorphic Classification of Wetlands. Tech. Rept. WRP-DE-4. US Army Corps ofEngineers Waterways Exp. Stn.; Vicksburg, MS.
Brophy, L. 2005. Estuary assessment. Oregon Watershed Assessment Manual. Oregon Watershed EnhancementBoard; Salem.
Collins, J.N., E. Stein, and M. Sutula. 2004. California Rapid Assessment Method for Wetlands. Report to theUSEPA, Region 9; San Francisco, CA.
Costanza, R., R. d’Arge, R. de Groot, S. Farber, M. Grasso, B. Hannon, K. Limburg., S.Naeem, R. O’Neill, J. Paruelo.,R. Raskin, P. Sutton, and M. van den Belt. 1997. The value of the world’s ecosystem services and natural capital.Nature 387:253-260.
Cowardin, L.M., V. Carter, F.C. Golet, and E.T. LaRoe. 1979. Classification of Wetlands and Deepwater Habitats ofthe United States. U.S. Fish and Wildlife Service, Office of Biological Services, Biological Services Program FWS/OBS-79/31.
Giannico, G., and J. A. Souder. 2004a. The Effects of Tide Gates on Estuarine Habitats and Migratory Fish. SeaGrant Publication ORESU-G-04-002. COAS, Oregon State Univ.; Corvallis.
Giannico, G., and J. A. Souder. 2004b. Tide Gates in the Pacific Northwest: Operation, Types, and EnvironmentalEffects. Sea Grant Publication ORESU-T-05-001. COAS, Oregon State Univ.; Corvallis.
Good, J.W. 2000. Summary and current status of Oregon’s estuarine systems. pp. 33-44 in: Oregon State of theEnvironment 2000 Report. Oregon Progress Board; Salem.
Good, J.W. and C.B. Sawyer. 1998. Recommendations for a Non-regulatory Wetland Restoration Program forOregon. Oregon Sea Grant Publication No. ORESU-O-98-001. Oregon Sea Grant; Corvallis.
Hamilton, S.F. 1984. Estuarine Mitigation: The Oregon Process. Oregon Division of State Lands; Salem.
Hughes, R.M., S. Howlin, and P.R. Kaufmann. 2004. A biointegrity index for coldwater streams of western Oregonand Washington. Transactions of the American Fisheries Society 133:1497-1515.

33August 2006 – Hydrogeomorphic Assessment Guidebook for Tidal Wetlands of the Oregon Coast, Part 1 Literature Cited
Hruby, T., K. Bruner, S. Cooke, K. Dublonica, R. Gersib, T. Granger, L. Reinelt, K. Richter, D. Sheldon, A. Wald, andF. Weinmann. 1999. Methods for Assessing Wetland Functions. Vol. I: Riverine and Depressional Wetlands in theLowlands of Western Washington. Ecology Publication 99-115. Washington Dept. of Ecology; Olympia, WA.
Mitchell, D.L. 1981. Salt marsh re-establishment following dike breaching on the Salmon River Estuary, Oregon.Thesis, Oregon State Univ.; Corvallis.
Morlan, J. 2000. Summary of current status and health of Oregon’s freshwater wetlands. pp. 45 – 52 In: OregonState of the Environment 2000 Report. Oregon Progress Board; Salem.
National Oceanic and Atmospheric Administration (NOAA). 1985. National Estuarine Inventory: Data Atlas,Volume 1: Physical and Hydrologic Characteristics. Rockville, MD: Strategic Assessment Branch, OceanAssessments Division. 103 pp.
National Research Council. 2001. Compensating for Wetland Losses Under the Clean Water Act. National AcademyPress; Washington, D.C.
Neckles, H.A., M. Dionne, D.M. Burdick, C.T Roman, R. Buchsbaum, and E. Hutchins. 2002. A monitoring protocolto assess tidal restoration of salt marshes on local and regional scales. Restor. Ecol. 10:556-563.
Seliskar, D.M. and J.L. Gallagher. 1983. The Ecology of Tidal Marshes of the Pacific Northwest Coast: A CommunityProfile. FWS/OBS-82/32. U.S. Fish and Wildlife Service; Washington, DC.
Shafer, D.J. and D.J. Yozzo. 1998. National Guidebook for Application of Hydrogeomorphic Assessment to TidalFringe Wetlands. Tech. Rep. WEP-DE-16. US Army Corps of Engineer Waterway Experiment Station; Vicksburg,MS.
Shafer, D.J., B. Herczeg, D. Moulton, A. Sipocz, K. Jaynes, L. Rozas, C. Onuf, and W. Miller. 2002. RegionalGuidebook for Application of Hydrogeomorphic Assessments to Northwest Gulf of Mexico Tidal Fringe Wetlands. USArmy Corps of Engineer Waterway Experiment Station; Vicksburg, MS.
Smith, R.D. 1993. A Conceptual Framework for Assessing the Functions of Wetlands. Tech. Rep. WRP-DE-3,Waterways Exp. Stn., US Army Corps of Engineers; Vicksburg, MS.
Smith, R. D. 2001. Hydrogeomorphic Approach to Assessing Wetland Functions: Guidelines for DevelopingRegional Guidebooks - Chapter 3, Developing a Reference Wetland System, ERDC/EL TR-01-29, U.S. Army EngineerResearch and Development Center; Vicksburg, MS.
Smith, R.D., A. Ammann, C. Bartoldus, and M.M. Brinson. 1995. An Approach for Assessing Wetland FunctionsUsing Hydrogeomorphic Classification, Reference Wetlands, and Functional Indices. Tech. Rept. WRP-DE-9,Waterways Exp. Stn., US Army Corps of Engineers; Vicksburg, MS.
Smith, R. D. and Wakeley, J. S. 2001. Hydrogeomorphic Approach to Assessing Wetland Functions: Guidelines forDeveloping Regional Guidebooks - Chapter 4, Developing Assessment Models, ERDC/EL TR-01-30, U.S. ArmyEngineer Research and Development Center; Vicksburg, MS.
Teal, J.M. 1962. Energy flow of a salt marsh ecosystem of Georgia. Ecology 43:614-624.
Thom, R.M. 1992. Accretion rates of low intertidal salt marshes in the Pacific Northwest. Wetlands 12:147-156.
Zedler, J.B. and R. Lindig-Cisneros. 2000. Functional equivalency of restored and natural salt marshes. pp. 569-582in: M.P.Weinstein and D.A. Kreeger (eds.). Concepts and Controversies in Tidal Marsh Ecology. Kluwer AcademicPublishers; Boston.

34 Hydrogeomorphic Assessment Guidebook for Tidal Wetlands of the Oregon Coast, Part 1 – August 2006
Data F
orm
A1. R
apid
Ind
icators o
f Risks to
Tidal W
etland
Integ
rity and
Su
stainab
ility
Ap
pen
dix A
. Data F
orm
s
This form
primarily assesses “stressors,” indicators of the risk a tidal w
etland may face from
various types of degradation usu ally associatedw
ith human activities. T
hese stressors have the potential in some situations to dim
inish wetland integrity. Specifically, they can reduce the
ability of a wetland to m
aintain a balanced, integrated, adaptive comm
unity of organisms w
ith a species composition, diversity, and func-
tional organization that compares w
ell to unaltered habitat of the Oregon C
oast. A w
etland may be considered to have high integrity w
hen allof its characteristic processes and parts are intact and functioning w
ithin their natural ranges of variation. After entering the appropriate
score in each box of this field form, enter your scores into the accom
panying spreadsheet, assign weights to the indicators if desired, and
compute the score for R
isk. When assessing these stressors, do not take into account their potential for being reversed. T
he “sustainability”of w
etland sites is assumed to be low
est when they are at greatest risk. W
hen combined w
ith other information, risk assessm
ent s such as thisare useful not only for assessing w
etland integrity and function, but also for helping prioritize sites for restoration based on a site’s likelihoodof having been ecologically degraded. O
ther factors, such as the wetland’s intrinsic sensitivity, scarcity, geom
orphic resilie nce, and landow
nerships, should also be considered when prioritizing restoration.
©2006 H
GM
Guidebook
Ap
pen
dix A
Hydrogeom
orphic Assessm
ent Guidebook for T
idal Wetlands of the O
regon Coast, P
art 1 – August 2006
Appendix A
. Data F
orm A
1, Intro
.

35August 2006 – Hydrogeomorphic Assessment Guidebook for Tidal Wetlands of the Oregon Coast, Part 1
Wet
lan
d S
ite
Nam
e: _
__
__
__
__
__
__
__
__
__
__
__
__
__
__
__
__
__
_
Dat
e:_
__
__
__
__
__
_
Tim
e B
egin
:__
__
__
__
T
ime
En
d:
__
__
__
_
Ass
esso
r: _
__
__
__
__
__
__
__
__
__
__
__
__
__
__
__
__
__
__
_
To
tal
Mar
sh T
ran
sect
Len
gth
(co
mb
ined
): _
__
__
__
m
Est
imat
ed P
osi
tio
n o
f th
e as
sess
ed u
nit
in
th
e es
tuar
y:
nea
r o
cean
(lo
wer
on
e-th
ird
): _
__
__
_
mid
: _
__
__
_
nea
r m
ajo
r h
ead
-of-
tid
e (u
pp
er o
ne-
thir
d):
__
__
__
E
stim
ated
HG
M a
reas
in t
he
asse
ssed
un
it:
Mar
ine-
sou
rced
Hig
h M
arsh
: _______%
M
arin
e-so
urc
ed L
ow M
arsh
: ______%
R
iver
-sou
rced
Tid
al W
etla
nd
: _
__
__
__
%
cod
e in
dic
ato
r sc
ale/
sco
re
gu
idan
ce
1.
Bu
ffA
lt
Rel
ativ
e bu
ffer
bet
wee
n th
e w
etla
nd a
nd u
plan
d ar
eas.
C
alcu
late
: A
* (
B +
C).
[F
or
exam
ple
, fo
r A
, B
, C
bel
ow
, ca
lcula
te
2 x
(1 +
3)
= 8
.]
Scr
een t
he
resu
ltin
g c
alcu
lati
on w
ith t
he
scal
e on t
he
right
[ex:
8 =
0.3
], t
hen
ente
r th
e sc
ore
in t
he
box.
O
pti
onal
ly,
also
ente
r an
est
imat
e of
cert
ainty
(0 t
o 1
).
A)
Wit
hin
100
ft
of
the
wet
land
’s e
dg
e w
ith
ad
join
ing u
pla
nd
, th
e %
of
the
up
lan
d t
hat
con
tain
s p
avem
ent,
bu
ild
ing
s, o
r o
ther
bar
e su
bst
rate
:
% u
pla
nd
as
des
crib
ed
scal
e <
5 %
1
5-1
4 %
2
15 –
24
%
3 25-4
9 %
4
>50 %
5
wet
land o
ccupie
s nea
rly a
ll o
f an
isl
and,
and
non
e of
the
isla
nd i
s d
evel
op
ed
0
B)
Wit
hin
100 f
t of
the
wet
land’s
edg
e, t
he
pre
dom
inan
t el
evat
ion o
f th
e port
ion o
f th
e upla
nd t
hat
is
mo
st-d
istu
rbed
(p
aved
, la
nd
scap
ed, o
ver
gra
zed
, o
r b
are)
:
p
red
om
inan
t el
evat
ion
sc
ale
< 2
0 f
t h
igh
er t
han
wet
lan
d
1 20-5
0 f
t hig
her
2
>5
0 f
t h
igh
er
3 C
) W
ith
in 1
00
ft
of
the
wet
land
’s e
dg
e, t
he
sub
stra
te p
red
om
inat
ing
in t
he
po
rtio
n o
f th
e u
pla
nd t
hat
is
mo
st-d
istu
rbed
(p
aved
, la
nd
scap
ed, o
ver
gra
zed
, o
r b
are)
:
pre
do
min
ant
sub
stra
te
scal
e lo
am,
silt
, cl
ay
1 fi
ne,
san
dy s
oil
2
coar
se s
and (
min
imal
org
anin
lay
er),
fil
l, p
avem
ent,
or
rock
3
Scr
een t
he
resu
ltin
g c
alcu
lati
on w
ith
the
scal
e on t
he
right,
then
in
th
e box e
nte
r th
e sc
ore
and
opti
onal
ly a
n e
stim
ate
of
cert
ainty
(0 t
o 1
).
0
= 0
.01
1-2
= 0
.1
3
-6 =
0.2
7-9
= 0
.3
10
-12
= 0
.4
13
-15
= 0
.5
16
-18
= 0
.6
19
-21
= 0
.7
22
-24
= 0
.8
25
-27
= 0
.9
>
27
= 1
.0
sc
ore
#1:
ce
rtai
nty
#1:
With
in 1
00 ft
= t
he
per
cen
t w
ith
in t
he
enti
re a
rea
that
is
up
land a
nd w
ithin
1
00
ft.
of
the
wet
lan
d-u
pla
nd
ed
ge.
D
o n
ot
incl
ude
the
tidal
wet
land
itse
lf,
but
non-t
idal
wet
lands
may
be
incl
ud
ed a
s p
art
of
that
zo
ne.
M
easu
re t
he
100 f
t hori
zonta
lly f
rom
th
e w
etla
nd’s
upper
lim
it o
f an
nual
ti
dal
flo
odin
g (
hig
hes
t ti
de)
.
Exte
nd t
he
100 f
t li
mit
to 3
00 f
t if
a
per
enn
ial
fres
hw
ater
tri
bu
tary
flo
ws
thro
ugh t
he
wet
land,
i.e.
, 100 f
t on
eith
er s
ide
of
the
trib
uta
ry c
han
nel
, up
to 3
00 f
t aw
ay.
Use
d f
or:
R
A.*
*
see
pag
e 2
3 o
r A
pp
end
ix A
fo
r ab
bre
via
tio
ns
sco
re #
1:
cert
ain
ty #
1:
©20
06 H
GM
Gui
debo
okP
age
1/7
Hyd
roge
omor
phic
Ass
essm
ent G
uide
book
for T
idal
Wet
land
s of
the
Ore
gon
Coa
st, P
art 1
– A
ugus
t 200
6A
ppen
dix
A. D
ata
For
m A
1

36 Hydrogeomorphic Assessment Guidebook for Tidal Wetlands of the Oregon Coast, Part 1 – August 2006
©2006 H
GM
GuidebookP
age 2/7H
ydrogeomorphic A
ssessment G
uidebook for Tidal W
etlands of the Oregon C
oast, Part 1 – A
ugust 2006A
ppendix A. D
ata Form
A1
cod
e in
dicato
r scale/sco
re g
uid
ance
2. C
hem
In
Max
imu
m risk
of th
e wetlan
d b
eing ex
posed
to chem
ical pollutants (exclu
din
g nutrients).
Calcu
late: T * (L
+ E
). [For ex
ample, 0
x (1
+ 1
) = 0
] where:
T T
oxic
ity scale
no p
ollu
tant so
urces lik
ely in
nearb
y ru
noff,
gro
undw
ater, or su
rface water; n
o h
istory
of recen
t sp
ills reachin
g th
e wetlan
d
0
som
e po
llutan
ts 1
L M
aximum
Lo
ad (of contam
inants) scale
diffu
se (distan
t sou
rce), or in
frequ
ent
( severe sto
rms o
nly
) 1
con
centrated
(nearb
y so
urce) o
r frequ
ent
2
E M
aximum
Exte
nt (of contam
inants) scale
limited
(only
a small %
of th
e wetlan
d is lik
ely
t o b
e exposed
to th
e chem
ical) 1
mo
st of w
etland
cou
ld b
e exp
osed
2
Com
pare th
e result w
ith th
e scale at the rig
ht to
determ
ine th
e score.
0
= 0
.01
2
= 0
.33
3
= 0
.66
4
= 1
.00
score #2:
certainty #2:
Toxicity = p
ollu
tants in
clude su
bstan
ces poten
tially h
armfu
l to
plan
ts or an
imals an
d p
resent w
ell above an
y n
atural
back
gro
und lev
el. Load
= ru
noff lo
ad o
f contam
inan
ts will d
epen
d p
artly o
n size,
slope, an
d so
il type o
f the co
ntrib
utin
g area; co
nsid
er annual
max
imu
m fo
r a no
rmal y
ear. E
xtent = “lim
ited” w
ould
apply
if surface w
ater travels o
nly
in
a single in
ternal ch
ann
el, or if th
e only
contam
inan
t source is
at a localized
spo
t alon
g th
e up
land
edg
e. “C
ertainty
” sho
uld
norm
ally b
e scored
very
low
for th
is in
dicato
r. If measu
red d
ata are availab
le, you m
ay u
se it to
info
rm co
mp
on
ents (T
) and
(L).
Used
for: R
A, In
v, A
fish, M
fish, R
fish, [N
FW
, Sb
ird,
Lbird
M].
3. N
utrIn
M
axim
um
risk o
f nutrient overload in
the w
etland
. C
alculate: S
* (L
+ E
) Fo
r exam
ple, 1
x (1
+ 2
) = 3
wh
ere:
S S
ou
rce
Typ
e scale
no
abn
orm
al sou
rces 0
min
or p
oten
tial or k
no
wn
sou
rce of n
itrog
en o
r p
ho
sphoru
s 1
majo
r po
tential o
r kn
ow
n so
urce o
f nitro
gen
or
pho
sphoru
s 2
L
Maxim
um L
oad (of nutrients)
scale
diffu
se or d
iluted
(distan
t sou
rce), or in
frequ
ent
1 co
ncen
trated (n
earby
sou
rce) or freq
uen
t 2
E
Maxim
um E
xte
nt
scale only
a small %
of th
e wetlan
d is lik
ely to
receive
inputs d
ue to
its relative elev
ation &
oth
er factors
1
no
t localized
2
Com
pare th
e result w
ith th
e scale at the rig
ht to
determ
ine th
e score.
0
= 0
.01
2
= 0
.33
3
= 0
.66
4
= 1
.00
score #3:
certainty #3:
Minor so
urce ty
pe =
wid
ely-scattered
ho
uses, law
ns, lo
w-
den
sity g
razing, p
arkin
g lo
ts, exten
sive stan
ds o
f alder,
recently
bu
rned
or lo
gg
ed areas, an
d/o
r occasio
nal larg
e boat
traffic. M
ajor source ty
pe =
neig
hborh
oods (n
ot o
n sew
er lines),
exten
sive co
ncen
trated g
razing
, waste treatm
ent p
lant efflu
ent,
man
y m
alfun
ction
ing
septic sy
stems, an
d/o
r bo
atyard
s, h
arbo
rs. Load
, Extent: see ab
ove.
If measu
red d
ata are availab
le, yo
u m
ay u
se it to in
form
co
mp
on
ents (S
) and
(E).
Used
for: R
A, A
Pro
d, D
ux, [W
Q, X
pt, In
v, A
fish, M
fish,
Rfish
, NF
W, S
bird
, Lbird
M].
score #3:
certainty #3:
score #2:
certainty #2:

37August 2006 – Hydrogeomorphic Assessment Guidebook for Tidal Wetlands of the Oregon Coast, Part 1
©20
06 H
GM
Gui
debo
okP
age
3/7
Hyd
roge
omor
phic
Ass
essm
ent G
uide
book
for T
idal
Wet
land
s of
the
Ore
gon
Coa
st, P
art 1
– A
ugus
t 200
6A
ppen
dix
A. D
ata
For
m A
1
cod
e in
dic
ato
r sc
ale/
sco
re
gu
idan
ce
4.
Sed
Sh
ed
Inco
min
g f
ine-
sed
imen
t o
verl
oad
.
As
a re
sult
of
hum
an a
ctiv
itie
s ou
tsid
e th
e w
etla
nd, se
dim
ent
load
s re
achin
g t
he
wet
lan
d a
re c
urr
entl
y (
sele
ct o
ne)
:
sed
imen
t lo
ads
sco
re
m0.
ost
ly n
orm
al f
or
the
wet
land’s
subcl
ass
and
loca
tio
n i
n t
he
estu
ary
01
so an0.
mew
hat
abov
e no
rmal
for
the
wet
land’s
subcl
ass
d l
oca
tion i
n t
he
estu
ary, due
to a
ccel
erat
ed e
rosi
on
up
slop
e, u
pri
ver
, o
r al
on
gsh
ore
50
m1.
uch
abov
e no
rmal
for
the
wet
land’s
subcl
ass
and
loca
tion i
n t
he
estu
ary, due
to a
ccel
erat
ed e
rosi
on
up
slop
e, u
pri
ver
, o
r al
on
gsh
ore
00
sc
ore
#4:
cert
ain
ty #
4:
Ignore
th
e w
etla
nd’s
abil
ity t
o t
rap w
hat
ever
sed
imen
t ar
riv
es—
con
sid
er o
nly
its
ex
po
sure
to
ele
vat
ed s
edim
ent
load
s.
Pote
nti
al s
ourc
es i
ncl
ud
e: e
rodin
g b
anks,
logged
or
burn
ed
area
s, m
inin
g (
espec
iall
y g
ravel
, pla
cer)
, ro
ads,
fre
quen
t d
red
gin
g,
liv
esto
ck, A
TV
s.
Co
nsi
der
pro
xim
ity
, ex
ten
t,
slope,
su
bst
rate
type,
an
d n
um
ber
of
yea
rs t
o r
ecover
. “N
orm
al”
for
a w
etla
nd n
ear
the
estu
ary m
outh
may
be
a g
reat
er l
oad
than
fo
r a
wet
lan
d n
ear
hea
d-o
f-ti
de,
bec
ause
lo
ad i
ncr
ease
s dow
nst
ream
even
in p
rist
ine
estu
arie
s.
Use
d f
or:
R
A, In
v,
[Afi
sh,
Mfi
sh,
Rfi
sh,
NF
W, S
bir
d,
Lbir
dM
].
5.
So
ilX
On
site
so
il d
istu
rban
ce.
How
mu
ch o
f th
e as
sess
men
t unit
(only
the
par
t th
at i
s st
ill
wet
land)
has
bee
n
affe
cted
by
on
go
ing
or
pas
t er
osi
on
/ co
mp
acti
on
cau
sed
dir
ectl
y b
y h
uman
ac
tivi
ties
.
no
ne
1- 1
0%
10-5
0%
>50%
o
ng
oin
g
0
2
3
4
his
tori
cal b
ut
still
ap
par
ent
0
1
2
3
Sel
ect
on
e n
um
ber
fro
m e
ach
ro
w. T
hen
su
m t
he
two
cho
sen
nu
mb
ers
and
ap
ply
th
e sc
ale
on t
he
right
to d
eriv
e th
e sc
ore
.
0
= 0
.01
1
= 0
.1
2 =
0.2
3
= 0
.3
4 =
0.4
5
= 0
.6
6 =
0.8
7
= 1
.0
sc
ore
#5:
ce
rtai
nty
#5:
Pote
nti
al d
istu
rban
ces
wit
hin
th
e w
etla
nd i
ncl
ude:
li
ves
tock
, A
TV
s, r
esto
rati
on a
ctiv
itie
s, s
ubsi
den
ce
asso
ciat
ed w
ith d
ikin
g, dit
ches
, fi
lls,
log s
tora
ge.
C
onsi
der
ex
tent
and s
ever
ity.
In
fer
pas
t lo
g s
tora
ge
fro
m h
isto
rica
l ae
rial
ph
oto
gra
ph
s,
loca
l co
nta
cts,
pre
sen
ce n
earb
y o
f old
pil
ings,
and
par
tial
ly-b
uri
ed c
ut
logs.
In
fer
lives
tock
fro
m p
rese
nce
of
fen
ces,
or
loca
l k
no
wle
dg
e.
Use
d f
or:
R
A, A
Pro
d, W
Q, [X
pt,
Inv, A
fish
, M
fish
, R
fish
, N
FW
, S
bir
d,
Lb
ird
M].
sco
re #
5:
cert
ain
ty #
5:
sco
re #
4:
cert
ain
ty #
4:

38 Hydrogeomorphic Assessment Guidebook for Tidal Wetlands of the Oregon Coast, Part 1 – August 2006
cod
e in
dicato
r sco
re g
uid
ance
6. D
ikeDry
Deg
ree the area th
at is still wetlan
d (an
d in
cludin
g its in
ternal ch
annels)
beco
mes drier (i.e., m
uted
tidal flo
odin
g) as a resu
lt of d
itches o
r the
installatio
n o
f dik
es, tideg
ates, culv
erts, and o
ther artificial co
nstrictio
ns.
score
no
such
alteration
s, and
no changes ob
served
0.01
floo
din
g fro
m tid
e or ru
no
ff occu
rs less often
as a resu
lt of th
e alterations—
noneth
eless, nearly
all areas w
ithin
the w
etland
that p
revio
usly
were
flooded
by d
aily tid
es continue to flood daily
0.33
som
e areas that p
revio
usly
were flo
od
ed b
y d
aily
tides o
r up
land ru
no
ff no longer flood daily, b
ut
are still tidal w
etland; d
urin
g m
onth
ly lo
w tid
es, th
ere is mu
ch less w
ater in th
e wetlan
d th
an
prev
iously
0.66
daily
tidal circulation has been eliminated
from
all b
ut a sm
all part o
f the w
etland
; severe red
uctio
n
in freq
uen
cy, d
uratio
n, an
d d
epth
of d
aily an
d
mo
nth
ly h
igh
/low
tide
1.00
Note: F
or m
any d
iked
wetlan
ds, th
e appro
priate sco
re will b
e 0.6
6.
sco
re #6:
certain
ty #6:
Wh
ere histo
rical data are lack
ing
, con
sider “d
rier” relativ
e to n
earby u
naltered
wetlan
ds o
f about th
e same
elevatio
n &
size. Wetlan
ds receiv
ing little u
plan
d ru
noff
or g
roundw
ater seepag
e are especially
vuln
erable to
this
conditio
n w
hen
they
are di k
ed. M
ainly
inclu
de
constrictio
ns w
ithin
or alo
ng th
e uplan
d o
r water ed
ge o
f th
e wetlan
d. In
rare instan
ces decreased
onsite flo
odin
g
may
be attrib
uted
to p
resence o
f up
river d
ams, w
ater d
iversio
ns, o
r dred
gin
g (d
ee pen
ing
) of estu
ary m
ou
ths.
Ignore d
ryin
g d
ue to
geo
log
ic uplift o
r to sed
imen
t-related
increases in
elevatio
n o
f marsh
surface, b
ut
inclu
de d
ryin
g if d
ue to
sedim
ent b
lock
age o
f surface
water in
pu
ts. As tim
e allow
s, use p
roced
ures d
escribed
b
y B
roph
y (2
00
5) fo
r locatin
g tid
egates.
Used
for: R
A.
7. D
ikeWet
Deg
ree this w
etland
and
/or its ch
ann
els beco
mes w
etter (mo
re po
nd
ing
) as a resu
lt of in
stallation o
f dik
es, tideg
ates, culv
erts, ditch
es, and o
ther artificial
constrictio
ns o
r excav
ations, in
cludin
g su
bstrate co
mp
action an
d su
bsid
ence
associated
with
these.
score
no
such
alteration
s, and
no changes ob
served
0.01
som
e areas with
in th
e wetlan
d n
ow
floo
d m
ore
often
, longer, o
r mo
re exten
sively
as a result o
f alteratio
ns, but only at m
onthly high (spring) tide an
d/o
r du
ring
heav
y p
recipitatio
n
0.33
som
e areas with
in th
e wetlan
d n
ow
flood m
ore
often
, lon
ger, o
r mo
re exten
sively
and this is noticeable each day
; and
/or u
plan
d ru
noff is
noticeab
ly im
pounded
with
in th
e wetlan
d at v
arious
times as a resu
lt of th
e alteration
s
0.66
mu
ch o
f the site rem
ains flooded long after daily
high tide; and
/or m
ajor in
crease in flo
od
ing as a
result o
f sedim
ent su
bsid
ence fo
llow
ing
dik
ing
1.00
Note: F
or m
any d
iked
wetlan
ds, th
e appro
priate sco
re will b
e 0.6
6.
sco
re #7:
certain
ty #7:
Do
no
t inclu
de d
ike b
reachi n
g o
r remo
val th
at mad
e the
site wetter (su
ch as th
at evid
enced
by d
ead trees).
Where h
istorical d
ata are lackin
g, co
nsid
er “wetter”
relative to
nearb
y u
naltered
wetlan
ds o
f about th
e same
elevatio
n. D
iked
wetlan
ds are esp
ecially v
uln
erable to
th
is con
ditio
n if th
ey h
ave p
erenn
ial tribu
taries, direct
storm
water in
pu
ts, or seep
s/wetlan
ds alo
ng th
eir uplan
d
edg
e. In rare in
stances in
creased o
nsite flo
od
ing
may
be
attributed
to in
creased ru
noff fro
m p
avem
ent, in
puts
from
offsite d
itches, o
r recent clearcu
tting in
the
watersh
ed. A
s time allo
ws, u
se pro
cedu
res describ
ed b
y
Bro
ph
y (2
005
) for lo
cating tid
egates.
Used
for: R
A.
score #6:
certainty #6:
score #7:
certainty #7:
©2006 H
GM
GuidebookP
age 4/7H
ydrogeomorphic A
ssessment G
uidebook for Tidal W
etlands of the Oregon C
oast, Part 1 – A
ugust 2006A
ppendix A. D
ata Form
A1

39August 2006 – Hydrogeomorphic Assessment Guidebook for Tidal Wetlands of the Oregon Coast, Part 1
©20
06 H
GM
Gui
debo
okP
age
5/7
Hyd
roge
omor
phic
Ass
essm
ent G
uide
book
for T
idal
Wet
land
s of
the
Ore
gon
Coa
st, P
art 1
– A
ugus
t 200
6A
ppen
dix
A. D
ata
For
m A
1
cod
e in
dic
ato
r sc
ore
g
uid
ance
8.
F
oo
tVis
E
xte
nt
and
fre
qu
ency
of
wet
land
vis
itat
ion.
C
alcu
late
: A
+ (
B*2)
+ (
C*3
). [F
or
exam
ple
, 10
+ (
20
x2
) +
(7
0x3
) =
260
] w
her
e:
__
__
_(A
) %
of
wet
lan
d &
up
land
* v
isit
ed o
nly
rare
ly (
<1
0 d
ays
/yr)
b
y p
eop
le o
n fo
ot
__
__
_(B
) %
of
wet
lan
d &
up
land
* w
ith
in
term
edia
te v
isit
atio
n f
req
uen
cy
__
__
_(C
) %
of
wet
lan
d &
up
land
* v
isit
ed d
aily
or
alm
ost
so (
>360 d
ays/
yr)
*
incl
ud
es u
pla
nd w
ith
in 1
00
ft.
th
e re
sult
ing
nu
mb
er
sco
re
<110
1 (
infr
equen
t &
lo
cali
zed v
isit
atio
n)
0.0
1
10-1
39
0.
33
140-
6 199
0.
62
00
+
0 (f
req
uen
t &
ex
ten
siv
e v
isit
atio
n)
1.0
sc
ore
#8:
ce
rtai
nty
#8:
A,
B,
and C
must
su
m t
o 1
00%
.
Ass
um
e an
av
erag
e v
isit
or
“cas
ts a
dis
turb
ance
sh
ado
w”
of
rad
ius
10
0 f
t.
Infe
r gre
ater
vis
itat
ion f
requen
cy i
f cl
ose
r to
ro
ads
& b
uil
din
gs
(esp
ecia
lly p
opula
tio
n
cen
ters
), p
ub
lic
lan
d,
most
ly h
igh
mar
sh,
and
/or
sig
ns
of
use
, e.
g., f
oo
t tr
ails
. U
sed
fo
r:
RA
, N
FW
, D
ux
, S
bir
d.
9.
Bo
ats
H
ow
fre
qu
ent
and
clo
se i
s bo
at t
raff
ic (
all
typ
es)?
<1
00 f
t aw
ay
100-
1000
ft
away
>1
000
ft
away
se
ldo
m (
<1
2x
/day
) 0
.6
0.4
0
.0fr
equ
ent
2
0
.8
0.6
0.
nea
rly
con
4
st
ant
1.0
0
.80
. S
elec
t th
e la
rges
t num
ber
that
is
appli
cable
and e
nte
r it
in t
he
Sco
re b
ox.
sc
ore
#9:
ce
rtai
nty
#9:
Use
d f
or:
R
A, N
FW
.
10.
Ho
meD
is
Pro
xim
ity (
ft)
to t
he
near
est
inha
bite
d st
ruct
ure.
pro
xim
ity
sco
re
<200’
1.00
2
00’-
999’
0.75
1
000
’-199
9’
0.50
2
000
’-500
0’
0.25
>
50
00
’ 0.
01
sc
ore
#10
:
ce
rtai
nty
#10
:
Est
imat
e th
e dis
tance
fro
m t
he
wet
land-u
pla
nd
edge
close
st t
o t
he
stru
cture
. T
he
stru
cture
m
ust
be:
(a
) in
hab
ited
fo
r at
lea
st 2
mo
nth
s p
er y
ear,
and
(b
) n
ot
con
tin
uo
usl
y s
epar
ated
fro
m w
etla
nd
by
w
ater
wid
er t
han
10 f
t.,
e.g., n
ot
on a
n o
pposi
te
shore
. A
eria
l photo
gra
ph
s or
topo m
aps
are
use
ful.
U
sed
fo
r:
RA
, L
bir
dM
.
sco
re #
10:
cert
ain
ty #
10:
sco
re #
9:
cert
ain
ty #
9:
sco
re #
8:
cert
ain
ty #
8:

40 Hydrogeomorphic Assessment Guidebook for Tidal Wetlands of the Oregon Coast, Part 1 – August 2006
cod
e in
dicato
r sco
re g
uid
ance
11. R
oad
X
Pro
xim
ity (ft) to
the n
earest paved area:
<10 ft 10-100’
100-1000’ p
rimar
1.
6
2
y road
s 0
0
.0
.seco
n3
0
.01
d
ary road
s 0
.6
0.
En
ter the m
axim
um
app
rop
riate nu
mb
er directly
into
the sco
re b
ox
to th
e righ
t.
sco
re #11:
certain
ty #11:
Co
nsid
er park
ing
lots (>
20
veh
icle capacity
) to b
e prim
ary
road
s. Prim
ary ro
ads u
sually
hav
e >1
veh
icles/min
ute d
urin
g
the d
aytim
e. If a prim
ary ro
ad b
ord
ers on
ly a tin
y fractio
n o
f a w
etland’s u
plan
d ed
ge, treat it as a seco
ndary
road
. U
sed fo
r: RA
, Lb
irdM
.
12. In
vas P
resence o
r poten
tial for invasive exotic invertebrates.
score
no in
vasiv
e exotic in
verteb
rates hav
e be
repo
rted fro
m th
is estuary
(see gu
idan
ce at rig
ht), an
d th
ere are no
oyster cu
ltivati
facilities or large-ship traffic ro
utes in
simil
parts o
f the sam
e estua efao
n
ar ry
01 n
r 0.
no in
vasiv
e exotic in
verteb
rates hav
e be
repo
rted fro
m th
is estuary
(see colu
mn
at frig
ht), b
ut th
ere are oyster cu
ltivatio
n faciliti
and/o
r large sh
ips traffic in
the estu
a eaes ry
50 n
r 0.
po
pu
lation
s of in
vasiv
e exo
tic inv
ertebrates a
know
n to
hav
e beco
me estab
lished
in th
estua
rry
00 e is
1.
sco
re #12:
certain
ty #12:
Green
crabs o
r oth
er inv
asive in
verteb
rate species h
ave b
een
do
cum
ented
in T
illamo
ok
, Netarts, S
almo
n, S
iletz, Yaq
uin
a, A
lsea, Um
pqua, C
oos, an
d C
oquille estu
aries. Oyster
facilities are presen
t in so
me o
f these p
lus in
the N
ehalem
an
d S
iuslaw
estuaries.
Large ship traffic = d
eep-d
raft vessels, esp
ecially th
ose th
at d
ischarg
e foreig
n b
allast water.
Used
for: R
A, In
v, [A
fish, M
fish, R
fish, N
FW
, Sb
ird,
Lbird
M].
score #12:
certainty #12:
score #11:
certainty #11:
©2006 H
GM
GuidebookP
age 6/7H
ydrogeomorphic A
ssessment G
uidebook for Tidal W
etlands of the Oregon C
oast, Part 1 – A
ugust 2006A
ppendix A. D
ata Form
A1

41August 2006 – Hydrogeomorphic Assessment Guidebook for Tidal Wetlands of the Oregon Coast, Part 1
©20
06 H
GM
Gui
debo
okP
age
7/7
Hyd
roge
omor
phic
Ass
essm
ent G
uide
book
for T
idal
Wet
land
s of
the
Ore
gon
Coa
st, P
art 1
– A
ugus
t 200
6A
ppen
dix
A. D
ata
For
m A
1
cod
e in
dic
ato
r sc
ale/
sco
re
gu
idan
ce
13.
Inst
abil
Po
ssib
le in
stab
ility
of
the
wet
lan
d.
Cal
cula
te t
he
foll
ow
ing u
sing t
he
num
eric
val
ues
bel
ow
: A
+ B
+ C
+ D
+ E
= s
cale
T
hen
use
the
scal
e to
the
right
and e
nte
r a
score
in t
he
box.
A)
Liv
ing
tree
s or
shr
ubs
> 1
0 f
t. t
all
and f
looded
by t
ide
at l
east
once
per
yea
r:
des
crip
tio
n
valu
e m
any
1 fe
w
2 n
on
e 3
B)
Per
cent
of
wet
land
tha
t is
hig
h m
arsh
(not
flooded
dai
ly d
uri
ng
mo
st o
f th
e m
onth
, but
stil
l fl
ooded
occ
asio
nal
ly b
y t
ide)
: d
escr
ipti
on
va
lue
>50%
0
10
-50
%
1 1
-10
%
2 <
1%
3
C)
Cha
nge
in a
rea
of
wet
land a
nd a
djo
inin
g t
idef
lat
as i
ndic
ated
fro
m
his
tori
cal
dat
a, m
aps,
or
imag
es:
des
crip
tio
n
valu
e in
cor
reas
e fr
om
sed
imen
tati
on
, no n
oti
ceab
le c
han
ge,
or
no d
ata
1
los
3 s
of
mar
sh a
rea
fro
m e
rosi
on
or
win
db
low
n s
and
(n
ot f
rom
fil
lin
g, dik
ing, dra
inag
e)
D)
Tid
al c
ircu
lati
on:
des
crip
tio
n
valu
e no
evi
denc
e ti
dal
flo
odin
g r
estr
icte
d d
uri
ng p
ast
100 y
ears
0
full
daily
tid
al f
loo
din
g r
esu
med
mor
e th
an 1
0 y
ears
ago
1 fu
ll da
ily t
idal
flo
od
ing
res
um
ed le
ss th
an 1
0 y
ears
ago
2 pa
rtia
l tid
al f
loo
din
g r
esu
med
mor
e th
an 1
0 y
ears
ago
3 pa
rtia
l tid
al f
loo
din
g r
esu
med
less
than
10
yea
rs a
go
4
E)
Pre
dom
inan
t su
bstr
ate:
d
escr
ipti
on
va
lue
loam
, si
lt,
clay
1
sandy s
oil
2
sand d
unes
, fi
ll,
dre
dged
mat
eria
l, r
ock
3
3
= 0
.01
4
= 0
.1
5
= 0
.2
6
= 0
.3
7
= 0
.4
8
= 0
.5
9
= 0
.6
1
0 =
0.7
11
= 0
.8
1
2 =
0.9
>
12 =
1.0
sco
re #
13:
ce
rtai
nty
#13
:
(C)
Do
no
t in
clu
de
dir
ect
loss
es f
rom
fil
lin
g o
r d
ikin
g,
or
incr
ease
s due
to r
esto
rati
on –
in
clude
only
those
fr
om
sed
imen
tati
on
or
ero
sio
n. I
f ar
ea l
oss
can
be
do
cum
ente
d a
t an
y t
ime
sin
ce 1
85
0,
assi
gn
a “
0”
regar
dle
ss o
f poss
ible
subse
quen
t in
crea
sed a
rea.
B
e ca
refu
l w
hen
co
mp
arin
g h
isto
rica
l m
aps
or
aeri
al
photo
gra
phs,
as
appar
ent
chan
ges
may
act
ual
ly b
e due
to d
iffe
rence
s in
the
dai
ly o
r m
onth
ly t
idal
cycl
e w
hen
th
e im
age
was
rec
ord
ed.
(D)
Res
tora
tio
n m
ay h
ave
bee
n i
nte
nti
on
al o
r fr
om
nat
ura
l er
osi
on o
f dik
es.
Par
tial
tid
al f
loodin
g
incl
udes
mar
shes
wit
h “
mute
d”
tidal
am
pli
tude
due
to
culv
ert
rest
rict
ion
s o
r m
od
ifie
d t
ideg
ates
. P
rese
nce
of
dik
e re
mn
ants
do
es n
ot
alw
ays
mea
n t
idal
flo
odin
g i
s p
arti
al.
U
sed
fo
r:
RA
, W
Q.
sco
re #
13:
cert
ain
ty #
13:

42 Hydrogeomorphic Assessment Guidebook for Tidal Wetlands of the Oregon Coast, Part 1 – August 2006
Data F
orm
A2. D
irect Ind
icators o
f Wetlan
d In
tegrity th
at Req
uire M
ore-In
tensive F
ield W
ork
If unable to perform these relatively intensive m
easurements, you m
ay skip this section and proceed with section B
1, but wetland integrity
and the botanical function will not be scored. To calculate inform
ation needed in this section, you must first enter your field data in the
accompanying E
xcel™ spreadsheet. For the plant indicators, you m
ust use the survey protocol specified in Protocol for assessing botani-
cal indicators on page 16.
©2006 H
GM
Guidebook
Hydrogeom
orphic Assessm
ent Guidebook for T
idal Wetlands of the O
regon Coast, P
art 1 – August 2006
Appendix A
. Data F
orm A
2, Intro
.

43August 2006 – Hydrogeomorphic Assessment Guidebook for Tidal Wetlands of the Oregon Coast, Part 1
©20
06 H
GM
Gui
debo
okP
age
1/2
Hyd
roge
omor
phic
Ass
essm
ent G
uide
book
for T
idal
Wet
land
s of
the
Ore
gon
Coa
st, P
art 1
– A
ugus
t 200
6A
ppen
dix
A. D
ata
For
m A
2
cod
e in
dic
ato
r sc
ore
g
uid
ance
14
. R
atio
C
Cha
nnel
pro
port
ions
. W
alk
up
stre
am t
o e
ach
of
fiv
e su
rvey
po
ints
alo
ng
a m
ajo
r in
tern
al c
han
nel
(se
e ri
ght
colu
mn
) an
d m
easu
re t
he
chan
nel
topw
idth
and in
cisi
on
dept
h. T
hen
in
pu
t th
e m
easu
rem
ents
on
th
e ac
com
pan
yin
g
spre
adsh
eet
(par
t A
2a)
and a
llow
it
to c
alcu
late
the
Ab
solu
te D
iffe
ren
ce (
mea
n).
C
om
par
e th
at n
um
ber
wit
h
the
left
sid
e of
the
foll
ow
ing s
cale
, to
det
erm
ine
the
score
.
Ente
r th
e sc
ore
in t
he
colu
mn
to t
he
right.
If
the
site
co
nta
ins
no t
idal
chan
nel
, sk
ip t
his
sec
tion.
Pro
toco
l:
The
five
surv
ey p
oin
ts (
Fig
ure
1)
should
be
arra
yed
fro
m w
her
e th
e m
ain c
han
nel
exit
s th
e w
etla
nd (
#1)
to t
he
mo
st d
ista
nt
but
connec
ted f
eeder
ch
annel
(#5),
and
sho
uld
be
rep
rese
nta
tiv
e o
f th
e o
ther
nea
rby
sec
tio
ns
of
chan
nel
. I
f n
o b
ank
s ar
e ap
par
ent,
th
en m
easu
re a
t th
e fi
rst
maj
or
bre
ak i
n t
he
chan
nel
sid
e sl
ope
(oft
en t
he
wet
ted
wid
th a
t h
igh
tid
e).
Veg
etat
ion
ch
ang
e ca
n a
lso
be
use
d t
o
dis
cern
th
e to
p o
f th
e b
ank
. M
easu
re t
o t
he
geo
mo
rph
ic
top
, no
t to
wh
ere
the
wat
er l
evel
is.
sc
ore
# 1
4:
ce
rtai
nty
# 1
4:
Topw
idth
= t
he
dis
tan
ce f
rom
ban
k-t
o-b
ank
. M
easu
re
to t
he
geo
mo
rph
ic t
op
, n
ot
to w
her
e th
e w
ater
lev
el i
s.
Inci
sion
dep
th =
the
ver
tica
l dis
tance
(m
) bet
wee
n t
he
chan
nel
bo
ttom
an
d t
he
top
of
a li
ne
run
nin
g b
etw
een
th
e ch
ann
el b
ank
s.
S
ee P
art
2 f
or
des
crip
tio
n o
f as
sum
pti
on
s b
ehin
d t
his
in
dic
ator
and i
ts s
cali
ng.
U
sed
fo
r: W
I, W
Q.
sco
re #
14:
cert
ain
ty #
14:

44 Hydrogeomorphic Assessment Guidebook for Tidal Wetlands of the Oregon Coast, Part 1 – August 2006
©2006 H
GM
GuidebookP
age 2/2H
ydrogeomorphic A
ssessment G
uidebook for Tidal W
etlands of the Oregon C
oast, Part 1 – A
ugust 2006A
ppendix A. D
ata Form
A2
cod
e g
uid
ance
15. Sp
PerQ
d 16. S
pD
eficit 17. A
llPC
90 18. D
om
Def
19. NN
20PC
20. N
Nd
ef 21. A
nn
Def
22. Tap
PC
def
23. Sto
lPC
def
24. Tu
ftPC
def
These b
otan
ical indicato
rs are calculated
and scaled
auto
matically
in p
art A2 o
f the acco
mp
any
ing
spread
sheet, u
sing
field d
ata you en
ter in
part A
2b
of th
e spread
sheet. Y
ou
mu
st first collect th
e data u
sing
the fo
llow
ing
pro
t oco
l. Reco
rd th
e plan
t data o
n th
e Ap
pen
dix
E
(Veg
etation Q
uad
rat Data F
orm
), then
transfer to
the sp
readsh
eet. 1
. In m
ost in
stances, estab
lish tw
o p
arallel transects p
er wetla n
d (F
igu
re 3), p
referably
som
etime b
etween
May
and
Sep
temb
er. On
e end o
f each
transect sh
ould
be at a p
oin
t contain
ing w
etland v
egetatio
n th
at is nearest th
e adjo
inin
g u
nv
egetated
bay
or riv
er; the o
ther en
d sh
ould
b
e at the ap
pro
xim
ate upp
er annu
al limit o
f tidal in
und
ation (i.e., “u
plan
d”), as u
sually
ind
icated b
y th
e tree line o
r driftw
ood lin
e. If the
wetlan
d o
ccupies all o
f an islan
d w
ith n
o u
plan
d, ex
tend
each tran
sect the w
idth
of th
e island (if feasib
le). Tran
sects should
be relativ
ely
straight, b
ut p
recise alignm
ent is n
ot essen
tial. 2. S
ituate th
e two tran
sects near th
e wid
est part o
f the w
etland. S
ituate th
em to
avoid
or m
inim
ize crossin
g o
f majo
r chan
nels an
d n
on-
wetlan
d sp
ots (d
ikes, fills) w
ithin
the w
etland
. Av
oid
placin
g th
e transects w
ithin
2m
of each
oth
er—m
uch
wid
er spacin
g (at least 1
0 m
) is preferred
if logistically
possib
le. Do n
ot try
to “aim
” the tran
sects to in
tercept p
articular p
lant co
mm
unities o
r attempt to
mak
e the tran
sects “rep
resentativ
e” of th
e wetlan
d. R
andom
placem
ent, w
hile d
esirable statistically
, often
pr esen
ts logistical h
eadach
es and is relativ
ely
mean
ingless g
iven
the lim
ited rep
lication (o
f only
two tran
sects). 3
. In ex
actly 2
0 q
uad
rats (squ
are plo
ts), each w
ith d
imen
sion
s 1m
x 1
m, id
entify
and
assess relative p
ercent-co
ver o
f each p
lant sp
ecies. E
ach o
f the 2
transects sh
ou
ld co
ntain
10 q
uad
rats, spaced
equid
istantly
along th
e transect b
egin
nin
g at th
e veg
etated tran
sition fro
m
un
veg
etated b
ay/riv
er. How
ever, if it b
ecom
es evid
ent th
at less than
20
% o
f a qu
adrat is v
egetated
, mo
ve to
the left o
r right o
f the tran
sect until a sp
ot is fo
und w
here th
is criterion is m
et. (The b
otan
ical pro
toco
l in th
is gu
ideb
ook is n
ot in
tend
ed to
assess exten
t of u
nv
egetated
area in
a wetlan
d. T
his is ad
dressed
only
by in
dicato
r #28).
4. In
narro
w m
arshes, th
e use o
f on
ly tw
o sh
ort tran
sects cou
ld resu
lt in q
uad
rats alon
g each
transect b
eing
closer th
an 2
m to
each o
ther. T
o
avo
id th
is, dep
loy
add
ition
al transects p
erpen
dicu
lar to th
e bay
or riv
er until at least th
e 2m
spacin
g is estab
lished
betw
een q
uad
rats as well
as betw
een tran
sects. In rare in
stances, it m
ay also
be n
ecessary to
chan
ge tran
sect orien
tation
from
perp
end
icular to
ob
liqu
e.

45August 2006 – Hydrogeomorphic Assessment Guidebook for Tidal Wetlands of the Oregon Coast, Part 1
Dat
a F
orm
B1.
R
apid
Ind
icat
ors
of
Fu
nct
ion
Th
at M
ay b
e E
stim
ated
Thi
s fo
rm a
nd th
e su
cces
sive
one
(Fo
rm B
2) in
clud
e in
dica
tors
kno
wn
from
tech
nica
l lite
ratu
re o
r re
ason
ed e
colo
gica
l pri
ncip
les
to b
e as
soci
-at
ed w
ith o
ne o
r m
ore
of th
e 12
key
fun
ctio
ns o
f tid
al w
etla
nds.
Som
e of
the
indi
cato
rs w
ere
corr
elat
ed s
tatis
tical
ly w
ith o
ne o
r m
ore
indi
ca-
tors
of
Ris
k fr
om F
orm
A1.
Oth
ers
wer
e un
corr
elat
ed, e
ither
due
to th
e im
prec
isio
n w
ith w
hich
they
and
/or
the
Ris
k in
dica
tors
wer
e es
ti-m
ated
, or
to th
eir
bein
g in
trin
sica
lly u
naff
ecte
d by
hum
an a
ctiv
ities
. T
he u
ncor
rela
ted
func
tions
wer
e in
clud
ed b
ecau
se o
f th
eir
impo
rtan
ce to
asse
ssin
g th
e fu
nctio
ns, a
s do
cum
ente
d in
Par
t 2 o
f th
is g
uide
book
. N
ote:
A h
ighe
r nu
mbe
r fo
r a
part
icul
ar in
dica
tor
belo
w d
oes
not a
lway
sm
ean
grea
ter
func
tion–
the
num
ber
depe
nds
on th
e fu
nctio
n an
d th
e in
dica
tor.
Ita
liciz
ed te
rms
are
defi
ned
in th
e la
st c
olum
n. A
bbre
viat
ions
for
func
tions
in th
e la
st c
olum
n ar
e sh
own
in A
ppen
dix
B.
©20
06 H
GM
Gui
debo
okH
ydro
geom
orph
ic A
sses
smen
t Gui
debo
ok fo
r Tid
al W
etla
nds
of th
e O
rego
n C
oast
, Par
t 1 –
Aug
ust 2
006
App
endi
x A
. Dat
a F
orm
B1,
Intr
o.

46 Hydrogeomorphic Assessment Guidebook for Tidal Wetlands of the Oregon Coast, Part 1 – August 2006
©2006 H
GM
Guidebook
Page 1/12
Hydrogeom
orphic Assessm
ent Guidebook for T
idal Wetlands of the O
regon Coast, P
art 1 – August 2006
Appendix A
. Data F
orm B
1
cod
e in
dicato
r scale/sco
re g
uid
ance
0
1
2
3
-4
5-6
7
-8
9-1
0
11-1
2
13-1
4
15-1
6
>1
5
= 0
.01
= 0
.1
= 0
.2
= 0
.3
= 0
.4
= 0
.5
= 0
.6
= 0
.7
= 0
.8
= 0
.9
= 1
.0
25. F
loo
d
Imag
ine th
e wetlan
d u
nder each
tidal co
nditio
n listed
belo
w.
What %
of th
e wetlan
d’s area (in
cludin
g its in
ternal tid
al chan
nels)
is likely
to b
e accessible to young anadromous fish
? A
s your an
swer, select o
ne n
um
ber fro
m each
row
, then
sum
the
fou
r nu
mb
ers and
use th
eir sum
with
the scale o
n th
e righ
t to
gen
erate a score fo
r the b
ox
.
du
ring
: 0%
(n
on
e)
1-10%
10-50%
50-90%
>90%
Mo
nth
ly low
tide
0
4
5
6
7
Daily lo
w tid
e 0
3
4
5
6
D
aily hig
h tid
e 0
2
3
4
5
M
on
thly h
igh
tide
0
1
2
3
4
sco
re #25:
certain
ty #25:
Assu
me co
nd
ition
s are averag
ed o
ver F
ebru
ary—
Jun
e. If th
e site cann
ot b
e visited
repeated
ly, an
swer th
is based
o
n v
isual estim
ation
of th
e top
og
raph
y o
f the w
etland
relativ
e to th
e tidal am
plitu
de rep
orted
from
the clo
sest m
onito
ring statio
n in
the estu
ary (see T
idal range in O
regon estuaries, belo
w) o
r imp
rov
ed lo
cal data (w
here
availab
le). S
almo
nid
distrib
utio
n m
aps are av
ailable o
n th
e intern
et at: rain
bo
w.d
fw.state.o
r.us/n
rimp/in
form
ation
/fishd
istmap
s.h
tm
Used
for: X
pt, A
fish, M
fish, R
fish, D
ux, L
bird
M,
[NF
W].
score #25:
certainty #25:

47August 2006 – Hydrogeomorphic Assessment Guidebook for Tidal Wetlands of the Oregon Coast, Part 1
estu
ary
loca
tion
da
ily
rang
e
(ft.
)
mon
thly
ra
nge
(f
t.)
es
tuar
y lo
cati
on
daily
ra
nge
(f
t.)
mon
thly
ra
nge
(f
t.)
es
tuar
y lo
cati
on
daily
ra
nge
(f
t.)
mon
thly
ra
nge
(f
t.)
Nec
anic
um
Sea
sid
e 4
.7
5.8
T
aft
5.0
6
.1
Win
ches
ter
5.1
6
.9
Bri
gh
ton
5
.9
7.8
Sile
tz
Ker
nv
ille
4
.6
6.6
Um
pqua
Ree
dsp
ort
5
.1
6.7
Wh
eele
r 5
.9
7.6
S
o.
Bea
ch
6.3
8
.3
mo
uth
5
.2
7.0
Neh
alem
Neh
alem
5
.6
7.2
Yaq
uina
Yaq
uin
a 6
.2
8.2
C
har
lest
on
5
.7
7.5
Bar
vie
w
6.2
8
.2
Wal
dp
ort
5
.8
7.7
E
mp
ire
4.9
6
.7
Gar
ibal
di
5.9
7
.8
Als
ea
Dri
ft C
r.
5.0
6
.2
Coo
s
Co
os
Bay
5
.6
7.3
Bay
Cit
y
5.4
7.1
m
ou
th
5.5
7
.3
Coq
uille
B
andon
5
.2
7.0
Till
amoo
k
Til
lam
oo
k
5.2
6
.6
Flo
ren
ce
5.4
7
.3
Rog
ue
Wed
der
bu
rn
4.9
6
.7
Net
arts
W
his
key
Cr.
4
.8
7.8
C
ush
man
5
.5
7.3
C
hetc
o B
roo
kin
gs
5.1
7
.0
Sand
Lak
e --
- 5
.7
---
Tie
rnan
5
.9
7.7
Nes
tucc
a m
ou
th
5.8
7
.6
Sius
law
Map
leto
n
6.2
8
.0
Tid
al r
ang
e in
Ore
go
n e
stu
arie
s (m
ost
ly f
rom
Ham
ilto
n 1
984)
. U
se b
ette
r lo
cal d
ata
wh
en a
vaila
ble
.
©20
06 H
GM
Gui
debo
okP
age
2/12
Hyd
roge
omor
phic
Ass
essm
ent G
uide
book
for T
idal
Wet
land
s of
the
Ore
gon
Coa
st, P
art 1
– A
ugus
t 200
6A
ppen
dix
A. D
ata
For
m B
1

48 Hydrogeomorphic Assessment Guidebook for Tidal Wetlands of the Oregon Coast, Part 1 – August 2006
©2006 H
GM
Guidebook
Page 3/12
Hydrogeom
orphic Assessm
ent Guidebook for T
idal Wetlands of the O
regon Coast, P
art 1 – August 2006
Appendix A
. Data F
orm B
1
cod
e in
dicato
r sco
re g
uid
ance
26. S
had
e P
ercent o
f the en
tire wetlan
d’s v
egetated
area that is shaded
by
trees or to
pograp
hy:
%
sco
re <
1%
0.01
1-1
0%
0.50
>10%
1.00
sco
re #26:
certain
ty #26:
To
cou
nt, it m
ust b
e shad
ed fo
r 4+
ho
urs d
urin
g an
av
erage clo
ud
less day
. In
clud
e parts o
f the internal channel n
etwo
rk th
at are in
un
dated
mo
st day
s and
are shad
ed b
y d
eep in
cision
, lo
gs, o
r un
dercu
t ban
ks. Internal channels in
clud
e bo
th
tribu
tary ch
annels (flo
win
g fro
m u
plan
ds) an
d b
lind
ch
annels (flo
odin
g w
ith th
e inco
min
g tid
e). U
sed fo
r: AP
rod, [W
Q, X
pt, In
v, A
fish, M
fish, R
fish,
NF
W, S
bird
, Lb
irdM
].
27. S
had
eLM
[S
kip
if no
low
marsh
is presen
t.] P
ercent o
f only the lo
w m
arsh th
at is shaded b
y trees o
r to
po
grap
hy:
%
sco
re <
1%
0.01
1-1
0%
0.50
>10%
1.00
sco
re #27:
certain
ty #27:
See ab
ove.
As a rem
ind
er, “low
marsh
” is defin
ed as areas flo
od
ed
by th
e tide d
urin
g th
e majo
rity o
f day
s durin
g m
ost
month
s of th
e year. L
ow
marsh
is not lim
ited ju
st to
areas that flo
od ev
ery d
ay.
Used
for: A
fish.
28. B
are A
rea of bare substrate, in
clud
ing
pannes, shallo
w p
oo
ls, and
tideflats w
ider th
an 2
m an
d lo
cated w
ithin th
e wetlan
d:
area
score
0-4
sq. m
0.01
4-1
00 sq
.m
0.25 1
00-2
,500
sq.m
0.50
2,5
00-1
0,0
00 sq
.m
0.75 >
10,0
00 sq
.m
1.00
sco
re #28:
certain
ty #28:
Pannes =
shallo
w m
ostly
-bare d
epressio
ns in
the m
arsh
surface an
d aren
’t curren
tly a p
art of tid
al chan
nels.
Assess co
nditio
n as at lo
w tid
e. U
sed fo
r: AP
rod
, NF
W, D
ux
, Sb
ird, [W
Q, X
pt, In
v,
Afish
, Mfish
, Rfish
, NF
W, S
bird
, Lbird
M].
score #26:
certainty #26:
score #27:
certainty #27:
score #28:
certainty #28:

49August 2006 – Hydrogeomorphic Assessment Guidebook for Tidal Wetlands of the Oregon Coast, Part 1
©20
06 H
GM
Gui
debo
okP
age
4/12
Hyd
roge
omor
phic
Ass
essm
ent G
uide
book
for T
idal
Wet
land
s of
the
Ore
gon
Coa
st, P
art 1
– A
ugus
t 200
6A
ppen
dix
A. D
ata
For
m B
1
cod
e in
dic
ato
r sc
ore
g
uid
ance
29
. P
ann
es
Are
a on
ly o
f pa
nnes
an
d s
hal
low
isol
ated
po
ols
(n
ot
tid
efla
ts):
area
sc
ore
0
-4 s
q. m
0.
01
4-1
00 s
q.m
0.
25
100-2
,500
sq
.m
0.50
2
,500-1
0,0
00 s
q.m
0.
75
>10,0
00 s
q.m
1.
00
sc
ore
#29
:
ce
rtai
nty
#29
:
Isol
ated
= l
ackin
g a
su
rfac
e co
nnec
tion t
o o
ther
wat
ers
duri
ng d
aily
low
tid
e U
sed
fo
r:
Inv
, R
fish
, [A
fish
, M
fish
, S
bir
d, L
bir
dM
].
30.
Tra
nA
ng
T
rans
itio
n an
gle
along m
ost
of
the
wet
land e
xter
nal e
dge:
tran
siti
on
an
gle
sc
ore
g
rad
ual
, o
r st
eep
bu
t st
able
0.
01
stee
p, w
ith
ex
ten
siv
e er
osi
on
an
d u
nd
ercu
ttin
g
1.00
sc
ore
#30
:
ce
rtai
nty
#30
:
Ext
erna
l edg
e =
the
edge
bet
wee
n t
he
mar
sh a
nd
adjo
inin
g b
ay o
r ti
dal
riv
er.
Use
d f
or:
W
Q.
31.
Up
Ed
ge
Per
cent
of
the
wet
land’s
enti
re p
erim
eter
that
is
upla
nd,
i.e.
,
neith
er w
ater
, non-t
idal
wet
land, nor
tidef
lat:
%
sco
re
<1
0.
01
1-2
5
0.25
2
5-5
0
0.50
5
0-7
5
0.75
>
75
1.
00
sc
ore
#31
:
ce
rtai
nty
#31
:
Per
imet
er =
the
wet
lan
d’s
ed
ge
wit
h u
pla
nd
plu
s w
ith
unveg
etat
ed w
ater
or
tidef
lat.
D
o n
ot
incl
ude
inte
rnal
ch
annel
s in
the
calc
ula
tion o
f th
e m
arsh
per
imet
er.
If
po
ssib
le, u
se c
om
pu
ter
GIS
so
ftw
are
to m
easu
re t
he
per
imet
er a
nd
ed
ges
. U
sed
fo
r: W
Q,
Lb
ird
M.
sco
re #
29:
cert
ain
ty #
29:
sco
re #
30:
cert
ain
ty #
30:
sco
re #
31:
cert
ain
ty #
31:

50 Hydrogeomorphic Assessment Guidebook for Tidal Wetlands of the Oregon Coast, Part 1 – August 2006
©2006 H
GM
Guidebook
Page 5/12
Hydrogeom
orphic Assessm
ent Guidebook for T
idal Wetlands of the O
regon Coast, P
art 1 – August 2006
Appendix A
. Data F
orm B
1
cod
e in
dicato
r sco
re g
uid
ance
32. L
WD
chan
N
um
ber o
f pieces o
f large woody debris (L
WD
) in w
etland’s tid
al ch
annel n
etwo
rk:
# L
WD
in ch
ann
el sco
re 0
, or n
o ch
ann
els presen
t 0.01
1-1
0
0.50 >
10
1.00
sco
re #32:
certain
ty #32:
To
cou
nt, th
e LW
D m
ust h
ave
a diam
eter >1
5 cm
and
a leng
th >
2m
. U
sed fo
r: Inv
, Afish
, [Rfish
, Mfish
, Sb
ird,
Lbird
M].
33. L
WD
marsh
N
um
ber o
f LW
D projecting
at least 1m
above th
e wetlan
d su
rface:
# LW
D
abo
ve surface
sco
re 0
0.01
1-4
0.25
5-9
0.50
10-3
0
0.75 >
30
1.00
sco
re #33:
certain
ty #33:
Used
for: L
bird
M.
34. L
WD
line
Driftw
ood line as % o
f wetlan
d’s u
plan
d ed
ge len
gth
:
%
score
0
0.01 1
-9
0.25 1
0-2
9
0.50 3
0-5
9
0.75 >
59
1.00
sco
re #34:
certain
ty #34:
Driftw
ood lin
e = L
WD
arranged
natu
rally in
a lin
ear pattern
, usu
ally p
arallel to u
plan
d, as a
result o
f tides. (D
riftwood lin
es are often
close to
th
e elevatio
n o
f annual h
igh tid
e) U
sed fo
r: Inv
, Lb
irdM
, [Afish
, Mfish
, Rfish
, N
FW
, Sb
ird.]
score #32:
certainty #32:
score #33:
certainty #33:
score #34:
certainty #34:

51August 2006 – Hydrogeomorphic Assessment Guidebook for Tidal Wetlands of the Oregon Coast, Part 1
©20
06 H
GM
Gui
debo
okP
age
6/12
Hyd
roge
omor
phic
Ass
essm
ent G
uide
book
for T
idal
Wet
land
s of
the
Ore
gon
Coa
st, P
art 1
– A
ugus
t 200
6A
ppen
dix
A. D
ata
For
m B
1
cod
e in
dic
ato
r sc
ale/
sco
re
gu
idan
ce
35.
Tri
bL
C
um
ula
tiv
e le
ng
th (
in m
iles
) o
f fi
sh-a
cces
sib
le n
on
-tid
al t
ribu
tary
ch
anne
ls t
hat
fee
d i
nto
the
wet
land:
le
ng
th
sco
re
<3
mi.
0.
01
3-1
0m
i.
0.05
>
10
mi.
1.
00
sco
re #
35:
ce
rtai
nty
#35
:
Mea
sure
on
ly t
he
trib
uta
ry c
han
nel
s th
at p
ass
thro
ug
h t
he
wet
lan
d. D
on’t
co
un
t th
e ad
join
ing
mai
n r
iver
ch
ann
el.
Est
imat
e le
ng
th b
egin
nin
g a
t th
e w
etla
nd
’s u
pla
nd
mar
gin
an
d e
xte
ndin
g t
o t
he
upst
ream
lim
it o
f fi
sh-a
cces
sible
wat
ers.
O
DF
W h
as i
nfo
rmat
ion
on
sal
mo
nid
use
are
as:
rain
bo
w.d
fw.s
tate
.or.
us/
nri
mp
/in
form
atio
n/f
ish
dis
tmap
s.h
tm
Use
d f
or:
X
pt,
Inv,
Afi
sh, N
FW
, D
ux,
Lb
irdM
, [M
fish
, R
fish
, S
bir
d].
36.
Fre
sh
Types
of
fres
hwat
er s
ourc
es t
hat
fee
d t
he
wet
land i
nte
rnal
ly.
Sel
ect
the
max
imu
m s
core
in
eac
h gro
up
and
th
en s
um
th
e tw
o
max
ima:
Gro
up
A:
Flo
win
g in
to t
he
wet
lan
dsc
ore
pere
nnia
l fre
sh t
ributa
ry
4 in
term
itten
t fre
sh t
rib
uta
ry o
r st
orm
wat
er p
ipe
2 n
eith
er
0
Gro
up
B:
Ad
join
ing
on
th
e u
ph
ill s
ide
sco
re
larg
e* n
on
-tid
al f
resh
wat
er w
etla
nd
, po
nd
, or
spri
ng
4
smal
l non-t
idal
wet
land, se
ep,
or
hydr
ic s
oil
pat
ch
3 oth
er l
and c
over
, an
d t
idal
wet
land i
s not
an i
slan
d
1 ti
dal
wet
land
occ
up
ies
nea
rly a
ll o
f an
isl
and
0 *
wid
er t
han
th
e ti
dal
wet
lan
d (
wid
th m
easu
red
per
pen
dic
ula
r to
slo
pe)
sum
= s
core
0
= 0
.01
1
= 0
.1
2
= 0
.2
3
= 0
.3
4
= 0
.5
5
= 0
.7
6
= 0
.8
7
= 0
.9
8
= 1
.00
sco
re #
36:
ce
rtai
nty
#36
:
Do n
ot
count
maj
or
river
s ad
join
ed b
y t
he
wet
land a
s fr
esh
wat
er s
ou
rces
. P
eren
nial
tri
bu
tari
es f
low
yea
r-ro
und
m
ost
yea
rs.
Int
erm
itten
t tri
buta
ries
flo
w s
easo
nal
ly a
nd h
ave
reco
gniz
able
chan
nel
s ex
tendin
g u
phil
l at
lea
st t
wic
e th
e w
idth
of
the
tidal
mar
sh. N
on-t
idal
wet
land
s on
th
e O
reg
on
Coas
t ar
e ty
pic
ally
dom
inat
ed b
y a
lder
, w
illo
w,
catt
ail,
skunk
cabbag
e, s
lough s
edge,
sm
all-
fruit
ed b
ulr
ush
, an
d w
ater
par
sley
(so
me
of
thes
e occ
ur
to a
les
ser
deg
ree
in t
idal
w
etla
nds)
. A
djoi
ning
mea
ns
pre
sen
t w
ith
in 1
0m
.
Ore
gon c
oas
tal
soil
s co
nsi
der
ed t
o b
e hy
dric
are
Bla
cklo
ck,
Bra
gto
n,
Bra
llie
r, B
renner
, C
het
co,
Cla
tsop,
Coquil
le,
Dep
oe,
Flu
vaq
uen
ts, H
ebo,
Hec
eta,
Lan
glo
is,
Riv
erw
ash,
Wil
lanch
, an
d Y
aquin
a.
Man
y o
ther
s co
nta
in h
ydri
c in
clu
sio
ns.
U
sed
fo
r: A
Pro
d, A
fish
, N
FW
, D
ux
, L
bir
dM
, [W
Q, X
pt,
In
v, M
fish
, R
fish
, S
bir
d].
sco
re #
35:
cert
ain
ty #
35:
sco
re #
36:
cert
ain
ty #
36:

52 Hydrogeomorphic Assessment Guidebook for Tidal Wetlands of the Oregon Coast, Part 1 – August 2006
©2006 H
GM
Guidebook
Page 7/12
Hydrogeom
orphic Assessm
ent Guidebook for T
idal Wetlands of the O
regon Coast, P
art 1 – August 2006
Appendix A
. Data F
orm B
1
cod
e in
dicato
r scale/sco
re g
uid
ance
37. W
idth
W
etland’s wid
th at its w
idest p
art:
wid
th ft.
score
wid
th ft.
score
<1
00
0.01
600–
700
0.6
100–
200
0.1
700–
800
0.7
200–
300
0.2
800–
900
0.8
300–
400
0.3
900–
1,0
00
0.9
400–
500
0.4
>1
,00
0
1.0 5
00–
600
0.5
sco
re #37:
certain
ty #37:
Measu
re this as a p
erpen
dicu
lar line fro
m aq
uatic
(unveg
etated riv
er or b
ay ed
ge o
r tideflat) to
uplan
d
edge. If site is an
island w
ith n
o u
plan
d, m
easure to
the
water ed
ge o
n o
pposite sid
e of th
e island.
Used
for: W
Q, X
pt, D
ux
, Sb
ird.
38. M
ud
W
Max
imu
m w
idth
of larg
est tideflat that ad
join
s the w
etland
:
wid
th ft.
score
wid
th ft.
score
<1
00
0.01
600–
700
0.6
100–
200
0.1
700–
800
0.7
200–
300
0.2
800–
900
0.8
300–
400
0.3
900–
1,0
00
0.9
400–
500
0.4
>1
,00
0
1.0 5
00–
600
0.5
sco
re #38:
certain
ty #38:
Measu
re this u
sing a U
SG
S to
pog
raph
ic map
or
(preferab
ly) field
ob
servatio
n at lo
w tid
e, as a perp
endicu
lar to th
e extern
al edge o
f wetlan
d, o
r m
easure it to
the ex
ternal ed
ge o
f oth
er wetlan
ds o
r flats on eith
er side (co
ntig
uo
us to
the w
etland b
eing
measu
red).
Used
for: N
FW
, Sb
ird.
39. R
oo
st
[Sk
ip if th
e wetlan
d co
ntain
s no
low
marsh
.] N
um
ber o
f types o
f poten
tial shorebird roosts with
in 1
.5 m
i. of th
e cen
ter of th
e wetlan
d (ch
eck all th
at are presen
t): _
_ treeless h
igh
marsh
, mo
stly w
ider th
an 3
00
ft _
_ treeless u
nin
hab
ited islan
ds (d
ry at h
igh
tide)
__ b
eaches o
r bars, m
ostly
wid
er than
100 ft at h
igh tid
e _
_ n
on
tidal m
arsh/p
on
d, m
ostly
wid
er than
30
0 ft
__ u
nv
egetated
dik
e or jetty
__ seaso
nally
floo
ded
pastu
re >4
0 acres
__ sew
age treatm
ent lag
oo
n
Ad
d th
e nu
mb
er of ch
eckm
arks an
d u
se scale at righ
t to d
erive sco
re.
0 =
0.0
1
1 =
0.2
5
2-3
= 0
.50
4
-5 =
0.7
5
6-7
= 1
.00
score #39:
certain
ty #39:
Inclu
de th
ese if they
occu
r with
in th
e wetlan
d as w
ell. U
sed fo
r: Sb
ird.
score #37:
certainty #37:
score #38:
certainty #38:
score #39:
certainty #39:

53August 2006 – Hydrogeomorphic Assessment Guidebook for Tidal Wetlands of the Oregon Coast, Part 1
©20
06 H
GM
Gui
debo
okP
age
8/12
Hyd
roge
omor
phic
Ass
essm
ent G
uide
book
for T
idal
Wet
land
s of
the
Ore
gon
Coa
st, P
art 1
– A
ugus
t 200
6A
ppen
dix
A. D
ata
For
m B
1
cod
e in
dic
ato
r sc
ore
g
uid
ance
40
. Is
lan
d
Wet
lan
d c
om
pri
ses
all
or
par
t o
f an
un
inh
abit
ed is
land
:
d
escr
ipti
on
sc
ore
w
etla
nd
co
mp
rise
s al
l o
r p
art
of
isla
nd
; an
d th
e is
land
con
tain
s es
sen
tial
ly n
o h
igh
mar
sh o
r u
nd
evel
op
ed u
pla
nd
, i.
e.,
is c
om
ple
tely
under
wat
er d
uri
ng
dai
ly h
igh
tid
e
0.01
wet
lan
d c
om
pri
ses
all
or
par
t o
f is
lan
d;
and
the
isla
nd
con
tain
s so
me
hig
h m
arsh
and
/or
un
dev
elo
ped
up
lan
d,
this
b
ein
g le
ss t
han
th
e ar
ea o
f lo
w m
arsh
0.33
wet
lan
d c
om
pri
ses
all
or
par
t o
f is
lan
d;
and
the
isla
nd
con
tain
s so
me
hig
h m
arsh
and
/or
un
dev
elo
ped
up
lan
d,
this
b
ein
g g
reat
er t
han
the
area
of
low
mar
sh
0.66
wet
land d
oes
not
com
pri
se a
ll o
r par
t of
isla
nd
1.00
sco
re #
40:
ce
rtai
nty
#40
:
Isla
nd =
lan
d n
ot
per
man
entl
y f
looded
and
com
ple
tely
sep
arat
ed f
rom
upla
nd a
t lo
w t
ide
by
wat
er a
t le
ast
3 f
t dee
p a
nd 2
0 f
t w
ide.
U
sed
fo
r:
Inv
, D
ux
, L
bir
dM
, [A
fish
, M
fish
, R
fish
, S
bir
d, N
FW
].
sco
re #
40:
cert
ain
ty #
40:
cod
e in
dic
ato
r sc
ore
g
uid
ance
41
. F
etch
D
irec
tion a
nd d
ista
nce
of
exte
rnal
edg
e’s
exp
osu
re t
o i
nte
nse
wav
e an
d/or
riv
er c
urre
nt a
ctio
n.
En
ter
the
max
imu
m a
pp
rop
riat
e n
um
ber
in
th
e b
ox
to
th
e ri
gh
t.
S
E, S
, or
SW
exp
osu
re, a
nd
dis
tan
ce is
:
<100
’ 10
0 –
1,00
0’
>1,0
00’
Ext
ern
al e
dg
e m
ost
ly
pro
tect
ed b
y d
ikes
, le
vees
, up
lan
d
top
og
rap
hy.
0.01
(o
r m
arsh
’s
exte
rnal
ed
ge
face
s a
dir
ecti
on
oth
er t
han
SE
, S
. or
SW
)
0.01
0.
01
Gra
du
al d
rop
-off
to
d
eep
er w
ater
; an
d
larg
e-b
oat
tra
ffic
an
d
seve
re r
iver
flo
od
s ar
e b
oth
infr
equ
ent.
0.3
0.6
0.8
Sh
arp
dro
p-o
ff t
o
dee
per
wat
er;
and
/or
larg
e-b
oat
tra
ffic
n
earb
y; a
nd
/or
larg
e ri
ver
flo
od
s ar
e fr
equ
ent.
No
p
rote
ctio
n.
Dri
ftw
oo
d
oft
en a
bu
nd
ant.
0.5
0.8
1.00
sc
ore
#41
:
ce
rtai
nty
#41
:
Dro
poff
= t
he
slo
pe
and
bat
hym
etry
of
dee
per
-wat
er
area
s w
ith
in a
bo
ut
30
ft
of
the
mar
sh e
dg
e, n
ot
just
to
th
e m
arsh
ed
ge
itse
lf.
If l
oca
l w
ind d
ata
show
str
onges
t w
aves
consi
sten
tly
com
ing
fro
m a
dir
ecti
on
oth
er t
han
SE
, S
, o
r S
W, y
ou
m
ay m
odif
y t
he
hea
der
s on t
his
tab
le t
o t
hat
dir
ecti
on.
Use
d f
or:
W
Q, In
v, D
ux
, [A
fish
, M
fish
, R
fish
, N
FW
, S
bir
d, L
bir
dM
].
sco
re #
41:
cert
ain
ty #
41:

54 Hydrogeomorphic Assessment Guidebook for Tidal Wetlands of the Oregon Coast, Part 1 – August 2006
©2006 H
GM
Guidebook
Page 9/12
Hydrogeom
orphic Assessm
ent Guidebook for T
idal Wetlands of the O
regon Coast, P
art 1 – August 2006
Appendix A
. Data F
orm B
1
cod
e in
dicato
r scale/sco
re g
uid
ance
42. P
form
N
um
ber o
f easily-reco
gnizab
le vegetation structures presen
t with
in
the w
etland. C
heck
all that p
redom
inate o
ver at least 1
00 sq
.ft: __ larg
e robust g
rass-like p
lants (e.g
., bulru
sh, cattail)
__
oth
er large n
ative g
rass-like p
l ants (m
ostly
>8 in
ches lo
ng, e.g
., D
eschampsia, H
ordeum, Juncus )
__
fleshy
, succu
lent p
l ants (e.g
., pick
leweed
) _
_ o
ther n
on
-wo
od
y p
lants (e.g
., saltmarsh
aster, oth
er forb
s) _
_ nurse logs su
pportin
g p
lants taller th
an 1
ft. _
_ su
bm
ersed aq
uatics (e.g
., wig
e on
grass o
r eelgrass) in
intern
al ch
annels o
r pools o
r extern
ally w
ithin
50 ft.
Deriv
e score b
y co
mp
aring th
e num
ber o
f items ch
ecked
abo
ve w
ith
the scale in
the n
ext co
lum
n.
0-2
= 0
.01
3
= 0
.25
4
= 0
.50
5
= 0
.75
6
= 1
.00
score #42:
certain
ty #42:
Nurse logs =
large lo
gs o
r stum
ps p
resent o
n th
e marsh
su
rface which
, becau
se of th
e elevated
substrate th
ey
pro
vid
e, pro
tect germ
inatin
g p
lants o
n to
p o
f the lo
g
from
poten
tially leth
al long-d
uratio
n flo
odin
g an
d h
igh
salinity
. U
sed fo
r: AP
rod, X
pt, In
v, D
ux, L
bird
M, [W
Q, A
fish,
Mfish
, Rfish
, NF
W, S
bird
].
43. F
orm
Div
Num
ber o
f easily-reco
gnizab
le vegetation forms w
ithin
the w
etland
or directly adjoining
its uplan
d ed
ge, fro
m th
is list. For liv
e veg
etation, th
ese must b
e presen
t along >
5%
of u
plan
d ed
ge o
r that
com
prise >
5%
of th
e wetlan
d area:
_
_ g
razed o
r mo
wed
grass an
d/o
r forb
s __ u
ngrazed
& u
nm
ow
ed g
rass and/o
r forb
s _
_ sh
rub
s 2-6
ft tall, con
ifer __ sh
rubs 2
-6 ft tall, d
eciduous
__
shru
bs 6
-20
ft tall, con
ifer __ sh
rubs 6
-20 ft tall, d
eciduous
__ liv
e trees 20-6
0 ft tall, co
nifer
__ liv
e trees 20-6
0 ft tall, d
eciduous
__ liv
e trees >60 ft tall, co
nifer
__ liv
e trees >60 ft tall, d
eciduous
__
stand
ing
snag
s, <6
” diam
eter _
_ stan
din
g sn
ags, >
6” d
iameter
Deriv
e score b
y co
mp
aring th
e num
ber o
f items ch
ecked
abo
ve w
ith
the scale in
the n
ext co
lum
n.
1 =
0.0
1
2 =
0.2
3
= 0
.3
4 =
0.4
5
= 0
.5
6 =
0.6
7
= 0
.7
8 =
0.8
9
= 0
.9
>9
= 1
.0
sco
re #43:
certain
ty #43:
Directly adjoining
= u
nobscu
red b
y a tree can
opy.
Used
for: In
v, L
bird
M, [A
fish, M
fish, R
fish, N
FW
, S
bird
].
score #42:
certainty #42:
score #43:
certainty #43:

55August 2006 – Hydrogeomorphic Assessment Guidebook for Tidal Wetlands of the Oregon Coast, Part 1
©20
06 H
GM
Gui
debo
okP
age
10/1
2H
ydro
geom
orph
ic A
sses
smen
t Gui
debo
ok fo
r Tid
al W
etla
nds
of th
e O
rego
n C
oast
, Par
t 1 –
Aug
ust 2
006
App
endi
x A
. Dat
a F
orm
B1
cod
e in
dic
ato
r sc
ore
g
uid
ance
44
. A
lder
P
erce
nt
of
up
lan
d e
dg
e bo
unded
(w
ith
in 5
0 f
t.)
by a
lder
:
%
sco
re
<1
(o
r n
o u
pla
nd
) 0.
01
1-1
0
0.33
1
0-5
0
0.66
>
50
1.
00
sc
ore
#44
:
ce
rtai
nty
#44
:
Oth
er d
ecid
uo
us
pla
nt
spec
ies
kn
ow
n t
o f
ix n
itro
gen
(n
ot
sim
ply
tak
e it
up f
rom
th
e so
il)
may
be
incl
ud
ed a
s w
ell.
U
sed
fo
r:
Inv
, [A
fish
, M
fish
, R
fish
, N
FW
, S
bir
d,
Lbir
dM
].
45.
Eel
g
Pre
sen
ce o
f ee
lgra
ss (
eith
er s
pec
ies)
:
pre
sen
ce
sco
re
not
0d
etec
ted
0.
1 o
bs
50er
ved
only
in a
djo
inin
g w
ater
s or
flat
s 0.
o
bs
00er
ved
wit
hin
the
wet
land’s
inte
rnal
chan
nel
s 1.
sc
ore
#45
:
ce
rtai
nty
#45
:
Bas
ed e
ith
er o
n o
bse
rvat
ion
s fr
om
sh
ore
(u
p t
o 5
0 f
t.
away
), b
oat
, or
publi
shed
rep
ort
s or
map
s.
“Cer
tain
ty”
should
be
score
d l
ow
if
no e
elgra
ss i
s det
ecte
d b
ecau
se
det
ecti
on a
t a
dis
tance
can
be
dif
ficu
lt o
r im
poss
ible
. U
sed
fo
r:
Inv
, D
ux
, [A
fish
, M
fish
, R
fish
, N
FW
, S
bir
d,
Lbir
dM
].
46.
So
ilFin
e P
redo
min
ant s
oil t
extu
re i
n m
ost
of
the
wet
land:
so
il te
xtu
re
sco
re
coar
se s
and
, g
rav
el
0.01
fi
ne
san
d
0.40
si
lt,
loam
, m
uck
, pea
t 1.
00
sc
ore
#46
:
ce
rtai
nty
#46
:
Ass
ess
this
fro
m c
ounty
soil
surv
ey m
aps,
unle
ss b
ette
r dat
a ar
e av
aila
ble
fro
m o
nsi
te e
xam
inat
ion o
f th
e upper
12 i
nch
es o
f th
e so
il a
t se
ver
al l
oca
tions
in t
he
wet
land.
P
redo
min
ant =
occ
up
yin
g t
he
gre
ates
t pro
port
ion o
f th
e su
rfac
e ar
ea o
f a
site
. U
sed
fo
r: W
Q.
sco
re #
44:
cert
ain
ty #
44:
sco
re #
45:
cert
ain
ty #
45:
sco
re #
46:
cert
ain
ty #
46:

56 Hydrogeomorphic Assessment Guidebook for Tidal Wetlands of the Oregon Coast, Part 1 – August 2006
©2006 H
GM
Guidebook
Page 11/12
Hydrogeom
orphic Assessm
ent Guidebook for T
idal Wetlands of the O
regon Coast, P
art 1 – August 2006
Appendix A
. Data F
orm B
1
cod
e in
dicato
r sco
re g
uid
ance
47. E
stuS
al T
idal marsh acreage in
this w
etland’s m
ajor estu
ary:
d
escriptio
n
score
Tid
al marsh
es are absen
t (or n
early ab
sent) fro
m tw
o o
f the
three salin
ity zo
nes (fresh
, brack
ish, salin
e): N
etarts, Siltco
os, T
enm
ile, Elk
Riv
er, Ch
etco.
0.01
Tid
al marsh
es are absen
t (or n
early so
) from
one o
f the
three salin
ity zo
nes, w
ith o
ne o
f the tw
o rem
ainin
g zo
nes
hav
ing
mu
ch m
ore m
arsh acreag
e than
the o
ther:
San
d L
ake, S
almon, B
eaver C
r., Coquille,
New
Riv
er, Ro
gu
e, Win
chu
ck.
0.33
Tid
al marsh
es are presen
t in all th
ree zones, w
ith o
ne zo
ne
contain
ing m
ore th
an 5
0%
of th
e estuary
’s marsh
acreage:
Neh
alem, T
illamo
ok
, Nestu
cca, Yaq
uin
a, Alsea, C
oo
s.
0.66
Tid
al marsh
es are presen
t in all th
ree zones, w
ith n
o zo
ne
contain
ing m
ore th
an 5
0%
of th
e estuary
’s marsh
acreage:
Necan
icum
, Siletz, S
iuslaw
, Um
pq
ua.
1.00
sco
re #47:
certain
ty #47:
The salin
ity zo
nes are n
ot b
a sed o
n salin
ity w
ithin
the
wetlan
d, b
ut rath
er in th
e adjo
inin
g b
ay o
r river.
These categ
orizatio
ns o
f estuaries are b
ased o
n v
ery
limited
salinity
data an
d m
ay b
e revised
. U
sed fo
r: Afish
, Mfish
, Rfish
, [WQ
, Inv
, NF
W, S
bird
, L
bird
M].
score #47:
certainty #47:
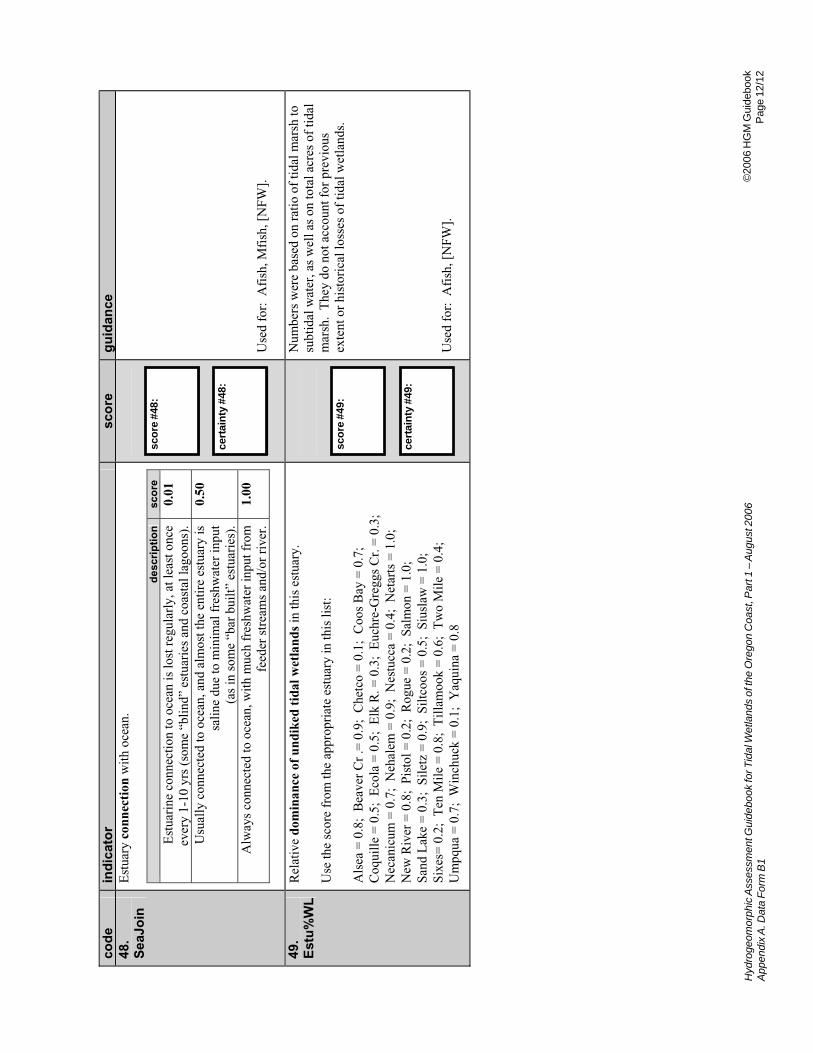
57August 2006 – Hydrogeomorphic Assessment Guidebook for Tidal Wetlands of the Oregon Coast, Part 1
©20
06 H
GM
Gui
debo
okP
age
12/1
2H
ydro
geom
orph
ic A
sses
smen
t Gui
debo
ok fo
r Tid
al W
etla
nds
of th
e O
rego
n C
oast
, Par
t 1 –
Aug
ust 2
006
App
endi
x A
. Dat
a F
orm
B1
cod
e in
dic
ato
r sc
ore
g
uid
ance
48
. S
eaJo
in
Est
uar
y c
onne
ctio
n w
ith
oce
an.
d
escr
ipti
on
sc
ore
E
stuar
ine
connec
tion t
o o
cean
is
lost
reg
ula
rly,
at l
east
once
ev
ery 1
-10 y
rs (
som
e “b
lind”
estu
arie
s an
d c
oas
tal
lagoons)
. 0.
01
Usu
ally
connec
ted t
o o
cean
, an
d a
lmost
the
enti
re e
stuar
y i
s sa
line
due
to m
inim
al f
resh
wat
er i
nput
(as
in s
om
e “b
ar b
uil
t” e
stuar
ies)
.
0.50
Alw
ays
connec
ted t
o o
cean
, w
ith
mu
ch f
resh
wat
er i
nput
from
fe
eder
str
eam
s an
d/o
r ri
ver
. 1.
00
sc
ore
#48
:
ce
rtai
nty
#48
:
Use
d f
or:
A
fish
, M
fish
, [N
FW
].
49.
Est
u%
WL
R
elat
ive
dom
inan
ce o
f un
dike
d ti
dal w
etla
nds
in t
his
est
uar
y.
U
se t
he
score
fro
m t
he
appro
pri
ate
estu
ary i
n t
his
lis
t:
Als
ea =
0.8
; B
eav
er C
r .=
0.9
; C
het
co =
0.1
; C
oos
Bay
= 0
.7;
C
oquil
le =
0.5
; E
cola
= 0
.5;
Elk
R. =
0.3
; E
uch
re-G
reggs
Cr.
= 0
.3;
N
ecan
icum
= 0
.7;
Neh
alem
= 0
.9;
Nes
tucc
a =
0.4
; N
etar
ts =
1.0
;
New
Riv
er =
0.8
; P
isto
l =
0.2
; R
og
ue
= 0
.2;
Sal
mo
n =
1.0
;
San
d L
ake
= 0
.3;
Sil
etz
= 0
.9;
Sil
tcoos
= 0
.5;
Siu
slaw
= 1
.0;
S
ixes
= 0
.2;
Ten
Mil
e =
0.8
; T
illa
mook =
0.6
; T
wo M
ile
= 0
.4;
U
mp
qu
a =
0.7
; W
inch
uck
= 0
.1;
Yaq
uin
a =
0.8
sc
ore
#49
:
ce
rtai
nty
#49
:
Nu
mb
ers
wer
e b
ased
on
rat
io o
f ti
dal
mar
sh t
o
subti
dal
wat
er, as
wel
l as
on t
ota
l ac
res
of
tidal
m
arsh
. T
hey
do
no
t ac
cou
nt
for
pre
vio
us
exte
nt
or
his
tori
cal
loss
es o
f ti
dal
wet
lan
ds.
U
sed
fo
r: A
fish
, [N
FW
].
sco
re #
48:
cert
ain
ty #
48:
sco
re #
49:
cert
ain
ty #
49:
58 Hydrogeomorphic Assessment Guidebook for Tidal Wetlands of the Oregon Coast, Part 1 – August 2006
This form
includes indicators known from
technical literature or reasoned ecological principles to be associated with one or m
ore of the 12key functions of tidal w
etlands. Some of the indicators w
ere correlated statistically with one or m
ore indicators of risk from Form
A1. O
th-ers w
ere uncorrelated, either due to the imprecision w
ith which they and/or the R
isk indicators were estim
ated, or to their bei ng intrinsicallyunaffected by hum
an activities. The uncorrelated functions w
ere included because of their importance to assessing the functions, as docu-
mented in Part 2 of this guidebook. N
ote: A higher num
ber for a particular indicator below does not alw
ays mean greater function–the
number depends on the function and the indicator. Italicized term
s are defined in the last column. A
bbreviations for functions in the lastcolum
n are shown in A
ppendix B.
Data F
orm
B2. R
apid
Ind
icators o
f Fu
nctio
n R
equ
iring
Aerial
Ph
oto
grap
hs o
r Measu
ring
Eq
uip
men
t
Appendix A
©2006 H
GM
Guidebook
Hydrogeom
orphic Assessm
ent Guidebook for T
idal Wetlands of the O
regon Coast, P
art 1 – August 2006
Appendix A
. Data F
orm B
2, Intro
.

59August 2006 – Hydrogeomorphic Assessment Guidebook for Tidal Wetlands of the Oregon Coast, Part 1
©20
06 H
GM
Gui
debo
okP
age
1/4
Hyd
roge
omor
phic
Ass
essm
ent G
uide
book
for T
idal
Wet
land
s of
the
Ore
gon
Coa
st, P
art 1
– A
ugus
t 200
6A
ppen
dix
A. D
ata
For
m B
2
cod
e in
dic
ato
r sc
ore
g
uid
ance
50
. W
etF
ield
%
Per
cent
of
land w
ithin
1.5
mi.
th
at a
ppea
rs (
in a
1:2
4,0
00
scal
e ae
rial
photo
gra
ph)
to b
e po
nds,
lak
es, n
on
tid
al m
arsh
, se
wag
e la
goons,
cro
pla
nd
, or
pas
ture
in fl
at te
rrai
n.
%
sc
ore
<
5
0.01
5
-9
0.25
1
0-1
9
0.50
2
0-2
9
0.75
>
29
1.
00
sc
ore
#50
:
ce
rtai
nty
#50
:
Fla
t ter
rain
= s
lop
es l
ess
than
ab
ou
t 1
0%
. A
fter
dra
win
g a
cir
cle
of
1.5
mi.
rad
ius
from
the
wet
land
cen
ter
(4 i
nch
es o
n a
1:2
4,0
00 s
cale
aer
ial
pho
tog
raph
or
map
), m
easu
re t
he
acre
age
of
the
nam
ed c
ov
er t
yp
es a
nd
d
ivid
e b
y 4
5.2
4 t
o g
et t
he
per
cen
t. P
erfo
rmin
g t
his
m
easu
rem
ent
wit
h a
GIS
is
pre
ferr
ed.
If n
o a
cces
s to
aer
ial
ph
oto
gra
ph
s, a
ttem
pt
to e
stim
ate
bu
t sc
ore
cer
tain
ty “
0.0
1”.
U
sed
fo
r: N
FW
, S
bir
d, D
ux
.
51.
Bu
ffC
ov
Per
cent
of
the
area
su
rroundin
g t
his
wet
land t
hat
appea
rs (
in
a 1:2
4,0
00 s
cale
aer
ial
photo
gra
ph)
to b
e de
velo
ped
or
pers
iste
ntly
bar
e.
<5%
6-
14%
15
-24%
>
25%
w
ith
in 1
500
ft:
0.
50
0.25
0.
15
0.10
w
ith
in 3
000
ft:
0.
50
0.20
0.
10
0.01
S
elec
t o
ne
nu
mb
er f
rom
eac
h r
ow
and
su
m t
hem
to
der
ive
the
sco
re.
sc
ore
#51
:
ce
rtai
nty
#51
:
Dev
elop
ed =
law
ns,
lan
dsc
apin
g, p
avem
ent,
bu
ild
ing
s.
Per
sist
ently
bar
e =
bar
e co
mp
acte
d s
oil
or
rock
(not
sand
du
nes
).
Aft
er d
raw
ing a
cir
cle
of
1500 f
t. o
utw
ard f
rom
the
wet
land
cente
r (3
/4 i
nch
on a
1:2
4000 a
eria
l photo
gra
ph o
r m
ap),
su
btr
act
fro
m 1
62
acr
es (
the
area
of
the
circ
le)
the
acre
age
of
any i
ncl
uded
tid
elan
ds.
T
hen
div
ide
the
dev
elo
ped
acr
es y
ou
m
easu
red b
y t
his
num
ber
. D
o l
ikew
ise
for
the
3000’
circ
le,
but
subst
itute
650 f
or
162. M
ult
iply
the
resu
lts
by 1
00 t
o g
et
per
cent.
P
erfo
rmin
g t
his
mea
sure
men
t w
ith a
GIS
is
pre
ferr
ed.
If
no a
cces
s to
aer
ial
photo
gra
phs,
att
emp
t to
es
tim
ate
but
score
cer
tain
ty “
0.0
1”.
U
sed
fo
r: N
FW
, L
bir
dM
.
sco
re #
50:
cert
ain
ty #
50:
sco
re #
51:
cert
ain
ty #
51:

60 Hydrogeomorphic Assessment Guidebook for Tidal Wetlands of the Oregon Coast, Part 1 – August 2006
©2006 H
GM
GuidebookP
age 2/4H
ydrogeomorphic A
ssessment G
uidebook for Tidal W
etlands of the Oregon C
oast, Part 1 – A
ugust 2006A
ppendix A. D
ata Form
B2
cod
e in
dicato
r sco
re g
uid
ance
52. B
lind
L
Internal channel complexity
. W
hile v
iewin
g a 1
:24
,00
0 scale aerial p
ho
tog
raph
, imag
ine
all the w
etland’s blind channel seg
men
ts strun
g en
d-to
-end
an
d straig
hten
ed o
ut. R
elative to
the w
etland’s w
idth, w
ou
ld
their cu
mu
lative len
gth
be:
len
gth
relative to w
idth
sco
re less th
an h
alf (50%
) 0.01
50
-10
0%
0.20
1-1
.9 tim
es lon
ger
0.40 2
-2.9
times lo
ng
er 0.60
3-3
.9 tim
es lon
ger
0.80 >
3.9
times lo
ng
er 1.00
sco
re #52:
certain
ty #52:
Blind channels =
chan
nels lo
cated en
tirely w
ithin
the w
etland
(do n
ot o
rigin
ate in ad
join
ing u
plan
ds) th
at flood w
ith th
e in
com
ing
tide.
Width
= th
e wetlan
d’s m
axim
um
wid
th m
easured
p
erpen
dicu
lar to ad
join
ing
bay
or riv
er. If n
o access to
aerial ph
oto
grap
hs, attem
pt to
estimate b
ut
score certain
ty “0
.01”.
Used
for: A
Pro
d, W
Q, X
pt, In
v, A
fish, M
fish, R
fish, [N
FW
, S
bird
, Lb
irdM
].
score #52:
certainty #52:

61August 2006 – Hydrogeomorphic Assessment Guidebook for Tidal Wetlands of the Oregon Coast, Part 1
©20
06 H
GM
Gui
debo
okP
age
3/4
Hyd
roge
omor
phic
Ass
essm
ent G
uide
book
for T
idal
Wet
land
s of
the
Ore
gon
Coa
st, P
art 1
– A
ugus
t 200
6A
ppen
dix
A. D
ata
For
m B
2
cod
e in
dic
ato
r sc
ore
g
uid
ance
53
. E
xits
N
um
ber
of
inte
rnal
cha
nnel
exi
ts.
Co
un
t th
ese
usi
ng
a 1
:24
00
0 a
eria
l p
ho
tog
rap
h a
nd
en
ter
in
the
bo
tto
m b
ox
(“d
atu
m”)
in
th
e n
ext
colu
mn
.
Then
in t
he
top r
ow
of
the
rele
van
t ta
ble
bel
ow
(A
or
B),
fin
d
the
wet
land e
dge
length
. I
n t
hat
colu
mn
fin
d t
he
num
ber
of
chan
nel
exi
ts t
his
wet
land h
as.
Then
look a
long t
hat
row
to
the
last
colu
mn
for
the
resu
ltin
g s
core
. A
. W
etla
nd
s on
silt
, cla
y, o
r m
uck
sub
stra
te:
len
gth
of
exte
rnal
wet
ed
ge
(ft)
<1
000’
10
00-3
400’
>3
400’
sco
re
0 e
xit
s ts
0 e
xi
0 e
xit
s 0.
01
1
1-2
1-3
0.25
2
3
-5
-6
40.
50
3-4
1
0
2
6-
7-1
0.75
>
4
10
5
>
>1
1.00
B
. W
etla
nds
on s
and
sub
stra
te:
exit
s sc
ore
0
0.01
1
0.50
>
1
1.00
sc
ore
#53
:
ce
rtai
nty
#53
:
d
atu
m #
53:
Exi
ts =
wher
e in
tern
al c
han
nel
s fl
ow
in
to u
nveg
etat
ed w
ater
s o
r ti
def
lats
ou
tsid
e o
f th
e w
etla
nd
.
Ext
erna
l wet
edg
e le
ngth
is
mea
sure
d a
s th
e w
etla
nd’s
edg
e w
ith u
nveg
etat
ed w
ater
or
tidef
lat
at l
ow
tid
e.
For
chan
nel
s th
at c
on
nec
t at
bo
th e
nd
s to
a t
idef
lat
or
un
veg
etat
ed b
ay o
r ri
ver
, co
un
t both
en
ds
as e
xit
s.
Do n
ot
coun
t co
nst
ruct
ed
dra
inag
e d
itch
es.
IM
PO
RT
AN
T:
The
num
ber
of
exit
s is
str
ongly
rel
ated
to
mar
sh s
ize,
subst
rate
type,
and H
GM
subcl
ass—
som
etim
es
even
mo
re t
han
to
mar
sh d
istu
rban
ce. S
ee n
ote
fo
r #
52
, ab
ov
e.
If n
o a
cces
s to
aer
ial
ph
oto
gra
ph
s, a
ttem
pt
to e
stim
ate
bu
t sc
ore
cer
tain
ty “
0.0
1”.
U
sed
fo
r: A
Pro
d, W
Q, X
pt,
In
v, A
fish
, M
fish
, R
fish
, [N
FW
, S
bir
d, L
bir
dM
].
sco
re #
53:
cert
ain
ty #
53:
dat
um
#53
:

62 Hydrogeomorphic Assessment Guidebook for Tidal Wetlands of the Oregon Coast, Part 1 – August 2006
©2006 H
GM
GuidebookP
age 4/4H
ydrogeomorphic A
ssessment G
uidebook for Tidal W
etlands of the Oregon C
oast, Part 1 – A
ugust 2006A
ppendix A. D
ata Form
B2
cod
e in
dicato
r sco
re g
uid
ance
54. Ju
ncM
ax N
um
ber o
f intern
al channel junctions. C
ount th
ese along th
e single lo
ngest in
ternal ch
annel, u
sing a
1:2
40
00
scale aerial ph
oto
grap
h, an
d en
ter in th
e bottom b
ox
(“datu
m”) in
the n
ext co
lum
n.
Th
en in
top
row
of th
e relevan
t table b
elow
(A o
r B), fin
d th
e w
etland area. In
that co
lum
n fin
d th
e nu
mb
er of ch
ann
el junctions th
is wetlan
d h
as. Then
loo
k in
along th
at row
for
the last co
lum
n fo
r the resu
lting sco
re. A
. Wetlan
ds o
n silt, clay, or m
uck su
bstrate:
wetlan
d area (acres)
< 8 8-30
>30
sc
ore
0 jcts
0 jc
0 jc
0ts
ts .01
1
1
01-4
.50
2
-3
0.5
-7
75 >
1
>3
1.
>8
00
B. W
etlands o
n sand su
bstrate:
jun
ction
s sco
re 0
0.01 1
0.50 >
1
1.00
sco
re #54:
certain
ty #54:
d
atum
#54:
Junctions = v
isible co
nflu
ences b
etween
two in
ternal tid
al ch
annels reg
ardless o
f their relativ
e sizes. D
o n
ot co
un
t con
structed
drain
age d
itches.
Important: T
he n
um
ber o
f chan
nel ju
nctio
ns is stro
ngly
related
to m
arsh size, su
bstrat e ty
pe, an
d H
GM
subclass –
so
metim
es even
mo
re than
to m
arsh d
isturb
ance. S
ee no
te fo
r #5
2, ab
ov
e. If n
o access to
aerial ph
oto
grap
hs, attem
pt to
estimate b
ut
score certain
ty “0
.01”.
Used
for: A
Pro
d, W
Q, X
pt, In
v, A
fish, M
fish, R
fish, [N
FW
, S
bird
, Lb
irdM
].
55. F
reshS
po
t Internal freshw
ater. A
t a giv
en p
oin
t in tim
e, the m
axim
um
differen
ce betw
een
salinity
in u
nco
nfin
ed w
aters with
in th
e wetlan
d v
s. outsid
e th
e wetlan
d is:
d
ifference
score
in0.
ternal is <
10 p
pt fresh
er, or is m
ore salin
e 01
intern
al is 10-2
0 p
pt fresh
er 0.50
intern
al is >20 p
pt fresh
er 1.00
sco
re #5
5:
certain
ty #
55
:
Measu
re salinity
from
tidal w
ater (intern
al chan
nel o
r pool),
preferab
ly aro
un
d th
e time o
f low
tide, an
d su
btract fro
m
salinity
measu
red (alm
ost) sim
ult an
eously
in th
e adjo
inin
g
bay
or riv
er. If po
ssible, rep
e at du
ring
oth
er season
s and
use
the g
reatest differen
tial, which
often
is in m
id-su
mm
er. Do
no
t measu
re if any
rainfall h
as occu
rred in
last 24
ho
urs.
If no
access to a refracto
meter, attem
pt to
categorize b
ased o
n
any o
bserv
ed so
urces o
f freshw
ater input, b
ut sco
re certainty
“0
.01
”. U
sed fo
r: AP
rod
, Afish
, NF
W, D
ux
, Lb
irdM
, [WQ
, Xp
t, In
v].
score #54:
certainty #54:
datu
m #54:
score #55:
certainty #55:

63August 2006 – Hydrogeomorphic Assessment Guidebook for Tidal Wetlands of the Oregon Coast, Part 1
Data Form C. Rapid Indicators of the Values of Functions
Logs large enough to be elevatedsubstantially above the surfaceprovide perches for birds thatforage in tidal marshes.
This optional form for assessing values offunctions is perhaps the most time-consum-ing and requires the most thought and back-ground investigation. The required informa-tion often will not exist for a particular siteand may be unobtainable in the short-term.Nonetheless, values of functions are impor-tant in assessing fairly the overall importanceof particular tidal wetlands. Much of theform can be completed in the office and byconsulting other resource professionals andlocal citizens. It is best to complete this formafter assessing functions with forms B1 andB2. Note that the form is organized aroundfunctions, with one set of questions for eachof the 12 tidal wetland functions (in a fewcases, multiple functions are grouped). For
each row, place a check mark in whichevercolumn seems to better reflect the wetlandyou’re assessing. Alternatively, you mayscore each value indicator on a scale of 0(lowest value) to 1.0 (highest value) andplace the score in the middle column of eachrow. If some of the requested information isnot available, proceed with other items in theassessment. Then copy your data to theaccompanying spreadsheet. If you wish, youmay assign weights to each row, but there isno defensible way of mathematically com-bining the scores for individual values intoan overall value score for each function (i.e.,no total “values” scoring models). Note thatthese are proscriptive as well as descriptiveevaluations–designed to help prioritize aswell as describe.
Hydrogeomorphic Assessment Guidebook for Tidal Wetlands of the Oregon Coast, Part 1 – August 2006Appendix A. Data Form C, Intro.
©2006 HGM Guidebook

64 Hydrogeomorphic Assessment Guidebook for Tidal Wetlands of the Oregon Coast, Part 1 – August 2006Appendix A
Primary Production and Exporting Aboveground Production highest function value suggested
score (0 to 1)
lowest function value
___ The wetland’s tidal marsh plants are extensively and sustainably grazed, and livestock are an important part of the local economy.
#101: ___ The wetland currently is not grazed and, due to wetness or its location, has little potential as pasture.
___ The wetland’s estuary has not experienced major die-offs of marine animals as a result of diminished dissolved oxygen.
#102: ___ The wetland’s estuary has experienced frequent and major die-offs of marine animals as a result of diminished dissolved oxygen, and the wetland is near the estuary mouth or other areas where this has occurred.
___ Uplands in this estuary, especially those closest to the water, are largely devoid of vegetation, e.g., sand dunes, pavement.
#103: ___ Uplands in this estuary are completely vegetated.
___ The site is one of only a few, or is one of the largest ones, of its subclass* in this estuary that supports and exports primary production to at least this degree.
#104: ___ Sites of this subclass and size that support and/or export primary production to this degree are relatively abundant in this estuary.
___ Other factors suggest that primary production specifically from this wetland is of unusually great importance to food webs located in the wetland or in receiving waters of the adjoining estuary or river. Explain:
#105: ___ Other factors suggest that primary production specifically from this wetland is not especially important to food webs located in the wetland or in receiving waters of the adjoining estuary or river. Explain:
* Tidal wetlands are provisionally labeled by their HGM subclasses in maps on the accompanying DVD.
Hydrogeomorphic Assessment Guidebook for Tidal Wetlands of the Oregon Coast, Part 1 – August 2006Appendix A. Data Form C
©2006 HGM GuidebookPage 1/8

65August 2006 – Hydrogeomorphic Assessment Guidebook for Tidal Wetlands of the Oregon Coast, Part 1
Maintaining Element Cycling Rates and Pollutant Processing and Stabilizing Sediment highest function value suggested
score: lowest function value
opportunity to perform these functions: ___ Element inputs to the wetland may be relatively large as suggested by a score of 1.00 for items NutrIn, ChemIn, BuffAlt, and/or SedShed in the accompanying spreadsheet.
#106: ___ Element inputs to the wetland may be relatively small as suggested by a score of 0.01 for NutrIn, ChemIn, BuffAlt, and/or SedShed.
___ Large populations of salmon spawn very near the wetland.
#107: ___ Populations of spawning salmon are absent from this river basin.
___ Substantial volumes of woody and other organic matter enter the river or estuary a short distance upriver from the wetland as a result of recent fires, logging, or other factors.
#108: ___ Inputs of woody and other organic matter to the wetland are probably at or below historical (pre-settlement) rates.
___ Validated computer models of watershed processes indicate major net influx of sediments, nutrients, or metals to this estuary and wetland.
#109: ___ Validated computer models of watershed processes indicate no major delivery of sediments, nutrients, or metals to this estuary or wetland.
significance of this wetland (assuming these functions occur): ___ The site is near the estuary’s main head of tide.
#110: ___ The site is near the estuary mouth (where its individual effect, if any, may be dwarfed by marine circulation).
___ Rapid sedimentation and shoaling near the mouth of this estuary is a major concern and expense and/or the estuary is regularly dredged.
#111: ___ Sedimentation and shoaling near the mouth of this estuary are not a major concern or expense; no dredging occurs.
___ The wetland’s estuary has experienced frequent and major die-offs of marine animals as a result of diminished dissolved oxygen. The wetland is capable of processing internally much of the carbon it produces or imports, and thus avoids contributing to this problem. The wetland also is near the estuary mouth or other areas where severe oxygen deficits have occurred.
#112: ___ The wetland’s estuary has not experienced major die-offs of marine animals as a result of diminished dissolved oxygen.
___ The wetland is one of only a few of its subclass and size in this estuary that may stabilize sediments, remove nitrogen, and/or process carbon & pollutants to this or greater degree.
#113: ___ Wetlands of this subclass and size, that remove nitrogen or process carbon & pollutants to this or greater degree, are abundant in this estuary.
___ Other factors suggest that element cycling and removal functions of this wetland are of unusually great importance to biological or human resources in the wetland or in receiving waters of the estuary or river. Explain:
#114: ___ Other factors suggest that element cycling and removal functions of this wetland are not atypically important to biological or human resources in the wetland or in receiving waters of the estuary or river. Explain:
Hydrogeomorphic Assessment Guidebook for Tidal Wetlands of the Oregon Coast, Part 1 – August 2006Appendix A. Data Form C
©2006 HGM GuidebookPage 2/8

66 Hydrogeomorphic Assessment Guidebook for Tidal Wetlands of the Oregon Coast, Part 1 – August 2006
Maintaining Invertebrate Habitat highest function value suggested
score: lowest function value
___ This estuary ranks as one of the best for revenue and/or jobs from harvesting of crabs and other native mobile invertebrates.
#115: ___ This estuary supports little or no revenue and/or jobs from harvesting of native crabs and other native mobile invertebrates.
___ The wetland is one of a very few known on the Oregon coast known to be used by a particular native invertebrate species, and it otherwise supports a normal assemblage of invertebrates..
#116: ___ All invertebrate species known from this wetland are widespread in tidal wetlands of the Oregon coast.
___A large portion of the uplands and deeper waters near this wetland have very limited capacity to support invertebrates, e.g., largely devegetated, chemical contamination, frequent soil or sediment disturbance.
#117: ___ Upland and deepwater areas near this wetland have considerable capacity to support invertebrates, e.g., land cover is mostly unaltered, sedimentation is normal, there is little or no chemical contamination.
___ The site is one of only a few, or is one of the largest ones, of its subclass in this estuary that support native invertebrates to this or greater degree.
#118: ___ Sites of this subclass and size that support native invertebrates to this or greater degree are relatively abundant in this estuary.
___ Other factors suggest that invertebrate species or densities produced at this site are of unusually great importance to food webs or ecological processes in the wetland or its estuary. Explain:
#119: ___ Other factors suggest that invertebrate species or densities produced at this site are not atypically important to food webs or ecological processes in the wetland or its estuary. Explain:
Hydrogeomorphic Assessment Guidebook for Tidal Wetlands of the Oregon Coast, Part 1 – August 2006Appendix A. Data Form C
©2006 HGM GuidebookPage 3/8

67August 2006 – Hydrogeomorphic Assessment Guidebook for Tidal Wetlands of the Oregon Coast, Part 1
Maintaining Anadromous Fish highest function value suggested
score: lowest function value
___ One or more federally-listed anadromous fish species or subpopulations are known to use this particular wetland frequently and extensively during critical periods.
#120: ___ No federally-listed anadromous fish species (or recognized subpopulation) is known from the wetland or nearby waters.
___ In the past, considerable funds have been expended to restore or enhance this particular wetland specifically for (among perhaps many objectives) anadromous fish.
#121: ___ In the past, no funds have been expended to restore or enhance this particular wetland specifically for anadromous fish.
___ The site is one of only a few, or is one of the largest ones, of its subclass and size in this estuary that supports anadromous fish to this or greater degree.
#122: ___ Sites of this subclass and size that support anadromous fish to this or greater degree are relatively abundant in this estuary.
Maintaining Habitat for Resident Fish and Maintaining Habitat for Visiting Marine Fish highest function value suggested
score: lowest function value
___ This estuary ranks as one of the best for revenue and/or jobs from harvesting of resident and visiting marine fish.
#123: ___ This estuary supports little or no revenue and/or jobs from harvesting of resident and visiting marine fish.
___ The wetland is one of a very few on the Oregon coast known to be used by a particular non-anadromous fish.
#124: ___ All non-anadromous fish species known from this wetland are widespread in tidal wetlands of the Oregon coast.
___ The wetland or closely connected waters provide some of the most consistently productive fishing for native tidal marsh fish species and/or marine species on the Oregon coast.
#125: ___ Site does not provide atypically productive fishing for any native tidal marsh fish species or marine species on the Oregon coast.
___ The site is one of only a few, or is one of the largest ones, of its subclass in this estuary that supports non-anadromous fish to at least this degree.
#126: ___ Sites of this subclass and size that support non-anadromous fish to this degree or greater are relatively abundant in this estuary.
___ Other factors suggest that non-anadromous fish species or densities of native mobile invertebrates inhabiting the wetland are of unusually great importance to food webs or ecological processes in the wetland or closely connected waters. Explain:
#127: ___ Other factors suggest that non-anadromous fish species or densities of native mobile invertebrates inhabiting the wetland are not atypically important to food webs or ecological processes in the wetland or closely connected waters. Explain:
Hydrogeomorphic Assessment Guidebook for Tidal Wetlands of the Oregon Coast, Part 1 – August 2006Appendix A. Data Form C
©2006 HGM GuidebookPage 4/8
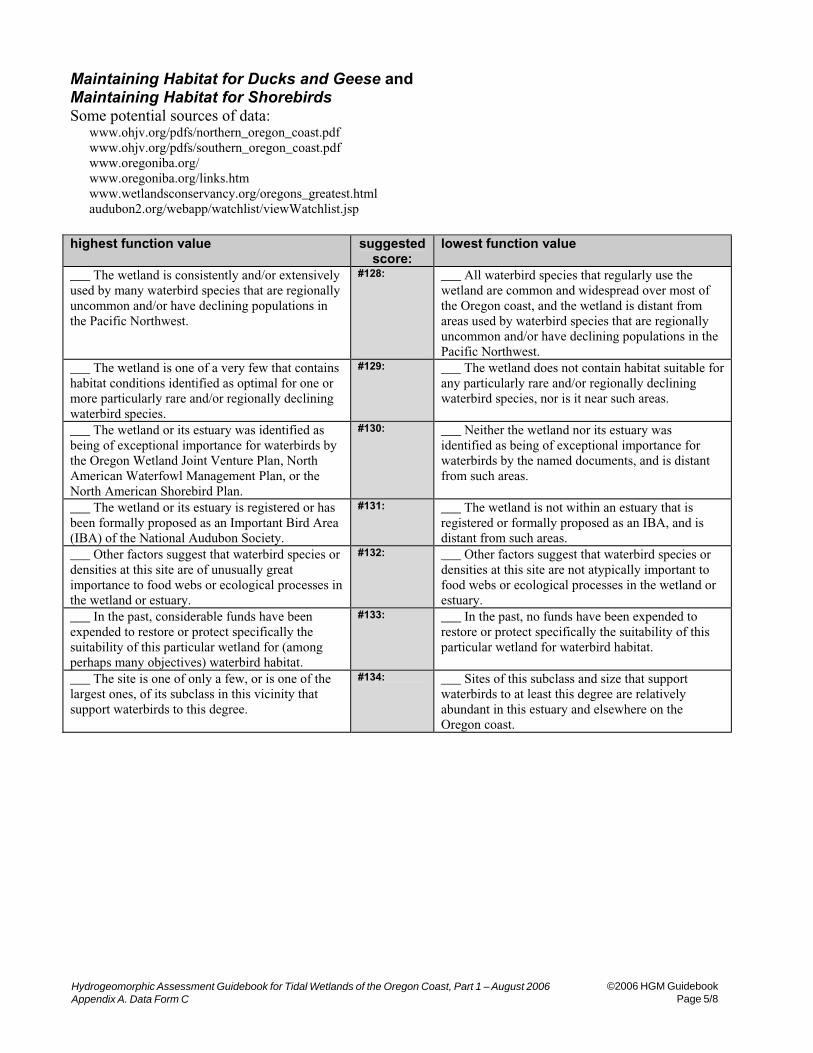
68 Hydrogeomorphic Assessment Guidebook for Tidal Wetlands of the Oregon Coast, Part 1 – August 2006
Maintaining Habitat for Ducks and Geese and Maintaining Habitat for Shorebirds Some potential sources of data:
www.ohjv.org/pdfs/northern_oregon_coast.pdf www.ohjv.org/pdfs/southern_oregon_coast.pdf www.oregoniba.org/ www.oregoniba.org/links.htm www.wetlandsconservancy.org/oregons_greatest.html audubon2.org/webapp/watchlist/viewWatchlist.jsp
highest function value suggested
score: lowest function value
___ The wetland is consistently and/or extensively used by many waterbird species that are regionally uncommon and/or have declining populations in the Pacific Northwest.
#128: ___ All waterbird species that regularly use the wetland are common and widespread over most of the Oregon coast, and the wetland is distant from areas used by waterbird species that are regionally uncommon and/or have declining populations in the Pacific Northwest.
___ The wetland is one of a very few that contains habitat conditions identified as optimal for one or more particularly rare and/or regionally declining waterbird species.
#129: ___ The wetland does not contain habitat suitable for any particularly rare and/or regionally declining waterbird species, nor is it near such areas.
___ The wetland or its estuary was identified as being of exceptional importance for waterbirds by the Oregon Wetland Joint Venture Plan, North American Waterfowl Management Plan, or the North American Shorebird Plan.
#130: ___ Neither the wetland nor its estuary was identified as being of exceptional importance for waterbirds by the named documents, and is distant from such areas.
___ The wetland or its estuary is registered or has been formally proposed as an Important Bird Area (IBA) of the National Audubon Society.
#131: ___ The wetland is not within an estuary that is registered or formally proposed as an IBA, and is distant from such areas.
___ Other factors suggest that waterbird species or densities at this site are of unusually great importance to food webs or ecological processes in the wetland or estuary.
#132: ___ Other factors suggest that waterbird species or densities at this site are not atypically important to food webs or ecological processes in the wetland or estuary.
___ In the past, considerable funds have been expended to restore or protect specifically the suitability of this particular wetland for (among perhaps many objectives) waterbird habitat.
#133: ___ In the past, no funds have been expended to restore or protect specifically the suitability of this particular wetland for waterbird habitat.
___ The site is one of only a few, or is one of the largest ones, of its subclass in this vicinity that support waterbirds to this degree.
#134: ___ Sites of this subclass and size that support waterbirds to at least this degree are relatively abundant in this estuary and elsewhere on the Oregon coast.
Hydrogeomorphic Assessment Guidebook for Tidal Wetlands of the Oregon Coast, Part 1 – August 2006Appendix A. Data Form C
©2006 HGM GuidebookPage 5/8

69August 2006 – Hydrogeomorphic Assessment Guidebook for Tidal Wetlands of the Oregon Coast, Part 1
Maintaining Habitat for Native LandBirds, Small Mammals, and Their Predators and Maintaining Habitat for Nekton-feeding Birds Some potential sources of data:
oregonstate.edu/ornhic/ www.oregoniba.org/ www.oregoniba.org/links.htm audubon2.org/webapp/watchlist/viewWatchlist.jsp
highest function value suggested
score: lowest function value
___ The wetland is consistently and/or extensively used by native land bird or mammal species that are listed as Threatened, Endangered, or Sensitive, or are recognized as conservation priority species or communities by Partners-in-Flight or the Oregon Natural Heritage Program.
#135: ___ No such species or communities are present in the wetland or nearby parts of the estuary.
__ Other native land bird or mammal species that are regionally uncommon and/or have declining populations in the Pacific Northwest are consistently and/or extensively present in the wetland.
#136: ___ All native land bird or mammal species that use this wetland occur widely on the Oregon coast and none are known to be declining at a regional scale.
___The wetland is one of a very few that contains habitat conditions identified as optimal for one or more particularly rare and/or regionally declining wetland-associated bird species (other than waterbirds).
#137: ___ The wetland does not contain habitat suitable for any particularly rare and/or regionally declining, wetland-associated bird species (excluding waterbird species).
___ Other factors suggest native land bird or mammal species or densities at this site are of unusually great importance to food webs or ecological processes in the wetland or its estuary.
#138: ___ Other factors suggest that native land bird or mammal species or densities at this site are not atypically important to food webs or ecological processes in the wetland or its estuary.
___ In the past, considerable funds have been expended to restore specifically the suitability of this particular site for (among perhaps many objectives) wetland-associated native land birds or mammals.
#139: ___ In the past, no funds have been expended to restore specifically the suitability of this particular site for wetland-associated native land bird or mammal species.
___ The site is one of only a few, or is one of the largest ones, of its subclass in this vicinity that support wetland-associated native land bird or mammal species to this degree.
#140: ___ Sites of this subclass and size that support native land bird or mammal species to this degree are relatively abundant both locally and regionally.
Hydrogeomorphic Assessment Guidebook for Tidal Wetlands of the Oregon Coast, Part 1 – August 2006Appendix A. Data Form C
©2006 HGM GuidebookPage 6/8

70 Hydrogeomorphic Assessment Guidebook for Tidal Wetlands of the Oregon Coast, Part 1 – August 2006
Maintaining Natural Botanical Conditions Some potential sources of data:
www.oregonstate.edu/ornhic www.npsoregon.org cladonia.nacse.org/platlas/jclass/OPAJava20.htm ocid.nacse.org/cgi-bin/qml/herbarium/plants/vherb.qml
highest function value suggested
score: lowest function value
___ Site contains many native plant species or associations that are uncommon and/or have declining populations in Oregon coastal tidelands. This may include, but is not limited to, species categorized as G1, G2, S1, or S2 by the Oregon Natural Heritage Program.
#141: ___ All plant species and associations at this site also occur widely in Oregon coastal tidelands, and none have been documented to be declining in the ecoregion.
___ Site is one of a very few that contains habitat conditions identified as optimal for one or more particularly rare and/or regionally declining native plant species or associations. This includes, for example, sites with extensive woody vegetation (especially Sitka spruce) that are regularly flooded by tides. In Oregon this is a relatively rare type of wetland that has declined dramatically.
#142: ___ Site does not contain habitat suitable for any particularly rare and/or regionally declining native plant species or association.
___ Other factors suggest that native plants at this site are of unusually great importance to food webs or ecological processes located onsite or in the region generally.
#143: ___ Other factors suggest that native plants at this site are not atypically important to food webs or ecological processes located onsite or in the region generally.
___ The site is one of only a few, or is one of the largest ones, of its subclass in this estuary that support native tidal vegetation to this degree.
#144: ___ Sites of this subclass and size that support characteristic vegetation to this degree are relatively abundant both in this estuary and regionally.
___ In the past, considerable funds have been expended to restore specifically the suitability of this particular site for unusual or characteristic native plant species or associations.
#145: ___ In the past, no funds have been expended to restore specifically the suitability of this particular site for native plant species.
Hydrogeomorphic Assessment Guidebook for Tidal Wetlands of the Oregon Coast, Part 1 – August 2006Appendix A. Data Form C
©2006 HGM GuidebookPage 7/8

71August 2006 – Hydrogeomorphic Assessment Guidebook for Tidal Wetlands of the Oregon Coast, Part 1
Other Factors Potentially Relating to Value or Concern A potential source of data: www.coastalatlas.net/metadata/TidalWetlandsofOregonsCoastalWatersheds,Scranton,2004.htm highest concern suggested
score: lowest concern
__ Loss of tidal wetlands has been greater in this estuary than in any other on the Oregon Coast.
#146: __ Loss of tidal wetlands has been less in this estuary than in any other on the Oregon Coast.
__ This wetland is the only one of its HGM subclass in this estuary.
#147: __ This wetland belongs to an HGM subclass that is the most common one in this estuary.
__ The wetland belongs to an HGM subclass that has experienced the most losses of any tidal HGM subclass in this estuary.
#148: __ The wetland belongs to an HGM subclass that has experienced the lowest losses (or greatest gain) of any tidal HGM subclass in this estuary.
__ The entire wetland is designated as a Hazardous Waste Site.
#149: ___ No portion of the wetland or its immediate tributaries is designated as a Hazardous Waste Site.
__ Much of the wetland is known to contain artifacts of high archaeological importance.
#150: __ None of the wetland is known to contain artifacts of high archaeological importance.
__ The wetland is visited by many people engaging in activities that are compatible (in moderation) with its natural functions, e.g., kayaking, educational tours, hunting, fishing, birding.
#151: __ The wetland is almost never visited, or is visited to such a large degree that some functions are impaired.
Hydrogeomorphic Assessment Guidebook for Tidal Wetlands of the Oregon Coast, Part 1 – August 2006Appendix A. Data Form C
©2006 HGM GuidebookPage 8/8

72 Hydrogeomorphic Assessment Guidebook for Tidal Wetlands of the Oregon Coast, Part 1 – August 2006

73August 2006 – Hydrogeomorphic Assessment Guidebook for Tidal Wetlands of the Oregon Coast, Part 1
Veg
etat
ion
Qu
adra
t D
ata
Fo
rm S
ite:
____
____
____
____
____
____
____
_ D
ate:
___
____
__
Tim
es:
____
____
____
____
__
Per
son
(s):
___
____
____
____
____
_
1 2
3 4
5 6
7 8
9 10
11
12
13
14
15
16
17
18
19
20
A
chill
ea m
illef
oliu
m
Ag
rost
is s
tolo
nif
era
(=al
ba)
Alis
ma
gra
min
eum
Aln
us
rub
ra
An
gel
ica
luci
da
Arg
enti
na
eged
ii
(= P
ote
nti
lla p
acif
ica)
Atr
iple
x p
atu
la
Bid
ens
cern
ua
Car
ex ly
ng
bye
i
C. o
bn
up
ta
Cas
tille
ja a
mb
igu
a
Cic
uta
do
ug
lasi
i
Cir
siu
m a
rven
se
C. v
ulg
are
Co
rdyl
anth
us
mar
itim
us
Co
tula
co
ron
op
ifo
lia
Cu
scu
ta s
alin
a
Des
cham
psi
a ca
esp
ito
sa
Dis
tich
lis s
pic
ata
Ele
och
aris
pal
ust
ris
E. p
arvu
la
Ep
ilob
ium
cili
ata
Ere
chti
tes
glo
mer
ata
Fes
tuca
ru
bra
F. a
run
din
acea
Gal
ium
ap
arin
e
G. t
rifi
du
m
Gla
ux
mar
itim
a
Gri
nd
elia
str
icta
Her
acle
um
lan
atu
m
Ho
lcu
s la
nat
us
Ho
rdeu
m b
rach
yan
ther
um
©20
06 H
GM
Gui
debo
okP
age
1/3
Hyd
roge
omor
phic
Ass
essm
ent G
uide
book
for T
idal
Wet
land
s of
the
Ore
gon
Coa
st, P
art 1
– A
ugus
t 200
6A
ppen
dix
A. V
eget
atio
n Q
uadr
at D
ata
For
m

74 Hydrogeomorphic Assessment Guidebook for Tidal Wetlands of the Oregon Coast, Part 1 – August 2006
1
2 3
4 5
6 7
8 9
10 11
12 13
14 15
16 17
18 19
20 Jau
mea carn
osa
Jun
cus b
alticus
J. acum
inatu
s
J. bu
fon
ius
J. effusu
s
J. gerard
ii
J. lesueu
rii
Lath
yrus p
alustris
Lilaeo
psis o
cciden
talis
Lim
on
ium
californ
icum
Lo
nicera in
volu
crata
Lo
tus co
rnicu
latus
Lu
dw
igia p
alustris
Lyth
rum
salicaria
Oen
anth
e sarmen
tosa
Paren
tucellia visco
sa
Ph
alaris arun
din
acea
Ph
leum
praten
se
Picea sitch
ensis
Plan
tago
maritim
a
Plectritis co
ng
esta
Pu
ccinellia p
um
ila
Ran
un
culu
s repen
s
Ru
mex aq
uaticu
s
R. co
ng
lom
eratus
R. crisp
us
Sag
ittaria latifolia
Salico
rnia virg
inica
Salix sp
p.
Sch
oen
op
lectus (S
cirpu
s) am
ericanu
s
Isolep
is (Scirp
us) cern
uu
s
Scirp
us m
aritimu
s
S. m
icrocarp
us
S. acu
tus
Sp
argan
ium
spp
.
Sp
ergu
laria canad
ensis
S. m
acroth
eca
S. salin
a (marin
a)
©2006 H
GM
GuidebookP
age 2/3H
ydrogeomorphic A
ssessment G
uidebook for Tidal W
etlands of the Oregon C
oast, Part 1 – A
ugust 2006A
ppendix A. V
egetation Quadrat D
ata Form

75August 2006 – Hydrogeomorphic Assessment Guidebook for Tidal Wetlands of the Oregon Coast, Part 1
1
2 3
4 5
6 7
8 9
10
11
12
13
14
15
16
17
18
19
20
Sp
irae
a d
ou
gla
sii
Ste
llari
a h
um
ifu
sa
Sym
ph
yotr
ich
um
(A
ster
) su
bsp
icat
us
Tri
foliu
m r
epen
s
T. w
orm
sko
ljii
Tri
glo
chin
co
nci
nn
um
T. m
arit
imu
m
Typ
ha
lati
folia
Ver
on
ica
amer
ican
a
Vic
ia s
pp
.
©20
06 H
GM
Gui
debo
okP
age
3/3
Hyd
roge
omor
phic
Ass
essm
ent G
uide
book
for T
idal
Wet
land
s of
the
Ore
gon
Coa
st, P
art 1
– A
ugus
t 200
6A
ppen
dix
A. V
eget
atio
n Q
uadr
at D
ata
For
m

76 Hydrogeomorphic Assessment Guidebook for Tidal Wetlands of the Oregon Coast, Part 1 – August 2006

77August 2006 – Hydrogeomorphic Assessment Guidebook for Tidal Wetlands of the Oregon Coast, Part 1
Appendix B. Abbreviations Used In This Document
Function abbreviations
used in this document
description
Afish Maintain Habitat for Anadromous Fish
AProd Produce Aboveground Organic Matter
BotC Maintain Natural Botanical Conditions
Dux Maintain Habitat for Ducks and Geese
Inv Maintain Habitat for Native Invertebrates
LbirdM Maintain Habitat for Native Landbirds, Small Mammals, & Their Predators
Mfish Maintain Habitat for Visiting Marine Fish
NFW Maintain Habitat for Nekton-feeding Birds
RA Assessment of Risks to Wetland Integrity & Sustainability
Rfish Maintain Habitat for Other Visiting and Resident Fish
Sbird Maintain Habitat for Shorebirds
WI Wetland Integrity
WQ Maintain Element Cycling Rates and Pollutant Processing; Stabilize Sediment
Xpt Export Aboveground Plant & Animal Production
Appendix B

78 Hydrogeomorphic Assessment Guidebook for Tidal Wetlands of the Oregon Coast, Part 1 – August 2006
The abbreviations of the indicator variables are listed in Appendix A and in the left-hand columns ofForms B1 and B2. In the following formulas, “*” denotes multiplication. Items within parenthesesare averaged (AVG) or their maximum (MAX) is taken. Calculations involving items within brack-ets are performed only after calculations within parentheses contained within those brackets areperformed. Reasons for the particular choices of combination rules are given in Part 2 of thisguidebook. The accompanying Excel™ spreadsheet will produce the same scores, but in somecases slightly different formulas were embedded for more efficient data processing.
Scoring Models
Produce Aboveground Organic Matter (AProd)NutrIn + [(AVG: Fresh, FreshSpot) + Pform – Bare – SoilX – Shade
Export Aboveground Plant & Animal Production (Xpt)AProd + [AVG: BlindL, Jcts, Exits, Flood, TribL, (1- Width)]
Maintain Element Cycling Rates and Pollutant Processing; Stabilize Sediment (WQ)AProd + (AVG: BlindL, Jcts, Exits, Flood) + Width + UpEdge + SoilFine –[AVG: TranAng, (1-RatioC), Fetch, SoilX]
Maintain Habitat for Native Invertebrates (Inv)AProd + (AVG: BlindL, Jcts, Exits) + (AVG: Pform, FormDiv, SppPerQd) + (MAX: Eelg, Alder) +(AVG: Fetch, LWDchan, LWDline, Pannes, UpEdge) + (AVG: Fresh, FreshSpot, TribL) – Invas –ChemIn – SedShed – Instabil – (1-Island)
Maintain Habitat for Anadromous Fish (Afish)(AVG: Flood, SeaJoin) * {AVG [Inv, Estu%WL, (AVG: BlindL, Jcts, Exits), (1-ChemIn)} +(MAX: Eelg, LWDchan) + (MAX: TribL, Fresh, FreshSpot) + EstuSal + ShadeLM
Maintain Habitat for Marine Fish (Mfish)(AVG: Flood, SeaJoin) * {AVG [Inv, Eelg, (AVG: BlindL, Jcts, Exits), (1-ChemIn)]}
Maintain Habitat for Other Visiting and Resident Fish (Rfish)Flood * + [(MAX: LWDchan, Eelg) + (MAX: TribL, Fresh, FreshSpot) + Pannes]
Maintain Habitat for Nekton-feeding Wildlife (NFW)(MAX: Rfish, Afish, Mfish) + (AVG: TribL, BlindL, Exits, Jcts) + (MAX: Bare, MudW, Pannes) +(AVG: WetField%, Fresh, FreshSpot) + [AVG: BuffCov, (1-FootVis), (1-Boats)]
Maintain Habitat for Ducks and Geese (Dux)(AVG: BlindL, Exits, Jcts, Flood) + (AVG: Eelg, Bare, MudW, NutrIn, Pform) +(AVG: Fresh, FreshSpot, TribL) + WetField% + (1 – Fetch) + {[MAX: (Width, 1 - Island)] –[AVG: FootVis, Boats]}
Appendix C. Scoring Models and Scales Used to Assess theFunctions
Appendix C
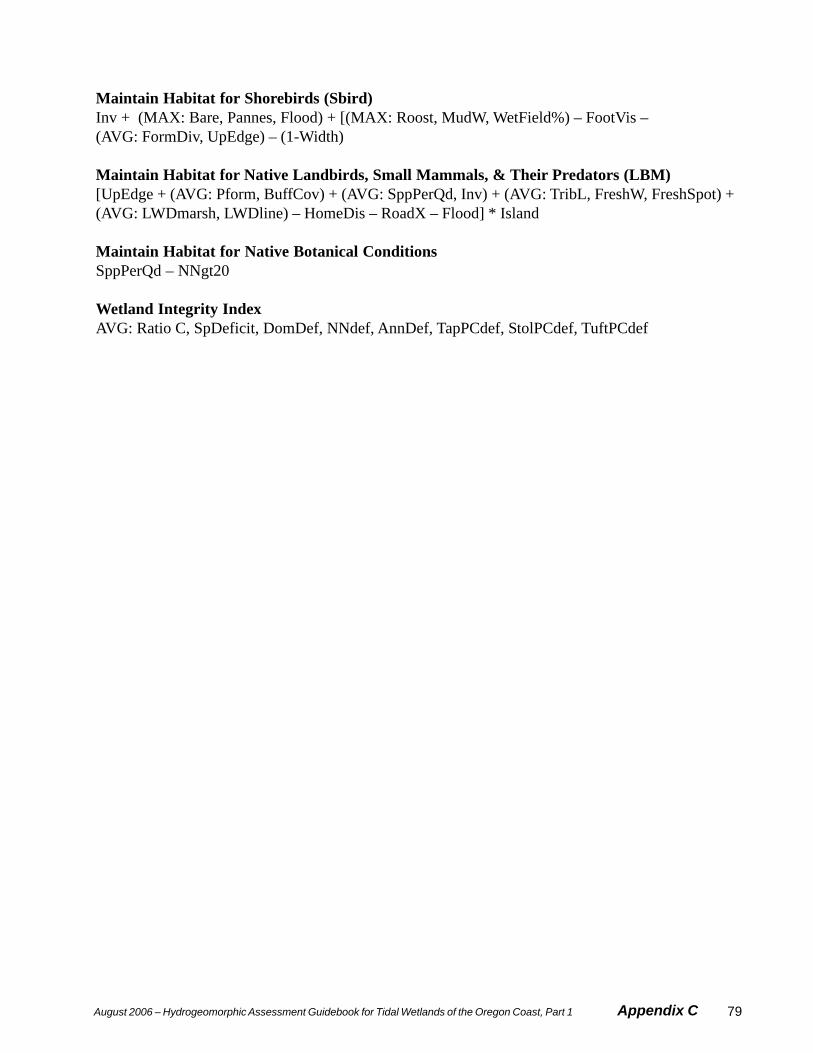
79August 2006 – Hydrogeomorphic Assessment Guidebook for Tidal Wetlands of the Oregon Coast, Part 1
Maintain Habitat for Shorebirds (Sbird)Inv + (MAX: Bare, Pannes, Flood) + [(MAX: Roost, MudW, WetField%) – FootVis –(AVG: FormDiv, UpEdge) – (1-Width)
Maintain Habitat for Native Landbirds, Small Mammals, & Their Predators (LBM)[UpEdge + (AVG: Pform, BuffCov) + (AVG: SppPerQd, Inv) + (AVG: TribL, FreshW, FreshSpot) +(AVG: LWDmarsh, LWDline) – HomeDis – RoadX – Flood] * Island
Maintain Habitat for Native Botanical ConditionsSppPerQd – NNgt20
Wetland Integrity IndexAVG: Ratio C, SpDeficit, DomDef, NNdef, AnnDef, TapPCdef, StolPCdef, TuftPCdef
Appendix C
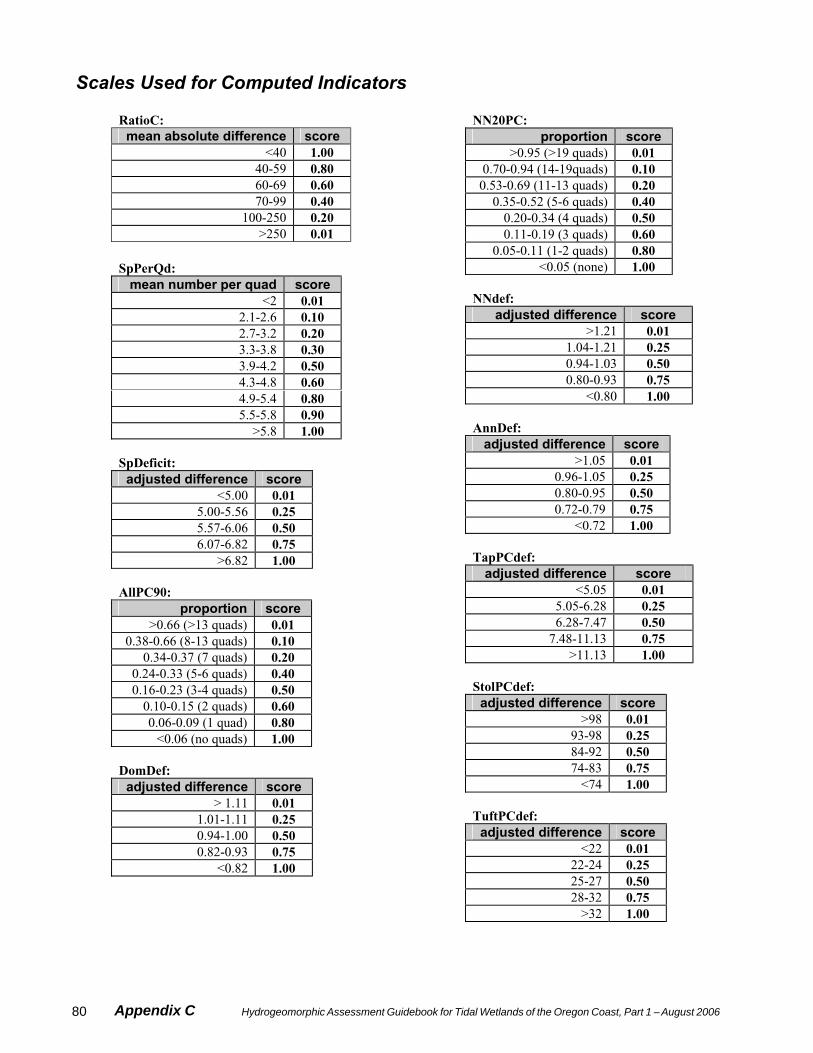
80 Hydrogeomorphic Assessment Guidebook for Tidal Wetlands of the Oregon Coast, Part 1 – August 2006
Scales Used for Computed Indicators RatioC:
mean absolute difference score <40 1.00
40-59 0.80 60-69 0.60 70-99 0.40
100-250 0.20 >250 0.01
SpPerQd:
mean number per quad score <2 0.01
2.1-2.6 0.10 2.7-3.2 0.20 3.3-3.8 0.30 3.9-4.2 0.50 4.3-4.8 0.60 4.9-5.4 0.80 5.5-5.8 0.90
>5.8 1.00 SpDeficit:
adjusted difference score <5.00 0.01
5.00-5.56 0.25 5.57-6.06 0.50 6.07-6.82 0.75
>6.82 1.00 AllPC90:
proportion score >0.66 (>13 quads) 0.01
0.38-0.66 (8-13 quads) 0.10 0.34-0.37 (7 quads) 0.20
0.24-0.33 (5-6 quads) 0.40 0.16-0.23 (3-4 quads) 0.50
0.10-0.15 (2 quads) 0.60 0.06-0.09 (1 quad) 0.80
<0.06 (no quads) 1.00 DomDef:
adjusted difference score > 1.11 0.01
1.01-1.11 0.25 0.94-1.00 0.50 0.82-0.93 0.75
<0.82 1.00
NN20PC:
proportion score >0.95 (>19 quads) 0.01
0.70-0.94 (14-19quads) 0.10 0.53-0.69 (11-13 quads) 0.20
0.35-0.52 (5-6 quads) 0.40 0.20-0.34 (4 quads) 0.50 0.11-0.19 (3 quads) 0.60
0.05-0.11 (1-2 quads) 0.80 <0.05 (none) 1.00
NNdef:
adjusted difference score >1.21 0.01
1.04-1.21 0.25 0.94-1.03 0.50 0.80-0.93 0.75
<0.80 1.00 AnnDef:
adjusted difference score >1.05 0.01
0.96-1.05 0.25 0.80-0.95 0.50 0.72-0.79 0.75
<0.72 1.00 TapPCdef:
adjusted difference score <5.05 0.01
5.05-6.28 0.25 6.28-7.47 0.50
7.48-11.13 0.75 >11.13 1.00
StolPCdef:
adjusted difference score >98 0.01
93-98 0.25 84-92 0.50 74-83 0.75
<74 1.00 TuftPCdef:
adjusted difference score <22 0.01
22-24 0.25 25-27 0.50 28-32 0.75
>32 1.00
Appendix C

81August 2006 – Hydrogeomorphic Assessment Guidebook for Tidal Wetlands of the Oregon Coast, Part 1
Appendix D. Glossary
Assessment unit: (also called “site” or “assessment area”) the wetland area that is being examined;may include all or part of an entire marsh, wetland, or wetland polygon. If the wetland containsmultiple HGM subclasses, it is classified according to whichever subclass comprises the largestarea. If one of the component subclasses comprises more than 20% of the area, that area is assessedas a separate unit.
Calibration: the process of standardizing (scaling) data to a specific numeric range (scale) bydividing by a constant, such as the maximum value in a data set.
Channel: a distinct semi-linear depression with a definable outlet and with identifiable bank edgesthat have been shaped by flowing water; includes manmade ditches and swales that may flow onlyintermittently, and includes both tidal channels and non-tidal (stream or river) channels.
Channel pool: an unvegetated, intermittently-isolated depression (of least 2m2) in a channelbottom, that fails to empty completely during low tide. Salinity is similar to that of the channelnetwork to which it connects during high tide. Compare with panne and fresh pool.
Ecoregion: a large geographic area delimited by its relative homogeneity of climate, topography,and land cover.
External edge: the interface between vegetation at the lowest point in the low marsh (i.e., the outeredge of the marsh) and unvegetated tidal or subtidal habitat (the receiving waters).
Fetch: the distance over water in which waves are generated by a wind having a constant directionand speed. Generally considered synonymous with the maximum open water distance in thedirection from which the strongest and most constant winds blow.
Flood tide: the rising tide that occurs twice daily in Oregon.
Fresh pool: an unvegetated, apparently-isolated depression of least 2m2 in the surface of the highmarsh plain, of natural or artificial origin, that contains surface water whose salinity is less than thatof nearby channels. Fed mainly by rain and/or groundwater discharge. Adjoining vegetation is nothalophytic. Compare with panne and channel pool.
Function: what a site does; especially, the hydrologic, geochemical, and biological processes it(potentially) performs without human assistance. Functions support ecosystems and economies.
Function capacity: an estimate of the rate or magnitude (i.e., effectiveness, sensu Adamus 1983)an assessment site and its supporting landscape perform a specified function, relative to otherwetland sites in its subclass. Termed “potential functional performance” by Hruby et al. (1999).
HGM: see Hydrogeomorphic.
Appendix D

82 Hydrogeomorphic Assessment Guidebook for Tidal Wetlands of the Oregon Coast, Part 1 – August 2006
High marsh: a wetland that is inundated by tidal surface water at least once annually but not daily.Synonymous with supratidal marsh and with the MSH (marine-sourced high) subclass of theOregon HGM classification scheme.
High tide: as used in this guidebook, the maximum height reached by the two rising tides thatoccur daily at a given location. Mean high tide is the average of all daily high tides at the locationover the span of a month.
Highest functioning standard: a site or small group of sites that received the highest score for aspecified function, among a much larger group of sites similarly assessed.
Hydrogeomorphic (HGM): pertaining to water, geologic setting, and/or morphological (landform)features.
Hydrogeomorphic (HGM) approach: a framework (Smith et al. 1995) for the regionaldevelopment of rapid assessment methods that features: (a) preclassification of wetland sitesaccording to their likely water sources and flow direction; (b) use of rapid indicators of wetlandfunctions, based on regional literature review and expert opinion; (c) calibration of the indicators ata series of regional reference sites prior to methods development; and (d) specification of rules(scoring models) to combine the calibrated data for individual indicators into scores representingrelative capacity of each of a site’s wetland functions.
Hydrogeomorphic (HGM) Classification: the national classification of wetlands based ongeomorphic setting, water source and transport, and hydrodynamics, as proposed by Brinson (1993).Use of a regionalization of this approach for Oregon (Adamus 2001b) is required by the OregonDepartment of State Lands in applications for Removal-Fill permits and for local WetlandsInventories.
HGM subclass: one of 13 types of wetlands, defined by hydrological and geomorphiccharacteristics, that occur in Oregon, as described by Adamus (2001b). Three of these subclassesare the subject of this guidebook.
Indicator: characteristics or variables that are relatively easy to observe and (in this guidebook) arebelieved to correlate with (but are not necessarily causally linked with) processes that supportspecific wetland or riparian functions. Not limited to “field indicators” used to delineate wetlands.
Integrity: see Wetland Integrity.
Internal tidal channel: a low-gradient tidal channel that is surrounded by marsh, is much narrowerthan the marsh, and may not extend into uplands beyond the marsh.
Inundated, Inundation: covered wholly or partly with surface water; the water may come directlyfrom precipitation, subsurface water table rise, runoff, tides, or channel flow.
Least-altered standard: a site or small group of sites that, by consensus, are the least likely amongmany in a region to have been exposed to lasting or chronically serious alterations as a result ofhuman activities.
Appendix D

83August 2006 – Hydrogeomorphic Assessment Guidebook for Tidal Wetlands of the Oregon Coast, Part 1
Low marsh: a marsh that is inundated twice daily by the tide. Synonymous with intertidal marsh.Includes the MSL (marine-sourced low) and RS (river-sourced) subclasses of the Oregon HGMclassification scheme.
Low tide: as used in this guidebook, the lowest level reached by the two falling (ebbing) tides thatoccur daily at a given location. Mean low tide is the average of all daily low tides at the locationover the span of a month.
Model, scoring: a mathematical device (formula, equation) for combining numeric estimates ofindicators, in a manner thought to represent function or some other attribute of a site.
MSH: see High Marsh.
MSL: see Low Marsh. (Also an abbreviation for Mean Sea Level, but not used in that context inthis guidebook.)
Neap tide: a tide occurring at or near the time of half-moons. The neap tide range is usually 10%to 30% less than the mean tidal range.
Non-native: species not present in Oregon tidal marshes during pre-settlement times, but currentlyoccurring as the result of natural or human-aided establishment. Used synonymously with “exotic”or “alien” species. Includes a few species, e.g., Phalaris arundinacea, that were historically presentbut whose range and regional dominance has expanded tremendously.
Panne (also spelled pan): a mostly-unvegetated, apparently isolated, generally circular or ovalmicrodepression in the surface of the high or low marsh plain, generally at least 2m2 in area,sometimes caused by shading and tidal scouring around deposited logs and driftwood, or by relictsof former channels or ditches. May or may not contain surface water; the salinity of any surfacewater is usually equal or greater than that of the nearest tidal channel. If vegetation is present, it isgenerally sparse and comprised mainly of halophytic species. Compare with fresh pool and channelpool.
Pannes are naturally-occurring shallowdepressions in themarsh surface thatoften have verydifferent salinity andvegetation.
Appendix D

84 Hydrogeomorphic Assessment Guidebook for Tidal Wetlands of the Oregon Coast, Part 1 – August 2006
Predominant, Predominating, Predominance: comprising the largest portion of space in thehorizontal dimension; need not comprise a majority of the space (i.e., 50% or any other threshold).
Quadrat: a square-shaped unit, generally a few meters or less per side, used to standardizesampling. Sometimes used synonymously with “plot.”
Reference site: an assessment site or unit that, together with others, is used to calibrate regionalscoring models of wetland function for the particular HGM subclass. Such sites are selected toencompass the expected natural and human variability among wetlands of their subclass in theregion. In the HGM method, altered sites are allowed to be reference sites (see Reference StandardSite).
Reference standard site: a reference site that, along with a very few others, is among the least-altered sites of its type in an ecoregion. Data from such sites may be used as the “gold standard”against which the performance of other wetlands (of the same subclass and ecoregion) may bejudged.
Risk (to wetland integrity): the probability that stressors may, over the short or long term, threaten awetland’s geomorphic and/or biological integrity, primarily as related to the magnitude and durationof the stressor rather than to the intrinsic sensitivity of the wetland.
Salt marsh: a tidal marsh that is predominantly influenced by marine-sourced waters.
Site: the tidal marsh assessment area or polygon. Tidal marshes do not always exist as highlydiscrete units in space and time.
Shrub: a woody plant that is between 6 and 20ft. tall; includes early stages of species thateventually grow to be trees.
Spring tide: a tide occurring at or near the time of new or full moon and that rises highest and fallslowest from the mean sea level.
Tidal amplitude: the difference in level between low tide and high tide on a given day.
Tidal range: the difference in level between all low and high tides at a specific location andaveraged over a long period, generally 18.6 years.
Tidal channel: a channel whose water is primarily from downgradient (subtidal) sources; the wateris transported into the tidal channel by tidal forces. Such channels are often “blind,” i.e., are notconnected to freshwater subsidiary tributaries that enter the marsh from its upland edge.
Tidal marsh: a wetland, usually with a predominance of emergent herbaceous vegetation, thatusually is inundated by the tide once or twice a month during spring high tides, and once annually atthe very least. Includes both low (intertidal) and high (supratidal) marsh. As used in this guide,includes tidal shrub and spruce wetlands, but not eelgrass beds. May have fresh, saline, or brackishsurface water.
Tidal prism: the difference in water volume between high and low tide.
Appendix D

85August 2006 – Hydrogeomorphic Assessment Guidebook for Tidal Wetlands of the Oregon Coast, Part 1
Tidegate: a mechanical device placed in a dike or natural riverbank to block saltwater fromentering channels and lowlands behind the dike that otherwise would be flooded by high tide whileallowing fresh water to drain during low tide. Tidal fluctuations behind the point where it is placedare eliminated or muted. Tidegates may consist of a wooden or metal flap hinged on the top of adownstream end of a culvert. The tidegate is positioned so that a rising tide forces the gate againstthe culvert, preventing flooding inside the dike by the rising tide. Freshwater then backs up behindthe gate. On the ebb tide, the gate opens when the downstream level is lower than the freshwaterlevel, allowing drainage of the land or wetland behind the dike (Giannico & Souder 2004a, b).
Topographic map: a map showing elevations. Maps at a very coarse scale can be viewed online at:topozone.com .
Tree: for purposes of this guidebook, a woody plant taller than 20ft.
Tributaries: non-tidal freshwater subsidiary channels, that may or may not contain water year-round, and which traverse the marsh on their path into the mainstem estuarine channel or bay.
Upland: as used in this guidebook, any terrestrial area not exposed to tides. Includes freshwaterwetlands that are not so exposed, but which may remain inundated for long periods due to runofffrom the watershed. Often delimited by the transition from herbaceous marsh to closed-canopywoodland or sand dune, and sometimes by a line of weathered driftwood.
Values: as used in this guidebook, the economic, ecological, or social importance assigned afunction as a result of its opportunity to provide functions, goods, and services–and the significanceof these.
Variable: as used in this guidebook, a factor that determines wetland function; may or may not berelatively easy to measure (see Indicator).
Wetland integrity: the ability of a wetland to support and maintain: (a) dynamic hydrogeomorphicprocesses within the range found in wetlands that have experienced the least alteration by humans;and (b) a balanced, integrated, adaptive community of organisms having a species composition,diversity, and functional organization comparable to that found in relatively unaltered native habitatsof the region. That ability is also characterized as influenced by (and influencing) geomorphicprocesses. Together, these define the ability to support and maintain wetland complexity andcapacity for self-organization with respect to species composition, physical and chemicalcharacteristics, and functional processes. A wetland may be considered to have high integrity (orbe in “intact” condition) when all of its natural processes and parts are functioning within theirnatural ranges of variation. Integrity often is used synonymously with “naturalness,” although thelinkage between naturalness, wetland complexity, and wetland self-organizing capacity may notalways be clearly apparent. Estimates of a wetland’s integrity commonly are expressed by a singleword or score. Although indices for assessing biological integrity of Oregon streams have beentested and applied (Hughes et al. 2004), no such indices have yet been successfully tested forOregon wetlands.
Wrack: flotsam and other floating debris, e.g., seaweed, plant litter, trash. Often deposited by tidesalong the daily high tide level in a “wrack line.”
Appendix D

86 Hydrogeomorphic Assessment Guidebook for Tidal Wetlands of the Oregon Coast, Part 1 – August 2006

for additional copies of thisdocument, contact
Oregon Watershed Enhancement Board775 Summer Street, Suite 360
Salem, OR 97301-1290