AN INTRODUCTION TO HYDROGEOMORPHIC (HGM ......AN INTRODUCTION TO HYDROGEOMORPHIC (HGM) FUNCTIONAL...
96
AN INTRODUCTION TO HYDROGEOMORPHIC (HGM) FUNCTIONAL STREAM ASSESSMENT Facilitated by LRL HGM Team: Jennifer Thomason & Justin Branham Louisville District Regulatory Branch Louisville District Regulatory Branch US Army Corps of Engineers BUILDING STRONG ®
Transcript of AN INTRODUCTION TO HYDROGEOMORPHIC (HGM ......AN INTRODUCTION TO HYDROGEOMORPHIC (HGM) FUNCTIONAL...

AN INTRODUCTION TO HYDROGEOMORPHIC (HGM) FUNCTIONAL STREAM ASSESSMENTFacilitated by LRL HGM Team:y
Jennifer Thomason & Justin Branham
Louisville District Regulatory BranchLouisville District Regulatory Branch
US Army Corps of EngineersBUILDING STRONG®

Purpose of HGM ApproachPurpose of HGM Approach To assess the capacity of a stream p y
reach to perform functions relative to similar streams in a region
Ecosystem functions assessed through measures of commonly identified ystructural components important to stream function and simple logic
d lmodels
BUILDING STRONG®

Purpose of WorkshopPurpose of Workshop
Provide an overview of theProvide an overview of the Draft Guidebook
Introduce basic concepts Introduce basic concepts and terms
H t d t th HGM How to conduct the HGM assessment
BUILDING STRONG®

What Are Functions?What Are Functions?
Processes or activities that take Processes or activities that take place in ecosystems
“Thi h d ” “Things that ecosystems do”
BUILDING STRONG®

Examples of Stream FunctionsExamples of Stream Functions Hydrology
►Transport water downstream ►Dissipate energy of currentsi h i l C li Biogeochemical Cycling►Retain and transform inorganic materials
needed for biological processes into organicneeded for biological processes into organic forms
►Oxidize those organic molecules back into gelemental forms through respiration
Habitat
BUILDING STRONG®
►Support for plant and animal communities

Functions versus ValuesFunctions versus Values
Values are beneficial goods and services Values are beneficial goods and services resulting from functions
“Value” is the relative importance of something to an individual or group (e.g., to society)
The HGM Approach assesses functionsThe HGM Approach assesses functions, but does not determine values
BUILDING STRONG®

What is Functional Capacity?What is Functional Capacity?
The degree or magnitude to which aThe degree or magnitude to which a ecosystem performs a function
Depends on characteristics of the Depends on characteristics of the ecosystem and the surrounding landscape
Si il t hibit f Similar ecosystems exhibit a range of functional capacities due to inherent characteristics natural disturbance andcharacteristics, natural disturbance, and anthropogenic alteration
BUILDING STRONG®

What is the HGM Approach?What is the HGM Approach?
A h d f i h f i l A method for assessing the functional capacity of an ecosystem
Three pillars of the HGM Approach:►Hydrogeomorphic classification
Reference sites►Reference sites►Assessment models
End result is a rapid assessment technique End result is a rapid assessment technique for the user
BUILDING STRONG®

Regional SubclassesRegional Subclasses Applying
classification to aclassification to a specific geographic area leads toarea leads to regional subclasses►High-gradient►High gradient
ephemeral and intermittent headwater streams in western WV and
t KYBUILDING STRONG®
eastern KY

Regional Subclasses (continued)Regional Subclasses (continued)
Regional subclasses are the target for Regional subclasses are the target for development of HGM assessment models
BUILDING STRONG®

What are Reference Sites?What are Reference Sites?
A group of sites that encompasses the range of variability exhibited by a g y yregional subclass Variability results from:Variability results from:
►Natural processes and disturbance►Anthropogenic alterationp g
BUILDING STRONG®

What is “Reference Standard” ?What is Reference Standard ?
Streams performing a suite of functions forStreams performing a suite of functions for the regional subclass at a level that is characteristic of the least altered sites incharacteristic of the least altered sites in the least altered landscapes Of over 90 sites sampled only 10 sites Of over 90 sites sampled, only 10 sites
identified by the A-Team as Reference StandardStandard
BUILDING STRONG®

Developing Assessment ModelsDeveloping Assessment Models
HGM models are designed to estimate functional capacity of a site relative tofunctional capacity of a site relative to reference standard sites
FCI = Functional Capacity of the Target Ecosystem (SAR) FCIFunctional Capacity of Reference Standard Ecosystem
BUILDING STRONG®
Developing Assessment ModelsDeveloping Assessment Models Functional Capacity depends on
h t i ti f th t d thcharacteristics of the ecosystem and the surrounding landscapeTh f HGM d l i bl Therefore, HGM models use variables that are measures of site and landscape characteristics:characteristics:►Substrate size►Sediment embeddedness►Amount of large woody debris
BUILDING STRONG®

Assessment ModelsAssessment Models
Consist of model variables aggregated inConsist of model variables aggregated in an equation to produce a Functional Capacity Index (FCI)p y ( )
BUILDING STRONG®

Applications of HGM ModelsApplications of HGM Models
Estimate baseline functional capacityEstimate baseline functional capacity Estimate impacts of a proposed project
E l t j t lt ti Evaluate project alternatives Determine baseline mitigation requirements Estimate the effects of resource
managementg Monitor the performance of restored
ecosystemsBUILDING STRONG®
ecosystems

Information Sources on the WebInformation Sources on the Web
HGM guidebooks and other resources:► http://el erdc usace army mil/wetlands/hgmhp html► http://el.erdc.usace.army.mil/wetlands/hgmhp.html► http://el.erdc.usace.army.mil/wetlands/datanal.html
BUILDING STRONG®

QUESTIONS?QUESTIONS?
BUILDING STRONG®

HGM VARIABLES
Facilitated by LRL HGM Team:y
Jennifer Thomason & Justin Branham
Louisville District Regulatory BranchLouisville District Regulatory Branch
US Army Corps of EngineersBUILDING STRONG®

Site Selection and SARand SAR
Determination Scenarios
BUILDING STRONG®

Variables areVariables are
The things we measure or estimate in theThe things we measure or estimate in the field►Used to determine the indices that go into the►Used to determine the indices that go into the
models to determine functional capacity index (FCI)( )
12 variables have been selected for the High-gradient Headwater guidebookHigh gradient Headwater guidebook
BUILDING STRONG®

List of the 12 Variables (1-6)List of the 12 Variables (1-6)
Channel canopy cover (VCCANOPY)Channel canopy cover (VCCANOPY) Channel substrate embeddedness (VEMBED)
Ch l b t t i (V ) Channel substrate size (VSUBSTRATE) Potential channel bank erosion (VBERO) Large Woody Debris (VLWD) Riparian/buffer zone tree diameter (VTDBH)Riparian/buffer zone tree diameter (VTDBH)
BUILDING STRONG®

List of the 12 Variables (7-12)List of the 12 Variables (7-12)
Riparian/buffer zone snag density (VSNAG)Riparian/buffer zone snag density (VSNAG) Riparian/buffer zone sapling/shrub density
(VSSD)(VSSD) Riparian/buffer zone species richness (VSRICH) Riparian/buffer zone soil detritus (VDETRITUS) Herbaceous cover (VHERB)( ) Watershed land use (VWLUSE)
BUILDING STRONG®
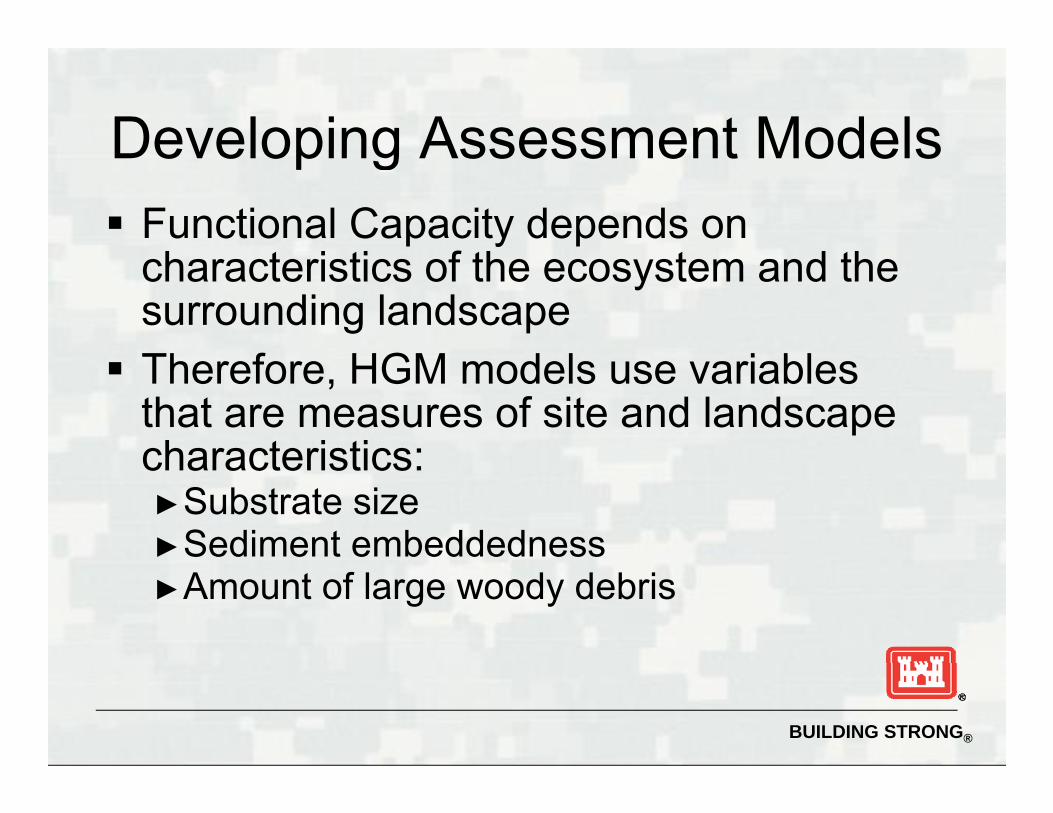
Variables Collected for the High‐Gradient
Ephemeral and Intermittent Headwater
Streams in Western West Virginia andWest Virginia and Eastern Kentucky HGM Assessment
Models
Functions:Functions:Hy = HydrologyB = Biogeochemical ProcessingH = Habitat
BUILDING STRONG®

Channel canopy cover (VCCANOPY)Channel canopy cover (VCCANOPY)
Average % cover of the canopy over Average % cover of the canopy over the stream channel VCCANOPY applies indirectly to all
functions and directly to the habitat yfunction
BUILDING STRONG®

How to measure VCCANOPYHow to measure VCCANOPY
1) Tree: all living woody plants >4 in. in1) Tree: all living woody plants 4 in. in diameter at breast height (55 in.) within the stream channel and riparian/buffer zones
2) If no trees (or <20 percent canopy cover) or saplings are present within the riparian/buffer zone or stream channel, then the variable would not be used, and the following steps can be skippedfollowing steps can be skipped
BUILDING STRONG®

How to measure VCCANOPYcontinued
3) Using a densitometer spherical crown3) Using a densitometer, spherical crown densiometer, or equivalent device designed for estimating percent channel canopy cover,
ti t th t f li ht b d b testimate the amount of light obscured by tree branches and leaves
• This is done while standing in the stream channel within the SAR or PSAR.
4) Minimum of 10 points - approximately evenly spaced along the SARspaced along the SAR • Longer SARs or those with a diverse canopy may require
additional data points
BUILDING STRONG®

How to measure VCCANOPYcontinued
5) Average all of the estimates of percent ) g pchannel canopy cover
6) Using Figure 9, determine the bi d f Vsubindex score for VCCANOPY
BUILDING STRONG®

Examples of Channel canopy cover VVCCANOPY
Channel with over 90 percent Channel with zero percent pcover
pcover
BUILDING STRONG®

>88%
BUILDING STRONG®

Substrate embeddedness (VEMBED)Substrate embeddedness (VEMBED)
This variable is the average embeddednessThis variable is the average embeddedness value of the stream substrate►Embeddedness is a measure of the degree to
which coarse substrates (gravel, cobble, and boulders) are covered, surrounded, or buried by fine sediments
►Fine sediments include sand, silt, and clay size (≤0.08 in. (0.2 cm)) particlesV li ll f i►VEMBED applies to all functions
BUILDING STRONG®

How to measure VEMBEDHow to measure VEMBED
1) Emdeddedness is measured concurrently with ) yVSUBSTRATE using the same substrate particle
2) At 30 or more evenly spaced points along the length of the SAR or PSAR select at randomlength of the SAR or PSAR select at random substrate particle► Substrate particles consisting of sand, silt, and clay
receive an embeddedness score of 1receive an embeddedness score of 1► Concrete or other artificial substrate would also
receive an embeddedness score of 1► Areas of bedrock receive an embeddedness score of► Areas of bedrock receive an embeddedness score of
5 (Table 4 – pg 23)
BUILDING STRONG®

How to measure VEMBEDcontinued
3) Average the embeddedness rating score3) Average the embeddedness rating score for all substrate particles measured
4) Using Figure 11 determine the subindex4) Using Figure 11, determine the subindex score for VEMBED (pg 25)
BUILDING STRONG®

BUILDING STRONG®

Substrate embeddedness VEMBEDT bl 4Table 4
Rating Rating DescriptionRating Rating Description
5 <5 percent of surface covered, surrounded, or buried by fine sediment
4 5 to 25 percent of surface covered, surrounded, or buried by fine sediment
3 26 to 50 percent of surface covered, surrounded, or buried by 3 fine sediment
2 51 to 75 percent of surface covered, surrounded, or buried by fine sediment
1 >75 percent of surface covered, surrounded, or buried by fine sediment
BUILDING STRONG®

3.5-4 Rating
BUILDING STRONG®

Substrate embeddedness VEMBED
embeddedness rating of 5 (<5 % th f d b fi
embeddedness rating of 1 (>75 % f th f d b% the surface covered by fine
sediments% of the surface covered by fine sediments)
BUILDING STRONG®
Channel substrate size (VSUBSTRATE)Channel substrate size (VSUBSTRATE) This variable is the median size of the
stream substrate VSUBSTRATE only applies to hydrology and SUBSTRATE y pp y gy
habitat functions
BUILDING STRONG®

How to measure VSUBSTRATEHow to measure VSUBSTRATE
1) Using the same particles selected for VEMBED, h 0 1 i (3 ) h i fmeasure to the nearest 0.1 in. (3 mm) the size of
the particle along the longitudinal (intermediate) axis2) Bedrock should be counted as 99 in. (251 cm)3) Concrete or asphalt should be counted as zero4) Sand or finer size particles can be recorded as 0.08
in. (0.2 cm)in. (0.2 cm)5) Calculate the median value for all particles
measured6) Use Figure 13 to determine the subindex score6) Use Figure 13 to determine the subindex score
BUILDING STRONG®

Channel substrate size VSUBSTRATE
Illustrations of the B-Illustrations of the Baxis used for substrate size
BUILDING STRONG®

2-6 in.
BUILDING STRONG®
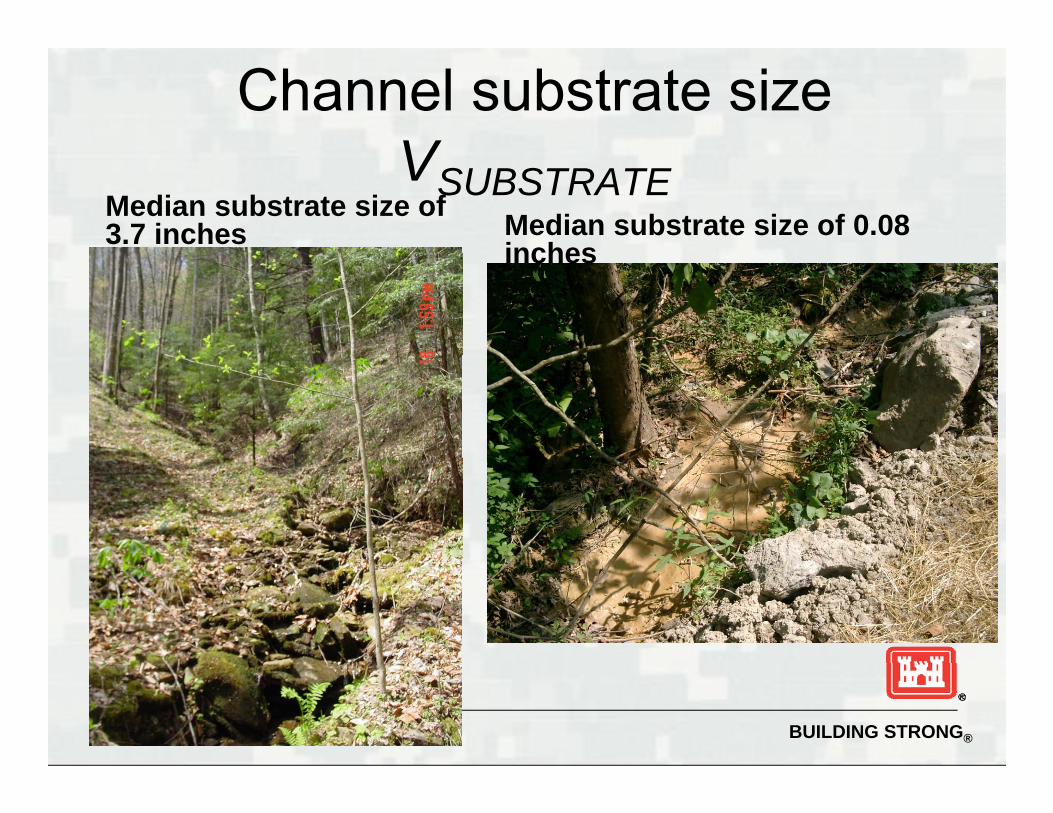
Channel substrate size VVSUBSTRATE
Median substrate size of 3.7 inches Median substrate size of 0.08
inchesinches
BUILDING STRONG®

Potential Channel Bank Erosion (V )(VBERO)
Disturbed scoured sections of the streamDisturbed, scoured sections of the stream channel bank V only applies to the hydrology VBERO only applies to the hydrology
function
BUILDING STRONG®

How to measure VBEROHow to measure VBERO1) While standing in the channel of the SAR or PSAR,
measure the length of both the left and right g gstreambanks that display signs of erosion.
2) Record separately the number of feet of left channel bank erosion and right channel bank erosion on the data
3) Total the number of feet of left descending and right descending channel bank erosion and divide by the length
bank erosion and right channel bank erosion on the data sheet
g y gof the stream channel; then multiply by 100 (Equation 7)
ft. left bank erosion ft. right bank erosion 100 % stream channel erosion
4) Use Figure 15 to determine the subindex score for VBERO.
stream reach length
BUILDING STRONG®

0 9
1Percent Channel Bank Erosion
0-14%
0.8
0.9
0.6
0.7
ubin
dex
0.4
0.5
Var
iabl
e S
u
0.2
0.3
0 20 40 60 80 100 120 140 160 180 200
0
0.1
BUILDING STRONG®
percent

Potential Channel Bank Erosion (VBERO)(VBERO)
(continued)
BUILDING STRONG®

Large Woody Debris (VLWD)Large Woody Debris (VLWD)
LWD: downed woody stems > 4in inLWD: downed woody stems > 4in. in diameter and > 36 in. long Number of individual pieces of down Number of individual pieces of down
woody stems per 100 ft (30.5 m) of stream reach within the channel and thereach within the channel and the riparian/buffer zoneV li t ll f ti VLWD applies to all functions
BUILDING STRONG®

How to measure VLWDHow to measure VLWD
1) Count each individual piece of LWD along the entire SAR PSAR I l d ll LWD l d i hSAR or PSAR. Include all LWD located in the riparian/buffer zone and within the stream channel.
2) Record the total number of LWD on the data sheet.
3) Divide the total number of LWD by the length of the3) Divide the total number of LWD by the length of the SAR or PSAR, then multiply by 100 to determine the number of LWD per 100 ft of stream reach.
4) Use Figure 17 to determine the subindex score for VLWD
BUILDING STRONG®

0 9
1Large Woody Debris
8-20 per 100’
0 7
0.8
0.9
0.6
0.7
Subi
ndex
0.4
0.5
Var
iabl
e S
0.2
0.3
0 10 20 30 40 50 60 70Number of large woody debris per 100 ft of stream sreach
0
0.1
N b f l d d b i 100 ft f t h
BUILDING STRONG®
Number of large woody debris per 100 ft. of stream sreachNumber of large woody debris per 100 ft of stream reach

BUILDING STRONG®
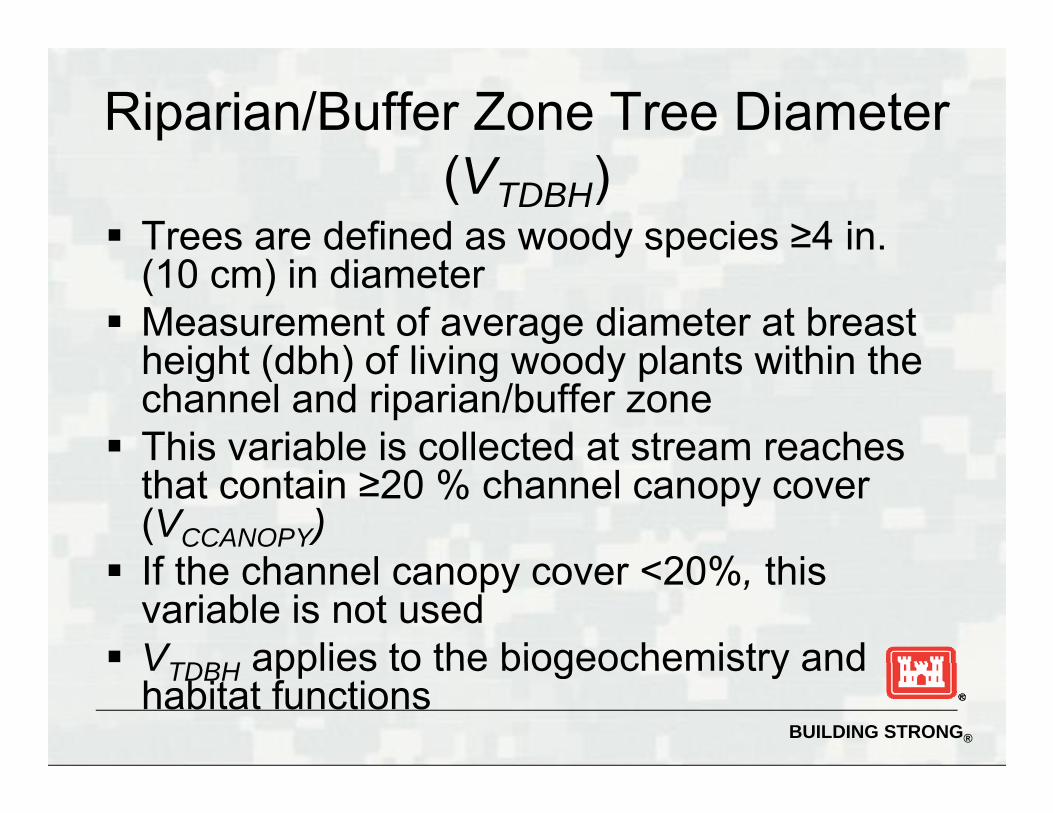
Riparian/Buffer Zone Tree Diameter (VTDBH)
Trees are defined as woody species ≥4 in. y p(10 cm) in diameter
Measurement of average diameter at breast height (dbh) of living woody plants within theheight (dbh) of living woody plants within the channel and riparian/buffer zone
This variable is collected at stream reachesThis variable is collected at stream reaches that contain ≥20 % channel canopy cover (VCCANOPY) If th h l 20% thi If the channel canopy cover <20%, this variable is not used
VTDBH applies to the biogeochemistry and
BUILDING STRONG®
VTDBH applies to the biogeochemistry and habitat functions
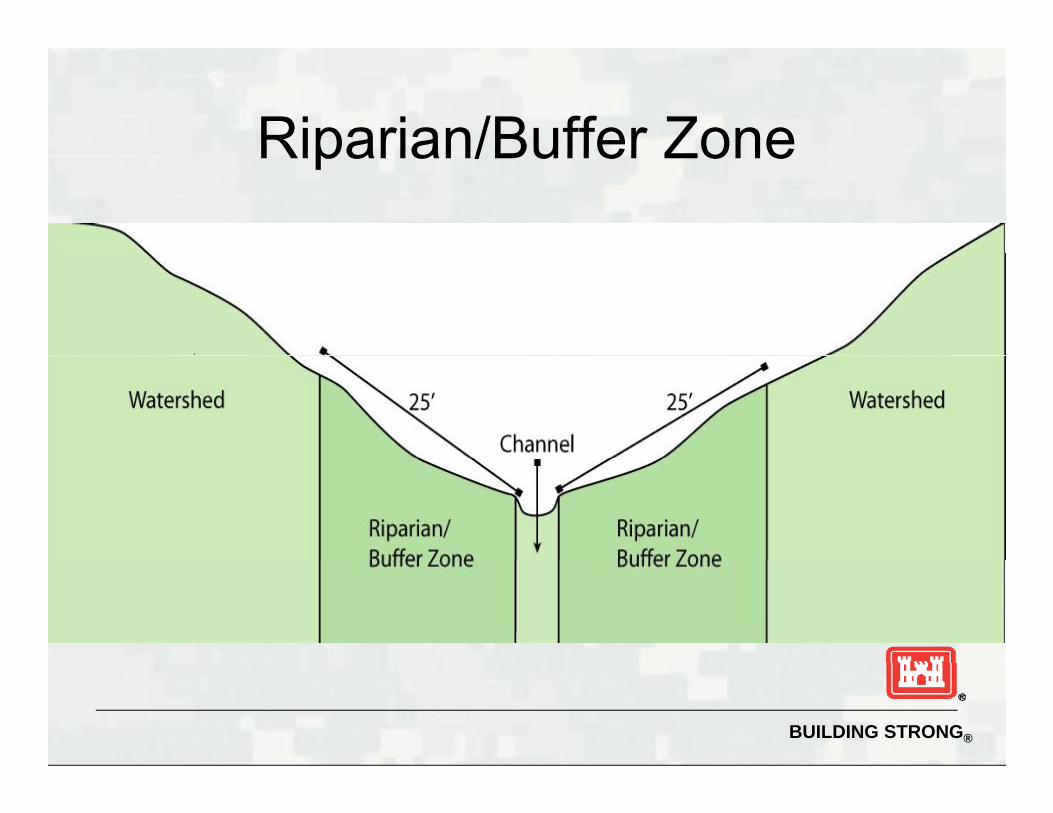
Riparian/Buffer ZoneRiparian/Buffer Zone
BUILDING STRONG®

How to measure VTDBHHow to measure VTDBH
1) Measure the dbh of all trees within the1) Measure the dbh of all trees within the channel and riparian/buffer zone of the SAR or PSARSAR or PSAR►Measurements should be made using tree
calipers dbh tape or equivalent devicecalipers, dbh tape, or equivalent device. ►The tree should be measured if any part of
the stem is within the riparian/buffer zone.the stem is within the riparian/buffer zone.
BUILDING STRONG®

How to measure VTDBH( i d)(continued)
2) Calculate the average tree diameter by2) Calculate the average tree diameter by summing dbh measurements and dividing by the total number of trees measuredby the total number of trees measured.
3) Use Figure 19 to determine the subindex score for Vscore for VTDBH
BUILDING STRONG®

1Average Tree Diameter at Breast Height (DBH) in the Riparian/Buffer Zone
>8.7 in.
0.8
0.9
0.6
0.7
bind
ex
0.4
0.5
Varia
ble
Sub
0.2
0.3
4 5 6 7 8 9 10
0
0.1
BUILDING STRONG®
Average tree diameter (inches)

Riparian/Buffer Zone Tree DiameterDiameter
(continued)
BUILDING STRONG®

Riparian/buffer zone snag density (V )(VSNAG)
Number of individual snags per 100 ft ofNumber of individual snags per 100 ft of the SAR or PSAR within the entire stream channel and riparian/buffer zonechannel and riparian/buffer zone.►Snags are defined as standing dead trees ≥4
in (10 cm) in diameter and ≥36 in (90 cm) inin. (10 cm) in diameter and ≥36 in. (90 cm) in height
►VSNAG only applies to the habitat function.►VSNAG only applies to the habitat function.
BUILDING STRONG®

How to measure VSNAGHow to measure VSNAG
1) Count all snags within the entire riparian/buffer ) g pzone, including any snags that occur in the stream channel of the SAR or PSAR– Snags should be counted if any part of the stem is g y p
within the sample area.2) Divide the total number of snags by the length of
the SAR or PSAR; then multiply by 100 tothe SAR or PSAR; then multiply by 100 to determine the number of snags per 100 ft of stream reach
3) Use Figure 21 to determine the subindex score3) Use Figure 21 to determine the subindex score for VSNAG
BUILDING STRONG®

1Snag Density in the Riparian/Buffer Zone
0.6-3.0 per 100’
0.8
0.9
0.6
0.7
bind
ex
0.4
0.5
Var
iabl
e Su
b
0.2
0.3
0 1 2 3 4 5 6 7 8 9 10
0
0.1
BUILDING STRONG®
0 3 5 6 8 9 0Snags per 100 feet of stream reach

Riparian/buffer zone snag density (V )(VSNAG)
BUILDING STRONG®

Riparian/buffer zone sapling/shrub d i (V )density (VSSD)
Number of woody stems >36 in. (90 cm) inNumber of woody stems 36 in. (90 cm) in height and <4 in. (10 cm) dbh (e.g., shrubs, saplings, and understory trees) p g y )per 100 ft (30.5 m) of stream reach. Only measured if channel canopy cover is y py
<20% VSSD applies only to the biogeochemistry SSD pp y g y
and habitat functions
BUILDING STRONG®

How to measure VSSDHow to measure VSSD
1) Count each woody stem within the entire ) yriparian/buffer zone and the stream channel. ► In cases where multiple stems arise from the
same plant count all stems above a height of 6same plant, count all stems above a height of 6 in. (15 cm) from the ground surface.
►Stems that originate outside of the riparian buffer zone are not countedzone are not counted.
►Record the total number of stems for the left side and right side of the sample reach on the d t h tdatasheet
BUILDING STRONG®

How to measure VSSD( i d)(continued)
2) Total the number of stems within the )riparian/buffer zone.
3) Divide the total number of stems by the length of the SAR or PSAR then multiply bylength of the SAR or PSAR, then multiply by 100 to determine the number of sapling/shrub stems per 100 ft of stream p g preach.
4) Use Figure 23 to determine the variable subindex for Vsubindex for VSSD
BUILDING STRONG®

1Number of Sapling/Shrub Stems Per 100 ft. of Stream Channel
>65 per 100’
0.8
0.9
0.6
0.7
ore
0.4
0.5
Sub
inde
x sc
o
0.2
0.3
0 5 10 15 20 25 30 35 40 45 50 55 60 65 70 75
0
0.1
BUILDING STRONG®
0 5 10 15 20 25 30 35 40 45 50 55 60 65 70 75Number

Riparian/buffer zone species i h (V )richness (VSRICH)
Measure of the native tree speciesMeasure of the native tree species diversity per 100 ft of stream reach within the riparian/buffer zone and channelthe riparian/buffer zone and channel The focus is on the plants occurring in the
tallest stratum presenttallest stratum present VSRICH applies only to the habitat function
BUILDING STRONG®

How to measure VSRICHHow to measure VSRICH
1) On the data form, place a check mark beside ) peach species in Group 1 or 2 (Table 5) that is observed in the riparian/buffer zone, including the channel.
2) Total the number of species checked in Groups 1 and 2 separately. Subtract the number of observed species in Group 2 from the numberobserved species in Group 2 from the number observed in Group 1. If the number from Group 2 is larger than that from Group 1, then the subindex score equals zero for VSRICH and thesubindex score equals zero for VSRICH and the following steps can be skipped.
BUILDING STRONG®

How to measure VSRICH( i d)(continued)
3) If the result of Group 1 – Group 2 is ≥ 8, then ) p pthe subindex score is 1.0 regardless of the reach length and the following steps can be skippedskipped.
4) For both Group 1 and Group 2, divide the number of species by the length of the SARnumber of species by the length of the SAR or PSAR being assessed; then multiply by 100 to determine the number of species per p p100 ft of stream reach for each group.
5) Use Figure 24 to determine the subindex
BUILDING STRONG®
score for VSRICH

BUILDING STRONG®

0 9
1Sp ec ies Richness
>2.1 per 100’
0 7
0.8
0.9
0 5
0.6
0.7
Sub
inde
x
0.4
0.5
Varia
ble
S
0.2
0.3
0 0 .5 1 1 .5 2 2 .5N um b e r p er 10 0 fe e t o f stre a m re ach
0
0.1
BUILDING STRONG®
N um b e r p er 10 0 fe e t o f stre a m re ach

Riparian/buffer zone soil detritus (V )(VDETRITUS)
Average percent cover of detrital material on the g psoil surface within the riparian/buffer zone
Soil detritus is defined as the soil layer dominated b ti ll d d b t till i blby partially decomposed but still recognizable organic material, such as leaves, sticks, needles, flowers, fruits, insect frass, dead moss, or , , , ,detached lichens on the surface of the ground
Applies to the biogeochemistry and habitat functionsfunctions
BUILDING STRONG®

How to measure VDETRITUSHow to measure VDETRITUS
1) Visually estimate the percent cover of leaves, ) y psticks, or other organic material within eight or more 40-in. x 40-in. (1-m x 1-m) plots in representative locations of the riparian/buffer p pzone (four plots on each side of the channel).
2) Average the percent cover estimates of all plots.3) Report the average cover of detritus as a3) Report the average cover of detritus as a
percent.4) Use Figure 26 to determine the subindex score
f Vfor VDETRITUS
BUILDING STRONG®
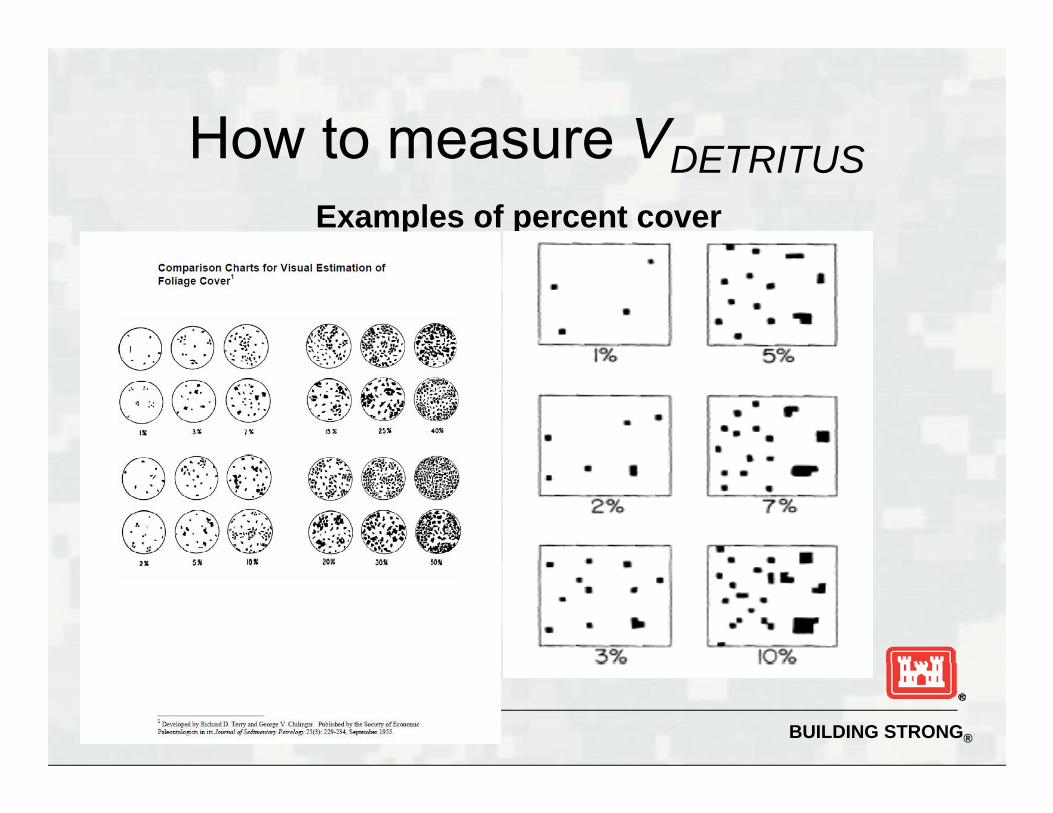
How to measure VDETRITUSHow to measure VDETRITUSExamples of percent cover
BUILDING STRONG®

1
0 9
Riparian Detritus82-100%
0.8
0 7
0.9
0.6
0.7
x S
core
0.4
0.5
Sub
inde
x
0.2
0.3
0 20 40 60 80 10010 30 50 70 90Percent riparian detritus
0
0.1
BUILDING STRONG®
Percent riparian detritus

BUILDING STRONG®

Riparian/buffer zone herbaceous (V )cover (VHERB)
Defined as all herbaceous vegetation, gregardless of height (does not include woody species defined as sapling/shrub)y p p g ) Only measured if channel canopy cover is
<20%20% Average percent cover of herbaceous
vegetation within the riparian/buffer zonevegetation within the riparian/buffer zone Applies to the biogeochemistry and habitat
functionsBUILDING STRONG®
functions

How to measure VHERBHow to measure VHERB
1) Using the same eight or more1) Using the same eight or more representative 40-in. x 40-in. (1-m x 1-m) plots used to estimate VDETRITUS, visually p DETRITUS yestimate the percent absolute cover of herbaceous plant material
2) Average all estimates.3) Use Figure 27 to determine the subindex ) g
score for VHERB
BUILDING STRONG®

How to measure VHERBHow to measure VHERBExamples of percent cover
BUILDING STRONG®

0 9
1Percent Ground Cover Vegetation
>75%
0.8
0.9
0.6
0.7
scor
e
0.4
0.5
Subi
ndex
0.2
0.3
0 10 20 30 40 50 60 70 80 90 100
0
0.1
BUILDING STRONG®
Percent herbaceous cover

Watershed land-use (VWLUSE)Watershed land use (VWLUSE)
Surface runoff potential from theSurface runoff potential from the watershed or catchment outside the riparian/buffer zone into the headwaterriparian/buffer zone into the headwater stream Weighted average of the combination of Weighted average of the combination of
land cover and land-use classificationsV li t ll f ti VWLUSE applies to all functions
BUILDING STRONG®

How to measure VWLUSEHow to measure VWLUSE
1) Use topographic maps, GIS data, or other ) p g p psources to delineate the catchment or watershed above the lowest point of the SAR and along with field reconnaissance to determine the percentage p gof each land-use category (Table 5) in the watershed.
2) Determine a weighted average (by area) of land-2) Determine a weighted average (by area) of landuse categories for the catchment. An example can be found in Appendix B.
3) Use Figure 28 to determine the subindex score3) Use Figure 28 to determine the subindex score for VWLUSE
BUILDING STRONG®

Table 6 VWLUSE
BUILDING STRONG®

>75% Native Forest
BUILDING STRONG®

Data Sheet & CalculatorData Sheet & Calculator
HGM Guidebook available at:HGM Guidebook available at: http://el.erdc.usace.army.mil/programs.cfm?Topic=wrap&Option=Program?Topic wrap&Option Program►Pages 68-70 in Guidebook
Datasheet and FCI Calculator available at: Datasheet and FCI Calculator available at: http://el.erdc.usace.army.mil/wetlands/datanal htmlnal.html.
BUILDING STRONG®

QUESTIONS?QUESTIONS?
BUILDING STRONG®

HGM FUNCTION MODELS
Facilitated by LRL HGM Team:Facilitated by LRL HGM Team:
Jennifer Thomason & Justin Branham
Louisville District Regulatory Branch
US Army Corps of EngineersBUILDING STRONG®

ModelsModels Variables are combined using simpleVariables are combined using simple
equations to represent differences in function based on deviation from reference standard
One model for Hydrology function 2 models each representing Biogeochemical
cycling and Habitat functions►One if Channel canopy is >20%
O if Ch l i 20%►One if Channel canopy is <20%
BUILDING STRONG®

HydrologyHydrology
Defined as the ability of the High-gradientDefined as the ability of the High gradient Headwater Stream to dissipate energy associated with flow velocity and transportassociated with flow velocity and transport water downstream
BUILDING STRONG®

HydrologyHydrology
Substrate embeddednessSubstrate embeddedness Substrate size
P t ti l b k i Potential bank erosion Large woody debris Watershed land use
BUILDING STRONG®

HydrologyHydrology
V
VWLUSE
VSUBSTRATE, VEMBED or VBERO
VLWD
BUILDING STRONG®

Biogeochemical cyclingBiogeochemical cycling
Defined as the ability of the High-gradientDefined as the ability of the High gradient Headwater Stream ecosystem to retain and transform inorganic materials neededand transform inorganic materials needed for biological processes into organic forms and to oxidize those organic moleculesand to oxidize those organic molecules back into elemental forms through respiration and decompositionrespiration and decomposition
BUILDING STRONG®

Biogeochemical cyclingBiogeochemical cycling
Substrate embeddednessSubstrate embeddedness Large woody debris
D t it Detritus Tree diameter at breast height Sapling/shrub Percent cover of herbaceous vegetationPercent cover of herbaceous vegetation Watershed land use
BUILDING STRONG®

Biogeochemical cyclingBiogeochemical cycling>20% Tree Canopy Cover <20% Tree Canopy Cover
VDETRITUSVTDBH
VDETRITUS VSSD
VHERB
VLWD
VVLWD
VEMBEDVEMBED
VWLUSE VWLUSE
BUILDING STRONG®
WLUSE

HabitatHabitat
Defined as the capacity of a High-gradientDefined as the capacity of a High gradient Headwater Stream ecosystem to provide critical life requisites to selectedcritical life requisites to selected components of the vertebrate and invertebrate wildlife communityinvertebrate wildlife community
BUILDING STRONG®

HabitatHabitat Canopy cover Substrate embeddedness Substrate size Large woody debris Detritus Tree diameter at breast height Snag densityg y Sapling/shrub density Species richness (tree or tallest dominant strata present) Percent cover of herbaceous vegetationg Watershed land use
BUILDING STRONG®

HabitatHabitat>20% Tree Canopy Cover <20% Tree Canopy Cover
VWLUSE VSRICHVWLUSE
VCCANOPY
V
VSNAG
VSRICH
VEMBEDorVSNAG
VSSD
VHERB
VEMBED
orVDETRITUS
VTDBHEMBED
VSUBSTRATE
VDETRITUS
VSNAG
VSUBSTRAT
E
VLWD VLWD
BUILDING STRONG®

QUESTIONS?QUESTIONS?
BUILDING STRONG®