Board of Trustees’ Annual Planning Retreat February 7, 2011 2011 RSCCD “Plan to Plan”
39
Board of Trustees’ Annual Planning Retreat February 7, 2011 2011 RSCCD “Plan to Plan”
-
Upload
antony-payne -
Category
Documents
-
view
214 -
download
0
Transcript of Board of Trustees’ Annual Planning Retreat February 7, 2011 2011 RSCCD “Plan to Plan”
Board of Trustees’ Annual Planning Retreat
February 7, 2011
2011 RSCCD “Plan to Plan”
Agenda
Review of 2010-2011 vision & goals Accountability Reporting for the Community
Colleges (ARCC) 12 Measures of Success Progress towards Goals Results of Community/Staff Input, 2010-
2011 Goals Recommendations of 2011-2012 Goals
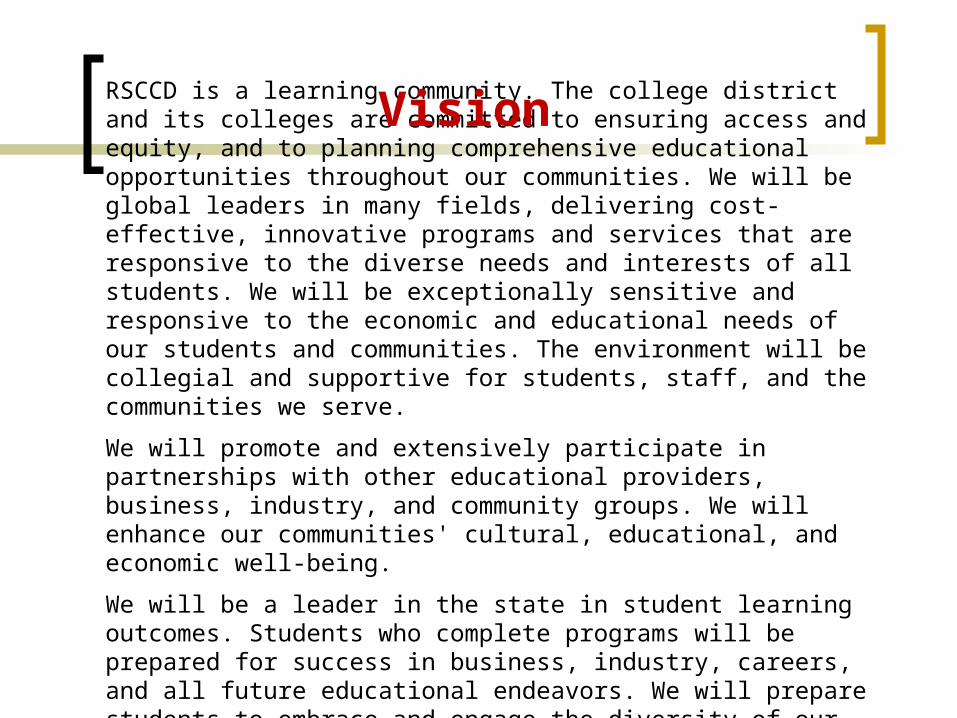
RSCCD is a learning community. The college district and its colleges are committed to ensuring access and equity, and to planning comprehensive educational opportunities throughout our communities. We will be global leaders in many fields, delivering cost-effective, innovative programs and services that are responsive to the diverse needs and interests of all students. We will be exceptionally sensitive and responsive to the economic and educational needs of our students and communities. The environment will be collegial and supportive for students, staff, and the communities we serve.
We will promote and extensively participate in partnerships with other educational providers, business, industry, and community groups. We will enhance our communities' cultural, educational, and economic well-being.
We will be a leader in the state in student learning outcomes. Students who complete programs will be prepared for success in business, industry, careers, and all future educational endeavors. We will prepare students to embrace and engage the diversity of our global community and to assume leadership roles in their work and public lives.
Vision

2010-2011 Goals
#1 -- Promote a learning community environment that is innovative, student-centered, and celebrates student achievement.
#2 -- Provide access and retention for completion programs, including transfer, vocational, and high school diploma programs; and prepare students for success in their academic, career, and personal life endeavors.
#3 – Update and implement facilities master plans, maximize college and community use of facilities, and incorporate “green” efforts into facilities development and other efforts when cost-effective.
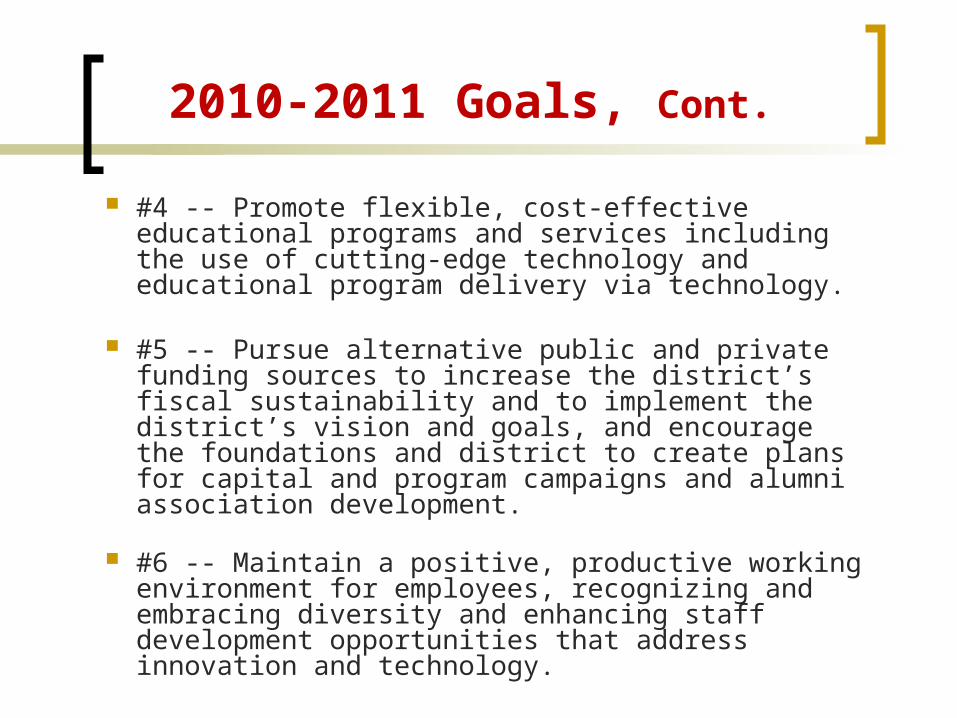
2010-2011 Goals, Cont.
#4 -- Promote flexible, cost-effective educational programs and services including the use of cutting-edge technology and educational program delivery via technology.
#5 -- Pursue alternative public and private funding sources to increase the district’s fiscal sustainability and to implement the district’s vision and goals, and encourage the foundations and district to create plans for capital and program campaigns and alumni association development.
#6 -- Maintain a positive, productive working environment for employees, recognizing and embracing diversity and enhancing staff development opportunities that address innovation and technology.

2010-2011 Goals, Cont.
#7 -- Expand partnerships with business, labor, community groups, universities, schools, and other public and private agencies in order to enhance the district’s resource development; ensure student access and success; ensure robust economic development programs; and be responsive to workforce development needs and high demand career fields.
#8 -- Assess the educational needs of the communities we serve, and enhance awareness of the colleges and community involvement through outreach and advocacy among community constituencies and leaders.

ARCC
Accountability Reporting for the Community Colleges (ARCC)/AB1417 is the framework that provides for the annual evaluation of community college performance in meeting statewide educational outcome priorities.
Required the System Office to develop an accountability report/model
Replaced Partnership for Excellence to keep funding in the community college system
Legislatively-required annual report—Local trustee review is required

ARCC
Colleges are NOT ranked!
SAC and SCC should NOT be compared to each other
College performance is analyzed over a three-year period AND within selected peer groups
Many college activities could impact these measures
This is one measure of success, not the only one….staff encourages multiple measures of assessment for continuous improvement

ARCC: College Report
Progress and Achievement: Degree/Certificate/Transfer Progress and Achievement Rate Percentage of students earning 30 or more units 1st Fall to 2nd Fall Persistence Rate
Progress and Achievement: Workforce Development Annual successful course completion rate for vocational
courses Pre-Collegiate Improvement
Annual successful course completion rate for basic skills courses
ESL Improvement Rate Basic Skills Improvement Rate Career Development and College Preparation (CDCP) Progress
and Achievement Rate (Non-Credit) College Profile Peer Grouping College Self-Assessment

ARCC: Progress and Achievement (Degree/Certificate/Transfer)
2001-02 to 2006-
07
2002-03 to 2007-
08
2003-04 to 2008-09
Peer Group
Average
Student Progress & Achievement SAC SCC
44.8%45.0%
45.3%42.8%
43.3%39.0%
42.5%47.9%
Percentage of Students Who Earned at Least 30 units SAC SCC
70.1%56.7%
72.3%56.2%
69.1%52.2%
75.0%68.3%
Fall to Fall Student Persistence SAC SCC
Fall 05-Fall 06
71.7%68.8%
Fall 06-Fall 07
76.6%72.4%
Fall 08-Fall 09
74.3%62.9%
72.6%66.5%

ARCC: Progress and Achievement
(Workforce Development)
2006-2007
2007-2008 2008-2009
Peer Group
Average
Annual Successful Course Completion Rate for Vocational Courses SAC SCC
88.5%87.2%
89.6%90.5%
89.7%91.3%
90.5%90.5%
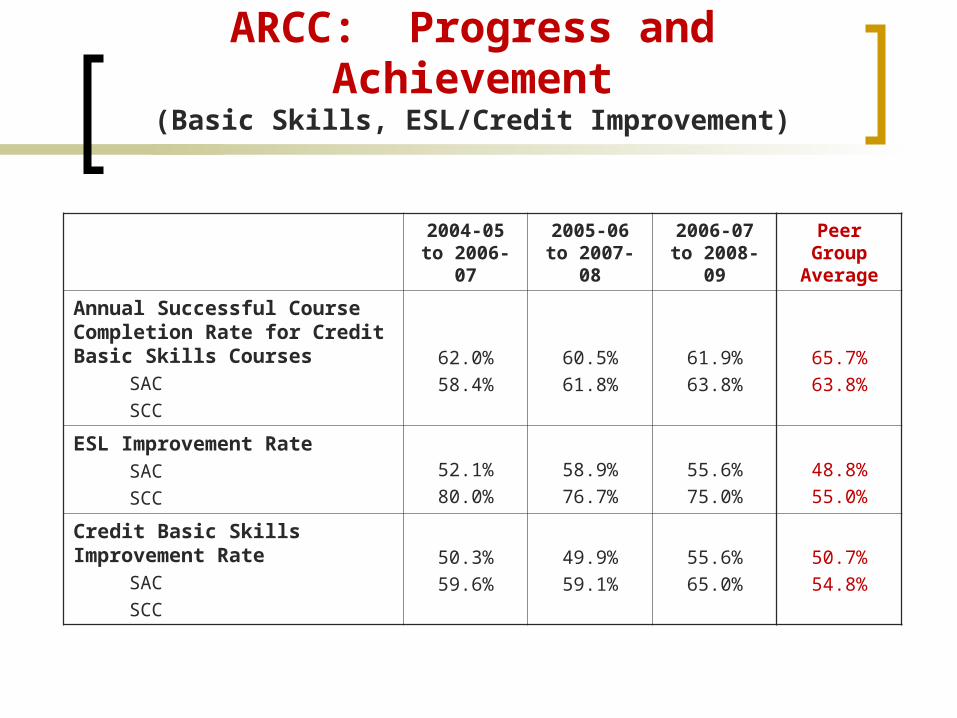
ARCC: Progress and Achievement
(Basic Skills, ESL/Credit Improvement)
2004-05 to 2006-
07
2005-06 to 2007-
08
2006-07 to 2008-
09
Peer Group
Average
Annual Successful Course Completion Rate for Credit Basic Skills Courses SAC SCC
62.0%58.4%
60.5%61.8%
61.9%63.8%
65.7%63.8%
ESL Improvement Rate SAC SCC
52.1%80.0%
58.9%76.7%
55.6%75.0%
48.8%55.0%
Credit Basic Skills Improvement Rate
SAC SCC
50.3%59.6%
49.9%59.1%
55.6%65.0%
50.7%54.8%
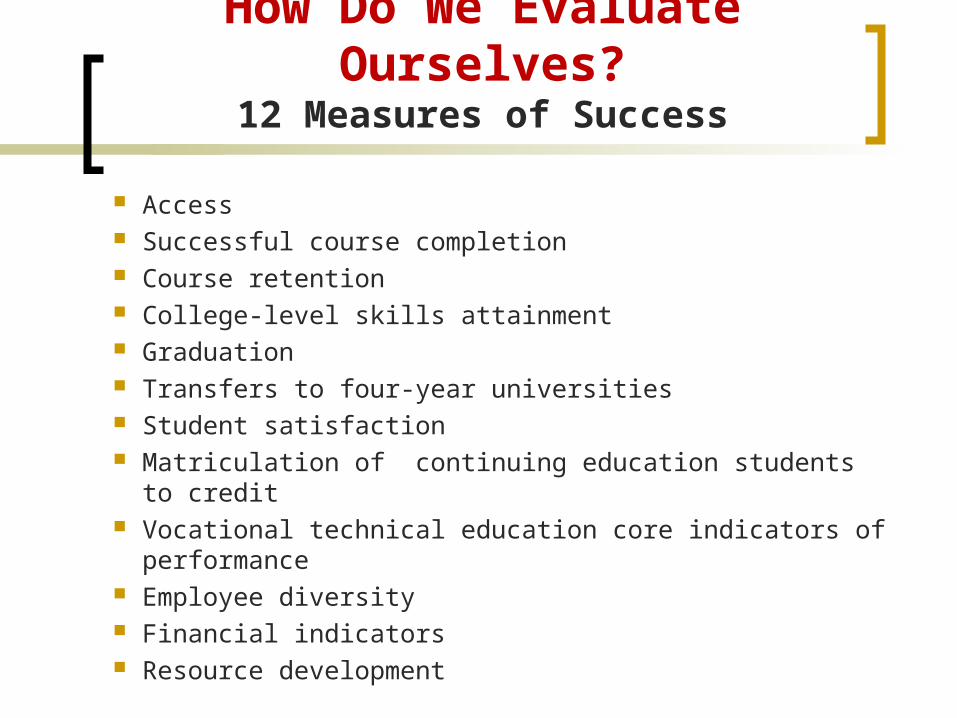
How Do We Evaluate Ourselves?
12 Measures of Success
Access Successful course completion Course retention College-level skills attainment Graduation Transfers to four-year universities Student satisfaction Matriculation of continuing education students to credit Vocational technical education core indicators of
performance Employee diversity Financial indicators Resource development
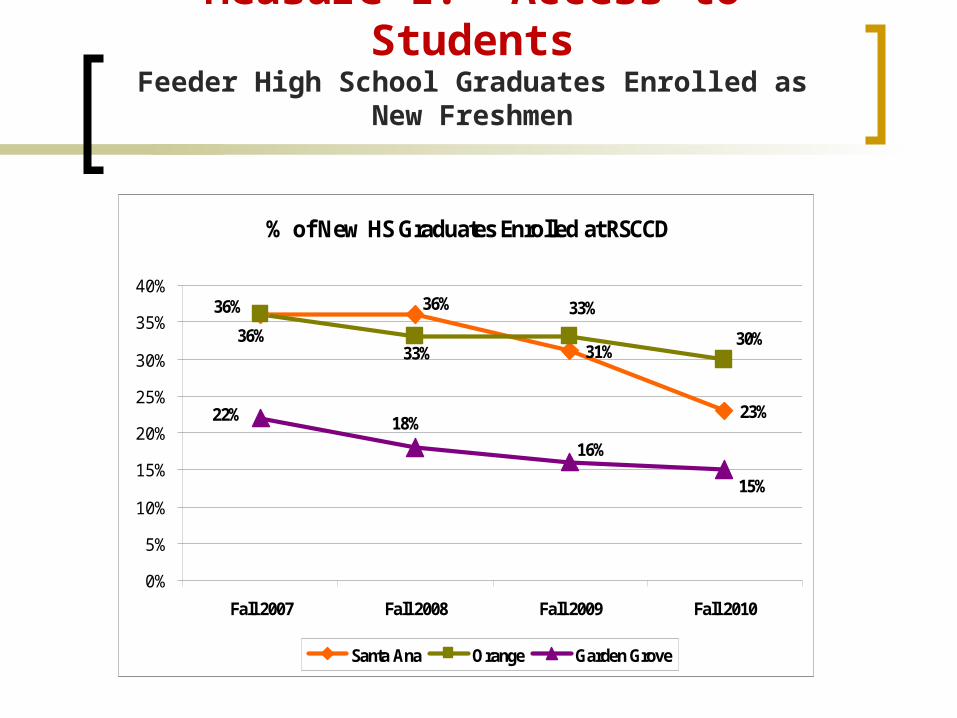
Measure 1: Access to Students
Feeder High School Graduates Enrolled as New Freshmen
% of New HS Graduates Enrolled at RSCCD
31%
23%
36%
36%
30%
33%
33%
36%
18%
16%
15%
22%
0%
5%
10%
15%
20%
25%
30%
35%
40%
Fall 2007 Fall 2008 Fall 2009 Fall 2010
Santa Ana Orange Garden Grove

Measure 1: Access to Students
Enrollment and Service Area Population
74%85%
75% 77%
92%
0%
20%
40%
60%
80%
100%
Service Area2010
K-12 Enrollment2009-10
All CreditEnrollment Fall
2010
TraditionalCredit
Enrollment Fall2010
Non-CreditEnrollment Fall
2010
% Non-White

Measure 2: Successful Course Completion
69%
72%69% 69%
50%
55%
60%
65%
70%
75%
Fall 2007 Fall 2008 Fall 2009 Fall 2010
63%
67%65%
64%
50%
55%
60%
65%
70%
75%
Fall 2007 Fall 2008 Fall 2009 Fall 2010
Santiago Canyon College Santa Ana College

Measure 3: Course Retention
85%83%84%
82%
50%
55%
60%
65%
70%
75%
80%
85%
90%
Fall 2007 Fall 2008 Fall 2009 Fall 2010
83%81%82%82%
50%
55%
60%
65%
70%
75%
80%
85%
90%
Fall 2007 Fall 2008 Fall 2009 Fall 2010
Santiago Canyon College Santa Ana College
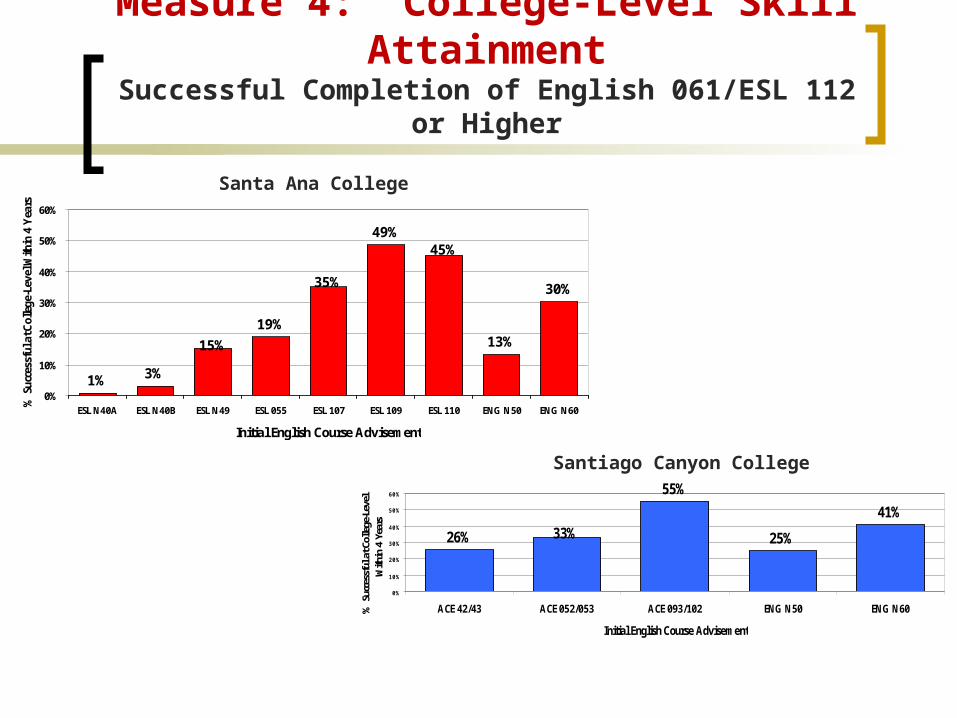
Measure 4: College-Level Skill Attainment
Successful Completion of English 061/ESL 112 or Higher
1% 3%
19%
49%
13%
30%
15%
35%
45%
0%
10%
20%
30%
40%
50%
60%
ESL N40A ESL N40B ESL N49 ESL 055 ESL 107 ESL 109 ESL 110 ENG N50 ENG N60
Initial English Course Advisement
% Suc
cess
ful a
t Col
lege
-Lev
el W
ithin
4 Y
ears
26%
55%
25%
41%33%
0%
10%
20%
30%
40%
50%
60%
ACE 42/43 ACE 052/053 ACE 093/102 ENG N50 ENG N60
Initial English Course Advisement
% S
ucce
ssfu
l at C
olle
ge-L
evel
W
ithin
4 Y
ears
Santiago Canyon College
Santa Ana College

7%9%
23%
0%
5%
10%
15%
20%
25%
30%
MATH N05* MATH N06 MATH N48
Initial Math Course Advisement
% S
ucce
ssfu
l at C
olle
ge-L
evel
With
in 4
Ye
ars
Measure 4: College-Level Skill Attainment
Successful Completion of Math 060 or Higher
13%17%
36%
0%
10%
20%
30%
40%
MATH N05* MATH N06 MATH N48
Initial Math Course Advisement
% Suc
cess
ful a
t Col
lege
-Lev
el
With
in 4
Yea
rs
Santa Ana College
Santiago Canyon College
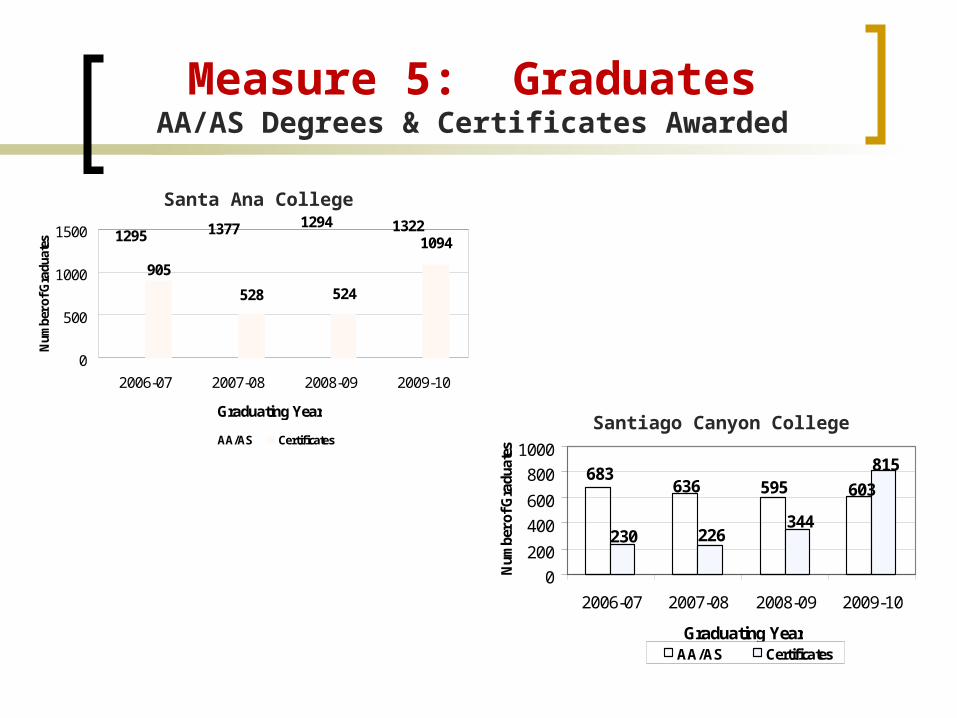
Measure 5: GraduatesAA/AS Degrees & Certificates Awarded
1295 1377 1294 1322
905
528 524
1094
0
500
1000
1500
2006-07 2007-08 2008-09 2009-10
Graduating Year
Num
ber o
f Gra
duat
es
AA/AS Certificates
683636 595 603
230 226344
815
0
200
400
600
800
1000
2006-07 2007-08 2008-09 2009-10
Graduating Year
Num
ber o
f Gra
duat
es
AA/AS Certificates
Santiago Canyon College
Santa Ana College

Measure 5: GraduatesHigh School Diplomas Awarded
146185 189
150
0
50
100
150
200
250
2006-07 2007-08 2008-09 2009-10Graduating Year
# o
f dip
lom
as
120 124 12285
0
50
100
150
200
250
2006-07 2007-08 2008-09 2009-10Graduating Year
# o
f dip
lom
as
SAC School of Continuing Education
SCC School of Continuing Education
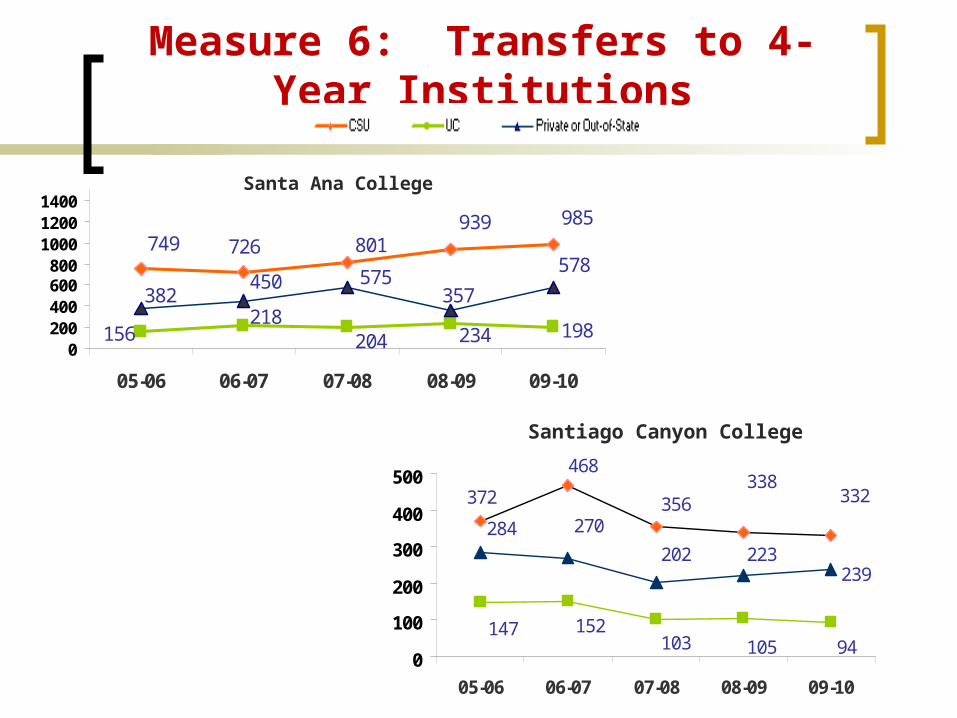
Measure 6: Transfers to 4-Year Institutions
726749 801939 985
156218
204 234 198
382450 575
357
578
0200400600800
100012001400
05-06 06-07 07-08 08-09 09-10
372
468
356338
332
147 152103 105 94
284 270
202 223239
0
100
200
300
400
500
05-06 06-07 07-08 08-09 09-10
Santiago Canyon College
Santa Ana College

Measure 7: Student Satisfaction
“The effectiveness of classroom experience is good/excellent”
SAC current students 82%graduates 87%
SCC current students 78%graduates 87%
“The campus environment is good/excellent” SAC current students 80%
graduates 88%
SCC current students 74%graduates 83%
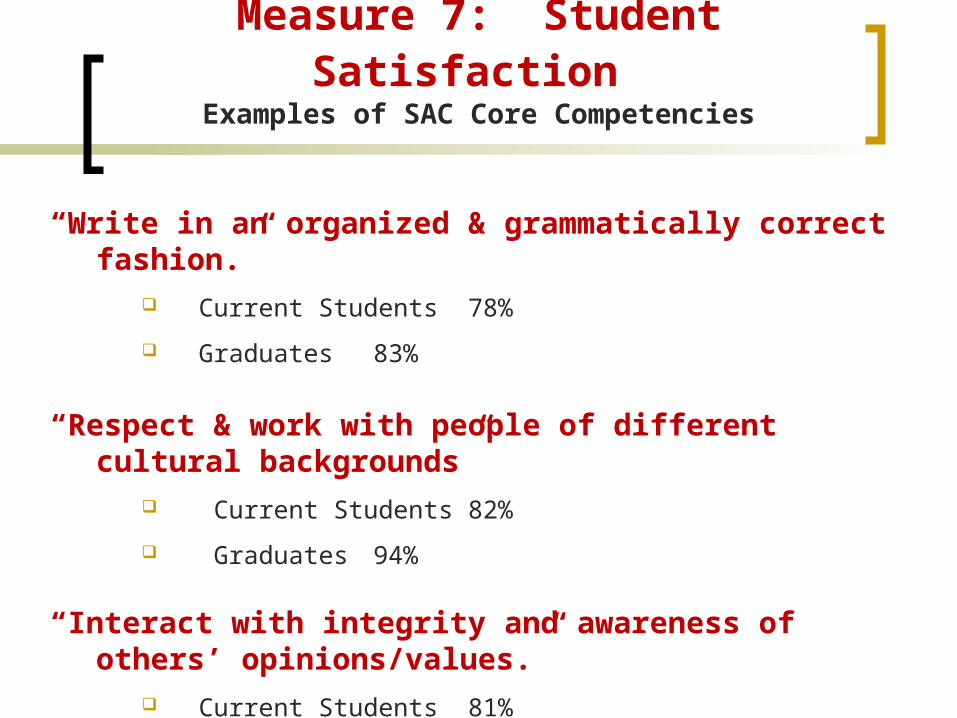
Measure 7: Student Satisfaction
Examples of SAC Core Competencies
“Write in an organized & grammatically correct fashion.”
Current Students 78%
Graduates 83%
“Respect & work with people of different cultural backgrounds”
Current Students 82%
Graduates 94%
“Interact with integrity and awareness of others’ opinions/values.”
Current Students 81%
Graduates 88%

Measure 7: Student Satisfaction
Examples of SCC Student Learning Outcomes
“Take responsibility for one’s own learning and well-being.”
Current Students 78%
Graduates 86%
“Communicate ideas in a clear and articulate manner.”
Current Students 74%
Graduates 90%
“Critically analyze, evaluate, organize and use quantitative and qualitative data.”
Current Students 77%
Graduates 87%

Measure 8: Matriculation of Continuing Education Students
to Credit Program
938 970 983 791
0
200
400
600
800
Fall 2007 Fall 2008 Fall 2009 Fall 2010
CE to SAC Credit
152 162 166 172
0
50
100
150
200
Fall 2007 Fall 2008 Fall 2009 Fall 2010
CE to SCC Credit
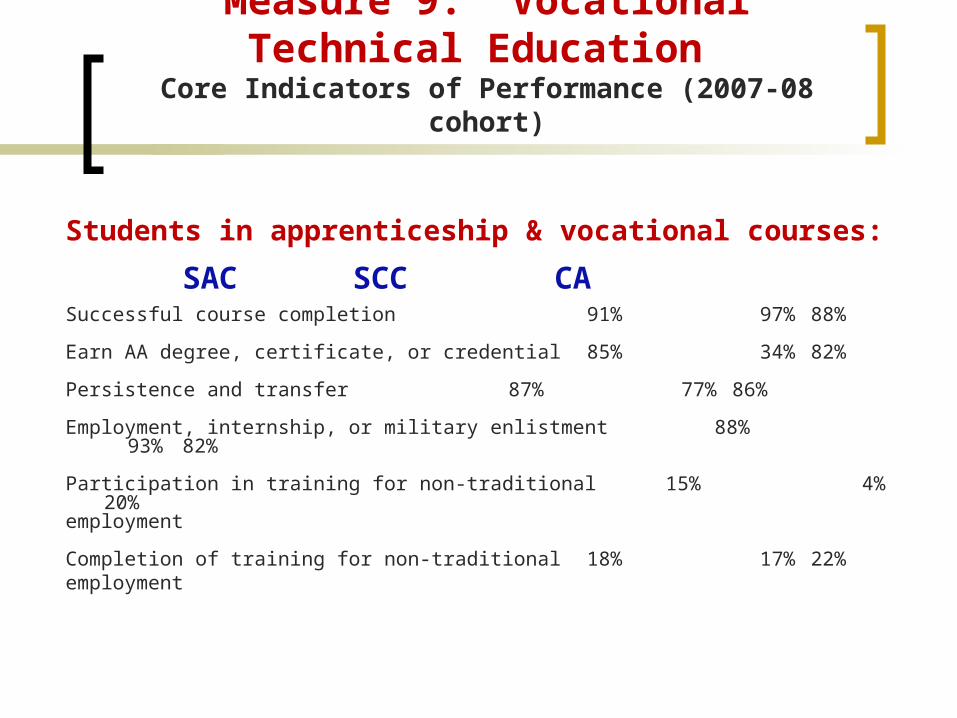
Measure 9: Vocational Technical Education
Core Indicators of Performance (2007-08 cohort)
Students in apprenticeship & vocational courses:
SAC SCC CASuccessful course completion 91% 97% 88%
Earn AA degree, certificate, or credential 85% 34% 82%
Persistence and transfer 87% 77% 86%
Employment, internship, or military enlistment 88% 93% 82%
Participation in training for non-traditional 15% 4% 20%employment Completion of training for non-traditional 18% 17% 22%employment

Measure 10: Employee Diversity
% of Non-White Districtwide
43%
60%
33%
50%
64%
38%
0%
10%
20%
30%
40%
50%
60%
70%
F/T Faculty F/T Classified F/T Management
Fall 2005 Fall 2010

Measure 11: Financial Indicators
Ending Balance (% of Expenditures)
12.93%
5.24%5.70%
13.45%
12.22%
13.18%
12.18%11.12%
14.31%
8.44%9.62%
20.39%
0%
5%
10%
15%
20%
25%
1998-99 1999-00 2000-01 2001-02 2002-03 2003-04 2004-05 2005-06 2006-07 2007-08 2008-09 2009-10

Measure 12: Resource Development
Competitive Grant Income
$24,077,547
$30,238,778$30,128,395 $30,396,270
$25,614,423
$20,000,000
$25,000,000
$30,000,000
$35,000,000
2005-06 2006-07 2007-08 2008-09 2009-10Fiscal Year
District-wide Grants

Measure 12: Resource Development
Financial Aid Awarded to Students
$8,703,308
$8,847,829
$9,582,271$12,248,746
$16,058,040
$0
$5,000,000
$10,000,000
$15,000,000
$20,000,000
2005-06 2006-07 2007-08 2008-09 2009-10Fiscal Year
Awarded by SAC and SCC

Progress Toward 2010-2011 Goals
#1 -- Promote a learning community environment that is innovative, student-centered, and celebrates student achievement.
#2 -- Provide access and retention for completion programs, including transfer, vocational, and high school diploma programs; and prepare students for success in their academic, career, and personal life endeavors.
#3 – Update and implement facilities master plans, maximize college and community use of facilities, and incorporate “green” efforts into facilities development and other efforts when cost-effective.

Progress Toward 2010-2011 Goals
#4 -- Promote flexible, cost-effective educational programs and services including the use of cutting-edge technology and educational program delivery via technology.
#5 -- Pursue alternative public and private funding sources to increase the district’s fiscal sustainability and to implement the district’s vision and goals, and encourage the foundations and district to create plans for capital and program campaigns and alumni association development.
#6 -- Maintain a positive, productive working environment for employees, recognizing and embracing diversity and enhancing staff development opportunities that address innovation and technology.

Progress Toward 2010-2011 Goals
#7 -- Expand partnerships with business, labor, community groups, universities, schools, and other public and private agencies in order to enhance the district’s resource development; ensure student access and success; ensure robust economic development programs; and be responsive to workforce development needs and high demand career fields.
#8 -- Assess the educational needs of the communities we serve, and enhance awareness of the colleges and community involvement through outreach and advocacy among community constituencies and leaders.
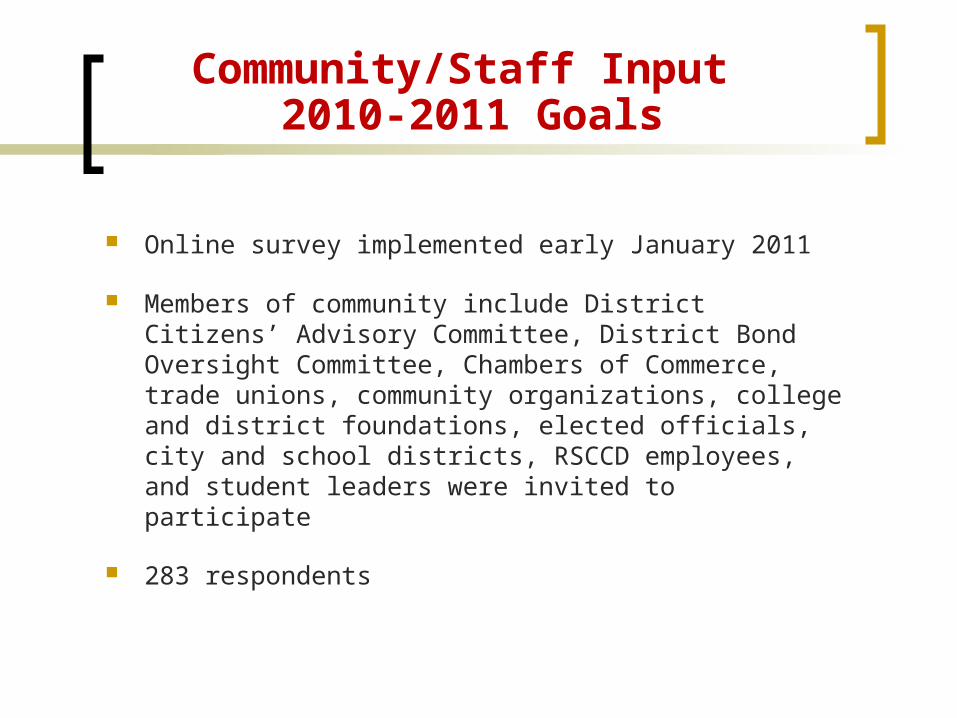
Community/Staff Input 2010-2011 Goals
Online survey implemented early January 2011
Members of community include District Citizens’ Advisory Committee, District Bond Oversight Committee, Chambers of Commerce, trade unions, community organizations, college and district foundations, elected officials, city and school districts, RSCCD employees, and student leaders were invited to participate
283 respondents
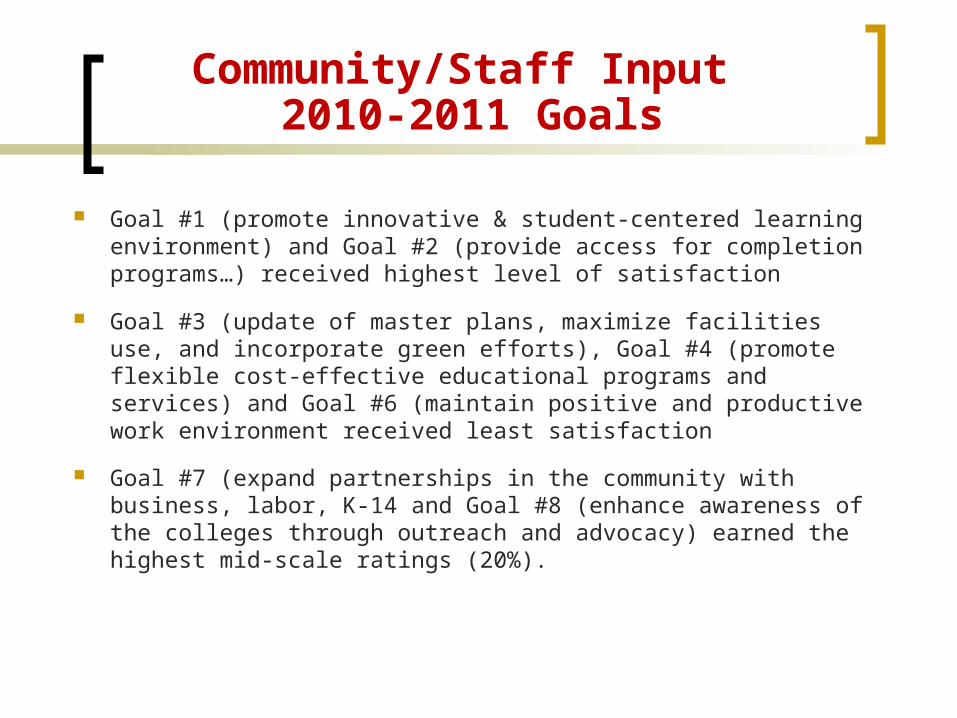
Community/Staff Input 2010-2011 Goals
Goal #1 (promote innovative & student-centered learning environment) and Goal #2 (provide access for completion programs…) received highest level of satisfaction
Goal #3 (update of master plans, maximize facilities use, and incorporate green efforts), Goal #4 (promote flexible cost-effective educational programs and services) and Goal #6 (maintain positive and productive work environment received least satisfaction
Goal #7 (expand partnerships in the community with business, labor, K-14 and Goal #8 (enhance awareness of the colleges through outreach and advocacy) earned the highest mid-scale ratings (20%).
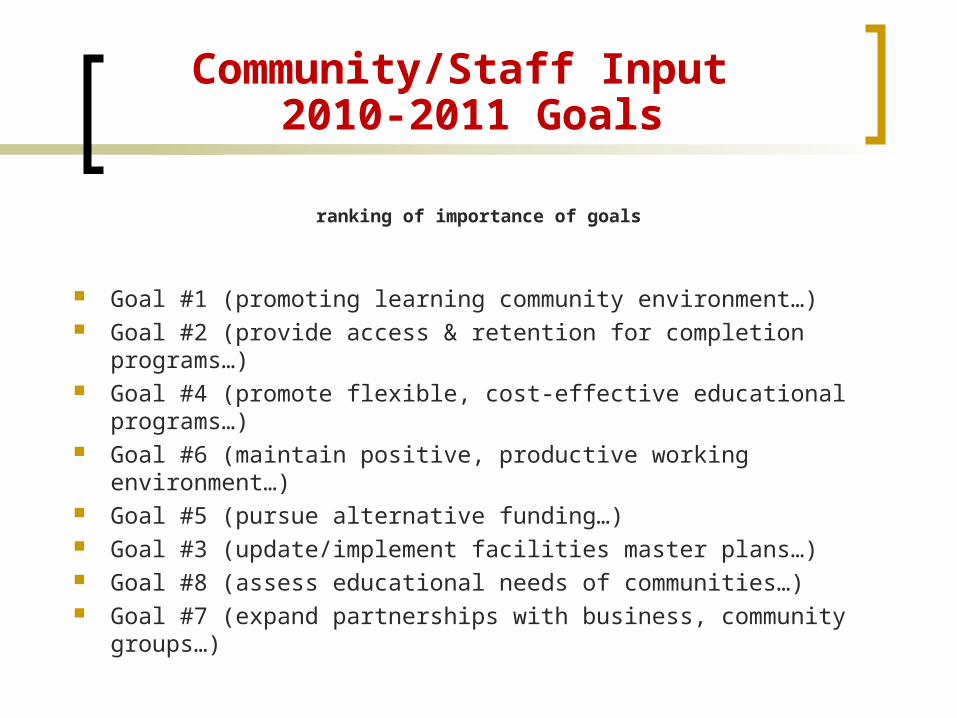
Community/Staff Input 2010-2011 Goals
Goal #1 (promoting learning community environment…) Goal #2 (provide access & retention for completion
programs…) Goal #4 (promote flexible, cost-effective educational
programs…) Goal #6 (maintain positive, productive working environment…) Goal #5 (pursue alternative funding…) Goal #3 (update/implement facilities master plans…) Goal #8 (assess educational needs of communities…) Goal #7 (expand partnerships with business, community
groups…)
ranking of importance of goals

Community/Staff Input of 2010-2011 Goals
Most frequently expressed comments
Reinstate COLA, step and longevity increases for staff
Build damaged morale of staff (due to reductions in force, etc.)
Remove politics from the classroom and move to a more student-centered climate
Increase emphasis on vocational classes Actively pursue green technology

Recommendations of 2011-2012 Goals
BOT vision/goals serve as guiding principles for district/colleges staff
Staff recommends that BOT maintains current goals for 2011-2012