Board of Governors PENSION & BENEFITS COMMITTEE 9:30 … · Board of Governors PENSION & BENEFITS...
52
Board of Governors PENSION & BENEFITS COMMITTEE Friday, 9 October 2015 9:30 a.m. to 12:00 noon NH 3001 OPEN SESSION ACTION 1. Approval of the 11 September 2015 Minutes* and Business Arising Decision 2. Execution Against the Work Plan* [Wickens] Information 3. Update on Government Pension Plan Initiatives [Shapira, Byron] Information 4. Asset/Liability Management* [Shapira, Byron] Information 5. Report from RPPI Subcommittee: [Wagner/Forsyth] a. Fund Overview and Domestic Investment Manager Review* b. 2015 Statement of Investment Policies & Procedures* c. Historical Data: Real Returns* Information Decision Discussion 6. Proposed Plan Amendments to Streamline Administration* [McGrath] Decision 7. Calculation of Commuted Value: Adoption of CIA Standard* [McGrath] Decision 8. Update re: Employee Family Assistance Program Changes Information 9. Other Business CONFIDENTIAL SESSION 10. Request re: Benefits Plan Coverage* [Kennedy] Decision 11. Next Meeting: Friday, 13 November 2015, 9:30 a.m. – 12:00 noon in NH 3001 *attached/to be distributed** 22 September 2015 Rebecca Wickens Associate University Secretary & Legal Counsel Please convey regrets to Cindy Baker at 519-888-4567 x32623 or [email protected]
Transcript of Board of Governors PENSION & BENEFITS COMMITTEE 9:30 … · Board of Governors PENSION & BENEFITS...

Board of Governors PENSION & BENEFITS COMMITTEE
Friday, 9 October 2015 9:30 a.m. to 12:00 noon
NH 3001
OPEN SESSION
ACTION
1. Approval of the 11 September 2015 Minutes* and Business Arising Decision
2. Execution Against the Work Plan* [Wickens]
Information
3. Update on Government Pension Plan Initiatives [Shapira, Byron] Information
4. Asset/Liability Management* [Shapira, Byron] Information
5. Report from RPPI Subcommittee: [Wagner/Forsyth] a. Fund Overview and Domestic Investment Manager Review* b. 2015 Statement of Investment Policies & Procedures* c. Historical Data: Real Returns*
Information Decision Discussion
6. Proposed Plan Amendments to Streamline Administration* [McGrath]
Decision
7. Calculation of Commuted Value: Adoption of CIA Standard* [McGrath] Decision
8. Update re: Employee Family Assistance Program Changes Information
9. Other Business
CONFIDENTIAL SESSION
10. Request re: Benefits Plan Coverage* [Kennedy] Decision
11. Next Meeting: Friday, 13 November 2015, 9:30 a.m. – 12:00 noon in NH 3001
*attached/to be distributed**
22 September 2015 Rebecca Wickens
Associate University Secretary & Legal Counsel
Please convey regrets to Cindy Baker at 519-888-4567 x32623 or [email protected]

Board of Governors
PENSION & BENEFITS COMMITTEE
Minutes of the Friday, 11 September 2015 Meeting
Present: Monika Bothwell, Lori Curtis, Peter Forsyth, Mary Hardy, Dennis Huber, Dave Kibble, Ramesh Kumar,
Ian Orchard*, Michael Steinmann, Christine Wagner, Karen Wilkinson [chair], Marta Witer
*left after item 4 of the agenda
Regrets: Marilyn Thompson
Secretariat: Rebecca Wickens
Resources: Linda Byron, Joan Kennedy, Sue McGrath, Allan Shapira
Guests: Stewart Forrest, Sarah Hadley
Organization of Meeting: Karen Wilkinson, chair of the committee, took the chair. Rebecca Wickens, secretary
of the committee, acted as secretary. The secretary advised that a quorum was present. The agenda was approved
without formal motion.
OPEN SESSION
1. APPROVAL OF THE MINUTES AND BUSINESS ARISING
The committee heard a motion to approve the open session minutes of the 19 June 2015 meeting. Witer and
Wagner. Carried (with 2 abstentions).
2. EXECUTION AGAINST THE WORK PLAN
The report was received for information.
3. UPDATE ON GOVERNMENT PENSION PLAN INITIATIVES
Aon Hewitt updated members re: the Ontario Retirement Pension Plan (ORPP), working group on the Ontario
university sector jointly sponsored pension plan (JSPP), and new commuted value standards coming into
force, highlighting: re: ORPP - employers with “comparable” workplace pension plans (e.g. defined benefit
pension plan) will not be impacted until 2020 and only then with respect to employees who are not part of the
workplace pension plan, need to consider how the ORPP will impact the University’s participating employers
(e.g. the university colleges), the earnings threshold for participation has not yet been determined; re: JSPP –
working group needs to report to the government by the end of the year, several universities will go through a
bargaining process to work out the remaining issues, the end result will be a framework for consideration by
universities and their governing bodies and stakeholders, how universities will fund existing deficits on
joining the plan, the trade-off between certainty of contribution rates and potentially higher costs; re: new
commuted value standards – effective 1 October 2015 the Canadian Institute of Actuaries requires the use of
new mortality tables for calculating commuted values, this will increase costs and negatively impact the 2016
valuation, Ontario has not passed new regulations to reflect the revised standard. Members heard that Human
Resources is already working on operationalizing the new commuted value calculations.
4. ANNUAL REPORT TO THE COMMUNITY
Members discussed the community’s interest in the JSPP, and the need to convey that the JSPP is in the early
stages of development and the committee will continue to monitor its progress. Subject to making the
foregoing clarification, there was a motion to approve the report for distribution. Curtis and Hardy. Carried.
[Note: the report was distributed to employees on 2 October 2015.]
Pension & Benefits Committee
11 September 2015 Minutes page 2
5. VACATION EXCHANGE PROGRAM FORM
McGrath reminded members re: the discussion at the June 2015 meeting and drew members’ attention to the
new wording on the vacation exchange program form. Members asked that the second clause re:
grandfathering be deleted, because it could create false expectations on the part of plan members. The
committee endorsed the revised language by general consensus.
6. OTHER BUSINESS
There was no other business.
7. NEXT MEETING
The next meeting will be held Friday, 9 October 2015, 9:30 a.m. – 12:00 noon in NH 3001.
The committee convened in confidential session.
2 October 2015 Rebecca Wickens
Associate University Secretary & Legal Counsel

Pension & Benefits Committee, Board of Governors, University of Waterloo Execution against Work Plan
The below represents the annual responsibilities of the P&B Committee and has been prepared as an aid to planning only. The committee’s activities are much broader, however, and include: legislative changes, plan changes and improvements; selection of managers and service providers; and requests from the UW community regarding pension and benefits plans.
1 The 2014 version of the SIPP was approved by the Board of Governors at its 28 October 2014 meeting, so the annual review of the SIPP was deferred by Registered Pension Plan Investments Subcommittee (RPPI) and Finance & Investment Committee (F+I). In the interim, RPPI was made aware of regulatory changes impacting the SIPP; however, guidance from the government and committee advisors on how to address the changes is still forthcoming. It is expected that the revised SIPP will be presented to F+I and P&B in September or October. 2 1 January 2014 Actuarial Valuation Report was filed in July 2014.
Task Frequency 21 Nov 2014
19 Dec 2014
23 Jan 2015
27 Feb 2015
27 Mar 2015
22 May 2015
19 Jun 2015
11 Sept 2015
09 Oct 2015
Approval of Actuarial Valuation Assumptions Annual
Approval of the Statement of Investment Policies and Procedures (SIPP)
Annual 1
Preliminary Valuation Results (RPP and PPP) Annual
Actuarial Valuations (RPP and PPP) Annual
Actuarial Filing2 Minimum every three years
Cost-of-living adjustment to payroll pension plan limit
Annual
Cost-of-living Increase for Pensioners Annual
Pensions for Deferred Members Annual
Salaries for Pension Purposes for Individuals on Long-term Disability
Annual
Benefits Plan Premium Renewals Annual
Indexing of Long-term Disability Plan Benefits and Maxima
Annual
3 Conducted online in May (new procedure implemented for all Board committees starting spring 2014)
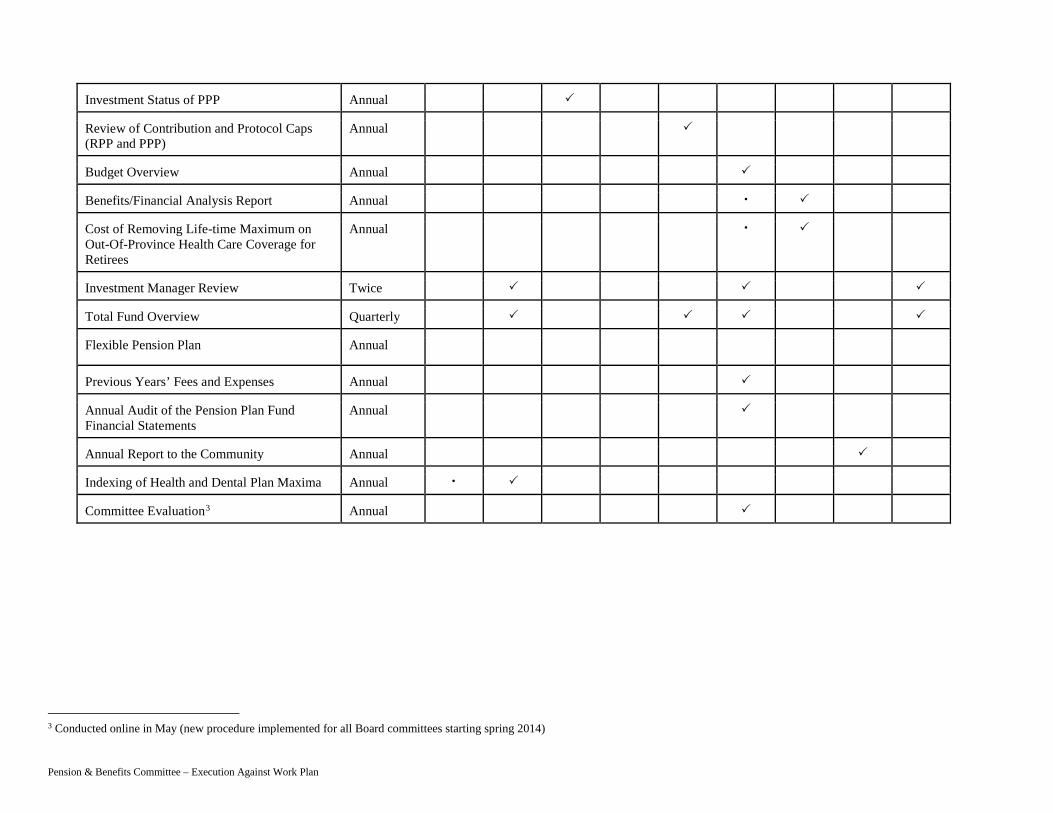
Investment Status of PPP Annual
Review of Contribution and Protocol Caps (RPP and PPP)
Annual
Budget Overview Annual
Benefits/Financial Analysis Report Annual
Cost of Removing Life-time Maximum on Out-Of-Province Health Care Coverage for Retirees
Annual
Investment Manager Review Twice
Total Fund Overview Quarterly
Flexible Pension Plan Annual
Previous Years’ Fees and Expenses Annual
Annual Audit of the Pension Plan Fund Financial Statements
Annual
Annual Report to the Community Annual
Indexing of Health and Dental Plan Maxima Annual
Committee Evaluation3 Annual
Pension & Benefits Committee – Execution Against Work Plan

XYZ Canada | As of June 30, 2015
To protect the confidential and proprietary information included in this material, it may not be disclosed or provided to any third parties without the approval of Aon Hewitt.
Asset/Liability Management Dashboard (Sample)

2
About This Material
This document is a sample of a reporting tool that can be used to track changes in funded status of the Pension Plan over successive reporting periods, as well as quantify the amount of risk to which the Pension Plan is exposed. The report prepares the funded status and performs the analysis on two bases:
Risk-Free Benchmark Basis – This liability would be calculated using best estimate assumptions for retirement, termination and other demographic experience, and a discount rate and inflation assumption determined with reference to the risk-free environment. For example, this liability could be determined at the real return bond yield plus a credit spread to reflect additional yield that can be achieved with relatively little additional risk. This liability differs from the wind-up or solvency calculation in that the demographic assumptions are best estimate and “grow-in” provisions are not included.
Going Concern Basis – This liability would be calculated using the going concern assumptions at the most recent valuation. This dashboard compares the going concern liability with the liability calculated using the risk-free benchmark . The difference between the two liabilities represents the amount of return expected to be provided by taking on risk in the investment portfolio. Over successive quarters the tool helps quantify how that risk changes as the underlying interest rates change.
On both bases the following information is shown:
■ Current Funded Status and Historical Asset Liability Performance
— How well funded is the plan?
— What has been the return on plan assets and liabilities?
■ Detailed Asset and Liability Performance Attribution
— What factors drove the performance of assets and liabilities over the prior period?
— What is the relative impact of these factors on the assets and liabilities in isolation and in combination?
■ Scenario Testing
— What risk exposures does the plan face?
— What would be the impact of a downside event for each risk factor?
All values included are for a sample pension plan and do not reflect the University of Waterloo Pension Plan.
XYZ Canada | As of June 30, 2015

3
Executive Summary – Risk-Free Liability BenchmarkFunded Status
Asset-Liability Return
Highlights for the Quarter-Ending 6/30/15The plan's funded ratio increased to 54.30% at 6/30/15. This result was primarily due to the combined effects of:
■ Asset performance lower than expected,
■ Contributions of $350 thousand, and
■ A decrease in liabilities due to an increase in interest rates.
Asset Liability Return for Quarter-Ending 6/30/15Assets lost 2.86% during the quarter while liabilities lost 5.26%, resulting in a funded status increase of 1.64%.
XYZ Canada | As of June 30, 2015
Values in $1,000
6/30/14 9/30/14 12/31/14 3/31/15 6/30/15 Market Value of Assets $ 21,397 $ 21,440 $ 21,561 $ 22,448 $ 21,745 Liability 39,781 40,314 40,356 42,627 40,048 Surplus/(Deficit) $ (18,384) $ (18,874) $ (18,795) $ (20,179) $ (18,303)
Periodic Contributions $ 350 $ 350 $ 350 $ 350 Discount Rate 1.56% 1.36% 1.03% 0.61% 0.94%
Funded Ratio: Assets/Liability 53.8% 53.2% 53.4% 52.7% 54.3%
Periodic Return/Change Cumulative 9/30/14 12/31/14 3/31/15 6/30/15
Market Value of Assets Return 2.9% 0.5% 0.9% 4.4% -2.9%
Liability: Return 4.1% 2.2% 1.0% 6.5% -5.3%
Funded Ratio Change 0.5% -0.6% 0.2% -0.7% 1.6%

4
Liabilities
Assets
Risk-Free Asset-Liability Benchmark Performance Attribution
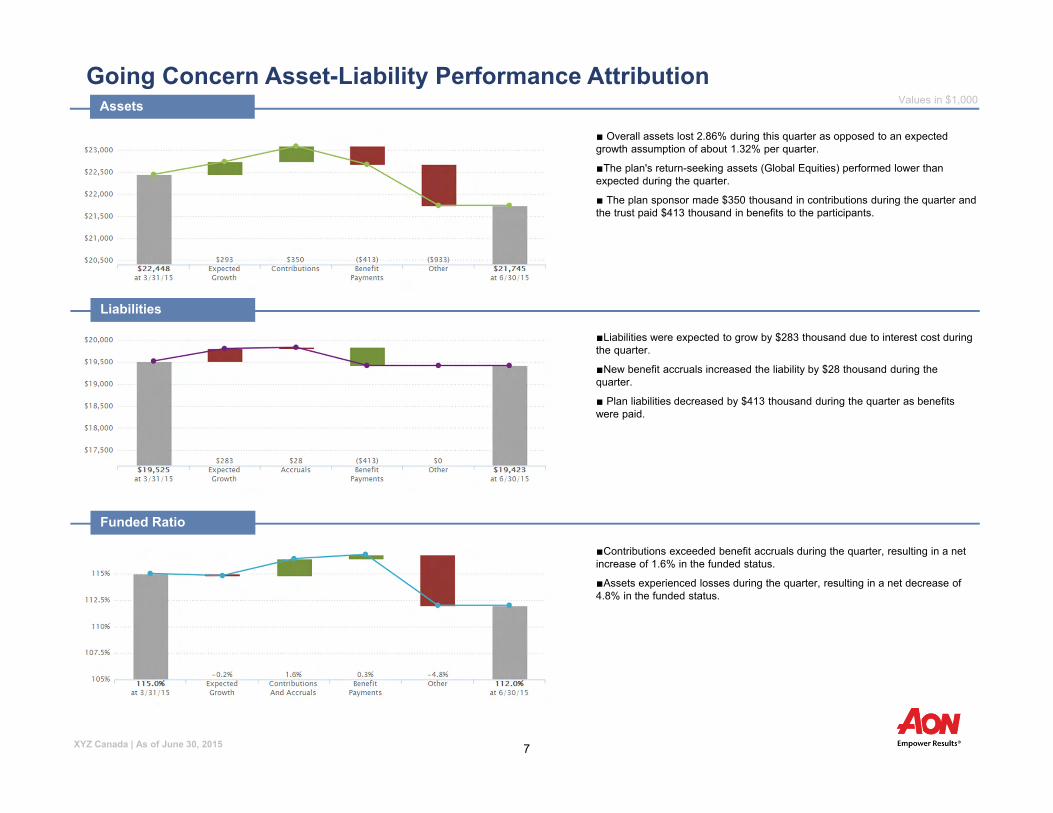
■ Overall assets lost 2.86% during this quarter as opposed to an expected growth assumption of about 1.32% per quarter.
■ The fixed income assets lost value due to an increase in the underlying risk-free rates and widening credit spreads.
■ The plan's return-seeking assets (Global Equities) performed lower than expected during the quarter.
■The plan sponsor made $350 thousand in contributions during the quarter and the trust paid $413 thousand in benefits to the participants.
■Liabilities were expected to grow by $-54 thousand due to interest cost during the quarter.
■Risk-free rates increased, and credit spreads were unchanged, resulting in a net decrease of $2,157 thousand ($2,157 thousand - $0 thousand).
■ New benefit accruals increased the liability by $72 thousand during the quarter.
■ Plan liabilities decreased by $413 thousand during the quarter as benefits were paid.
XYZ Canada | As of June 30, 2015
Values in $1,000
Funded Ratio
■ Overall, the difference in exposure to risk-free rates between assets and liabilities combined with changes in risk-free rates resulted in an increase in funded status of 1.75%.
■ Similarly, the difference in exposure to credit spreads between assets and liabilities combined with changes in credit spreads resulted in a decrease in funded status of 0.17%.
■ Return-seeking assets did not perform as well as expected during the quarter, deducting 1.06% from the plan's funded status during the period.
■ Contributions exceeded benefit accruals during the quarter, resulting in a net increase of 0.77% in the funded status.

5
Risk-Free Benchmark Sensitivity AnalysisCredit Spreads
Return-Seeking Assets
Risk-Free Rates
Inflation
Up 100bps Current
Down 100bps
Market Value of Assets $20,850 $21,745 $22,740
Liability $40,048 $40,048 $40,048
Surplus/(Deficit) ($19,198) ($18,303) ($17,308)
Change ($895) $995
XYZ Canada | As of June 30, 2015
Values in $1,000
Up 100bps Current
Down 100bps
Market Value of Assets $20,578 $21,745 $23,087
Liability $34,891 $40,048 $46,459
Surplus/(Deficit) ($14,313) ($18,303) ($23,372)
Change $3,990 ($5,069)
Increase 20% Current
Decrease 20%
Market Value of Assets $24,301 $21,745 $19,189
Liability $40,048 $40,048 $40,048
Surplus/(Deficit) ($15,747) ($18,303) ($20,859)
Change $2,556 ($2,556)
Up 100bps Current
Down 100bps
Market Value of Assets $21,745 $21,745 $21,745
Liability $46,424 $40,048 $34,835
Surplus/(Deficit) ($24,679) ($18,303) ($13,090)
Change ($6,376) $5,213
6
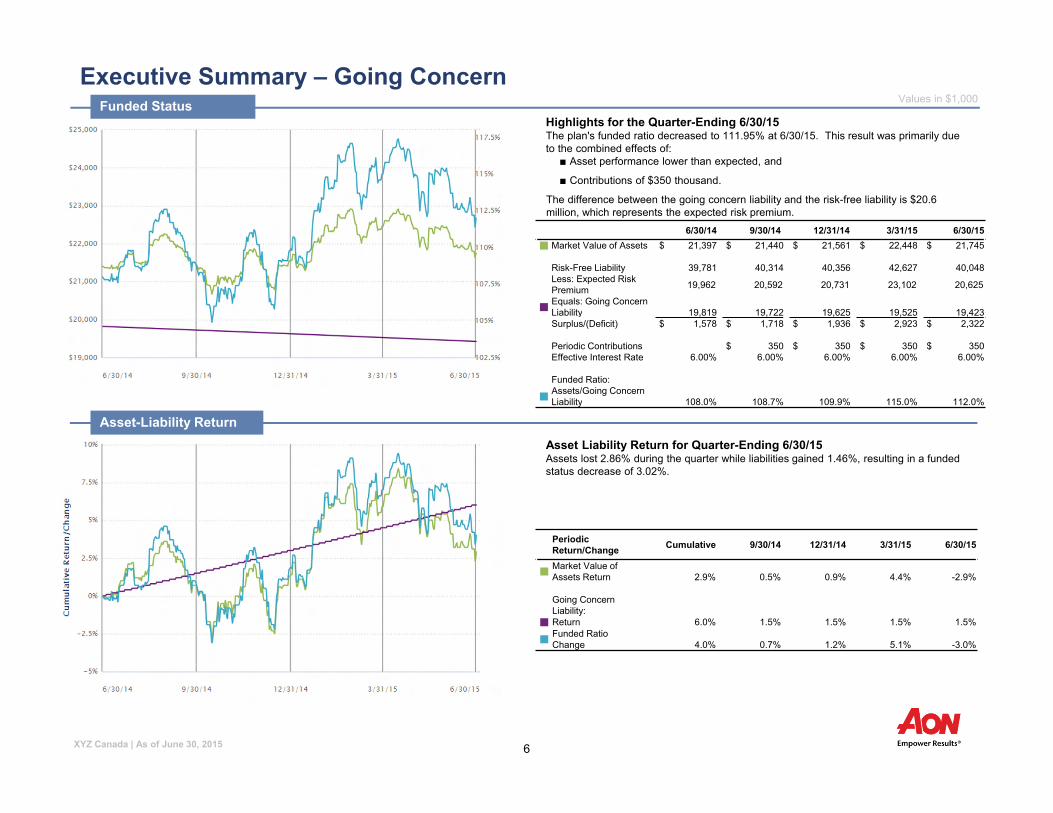
Executive Summary – Going ConcernFunded Status
Asset-Liability Return
Highlights for the Quarter-Ending 6/30/15The plan's funded ratio decreased to 111.95% at 6/30/15. This result was primarily due to the combined effects of:
■ Asset performance lower than expected, and
■ Contributions of $350 thousand.
The difference between the going concern liability and the risk-free liability is $20.6 million, which represents the expected risk premium.
Asset Liability Return for Quarter-Ending 6/30/15Assets lost 2.86% during the quarter while liabilities gained 1.46%, resulting in a funded status decrease of 3.02%.
XYZ Canada | As of June 30, 2015
Values in $1,000
6/30/14 9/30/14 12/31/14 3/31/15 6/30/15 Market Value of Assets $ 21,397 $ 21,440 $ 21,561 $ 22,448 $ 21,745
Risk-Free Liability 39,781 40,314 40,356 42,627 40,048Less: Expected Risk Premium 19,962 20,592 20,731 23,102 20,625
Equals: Going Concern Liability 19,819 19,722 19,625 19,525 19,423
Surplus/(Deficit) $ 1,578 $ 1,718 $ 1,936 $ 2,923 $ 2,322
Periodic Contributions $ 350 $ 350 $ 350 $ 350 Effective Interest Rate 6.00% 6.00% 6.00% 6.00% 6.00%
Funded Ratio:
Assets/Going Concern Liability 108.0% 108.7% 109.9% 115.0% 112.0%
Periodic Return/Change Cumulative 9/30/14 12/31/14 3/31/15 6/30/15
Market Value of Assets Return 2.9% 0.5% 0.9% 4.4% -2.9%
Going Concern Liability:
Return 6.0% 1.5% 1.5% 1.5% 1.5%
Funded Ratio Change 4.0% 0.7% 1.2% 5.1% -3.0%
7
Liabilities
Assets
Going Concern Asset-Liability Performance Attribution
■ Overall assets lost 2.86% during this quarter as opposed to an expected growth assumption of about 1.32% per quarter.
■The plan's return-seeking assets (Global Equities) performed lower than expected during the quarter.
■ The plan sponsor made $350 thousand in contributions during the quarter and the trust paid $413 thousand in benefits to the participants.
■Liabilities were expected to grow by $283 thousand due to interest cost during the quarter.
■New benefit accruals increased the liability by $28 thousand during the quarter.
■ Plan liabilities decreased by $413 thousand during the quarter as benefits were paid.
XYZ Canada | As of June 30, 2015
Values in $1,000
Funded Ratio
■Contributions exceeded benefit accruals during the quarter, resulting in a net increase of 1.6% in the funded status.
■Assets experienced losses during the quarter, resulting in a net decrease of 4.8% in the funded status.
8
Appendix
XYZ Canada | As of June 30, 2015

9
Asset Allocation and BenchmarkingAsset Class 6/30/15
Fixed Income■ FTSE TMX Long Bonds 45.64%
Global Equities■ MSCI World 54.36%
Total 100.00%
XYZ Canada | As of June 30, 2015

10
Asset Allocation and BenchmarkingAsset Class 6/30/15
Fixed Income■ FTSE TMX Long Bonds 45.64%
Global Equities■ MSCI World 54.36%
Total 100.00%
XYZ Canada | As of June 30, 2015

11
Glossary of Terms■ Funded Status and Asset-Liability Return
— Liability Return reflects the growth in liability due solely to interest rate movements and excludes the impact of Accruals and Benefit Payments.
■ Asset Liability Performance Attribution
— Expected Growth reflects assets growing at the expected annual return and liabilities increasing at the interest rate.
— Risk-Free Rates splits out the expected movement in assets and liabilities based on movements in Government of Canada bond yields.
— Credit Spreads splits out the expected movements in corporate yields in excess of Government of Canada bond yields.
— Excess Return-Seeking Assets defines the movement in the Return-Seeking assets based on benchmark returns in excess of expectations. The expectations are defined by the long-term capital market assumptions of the plan and are reflected in "expected growth".
— Benefit Payments displays the expected decrease in assets and liabilities due to benefit payments during the period.
— Contributions/Accruals displays the expected increase in assets and liabilities due to employer contributions and new benefit accruals, respectively.
— Other includes fixed income returns due to coupons and other active management effects, from the asset perspective. From a liability perspective, this bucket includes all liability changes not explained by financial movements during the period.
XYZ Canada | As of June 30, 2015

Report to the P&B Committee from the RPPI subcommittee members October 9, 2015 The RPPI met on September 29, 2015. Attached to this report you will find:
a) AON Hewitt Performance Review of RPP Investments at 30 June 2015 (3 page excerpt) b) UW RPP Investment Performance to 30 June 2015 c) Amended SIPP
1. Review of total fund performance as at June 30, 2015:
AON Hewitt discussed the fund performance from Q2 2015 (refer to attachments a and b) Total Fund: as of April 1, 2015 $ 1,418,029,000
Net Withdrawals -$ 5,688,000 Loss $ -24,474,000 Return over Q2 2015 = -1.73% 2. Reports from Canadian Investment Managers:
a. Sionna There was a presentation from Sionna, a Canadian equity manager. Sionna has overweighted energy and financials, and has no allocation to healthcare, which impacted performance negatively. During the last quarter, the Sionna portfolio returned -2.8 %, compared with the TSX index return of -1.6%.
b. TD Asset Management There was a presentation from TD Asset Management (TDAM). TDAM manages an index bond fund, a short term corporate bond fund, and holds the long term US treasuries. TDAM also manages the currency hedge. Currently about 50% of the foreign equities are hedged to the CAD. The bond funds closely match their respective indices.
3. Follow up on Oldfield compliance letters The University is now in receipt of confirmation of compliance from Oldfield.
4. Changes impacting the SIPP – including ESG: Various housekeeping changes to the SIPP agreement are recommended. (refer to attachment c) A major change is the inclusion of a statement on Ethical Investing (ESG). The RPPI recognizes this statement as a placeholder, to ensure that the fund is in compliance with the new regulations coming into effect. The RPPI urges the Pension and Benefits Committee to set up a process for developing a consultative procedure for refining this ESG statement (eg. a sub-committee).
5. Low volatility equity strategies, liability aware investing, etc.:
Additional information (reports) on these strategies are available through TDAM upon request.
6. Update from Finance & Investment Committee (F&I): The F&I are scheduled to meet on October 5th – a report will follow.
Submitted by Peter Forsyth and Christine Wagner
1 | P a g e

Allocation
MarketValue($000)
%
Performance (%)
1Quarter
YTD1
Year2
Years3
Years4
Years5
Years10
Years
Total Fund ex. Currency Overlay 1,387,867 100.0 -1.74 5.88 10.77 11.71 9.79 9.57 9.82 6.00
CPI + 3.75% 1.64 4.07 4.82 5.53 5.37 5.38 5.72 5.66
Value Added -3.38 1.81 5.95 6.18 4.42 4.19 4.10 0.34
Sionna 51,157 3.7 -2.79 (98) 0.53 (65) -3.21 (79) 10.59 (87) 11.02 (89) - - -
S&P/TSX Composite -1.63 0.91 -1.16 12.77 11.12 5.34 8.28 6.86
Value Added -1.16 -0.38 -2.05 -2.18 -0.10 - - -
Canadian Equity Median -1.27 1.77 1.07 14.44 14.02 7.86 10.27 7.57
Canadian Equities 51,157 3.7 -2.79 0.53 -3.21 10.59 11.02 1.02 4.28 4.86
S&P/TSX Composite -1.63 0.91 -1.16 12.77 11.12 5.34 8.28 6.86
Value Added -1.16 -0.38 -2.05 -2.18 -0.10 -4.32 -4.00 -2.00
Oldfield 118,367 8.5 -0.26 (41) 14.58 (17) 14.96 (84) 19.75 (80) 19.37 (89) 13.75 (89) - -
MSCI World Index (C$) -1.12 10.62 18.88 22.02 22.25 16.37 16.80 6.58
Value Added 0.86 3.96 -3.92 -2.27 -2.88 -2.62 - -
Global Equity Median -0.60 12.10 20.24 22.71 23.10 16.97 17.31 7.78
Trilogy 160,067 11.5 -0.32 (42) 12.69 (40) 21.63 (38) 22.08 (60) 22.67 (56) 17.19 (47) 17.71 (42) -
MSCI World Index (C$) -1.12 10.62 18.88 22.02 22.25 16.37 16.80 6.58
Value Added 0.80 2.07 2.75 0.06 0.42 0.82 0.91 -
Global Equity Median -0.60 12.10 20.24 22.71 23.10 16.97 17.31 7.78
Walter Scott 186,094 13.4 -0.24 (41) 10.94 (73) 20.67 (47) 20.40 (74) 20.49 (81) 16.79 (55) 16.28 (70) -
MSCI World Index (C$) -1.12 10.62 18.88 22.02 22.25 16.37 16.80 6.58
Value Added 0.88 0.32 1.79 -1.62 -1.76 0.42 -0.52 -
Global Equity Median -0.60 12.10 20.24 22.71 23.10 16.97 17.31 7.78
Global Equities 464,529 33.5 -0.27 12.38 19.29 20.65 20.86 15.90 16.24 4.83
MSCI World Index (C$) -1.12 10.62 18.88 22.02 22.25 16.37 16.80 6.58
Value Added 0.85 1.76 0.41 -1.37 -1.39 -0.47 -0.56 -1.75
Executive Summary
Performance Summary
As of 30 June 2015
Parentheses contain percentile rankings. (1st percentile is the best performing). All returns are reported gross of fees.There was no exposure to Canadian Equities from January 2012 to April 2012. *The RRB portfolio was liquidated and funds invested in a Short Term Corporate strategy on 17 December2014. **In March 2014, TDAM U.S. equity portfolio was liquidated and invested in U.S. Treasury bonds. CPI+3.75% benchmark has been implemented retrospectively since 1 January2014, CPI+3.85% prior to that.
Page 3
Executive Summary
Performance Summary
As of 30 June 2015
Allocation
MarketValue($000)
%
Performance (%)
1Quarter
YTD1
Year2
Years3
Years4
Years5
Years10
Years
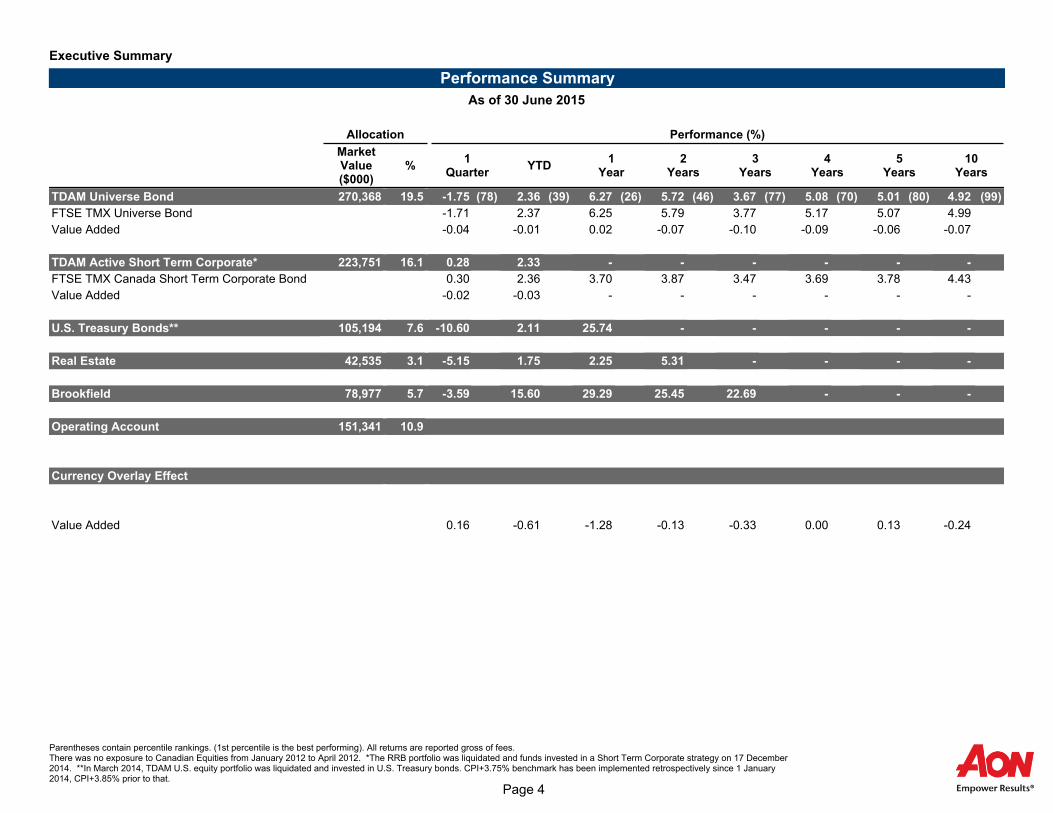
TDAM Universe Bond 270,368 19.5 -1.75 (78) 2.36 (39) 6.27 (26) 5.72 (46) 3.67 (77) 5.08 (70) 5.01 (80) 4.92 (99)
FTSE TMX Universe Bond -1.71 2.37 6.25 5.79 3.77 5.17 5.07 4.99
Value Added -0.04 -0.01 0.02 -0.07 -0.10 -0.09 -0.06 -0.07
Canadian Bonds Median -1.64 2.27 5.87 5.68 3.93 5.28 5.25 5.22
TDAM Active Short Term Corporate* 223,751 16.1 0.28 2.33 - - - - - -
FTSE TMX Canada Short Term Corporate Bond 0.30 2.36 3.70 3.87 3.47 3.69 3.78 4.43
Value Added -0.02 -0.03 - - - - - -
U.S. Treasury Bonds** 105,194 7.6 -10.60 2.11 25.74 - - - - -
Real Estate 42,535 3.1 -5.15 1.75 2.25 5.31 - - - -
Brookfield 78,977 5.7 -3.59 15.60 29.29 25.45 22.69 - - -
Operating Account 151,341 10.9
Real Return Bonds 141,074 10.2 0.18 0.43 0.87 0.54 0.88 - - -
Operating Account 10,267 0.7 0.13 0.14 0.16 0.35 0.26 0.50 0.41 0.79
Currency Overlay Effect
Total Fund & CO 1,387,686 100.0 -1.58 5.27 9.49 11.58 9.46 9.57 9.95 5.76
Total Fund ex CO -1.74 5.88 10.77 11.71 9.79 9.57 9.82 6.00
Value Added 0.16 -0.61 -1.28 -0.13 -0.33 0.00 0.13 -0.24
Real Return Bonds - 0.0 - - - - - - - -
Parentheses contain percentile rankings. (1st percentile is the best performing). All returns are reported gross of fees.There was no exposure to Canadian Equities from January 2012 to April 2012. *The RRB portfolio was liquidated and funds invested in a Short Term Corporate strategy on 17 December2014. **In March 2014, TDAM U.S. equity portfolio was liquidated and invested in U.S. Treasury bonds. CPI+3.75% benchmark has been implemented retrospectively since 1 January2014, CPI+3.85% prior to that.
Page 4

Performance (%)
1Quarter
YTD1
Year2
Years3
Years4
Years5
Years10
Years
Total Fund ex. Currency Overlay -1.75 5.80 10.54 11.44 9.51 9.30 9.55 5.75
CPI + 3.75% 1.64 4.07 4.82 5.53 5.37 5.38 5.72 5.66
Value Added -3.39 1.73 5.72 5.91 4.14 3.92 3.83 0.09
Sionna -2.79 (98) 0.44 (67) -3.48 (81) 10.23 (91) 10.65 (90) - - -
S&P/TSX Composite -1.63 0.91 -1.16 12.77 11.12 5.34 8.28 6.86
Value Added -1.16 -0.47 -2.32 -2.54 -0.47 - - -
Canadian Equity Median -1.27 1.77 1.07 14.44 14.02 7.86 10.27 7.57
Oldfield -0.26 (41) 14.37 (18) 14.32 (85) 18.98 (85) 18.57 (93) 12.97 (91) - -
MSCI World Index (C$) -1.12 10.62 18.88 22.02 22.25 16.37 16.80 6.58
Value Added 0.86 3.75 -4.56 -3.04 -3.68 -3.40 - -
Global Equity Median -0.60 12.10 20.24 22.71 23.10 16.97 17.31 7.78
Trilogy -0.32 (42) 12.54 (42) 21.17 (42) 21.53 (67) 22.09 (63) 16.62 (59) 17.12 (52) -
MSCI World Index (C$) -1.12 10.62 18.88 22.02 22.25 16.37 16.80 6.58
Value Added 0.80 1.92 2.29 -0.49 -0.16 0.25 0.32 -
Global Equity Median -0.60 12.10 20.24 22.71 23.10 16.97 17.31 7.78
Walter Scott -0.24 (41) 10.74 (76) 20.00 (53) 19.61 (81) 19.66 (88) 15.97 (69) 15.45 (81) -
MSCI World Index (C$) -1.12 10.62 18.88 22.02 22.25 16.37 16.80 6.58
Value Added 0.88 0.12 1.12 -2.41 -2.59 -0.40 -1.35 -
Global Equity Median -0.60 12.10 20.24 22.71 23.10 16.97 17.31 7.78
Global Equities -0.44 (46) 12.01 (54) 18.57 (66) 19.88 (79) 20.07 (86) 15.14 (78) 15.48 (80) 4.13 (100)
MSCI World Index (C$) -1.12 10.62 18.88 22.02 22.25 16.37 16.80 6.58
Value Added 0.68 1.39 -0.31 -2.14 -2.18 -1.23 -1.32 -2.45
Global Equity Median -0.60 12.10 20.24 22.71 23.10 16.97 17.31 7.78
TDAM Universe Bond -1.76 2.35 6.24 5.69 3.64 5.04 4.98 4.88
FTSE TMX Canada Universe Bond Index - C$ -1.71 2.37 6.25 5.79 3.77 5.17 5.07 5.00
Value Added -0.05 -0.02 -0.01 -0.10 -0.13 -0.13 -0.09 -0.12
TDAM Active Short Term Corporate 0.25 2.27 - - - - - -
FTSE TMX Canada Short Term Corporate Bond 0.30 2.36 3.70 3.87 3.47 3.69 3.78 4.43
Value Added -0.05 -0.09 - - - - - -
U.S. Treasury Bonds* -10.60 2.10 25.71 - - - - -
Executive Summary
Performance Summary (Net of Fees)
As of 30 June 2015
Parentheses contain percentile rankings. (1st percentile is the best performing). Peer universe for percentile rankings are gross of fees.There was no exposure to Canadian Equities from January 2012 to April 2012. *In March 2014, TDAM U.S. equity portfolio was liquidated and invested in U.S. Treasury bonds. CPI+3.75%benchmark has been implemented retrospectively since 1 January 2014, CPI+3.85% prior to that.
Page 6

University of Waterloo
Registered Pension Plan
Investment Performance to 30 June 2015
Year to One Two Three Four Five Ten Inception Since
Manager $ millions Date Year Years Years Years Years Years Date @UW Inception
TDAM 1
Fixed Income 270.4 2.4 6.3 5.7 3.7 5.1 5.0 4.9 31 Dec 2004 5.3
Objective 2.4 6.3 5.8 3.8 5.2 5.1 5.0 5.4
Value Added -0.1
U.S. Treasury Bond 105.2 2.1 25.7 na na na na 20 Mar 2014 20.2
Short Term Corporate Bond 223.8 2.3 na na na na na 17 Dec 2014 2.3
Objective 2.4 3.7 3.9 3.5 3.7 3.8 2.4
Value Added 0.0 na na na na na 0.0
Sionna
Canadian Equities 51.2 0.5 -3.2 10.6 11.0 na na 27 Apr 2012 8.9
Objective 1.4 -0.2 13.9 12.2 6.4 9.4 9.8
Value Added -0.9 -3.0 -3.3 -1.2 na na -0.9
Trilogy
Global Equities 160.1 12.7 21.6 22.1 22.7 17.2 17.7 31 Mar 2008 9.5
Objective 11.7 21.3 24.5 24.7 18.7 19.1 10.4
Value Added 1.0 0.4 -2.4 -2.0 -1.5 -1.4 -0.9
Walter Scott
Global Equities 186.1 10.9 20.7 20.4 20.5 16.8 16.3 31 Jul 2009 13.6
Objective 11.7 21.3 24.5 24.7 18.7 19.1 16.3
Value Added -0.8 -0.6 -4.1 -4.2 -1.9 -2.9 -2.6
Oldfield/Overstone
Global Equities 118.4 14.6 15.0 19.8 19.4 13.8 na 28 Jul 2011 13.8
Objective 11.7 21.3 24.5 24.7 18.7 19.1 18.7
Value Added 2.9 -6.3 -4.7 -5.3 -5.0 na -5.0
Brookfield Infrastructure 79.0 15.6 29.3 25.5 22.7 23 Nov 2011
iShares REIT 42.5 1.8 2.3 5.3 19 Oct 2012
Subtotal
Total Return ex. Currency Overlay 1236.5 5.9 10.8 11.7 9.8 9.6 9.8 6.0
CPI + 3.75% 24 4.1 4.8 5.5 5.4 5.4 5.7 5.7
Value Added 1.8 6.0 6.2 4.4 4.2 4.1 0.3
Other Investments
Currency Hedging 3 -0.2 -5.1 -7.0 -4.3 -2.9 15 Jul 2011 -3.1
BAs/U.S. and CDN Cash 141.1 0.4 0.7 1.4 0.0 20 Dec 2011
Operating Account 10.3 0.1 0.1 0.1 0.1 0.1 0.1 na
Total All (Cal'c by UW) 1387.7 4.9 9.5 10.8 9.2 9.0 9.4
Return Target: CPI+ 3.75% 5.7 5.7
Investment returns are gross of fees; reported returns are annualized1 TDAM = SIPP benchmark is tracking error vs index (passively managed) Objective: Cdn Equity = BM + 100 bps2 CPI+3.85% before 1 January 2014 Global Equity= BM + 200 bps3 Currency hedging - % of hedged amount Active Bond= BM + 50 bps 4 Preliminary number U.S. Treasury Bond = 30 Yr U.S. Treasury Yield
Infrastructure = CPI+3.75%
Short Term Corporate Fund = BM + 50 bps
Hedging Total Cdn % of Total
Currency $ Exposure Hedged 30 Yr U.S. Treasury Yield Ending June 30 (USD): 3.11
US$ 305 50% 30 Yr Cdn Treasury Yield Ending June 30 (CAD): 2.31
BPS 38 50%
Euro 41 75%
JPY 78 75%
Total 462
Going Concern Deficit (without asset smoothing)
Previously filed valuation 1 January 2010 $145.1m
Previously filed valuation 1 January 2011 $115.2m
Most recent filed valuation 1 January 2014 $149.5m
Most recent valuation (for mangement purposes) 1 January 2015 $112.1m
Comparative Canadian Universities and University of Waterloo - Pension performance
Assets greater than $500 million
2014 CAUBO annualized calendar year performance - equal weighted averageComparative Waterloo
One year 11.5 9.7Two years 13.4 9.6Four years 9.5 8.1Ten years 7.1 N/A

University of Waterloo Pension Plan (2011) STATEMENT OF INVESTMENT POLICIES AND PROCEDURES January 1, 20154
CONTENTS 1. Purpose 2. Background, Plan Type and Liabilities 3. Allocation of Investment Responsibilities 4. Return Expectations, Benchmark Portfolio, Fund Manager Investment Objectives 5. Aggregate Investment Limits, Permitted Investment Categories, Asset Mix Policy 6. Rebalancing 7. Conflict of Interest Policy and Disclosure Requirements 8. Lending of Cash and Securities 9. Delegation of Voting Rights 10. Valuation of Investments 11. Borrowing 12. Conflicts Between the Policy and Pooled Fund Investment Policies 13. Dismissal of a Fund Manager 14. Policy Review
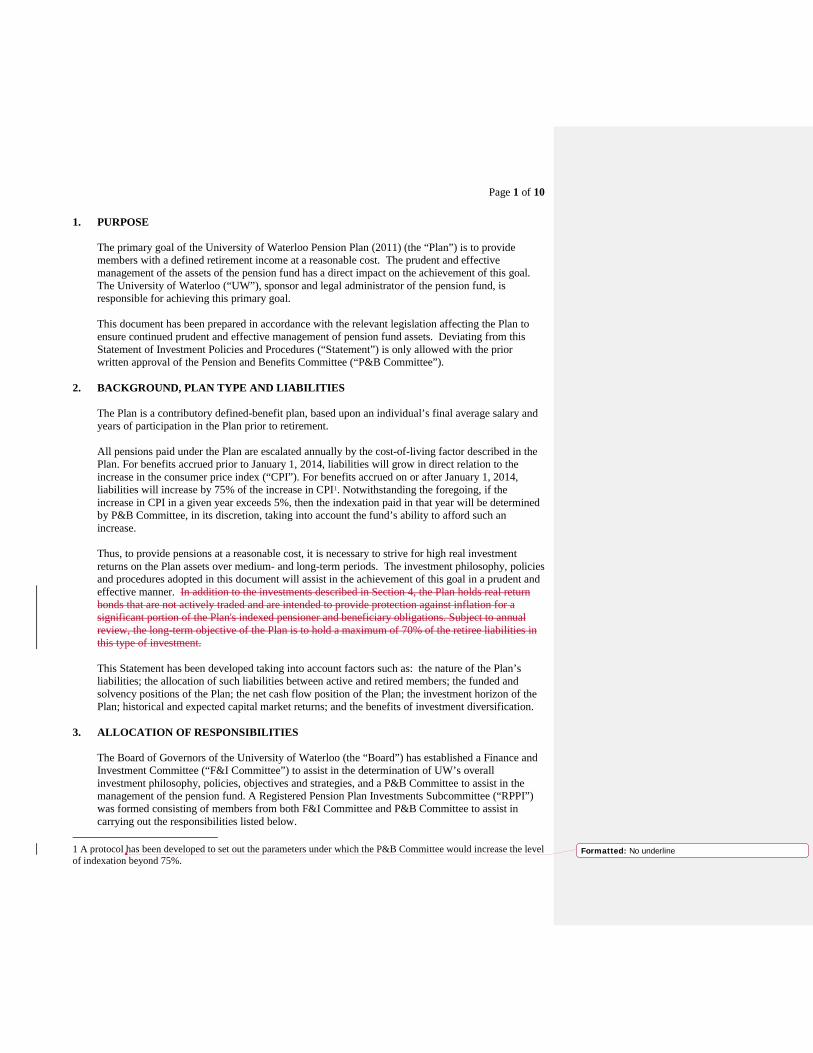
Page 1 of 10 1. PURPOSE
The primary goal of the University of Waterloo Pension Plan (2011) (the “Plan”) is to provide members with a defined retirement income at a reasonable cost. The prudent and effective management of the assets of the pension fund has a direct impact on the achievement of this goal. The University of Waterloo (“UW”), sponsor and legal administrator of the pension fund, is responsible for achieving this primary goal.
This document has been prepared in accordance with the relevant legislation affecting the Plan to ensure continued prudent and effective management of pension fund assets. Deviating from this Statement of Investment Policies and Procedures (“Statement”) is only allowed with the prior written approval of the Pension and Benefits Committee (“P&B Committee”).
2. BACKGROUND, PLAN TYPE AND LIABILITIES
The Plan is a contributory defined-benefit plan, based upon an individual’s final average salary and years of participation in the Plan prior to retirement.
All pensions paid under the Plan are escalated annually by the cost-of-living factor described in the Plan. For benefits accrued prior to January 1, 2014, liabilities will grow in direct relation to the increase in the consumer price index (“CPI”). For benefits accrued on or after January 1, 2014, liabilities will increase by 75% of the increase in CPI1. Notwithstanding the foregoing, if the increase in CPI in a given year exceeds 5%, then the indexation paid in that year will be determined by P&B Committee, in its discretion, taking into account the fund’s ability to afford such an increase.
Thus, to provide pensions at a reasonable cost, it is necessary to strive for high real investment returns on the Plan assets over medium- and long-term periods. The investment philosophy, policies and procedures adopted in this document will assist in the achievement of this goal in a prudent and effective manner. In addition to the investments described in Section 4, the Plan holds real return bonds that are not actively traded and are intended to provide protection against inflation for a significant portion of the Plan's indexed pensioner and beneficiary obligations. Subject to annual review, the long-term objective of the Plan is to hold a maximum of 70% of the retiree liabilities in this type of investment.
This Statement has been developed taking into account factors such as: the nature of the Plan’s liabilities; the allocation of such liabilities between active and retired members; the funded and solvency positions of the Plan; the net cash flow position of the Plan; the investment horizon of the Plan; historical and expected capital market returns; and the benefits of investment diversification.
3. ALLOCATION OF RESPONSIBILITIES
The Board of Governors of the University of Waterloo (the “Board”) has established a Finance and Investment Committee (“F&I Committee”) to assist in the determination of UW’s overall investment philosophy, policies, objectives and strategies, and a P&B Committee to assist in the management of the pension fund. A Registered Pension Plan Investments Subcommittee (“RPPI”) was formed consisting of members from both F&I Committee and P&B Committee to assist in carrying out the responsibilities listed below.
1 A protocol has been developed to set out the parameters under which the P&B Committee would increase the level of indexation beyond 75%.
Formatted: No underline
Page 2 of 10
RPPI will: · review this document annually; · review pension fund performance on at least a semi-annual basis; · review Fund Manager performance on at least a semi-annual basis; and · report to P&B Committee. RPPI will make recommendations to P&B Committee and F&I Committee on: · the content of this document; · the selection of Fund Managers; and · the purchase of specific investments, including real return bonds.
Working with the F&I Committee with respect to investment philosophy, policies, objectives and strategies and taking into consideration the recommendations of RPPI, the P&B Committee will make recommendations to the Board in the following areas:
· the content of this document after its annual review; · the selection of a Consulting Actuary; · the selection of Fund Managers; · the selection of a Custodian/Trustee to hold the pension fund assets; and · the purchase of specific investmentsthe purchase of real return bonds. In addition, the P&B Committee will:
· review this document annually, taking into consideration any recommended changes from
RPPI and F&I Committee; · consider reports from RPPI on pension fund performance on at least a semi-annual basis; · consider reports from RPPI on Fund Manager performance on at least a semi-annual basis; · provide cash flow information to the Fund Managers, if necessary; · be responsible for the delegation of any responsibilities not specifically mentioned; and, · report to Plan members on at least an annual basis.
The Fund Managers will:
· participate, at least annually, in performance reviews by the RPPI; · forward to RPPI quarterly reviews of investment performance, expectations of future returns
on various asset classes and proposed investment strategies for the following 12 to 24 months; · upon direction of the P&B Committee, invest in passive asset classes such as indexed bond
funds, indexed equity funds, real-return bonds, etc.; · manage asset mix and select securities within each asset class, subject to applicable legislation
and the philosophy and other constraints set out in this document; · advise the P&B Committee immediately of any changes in its senior investment personnel
and/or significant changes in the size or mix of assets managed; · comply with all relevant laws concerning the investment of the pension fund; and · complete and deliver a compliance report (see page 10) to the P&B Committee and the Fund’s
Consulting Actuary each quarter. The compliance report will indicate whether or not the Fund Manager was in compliance with this Statement during the quarter. In the event that the Fund Manager is not in compliance with this Statement, the Fund Manager is required to advise the P&B Committee immediately, detail the nature of the non-compliance and recommend the appropriate course of action to remedy the situation.

Page 3 of 10
· The Fund Managers are expected to comply, at all times and in all respects, with the Code of Ethics and Standards of Professional Conduct as promulgated by the CFA Institute. The Fund Managers will manage the assets with the care, diligence and skill that an investment manager of ordinary prudence would use in dealing with pension plan assets. The Fund Managers will also use all relevant knowledge and skill that they possess or ought to possess as a prudent investment manager.
The Consulting Actuary (or his/her delegate approved by P&B Committee and RPPI) will:
· assist in the preparation and subsequent annual reviews of this document; · participate in all reviews of the Fund Managers and the Plan; · report, at least semi-annually, on the performance of the Fund Managers and the Plan; · comment on any changes in the Plan’s benefits, membership or contribution flow which may
affect how the Plan’s assets are invested; · comment on the impact of potential investment opportunities/strategies/legislative changes
which may affect how the Plan’s assets are invested; · assist in the implementation of this Statement; · monitor the performance of the Plan and the Fund Managers on a regular basis, and contact the
chair of the P&B Committee immediately if there are adverse changes of any kind, which warrant further review and/or investigation;
· support RPPI and the P&B Committee on matters related to investment management and administration of the Plan; and
· meet with RPPI and the P&B Committee as required.
The Custodian/Trustee will:
· fulfill the regular duties required by law of a Custodian/Trustee and perform the specific duties required of the Custodian/Trustee pursuant to agreements entered into from time to time with UW; and
· provide the P&B Committee with monthly portfolio printouts of all assets of the Plan and transactions during the period.
4. RETURN EXPECTATION, BENCHMARK PORTFOLIO, FUND MANAGER
INVESTMENT OBJECTIVES
Return Expectation. The annualized rate of return of the Plan must exceed the annualized rate of increase in the Consumer Price Index by at least 400 basis points (bps) net of the associated investment management fees over any ten-year period. Investment Philosophy. All equity investments are to be made using the long-term value approach by investing in companies at prices below their underlying long-term values to protect capital from loss and earn income over time. The fund managers will attempt to identify financially-sound companies with good potential profitability which are selling at a discount to their intrinsic value. Appropriate measures of low prices may consist of: low price-earnings, high dividend yields, significant discounts to book value and low price to free cash flow. Downside protection is obtained by seeking a margin of safety in terms of sound financial position and a low price in relation to intrinsic value. Appropriate measures of financial integrity include debt/equity ratios, financial leverage, asset turnover, profit margin, return on equity, and interest coverage. It is anticipated that purchases will be made when economic and issue-specific conditions are less than ideal and sentiment is uncertain or negative. Conversely, it is expected that gains will be realized when issue-
Formatted: Indent: Left: 0.65", No bullets or numbering
Formatted: Indent: Left: 0.34", Keep with next

Page 4 of 10
specific factors are positive and sentiment is buoyant. Assets of the Fund are administered and managed on a combined basis through specialist portfolios. Fund managers will be expected to generate a rate of return in the first quartile or better over a market cycle. Volatility Expectation. The volatility of the Plan is directly related to its asset mix, and specifically, the balance between Canadian bonds, Canadian equities and foreign equities. Since the Fund Managers do not have authority to make any type of leveraged investment on behalf of the Plan, the volatility of the Plan should be similar to the volatility of the Benchmark Portfolio set out below. Benchmark Portfolio. The following benchmark portfolio is used by the Consulting Actuary to calculate the return assumptions for the Plan. A portion of the Plan is invested in a buy-and-hold real return bond portfolio. The following table applies to the remaining portion of the Plan.
Asset Benchmark Class Portfolio Cash 2% Fixed Income 33% Canadian Equities 15% Global Equities 40% Infrastructure 5% Real Estate 5% 100%
A diversified management structure has been adopted for the Plan consisting of several managers. This structure has been adopted as it is believed that the different investment mandates will result in increased diversification, while reducing the “manager risk” effect for the total Plan.
The investment management structure employs a mix of active and passive management styles. Active management has been adopted for portions of the assets as it provides the opportunity to outperform common market indices over the long-term, while controlling active risk levels. Passive management has been adopted for portions of the assets as it minimizes the risk of underperformance relative to a benchmark index and is generally less expensive than active management.
Fund Manager Investment Objectives. Subject to the constraints cited in section 5, Fund Managers will employ security selection and asset allocation strategies to try to add to the returns that would be earned by the alternative of passively managing their respective investment portfolio as described below. The objective of passive management is to match the return that could be earned by investing in securities that compose an index which is representative of a specific market.
Active Fund Manager performance will be considered satisfactory if the annualized return (before investment management fees) over consecutive four-year periods exceeds the return that could have been earned by passively managing the combined Benchmark Portfolio by 100 bps for Canadian Eequity Mmanagers, 200 bps for Gglobal Eequity Mmanagers and 50 bps for Canadian Ffixed Iincome Mmanagers. For Ppassive Canadian Ffixed Iincome Mmanagers (excluding U.S. treasuries), performance will be considered satisfactory if the tracking error is not more than +/- 10 bps over one-year periods and +/- 6 bps over consecutive four-year periods. For Fund Managers with mandates that do not fit into the categories set forth herein, performance objectives will be set when the Fund Manager is hired, and communicated to the Consulting Actuary (or delegate) for monitoring and reporting purposes. Similarly, for the hedged U.S. Equity Passive Managers,
Formatted: Font: Not Italic
Formatted: Font: Not Italic
Formatted: Font: Not Italic
Formatted: Font: Not Italic
Formatted: Font: Not Italic
Formatted: Font: Not Italic
Formatted: Font: Not Italic
Formatted: Font: Not Italic
Formatted: Font: Not Italic
Formatted: Font: Not Italic
Formatted: Font: Not Italic
Formatted: Font: Not Italic
Formatted: Font: Not Italic
Formatted: Font: Not Italic, No underline
Formatted: Font: Not Italic
Formatted: Font: Not Italic

Page 5 of 10
performance will be considered satisfactory if the tracking error is no more than +/- 20 bps over one-year periods and +/- 10 bps over consecutive four-year periods.
5. AGGREGATE INVESTMENT LIMITS and PERMITTED CATEGORIES, ASSET MIX
POLICY
Aggregate Investment Limits and Permitted Categories. At all times, the market value of the individual asset classes will be within the following minimum and maximum aggregate investment limits:
Asset Classes (excluding real return bonds)
Asset Class * + Minimum ** Maximum ** Fixed Income Cash or Equivalent
30% 0%
70% 15%
Equities
30% 70% Alternatives
0% 20% Total
* These assets can be held in any combination of pooled funds or individual investments. + The asset classes (other than the cash maximum) exclude real return bonds. The long‐term objective of the plan is to hold 70% of retiree liabilities in this type of investment. ** Minima and maxima do not sum to the total, as this would introduce artificial constraints.
Liquidity. All investments should be reasonably liquid (i.e. under normal circumstances, they should be capable of liquidation within one month).
Passively Managed and Specialty Investments. Assets that are passively managed or managed by specialty managers (e.g. global equities) are normally expected to be 100% invested with minimal, generally less than 2%, cash. The Ppassive Fund Manager may equitize cash within its pooled funds.
Cash or Equivalents. Cash on hand, demand deposits, treasury bills, short-term notes and bankers’ acceptances, term deposits and guaranteed investment certificates.
Equities. Common shares, rights, warrants, global depository receipts, exchange-traded index participation units, units of income trusts domiciled in jurisdictions that provide limited liability protection to unitholders and securities convertible into common shares. American Deposit Receipts (ADRs) are considered to be Non-Canadian/Non-US investments. No single equity shall represent more than 10% of the total market value of any one of the Fund Manager’s equity portfolios. Fixed Income. Bonds (including real-return bonds), debentures, mortgage loans, mortgage-backed securities, preferred shares and asset-backed securities (ABS’s). Passive Iinvestments in Canadian bonds and debentures will have a minimum rating of BBB or an equivalent rating, as rated by at least two of the three Recognized Bond Rating Agencies at the time of purchase. The following rating agencies shall be considered to be “Recognized Bond Rating Agencies”: (i) Dominion Bond
Formatted: Keep with next
Formatted: Font: Bold
Formatted: Keep with next
Formatted: Widow/Orphan control, Keep with next
Formatted: Indent: Left: 0.31", Space After: 12 pt

Page 6 of 10
Rating Service (Canadian issuers only); (ii) Standard and Poor’s and (iii) Moody’s Investor Services. Not more than 10 % of the market value of the Canadian fixed income securities shall be invested in BBB bonds or debentures. In addition, up to 10% of the actively managed fixed income portfolio (excluding the buy and hold U.S. treasuries) may be invested in debt denominated in U.S. currency, including debt issued by the U.S. Government, its agencies and instrumentalities. No other foreign currency debt will be purchased.
Downgrades in Rating Quality. In the event that a security is downgraded below the stated minimum in the Statement, the following steps will be taken: (i) The Fund Manager will notify UW of the downgrade by telephone at the earliest possible opportunity; (ii) Within ten business days of the downgrade, the Fund Manager will advise UW in writing of the course of action taken or to be taken by the Fund Manager, and its rationale; and (iii) Immediately upon downgrade, the Fund Manager will place the asset on a Watch List subject to monthly review by the Fund Manager with UW until such time as the security matures, is sold or until it is upgraded to a level consistent with the purchase quality standards as expressed in the guidelines mentioned above. Split Ratings. In cases in which the Recognized Bond Agencies do not agree on the credit rating, the bond will be classified according to the methodology used by DEX, which states: (i) if two agencies rate a security, use the lower of the two ratings; (ii) if three agencies rate a security, use the most common; (iii) if all three disagree, use the middle rating. Alternatives. Investments outside the traditional asset classes of stocks, bonds and cash. Examples of alternative investments are real estate, infrastructure, private equity, and hedge funds.
Derivatives, Options and Futures. Derivatives, options and futures on any securities allowable under the Statement, including index options and futures. These instruments will be used to protect against losses from changes in exchange rates, interest rates and market indices. Aggregate limits encompass the securities underlying the futures and options. Upon prior written confirmation from the P&B Committee that such investments may be made, derivatives may be used as a substitute for more traditional investments if they are based on and are consistent with achieving the Plan’s long-term asset mix goal and rate of return objectives. Such products include debt, equity, commodity and currency futures, options, swaps and forward contracts, pooled or segregated funds that employ derivatives and synthetic products for purposes consistent with the investment objectives of the fund. Synthetic products used as substitutes for more traditional investments will not be used to gain leveraged exposure to various asset classes and will be collateralized by cash equal to the risk-adjusted market value of the synthetic exposure. Hedging the currency on a fund position in a non-Canadian dollar investment is allowed into Canadian dollars only. Sufficient assets must be held to cover commitments due to the derivatives transactions. No derivatives can be used for speculative trading or to create a portfolio with leverage. Purchase or sale of any of these instruments for speculative purposes is prohibited. Pooled Funds. Open-ended pooled funds investing in the asset categories noted above. The aggregate limits for these categories are inclusive of the underlying assets in the pooled funds.
Global investments may only be made by the Gglobal Eequity Mmanagers. Canadian Mmanagers may only invest in Canadian investments, excluding any references to the contrary specifically outlined above. Passive Mmanagers may only invest in securities that are contained in the appropriate benchmark index(es) for their mandate(s), subject to residual cash holdings and approved purchases of U.S. treasuries.
Formatted: No underline
Formatted: Font: Not Italic
Formatted: Font: Not Italic
Formatted: Font: Not Italic
Formatted: Font: Not Italic
Formatted: Font: Not Italic
Formatted: Font: Not Italic
Page 7 of 10
Asset Mix Policy. The selection of investments is to be made with consideration given to the overall context of the investment portfolio without undue risk of loss or impairment and with a reasonable expectation of fair return or appreciation given the nature of the investments. All investments shall be made in accordance with all applicable legislation and the investment principles outlined above. Consideration of Environmental, Social and Governance (“ESG”) Factors. Consistent with its obligation to act in the best interest of the Plan, the Board chooses investments and Fund Managers that it believes will deliver superior financial performance over the longer term. In this regard, the Board does not consider ESG factors in choosing Fund Managers with whom it invests the assets of the Plan. The Board recognizes, however, that some Fund Managers may consider ESG factors as a way of determining which investments will have the best economic outcome, but this is not a factor considered by the Board when choosing Fund Managers nor are the Fund Managers instructed to consider the policies and practices of the various investments relating to ESG factors. In order to protect and enhance the value of the Plan’s investments, when choosing Fund Managers, the Board considers criteria that include the Fund Manager’s business, staff, historical performance, and investment process. For the purposes of this section, ESG factors refer to the environmental, social and governance factors relevant to an investment that may have a financial impact on that investment.
6. REBALANCING
The Plan will adjust the asset mix consistent with the investment philosophy described in this document.
7. CONFLICT OF INTEREST POLICY AND DISCLOSURE REQUIREMENTS
These guidelines apply to members of RPPI, P&B Committee, F&I Committee, Fund Managers, Consulting Actuary, Custodian/Trustee, the Administrator and any employee or agent retained to provide services to the Plan.
Conflict of Interest Policy. Consistent with UW Policy 69, “Conflict of Interest”, any person listed above must disclose any direct or indirect association or material interest or involvement in aspects related to her/his role with regard to the Pension Plan investments that would result in any potential or actual conflict of interest. Without limiting the generality of the foregoing, this would include material ownership of or control over an asset held by the Fund, participation in the management or membership on the boards of corporations with which the Fund is invested or which have significant investments in assets held by the Fund, or interest in actual or proposed contracts involving the Fund. However, being a member of the Plan itself is not sufficient to constitute a potential conflict of interest. Persons who are unsure as to whether or not a conflict of interest exists can seek clarification from the Secretariat on whether it is necessary to follow the procedures below Disclosure Requirements. Persons listed above shall disclose the nature and extent of any conflict to the Committee in writing upon becoming aware of the conflict; if knowledge of the conflict arises in the course of a discussion at a meeting, such disclosure will be made verbally and recorded in the minutes of the meeting.
Formatted: Font: Bold
Formatted: Indent: Left: 0.31", Widow/Orphan control,Keep with next
Formatted: Font: Bold
Formatted: Font: 11 pt
Formatted: Font: 11 pt, Font color: Auto, English (UnitedStates)
Formatted: Font: Bold
Page 8 of 10
If the person disclosing the conflict has voting power, he/she will refrain from participating in discussion and voting on the matter in respect of which the individual has a potential or actual conflict of interest. If the person is the chair, the chair will step down for the duration of the discussion and the members will choose one of their number to fill the chair during that period. If the person disclosing the conflict does not have voting power, he/she may elect to continue in her/his activities with respect to the issue in conflict only with the unanimous approval of the members with voting rights. The notification of a conflict shall be considered a continuing disclosure on that issue, until such time as he/she advises that the conflict no longer exists.
Related Party Transactions. For the purpose of this section, a “related party” and a “transaction” in respect of the Plan have the meanings given to such terms in Schedule III of the Pension Benefits Standards Regulations, 1985 (Canada). The following related party transactions are permitted for the Plan:
· any transaction that is required for the operation or administration of the Plan, the terms and
conditions of which are not less favourable to the Plan than market terms and conditions;
· any transaction the value of which is nominal (that is, less than 3% of the market value of the Plan) or which is immaterial to the Plan (that is, the terms and conditions of the transaction are not less favourable to the Plan than market terms and conditions); two or more transactions with the same related party shall be considered a single transaction; and
·- any purchase of securities of a related party, provided that those securities are acquired at a
public exchange recognized under the Pension Benefits Standards Act and Regulations, 1985 (Canada).
8. LENDING OF CASH AND SECURITIES
The pension fund may not lend cash other than through investments described in this policy. Upon approval of the P&B Committee, the pension fund may enter into securities loan agreements. Such loans must be secured by cash and/or readily marketable government bonds, treasury bills and/or letters of credit, discount notes and banker’s acceptances of Canadian chartered banks. The amount of collateral taken for securities lending should reflect best practices in local markets. The market value relationship between collateral and securities on loan must be calculated at least daily. For equity loans, high quality, liquid assets, may also be accepted as collateral. The terms and conditions of any securities lending program will be set out in a contract with the Custodian. The Custodian shall, at all times, ensure that the UW has a current list of those institutions that are approved to borrow the Plan’s investments. Where the Plan is invested in a pooled fund, security lending will be governed by the terms and conditions set out in the pooled fund contract.
9. DELEGATION OF VOTING RIGHTS
The Fund Managers are delegated the responsibility of exercising all voting rights acquired through the Plan’s investments. The Fund Managers will exercise acquired voting rights with the intent of fulfilling the investment objectives and policies of the Plan. At least on an annual basis, the Fund Managers shall report their voting rights to the P&B Committee. However, in those situations in which the exercise of voting rights could have significant financial impact upon the Plan’s assets, the Fund Managers will secure guidance from the P&B Committee as to how the rights should be voted.
Formatted: Indent: Left: 0.31", Bulleted + Level: 1 +Aligned at: 0.38" + Indent at: 0.71", Tab stops: 0.65", Left+ 1.31", Left + 1.81", Left + 2.31", Left + 2.81", Left + 3.31", Left + 3.81", Left + 4.31", Left + 4.81", Left + 5.31", Left + 5.81", Left + 6.31", Left + Not at -0.86" + -0.5" + 0" + 0.75" + 1.5" + 2" + 2.5" + 3" + 3.5" + 4"+ 4.5" + 5" + 5.5" + 6" + 6.5"
Formatted: Font: Not Italic
Page 9 of 10
Further, the Fund Managers should advise the P&B Committee regarding their voting on any unusual items or items they voted against management (together with reasons) at least on an annual basis.
10. VALUATION OF INVESTMENTS
It is expected that all the securities held by the Plan will have an active market and therefore valuation of the securities held by the Plan will be based on their market values.
The Fund Managers will notify the P&B Committee if the market for any investment held by the Plan becomes inactive and provide for the Committee’s consideration a method for valuing the affected investment.
Formatted: Indent: Left: 0", Hanging: 0.31", Keep withnext
Formatted: Font: Bold
Formatted: Indent: Left: 0"
Formatted: Indent: Hanging: 0.31"

Page 10 of 10 11. BORROWING
The Plan shall not borrow money. 12. CONFLICTS BETWEEN THE POLICY AND POOLED FUNDS INVESTMENT POLICIES
To the extent that the Plan’s assets are invested in a pooled fund, the provisions of the pooled fund’s own investment policy will supersede the above guidelines. The Fund Manager is required to advise UW in a quarterly compliance report in the event of any material discrepancies between the above guidelines and the pooled fund’s own investment guidelines. In the event that the Fund Manager is not in compliance with the Fund Manager’s own investment policy, the Fund Manager is required to advise UW immediately, detail the nature of the non-compliance and recommend an appropriate course of action to remedy the situation.
13. DISMISSAL OF A FUND MANAGER
Reasons for considering the termination of the services of a Fund Manager include, but are not limited to, the following factors:
· performance results which are below the stated performance benchmarks; · changes to the overall structure of the Plan’s assets such that the Fund Manager’s services are
no longer required; · changes in personnel, firm structure, ownership or investment philosophy; and/or, · failure to adhere to this Statement.
In the event that a new Fund Manager must be selected or additional Fund Manager(s) are added to the existing structure, UW will undertake an investment manager search. The criteria used for selecting a Fund Manager will be consistent with the investment and risk philosophy set out in Section 4.
14. POLICY REVIEW
The Statement may be reviewed and amended at any time, but it must be formally reviewed by UW at least annually.
January 20154
Formatted: Tab stops: -0.86", Left + -0.5", Left + 0.75",Left + 1.5", Left + 2", Left + 2.5", Left + 3", Left + 3.5",Left + 4", Left + 4.5", Left + 5", Left + 5.5", Left + 6",Left + 6.5", Left + Not at -0.31" + 0.69" + 1.19" + 1.69"+ 2.19" + 2.69" + 3.19" + 3.69" + 4.19" + 4.69" + 5.19" + 5.69" + 6.19"
Formatted: Keep with next

Page 11 of 10
To be completed by Fund Managers immediately prior to each quarterly review.
UNIVERSITY OF WATERLOO REGISTERED PENSION PLAN INVESTMENTS SUBCOMMITTEE
_______________, 201_ This is to certify that I/we have adhered to the guidelines contained in the January 20154 version of the “Statement of Investment Policies and Procedures” for the University of Waterloo Pension Plan (2011), approved by the Board of Governors of the University of Waterloo.
Signed _________________________ On behalf of _____________________ Date ___________________________

Subject: RE: Re: Carbon Bubble and Stranded AssetsFrom: Olaf Weber <[email protected]>Date: 15-09-30 11:55 AMTo: Peter Forsyth <[email protected]>
Hi Peter,
Thanks a lot for the response. I know this third party managers have to be dealt with. However, there are some that take these issues into account very well. Mercers in Toronto is quite a leader in this field.
Yesterday, the Bank of England Governor, Mark Carney gave quite an explicit speech about carbon related investment risks (see: http://www.bankofengland.co.uk/pra/Documents/supervision/activities/pradefra0915.pdf)
Hence, a way to deal with the problem is to ask the third party managers how they address the ESG issues, and if they do not, ask the to do so. It should also be in their interest to do what the clients want them to do. As far as I know there are products on the market, even low carbon funds.
Thanks a lot again for your response. I would be happy to discuss the issue more in detail if possible. Maybe we can meet for a coffee.
All the best
Olaf
-----Original Message-----From: Peter Forsyth [mailto:[email protected]] Sent: Wednesday, September 30, 2015 11:37 AM
RE: Re: Carbon Bubble and Stranded Assets
1 of 7 15-09-30 05:00 PM
To: Olaf WeberCc: Sally Gunz; Christine WagnerSubject: Fwd: Re: Carbon Bubble and Stranded Assets
Hi Olaf,
I am a member of the P&B committee and the investment subcommittee of the Pension and Benefits committee.
Your question is timely. We have recently been considering "Ethical, Social and Governance" policies, as per our investments (ESG).
Since we rely on 3rd party managers, in the form of pooled funds, we don't have control over individual stock purchases. So, at this point in time, if we wanted to follow some type of ESG policy, we don't really have any way of enforcing this.
You can argue that part of an ESG strategy would be to look at stranded assets, carbon, etc. The idea being that a socially responsible investment would also be a good long term investment, e.g. in the long term, if there is a large carbon tax, then many oil sands investments would suffer, and this would be a poor investment.
We will be discussing this at future P&B meetings, to try to determine
* How we should develop a policy (in the long term, since we can't really do much in the short term)
* How would we implement such a policy
So, the short answer is that we don't have a policy right now, since we can't implement it.
But we are thinking about it.
RE: Re: Carbon Bubble and Stranded Assets
2 of 7 15-09-30 05:00 PM
Peter Forsyth
-------- Forwarded Message --------Subject: Re: Carbon Bubble and Stranded AssetsDate: Wed, 30 Sep 2015 11:07:14 -0400From: Sally Gunz <[email protected]>To: Lori Curtis <[email protected]>, Peter Forsyth <[email protected]>
Peter:
I think you are the Peter Lori means! If you look down the email chain you will see what the question is. Thanks.
Sally
On 9/30/2015 11:02 AM, Lori Curtis wrote:
Hi Sally,
This would be a question for Peter as he is the rep at the investment sub-committee - I don't have his email address on my ipad - so cannot cc -
Lori J. Curtis, PhD
Director, SouthWestern Ontario Research Data Centre Professor, Department of Economics University of Waterloo
RE: Re: Carbon Bubble and Stranded Assets
3 of 7 15-09-30 05:00 PM
200 University Ave.Waterloo, ONN2L 3G1
phone 519-888-4567 ext. 33162fax [email protected]________________________________________From: Sally Gunz [[email protected]]Sent: September 30, 2015 10:30To: Lori CurtisSubject: Fwd: Carbon Bubble and Stranded Assets
Lori:
Not sure if Olaf contacted you or someone else following this. He says he knows someone on p and b. He also asked if FAUW has a position on this? I don't know. Do you? Or more correctly, what is it and does it involve FAUW?
S
-------- Forwarded Message --------Subject: Carbon Bubble and Stranded AssetsDate: Tue, 29 Sep 2015 15:15:39 -0400From: Olaf Weber <[email protected]><mailto:[email protected]>To: Sally Gunz <[email protected]><mailto:[email protected]>
Hi Sally,
It was great to see you at the Senate meeting.
RE: Re: Carbon Bubble and Stranded Assets
4 of 7 15-09-30 05:00 PM
Maybe you can help me with a question: I am conducting research on stranded assets, carbon bubble and its impact on investments. In this regard, I am interested in what institutional investors od. As you maybe know some pension funds and Universities already started thinking about these issues.
Do you know to whom I could talk? Does FAUW has a member on our pension fund committee?
I am happy to discuss and look forward to your response.
All the best
Olaf
Dr. Olaf WeberAssociate ProfessorDirector Master's Program in Sustainability Management (MES)<https://uwaterloo.ca/school-environment-enterprise-development/sustainability-management>Editor: Journal of Sustainable Finance and Investment<http://www.tandfonline.com/toc/TSFI20/current#.VLQrs8n53KM>Cigi Senior Fellow<https://www.cigionline.org/person/olaf-weber>Faculty of EnvironmentUniversity of Waterloo200 University Avenue WestWaterloo, ONN2L 3G1Office: EV3 4233Phone: 519-888-4567 ext. 38065skype: olaf.webertwitter: @olaf_weberhttp://environment.uwaterloo.ca/business/faculty/weber/olafweberpage.h
RE: Re: Carbon Bubble and Stranded Assets
5 of 7 15-09-30 05:00 PM
tml
Editor of the Journal of Sustainable Finance and Investment<http://www.tandfonline.com/toc/TSFI20/current#.VNI9mC49m1Y>
Have a look on our Graduate Program in Sustainability Management: https://uwaterloo.ca/environment/sustainability-managementMember of the Editorial Board of the International Journal of Corporate Strategy and Social Responsibility<http://www.inderscience.com/jhome.php?jcode=ijcssr#edboard> and The Journal of Contemporary Business and Professional Ethics (CBPE)<http://taadler.com/j7>
Just published:Weber, O. and A. Ahmad (2014). "Empowerment Through Microfinance: The Relation Between Loan Cycle and Level of Empowerment."<http://dx.doi.org/10.1016/j.worlddev.2014.05.012>World Development 62(0): 75-87.Weber, O. (2014). The financial sector's impact on sustainable development<http://www.tandfonline.com/doi/full/10.1080/20430795.2014.887345#.U0QCaqLZf9s>. Journal of Sustainable Finance & Investment, 4(1), 1-8. doi: 10.1080/20430795.2014.887345 Wiek, A., & Weber, O. (2014). Sustainability challenges and the ambivalent role of the financial sector<http://www.tandfonline.com/doi/full/10.1080/20430795.2014.887349#.U0QCnqLZf9s>. Journal of Sustainable Finance & Investment, 4(1), 9-20. doi: 10.1080/20430795.2014.887349 Social Banks and the Future of Sustainable Finance by Olaf Weber & Sven Remer. See http://www.routledge.com/978-0-415-58329-9
RE: Re: Carbon Bubble and Stranded Assets
6 of 7 15-09-30 05:00 PM

RE: Re: Carbon Bubble and Stranded Assets
7 of 7 15-09-30 05:00 PM

Historical Data: Real Returns
Peter ForsythOctober 1, 2015
1 Background
We frequently discuss expected future returns of our investment portfolio. This number is a crucialinput to determining solvency, wind-up and going concern funding shortfalls.
2 Methodology
2.1 Data
The following data was used for this analysis
• CPI data from the US Department of Labour
• The total quarterly return (including dividends and any other distributions) of an index ofall stocks traded on major US exchanges, January 1 1926 - December 31 2014. This is theVWD index from the Center for Research in Securities Pricing (CRSP).
• Returns from short term US Treasuries (3 month). This data is from the US Federal Reserve(January 1 1934 - December 31, 2014), and the NBER (January 1 1926 - December 31 1933).
A real equity return index and real US T-bill index was constructed from the above inputs.
2.2 Assumed Investment Strategy
The investment strategy is 50% short term treasuries and 50% equities, rebalanced yearly. TheUW Pension plan is approximately 50% bonds and 50% equities. Note that the UW plan investsin longer duration bonds, so the bond return will be underestimated from the above strategy. Onthe other hand, the UW plan equity returns have underperformed the relevant index for the last10 years.
We assume only an initial cash injection of W0 at the initial time. No cash injections orwithdrawals occur over the entire investment time T .
2.3 Resampling
The idea is to determine expected returns for a long term investment (i.e. 30 years), which canbe used to forecast the future return distribution. These estimates will be presented in terms ofannualized rates. However, these are in fact estimates of the gain in the investment over a longterm horizon.
The resampling technique consists of repeatedly sampling a set of paths from the historical data.A single path is constructed as follows. Suppose the investment horizon is 30 years. We divide thistotal time into 3 blocks of size 10 years. We then select 3 blocks at random (with replacement)
1

CRSP T-Bill (3-month)
Expected real arithmetic return Volatility Mean real rate
.082 .18 .006
Table 2.1: Data based on the entire data set, from January 1, 1926 to December 31, 2014.
0 0.01 0.02 0.03 0.04 0.05 0.06 0.07 0.08 0.090
0.1
0.2
0.3
0.4
0.5
0.6
0.7
0.8
0.9
1
Probability real return <= R
Real return R
Pro
ba
bili
ty
Figure 2.1: Distribution of real returns, based on resampling historical data. Each 30 year sampleconsists of three ten year blocks. Each block starts at a random quarter within January 1, 1926- December 31, 2014. Investment strategy: 50% US-T bills, 50% US equities. It is important toremember that these returns are not guaranteed each and every year. This is only the average returnover a thirty year period.
from the historical data. Each block starts at a random quarter. We then form a single path byconcatenating these 3 blocks. Note that since we sample with replacement, the blocks may overlap.Experiments with block sizes of 5, 10, 15 years yielded similar results.
To avoid end effects, the historical data is wrapped around.1 We then repeat this procedure formany paths. The sampling is done in blocks in order to account for (possible) serial dependenceeffects in the historical time series. The ten year block size seemed reasonable. Note that thisapproach does not assume any type of model for the returns, it is entirely data driven.
Some summary statistics of the raw data are given Table 2.1.
2.4 Results
The resampling was done using 10, 000 randomly selected paths. Increasing the number of samplesdid not result in any significant change. The total returns from the resampling over the thirty yearperiods are sorted, and the results are shown in Figure 2.1.
3 Conclusions
Figure 2.1 shows the degree of risk involved in long term investments. Some specific values showingthe probabilities are given in Table 3.1.
1Since the great depression data of 1929-1931 appears near the start of our dataset, wrap-around will producemore blocks of bad returns compared to truncating the blocks.
2
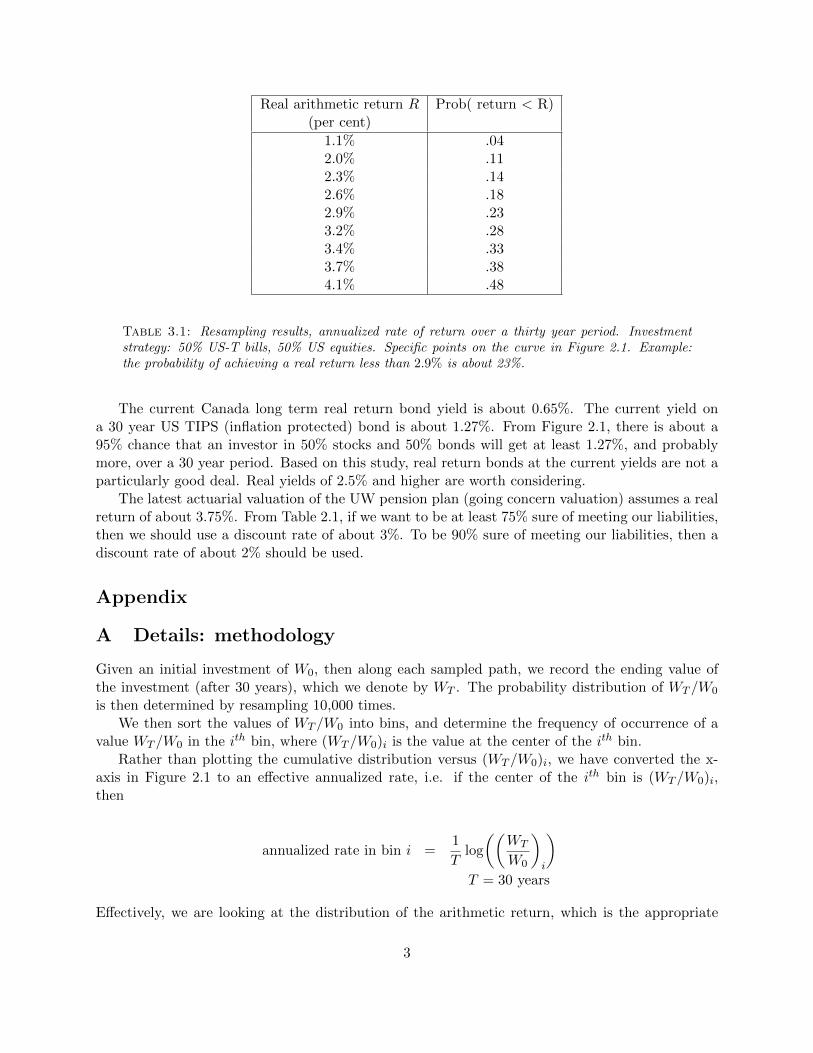
Real arithmetic return R Prob( return < R)(per cent)
1.1% .042.0% .112.3% .142.6% .182.9% .233.2% .283.4% .333.7% .384.1% .48
Table 3.1: Resampling results, annualized rate of return over a thirty year period. Investmentstrategy: 50% US-T bills, 50% US equities. Specific points on the curve in Figure 2.1. Example:the probability of achieving a real return less than 2.9% is about 23%.
The current Canada long term real return bond yield is about 0.65%. The current yield ona 30 year US TIPS (inflation protected) bond is about 1.27%. From Figure 2.1, there is about a95% chance that an investor in 50% stocks and 50% bonds will get at least 1.27%, and probablymore, over a 30 year period. Based on this study, real return bonds at the current yields are not aparticularly good deal. Real yields of 2.5% and higher are worth considering.
The latest actuarial valuation of the UW pension plan (going concern valuation) assumes a realreturn of about 3.75%. From Table 2.1, if we want to be at least 75% sure of meeting our liabilities,then we should use a discount rate of about 3%. To be 90% sure of meeting our liabilities, then adiscount rate of about 2% should be used.
Appendix
A Details: methodology
Given an initial investment of W0, then along each sampled path, we record the ending value ofthe investment (after 30 years), which we denote by WT . The probability distribution of WT /W0
is then determined by resampling 10,000 times.We then sort the values of WT /W0 into bins, and determine the frequency of occurrence of a
value WT /W0 in the ith bin, where (WT /W0)i is the value at the center of the ith bin.Rather than plotting the cumulative distribution versus (WT /W0)i, we have converted the x-
axis in Figure 2.1 to an effective annualized rate, i.e. if the center of the ith bin is (WT /W0)i,then
annualized rate in bin i =1
Tlog
((WT
W0
)i
)T = 30 years
Effectively, we are looking at the distribution of the arithmetic return, which is the appropriate
3

return to use when forecasting future investment returns.For example, from the Figure 2.1, we can see that there is about a 25% probability that the
future annualized return (over 30 years) will be less than .03. In other words, we can expect thatthe total real investment gain (WT /W0) will less than
e30×.03 =WT
W0= 2.45
about one time in four, in any 30 year period.The value of log(E[WT /W0]), where E[·] is the expectation, based on resampling, is about .045.For comparison purposes, in Figure A.1 we show the probability distribution of returns for the
50% bonds, 50% equities strategy versus a dynamic Liability Driven Investment (LDI) strategy.The LDI strategy uses the same assets: short term treasuries and the stock index, but dynamicallyalters the weights of these two assets, in response to the observed total real wealth (along a path)and the time to go.2 Figure A.1 shows the resampled backtest results.
Note that the LDI strategy uses as input
• Target real return i.e. minimize the probability of return being less than a return of Rtarg.More precisely, if W0 is the initial investment, and WT the result after T = 30 years, thenthe strategy seeks to minimize (
W0eRtargT −WT
)2
.
The strategy is determined using only the average market parameters in Table 2.1.
For the example shown, Rtarg = .047. If the real market followed a simple model3 basedon the parameters in Table 2.1, then with this choice of Rtarg, both the LDI and constantproportions strategy would generate the same expected arithmetic return (.044).
The observed resampled expected arithmetic returns from the resampled simulations are: LDI.044 and .045 for the constant proportions strategy4
The LDI strategy depends only on
• Current realized real gain (along any given path).
• Time to go
The strategy does not depend on any other properties of the observed market path (other than theaverage parameters in Table 2.1).
Note that, in the LDI case, we can be 95% sure of meeting our liabilities if we use a discountrate of about 3.4%.
2This is a true LDI strategy. Many LDI strategies in industry are based on a glide path, whereby the fraction inbonds only increases. This has a low probability of success.
3Geometric Brownian Motion. More sophisticated models have been tested to generate the LDI strategy. However,these more sophisticated models produced essentially the same results, over long horizons.
4In his controversial book, Capital in the 21st Century, Thomas Piketty argues that the long term historical realreturn on capital is about 5%. He argues that the return R can be larger than the real economic growth rate g, whichis summarized in the equation R > g, which can now be found on T-shirts. This seems counter-intuitive, but Pikettysupports this using statistical data, and reference to novels by Charles Dickens and Guy de Maupassant. Piketty’sresults are much debated.
4
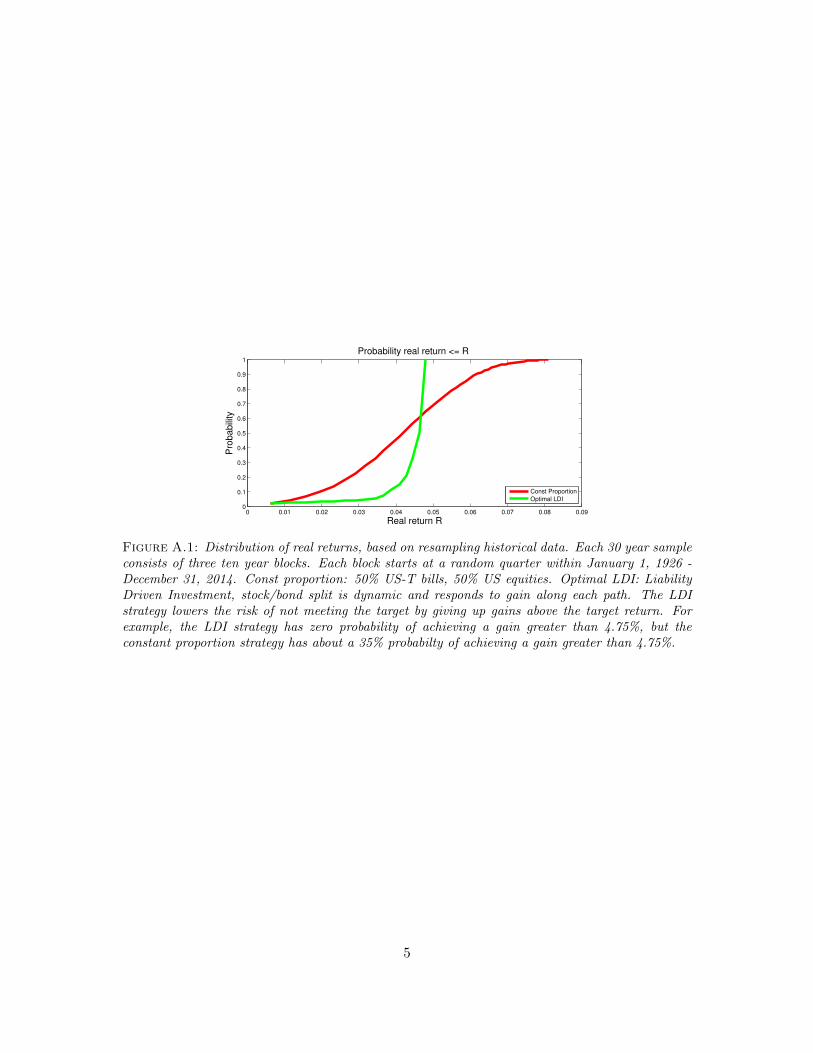
0 0.01 0.02 0.03 0.04 0.05 0.06 0.07 0.08 0.090
0.1
0.2
0.3
0.4
0.5
0.6
0.7
0.8
0.9
1
Probability real return <= R
Real return R
Pro
ba
bili
ty
Const Proportion
Optimal LDI
Figure A.1: Distribution of real returns, based on resampling historical data. Each 30 year sampleconsists of three ten year blocks. Each block starts at a random quarter within January 1, 1926 -December 31, 2014. Const proportion: 50% US-T bills, 50% US equities. Optimal LDI: LiabilityDriven Investment, stock/bond split is dynamic and responds to gain along each path. The LDIstrategy lowers the risk of not meeting the target by giving up gains above the target return. Forexample, the LDI strategy has zero probability of achieving a gain greater than 4.75%, but theconstant proportion strategy has about a 35% probabilty of achieving a gain greater than 4.75%.
5

Pre-Retirement Death Benefit
Problem Statement
Prepared by Sue McGrath, Manager Pension Services Last Updated: 06 October, 2015
Pre-Retirement Death Benefit – Problem Statement
Table of Contents
Table of Contents .......................................................................................................................................... 1
Background ................................................................................................................................................... 2
Problem Statement ....................................................................................................................................... 2
Consequences ............................................................................................................................................... 3
Resolution ..................................................................................................................................................... 3
Decision Required ......................................................................................................................................... 4
Pre-Retirement Death Benefit – Problem Statement 1 of 4 Rev. 0

Pre-Retirement Death Benefit – Problem Statement
Background
As part of implementing the new pension administration system, we are taking a look at our administration practices and plan provisions. We have identified an area that we believe should be reviewed on both a fairness and administrative simplicity bases.
For long service plan members who were hired and joined the pension plan prior to January 1, 1987, there is a difference in the benefit that would be paid if they were to terminate voluntarily prior to retirement, versus the benefit paid to their beneficiary if they die prior to retirement. The different treatment results in a lower value being paid upon death than would be paid upon termination or retirement. Specifically, the death benefit in respect of service prior to January 1, 1987 is the return of member contributions plus interest whereas the termination benefit pays the commuted value of the pension in respect of this service. The commuted value of the pension in respect of service on and after January 1, 1987, plus excess contributions if any, is payable under both the death and termination benefit.
Currently there are 132 active members with pre87 service: • 15 with less than or equal to 28 years of credited service (some service not credited due to
opting out until age 35, part time status, etc.) • 51 in excess of 28 but less than 30 years of credited service • 49 in excess of 30 but less than 35 years of credited service • 11 in excess of 35 but less than 40 years of credited service • 6 in excess of 40 years of credited service.
Problem Statement
If an active member dies in service he or she is deemed to have terminated employment as of the date of death and the member's required contributions made up to December 31, 1986 and any additional voluntary contributions, plus the commuted value of the deferred annuity in respect of service after December 31, 1986 and any excess contributions attributable to such service, all with interest to date of death, are refunded to the surviving spouse.
As an alternative to the lump sum refund, the spouse can elect to transfer the value to an RRSP, or receive an immediate or deferred pension that can be provided by the lump sum. If the benefit is paid to a non-spousal beneficiary or the member’s estate, the lump sum payment is the only option.
In comparison, on termination of employment other than retirement or death, a member is entitled to receive a deferred annuity in respect of all years of service, commencing at normal retirement date, (or earlier subject to any applicable reduction) plus any excess contributions.
Pre-Retirement Death Benefit – Problem Statement 2 of 4 Rev. 0

Pre-Retirement Death Benefit – Problem Statement
If the member is under the age of 55, the value of the deferred pension can be transferred to a locked-in retirement account, however if the member is 55 or older, the only option is an immediate or deferred pension.
Pre-Retirement Death Benefit Calculation Joined Plan: May 1, 1985 Date of Death: December 31, 2014 Age: 64.6667 Service: 29.6667 Death Benefit: $474,386.68 $16,378.02 (Pre87 CWI) + $458,008.66 (Post86 CV) Total CV: $485,309.65 difference of $10,922.97 Since the benefit payable on death is different from the benefit payable upon termination of employment, Morneau has suggested that due to the low volume of in-service deaths, the pre-retirement death process not be fully automated. They have suggested that the time and effort to configure and test the death calculation for a low volume transaction is not cost efficient.
Consequences
The current pre-retirement death benefit provision pays a higher value to a member who terminates employment compared to the total benefit paid out to the survivor of a member who has died while actively employed with the University.
If the pre-retirement death benefit administration is not be fully automated, Human Resources will be vulnerable to reputational and financial risk because manual manipulation, especially of a low volume transaction, introduces the potential for errors to occur compared to a fully automated process.
The consequence associated with changing the pre-retirement death benefit provision to the commuted value of pension in respect of all years of service, is an increase in going-concern accrued liability of less than $100,000.
Resolution
Amending the pre-retirement death benefit to pay the commuted value in respect of all years of service will establish equity between the termination and pre-retirement death benefits payable under the pension plan.
This change will also allow the pre-retirement death benefit process to be fully automated under the new pension administration system.
Hewitt has calculated the increase in liability on a going concern basis for this change to be less than $100,000.
Pre-Retirement Death Benefit – Problem Statement 3 of 4 Rev. 0

Pre-Retirement Death Benefit – Problem Statement
Decision Required
The Pension and Benefits Committee is being asked to consider an amendment to the pre-retirement death benefit provision, which will increase the benefit for members who die prior to retirement to equal the commuted value for all service. It will also increase going concern liabilities by just under $100,000.
Pre-Retirement Death Benefit – Problem Statement 4 of 4 Rev. 0

New CIA Mortality Table for the Computation of Commuted Values Which were to have been Effective October 1, 2015
As you may recall, the Canadian Institute of Actuaries has promulgated the use of a new mortality table (2014 CPM Combined Table with generational mortality improvements at Scale CPM-B), to be effective October 1, 2015, for the purposes of determining commuted values payable from pension plans.
Ontario Regulation 909 to the Pension and Benefits Act (PBA) sets out the minimum standard for calculating commuted values for the purpose of a terminating member transferring the value of their accrued pension from the plan. The Regulation refers to the Canadian Institute of Actuary’s (CIA) standard in effect on June 3, 2010.
It was anticipated that the regulation would be amended prior to October 1, 2015 to require the new CIA standard that has been published and adopted by the Canadian Institute of Actuaries (i.e. CPM combined table). This has not happened.
The Financial Service Commission of Ontario (regulator of the PBA) has indicated that the plan administrator may use the new basis and, if they do so, they are in compliance with the requirements of the Regulation as long as: (i) the commuted value is equal to, or higher than, the value that would be determined using the minimum standard; (ii) as required by subsection 19(5.1) of the Regulation, the plan administrator files a statement notifying FSCO that the new table is being used and as a result, the commuted values were calculated on a higher basis than the basis prescribed under subsection 19(1); and (iii) the plan terms permit or require the use of the new mortality basis.
Our plan defines commuted value as the lump sum amount which is the actuarial present value …”using the actuarial tables adopted by the Pension Committee on the recommendation of the Actuary, subject to the provisions of the Pension Benefits Act and the Income Tax Act.”
Aon Hewitt’s actuaries are bound by the standards to recommend the new table.
The Committee has already adopted the CPM combined table for valuation purposes.
The Plan Text supports moving to the new table.
Based on the above,
i Aon Hewitt has estimated that use of the new table will result in an increase in commuted values by approximately 4% - 7%
ii the plan text supports moving to the new table.
Attached is a draft statement to send to FSCO in accordance with subsection 19(5.1) of the Regulation should the committee adopt the new CIA mortality table for the calculation of commuted values.
Decision Required:
Based on the recommendation of the actuary, the Pension Committee adopt the new CIA mortality table for the calculation of commuted values effective October 1, 2015
October 9, 2015 Financial Services Commission of Ontario Pension Plans Branch 5160 Yonge Street, 4th Floor P.O. Box 85 Toronto, ON M2N 6L9 Re: University of Waterloo Pension Plan for Faculty and Staff Registration # 0310565 I wish to inform you that pursuant to subsection 19 (5.1) of the PBA Regulation 909 , and on the recommendation of the actuary, that effective October 1, 2015, we hereby elect to use the commuted value basis prescribed under the Pension Commuted Value Standards section 3500 in effect on June 9, 2015, published by the Canadian Institute of Actuaries, including the use of the new promulgated mortality table and projection scale for all commuted values (i.e. the 2014 Canadian Pensioners Mortality Table (CPM2014) combined with mortality improvement scale CPM Improvement Scale B (CPM-B)). This basis will be used for calculating commuted values for the purposes of subsection 42(1) of the Pension Benefits Act. Our actuary has confirmed that this new basis exceeds the basis currently prescribed under PBA Regulation 909 subsection 19(1). Should you have any questions regarding the above, please feel free to contact me. Sincerely, Sue McGrath Manager, Pension Services Human Resources