Board of Directors Meeting - Connecticut · ... 2016 Board of Directors Special Meeting Minutes ......
99
Board of Directors Meeting September 22, 2016
Transcript of Board of Directors Meeting - Connecticut · ... 2016 Board of Directors Special Meeting Minutes ......

Board of Directors Meeting
September 22, 2016
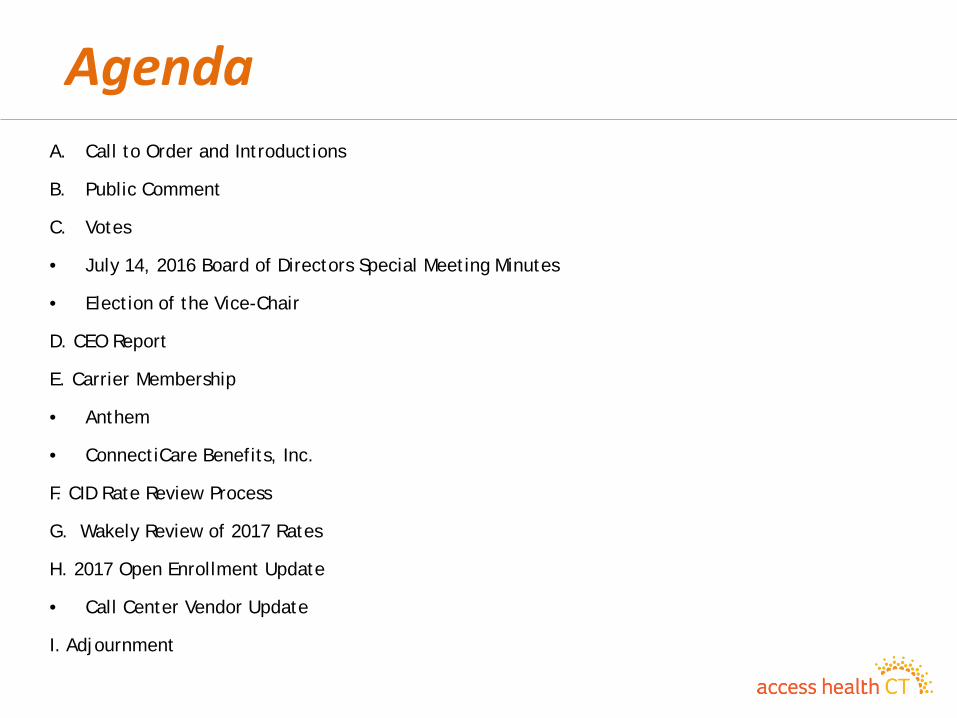
Agenda A. Call to Order and Introductions
B. Public Comment
C. Votes
• July 14, 2016 Board of Directors Special Meeting Minutes
• Election of the Vice-Chair
D. CEO Report
E. Carrier Membership
• Anthem
• ConnectiCare Benefits, Inc.
F. CID Rate Review Process
G. Wakely Review of 2017 Rates
H. 2017 Open Enrollment Update
• Call Center Vendor Update
I. Adjournment

Votes • July 14, 2016 Board of Directors Special
Meeting Minutes • Election of the Vice-Chair

CEO Report
Carrier Membership
Anthem
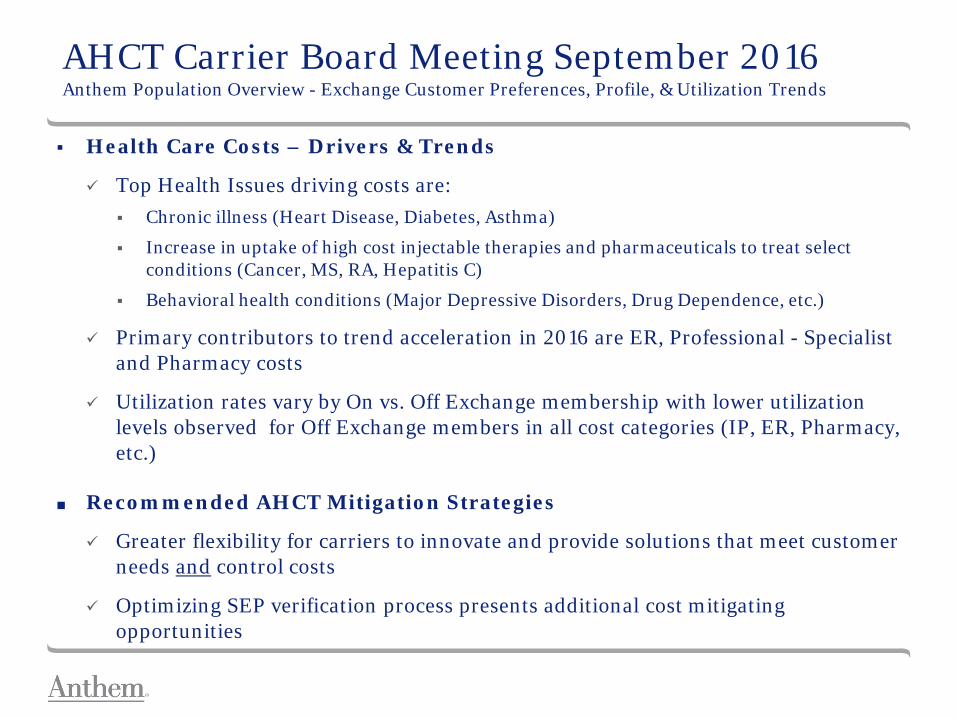
AHCT Carrier Board Meeting September 2016 Anthem Population Overview - Exchange Customer Preferences, Profile, & Utilization Trends
Health Care Costs – Drivers & Trends
Top Health Issues driving costs are: Chronic illness (Heart Disease, Diabetes, Asthma)
Increase in uptake of high cost injectable therapies and pharmaceuticals to treat select conditions (Cancer, MS, RA, Hepatitis C)
Behavioral health conditions (Major Depressive Disorders, Drug Dependence, etc.)
Primary contributors to trend acceleration in 2016 are ER, Professional - Specialist and Pharmacy costs
Utilization rates vary by On vs. Off Exchange membership with lower utilization levels observed for Off Exchange members in all cost categories (IP, ER, Pharmacy, etc.)
■ Recommended AHCT Mitigation Strategies
Greater flexibility for carriers to innovate and provide solutions that meet customer needs and control costs
Optimizing SEP verification process presents additional cost mitigating opportunities

Carrier Membership
ConnectiCare Benefits, Inc.

View of AHCT Healthcare Utilization September 22, 2016
Contents: Page 2: ConnectiCare’s Promise to AHCT Page 3: Observations on Exchange Members’ Healthcare Utilization Page 4: Helping members with Severe Conditions Page 5: Overcoming Barriers to Preventive Care Page 6-8: New ConnectiCare Solutions
Benefits, Inc.

Our Promise
Because you’re our neighbor, we do more for you Which means we are providing new, better and easier ways to access care on the phone, around the corner and beyond
Our promise We make it easy for you to get the care you need

Observations on Exchange Members’ Healthcare Utilization
Exchange Members use Less Preventive Care, Have Lapses in Coverage, and Ask More
Questions about Benefits
Members obtaining preventive care: 46.1% • 15% lower than Off-Exchange members Members accessing PCP: 64% • 8% lower than Off-Exchange members Length of Stay in Plan: 5.3 month average for 2016 Members with questions on benefits: 30% • 10% more than Off-Exchange members
Health issues driving cost: • Cardiovascular (a treatable condition) • Maternity & NICU with increasing
severity • Oncology with higher utilization and cost 8 of top 10 prescriptions are specialty drugs treating acute conditions Inpatient DRG index: 15% higher sickness burden than Off-Exchange members resulting in higher admits and length of stay Members with Emergency room visits: 8.1% • 1.8% higher than Off-Exchange
members
Result: Exchange Members more Often
Delay Care until Condition is Severe
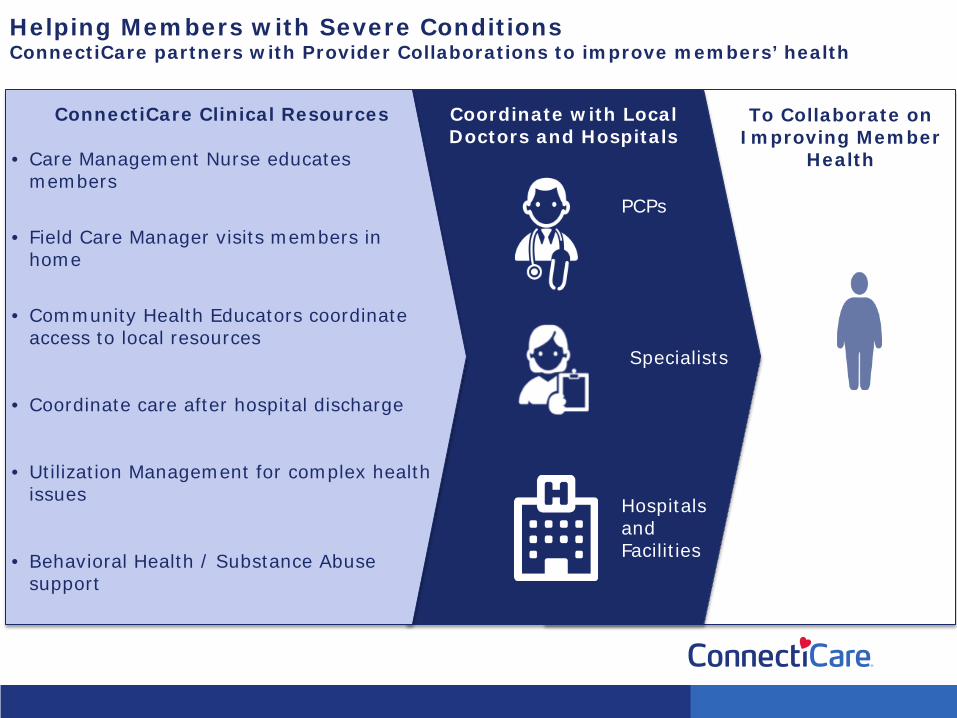
Helping Members with Severe Conditions ConnectiCare partners with Provider Collaborations to improve members’ health
ConnectiCare Clinicians
PCPs
Specialists
Hospitals and Facilities
ConnectiCare Clinical Resources • Care Management Nurse educates
members
• Field Care Manager visits members in
home
• Community Health Educators coordinate
access to local resources
• Coordinate care after hospital discharge
• Utilization Management for complex health issues
• Behavioral Health / Substance Abuse support
Coordinate with Local Doctors and Hospitals
To Collaborate on Improving Member
Health

Overcoming Barriers to Preventive Care
Benefits that are easy to understand and make physician visit costs affordable Primary Care Physicians and Nurses who explain the importance of preventive care using a member’s language and culture Advice on using health benefits to visit physicians that prevent health issues
Barriers Preventing Exchange Members from using Preventive Care
Cost: High deductibles make physician visit costs hard to predict or unaffordable No PCP Connection: don’t understand value of a PCP or preventive care Inexperience: Members new to health insurance don’t understand how to get full benefit of PCP and preventive care
Solutions which Overcome Barriers to Preventive Care

ConnectiCare Solution: Passage Provides easy to understand and affordable options
ConnectiCare’s alternative Silver plan
HMO design with $5 copay for primary care
High quality primary care network helps members navigate PCPs collaborate deeply with ConnectiCare clinicians Full access to specialty care and hospitals throughout Connecticut
Silver

Shop and enroll
Member services
Billing and
payment
Health assessments and wellness
Community and
educational events
Location: Manchester (flagship) Newington Bridgeport Orange
ConnectiCare Solution: ConnectiCare Centers Helping members make the most of their plan

Primary care: family
medicine, internal
medicine, pediatrics and gynecology
Urgent care/walk-in
including observation
units
Onsite laboratory
and diagnostics
Care programs: diabetes,
COPD, asthma, weight
management and more
Specialists: cardiology,
dermatology, orthopedics and more
Locations: Bridgeport Orange Newington
ConnectiCare Solution: CliniSanitas Patient centered multi-specialty care in a culturally relevant setting

CID Rate Review Process

CID Review Of 2017 Health Insurance Rates
PRESENTED BY: PAUL LOMBARDO
INSURANCE DEPARTMENT ACTUARY TO:
ACCESS HEALTH CT SEPTEMBER 22, 2016

2017 Health Insurance Rates
SCOPE OF REVIEW • 13 companies
• 18 rate filings on individual & small group
• Approx. 300,000 covered lives in Connecticut

2017 Health Insurance Rates
Items Contributing to 2017 Rate Increases • Annual Trend – cost of services, utilization of services, severity of
services and Rx (high single digits, low double digits)
• Experience Adjustment - significantly higher utilization and
severity of services than anticipated and previously priced
for(ranges from single digits to low double digits)
• Federal Reinsurance program sun setting 12/31/2016 (5% to 6%)
• Risk Adjustment volatility (significant payments and receipts)

2017 Health Insurance Rates
ON EXCHANGE - INDIVIDUAL
COMPANY Original Average Request
Original Range
Revised Request
Revised Range
Approved Ave.
Request
Approved Range
Covered Lives
*Anthem Health Plans
26.80% 16.5% to 39.8%
n/a n/a 22.4% 10.8% to 35.2%
56,700
CTCare Benefits Inc.
14.3% 13.0% to 19.2%
27.1% 26.5% to 33.7%
17.4% 15.4% to 24.8%
47,597
HealthyCT, Inc.
n/a n/a n/a n/a n/a n/a 16,274

2017 Health Insurance Rates
ON EXCHANGE – SMALL GROUP
COMPANY Original Average Request
Original Range
Revised Request
Revised Range
Approved Ave.
Request
Approved
Range
Covered Lives
*Anthem Health Plans
11.6% 6.8% to 20.4%
4.9% 0.1% to 13.1%
42,200
HealthyCT, Inc.
n/a n/a n/a n/a n/a n/a 16,274
2017 Health Insurance Rates
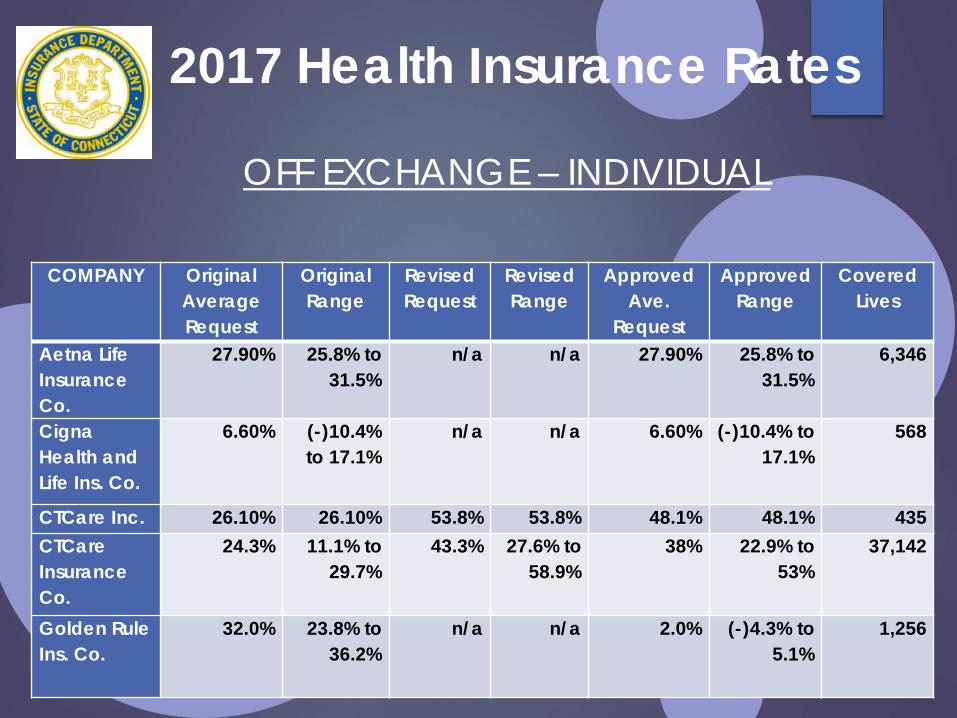
OFF EXCHANGE – INDIVIDUAL
COMPANY Original Average Request
Original Range
Revised Request
Revised Range
Approved Ave.
Request
Approved Range
Covered Lives
Aetna Life Insurance Co.
27.90% 25.8% to 31.5%
n/a n/a 27.90% 25.8% to 31.5%
6,346
Cigna Health and Life Ins. Co.
6.60% (-)10.4% to 17.1%
n/a n/a 6.60% (-)10.4% to 17.1%
568
CTCare Inc. 26.10% 26.10% 53.8% 53.8% 48.1% 48.1% 435 CTCare Insurance Co.
24.3% 11.1% to 29.7%
43.3% 27.6% to 58.9%
38% 22.9% to 53%
37,142
Golden Rule Ins. Co.
32.0% 23.8% to 36.2%
n/a n/a 2.0% (-)4.3% to 5.1%
1,256

2017 Health Insurance Rates OFF EXCHANGE – SMALL GROUP
COMPANY Original Average Request
Original Range
Revised Request
Revised Range
Approved Ave. Request
Approved Range
Covered Lives
Aetna Life Insurance Company
28.20% 9.9% to 38.4%
n/a n/a 23.4% 5.7% to 33.1%
36,067
CTCare Inc. 17.0% 17.0% 17.9% 17.9% 17.2% 17.2% 48 CTCare Insurance Co.
14.70% 8.1% to 35.9%
15.6% 12.4% to 39.9%
14.9% 11.8% to 39.0%
47,883
Harvard Pilgrim Health Care of CT
8.2% 4.8% to 11.6%
11.3% 6.9% to 15.5%
15.4% 10.8% to 19.8%
986
HPHC Insurance Company, Inc.
4.90% (-) 6.5% to 10.8%
8.1% (-)6.7% to 12.9%
12.0% (-)3.3% to 17.0%
8,251
Oxford Health Plans (CT), Inc.
2.60% (-)11.0% to 20.4%
n/a n/a 2.6% (-)11.0% to 20.4%
1,748
Oxford Health Insurance, Inc.
2.10% (-)15.9% to 17.0%
n/a n/a (-)2.5% (-)19.8% to 11.7%
15,912
UnitedHealthcare Insurance Co.
5.20% (-)6.9% to 29.3%
n/a n/a 5.20% (-)6.9% to 29.3%
207

2017 Health Insurance Rates
Average Rate Changes Approved by CID
Plan Type 2014 (2015 coverage
year)
2015 (2016 coverage
year)
2016 (2017 coverage
year)
3-Year Average
Individual (-) 1.6% 3.53% 24.8% 8.77% Small Group
5.36% (-)2.92% 12.88% 4.91%

Wakely Review of 2017 Rates

Access Health CT 2017 Rate Review and Analysis September 22, 2016 Presentation
Julia Andrews FSA, MAAA Senior Consulting Actuary
Ronald D Burkhart, ASA, MAAA Consulting Actuary

Introduction • Wakely was retained by Access Health CT to perform the
following services related to 2017 rates and rate filings ▫ Rate Filing Review: Review of initial and final health insurance
rate filings for carriers on the exchange; submit public comments to CID on initial filings
▫ Consumer Impact Analysis: Summarize rate changes before and after federal subsidies by rating area and plan type
▫ Rate Outlier Analysis: Perform a rate outlier analysis to assess the variance in rates by rating area and metal level
• Wakely relied on rate filings, templates, plan cross-walks and individual market enrollment data, provided by AHCT; results are subject to change
• See Wakely’s full report for additional details and a complete listing of disclosures, limitations and reliances
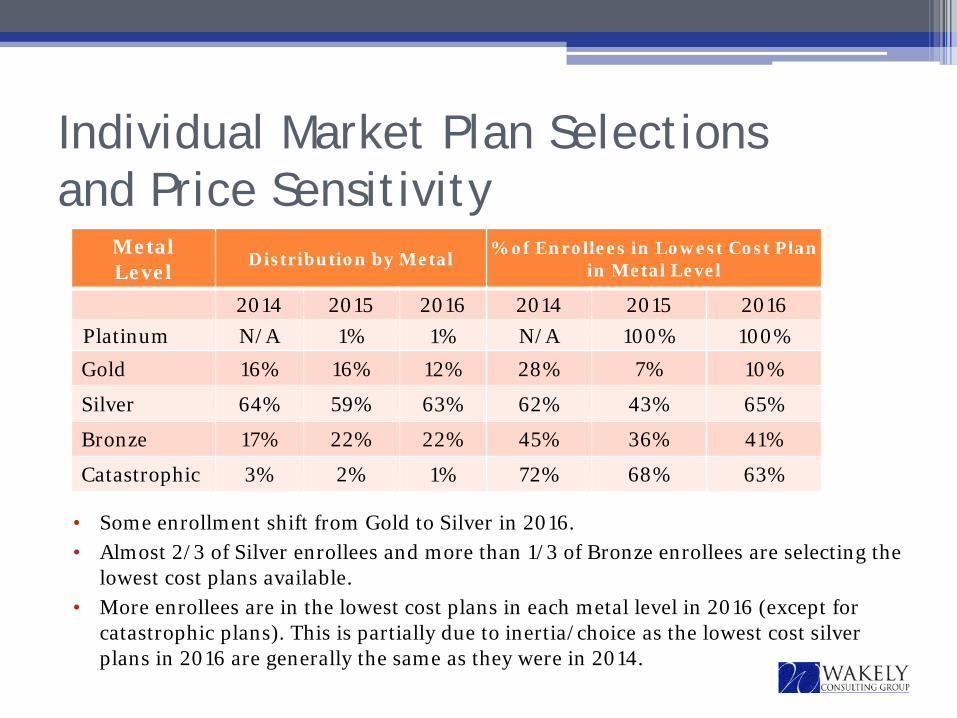
Individual Market Plan Selections and Price Sensitivity
• Some enrollment shift from Gold to Silver in 2016. • Almost 2/3 of Silver enrollees and more than 1/3 of Bronze enrollees are selecting the
lowest cost plans available. • More enrollees are in the lowest cost plans in each metal level in 2016 (except for
catastrophic plans). This is partially due to inertia/choice as the lowest cost silver plans in 2016 are generally the same as they were in 2014.
Metal Level
Distribution by Metal % of Enrollees in Lowest Cost Plan in Metal Level
2014 2015 2016 2014 2015 2016 Platinum N/A 1% 1% N/A 100% 100% Gold 16% 16% 12% 28% 7% 10%
Silver 64% 59% 63% 62% 43% 65%
Bronze 17% 22% 22% 45% 36% 41%
Catastrophic 3% 2% 1% 72% 68% 63%

Comparison of 2016 & 2017 Plan Offerings
Individual Market SHOP
2015 2016 2017 2015 2016 2017
Platinum 1 1 0 0 3 1
Gold 11 12 4 5 5 2
Silver 11 10 7 6 8 2
Bronze 15 14 6 10 7 3
Catastrophic 3 3 2 N/A N/A N/A
Total 41 40 19 21 23 8
• The number of plan offerings is decreasing in the individual market and SHOP due to carrier exits from the exchange
• Persisting carriers reduced their individual market offerings by 5 plans

Final Rate Changes • Before subsidies, rate changes are as follows: ▫ Individual market: Average 18.2% rate increase weighted by 2016
AHCT enrollment; changes vary by plan and rating area combination from a 7.9% increase to a 35.1% increase
▫ Small group market: Changes vary by plan and rating area combination from a 1% decrease to a 13% increase
▫ Rate changes are consistent across areas for most plans • See Appendix A for more information

Individual Market: Small Group Market:
Proposed and Final Rate Filings
Initial Filing Revised Filing Final Filing Carrier Average Change Range by Plan Average Change Range by Plan Average Change Range by Plan Anthem 26.8% 16.5% to 39.8% n/a n/a 22.4% 10.8% to 35.2% ConnectiCare 14.3% 13.0% to 19.2% 27.1% 26.5% to 33.7% 17.4% 15.4% to 24.8%
Initial Filing Revised Filing Final Filing Carrier Average Change Range by Plan Average Change Range by Plan Average Change Range by Plan Anthem 11.6% 6.8% to 20.4% n/a n/a 4.9% 0.1% to 13.1%
Source: http://www.ct.gov/cid/lib/cid/RateChart2017-Final.pdf Note: Range by Plan may include some off-Exchange plans
Presenter
Presentation Notes

Rate Filing Observations
• Final rates for all carriers were lower than initially proposed
▫ Carriers proposed revisions and CID required changes that generally further reduced rates
• Many of Wakely’s comments were addressed in revised and final filings • Expiration of 2 of the 3 Premium Stabilization Programs
▫ The Federal Transitional Reinsurance Program and Risk Corridor Program end in 2016 4.0% to 7.0% impact (Note: Risk Corridor impact inconsequential)
• Base Experience • Utilization & Cost Trends
▫ Medical & Pharmacy Trends were approximately 9.0% • 2017 Moratorium on Health Insurer Provider Fee (9010)
▫ -2.5% to - 3.5% impact • Elimination of Sales Compensation on Exchange • See Appendix B for potential state initiatives for controlling cost

Relative Rates – Individual Market • Fairfield is highest cost area and Hartford is the lowest cost • In 2016, Anthem and ConnectiCare generally had the lowest rates in
the state, replacing HealthyCT as the lowest cost some areas • In 2017, the general rate position of the remaining carriers has
remained relatively the same.
Carrier Approx. 2015 Market Share
Current Market Share
Anthem 37.4% 28.47%
ConnectiCare (CBI) 43.0% 60.50%
HealthyCT (HCT) 16.9% 8.95%
UnitedHealthcare 2.7% 2.08%

Relative Rates – SHOP • Fairfield is the highest cost area and Hartford is the lowest • After the withdrawal of United and HealthyCT, Anthem is the only
remaining carrier offering plan on SHOP • Anthem is offering the 6 Standard Plans and 2 non-standard plans. • Annual assumed medical & pharmacy trends in final filings were
approximately 7.7%

Change in Benchmark Plan and Premium
49% 2016 Benchmark Plan 2017 Benchmark Plan
County Enrollment
Distribution by County
Benchmark Premium Change
Issuer Plan Name Issuer Plan Name
Fairfield 30% 15.6% CBI Silver Choice POS CBI Passage Silver Alternative PCP POS Hartford 23% 15.6% CBI Silver Choice POS CBI Passage Silver Alternative PCP POS
Litchfield 7% 16.7% Anthem Silver PPO Pathway X, a Mult-State Plan CBI Passage Silver Alternative PCP POS Middlesex 5% 15.6% CBI Silver Choice POS CBI Passage Silver Alternative PCP POS
New Haven 22% 15.6% CBI Silver Choice POS CBI Passage Silver Alternative PCP POS New London 7% 19.5% Anthem Silver PPO Pathway X, a Mult-State Plan Anthem Silver PPO Pathway X, a Mult-State Plan
Tolland 4% 19.5% Anthem Silver PPO Pathway X, a Mult-State Plan Anthem Silver PPO Pathway X, a Mult-State Plan Windham 3% 19.5% Anthem Silver PPO Pathway X, a Mult-State Plan Anthem Silver PPO Pathway X, a Mult-State Plan
• The second lowest cost silver (benchmark) plan carrier is changing in one of the counties
• The benchmark plan is changing in five counties • Benchmark premium changes vary by county from 15.6% to 19.5%

Impact for Hypothetical Household • The next slide illustrates the change in the benchmark premium and
premium subsidy amounts by county for a single adult, age 27 (turning 28 in 2017) with household income of 200% FPL
• Key take-aways include ▫ Subsidies for this hypothetical household are increasing the most in New
London, Tolland, and Windham, and the least in Fairfield ▫ The average subsidy change across all areas of the state is 36% for this
household scenario ▫ Benchmark premium increases are higher here than in the prior slide
due to the impact of aging • Impact will vary by household scenario (see Appendix C for an
additional hypothetical household)

Change in Benchmark Premiums/Subsidies for Hypothetical Household
County Enrollment
Distribution by County
Monthly Benchmark Premium (Before Tax Credit) Monthly Premium Subsidy
2016 2017 $ Change % Change 2016 2017 $ Change % Change
Fairfield 30% $321 $384 $64 20% $191 $251 $61 32%
Hartford 23% $260 $312 $52 20% $132 $180 $50 38%
Litchfield 7% $282 $345 $63 22% $156 $212 $57 37%
Middlesex 5% $283 $340 $56 20% $154 $207 $54 35%
New Haven 22% $293 $352 $58 20% $164 $219 $56 34%
New London 7% $282 $349 $67 24% $156 $221 $66 43%
Tolland 4% $282 $349 $67 24% $156 $221 $66 43%
Windham 3% $282 $349 $67 24% $156 $221 $66 43%
TOTAL 100% $291 $351 $60 21% $162 $219 $58 36%
For single age 27 year old (28 in 2017) with income of 200% FPL (approximately $23,760 in 2016).

Rate Impact for Enrollees in Lowest Cost Silver Plan • The following slide shows the rate impact before and after subsidies for the
lowest cost Silver plan in each county for our hypothetical household • The first panel of numbers shows the monthly rate change before subsidies for
the 2016 lowest cost Silver plan compared to the 2017 plan members are auto-renewed into
• The second panel of numbers shows the after-subsidy monthly rate change for the 2016 lowest cost Silver plan compared to the 2017 plan members are auto-renewed into
• The third panel of numbers shows the monthly after-subsidy rate change for the 2016 lowest cost Silver plan compared to the 2017 lowest cost Silver plan assuming the individual moves to that plan if it is different from their current plan (plan name is in the third column) ▫ The lowest cost Silver plan is changing in all counties except New London, Tolland, and
Windham, creating savings opportunities • Results will vary for different household scenarios, see Appendix C for more
information

Lowest Cost Silver Impact for Hypothetical Household For single age 27 year old (28 in 2017) with income of 200% FPL (approximately $23,760 in 2016).
Lowest Cost Silver Plan Lowest Silver Before Tax Credit - Auto Renew
Lowest Silver After Tax Credit - Auto Renew
Lowest Silver After Tax Credit - Switch to 2017 Lowest
County 2016 2017 2016 2017 Change 2016 2017 Change 2016 2017 Change
Fairfield CBI, Silver Standard POS
CBI, Silver Standard POS
$319 $381 19% $129 $130 0% $129 $130 0%
Hartford CBI, Silver Standard POS
CBI, Silver Standard POS $259 $310 19% $129 $130 0% $129 $130 0%
Litchfield Anthem, Silver PPO Standard Pathway X
CBI, Silver Standard POS
$278 $350 26% $124 $138 11% $124 $130 5%
Middlesex CBI, Silver Standard POS
CBI, Silver Standard POS $282 $337 19% $129 $130 0% $129 $130 0%
New Haven CBI, Silver Standard POS
CBI, Silver Standard POS
$292 $349 19% $129 $130 0% $129 $130 0%
New London
Anthem, Silver PPO Standard Pathway X
Anthem, Silver Core PPO Pathway X 5300 $278 $350 26% $124 $129 5% $124 $127 3%
Tolland Anthem, Silver PPO Standard Pathway X
Anthem, Silver Core PPO Pathway X 5300
$278 $350 26% $124 $129 5% $124 $127 3%
Windham Anthem, Silver PPO Standard Pathway X
Anthem, Silver Core PPO Pathway X 5300 $278 $350 26% $124 $129 5% $124 $127 3%

Average Impact for Hypothetical Household • The next slide illustrates the change in average premium by area (weighted
by AHCT enrollment by plan in each area) before and after subsidy for the same hypothetical household
• Premium changes are based on auto-renewal into the plan based on mappings provided by AHCT
• Averages represent the impact if all enrollees in the county had the same household characteristics as our example
• Key take-aways include ▫ Enrollees in New London (for this hypothetical household) will see the most
benefit from increasing subsidies, with the base premium increase of 27% reducing to 9% after considering subsidies
▫ All enrollees (for this hypothetical household) will see at least a 4% improvement due to the change in subsidies
• Impact will vary by household scenario, see Appendix C for an additional household scenario and more information
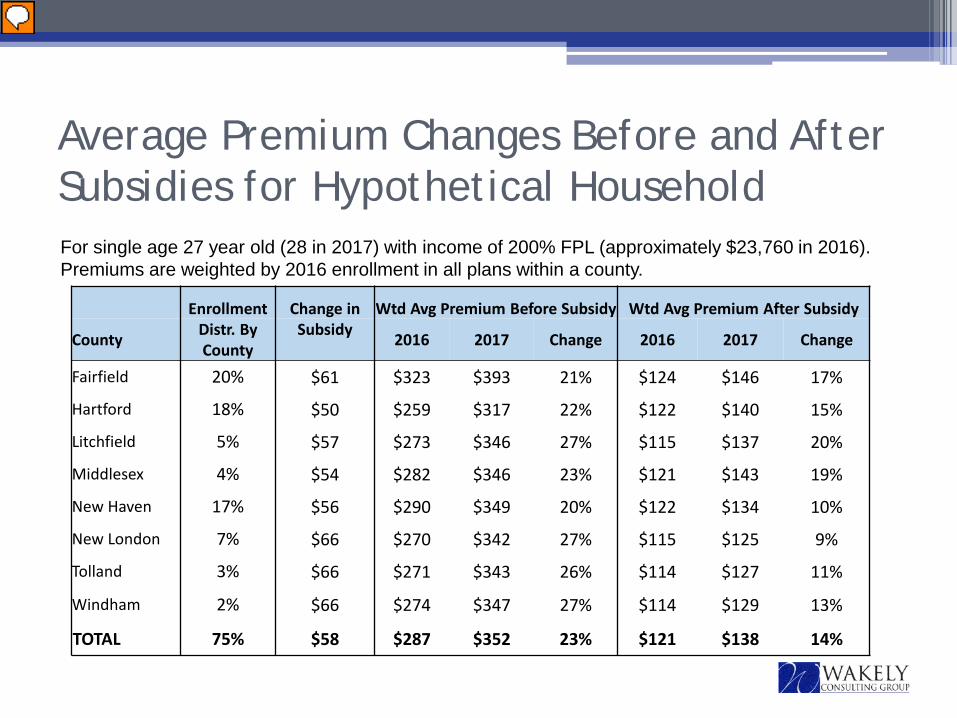
Average Premium Changes Before and After Subsidies for Hypothetical Household For single age 27 year old (28 in 2017) with income of 200% FPL (approximately $23,760 in 2016). Premiums are weighted by 2016 enrollment in all plans within a county.
Enrollment Change in Wtd Avg Premium Before Subsidy Wtd Avg Premium After Subsidy
County Distr. By County
Subsidy 2016 2017 Change 2016 2017 Change
Fairfield 20% $61 $323 $393 21% $124 $146 17%
Hartford 18% $50 $259 $317 22% $122 $140 15%
Litchfield 5% $57 $273 $346 27% $115 $137 20%
Middlesex 4% $54 $282 $346 23% $121 $143 19%
New Haven 17% $56 $290 $349 20% $122 $134 10%
New London 7% $66 $270 $342 27% $115 $125 9%
Tolland 3% $66 $271 $343 26% $114 $127 11%
Windham 2% $66 $274 $347 27% $114 $129 13%
TOTAL 75% $58 $287 $352 23% $121 $138 14%
Presenter
Presentation Notes
Use hypothetical in comments

Average Impact for Household in Discontinuing Plan • The next slide illustrates the change in average premium by carrier and
metal tier (weighted by AHCT enrollment by plan for each carrier) before and after subsidy for the same hypothetical household
• Premium changes are based moving to the lowest cost plan in the same metal tier (Platinum enrollees move to the lowest cost Gold plan)
• Averages represent the impact if all enrollees had the same household characteristics as our example
• Key take-aways include ▫ Enrollees (for this hypothetical household) will see lower than average increases
in base premiums before subsidies ▫ Enrollees (for this hypothetical household) can achieve material decreases in after
subsidy premiums

Average Premium Changes for Hypothetical Household in Discontinuing Plans For single age 27 year old (28 in 2017) with income of 200% FPL (approximately $23,760 in 2016). Premiums are weighted by 2016 enrollment in all plans within a county.
Level of % of Total
Enrollment
Wtd Avg Premium Before Subsidy Current plan in 2016
Lowest Cost plan in 2017
Wtd Avg Premium After Subsidy Current plan in 2016
Lowest Cost plan in 2017 Carrier Coverage 2016 2017 Change 2016 2017 Change
CBI Platinum 1.4% $392 $374 -5% $231 $156 -32% CBI Gold 1.7% $320 $373 17% $161 $158 -2% CBI Bronze 9.5% $186 $233 25% $25 $15 -38%
HealthyCT Gold 1.6% $347 $389 12% $173 $155 -10% HealthyCT Silver 5.0% $321 $350 9% $147 $116 -21% HealthyCT Bronze 3.4% $216 $242 12% $45 $11 -76% HealthyCT Catastrophic 0.1% $162 $189 17% $162 $189 17%
UnitedHealthCare Gold 0.7% $382 $400 5% $202 $160 -21% UnitedHealthCare Silver 1.0% $327 $353 8% $150 $116 -22%
UnitedHealthCare Bronze 0.2% $264 $243 -8% $90 $10 -88%
Presenter
Presentation Notes
Use hypothetical in comments

2017 Rate Changes

• Rate changes in this section reflect premium changes from 2016 to 2017 based on carrier plan mappings provided to Wakely by AHCT
• Weighted averages are based on enrollment by plan and county provided to Wakely by AHCT (individual market only)
Background
Appendix A

• The weighted average rate increase for AHCT enrollees (before premium subsidies) is 18.2%
• Rate changes across all plan and area combinations range from an 7.9% increase to an 35.1% increase
• By metal level, rate changes are highest on average for Gold plans (25.2%) and lowest for Silver plans (16.5%)
• No Platinum plans are offered in 2017; current enrollees will have to shop • By county, rate changes are highest on average for New London and
Windham (22.4%) and lowest for New Haven (16.1%) • By carrier, rate changes are highest for Anthem(21.5%) and lowest for
ConnectiCare (15.5%) • For any given plan, rate changes are fairly consistent across the counties
Individual Market Observations
Appendix A

Issuer
County Metric Anthem ConnectiCare Total
Platinum Min NA NA NA Max NA NA NA Wtd Avg NA NA NA
Gold Min 7.9% 16.5% 7.9% Max 35.1% 16.5% 35.1% Wtd Avg 28.2% 16.5% 25.2%
Silver Min 12.8% 15.1% 12.8% Max 21.9% 15.7% 21.9% Wtd Avg 18.8% 15.2% 16.5%
Bronze Min 11.2% 20.9% 11.2% Max 32.7% 21.7% 32.7% Wtd Avg 22.0% 21.1% 21.8%
Catastrophic Min 21.5% 20.0% 20.0% Max 29.2% 20.0% 29.2% Wtd Avg 25.5% 20.0% 23.3%
Total Min 7.9% 15.1% 7.9% Max 35.1% 21.7% 35.1% Wtd Avg 21.5% 15.5% 18.2%
Appendix A
Summary of Individual Rate Changes–by Metal Tier

Summary of Individual Rate Changes – by County
Issuer
County Metric Anthem ConnectiCare Total
Fairfield Min 9.9% 15.1% 9.9% Max 29.4% 21.7% 29.4% Wtd Avg 20.4% 15.5% 17.1%
Hartford Min 14.1% 15.1% 14.1% Max 34.4% 21.7% 34.4% Wtd Avg 24.6% 15.5% 17.9%
Litchfield Min 14.1% 15.1% 14.1% Max 34.4% 21.7% 34.4% Wtd Avg 23.2% 15.8% 22.0%
Middlesex Min 14.8% 15.1% 14.8% Max 35.1% 21.7% 35.1% Wtd Avg 25.1% 15.6% 18.5%
NewHaven Min 7.9% 15.1% 7.9% Max 27.1% 21.7% 27.1% Wtd Avg 17.1% 15.4% 16.1%
NewLondon Min 14.1% 15.1% 14.1% Max 34.4% 21.7% 34.4% Wtd Avg 23.0% 15.8% 22.4%
Tolland Min 14.1% 15.1% 14.1% Max 34.4% 21.7% 34.4% Wtd Avg 23.0% 15.8% 21.8%
Windham Min 14.1% 15.1% 14.1% Max 34.4% 21.7% 34.4% Wtd Avg 23.0% 15.9% 22.4%
Appendix A

• Rate changes across all plan and area combinations range from a 1% decrease to a 13% increase
• Rate changes are fairly consistent across the counties, except for a small decrease in Fairfield
• Rate changes vary by plan within each metal level
Observations - SHOP
Appendix A

Appendix A
Summary of SHOP Rate Changes
Metal Level Carrier 2016 Plan Name 2017 Plan Name Min Max Fairfield Hartford Litchfield Middlesex New Haven New
London Tolland Windham
Platinum Anthem Platinum Standard Pathway X PPO
Platinum Standard Pathway X PPO 12% 13% 12% 13% 13% 13% 13% 13% 13% 13%
Gold Anthem
Anthem Gold Standard Pathway X PPO
Anthem Gold Standard Pathway X PPO 1% 2% 1% 2% 2% 2% 2% 2% 2% 2%
Gold Anthem
Anthem Gold Pathway X HMO Plus
Anthem Gold Pathway X HMO Plus 1% 2% 1% 2% 2% 2% 2% 2% 2% 2%
Silver Anthem
Anthem Silver Standard Pathway X PPO
Anthem Silver Standard Pathway X PPO -1% 0% -1% 0% 0% 0% 0% 0% 0% 0%
Silver Anthem
Silver Standard Pathway X PPO w/ HSA
Silver Standard Pathway X PPO w/ HSA 10% 11% 10% 11% 11% 11% 11% 11% 11% 11%
Bronze Anthem
Anthem Bronze Standard Pathway X PPO
Anthem Bronze Standard Pathway X PPO 5% 6% 5% 6% 6% 6% 6% 6% 6% 6%
Bronze Anthem
Anthem Bronze Standard Pathway X PPO w HSA
Anthem Bronze Standard Pathway X PPO w HSA 10% 11% 10% 11% 11% 11% 11% 11% 11% 11%
Bronze Anthem
Anthem Bronze Pathway X HMO Plus w HSA
Anthem Bronze Pathway X HMO Plus w HSA 5% 6% 5% 6% 6% 6% 6% 6% 6% 6%

Approaches to Reducing Rates

• Examples of approaches states have taken or are considering to impact rates include ▫ State-specific reinsurance program (OR, AK, CMS*) ▫ Risk Adjustment Stabilization Pool (NY) ▫ All-payer rate setting for hospital services (MD) ▫ Promoting delivery system reform (e.g., ACOs, provider risk sharing) ▫ Setting growth caps in rates and/or provider reimbursements (MA/RI) ▫ Consumer driven plan design approaches ▫ Increased competition / competitive bidding / active purchasing (CA) ▫ Regulatory support for narrow networks ▫ State loss ratio requirements ▫ Other data driven strategies (i.e., to identify and address cost drivers)
• It is important to note that lowering rates in the individual market will have little impact on subsidized enrollees who pay a fixed amount, based on income, toward the Second Lowest Cost Silver plan
Examples of Approaches to Reduce Rates
Appendix B

Consumer Impact Analysis

• This section outlines the premium changes to consumers in the individual market after reflecting federal premium subsidies
• Impacts are calculated based on carrier plan mappings provided to Wakely by AHCT
• Weighted averages are based on enrollment by plan and county provided to Wakely by AHCT
Background
Appendix C

Background
• Premium impact for individuals and households vary based on: ▫ Member age(s) ▫ The number of family members ▫ Geographic region ▫ Eligibility for subsidies, i.e. advanced premium tax credit
(“APTC”) ▫ Income and household size ▫ Plan selection
Appendix C

Subsidy Calculation
• Subsidy eligible households receive a premium subsidy that is equal to difference between ▫ The full premium for the second lowest cost silver
(benchmark) plan available for the covered family members
▫ A portion of their household income as defined on the next slide
Appendix C

Subsidy Calculation
Appendix C
Income % Poverty
Income Range in Dollars for a single individual in 48 states + DC
Premium Cap Max % of Income for 2nd Lowest
Silver
2016 benefit year 2017 benefit year
(estimated) 2016 2017
Under 133% Less than $15,800 Less than $15,960 2.03% 2.04%
133% - 150% $15,800 - $17,820 $15,960 - $18,000 3.05% - 4.07% 3.06% - 4.08%
150% - 200% $17,820 - $23,760 $18,000 - $24,000 4.07% - 6.41% 4.08% - 6.43%
200% - 250% $23,760 - $29,700 $24,000 - $30,000 6.41% - 8.18% 6.43% - 8.21%
250% - 300% $29,700 - $35,640 $30,000 - $36,000 8.18% - 9.66% 8.21% - 9.69%
300% - 400% $35,640 - $47,520 $36,000 - $48,000 9.66% 9.69%
Over 400% More than $47,520
More than $48,000 No Cap No Cap

Consumer Premiums
• Benchmark plan: Subsidy eligible households pay up to the defined % of income for the Essential Health Benefits (EHB) portion of benchmark premium
• Non-Benchmark plan: Consumers pay the amount above, plus/minus the difference between their selected plan and the benchmark
• Advanced payment (APTC): federal government pays APTC directly to carrier, reducing consumer premium
Appendix C

Drivers of After Subsidy Rate Changes
• Change in Second Lowest Silver plan/premium • Change in plan premium relative to Second Lowest Silver premium • Change in income, household size • Updates to FPL • Consumer stays in same plan or shops
Appendix C

Change in Benchmark Plan and Subsidies • The next slide illustrates the change in the benchmark (second
lowest cost silver plan) by county for an age 21 individual, assuming no aging
• Key observations include: ▫ The benchmark carrier is changing in one of the eight counties ▫ Benchmark premium changes vary by county from 15.6% to
19.5% ▫ New London, Tolland, and Windham have the highest rate
increase / subsidy increase
Appendix C
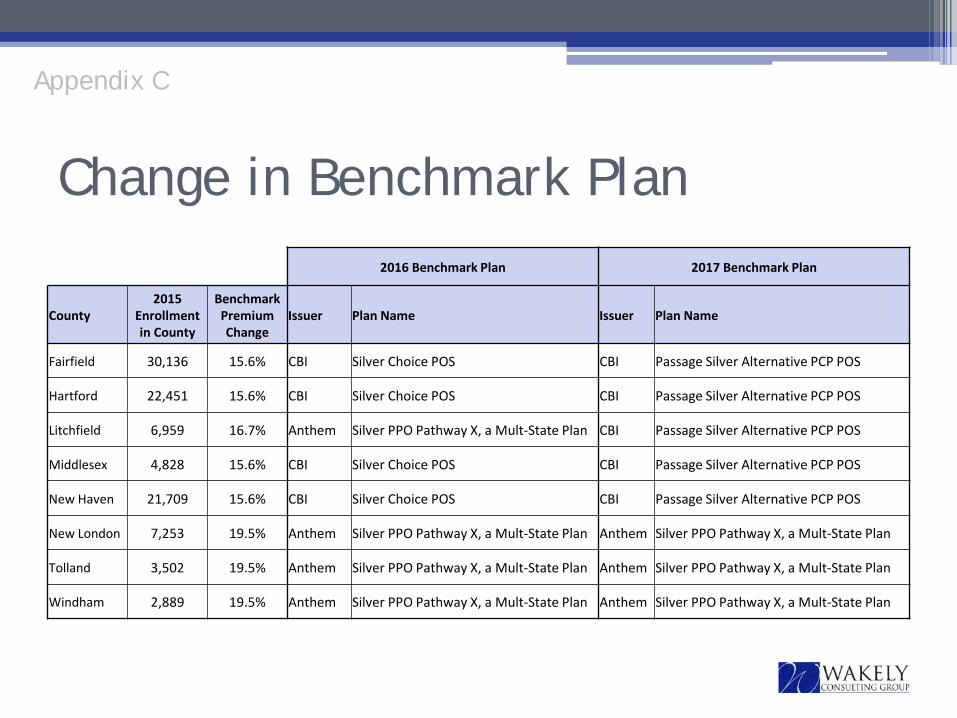
Change in Benchmark Plan 49% 2016 Benchmark Plan 2017 Benchmark Plan
County 2015
Enrollment in County
Benchmark Premium Change
Issuer Plan Name Issuer Plan Name
Fairfield 30,136 15.6% CBI Silver Choice POS CBI Passage Silver Alternative PCP POS
Hartford 22,451 15.6% CBI Silver Choice POS CBI Passage Silver Alternative PCP POS
Litchfield 6,959 16.7% Anthem Silver PPO Pathway X, a Mult-State Plan CBI Passage Silver Alternative PCP POS
Middlesex 4,828 15.6% CBI Silver Choice POS CBI Passage Silver Alternative PCP POS
New Haven 21,709 15.6% CBI Silver Choice POS CBI Passage Silver Alternative PCP POS
New London 7,253 19.5% Anthem Silver PPO Pathway X, a Mult-State Plan Anthem Silver PPO Pathway X, a Mult-State Plan
Tolland 3,502 19.5% Anthem Silver PPO Pathway X, a Mult-State Plan Anthem Silver PPO Pathway X, a Mult-State Plan
Windham 2,889 19.5% Anthem Silver PPO Pathway X, a Mult-State Plan Anthem Silver PPO Pathway X, a Mult-State Plan
Appendix C

Change in Benchmark Premium and Subsidies – Sample Households • The next slides illustrate the change in the benchmark premium and
premium subsidy amounts by county for three hypothetical households assuming auto-renewal ▫ Household 1: single, age 27 adult with income of 200% FPL ▫ Household 2: family of four, two adults age 37, two children under age 21 with
income of 350% FPL ▫ Household 3: single, age 41 adult with income of 300% FPL
• Results for other household scenarios will vary • Key observations for sample household 1 include
▫ Benchmark premiums are increasing by 21% on average, ranging by county from 20% to 24%
▫ Average subsidies for this household are increasing by 36% across all counties and range from 32% to 43% by county
▫ New London, Tolland, and Windham have the highest rate increase / subsidy increase
Appendix C

Change in Benchmark Premiums/Subsidies – Sample Household 1
County Enrollment
Distribution by County
Monthly Benchmark Premium (Before Tax Credit) Monthly Premium Subsidy
2016 2017 $ Change % Change 2016 2017 $ Change % Change
Fairfield 30% $321 $384 $64 20% $190 $251 $61 32%
Hartford 23% $260 $312 $52 20% $131 $180 $50 38%
Litchfield 7% $282 $345 $63 22% $155 $212 $57 37%
Middlesex 5% $283 $340 $56 20% $153 $207 $54 35%
New Haven 22% $293 $352 $58 20% $163 $219 $56 34%
New London 7% $282 $349 $67 24% $155 $221 $66 43%
Tolland 4% $282 $349 $67 24% $155 $221 $66 43%
Windham 3% $282 $349 $67 24% $155 $221 $66 43%
TOTAL 100% $291 $351 $60 21% $162 $219 $58 36%
For single age 27 year old (28 in 2017) with income of 200% FPL (approximately $23,760 in 2016).
Appendix C

Change in Benchmark Premiums/Subsidies – Sample Household 2 For family of four with income of 350% FPL, adults age 37 (38 in 2017) and two children under age 21
Appendix C
County
Enrollment Distribution by
County
Monthly Benchmark Premium (Before Tax Credit) Monthly Premium Subsidy
2016 2017 $ Change % Change 2016 2017 $ Change % Change
Fairfield 30% $1,146 $1,331 $185 16% $448 $622 $174 39%
Hartford 23% $931 $1,081 $150 16% $236 $375 $139 59%
Litchfield 7% $1,008 $1,193 $185 18% $322 $486 $164 51%
Middlesex 5% $1,012 $1,175 $163 16% $316 $468 $152 48%
New Haven 22% $1,049 $1,218 $169 16% $352 $510 $158 45%
New London 7% $1,008 $1,208 $200 20% $322 $515 $193 60%
Tolland 4% $1,008 $1,208 $200 20% $322 $515 $193 60%
Windham 3% $1,008 $1,208 $200 20% $322 $515 $193 60%
TOTAL 100% $1,041 $1,216 $175 17% $347 $510 $163 47%

Change in Benchmark Premiums/Subsidies – Sample Household 3 For single age 41 year old (42 in 2017) with income of 300% FPL (approximately $35,640 in 2016)
Appendix C
County
Enrollment Distribution by
County
Monthly Benchmark Premium (Before Tax Credit) Monthly Premium Subsidy
2016 2017 $ Change % Change 2016 2017 $ Change % Change
Fairfield 30% $398 $469 $70 18% $107 $173 $66 62%
Hartford 23% $324 $381 $57 18% $33 $86 $53 160%
Litchfield 7% $350 $420 $70 20% $63 $125 $62 98%
Middlesex 5% $352 $414 $62 18% $61 $118 $58 95%
New Haven 22% $365 $429 $64 18% $73 $133 $60 82%
New London 7% $350 $426 $75 21% $63 $135 $72 114%
Tolland 4% $350 $426 $75 21% $63 $135 $72 114%
Windham 3% $350 $426 $75 21% $63 $135 $72 114%
TOTAL 100% $362 $428 $66 18% $72 $133 $62 86%

Weighted Average Premium Changes – Sample Households • The following slides show the change in average premium by area
(weighted by AHCT enrollment by plan in each area) before and after subsidy for three different household scenarios (defined at the top of each page)
• Averages are weighted by enrollment in continuing plans based on 2016 distribution by county and plan provided by AHCT
• The table shows rate changes before and after subsidy assuming the household auto-renews in 2017 based on its 2016 plan
• Averages represent the impact if all enrollees in the county had the same household characteristics as the example
• Impact will vary for other household scenarios
Appendix C

Weighted Average Premium Changes – Sample Household 1 For single age 27 year old (28 in 2017) with income of 200% FPL (approximately $23,760 in 2016). Premiums are weighted by 2016 enrollment in continuing plans within a county.
Enrollment Change in Wtd Avg Premium Before Subsidy Wtd Avg Premium After Subsidy
County Distr. By County
Subsidy 2016 2017 Change 2016 2017 Change
Fairfield 20% $61 $323 $393 21% $124 $146 17%
Hartford 18% $50 $259 $317 22% $122 $140 15%
Litchfield 5% $57 $273 $346 27% $115 $137 20%
Middlesex 4% $54 $282 $346 23% $121 $143 19%
New Haven 17% $56 $290 $349 20% $122 $134 10%
New London 7% $66 $270 $342 27% $115 $125 9%
Tolland 3% $66 $271 $343 26% $114 $127 11%
Windham 2% $66 $274 $347 27% $114 $129 13%
TOTAL 75% $58 $287 $352 23% $121 $138 14%
Appendix C

Weighted Average Premium Changes – Sample Household 2 For family of four with income of 350% FPL, adults age 37 (38 in 2017) and two children under age 21. Premiums are weighted by 2016 enrollment in continuing plans within a county.
Enrollment Change in Wtd Avg Premium Before Subsidy Wtd Avg Premium After Subsidy
County For County Subsidy 2016 2017 Change 2016 2017 Change
Fairfield 20% $174 $1,156 $1,359 18% $673 $748 11%
Hartford 18% $139 $925 $1,096 18% $663 $728 10%
Litchfield 5% $164 $977 $1,198 23% $638 $720 13%
Middlesex 4% $152 $1,008 $1,199 19% $659 $740 12%
New Haven 17% $158 $1,037 $1,209 17% $663 $709 7%
New London 7% $193 $964 $1,185 23% $640 $678 6%
Tolland 3% $193 $969 $1,186 22% $635 $682 7%
Windham 2% $193 $978 $1,202 23% $635 $692 9%
TOTAL 75% $163 $1,025 $1,217 19% $660 $722 9%
Appendix C

Weighted Average Premium Changes – Sample Household 3 For single age 41 year old (42 in 2017) with income of 300% FPL (approximately $35,640 in 2016). Premiums are weighted by 2016 enrollment in continuing plans within a county.
Enrollment Change in Wtd Avg Premium Before Subsidy Wtd Avg Premium After Subsidy
County For County Subsidy 2016 2017 Change 2016 2017 Change
Fairfield 20% $66 $402 $479 19% $282 $309 10%
Hartford 18% $53 $322 $386 20% $278 $302 8%
Litchfield 5% $62 $340 $422 24% $270 $299 11%
Middlesex 4% $58 $350 $422 21% $277 $306 10%
New Haven 17% $60 $360 $426 18% $279 $295 6%
New London 7% $72 $335 $417 25% $271 $285 5%
Tolland 3% $72 $337 $418 24% $269 $286 6%
Windham 2% $72 $340 $423 25% $269 $290 8%
TOTAL 75% $62 $356 $428 20% $278 $300 8%
Appendix C

After Subsidy Rate Impact – Sample Households • The following slides show rate impact before and after subsidies for the
lowest cost silver and lowest cost bronze plans in each county for our three sample households
• The first panel of numbers shows the monthly rate change before subsidies for the 2016 lowest cost plan compared to the 2017 plan members are auto-renewed into
• The second panel of numbers shows the after-subsidy monthly rate change for the 2016 lowest cost plan compared to the 2017 plan members are auto-renewed into
• The third panel of numbers shows the monthly after-subsidy rate change for the 2016 lowest cost plan compared to the 2017 lowest plan assuming the individual moves to that plan (plan name is in the third column) ▫ The lowest cost Silver plan is changing in Fairfield, Litchfield, New Haven and
Tolland, creating savings opportunities by switching plans • Results will vary for other household scenarios
Appendix C

Lowest Cost Silver Impact – Sample Household 1 For single age 27 year old (28 in 2017) with income of 200% FPL (approximately $23,760 in 2016).
Lowest Cost Silver Plan Lowest Silver Before Tax Credit - Auto Renew
Lowest Silver After Tax Credit - Auto Renew
Lowest Silver After Tax Credit - Switch to 2017 Lowest
County 2016 2017 2016 2017 Change 2016 2017 Change 2016 2017 Change
Fairfield CBI, Silver Standard POS
CBI, Silver Standard POS
$319 $381 19% $129 $130 0% $129 $130 0%
Hartford CBI, Silver Standard POS
CBI, Silver Standard POS
$259 $310 19% $129 $130 0% $129 $130 0%
Litchfield Anthem, Silver PPO Standard Pathway X
CBI, Silver Standard POS
$278 $350 26% $124 $138 11% $124 $130 5%
Middlesex CBI, Silver Standard POS
CBI, Silver Standard POS
$282 $337 19% $129 $130 0% $129 $130 0%
New Haven CBI, Silver Standard POS
CBI, Silver Standard POS
$292 $349 19% $129 $130 0% $129 $130 0%
New London
Anthem, Silver PPO Standard Pathway X
Anthem, Silver Core PPO Pathway X 5300
$278 $350 26% $124 $129 5% $124 $127 3%
Tolland Anthem, Silver PPO Standard Pathway X
Anthem, Silver Core PPO Pathway X 5300
$278 $350 26% $124 $129 5% $124 $127 3%
Windham Anthem, Silver PPO Standard Pathway X
Anthem, Silver Core PPO Pathway X 5300
$278 $350 26% $124 $129 5% $124 $127 3%
Appendix C

Lowest Cost Silver Impact – Sample Household 2
For family of four with income of 350% FPL, adults age 37 (38 in 2017) and two children under age 21.
Lowest Cost Silver Plan Lowest Silver Before Tax Credit - Auto Renew
Lowest Silver After Tax Credit - Auto Renew
Lowest Silver After Tax Credit - Switch to 2017 Lowest
County 2016 2017 2016 2017 Change 2016 2017 Change 2016 2017 Change
Fairfield CBI, Silver Standard POS
CBI, Silver Standard POS
$1,141 $1,319 16% $693 $698 1% $693 $698 1%
Hartford CBI, Silver Standard POS
CBI, Silver Standard POS $927 $1,072 16% $692 $697 1% $692 $697 1%
Litchfield Anthem, Silver PPO Standard Pathway X
CBI, Silver Standard POS
$995 $1,211 22% $673 $726 8% $673 $697 4%
Middlesex CBI, Silver Standard POS
CBI, Silver Standard POS $1,008 $1,165 16% $692 $697 1% $692 $697 1%
New Haven CBI, Silver Standard POS
CBI, Silver Standard POS
$1,045 $1,207 16% $693 $697 1% $693 $697 1%
New London
Anthem, Silver PPO Standard Pathway X
Anthem, Silver Core PPO Pathway X 5300 $995 $1,211 22% $673 $697 4% $673 $688 2%
Tolland Anthem, Silver PPO Standard Pathway X
Anthem, Silver Core PPO Pathway X 5300
$995 $1,211 22% $673 $697 4% $673 $688 2%
Windham Anthem, Silver PPO Standard Pathway X
Anthem, Silver Core PPO Pathway X 5300 $995 $1,211 22% $673 $697 4% $673 $688 2%
Appendix C

Lowest Cost Silver Impact – Sample Household 3
For single age 41 year old (42 in 2017) with income of 300% FPL (approximately $35,640 in 2016).
Lowest Cost Silver Plan Lowest Silver Before Tax Credit - Auto Renew
Lowest Silver After Tax Credit - Auto Renew
Lowest Silver After Tax Credit - Switch to 2017 Lowest
County 2016 2017 2016 2017 Change 2016 2017 Change 2016 2017 Change
Fairfield CBI, Silver Standard POS
CBI, Silver Standard POS
$397 $465 17% $290 $292 1% $290 $292 1%
Hartford CBI, Silver Standard POS
CBI, Silver Standard POS $322 $378 17% $289 $292 1% $289 $292 1%
Litchfield Anthem, Silver PPO Standard Pathway X
CBI, Silver Standard POS
$346 $427 23% $283 $302 7% $283 $292 3%
Middlesex CBI, Silver Standard POS
CBI, Silver Standard POS $350 $410 17% $290 $292 1% $290 $292 1%
New Haven CBI, Silver Standard POS
CBI, Silver Standard POS
$363 $425 17% $290 $292 1% $290 $292 1%
New London
Anthem, Silver PPO Standard Pathway X
Anthem, Silver Core PPO Pathway X 5300 $346 $427 23% $283 $292 3% $283 $289 2%
Tolland Anthem, Silver PPO Standard Pathway X
Anthem, Silver Core PPO Pathway X 5300
$346 $427 23% $283 $292 3% $283 $289 2%
Windham Anthem, Silver PPO Standard Pathway X
Anthem, Silver Core PPO Pathway X 5300 $346 $427 23% $283 $292 3% $283 $289 2%
Appendix C
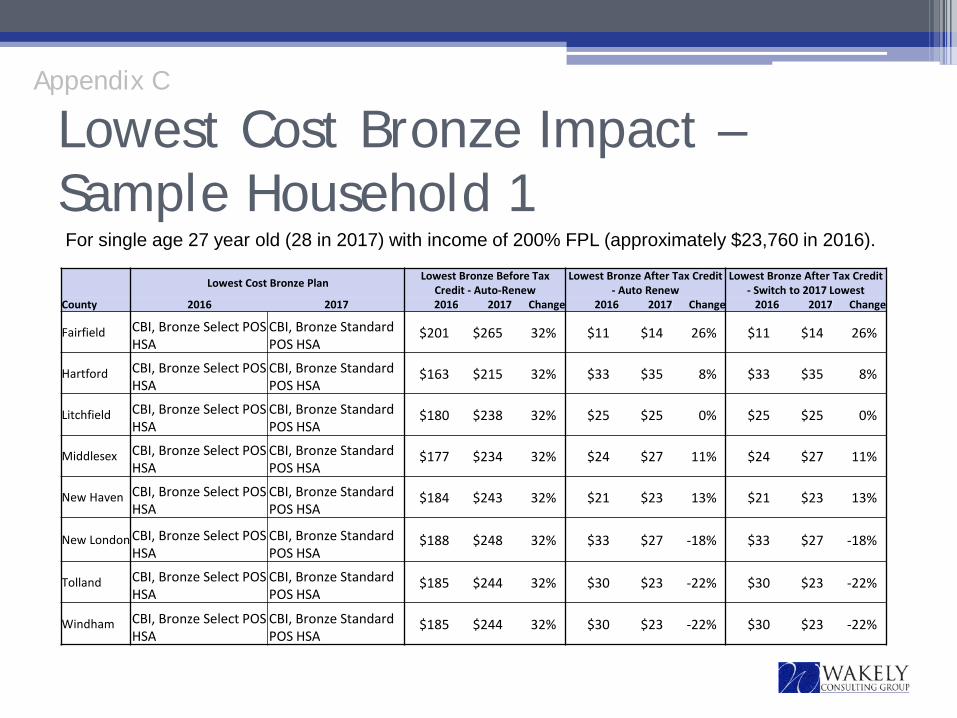
Lowest Cost Bronze Impact – Sample Household 1 Lowest Cost Bronze Plan Lowest Bronze Before Tax
Credit - Auto-Renew Lowest Bronze After Tax Credit
- Auto Renew Lowest Bronze After Tax Credit
- Switch to 2017 Lowest County 2016 2017 2016 2017 Change 2016 2017 Change 2016 2017 Change
Fairfield CBI, Bronze Select POS HSA
CBI, Bronze Standard POS HSA
$201 $265 32% $11 $14 26% $11 $14 26%
Hartford CBI, Bronze Select POS HSA
CBI, Bronze Standard POS HSA
$163 $215 32% $33 $35 8% $33 $35 8%
Litchfield CBI, Bronze Select POS HSA
CBI, Bronze Standard POS HSA
$180 $238 32% $25 $25 0% $25 $25 0%
Middlesex CBI, Bronze Select POS HSA
CBI, Bronze Standard POS HSA
$177 $234 32% $24 $27 11% $24 $27 11%
New Haven CBI, Bronze Select POS HSA
CBI, Bronze Standard POS HSA
$184 $243 32% $21 $23 13% $21 $23 13%
New London CBI, Bronze Select POS HSA
CBI, Bronze Standard POS HSA
$188 $248 32% $33 $27 -18% $33 $27 -18%
Tolland CBI, Bronze Select POS HSA
CBI, Bronze Standard POS HSA
$185 $244 32% $30 $23 -22% $30 $23 -22%
Windham CBI, Bronze Select POS HSA
CBI, Bronze Standard POS HSA
$185 $244 32% $30 $23 -22% $30 $23 -22%
Appendix C
For single age 27 year old (28 in 2017) with income of 200% FPL (approximately $23,760 in 2016).
Lowest Cost Bronze Impact – Sample Household 2 Lowest Cost Bronze Plan Lowest Bronze Before Tax
Credit - Auto-Renew Lowest Bronze After Tax Credit
- Auto Renew Lowest Bronze After Tax Credit
- Switch to 2017 Lowest County 2016 2017 2016 2017 Change 2016 2017 Change 2016 2017 Change
Fairfield CBI, Bronze Select POS HSA
CBI, Bronze Standard POS HSA
$718 $917 28% $270 $295 10% $270 $295 10%
Hartford CBI, Bronze Select POS HSA
CBI, Bronze Standard POS HSA
$583 $745 28% $347 $370 7% $347 $370 7%
Litchfield CBI, Bronze Select POS HSA
CBI, Bronze Standard POS HSA
$643 $822 28% $322 $337 5% $322 $337 5%
Middlesex CBI, Bronze Select POS HSA
CBI, Bronze Standard POS HSA
$634 $810 28% $318 $342 8% $318 $342 8%
New Haven CBI, Bronze Select POS HSA
CBI, Bronze Standard POS HSA
$657 $839 28% $305 $329 8% $305 $329 8%
New London CBI, Bronze Select POS HSA
CBI, Bronze Standard POS HSA
$671 $857 28% $349 $343 -2% $349 $343 -2%
Tolland CBI, Bronze Select POS HSA
CBI, Bronze Standard POS HSA
$660 $844 28% $339 $329 -3% $339 $329 -3%
Windham CBI, Bronze Select POS HSA
CBI, Bronze Standard POS HSA
$660 $844 28% $339 $329 -3% $339 $329 -3%
Appendix C
For family of four with income of 350% FPL, adults age 37 (38 in 2017) and two children under age 21.

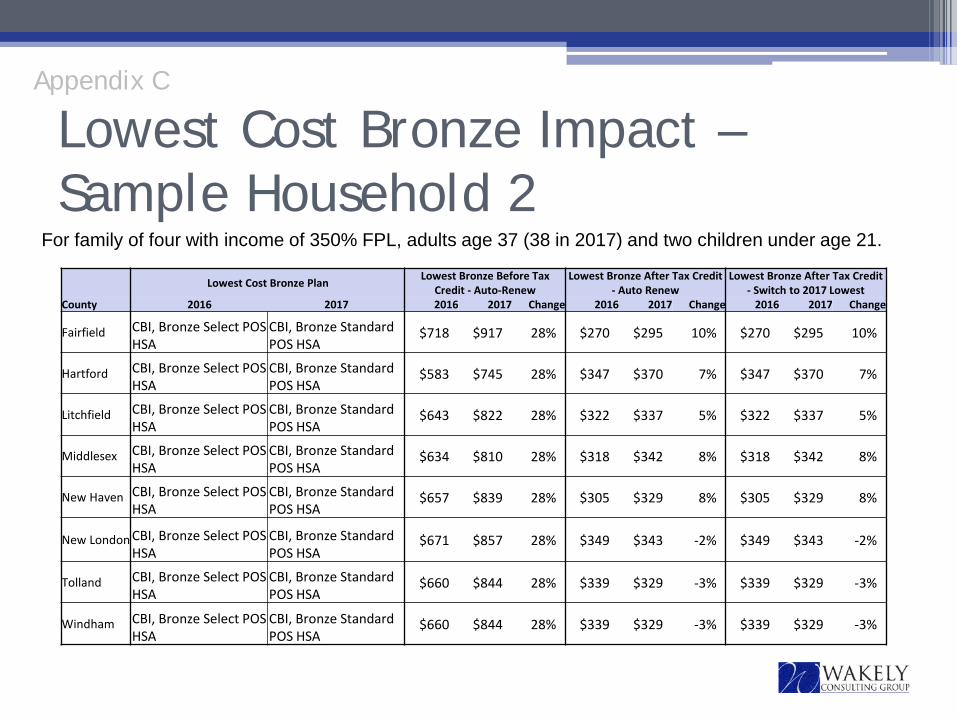
Lowest Cost Bronze Impact – Sample Household 3 Lowest Cost Bronze Plan Lowest Bronze Before Tax
Credit - Auto-Renew Lowest Bronze After Tax Credit
- Auto Renew Lowest Bronze After Tax Credit
- Switch to 2017 Lowest County 2016 2017 2016 2017 Change 2016 2017 Change 2016 2017 Change
Fairfield CBI, Bronze Select POS HSA
CBI, Bronze Standard POS HSA
$249 $323 30% $143 $150 6% $143 $150 6%
Hartford CBI, Bronze Select POS HSA
CBI, Bronze Standard POS HSA
$203 $262 29% $170 $177 4% $170 $177 4%
Litchfield CBI, Bronze Select POS HSA
CBI, Bronze Standard POS HSA
$224 $290 30% $161 $165 3% $161 $165 3%
Middlesex CBI, Bronze Select POS HSA
CBI, Bronze Standard POS HSA
$220 $285 30% $159 $167 5% $159 $167 5%
New Haven CBI, Bronze Select POS HSA
CBI, Bronze Standard POS HSA
$228 $296 30% $155 $162 5% $155 $162 5%
New London CBI, Bronze Select POS HSA
CBI, Bronze Standard POS HSA
$233 $302 29% $170 $167 -2% $170 $167 -2%
Tolland CBI, Bronze Select POS HSA
CBI, Bronze Standard POS HSA
$230 $297 29% $167 $162 -3% $167 $162 -3%
Windham CBI, Bronze Select POS HSA
CBI, Bronze Standard POS HSA
$230 $297 29% $167 $162 -3% $167 $162 -3%
Appendix C
For single age 41 year old (42 in 2017) with income of 300% FPL (approximately $35,640 in 2016).
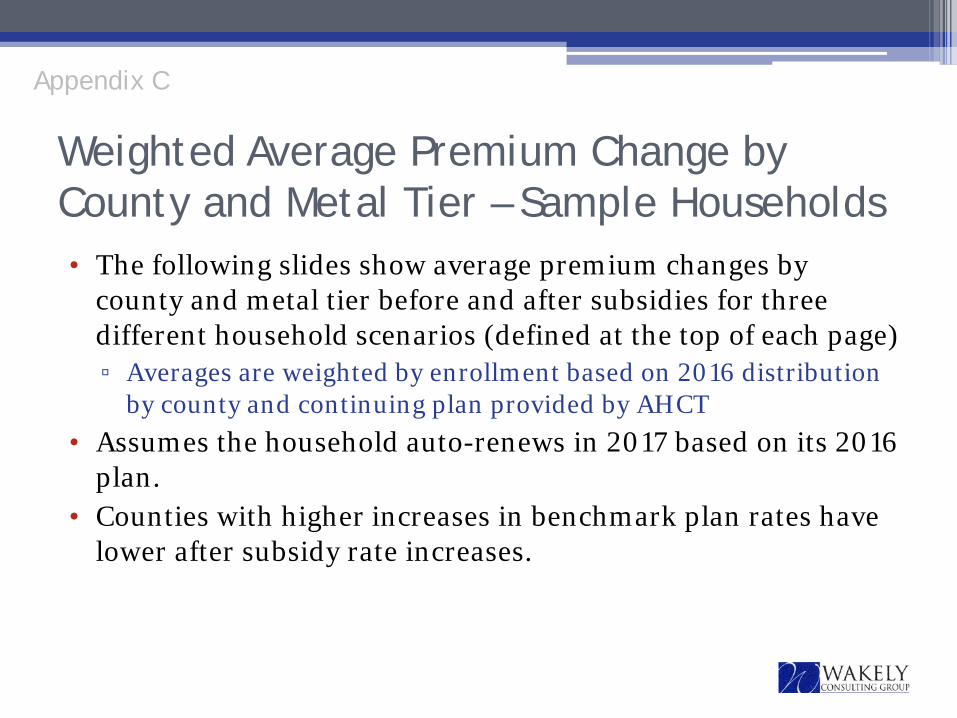
Weighted Average Premium Change by County and Metal Tier – Sample Households • The following slides show average premium changes by
county and metal tier before and after subsidies for three different household scenarios (defined at the top of each page) ▫ Averages are weighted by enrollment based on 2016 distribution
by county and continuing plan provided by AHCT • Assumes the household auto-renews in 2017 based on its 2016
plan. • Counties with higher increases in benchmark plan rates have
lower after subsidy rate increases.
Appendix C

Weighted Average Premium Change by County and Metal Tier – Household 1 For single age 27 year old (28 in 2017) with income of 200% FPL (approximately $23,760 in 2016). Premiums are weighted by 2016 enrollment in continuing plans within a county and metal tier.
Gold
County
% Change in Benchmark
Premium (no aging)
2016 Enrollment in Metal &
County
Before Subsidy
Premium After Subsidy
Premium Fairfield 15.6% 4,097 29% 26%
Hartford 15.6% 2,576 30% 24%
Litchfield 16.7% 1,036 34% 30%
Middlesex 15.6% 537 31% 28%
New Haven 15.6% 2,418 26% 19%
New London 19.5% 827 36% 29%
Tolland 19.5% 432 33% 24%
Windham 19.5% 357 35% 29%
Appendix C
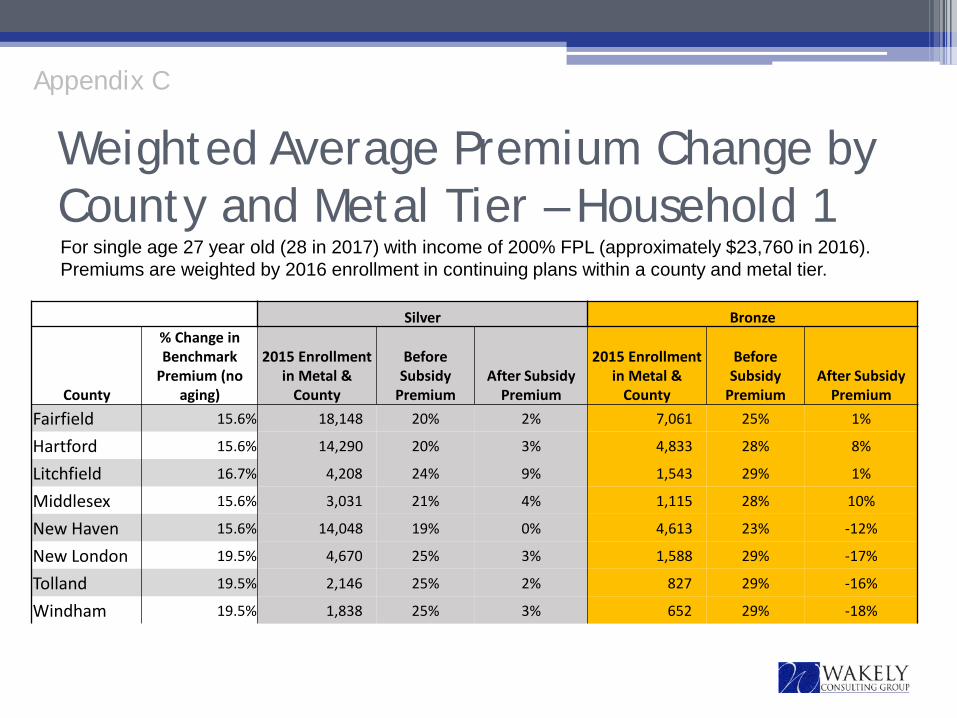
Weighted Average Premium Change by County and Metal Tier – Household 1 For single age 27 year old (28 in 2017) with income of 200% FPL (approximately $23,760 in 2016). Premiums are weighted by 2016 enrollment in continuing plans within a county and metal tier.
Silver Bronze
County
% Change in Benchmark
Premium (no aging)
2015 Enrollment in Metal &
County
Before Subsidy
Premium After Subsidy
Premium
2015 Enrollment in Metal &
County
Before Subsidy
Premium After Subsidy
Premium Fairfield 15.6% 18,148 20% 2% 7,061 25% 1%
Hartford 15.6% 14,290 20% 3% 4,833 28% 8%
Litchfield 16.7% 4,208 24% 9% 1,543 29% 1%
Middlesex 15.6% 3,031 21% 4% 1,115 28% 10%
New Haven 15.6% 14,048 19% 0% 4,613 23% -12%
New London 19.5% 4,670 25% 3% 1,588 29% -17%
Tolland 19.5% 2,146 25% 2% 827 29% -16%
Windham 19.5% 1,838 25% 3% 652 29% -18%
Appendix C

Weighted Average Premium Change by County and Metal Tier – Household 2
For family of four with income of 350% FPL, adults age 37 (38 in 2017) and two children under age 21. Premiums are weighted by 2016 enrollment in continuing plans within a county and metal tier.
Gold
County
% Change in Benchmark
Premium (no aging)
2016 Enrollment in Metal &
County
Before Subsidy
Premium After Subsidy
Premium Fairfield 15.6% 4,097 25% 18%
Hartford 15.6% 2,576 26% 17%
Litchfield 16.7% 1,036 29% 21%
Middlesex 15.6% 537 27% 20%
New Haven 15.6% 2,418 22% 14%
New London 19.5% 827 31% 20%
Tolland 19.5% 432 29% 17%
Windham 19.5% 357 31% 20%
Appendix C

Weighted Average Premium Change by County and Metal Tier – Household 2
For family of four with income of 350% FPL, adults age 37 (38 in 2017) and two children under age 21. Premiums are weighted by 2016 enrollment in continuing plans within a county and metal tier.
Silver Bronze
County
% Change in Benchmark
Premium (no aging)
2016 Enrollment in Metal &
County
Before Subsidy
Premium After Subsidy
Premium
2016 Enrollment in Metal &
County
Before Subsidy
Premium After Subsidy
Premium Fairfield 15.6% 18,148 16% 2% 7,061 21% 3%
Hartford 15.6% 14,290 17% 2% 4,833 24% 6%
Litchfield 16.7% 4,208 21% 6% 1,543 25% 3%
Middlesex 15.6% 3,031 17% 3% 1,115 24% 7%
New Haven 15.6% 14,048 15% 1% 4,613 19% -3%
New London 19.5% 4,670 21% 3% 1,588 25% -4%
Tolland 19.5% 2,146 21% 2% 827 25% -3%
Windham 19.5% 1,838 21% 3% 652 24% -4%
Appendix C

Weighted Average Premium Change by County and Metal Tier – Household 3
For single age 41 year old (42 in 2017) with income of 300% FPL (approximately $35,640 in 2016). Premiums are weighted by 2016 enrollment in continuing plans within a county and metal tier.
Gold
County
% Change in Benchmark
Premium (no aging)
2016 Enrollment in Metal &
County
Before Subsidy
Premium After Subsidy
Premium Fairfield 15.6% 4,097 26% 17%
Hartford 15.6% 2,576 27% 15%
Litchfield 16.7% 1,036 31% 19%
Middlesex 15.6% 537 29% 18%
New Haven 15.6% 2,418 24% 12%
New London 19.5% 827 33% 18%
Tolland 19.5% 432 30% 15%
Windham 19.5% 357 33% 18%
Appendix C
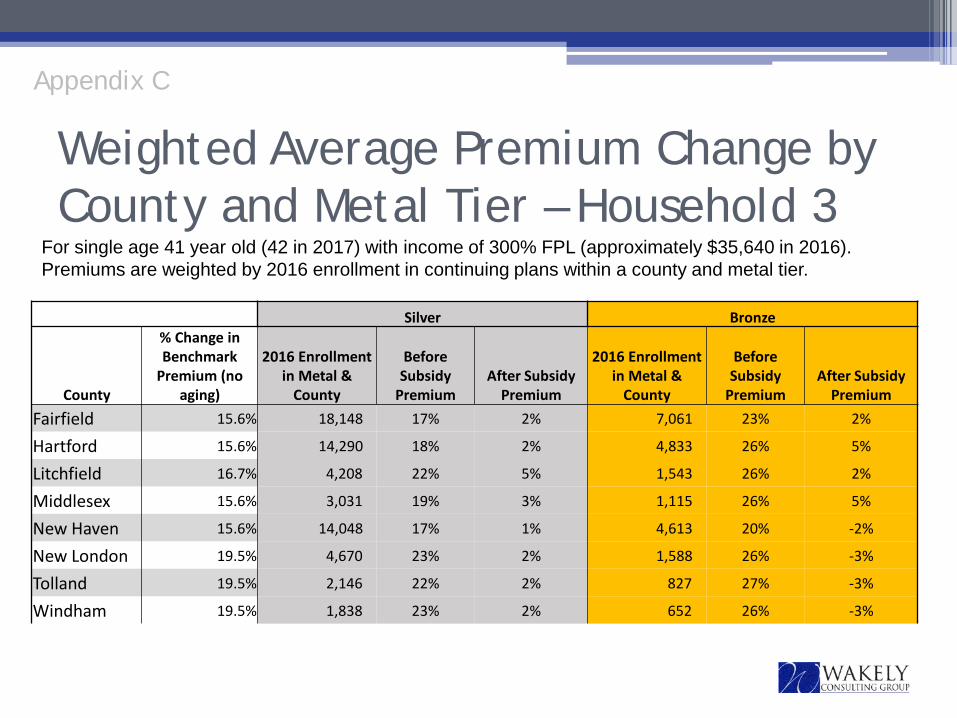
Weighted Average Premium Change by County and Metal Tier – Household 3
For single age 41 year old (42 in 2017) with income of 300% FPL (approximately $35,640 in 2016). Premiums are weighted by 2016 enrollment in continuing plans within a county and metal tier.
Silver Bronze
County
% Change in Benchmark
Premium (no aging)
2016 Enrollment in Metal &
County
Before Subsidy
Premium After Subsidy
Premium
2016 Enrollment in Metal &
County
Before Subsidy
Premium After Subsidy
Premium Fairfield 15.6% 18,148 17% 2% 7,061 23% 2%
Hartford 15.6% 14,290 18% 2% 4,833 26% 5%
Litchfield 16.7% 4,208 22% 5% 1,543 26% 2%
Middlesex 15.6% 3,031 19% 3% 1,115 26% 5%
New Haven 15.6% 14,048 17% 1% 4,613 20% -2%
New London 19.5% 4,670 23% 2% 1,588 26% -3%
Tolland 19.5% 2,146 22% 2% 827 27% -3%
Windham 19.5% 1,838 23% 2% 652 26% -3%
Appendix C

Simplified AHCT Example
• Ted is 27, single, lives in Fairfield and has an annual income of roughly $23,760, or 200% FPL ▫ Subsidy calculation is based on household
contribution of 6.41% of income, or $127 / month toward the 2nd lowest cost silver plan (benchmark)
Appendix C

Simplified AHCT Example • Ted wanted to enroll in a low cost silver plan in 2016 so
he could get cost sharing reductions ▫ Monthly rates for the two lowest cost options (before
subsidy) were $319 and $321, both CBI plans ▫ Monthly subsidy is $190 ▫ After subsidy monthly costs are $129 and $131 for the
two CBI plans ▫ Ted picks the lowest cost plan
Appendix C

Simplified AHCT Example - 2016
Lowest Silver 2016 2nd Lowest Silver 2017
CBI CBI
Rates Before Subsidy 2016 $319 $321
Subsidy 2016 $190
Rates After Subsidy 2016 $129 $131
Appendix C

Example - Changes for 2017 • The two lowest cost silver plans are still offered by CBI • Benchmark monthly premium changes from $321 in
2016 to $384 in 2017 • Subsidy goes up by roughly $61 / month
Appendix C

Example - Changes for 2017 • The CBI plan Ted enrolled in is still the lowest cost silver
plan, so he can stay in the CBI plan, and had an increase in the base rate of $62
• After subsidies, the monthly rate for Ted’s plan increases less than $1 from $129.37 to $129.74
• The increase in the subsidies tracked with the base premium increase so Ted enjoys very stable premiums from 2016 to 2017
Appendix C

Example - Changes for 2017 Lowest Silver 2016 2nd Lowest Silver
2016
CBI CBI
Rates Before Subsidy
2016 $319 $321
2017 $381 $385
$ Increase $62 $64
% Increase 19% 20%
Subsidy
2016 $190
2017 $251
$ Increase $61
% Increase 32%
Rates After Subsidy
2016 $129.37 $131
2017 $129.74 $133
$ Increase $0.40 $3
% Increase 0.3% 2%
Appendix C

2017 Open Enrollment Update

2017 Open Enrollment & Renewals Process (Open Enrollment November 1, 2016 through January 31, 2017)
Pre OE Renewal Projections
Non-Renewals Due to Plan Discontinuance 12.7%
Non-Renewals due to Carrier Attrition 11.8%
Non-Renewals Due to Application Selections 19.1%
Projected Manual Renewals 43.6%
Projected Auto Renewals 56.4%
October November December January
Renewal Strategy Kit
10/15 Renewal Notice 10/01
Storefront Opening
10/25
11/1 12/5 1/1 1/31
Open Enrollment
Renewal Final Notice
Qualified Health Plan (Annual Open
Enrollment Period)
Auto Renewal Effective Date

Call Center Vendor Update

Operations Update New Call Center Vendor Faneuil, Inc.

94
Call Center Training – 7/11/16 to Present
Faneuil Call Center Representatives (CCRs) were trained for eight weeks: Six weeks of classroom training and two weeks of on the job training (“nesting”).
Affordable Care Act (ACA), AHCT organization, eligibility, subsidies, insurance concepts & health plan offerings
Hands on AHCT system training – Consumer Portal and Worker Portal
Hands on Customer Relationship Management (CRM) training to capture customer information
Role Playing – answering customer questions, completing applications, and problem solving
Daily assessment of role playing to adjust training

95
Call Center Transition
Faneuil began taking calls on September 12th utilizing a phased approach.
Maximus and Faneuil are jointly answering calls until end of business September 23, 2016. For a 10-day period, Faneuil’s percentage of
calls increases.
AHCT, the Department of Social Services (DSS) and Faneuil meet 3 times a day to assess call center performance on a variety of quality
metrics to discuss corrective action for the next day.
Quality monitoring of CCR performance is completed hourly for assessment to adjust training when necessary.

96
Call Volume Phased Cut-Over Glide Path
0%
10%
20%
30%
40%
50%
60%
70%
80%
90%
100%
9/12 9/13 9/14 9/15 9/16 9/19 9/20 9/21 9/22 9/23
MaximusFaneuil
Faneuil will assume full call center responsibility on Monday 9/26/2016. by taking 100% of incoming call volume.

97
Faneuil, Inc. Quick Facts
Pricing Model Locations Staffing Training Current Exchange Customers
• Per Member Per Month cost structure (versus per minute)
• Aligned with AHCT’s strategy
• Incentivizes the improvement of our Customer’s Experience and the quality of service provided
• Bristol, CT (Primary)
• Hampton, VA (Overflow)
• 140 CCRs currently available
• 230 CCRs available 9/26
• Additional CCRs for Open Enrollment:
286 by 11/1 339 by 11/21
• Faneuil, AHCT and DSS will continue to assess quality performance measures and adjust training accordingly
• State of CA • State of WA

Adjournment