Board of Directors 11 March 2021 - SaTH
55
Board of Directors 11 March 2021 Agenda item 052/21 Report Integrated Performance Report Executive Lead Louise Barnett , CEO √ tick only those applicable Link to strategic pillar: Link to CQC domain: Our patients and community √ Safe √ Our people √ Effective √ Our service delivery √ Caring √ Our partners √ Responsive √ Our governance √ Well Led √ √ tick / input only those applicable, usually only one Report recommendations: Link to BAF / risk: For assurance √ BAF 1,2,3,4,5,7,8 and 9 For decision / approval Link to risk register: For review / discussion CRR1, CRR2, CRR3, CRR4, CRR5, CRR6, CRR9, CRR10, CRR11, CRR12, CRR13, CRR15, CRR17, CRR19, CRR21, CRR22, CRR23, CRR27 For noting For information For consent Presented to: The paper has been provided to Senior Leadership Committee members. Relevant sections of this paper have also been presented to: • Quality and Safety Assurance Committee on 24.03.2021 • Finance and Performance Assurance Committee on 02.03.2021. Dependent upon (if applicable): N/A Executive summary: This report provides the Board of Directors with an overview of the performance of the Trust. Key performance measures are analysed over time to understand the variation taking place and the level of assurance that can be inferred from the data. Where performance is below expected levels an exception report has been included. The report describes the key issues, actions and mitigations being taken to improve the performance. The Board of Directors is asked to take assurance from the report Appendices n/a
Transcript of Board of Directors 11 March 2021 - SaTH

Board of Directors 11 March 2021
Agenda item 052/21 Report Integrated Performance Report Executive Lead Louise Barnett , CEO
√ tick only thoseapplicable
Link to strategic pillar: Link to CQC domain: Our patients and community √ Safe √ Our people √ Effective √ Our service delivery √ Caring √ Our partners √ Responsive √ Our governance √ Well Led √
√ tick / input only those applicable, usually only one
Report recommendations: Link to BAF / risk: For assurance √ BAF 1,2,3,4,5,7,8 and 9 For decision / approval Link to risk register: For review / discussion CRR1, CRR2, CRR3,
CRR4, CRR5, CRR6, CRR9, CRR10, CRR11, CRR12, CRR13, CRR15, CRR17, CRR19, CRR21, CRR22, CRR23, CRR27
For noting For information
For consent
Presented to:
The paper has been provided to Senior Leadership Committee members.
Relevant sections of this paper have also been presented to: • Quality and Safety Assurance Committee on 24.03.2021• Finance and Performance Assurance Committee on
02.03.2021.Dependent upon (if applicable): N/A
Executive summary:
This report provides the Board of Directors with an overview of the performance of the Trust. Key performance measures are analysed over time to understand the variation taking place and the level of assurance that can be inferred from the data.
Where performance is below expected levels an exception report has been included. The report describes the key issues, actions and mitigations being taken to improve the performance.
The Board of Directors is asked to take assurance from the report
Appendices n/a
Integrated Performance Report
1.0 Purpose This report provides the Board of Directors with an overview of the performance of the Trust. It reports the key performance measures determined by the board using analysis over time to demonstrate the type of variation taking place and the level of assurance that can be taken in relation to the delivery of performance targets. Where performance is below expected levels an exception report is provided. This outlines the key issues, actions and mitigations being taken to improve the performance.
The report is aligned to the Trusts functional domains and includes an overarching executive summary together with domain executive summaries for: Quality, Covid-19 and Recovery, Operational Performance, Workforce, Finance and Transformation.
Table of Contents Integrated Performance Report ............................................................................................. 2
1.0 Purpose ...................................................................................................................... 2
2.0 Executive Summary .................................................................................................. 3
3.0 Overall Dashboard .................................................................................................... 4
4.0 Quality Summary ....................................................................................................... 8
5.0 Covid-19 and Recovery Summary ......................................................................... 19
6.0 Operational Summary ............................................................................................. 27
7.0 Workforce Summary ............................................................................................... 41
8.0 Finance Summary ................................................................................................... 46
9.0 Transformation Summary ....................................................................................... 49
2.0 Executive Summary Louise Barnett Chief Executive Officer
• The 3rd wave of Covid-19 intensified in January 2019, resulting in a significantly
higher level of hospital admissions than in either of the previous 2 waves. The Trust has responded well to the additional demands and has worked closely with the regional adult critical care network to provide additional regional capacity. We have worked closely with partners including RJAH, Shropcom and the military, who have provided us with appropriately skilled staff for deployment in wards and the emergency department as part of our escalation plan. At the end of January, we had 150 patients with Covid-19 in our beds and 22 patients in Critical Care.
• The increased Covid-19 demand has unfortunately resulted in the temporary suspension of some routine services and the need to delay some more urgent treatments. The impact has been minimised by working with the Independent Sector and RJAH, and through liaison with the regional West Midlands Cancer Hub. In the second half of January, we were unable to maintain the low risk green pathway on the RSH site, resulting in the delay of some more urgent cases, including cancer. This is a decision we have not taken lightly and are striving to recover this pathway as a matter of urgency to mitigate the risk of harm and anxiety for our patients.
• We are continuing to manage a number of Covid-19 outbreaks across our sites, some of which are further reducing capacity through the closure of beds and/or a reduction in available staffing. Despite this challenge, we have made improvements across a number of our infection prevention and control indicators, including E-coli and c.Difficile infections. We will continue to learn from incidents through root cause analysis, so that we can further improve patient safety, experiences and outcomes.
• Our Quality Improvement Strategy, launched this month, will support improved patient safety and experiences arising from our care. We are working on reducing the time we take to respond to concerns, recognising the importance of this to patients and their families. We are pleased to report that our friends and family metrics continue to show positive performance at over 95%.
• Our staff have worked tirelessly throughout the pandemic in providing care to our patients and also filling in where colleagues are absent. We recognise that our sickness absence levels have increased overall due to the impact of Covid-19 and that we do have a number of colleagues who are also shielding. Where possible we have facilitated home-based working or identified redeployment opportunities for those staff unable to undertake their normal duties.
• Despite the pressures on our ED there are positive improvements in the time to first assessment, sepsis awareness and there are fewer patients leaving the department without being seen. We remain concerned around the delays for ambulance handover, the long trolley waits and the 4 hour performance and are working to improve flow through multi-agency discharge planning activities.
• We have been actively supporting the delivery of the Covid-19 vaccination programme, enabling the first cohorts to receive their vaccinations by the end of January and are working hard to ensure that the top nine cohorts receive their vaccinations in line with national target timescales.
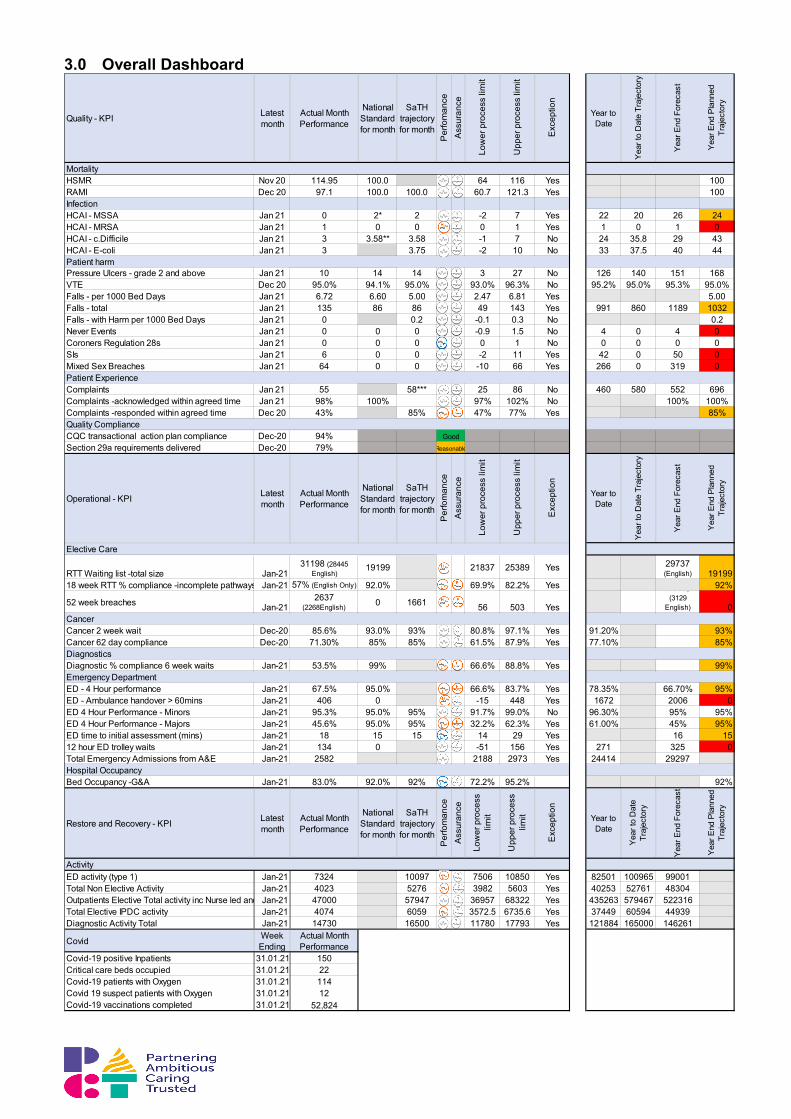
3.0 Overall Dashboard
Quality - KPI Latest month
Actual Month Performance
National Standard for month
SaTH trajectory for month
Per
fom
ance
Ass
uran
ce
Low
er p
roce
ss li
mit
Upp
er p
roce
ss li
mit
Exc
eptio
n
Year to Date
Year
to D
ate
Traj
ecto
ry
Year
End
For
ecas
t
Year
End
Pla
nned
Tr
ajec
tory
MortalityHSMR Nov 20 114.95 100.0 64 116 Yes 100RAMI Dec 20 97.1 100.0 100.0 60.7 121.3 Yes 100InfectionHCAI - MSSA Jan 21 0 2* 2 -2 7 Yes 22 20 26 24HCAI - MRSA Jan 21 1 0 0 0 1 Yes 1 0 1 0HCAI - c.Difficile Jan 21 3 3.58** 3.58 -1 7 No 24 35.8 29 43HCAI - E-coli Jan 21 3 3.75 -2 10 No 33 37.5 40 44
Pressure Ulcers - grade 2 and above Jan 21 10 14 14 3 27 No 126 140 151 168VTE Dec 20 95.0% 94.1% 95.0% 93.0% 96.3% No 95.2% 95.0% 95.3% 95.0%Falls - per 1000 Bed Days Jan 21 6.72 6.60 5.00 2.47 6.81 Yes 5.00Falls - total Jan 21 135 86 86 49 143 Yes 991 860 1189 1032Falls - with Harm per 1000 Bed Days Jan 21 0 0.2 -0.1 0.3 No 0.2Never Events Jan 21 0 0 0 -0.9 1.5 No 4 0 4 0Coroners Regulation 28s Jan 21 0 0 0 0 1 No 0 0 0 0SIs Jan 21 6 0 0 -2 11 Yes 42 0 50 0Mixed Sex Breaches Jan 21 64 0 0 -10 66 Yes 266 0 319 0
Complaints Jan 21 55 58*** 25 86 No 460 580 552 696Complaints -acknowledged within agreed time Jan 21 98% 100% 97% 102% No 100% 100%Complaints -responded within agreed time Dec 20 43% 85% 47% 77% Yes 85%
CQC transactional action plan compliance Dec-20 94%Section 29a requirements delivered Dec-20 79%
Operational - KPI Latest month
Actual Month Performance
National Standard for month
SaTH trajectory for month
Per
fom
ance
Ass
uran
ce
Low
er p
roce
ss li
mit
Upp
er p
roce
ss li
mit
Exc
eptio
n
Year to Date
Year
to D
ate
Traj
ecto
ry
Year
End
For
ecas
t
Year
End
Pla
nned
Tr
ajec
tory
RTT Waiting list -total size Jan-2131198 (28445
English)19199 21837 25389 Yes 29737
(English) 1919918 week RTT % compliance -incomplete pathways Jan-21 57% (English Only) 92.0% 69.9% 82.2% Yes 92%
52 week breaches Jan-212637
(2268English) 0 1661 56 503 Yes
3638, (3129
English) 0
Cancer 2 week wait Dec-20 85.6% 93.0% 93% 80.8% 97.1% Yes 91.20% 93%Cancer 62 day compliance Dec-20 71.30% 85% 85% 61.5% 87.9% Yes 77.10% 85%
Diagnostic % compliance 6 week waits Jan-21 53.5% 99% 66.6% 88.8% Yes 99%
ED - 4 Hour performance Jan-21 67.5% 95.0% 66.6% 83.7% Yes 78.35% 66.70% 95%ED - Ambulance handover > 60mins Jan-21 406 0 -15 448 Yes 1672 2006 0ED 4 Hour Performance - Minors Jan-21 95.3% 95.0% 95% 91.7% 99.0% No 96.30% 95% 95%ED 4 Hour Performance - Majors Jan-21 45.6% 95.0% 95% 32.2% 62.3% Yes 61.00% 45% 95%ED time to initial assessment (mins) Jan-21 18 15 15 14 29 Yes 16 1512 hour ED trolley waits Jan-21 134 0 -51 156 Yes 271 325 0Total Emergency Admissions from A&E Jan-21 2582 2188 2973 Yes 24414 29297
Bed Occupancy -G&A Jan-21 83.0% 92.0% 92% 72.2% 95.2% 92%
Restore and Recovery - KPI Latest month
Actual Month Performance
National Standard for month
SaTH trajectory for month
Per
fom
ance
Ass
uran
ce
Low
er p
roce
ss
limit
Upp
er p
roce
ss
limit
Exc
eptio
n
Year to Date
Year
to D
ate
Traj
ecto
ry
Year
End
For
ecas
t
Year
End
Pla
nned
Tr
ajec
tory
ED activity (type 1) Jan-21 7324 10097 7506 10850 Yes 82501 100965 99001Total Non Elective Activity Jan-21 4023 5276 3982 5603 Yes 40253 52761 48304Outpatients Elective Total activity inc Nurse led and Jan-21 47000 57947 36957 68322 Yes 435263 579467 522316Total Elective IPDC activity Jan-21 4074 6059 3572.5 6735.6 Yes 37449 60594 44939Diagnostic Activity Total Jan-21 14730 16500 11780 17793 Yes 121884 165000 146261
Covid Week Ending
Actual Month Performance
Covid-19 positive Inpatients 31.01.21 150Critical care beds occupied 31.01.21 22Covid-19 patients with Oxygen 31.01.21 114Covid 19 suspect patients with Oxygen 31.01.21 12Covid-19 vaccinations completed 31.01.21 52,824
Elective Care
Patient harm
Patient Experience
Quality ComplianceGood
Reasonable
Cancer
Diagnostics
Emergency Department
Hospital Occupancy
Activity
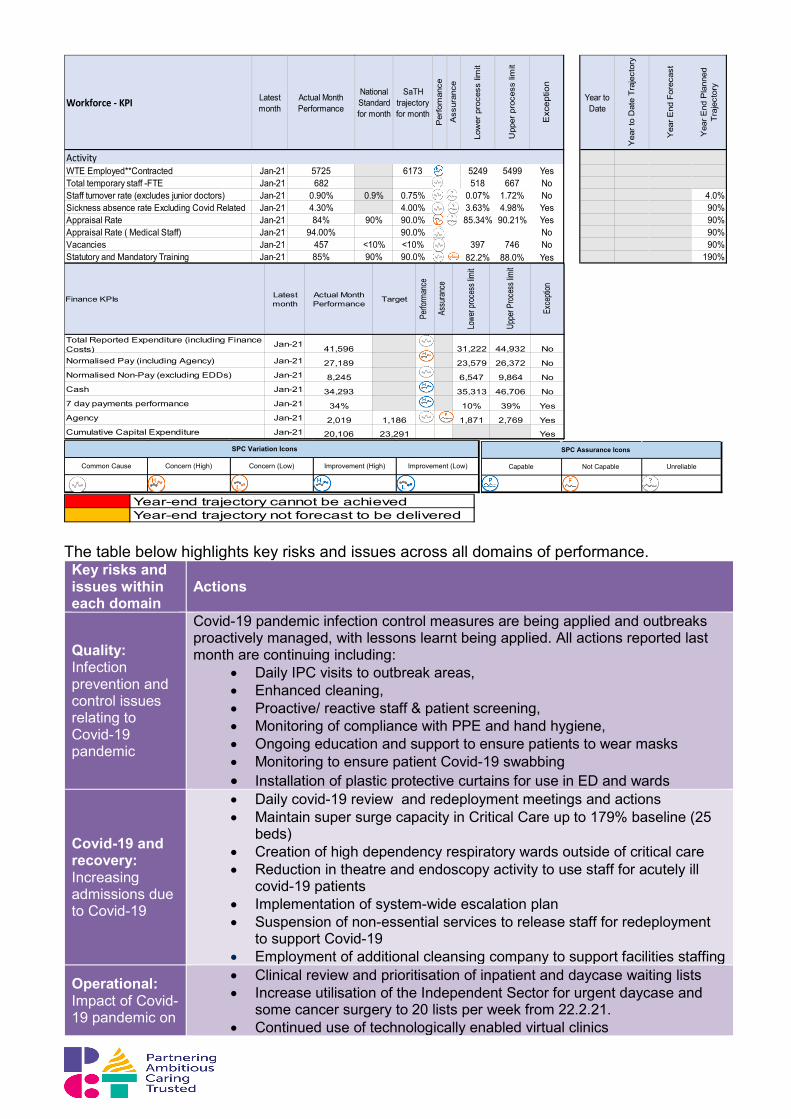
The table below highlights key risks and issues across all domains of performance. Key risks and issues within each domain
Actions
Quality: Infection prevention and control issues relating to Covid-19 pandemic
Covid-19 pandemic infection control measures are being applied and outbreaks proactively managed, with lessons learnt being applied. All actions reported last month are continuing including:
• Daily IPC visits to outbreak areas, • Enhanced cleaning, • Proactive/ reactive staff & patient screening, • Monitoring of compliance with PPE and hand hygiene, • Ongoing education and support to ensure patients to wear masks • Monitoring to ensure patient Covid-19 swabbing • Installation of plastic protective curtains for use in ED and wards
Covid-19 and recovery: Increasing admissions due to Covid-19
• Daily covid-19 review and redeployment meetings and actions • Maintain super surge capacity in Critical Care up to 179% baseline (25
beds) • Creation of high dependency respiratory wards outside of critical care • Reduction in theatre and endoscopy activity to use staff for acutely ill
covid-19 patients • Implementation of system-wide escalation plan • Suspension of non-essential services to release staff for redeployment
to support Covid-19 • Employment of additional cleansing company to support facilities staffing
Operational: Impact of Covid-19 pandemic on
• Clinical review and prioritisation of inpatient and daycase waiting lists • Increase utilisation of the Independent Sector for urgent daycase and
some cancer surgery to 20 lists per week from 22.2.21. • Continued use of technologically enabled virtual clinics
Workforce - KPI Latest month
Actual Month Performance
National Standard for month
SaTH trajectory for month
Per
fom
ance
Ass
uran
ce
Low
er p
roce
ss li
mit
Upp
er p
roce
ss li
mit
Exc
eptio
n
Year to Date
Yea
r to
Dat
e Tr
ajec
tory
Yea
r End
For
ecas
t
Yea
r End
Pla
nned
Tr
ajec
tory
WTE Employed**Contracted Jan-21 5725 6173 5249 5499 YesTotal temporary staff -FTE Jan-21 682 518 667 NoStaff turnover rate (excludes junior doctors) Jan-21 0.90% 0.9% 0.75% 0.07% 1.72% No 4.0%Sickness absence rate Excluding Covid Related Jan-21 4.30% 4.00% 3.63% 4.98% Yes 90%Appraisal Rate Jan-21 84% 90% 90.0% 85.34% 90.21% Yes 90%Appraisal Rate ( Medical Staff) Jan-21 94.00% 90.0% No 90%Vacancies Jan-21 457 <10% <10% 397 746 No 90%Statutory and Mandatory Training Jan-21 85% 90% 90.0% 82.2% 88.0% Yes 190%
Activity
Total Reported Expenditure (including Finance Costs)
Jan-21 41,596 31,222 44,932 NoNormalised Pay (including Agency) Jan-21 27,189 23,579 26,372 NoNormalised Non-Pay (excluding EDDs) Jan-21 8,245 6,547 9,864 NoCash Jan-21 34,293 35,313 46,706 No7 day payments performance Jan-21 34% 10% 39% YesAgency Jan-21 2,019 1,186 1,871 2,769 YesCumulative Capital Expenditure Jan-21 20,106 23,291 Yes
Lowe
r proc
ess l
imit
Uppe
r Proc
ess l
imit
Exce
ption
Finance KPIs Latest month
Perfo
rman
ce
Actual Month Performance Target
Assu
rance
Common Cause Concern (High) Concern (Low) Improvement (High) Improvement (Low)
SPC Variation Icons
Capable Not Capable Unreliable
SPC Assurance Icons
Year-end trajectory cannot be achievedYear-end trajectory not forecast to be delivered
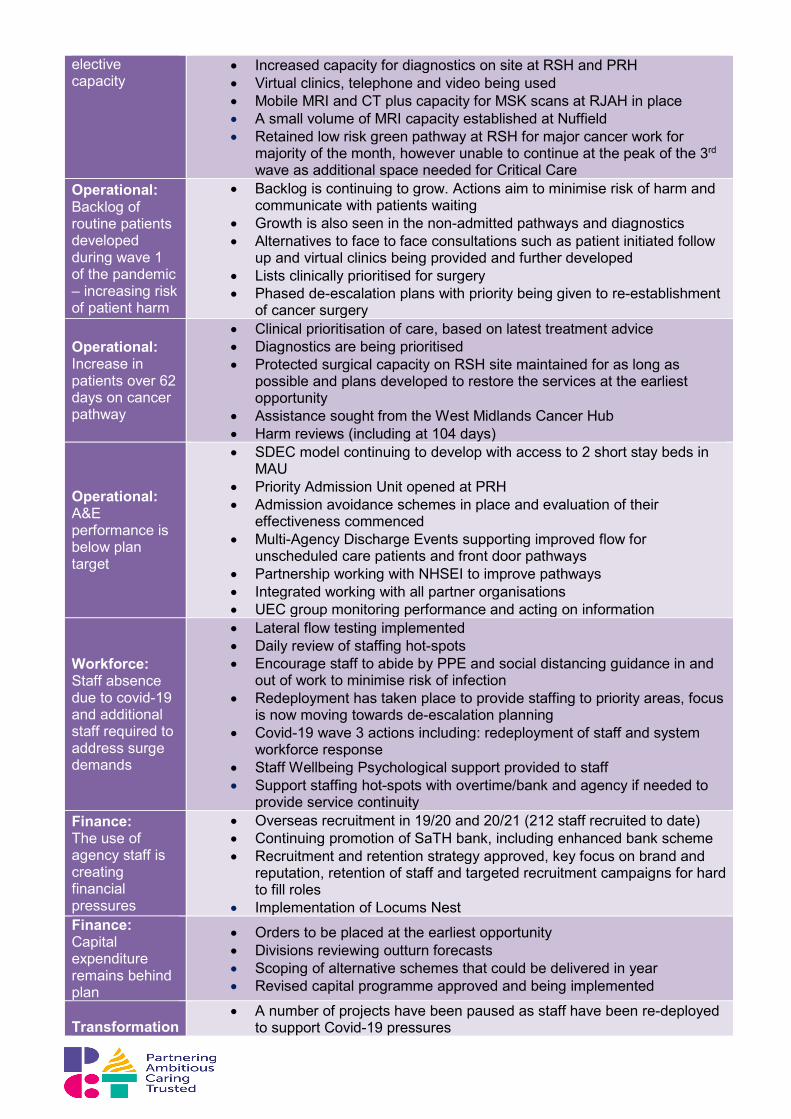
elective capacity
• Increased capacity for diagnostics on site at RSH and PRH • Virtual clinics, telephone and video being used • Mobile MRI and CT plus capacity for MSK scans at RJAH in place • A small volume of MRI capacity established at Nuffield • Retained low risk green pathway at RSH for major cancer work for
majority of the month, however unable to continue at the peak of the 3rd wave as additional space needed for Critical Care
Operational: Backlog of routine patients developed during wave 1 of the pandemic – increasing risk of patient harm
• Backlog is continuing to grow. Actions aim to minimise risk of harm and communicate with patients waiting
• Growth is also seen in the non-admitted pathways and diagnostics • Alternatives to face to face consultations such as patient initiated follow
up and virtual clinics being provided and further developed • Lists clinically prioritised for surgery • Phased de-escalation plans with priority being given to re-establishment
of cancer surgery
Operational: Increase in patients over 62 days on cancer pathway
• Clinical prioritisation of care, based on latest treatment advice • Diagnostics are being prioritised • Protected surgical capacity on RSH site maintained for as long as
possible and plans developed to restore the services at the earliest opportunity
• Assistance sought from the West Midlands Cancer Hub • Harm reviews (including at 104 days)
Operational: A&E performance is below plan target
• SDEC model continuing to develop with access to 2 short stay beds in MAU
• Priority Admission Unit opened at PRH • Admission avoidance schemes in place and evaluation of their
effectiveness commenced • Multi-Agency Discharge Events supporting improved flow for
unscheduled care patients and front door pathways • Partnership working with NHSEI to improve pathways • Integrated working with all partner organisations • UEC group monitoring performance and acting on information
Workforce: Staff absence due to covid-19 and additional staff required to address surge demands
• Lateral flow testing implemented • Daily review of staffing hot-spots • Encourage staff to abide by PPE and social distancing guidance in and
out of work to minimise risk of infection • Redeployment has taken place to provide staffing to priority areas, focus
is now moving towards de-escalation planning • Covid-19 wave 3 actions including: redeployment of staff and system
workforce response • Staff Wellbeing Psychological support provided to staff • Support staffing hot-spots with overtime/bank and agency if needed to
provide service continuity Finance: The use of agency staff is creating financial pressures
• Overseas recruitment in 19/20 and 20/21 (212 staff recruited to date) • Continuing promotion of SaTH bank, including enhanced bank scheme • Recruitment and retention strategy approved, key focus on brand and
reputation, retention of staff and targeted recruitment campaigns for hard to fill roles
• Implementation of Locums Nest Finance: Capital expenditure remains behind plan
• Orders to be placed at the earliest opportunity • Divisions reviewing outturn forecasts • Scoping of alternative schemes that could be delivered in year • Revised capital programme approved and being implemented
Transformation
• A number of projects have been paused as staff have been re-deployed to support Covid-19 pressures
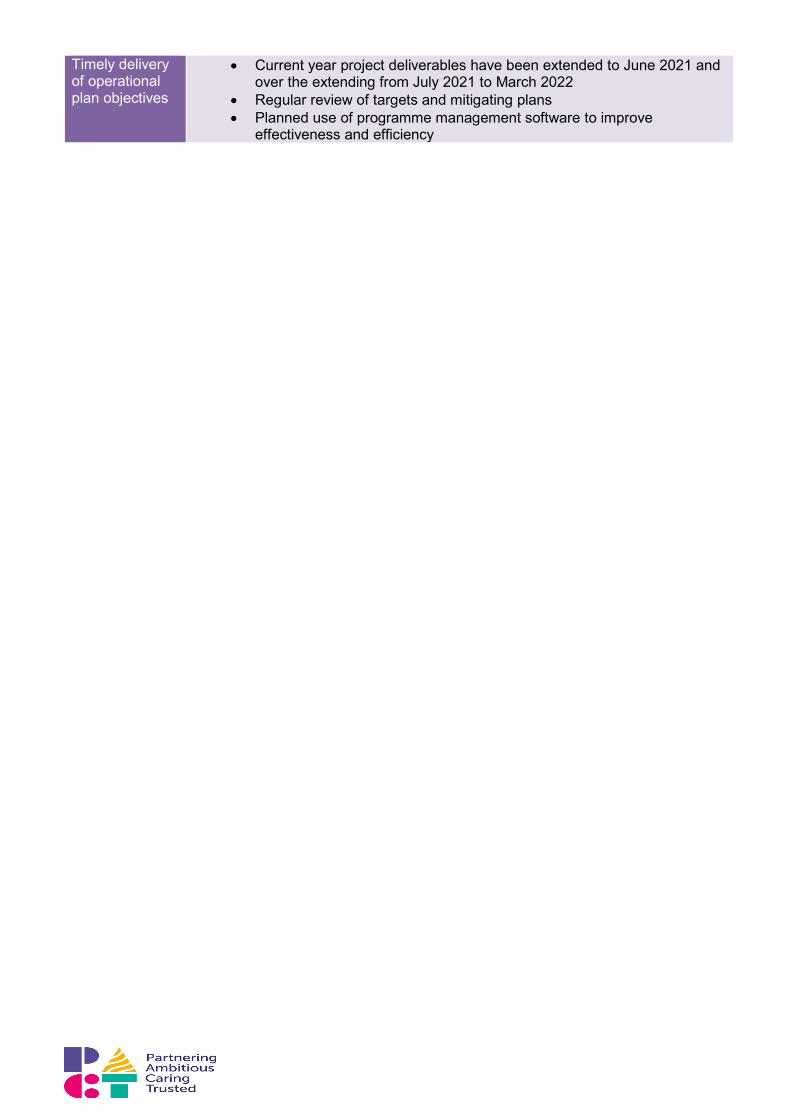
Timely delivery of operational plan objectives
• Current year project deliverables have been extended to June 2021 and over the extending from July 2021 to March 2022
• Regular review of targets and mitigating plans • Planned use of programme management software to improve
effectiveness and efficiency
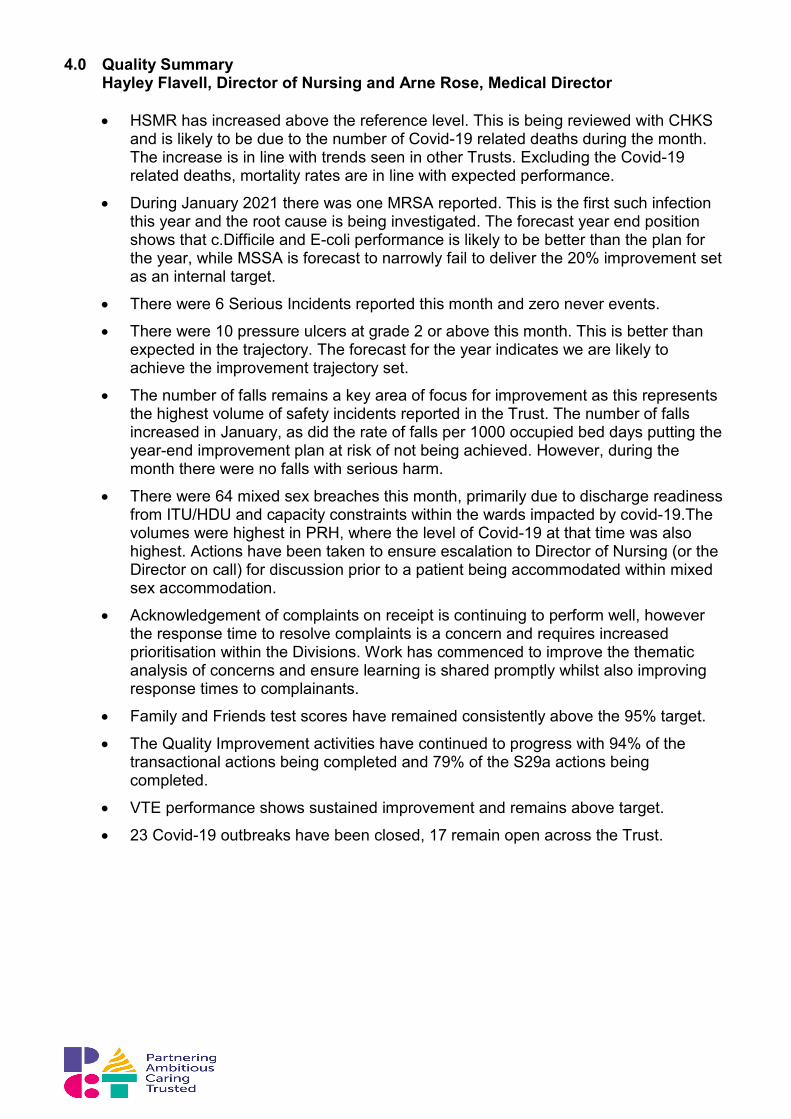
4.0 Quality Summary Hayley Flavell, Director of Nursing and Arne Rose, Medical Director
• HSMR has increased above the reference level. This is being reviewed with CHKS
and is likely to be due to the number of Covid-19 related deaths during the month. The increase is in line with trends seen in other Trusts. Excluding the Covid-19 related deaths, mortality rates are in line with expected performance.
• During January 2021 there was one MRSA reported. This is the first such infection this year and the root cause is being investigated. The forecast year end position shows that c.Difficile and E-coli performance is likely to be better than the plan for the year, while MSSA is forecast to narrowly fail to deliver the 20% improvement set as an internal target.
• There were 6 Serious Incidents reported this month and zero never events.
• There were 10 pressure ulcers at grade 2 or above this month. This is better than expected in the trajectory. The forecast for the year indicates we are likely to achieve the improvement trajectory set.
• The number of falls remains a key area of focus for improvement as this represents the highest volume of safety incidents reported in the Trust. The number of falls increased in January, as did the rate of falls per 1000 occupied bed days putting the year-end improvement plan at risk of not being achieved. However, during the month there were no falls with serious harm.
• There were 64 mixed sex breaches this month, primarily due to discharge readiness from ITU/HDU and capacity constraints within the wards impacted by covid-19.The volumes were highest in PRH, where the level of Covid-19 at that time was also highest. Actions have been taken to ensure escalation to Director of Nursing (or the Director on call) for discussion prior to a patient being accommodated within mixed sex accommodation.
• Acknowledgement of complaints on receipt is continuing to perform well, however the response time to resolve complaints is a concern and requires increased prioritisation within the Divisions. Work has commenced to improve the thematic analysis of concerns and ensure learning is shared promptly whilst also improving response times to complainants.
• Family and Friends test scores have remained consistently above the 95% target.
• The Quality Improvement activities have continued to progress with 94% of the transactional actions being completed and 79% of the S29a actions being completed.
• VTE performance shows sustained improvement and remains above target.
• 23 Covid-19 outbreaks have been closed, 17 remain open across the Trust.
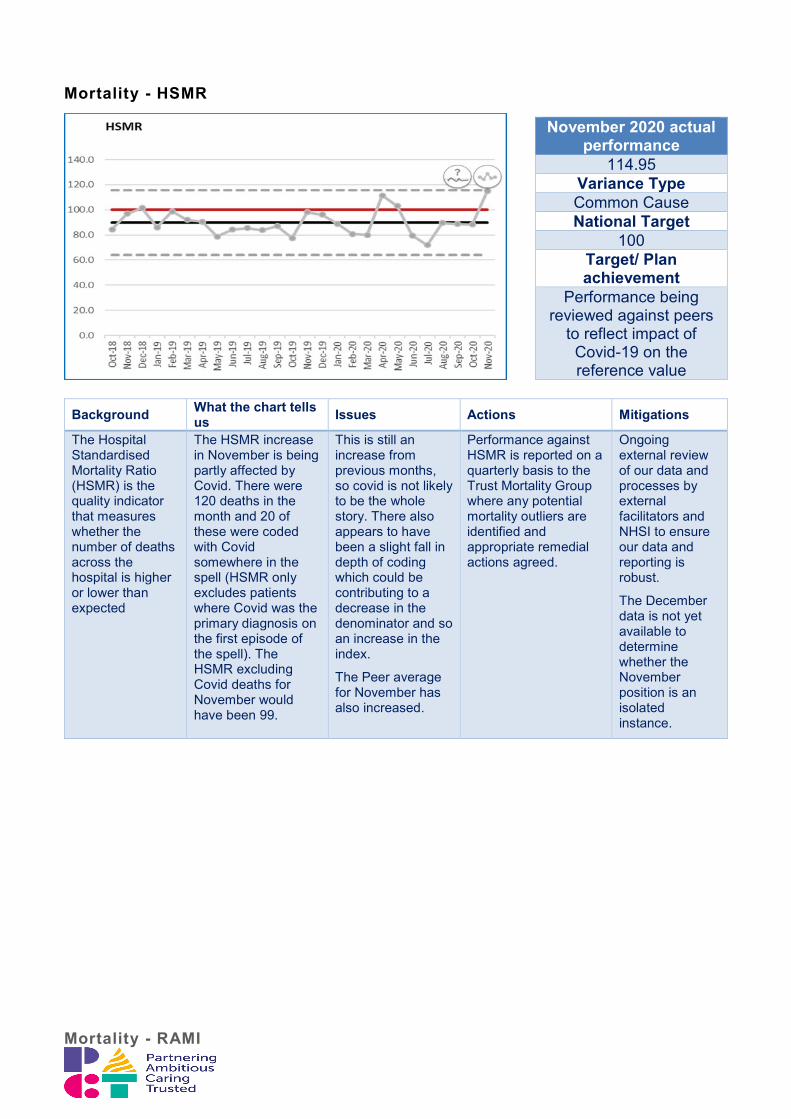
Mortality - HSMR
Background What the chart tells us Issues Actions Mitigations
The Hospital Standardised Mortality Ratio (HSMR) is the quality indicator that measures whether the number of deaths across the hospital is higher or lower than expected
The HSMR increase in November is being partly affected by Covid. There were 120 deaths in the month and 20 of these were coded with Covid somewhere in the spell (HSMR only excludes patients where Covid was the primary diagnosis on the first episode of the spell). The HSMR excluding Covid deaths for November would have been 99.
This is still an increase from previous months, so covid is not likely to be the whole story. There also appears to have been a slight fall in depth of coding which could be contributing to a decrease in the denominator and so an increase in the index.
The Peer average for November has also increased.
Performance against HSMR is reported on a quarterly basis to the Trust Mortality Group where any potential mortality outliers are identified and appropriate remedial actions agreed.
Ongoing external review of our data and processes by external facilitators and NHSI to ensure our data and reporting is robust.
The December data is not yet available to determine whether the November position is an isolated instance.
Mortality - RAMI
November 2020 actual performance
114.95 Variance Type Common Cause National Target
100 Target/ Plan achievement
Performance being reviewed against peers
to reflect impact of Covid-19 on the reference value
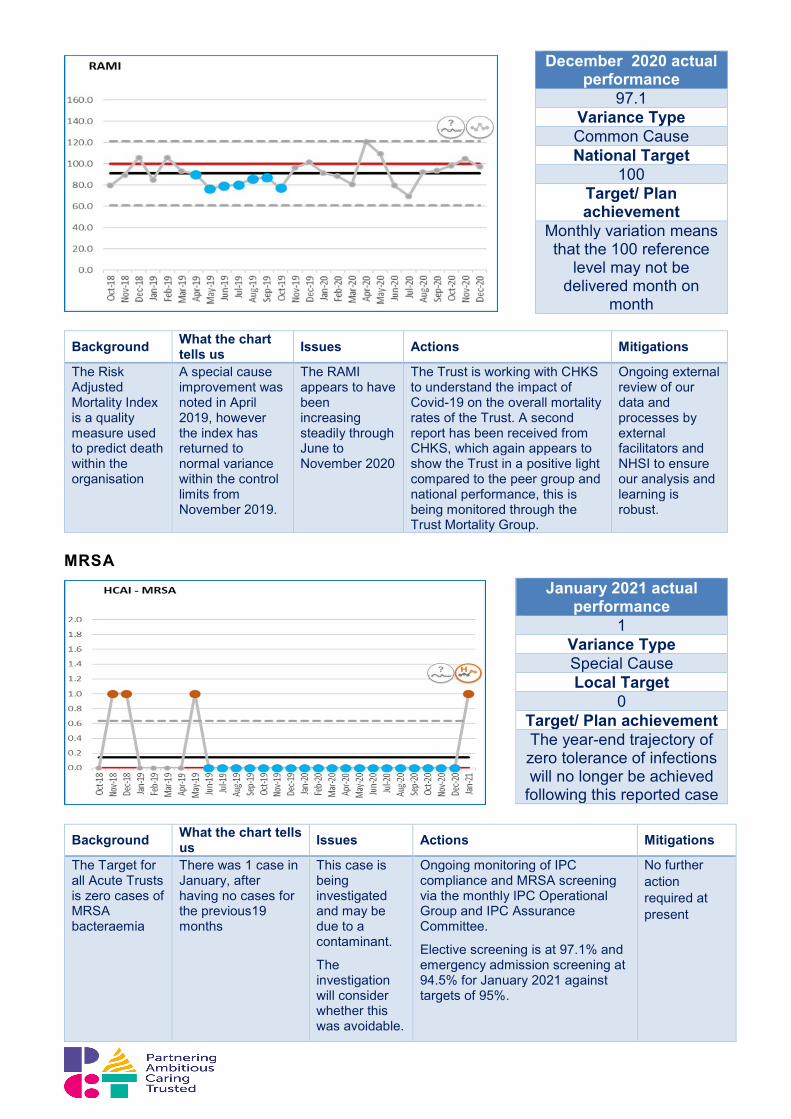
Background What the chart tells us Issues Actions Mitigations
The Risk Adjusted Mortality Index is a quality measure used to predict death within the organisation
A special cause improvement was noted in April 2019, however the index has returned to normal variance within the control limits from November 2019.
The RAMI appears to have been increasing steadily through June to November 2020
The Trust is working with CHKS to understand the impact of Covid-19 on the overall mortality rates of the Trust. A second report has been received from CHKS, which again appears to show the Trust in a positive light compared to the peer group and national performance, this is being monitored through the Trust Mortality Group.
Ongoing external review of our data and processes by external facilitators and NHSI to ensure our analysis and learning is robust.
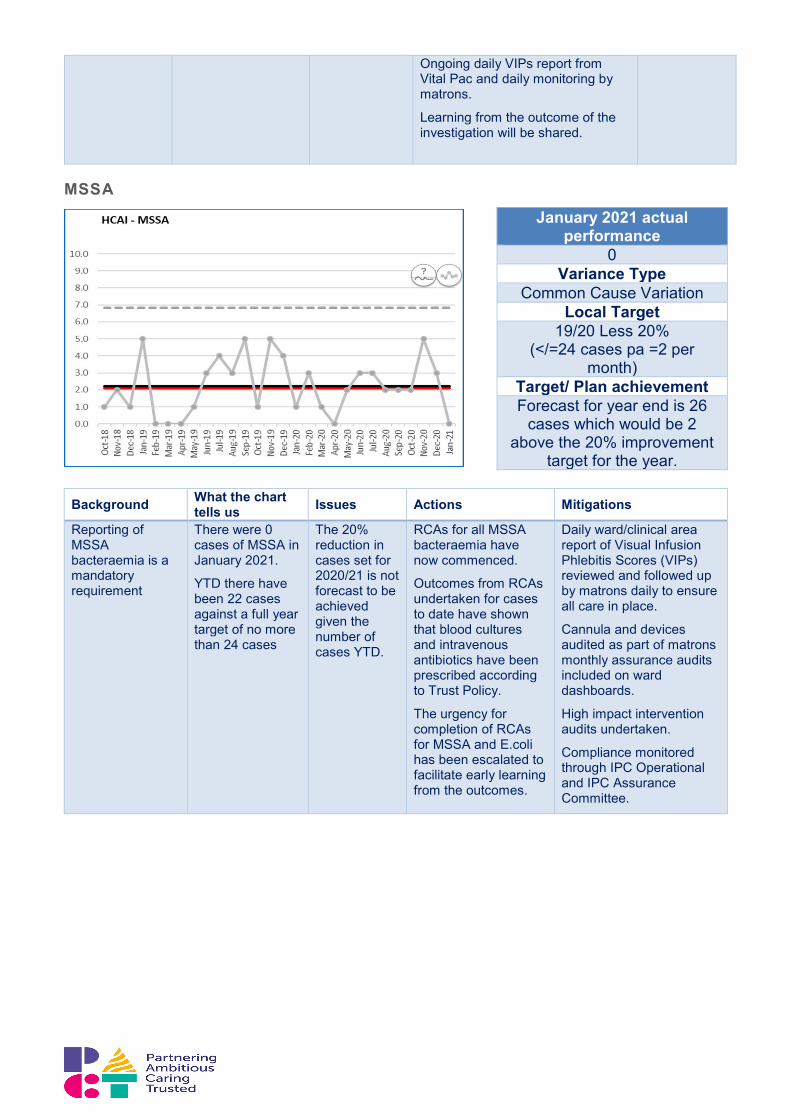
MRSA
Background What the chart tells us Issues Actions Mitigations
The Target for all Acute Trusts is zero cases of MRSA bacteraemia
There was 1 case in January, after having no cases for the previous19 months
This case is being investigated and may be due to a contaminant.
The investigation will consider whether this was avoidable.
Ongoing monitoring of IPC compliance and MRSA screening via the monthly IPC Operational Group and IPC Assurance Committee.
Elective screening is at 97.1% and emergency admission screening at 94.5% for January 2021 against targets of 95%.
No further action required at present
December 2020 actual performance
97.1 Variance Type Common Cause National Target
100 Target/ Plan achievement
Monthly variation means that the 100 reference
level may not be delivered month on
month
January 2021 actual performance
1 Variance Type Special Cause Local Target
0 Target/ Plan achievement The year-end trajectory of zero tolerance of infections will no longer be achieved
following this reported case
Ongoing daily VIPs report from Vital Pac and daily monitoring by matrons.
Learning from the outcome of the investigation will be shared.
MSSA
Background What the chart
tells us Issues Actions Mitigations
Reporting of MSSA bacteraemia is a mandatory requirement
There were 0 cases of MSSA in January 2021.
YTD there have been 22 cases against a full year target of no more than 24 cases
The 20% reduction in cases set for 2020/21 is not forecast to be achieved given the number of cases YTD.
RCAs for all MSSA bacteraemia have now commenced.
Outcomes from RCAs undertaken for cases to date have shown that blood cultures and intravenous antibiotics have been prescribed according to Trust Policy.
The urgency for completion of RCAs for MSSA and E.coli has been escalated to facilitate early learning from the outcomes.
Daily ward/clinical area report of Visual Infusion Phlebitis Scores (VIPs) reviewed and followed up by matrons daily to ensure all care in place.
Cannula and devices audited as part of matrons monthly assurance audits included on ward dashboards.
High impact intervention audits undertaken.
Compliance monitored through IPC Operational and IPC Assurance Committee.
January 2021 actual performance
0 Variance Type
Common Cause Variation Local Target
19/20 Less 20% (</=24 cases pa =2 per
month) Target/ Plan achievement Forecast for year end is 26
cases which would be 2 above the 20% improvement
target for the year.
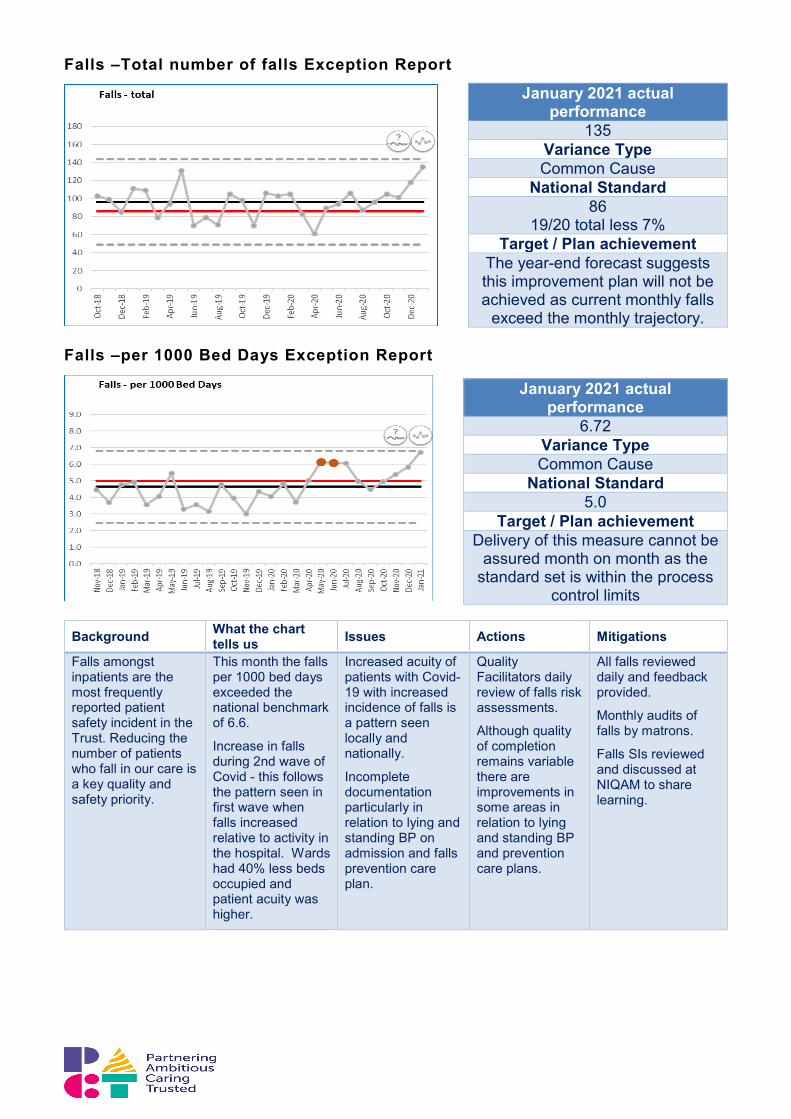
Falls –Total number of falls Exception Report
Falls –per 1000 Bed Days Exception Report
Background What the chart tells us Issues Actions Mitigations
Falls amongst inpatients are the most frequently reported patient safety incident in the Trust. Reducing the number of patients who fall in our care is a key quality and safety priority.
This month the falls per 1000 bed days exceeded the national benchmark of 6.6.
Increase in falls during 2nd wave of Covid - this follows the pattern seen in first wave when falls increased relative to activity in the hospital. Wards had 40% less beds occupied and patient acuity was higher.
Increased acuity of patients with Covid-19 with increased incidence of falls is a pattern seen locally and nationally.
Incomplete documentation particularly in relation to lying and standing BP on admission and falls prevention care plan.
Quality Facilitators daily review of falls risk assessments.
Although quality of completion remains variable there are improvements in some areas in relation to lying and standing BP and prevention care plans.
All falls reviewed daily and feedback provided.
Monthly audits of falls by matrons.
Falls SIs reviewed and discussed at NIQAM to share learning.
January 2021 actual performance
135 Variance Type Common Cause
National Standard 86
19/20 total less 7% Target / Plan achievement
The year-end forecast suggests this improvement plan will not be achieved as current monthly falls
exceed the monthly trajectory.
January 2021 actual performance
6.72 Variance Type Common Cause
National Standard 5.0
Target / Plan achievement Delivery of this measure cannot be
assured month on month as the standard set is within the process
control limits
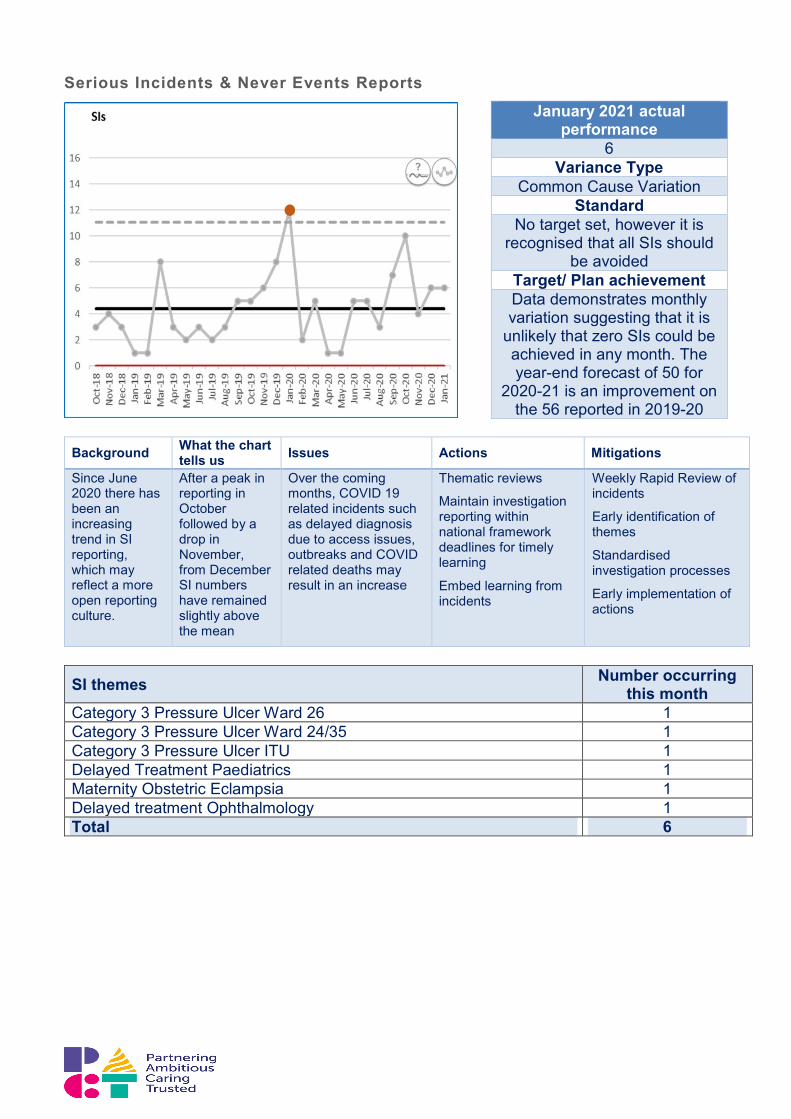
Serious Incidents & Never Events Reports
Background What the chart tells us Issues Actions Mitigations
Since June 2020 there has been an increasing trend in SI reporting, which may reflect a more open reporting culture.
After a peak in reporting in October followed by a drop in November, from December SI numbers have remained slightly above the mean
Over the coming months, COVID 19 related incidents such as delayed diagnosis due to access issues, outbreaks and COVID related deaths may result in an increase
Thematic reviews
Maintain investigation reporting within national framework deadlines for timely learning
Embed learning from incidents
Weekly Rapid Review of incidents
Early identification of themes
Standardised investigation processes
Early implementation of actions
SI themes Number occurring this month
Category 3 Pressure Ulcer Ward 26 1 Category 3 Pressure Ulcer Ward 24/35 1 Category 3 Pressure Ulcer ITU 1 Delayed Treatment Paediatrics 1 Maternity Obstetric Eclampsia 1 Delayed treatment Ophthalmology 1 Total 6
January 2021 actual performance
6 Variance Type
Common Cause Variation Standard
No target set, however it is recognised that all SIs should
be avoided Target/ Plan achievement Data demonstrates monthly variation suggesting that it is
unlikely that zero SIs could be achieved in any month. The year-end forecast of 50 for
2020-21 is an improvement on the 56 reported in 2019-20
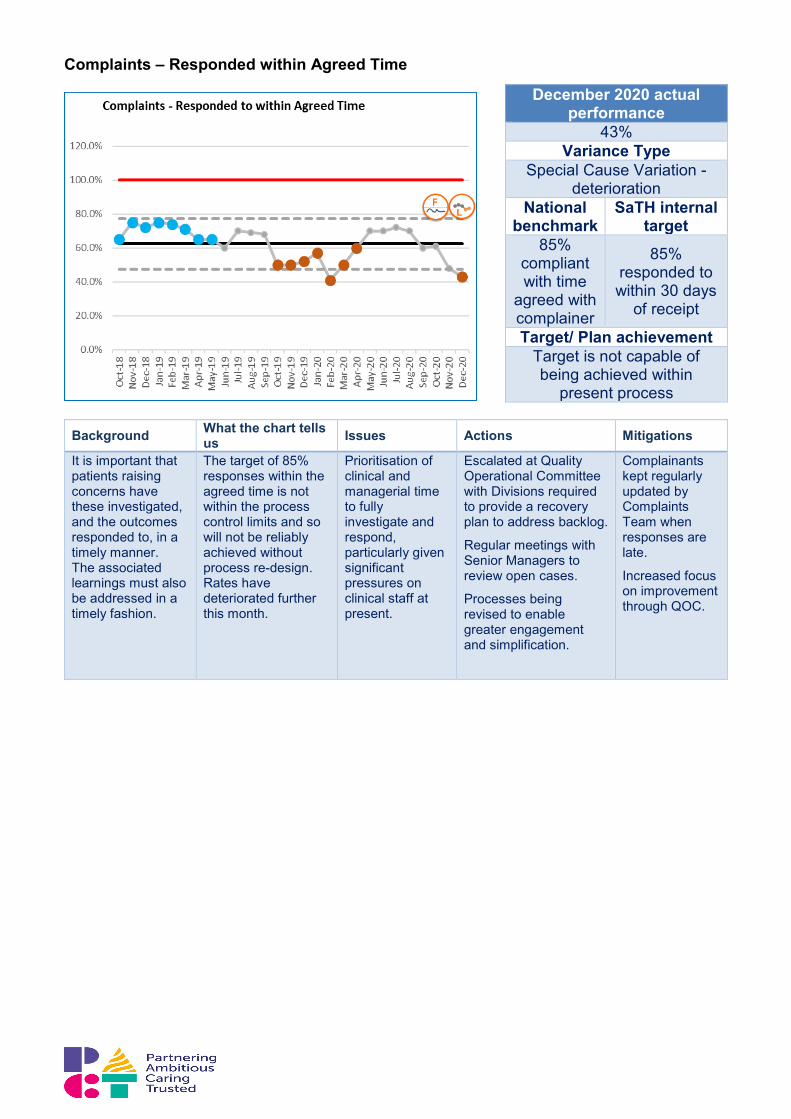
Complaints – Responded within Agreed Time
Background What the chart tells us Issues Actions Mitigations
It is important that patients raising concerns have these investigated, and the outcomes responded to, in a timely manner. The associated learnings must also be addressed in a timely fashion.
The target of 85% responses within the agreed time is not within the process control limits and so will not be reliably achieved without process re-design. Rates have deteriorated further this month.
Prioritisation of clinical and managerial time to fully investigate and respond, particularly given significant pressures on clinical staff at present.
Escalated at Quality Operational Committee with Divisions required to provide a recovery plan to address backlog.
Regular meetings with Senior Managers to review open cases.
Processes being revised to enable greater engagement and simplification.
Complainants kept regularly updated by Complaints Team when responses are late.
Increased focus on improvement through QOC.
December 2020 actual performance
43% Variance Type
Special Cause Variation -deterioration
National benchmark
SaTH internal target
85% compliant with time
agreed with complainer
85% responded to within 30 days
of receipt
Target/ Plan achievement Target is not capable of being achieved within
present process
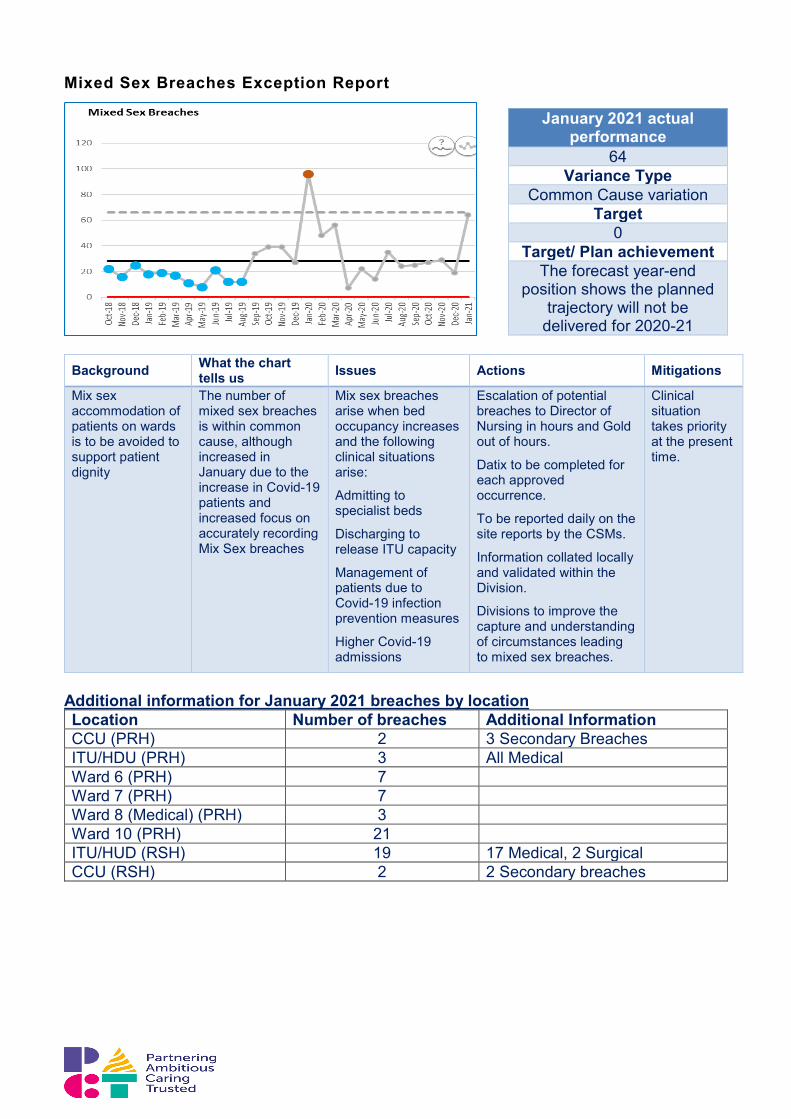
Mixed Sex Breaches Exception Report
Background What the chart tells us Issues Actions Mitigations
Mix sex accommodation of patients on wards is to be avoided to support patient dignity
The number of mixed sex breaches is within common cause, although increased in January due to the increase in Covid-19 patients and increased focus on accurately recording Mix Sex breaches
Mix sex breaches arise when bed occupancy increases and the following clinical situations arise:
Admitting to specialist beds
Discharging to release ITU capacity
Management of patients due to Covid-19 infection prevention measures
Higher Covid-19 admissions
Escalation of potential breaches to Director of Nursing in hours and Gold out of hours.
Datix to be completed for each approved occurrence.
To be reported daily on the site reports by the CSMs.
Information collated locally and validated within the Division.
Divisions to improve the capture and understanding of circumstances leading to mixed sex breaches.
Clinical situation takes priority at the present time.
Additional information for January 2021 breaches by location Location Number of breaches Additional Information CCU (PRH) 2 3 Secondary Breaches ITU/HDU (PRH) 3 All Medical Ward 6 (PRH) 7 Ward 7 (PRH) 7 Ward 8 (Medical) (PRH) 3 Ward 10 (PRH) 21 ITU/HUD (RSH) 19 17 Medical, 2 Surgical CCU (RSH) 2 2 Secondary breaches
January 2021 actual performance
64 Variance Type
Common Cause variation Target
0 Target/ Plan achievement
The forecast year-end position shows the planned
trajectory will not be delivered for 2020-21
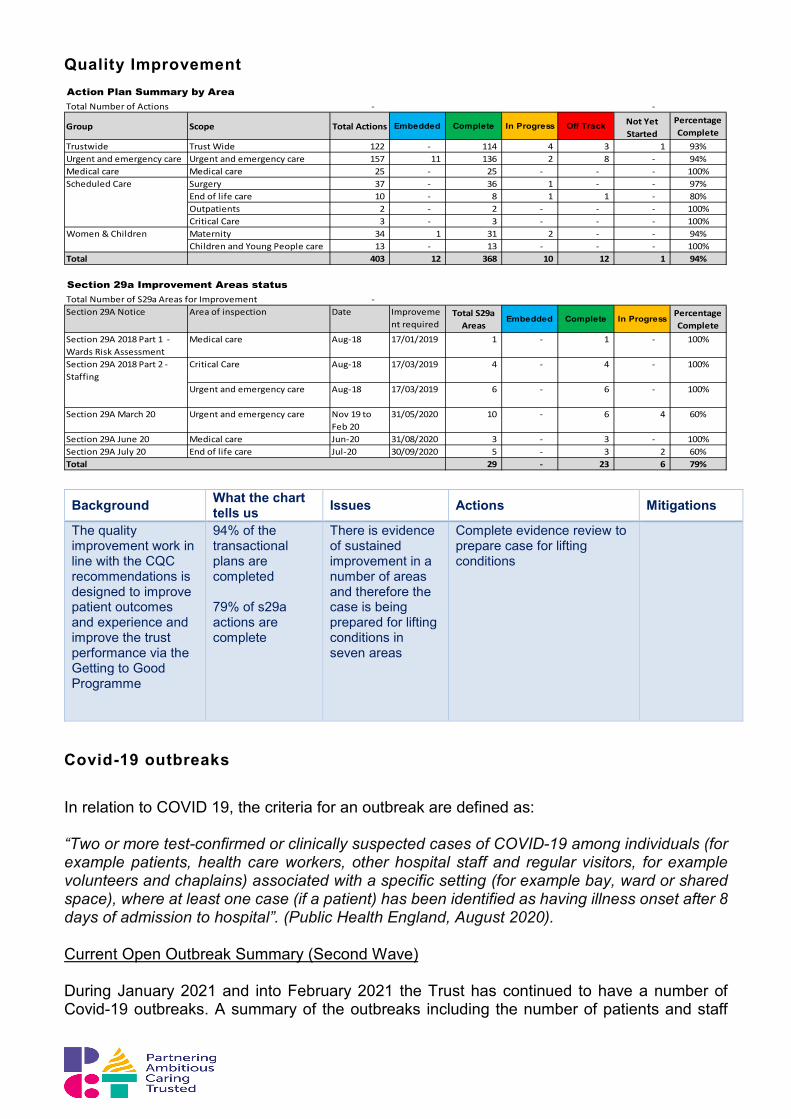
Quality Improvement
Background What the chart tells us Issues Actions Mitigations
The quality improvement work in line with the CQC recommendations is designed to improve patient outcomes and experience and improve the trust performance via the Getting to Good Programme
94% of the transactional plans are completed 79% of s29a actions are complete
There is evidence of sustained improvement in a number of areas and therefore the case is being prepared for lifting conditions in seven areas
Complete evidence review to prepare case for lifting conditions
Covid-19 outbreaks
In relation to COVID 19, the criteria for an outbreak are defined as: “Two or more test-confirmed or clinically suspected cases of COVID-19 among individuals (for example patients, health care workers, other hospital staff and regular visitors, for example volunteers and chaplains) associated with a specific setting (for example bay, ward or shared space), where at least one case (if a patient) has been identified as having illness onset after 8 days of admission to hospital”. (Public Health England, August 2020). Current Open Outbreak Summary (Second Wave) During January 2021 and into February 2021 the Trust has continued to have a number of Covid-19 outbreaks. A summary of the outbreaks including the number of patients and staff
Action Plan Summary by AreaTotal Number of Actions - -
Group Scope Total Actions Embedded Complete In Progress Off Track Not Yet Started
Percentage Complete
Trustwide Trust Wide 122 - 114 4 3 1 93%Urgent and emergency care Urgent and emergency care 157 11 136 2 8 - 94%Medical care Medical care 25 - 25 - - - 100%Scheduled Care Surgery 37 - 36 1 - - 97%Scheduled Care End of life care 10 - 8 1 1 - 80%Scheduled Care Outpatients 2 - 2 - - - 100%Scheduled Care Critical Care 3 - 3 - - - 100%Women & Children Maternity 34 1 31 2 - - 94%Women & Children Children and Young People care 13 - 13 - - - 100%Total 403 12 368 10 12 1 94%
Section 29a Improvement Areas status S29aTotal Number of S29a Areas for Improvement - Off TrackSection 29A Notice Area of inspection Date Improveme
nt required
Total S29a Areas
Embedded Complete In Progress Percentage Complete
Section 29A 2018 Part 1 - Wards Risk Assessment
Medical care Aug-18 17/01/2019 1 - 1 - 100%
Section 29A 2018 Part 2 - Staffing
Critical Care Aug-18 17/03/2019 4 - 4 - 100%
Section 29A 2018 Part 2 - Staffing
Urgent and emergency care Aug-18 17/03/2019 6 - 6 - 100%
Section 29A March 20 Urgent and emergency care Nov 19 to Feb 20
31/05/2020 10 - 6 4 60%
Section 29A June 20 Medical care Jun-20 31/08/2020 3 - 3 - 100%Section 29A July 20 End of life care Jul-20 30/09/2020 5 - 3 2 60%Total 29 - 23 6 79%
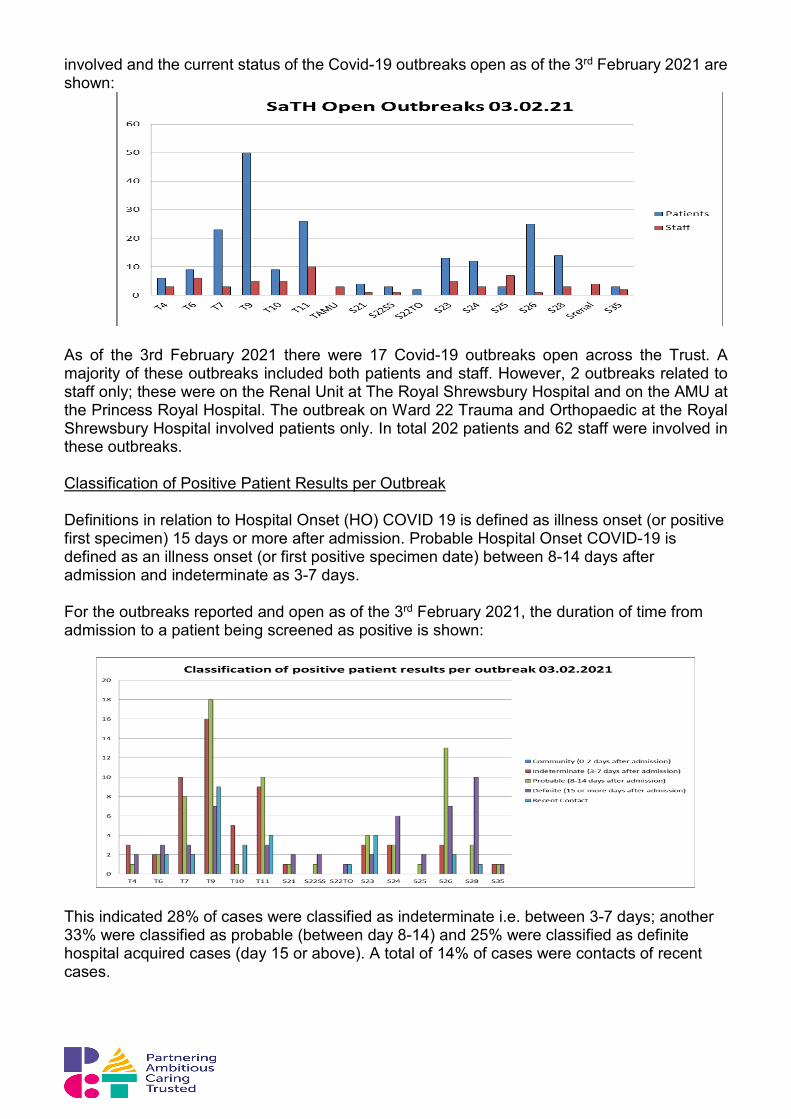
involved and the current status of the Covid-19 outbreaks open as of the 3rd February 2021 are shown:
As of the 3rd February 2021 there were 17 Covid-19 outbreaks open across the Trust. A majority of these outbreaks included both patients and staff. However, 2 outbreaks related to staff only; these were on the Renal Unit at The Royal Shrewsbury Hospital and on the AMU at the Princess Royal Hospital. The outbreak on Ward 22 Trauma and Orthopaedic at the Royal Shrewsbury Hospital involved patients only. In total 202 patients and 62 staff were involved in these outbreaks. Classification of Positive Patient Results per Outbreak Definitions in relation to Hospital Onset (HO) COVID 19 is defined as illness onset (or positive first specimen) 15 days or more after admission. Probable Hospital Onset COVID-19 is defined as an illness onset (or first positive specimen date) between 8-14 days after admission and indeterminate as 3-7 days. For the outbreaks reported and open as of the 3rd February 2021, the duration of time from admission to a patient being screened as positive is shown:
This indicated 28% of cases were classified as indeterminate i.e. between 3-7 days; another 33% were classified as probable (between day 8-14) and 25% were classified as definite hospital acquired cases (day 15 or above). A total of 14% of cases were contacts of recent cases.
Outbreak meetings take place twice weekly and are chaired by the Director of Infection Prevention and Control / Director of Nursing and are attended by key staff across the Trust, CCG, PHE and NHSI/E IPC leads.
Ongoing actions and monitoring in relation to the current outbreaks include:
• daily IPC visits to outbreak areas, • enhanced cleaning, • proactive/ reactive staff & patient screening, • monitoring of compliance with PPE and hand hygiene, • ongoing education and support to ensure patients to wear masks • monitoring to ensure patient Covid-19 swabbing • the installation of plastic protective curtains for use in ED and wards
Closed Outbreak Summary (Second Wave) From October 2020, the Trust has reported a number of Covid-19 outbreaks across both hospital sites which at the time of this report had closed. There were a total of 23 outbreaks. 9 involved staff only, one outbreak involved patients only and the remaining 13 outbreaks involved both patients and wards.

5.0 Covid-19 and Recovery Summary Mr Nigel Lee Chief Operating Officer
• The 3rd wave of Covid-19 intensified during January 2021, resulting in a significant
increase in the number of patients hospitalised, a number of whom required intensive support in our high dependency and ITU areas of both hospital sites. We increased our critical care footprint to 179% and this was staffed partly from within our own Trust and partly with the support of system partners. This meant that we were able to meet the demand for Shropshire residents and also support other Critical Care Units in the region.
• We also increased the capacity for patients requiring non-invasive ventilation to be managed within high-dependency respiratory wards, increasing the oxygen supply and the staffing on these wards. This capacity has prevented further patients requiring critical care, but has been an area that has presented staffing challenges during the period.
• The overall bed occupancy of Covid-19 patients was greater than the peak experienced in the first and second waves of the pandemic, reaching a peak of 165 patients on the 29th January, 2021. To put this in context our original winter plan had assumed 52 beds would be required for Covid-19 positive patients. As a consequence of the scale of the 3rd wave and the extended period of the wave, we have had to take action to release capacity from routine care and fully implement our escalation plan. This has resulted in redeployment of staff from both SaTH, RJAH, Shropcom and the military to support the staffing of our wards and A&E. At the same time we have been effective in rolling out the vaccination programme to the first 4 priority cohorts of the population.
• We have strived to minimise the impact on elective (including cancer) patients by expanding our use of the independent sector at the Nuffield and retaining a low risk green pathway at RSH for as long as possible to treat urgent patients including cancer. Unfortunately, we could not maintain the RSH green pathway into February and have been seeking support from the West Midlands Cancer Hub for patients unsuitable for treatment at the Nuffield. We are moving back into our original critical care footprint from the 22 February, and will re-establish the low risk green pathway, prioritising the surgery of the highest risk patients including patients with cancer.
• We are working with system partners on the de-escalation plan to enable redeployed staff to return to their bases as soon as it is safe to do so, so that other services can recommence as quickly as possible.
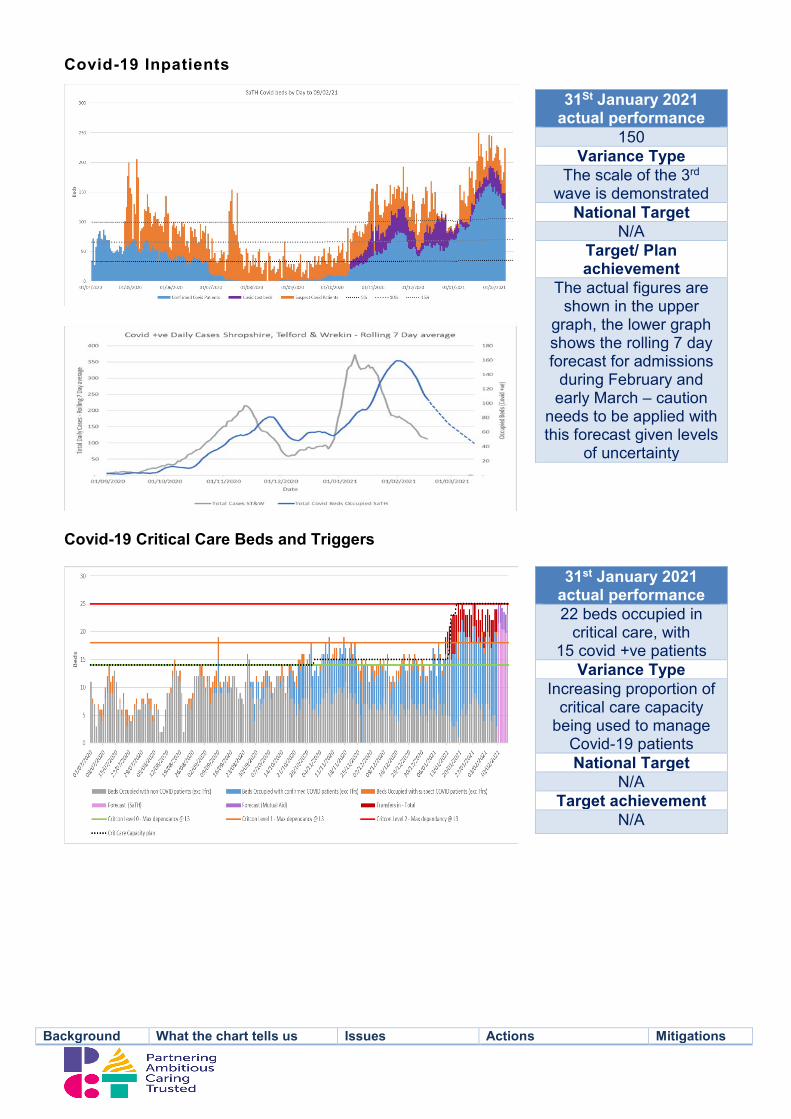
Covid-19 Inpatients
Covid-19 Critical Care Beds and Triggers
Background What the chart tells us Issues Actions Mitigations
31St January 2021 actual performance
150 Variance Type
The scale of the 3rd wave is demonstrated
National Target N/A
Target/ Plan achievement
The actual figures are shown in the upper
graph, the lower graph shows the rolling 7 day forecast for admissions
during February and early March – caution
needs to be applied with this forecast given levels
of uncertainty
31st January 2021 actual performance 22 beds occupied in
critical care, with 15 covid +ve patients
Variance Type Increasing proportion of
critical care capacity being used to manage
Covid-19 patients National Target
N/A Target achievement
N/A
Covid-19 positive, and admitted patients awaiting test results (suspect) are reported daily.
The upper chart demonstrates the daily change in number of admitted covid+ve patients, patients admitted and waiting outcome of swabbing and so being treated as covid-19 suspect and the number of temporary closed beds due to covid-19 outbreaks.
The lower chart shows the daily positive community cases and lag to hospital admissions (note the different scales for community prevalence and hospital admissions on the chart). The chart forecasts the possible continuing reduction in prevalence and hospitalisation.
The Critical Care chart shows the increased provision and occupancy of our critical care beds during January and into February 2021.
Demand on Critical Care and respiratory wards has been particularly high.
Capacity to meet needs of Covid-19 patients, patients awaiting test results on admission (suspect), seasonal urgent care and emergency admissions and urgent elective activity requirements.
Temporary bed reductions due to managing Covid-19 outbreaks.
Implemented system wide plan for escalation.
Redeployed staff to support Critical Care resulting in loss of theatre and endoscopy capacity.
Super Surge capacity implemented for Critical Care from 18.1.21.
Daily Covid-19 safe staffing review.
Outbreak management.
Increased use of IS for elective care.
Suspended routine services to release staff to Covid-19 response.
West Midlands Cancer Hub providing mutual aid for patients not suitable for surgery in the IS.
Surge capacity
System capacity and staffing
Triggers set and action plan for whole system in place
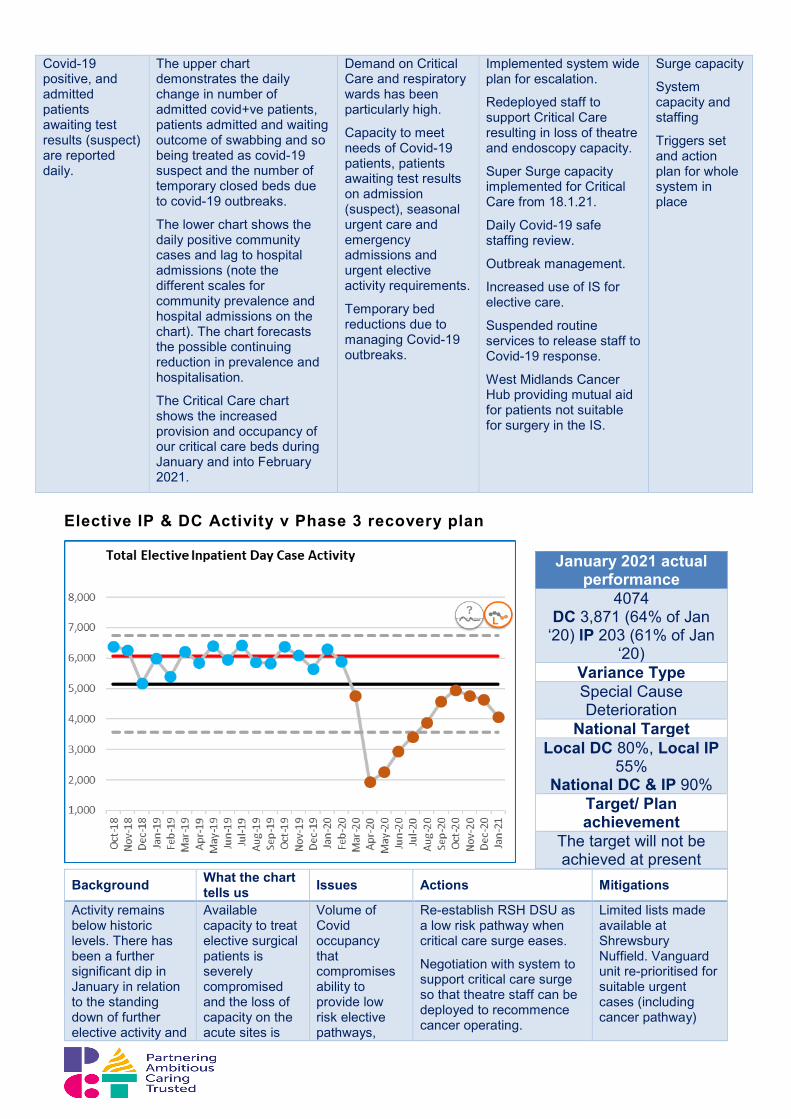
Elective IP & DC Activity v Phase 3 recovery plan
Background What the chart
tells us Issues Actions Mitigations
Activity remains below historic levels. There has been a further significant dip in January in relation to the standing down of further elective activity and
Available capacity to treat elective surgical patients is severely compromised and the loss of capacity on the acute sites is
Volume of Covid occupancy that compromises ability to provide low risk elective pathways,
Re-establish RSH DSU as a low risk pathway when critical care surge eases.
Negotiation with system to support critical care surge so that theatre staff can be deployed to recommence cancer operating.
Limited lists made available at Shrewsbury Nuffield. Vanguard unit re-prioritised for suitable urgent cases (including cancer pathway)
January 2021 actual performance
4074 DC 3,871 (64% of Jan
‘20) IP 203 (61% of Jan ‘20)
Variance Type Special Cause Deterioration
National Target Local DC 80%, Local IP
55% National DC & IP 90%
Target/ Plan achievement
The target will not be achieved at present
conversion of the low risk pathway (DSU) at RSH to support critical care surge and at PRH to support medical escalation
not offset by that made available by the System (around 14 lists / week at Shrewsbury Nuffield as at end January)
volume of critical care surge that requires theatre staff to be redeployed and further areas to be occupied as quasi critical care capacity
De-escalate out of PRH DSU to enable elective programme to restart.
Negotiation with System to support more Nuffield capacity being made available (20 lists / week by end Feb)
Negotiation with system to support PL2 patient placement in orthopaedics with RJAH.
Additional CEPOD operating established for super urgent time-critical patients (with enhanced patient consent as no low risk pathway available) – some vascular and time critical Ophthalmology.
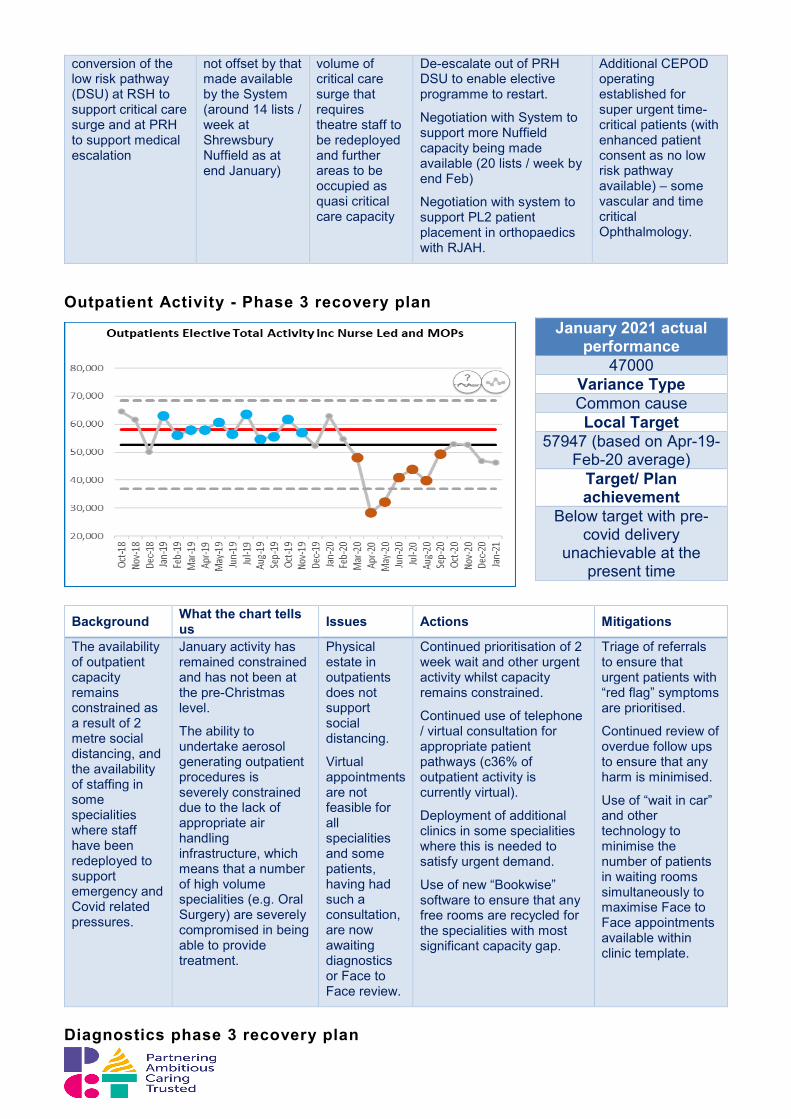
Outpatient Activity - Phase 3 recovery plan
Background What the chart tells us Issues Actions Mitigations
The availability of outpatient capacity remains constrained as a result of 2 metre social distancing, and the availability of staffing in some specialities where staff have been redeployed to support emergency and Covid related pressures.
January activity has remained constrained and has not been at the pre-Christmas level.
The ability to undertake aerosol generating outpatient procedures is severely constrained due to the lack of appropriate air handling infrastructure, which means that a number of high volume specialities (e.g. Oral Surgery) are severely compromised in being able to provide treatment.
Physical estate in outpatients does not support social distancing.
Virtual appointments are not feasible for all specialities and some patients, having had such a consultation, are now awaiting diagnostics or Face to Face review.
Continued prioritisation of 2 week wait and other urgent activity whilst capacity remains constrained.
Continued use of telephone / virtual consultation for appropriate patient pathways (c36% of outpatient activity is currently virtual).
Deployment of additional clinics in some specialities where this is needed to satisfy urgent demand.
Use of new “Bookwise” software to ensure that any free rooms are recycled for the specialities with most significant capacity gap.
Triage of referrals to ensure that urgent patients with “red flag” symptoms are prioritised.
Continued review of overdue follow ups to ensure that any harm is minimised.
Use of “wait in car” and other technology to minimise the number of patients in waiting rooms simultaneously to maximise Face to Face appointments available within clinic template.
Diagnostics phase 3 recovery plan
January 2021 actual performance
47000 Variance Type Common cause Local Target
57947 (based on Apr-19-Feb-20 average)
Target/ Plan achievement
Below target with pre-covid delivery
unachievable at the present time
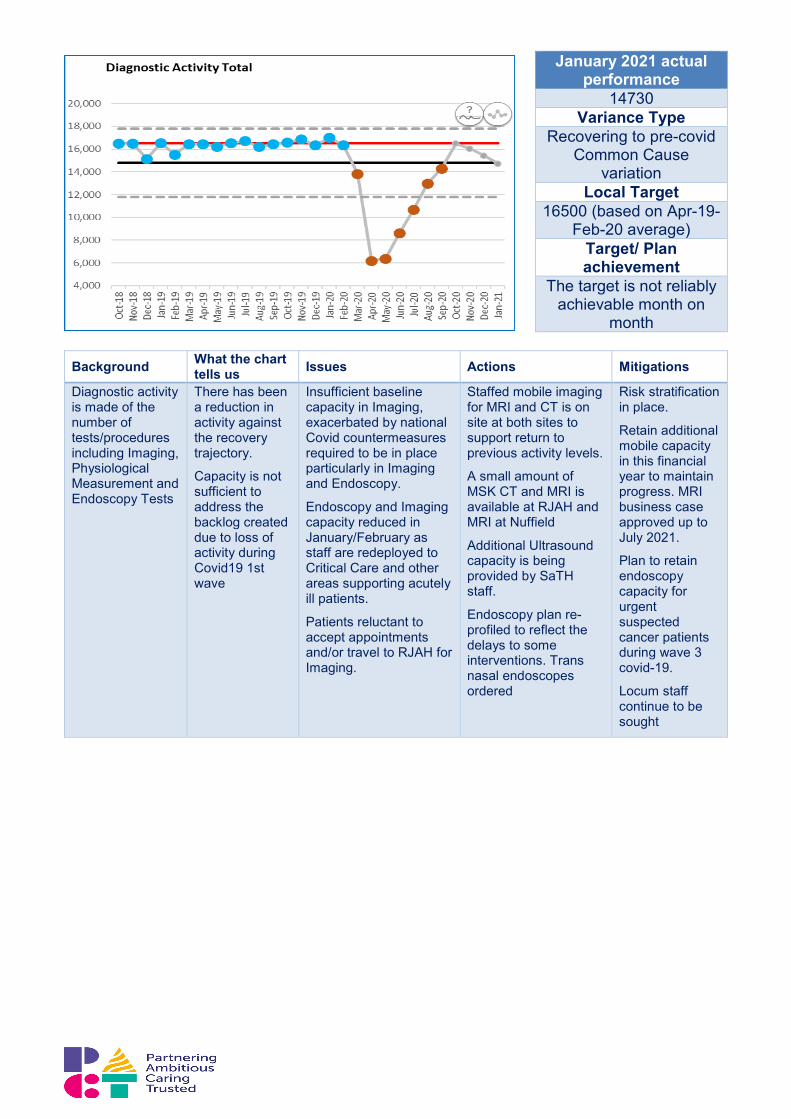
Background What the chart tells us Issues Actions Mitigations
Diagnostic activity is made of the number of tests/procedures including Imaging, Physiological Measurement and Endoscopy Tests
There has been a reduction in activity against the recovery trajectory.
Capacity is not sufficient to address the backlog created due to loss of activity during Covid19 1st wave
Insufficient baseline capacity in Imaging, exacerbated by national Covid countermeasures required to be in place particularly in Imaging and Endoscopy.
Endoscopy and Imaging capacity reduced in January/February as staff are redeployed to Critical Care and other areas supporting acutely ill patients.
Patients reluctant to accept appointments and/or travel to RJAH for Imaging.
Staffed mobile imaging for MRI and CT is on site at both sites to support return to previous activity levels.
A small amount of MSK CT and MRI is available at RJAH and MRI at Nuffield
Additional Ultrasound capacity is being provided by SaTH staff.
Endoscopy plan re-profiled to reflect the delays to some interventions. Trans nasal endoscopes ordered
Risk stratification in place.
Retain additional mobile capacity in this financial year to maintain progress. MRI business case approved up to July 2021.
Plan to retain endoscopy capacity for urgent suspected cancer patients during wave 3 covid-19.
Locum staff continue to be sought
January 2021 actual performance
14730 Variance Type
Recovering to pre-covid Common Cause
variation Local Target
16500 (based on Apr-19-Feb-20 average)
Target/ Plan achievement
The target is not reliably achievable month on
month
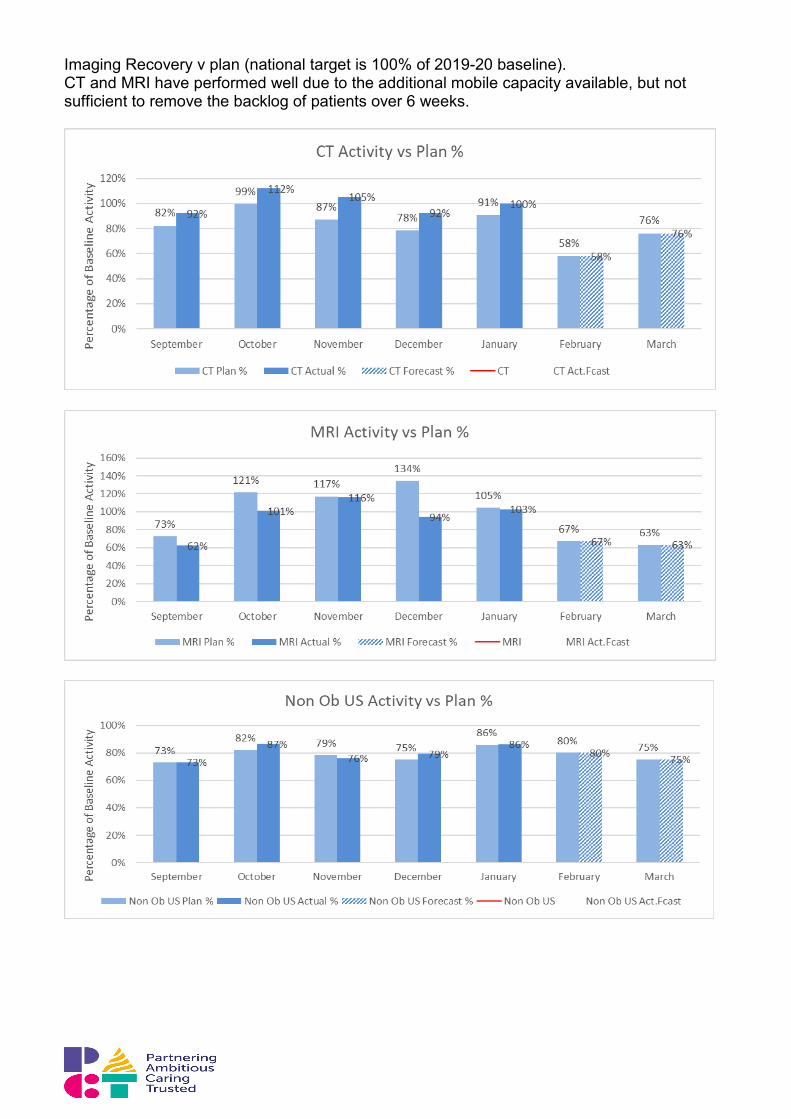
Imaging Recovery v plan (national target is 100% of 2019-20 baseline). CT and MRI have performed well due to the additional mobile capacity available, but not sufficient to remove the backlog of patients over 6 weeks.
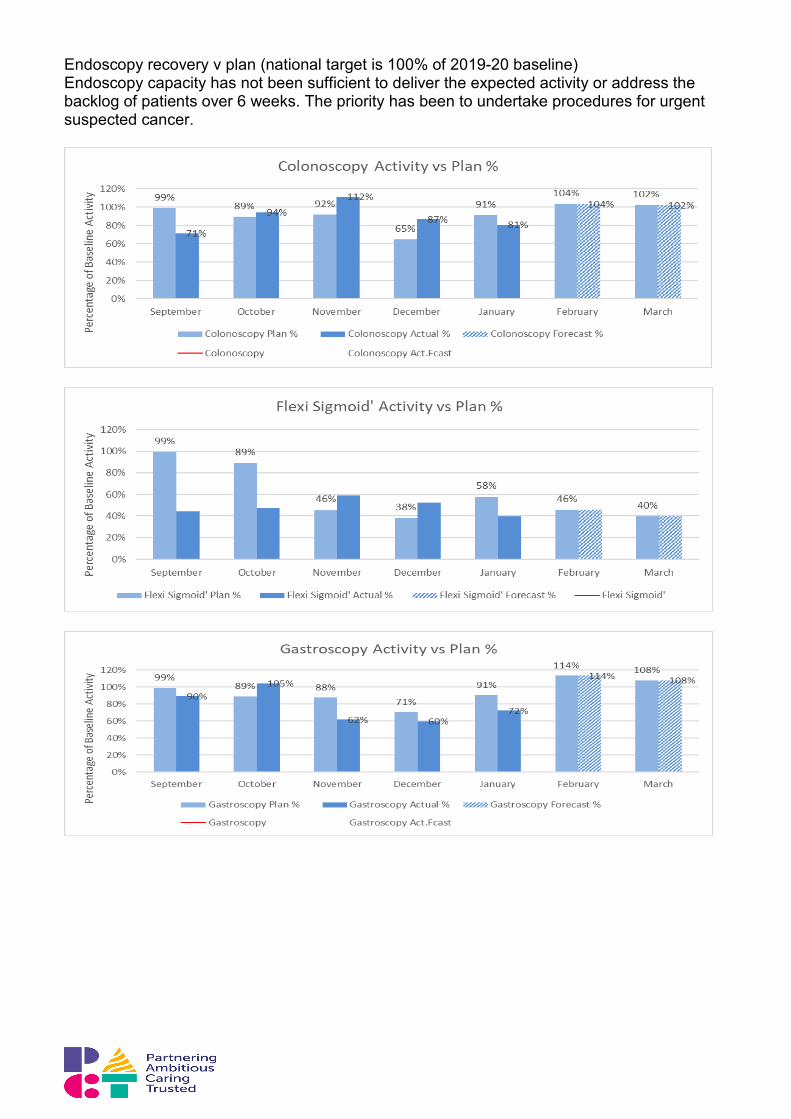
Endoscopy recovery v plan (national target is 100% of 2019-20 baseline) Endoscopy capacity has not been sufficient to deliver the expected activity or address the backlog of patients over 6 weeks. The priority has been to undertake procedures for urgent suspected cancer.
Non-Elective Activity
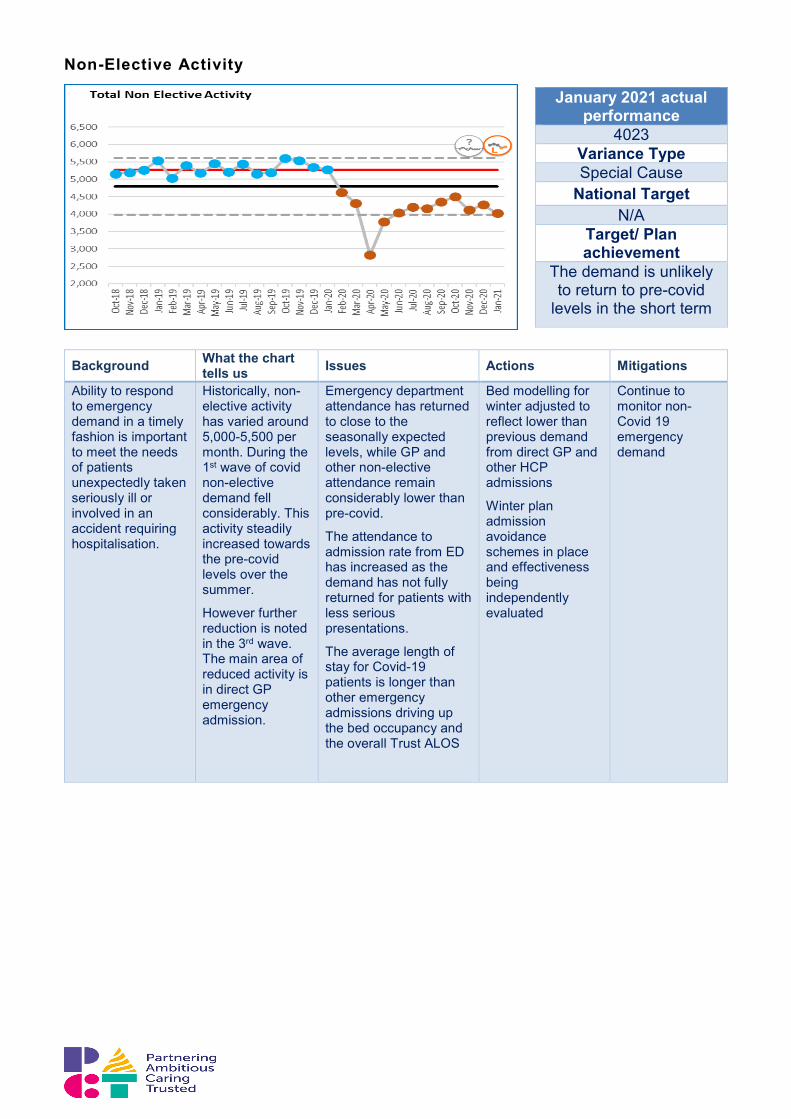
Background What the chart tells us Issues Actions Mitigations
Ability to respond to emergency demand in a timely fashion is important to meet the needs of patients unexpectedly taken seriously ill or involved in an accident requiring hospitalisation.
Historically, non-elective activity has varied around 5,000-5,500 per month. During the 1st wave of covid non-elective demand fell considerably. This activity steadily increased towards the pre-covid levels over the summer.
However further reduction is noted in the 3rd wave. The main area of reduced activity is in direct GP emergency admission.
Emergency department attendance has returned to close to the seasonally expected levels, while GP and other non-elective attendance remain considerably lower than pre-covid.
The attendance to admission rate from ED has increased as the demand has not fully returned for patients with less serious presentations.
The average length of stay for Covid-19 patients is longer than other emergency admissions driving up the bed occupancy and the overall Trust ALOS
Bed modelling for winter adjusted to reflect lower than previous demand from direct GP and other HCP admissions
Winter plan admission avoidance schemes in place and effectiveness being independently evaluated
Continue to monitor non-Covid 19 emergency demand
January 2021 actual performance
4023 Variance Type Special Cause
National Target N/A
Target/ Plan achievement
The demand is unlikely to return to pre-covid
levels in the short term
6.0 Operational Summary Mr Nigel Lee Chief Operating Officer
• The delivery of unscheduled care targets has been challenging during January due
to the rise in overall Covid demand combined with the challenge of segmenting patients suspected of and confirmed with Covid-19 from other patients. The average length of stay has been rising and despite the work of the Multi-Agency Discharge Events held in January the overall flow has not improved. This has led to delays in patients being admitted from the emergency department. This has meant that the emergency department occupancy has been high and caused delays in patients being handed over from the ambulance service. Clinical staff have worked hard to ensure that patients are assessed and managed safely during their waits. The overall numbers of handover delays has been slightly less than last year, but the length of some delays have been considerable. Whilst SATH has seen 12 hour breaches in the month, these have been significantly less than January 2020 (134 in Jan 2021 versus 411 in Jan 2020).
• It is good to see the improvement in the quality of care indicators within ED,
providing assurance of improved recognition of Sepsis, reduction in Paediatric triage time (which is now consistently below the 15 minute target) and a reduction in the patients who have left without being seen. Early data also shows the benefits we are seeing from the initiatives implemented to support the peak winter period, such as the therapies at the front door and the opening of the SDEC.
• Wards across both sites have been affected by outbreaks and beds with bays and
sometimes wards closed as a result. Our discharge lounges can also only support covid negative patients, which has also restricted flow on a number of occasions.
• Elective admissions have been reduced due to the impact of Covid-19 on our bed
and theatre capacity. Assistance has been requested from the West Midlands Cancer Hub to support the surgical treatment of patients clinically unsuitable for treatment in the Nuffield. Other cancer and urgent surgery is being undertaken via 10 operating lists per week at the Nuffield and through continuing use of the Vanguard (the level of theatre lists is planned to expand at the Nuffield during February, rising to 20 lists per week by week commencing 22 Feb). However, this is a far lower level of activity than previously undertaken and cannot accommodate the full mix of patients given the lack of intensive care and theatres facilities, and critical care escalation.
• During February we will be returning to our previous footprints for Critical Care with
funding provided to permanently increase the number of critical care beds by 2 to 16. We will continue to work at surge capacity (up to 25) in critical care whilst demand is at this level. As demand reduces, we will seek to re-establish the low risk and day surgery unit at the earliest opportunity to increase capacity for P2 patients who require surgery within a 4 week window. Our clinical teams are continuing to review patient clinical priorities to ensure the available capacity can be allocated to those patients with greatest clinical need.
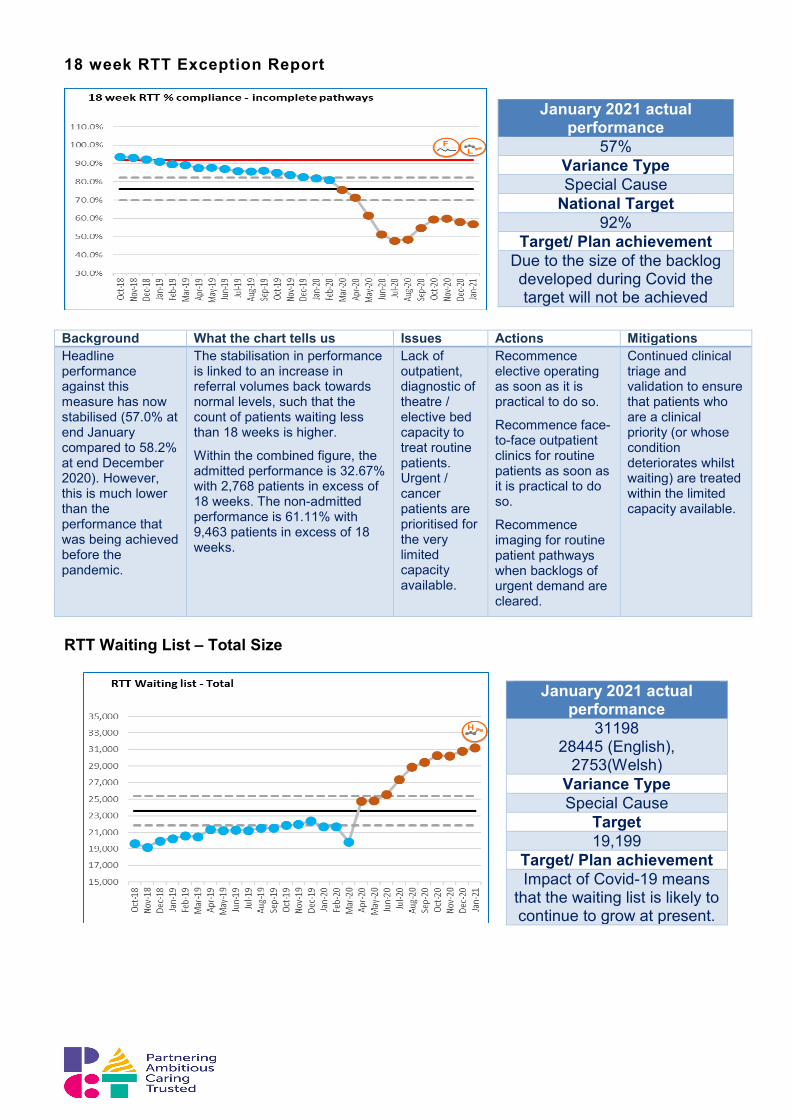
18 week RTT Exception Report
RTT Waiting List – Total Size
January 2021 actual performance
57% Variance Type Special Cause
National Target 92%
Target/ Plan achievement Due to the size of the backlog developed during Covid the target will not be achieved
Background What the chart tells us Issues Actions Mitigations Headline performance against this measure has now stabilised (57.0% at end January compared to 58.2% at end December 2020). However, this is much lower than the performance that was being achieved before the pandemic.
The stabilisation in performance is linked to an increase in referral volumes back towards normal levels, such that the count of patients waiting less than 18 weeks is higher.
Within the combined figure, the admitted performance is 32.67% with 2,768 patients in excess of 18 weeks. The non-admitted performance is 61.11% with 9,463 patients in excess of 18 weeks.
Lack of outpatient, diagnostic of theatre / elective bed capacity to treat routine patients. Urgent / cancer patients are prioritised for the very limited capacity available.
Recommence elective operating as soon as it is practical to do so.
Recommence face-to-face outpatient clinics for routine patients as soon as it is practical to do so.
Recommence imaging for routine patient pathways when backlogs of urgent demand are cleared.
Continued clinical triage and validation to ensure that patients who are a clinical priority (or whose condition deteriorates whilst waiting) are treated within the limited capacity available.
January 2021 actual performance
31198 28445 (English),
2753(Welsh) Variance Type Special Cause
Target 19,199
Target/ Plan achievement Impact of Covid-19 means
that the waiting list is likely to continue to grow at present.
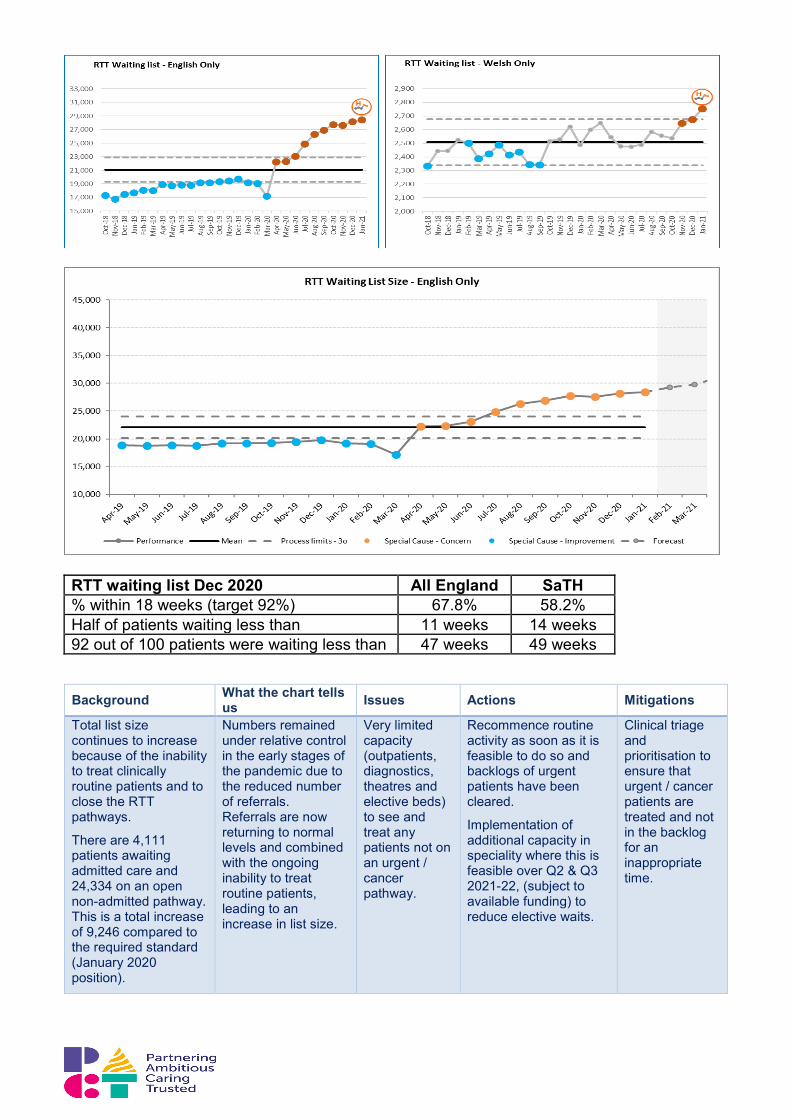
RTT waiting list Dec 2020 All England SaTH % within 18 weeks (target 92%) 67.8% 58.2% Half of patients waiting less than 11 weeks 14 weeks 92 out of 100 patients were waiting less than 47 weeks 49 weeks
Background What the chart tells us Issues Actions Mitigations
Total list size continues to increase because of the inability to treat clinically routine patients and to close the RTT pathways.
There are 4,111 patients awaiting admitted care and 24,334 on an open non-admitted pathway. This is a total increase of 9,246 compared to the required standard (January 2020 position).
Numbers remained under relative control in the early stages of the pandemic due to the reduced number of referrals. Referrals are now returning to normal levels and combined with the ongoing inability to treat routine patients, leading to an increase in list size.
Very limited capacity (outpatients, diagnostics, theatres and elective beds) to see and treat any patients not on an urgent / cancer pathway.
Recommence routine activity as soon as it is feasible to do so and backlogs of urgent patients have been cleared.
Implementation of additional capacity in speciality where this is feasible over Q2 & Q3 2021-22, (subject to available funding) to reduce elective waits.
Clinical triage and prioritisation to ensure that urgent / cancer patients are treated and not in the backlog for an inappropriate time.
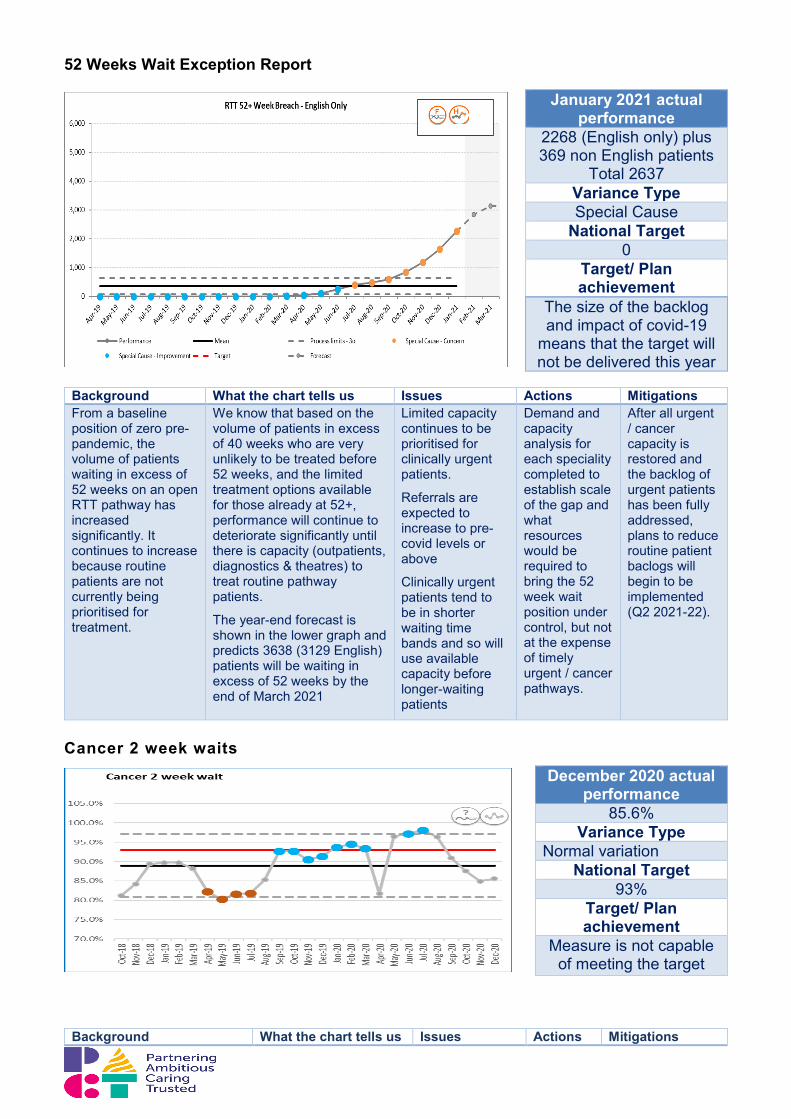
52 Weeks Wait Exception Report
Cancer 2 week waits
Background What the chart tells us Issues Actions Mitigations
January 2021 actual performance
2268 (English only) plus 369 non English patients
Total 2637 Variance Type Special Cause
National Target 0
Target/ Plan achievement
The size of the backlog and impact of covid-19
means that the target will not be delivered this year
Background What the chart tells us Issues Actions Mitigations From a baseline position of zero pre-pandemic, the volume of patients waiting in excess of 52 weeks on an open RTT pathway has increased significantly. It continues to increase because routine patients are not currently being prioritised for treatment.
We know that based on the volume of patients in excess of 40 weeks who are very unlikely to be treated before 52 weeks, and the limited treatment options available for those already at 52+, performance will continue to deteriorate significantly until there is capacity (outpatients, diagnostics & theatres) to treat routine pathway patients.
The year-end forecast is shown in the lower graph and predicts 3638 (3129 English) patients will be waiting in excess of 52 weeks by the end of March 2021
Limited capacity continues to be prioritised for clinically urgent patients.
Referrals are expected to increase to pre-covid levels or above
Clinically urgent patients tend to be in shorter waiting time bands and so will use available capacity before longer-waiting patients
Demand and capacity analysis for each speciality completed to establish scale of the gap and what resources would be required to bring the 52 week wait position under control, but not at the expense of timely urgent / cancer pathways.
After all urgent / cancer capacity is restored and the backlog of urgent patients has been fully addressed, plans to reduce routine patient baclogs will begin to be implemented (Q2 2021-22).
December 2020 actual performance
85.6% Variance Type
Normal variation National Target
93% Target/ Plan achievement
Measure is not capable of meeting the target
This measure is a key indicator for the organisation's performance against the national Cancer Waiting Times guidance ensuring wherever possible that any patient referred by their GP with suspected cancer has a first appointment within 14 days
The present system is unlikely to deliver the target reliably each month. Compliance with this target has fluctuated since April 2019 – attributed to low levels of capacity within the breast service.
Capacity issues in the breast specialty have impacted negatively on SaTH’s overall 2WW performance
Extra capacity being added to the Breast 2WW clinics
Implementation of revised 2WW Breast Referral Proformas
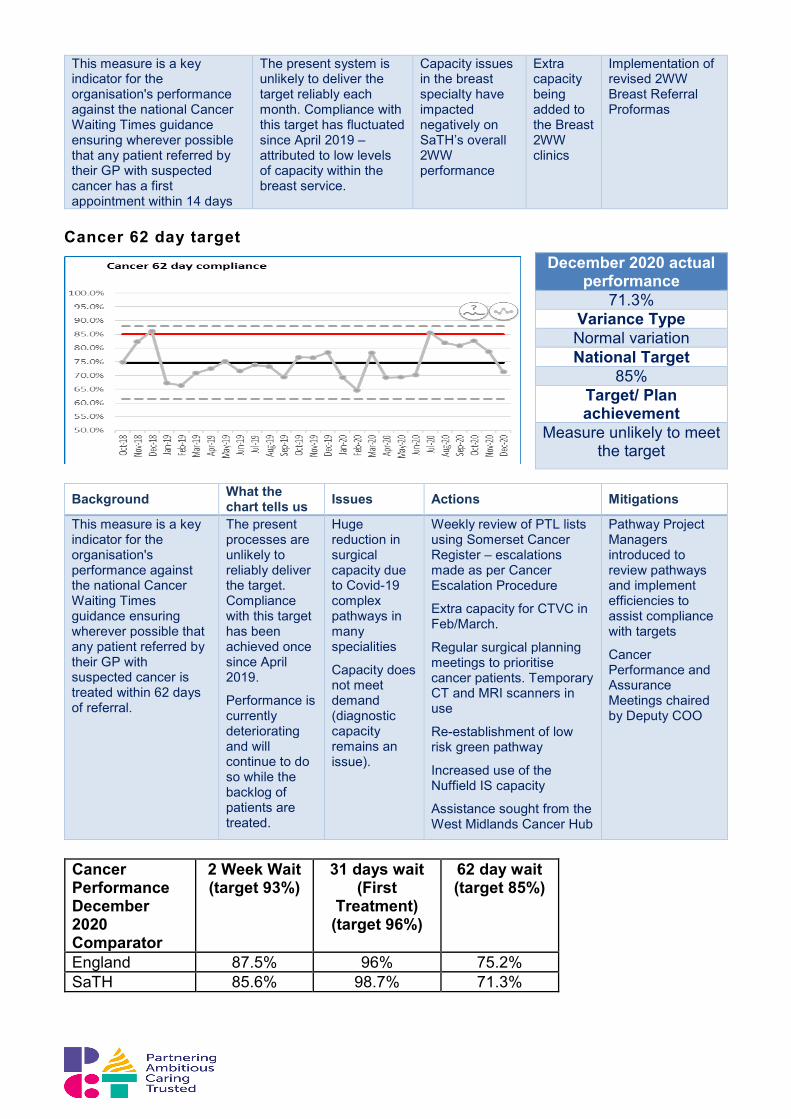
Cancer 62 day target
Background What the chart tells us Issues Actions Mitigations
This measure is a key indicator for the organisation's performance against the national Cancer Waiting Times guidance ensuring wherever possible that any patient referred by their GP with suspected cancer is treated within 62 days of referral.
The present processes are unlikely to reliably deliver the target. Compliance with this target has been achieved once since April 2019.
Performance is currently deteriorating and will continue to do so while the backlog of patients are treated.
Huge reduction in surgical capacity due to Covid-19 complex pathways in many specialities
Capacity does not meet demand (diagnostic capacity remains an issue).
Weekly review of PTL lists using Somerset Cancer Register – escalations made as per Cancer Escalation Procedure
Extra capacity for CTVC in Feb/March.
Regular surgical planning meetings to prioritise cancer patients. Temporary CT and MRI scanners in use
Re-establishment of low risk green pathway
Increased use of the Nuffield IS capacity
Assistance sought from the West Midlands Cancer Hub
Pathway Project Managers introduced to review pathways and implement efficiencies to assist compliance with targets
Cancer Performance and Assurance Meetings chaired by Deputy COO
Cancer Performance December 2020 Comparator
2 Week Wait (target 93%)
31 days wait (First
Treatment) (target 96%)
62 day wait (target 85%)
England 87.5% 96% 75.2% SaTH 85.6% 98.7% 71.3%
December 2020 actual performance
71.3% Variance Type Normal variation National Target
85% Target/ Plan achievement
Measure unlikely to meet the target

DM01 Diagnostic over 6 week waits
Background What the chart tells us Issues Actions Mitigations
DM01 is the national standard for non-urgent diagnostics completed within 6w of the referral
The overall standard has not been achieved this year.
Special Cause variation is currently related
Progress has been interrupted by our response to the 3rd wave surge. This is expected to continue into February.
Backlog created in diagnostic services
Imaging pod will be available from July 1st 2021 (delayed due to supplier constraints).
Mobile capacity on site for CT and MRI, plus small amount of additional weekly capacity at RJAH and
Risk stratification remains in place.
Priority is allocated to the most clinically urgent patients including cancer.
Business case approved for
January 2021 actual performance
53.5% Variance Type Special Cause
National Target 99%
Target/ Plan achievement
Target will not be delivered with present capacity constraints in
some diagnostic services
January 2021 actual performance
3700 Variance Type Special Cause
National Target 0
Target/ Plan achievement
Target will not be delivered with present capacity constraints in
some diagnostic services
predominantly to Covid-19.
from 1st Wave continuing.
Reluctance of patients to travel to RJAH and generally to accept MRI and Ultrasound appointments
Nuffield; 3rd party contracted to provide additional ultrasound capacity
additional mobile MRI capacity up to July 2021.
Progress with CT is dependent on availability of mobile CT continuing into next financial year
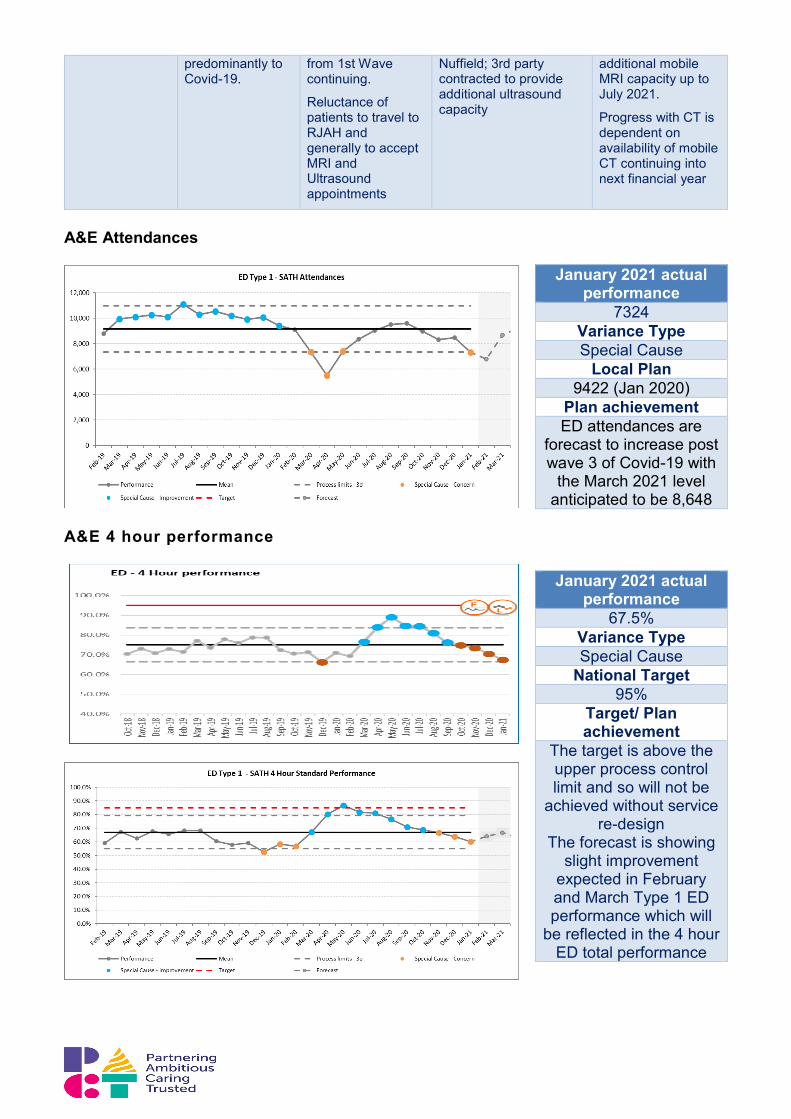
A&E Attendances
A&E 4 hour performance
January 2021 actual performance
7324 Variance Type Special Cause
Local Plan 9422 (Jan 2020)
Plan achievement ED attendances are
forecast to increase post wave 3 of Covid-19 with
the March 2021 level anticipated to be 8,648
January 2021 actual performance
67.5% Variance Type Special Cause
National Target 95%
Target/ Plan achievement
The target is above the upper process control limit and so will not be
achieved without service re-design
The forecast is showing slight improvement
expected in February and March Type 1 ED performance which will
be reflected in the 4 hour ED total performance

ED Majors Performance
Background What the chart tells us Issues Actions Mitigations
The national target is for all patients to be seen treated, admitted, transferred or discharged within 4 hours of arrival at the emergency department
ED 4 hour performance – 67.5% is showing special cause effect following eight consecutive months of decline.
The previous improved performance is due to fewer ED attendances during wave 1 of Covid-19 and was not typical of the previous performance
ED majors performance is the key driver to ED 4 hour perfomance delivery
Continued challenge in managing Covid-19 high risk and medium pathways
Known shortfall in bedded capacity to meet demand impacts upon flow from departments to inpatient areas
Reduction in minors attendances has had an impact on overall 4 hour performance this month
Continued daily oversight and management of site by Divisions
Internal improvement plan and actions in place to address internal flow issues
Capacity gap escalated to regulators with proposal for additional resource to address shortfall to improve performance going forward
Continued drive to divert to medical SDEC wherever possible
Increased focus on morning discharges
‘Safe Today’ process in place for EDs to rapidly identify and mitigate any potential risks associated with long waits in departments
January 2021 actual performance
95.3% Variance Type Common Cause
Variation National Target
95% Target/ Plan achievement
Delivered for last 3 months
Regional performance information (w/e
4.2.21) shows SaTH is one of four trusts
delivering performance of below 70%

ED Time to Initial Assessment - Children
Background What the chart tells us Issues Actions Mitigations
Time to initial assessment is a patient safety indicator
The system is showing improving special cause variation which has now been sustained for 12 months.
Process limits will now be reset around this sustained improvement
Sustained improvement required
Paediatric staffing plan developed and in process of being implemented to ensure sufficient capacity of appropriately skilled staff available to meet demand
ED IT system implementation – will further improve recording and reporting of this key metric
Daily audits undertaken to maintain oversight of process and metric for paediatrics
Continued focus on ED systems and processes with support from ECIST
ED Time to Initial Assessment - Adult
January 2021 actual performance
10 mins Variance Type Special Cause
National Target 15 mins
Target/ Plan achievement
Target is being consistently achieved
month on month
January 2021 actual performance
19 Variance Type Common Cause National Target
15 Target/ Plan achievement
Performance remains worse than target but
improving

ED Overall Time to Initial Assessment
Background What the chart tells us Issues Actions Mitigations
Time to initial assessment is a patient safety indicator.
Performance against this metric is slightly worse than the overall target
The % leaving the department without being seen has significantly improved at both EDs and is better than the <5% target
Capacity constraints within the departments especially when patients arrive in close time intervals
Continued recruitment into vacant ED posts will allow resilience in planning rota’s to support expected peak arrival times and further improve initial assessment times
Think 111 implemented on a phased approach to drive patients to pre booking walk in appointments where appropriate which can be staggered
Internal escalation processes
January 2021 actual performance
18 Variance Type Common Cause National Target
15 Target/ Plan achievement
Performance remains above target
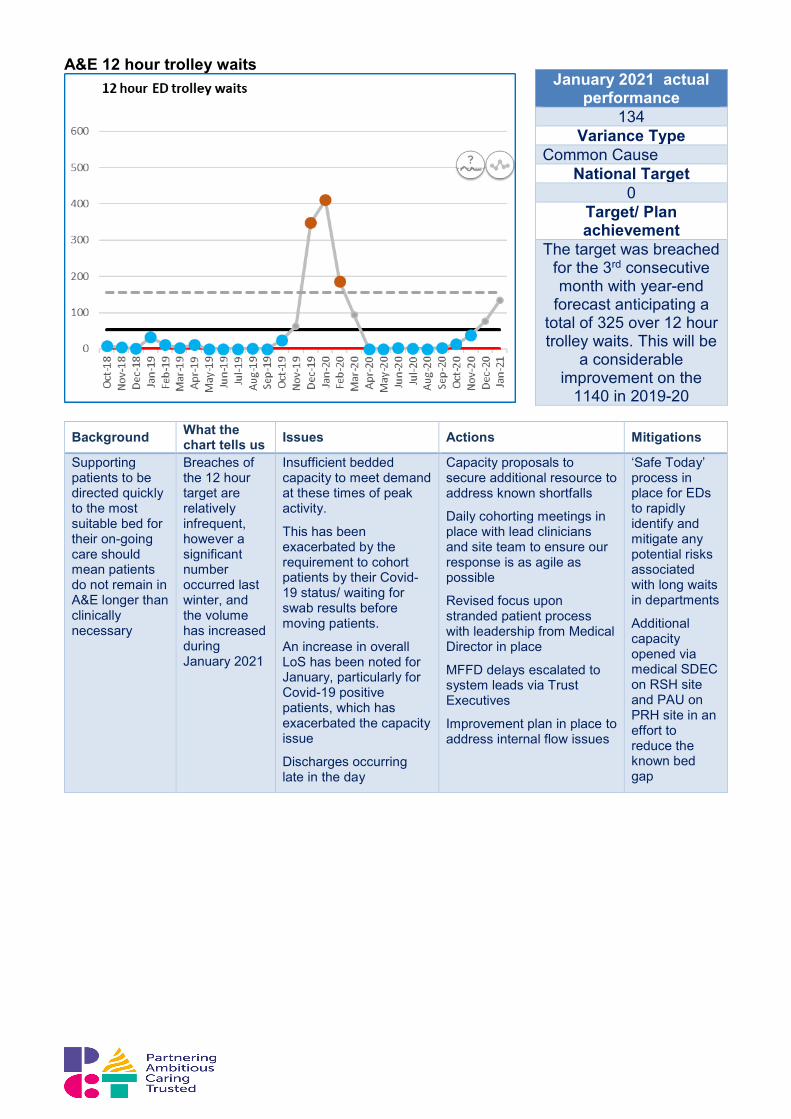
A&E 12 hour trolley waits
Background What the chart tells us Issues Actions Mitigations
Supporting patients to be directed quickly to the most suitable bed for their on-going care should mean patients do not remain in A&E longer than clinically necessary
Breaches of the 12 hour target are relatively infrequent, however a significant number occurred last winter, and the volume has increased during January 2021
Insufficient bedded capacity to meet demand at these times of peak activity.
This has been exacerbated by the requirement to cohort patients by their Covid-19 status/ waiting for swab results before moving patients.
An increase in overall LoS has been noted for January, particularly for Covid-19 positive patients, which has exacerbated the capacity issue
Discharges occurring late in the day
Capacity proposals to secure additional resource to address known shortfalls
Daily cohorting meetings in place with lead clinicians and site team to ensure our response is as agile as possible
Revised focus upon stranded patient process with leadership from Medical Director in place
MFFD delays escalated to system leads via Trust Executives
Improvement plan in place to address internal flow issues
‘Safe Today’ process in place for EDs to rapidly identify and mitigate any potential risks associated with long waits in departments
Additional capacity opened via medical SDEC on RSH site and PAU on PRH site in an effort to reduce the known bed gap
January 2021 actual performance
134 Variance Type
Common Cause National Target
0 Target/ Plan achievement
The target was breached for the 3rd consecutive month with year-end
forecast anticipating a total of 325 over 12 hour trolley waits. This will be
a considerable improvement on the
1140 in 2019-20
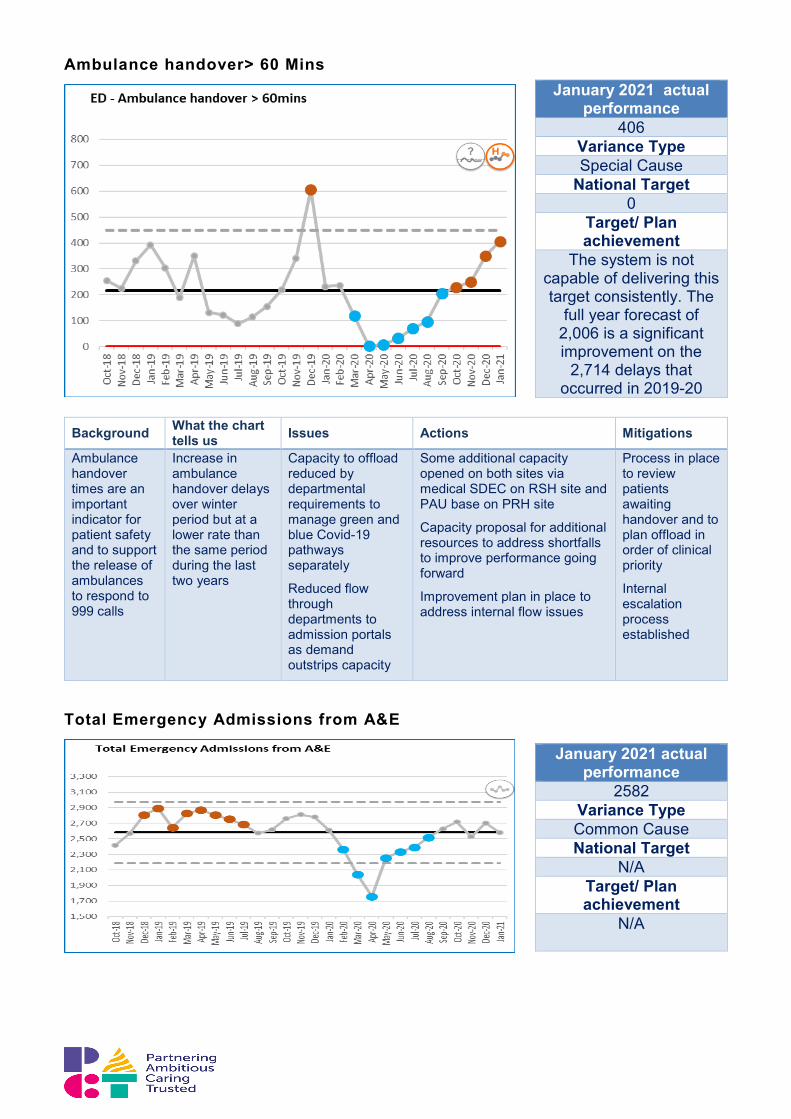
Ambulance handover> 60 Mins
Total Emergency Admissions from A&E
January 2021 actual performance
406 Variance Type Special Cause
National Target 0
Target/ Plan achievement
The system is not capable of delivering this target consistently. The
full year forecast of 2,006 is a significant improvement on the
2,714 delays that occurred in 2019-20
Background What the chart tells us Issues Actions Mitigations
Ambulance handover times are an important indicator for patient safety and to support the release of ambulances to respond to 999 calls
Increase in ambulance handover delays over winter period but at a lower rate than the same period during the last two years
Capacity to offload reduced by departmental requirements to manage green and blue Covid-19 pathways separately
Reduced flow through departments to admission portals as demand outstrips capacity
Some additional capacity opened on both sites via medical SDEC on RSH site and PAU base on PRH site
Capacity proposal for additional resources to address shortfalls to improve performance going forward
Improvement plan in place to address internal flow issues
Process in place to review patients awaiting handover and to plan offload in order of clinical priority
Internal escalation process established
January 2021 actual performance
2582 Variance Type Common Cause National Target
N/A Target/ Plan achievement
N/A
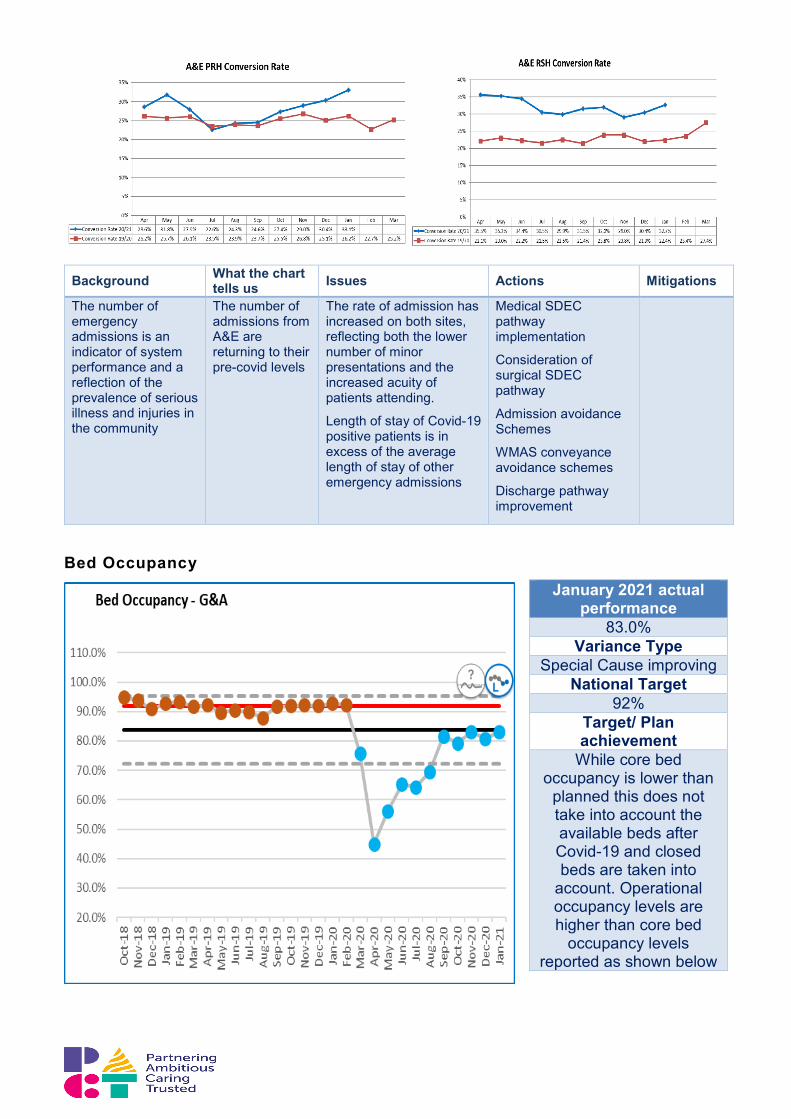
Background What the chart tells us Issues Actions Mitigations
The number of emergency admissions is an indicator of system performance and a reflection of the prevalence of serious illness and injuries in the community
The number of admissions from A&E are returning to their pre-covid levels
The rate of admission has increased on both sites, reflecting both the lower number of minor presentations and the increased acuity of patients attending.
Length of stay of Covid-19 positive patients is in excess of the average length of stay of other emergency admissions
Medical SDEC pathway implementation
Consideration of surgical SDEC pathway
Admission avoidance Schemes
WMAS conveyance avoidance schemes
Discharge pathway improvement
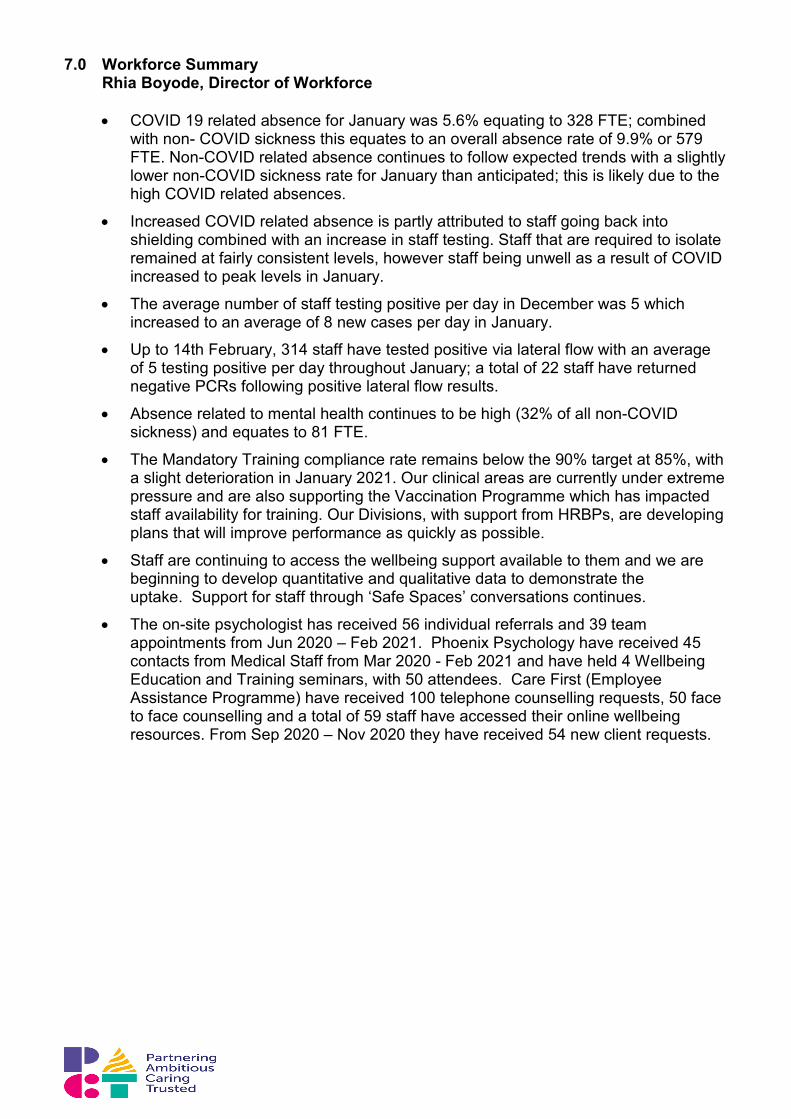
Bed Occupancy
January 2021 actual performance
83.0% Variance Type
Special Cause improving National Target
92% Target/ Plan achievement
While core bed occupancy is lower than
planned this does not take into account the available beds after Covid-19 and closed beds are taken into
account. Operational occupancy levels are higher than core bed
occupancy levels reported as shown below

Background What the chart tells us Issues Actions Mitigations
Bed occupancy is an important measure indicating the flow and capacity within the system
Admissions fell during the 1st wave of covid due to fall in non covid urgent care demand and cessation of elective care admissions
Since this time emergency admissions through ED have returned to near normal levels and elective care has moved to recovery phase.
The reduction in occupancy is largely due to non- ED admissions remaining below pre-covid levels
The bed occupancy formally reportable does not take account the available beds.
These are reduced at the present time due to:
a) Ring-fencing of capacity for Covid +ve patients
b) The social distancing required between beds
c) Temporary closure of beds due to outbreaks
d) Specialty specific protected capacity
January saw an increase in the occupancy of available beds and the level of occupancy by Covid-19 patients triggered escalation for mutual aid.
Bed modelling completed to show the daily impact of the factors on bed availability (see graph above)
Winter plan includes admission avoidance and discharge schemes
Clear curtains installed between beds to support infection control measures and reduce the need to close beds
Mutual aid provided to support the level of covid-19 occupied beds in January 2021.
Bed occupancy planned to increase to 96%
7.0 Workforce Summary Rhia Boyode, Director of Workforce
• COVID 19 related absence for January was 5.6% equating to 328 FTE; combined
with non- COVID sickness this equates to an overall absence rate of 9.9% or 579 FTE. Non-COVID related absence continues to follow expected trends with a slightly lower non-COVID sickness rate for January than anticipated; this is likely due to the high COVID related absences.
• Increased COVID related absence is partly attributed to staff going back into shielding combined with an increase in staff testing. Staff that are required to isolate remained at fairly consistent levels, however staff being unwell as a result of COVID increased to peak levels in January.
• The average number of staff testing positive per day in December was 5 which increased to an average of 8 new cases per day in January.
• Up to 14th February, 314 staff have tested positive via lateral flow with an average of 5 testing positive per day throughout January; a total of 22 staff have returned negative PCRs following positive lateral flow results.
• Absence related to mental health continues to be high (32% of all non-COVID sickness) and equates to 81 FTE.
• The Mandatory Training compliance rate remains below the 90% target at 85%, with a slight deterioration in January 2021. Our clinical areas are currently under extreme pressure and are also supporting the Vaccination Programme which has impacted staff availability for training. Our Divisions, with support from HRBPs, are developing plans that will improve performance as quickly as possible.
• Staff are continuing to access the wellbeing support available to them and we are beginning to develop quantitative and qualitative data to demonstrate the uptake. Support for staff through ‘Safe Spaces’ conversations continues.
• The on-site psychologist has received 56 individual referrals and 39 team appointments from Jun 2020 – Feb 2021. Phoenix Psychology have received 45 contacts from Medical Staff from Mar 2020 - Feb 2021 and have held 4 Wellbeing Education and Training seminars, with 50 attendees. Care First (Employee Assistance Programme) have received 100 telephone counselling requests, 50 face to face counselling and a total of 59 staff have accessed their online wellbeing resources. From Sep 2020 – Nov 2020 they have received 54 new client requests.
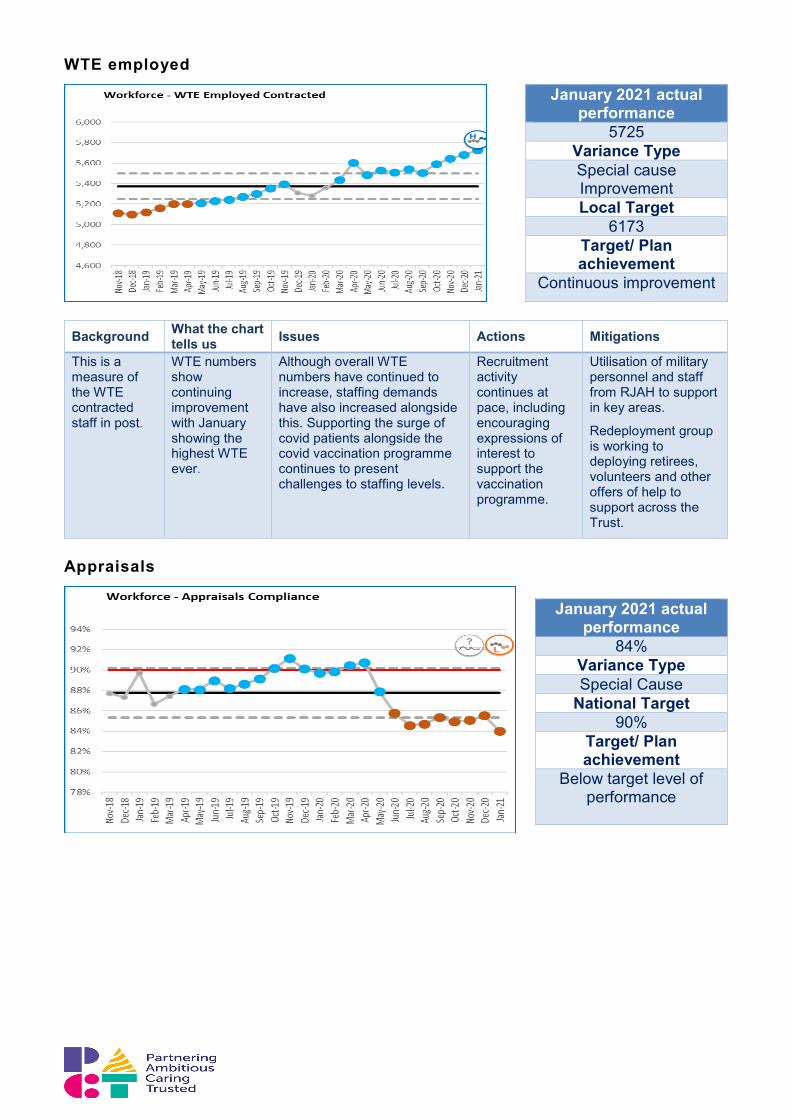
WTE employed
Background What the chart tells us Issues Actions Mitigations
This is a measure of the WTE contracted staff in post.
WTE numbers show continuing improvement with January showing the highest WTE ever.
Although overall WTE numbers have continued to increase, staffing demands have also increased alongside this. Supporting the surge of covid patients alongside the covid vaccination programme continues to present challenges to staffing levels.
Recruitment activity continues at pace, including encouraging expressions of interest to support the vaccination programme.
Utilisation of military personnel and staff from RJAH to support in key areas.
Redeployment group is working to deploying retirees, volunteers and other offers of help to support across the Trust.
Appraisals
January 2021 actual performance
5725 Variance Type Special cause Improvement Local Target
6173 Target/ Plan achievement
Continuous improvement
January 2021 actual performance
84% Variance Type Special Cause
National Target 90%
Target/ Plan achievement
Below target level of performance

Background What the chart tells us Issues Actions Mitigations
The measure is a key indicator for patient safety in ensuring staff are compliant in having completed their annual appraisal.
The 90% target was achieved January to April 2020 then started to drop and is currently 6% below target.
CV-19, staffing constraints have reduced the ability of wards to release staff for training.
E-mail reminders due or outstanding are sent to all staff.
Focused support is being provided to the managers of any Ward that is below target A substantial review of appraisals will be undertaken once the behaviours and values work is complete to ensure alignment with overall Trust objectives
Appraisal form has been revised to include the new Trust Values, health and well-being and flexible working discussions
Mandatory Training
Background What the chart tells us Issues Actions Mitigations
The measure is a key indicator for patient safety in ensuring staff are compliant with core mandated safety training.
Progress towards regaining 90% target has tailed off.
Safeguarding training compliance continues to improve month on month.
CV-19 & the Vaccination Programme, staffing constraints have reduced ability of Wards to release staff for training
Increased Statutory / Mandatory training requirements e.g. Hand Hygiene moving from triennial to annual
Poor IT literacy impacting on e-learning completion
Some data validation issues
Corp Ed is working with Divisions to identify and reduce data conflicts
Corp Ed is supporting Ward/Dep mangers to prioritise and schedule training completion
Corp Ed requested proxy facility to support remote e-learners effectively
E-learning and workbooks offered as alternatives to face to face training
Requirements made more transparent and newsletters to staff are signposting more clearly
Libraries supporting learners to access e-learning
Phone support for e-learning
Fire Safety Load Moving & Handling
Infection Prevention & Control
Hand Hygiene
Competence
Patient Moving & Handling
Adult Basic Life
Support
Paediatric Basic Life Support
Food Safety & Hygiene
Conflict Resolution Training
Equality & Diversity
Information Governance
Health & Safety Level 1
Training Compliance
%86% 83% 80% 92% 90% 74% 62% 87% 91% 91% 81% 83% 85%
January 2021 actual performance
85% Variance Type
Common Cause Variation
National Target 90%
Target/ Plan achievement
The target is above the upper process limit and
so unlikely to be achieved at present
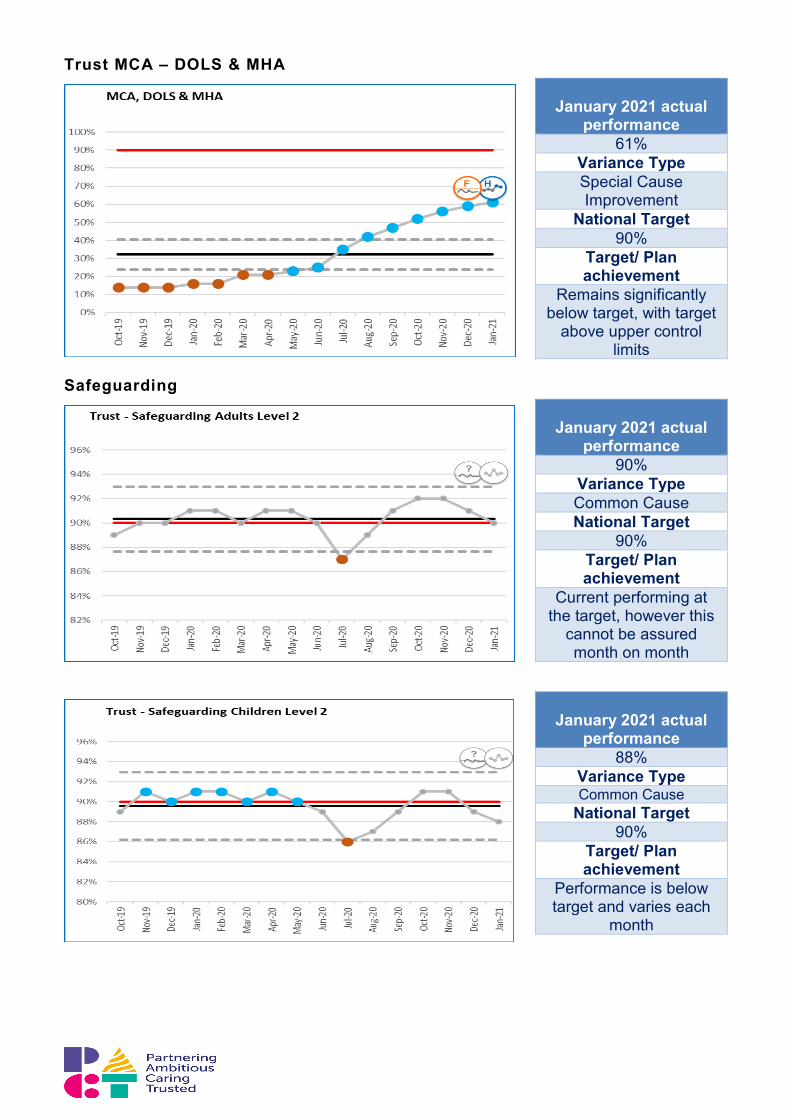
Trust MCA – DOLS & MHA
Safeguarding
January 2021 actual
performance 61%
Variance Type Special Cause Improvement
National Target 90%
Target/ Plan achievement
Remains significantly below target, with target
above upper control limits
January 2021 actual
performance 90%
Variance Type Common Cause National Target
90% Target/ Plan achievement
Current performing at the target, however this
cannot be assured month on month
January 2021 actual
performance 88%
Variance Type Common Cause
National Target 90%
Target/ Plan achievement
Performance is below target and varies each
month

Sickness Absence
Background What the chart tells us Issues Actions Mitigations
The measure is an indicator of staff sickness absence and is a % of FTE calendar days absent
Covid-19 related sickness and absence is not included.
Absences related to covid-19 increase the overall absence rate to above 10%
Sickness absence levels since March have broadly followed target levels
Performance is slightly above target when Covid-19 related absences are excluded
High levels of absence attributed to mental health reasons
Staff tired and feeling strain of covid-19 cases and increased work pressures
Sickness levels are likely to be lower due to the numbers of staff absent with covid-19 related absences.
Continue to offer support packages via health and wellbeing initiatives
Continue to monitor sickness levels within divisions
Monitor and review staffing levels
Work with temporary staffing departments to ensure gaps can be filled with temporary workforce where necessary
January 2021 actual performance
4.3% (exc.Covid related absences)
Variance Type Common Cause
Variation National Target
4% Target/ Plan achievement
The target is within the process control limits
and so is unlikely to be delivered month on
month

8.0 Finance Summary Mr James Drury, Interim Finance Director
• A deficit of £1.933m was reported in the month, £0.505m adverse relative to plan. However, it is important to note that this position included a further £2.095m movement linked to the untaken annual leave provision. Excluding this provision the reported in-month position becomes £1.590m favourable to plan which is similar to the prior month’s reported run rate saving.
• The Trusts underlying YTD position excluding the annual leave accrual (which now stands at £3.345m) is a deficit of £0.681m, £3.345m favourable to plan. This positive position is underpinned by continued development spend slippage and a reduction in variable costs linked to lower levels of activity delivery. It continues to be unlikely that this underspend will be reversed prior to year-end, although this expenditure will still be included in the 20/21 exit run rate, which will form the basis of the 21/22 budget setting process.
• The Trusts full-year financial forecast is now expected to be a deficit of £8.379m, £0.655m adverse to the £7.724m deficit control total for 2020/21. The FY position includes a £4m provision for untaken annual leave, which will be excluded from financial performance against the in-year control total. The adjusted FY financial position is £3.345m favourable to plan.
• There continue to be risks to delivery of this forecast over the final 2 months linked to the Trust’s response to COVID 19 including the critical care surge. As mentioned last month, the extent to which COVID related expenditure will be offset by elective underspends, mutual aid and MoD input, and the notable drop in agency fill since December remains materially uncertain. Other risks have been identified but it is expected that these will be mitigated during the remainder of the year, mainly through further slippage against planned developments.
• COVID-19 capital expenditure and commitments to date are £0.962m compared to a forecast outturn plan of £1.150m. Further work will be undertaken to understand the implications of the Trust response to COVID19 surge as part of month 10 reporting.
• Total capital expenditure to date is £20.106m against a YTD external plan of £27.692m, and internal plan of £23.291m; £7.586m and £3.185m respectively below plan due to slippage in project start dates. However, the Trust has known capital commitments to date of £13.489m. The total YTD capital including commitments is £33.595m, 79% of the FY capital plan.
• Cash at the end of January amounted to £34.293m including reconciling items, pre-payment of one month’s block and top up payments received in April amounting to £32.3m. Payment of block in advance will cease in February so cash balances will reduce in March to pre COVID 19 levels.
• The Trust’s payment performance against the Better Payment Practice Code improved this month with 90.6% by number, but deteriorated slightly to 92.1% by value, of undisputed invoices being paid within 30 days. In addition, 34% and 46% respectively of all invoices were paid within 7 days.
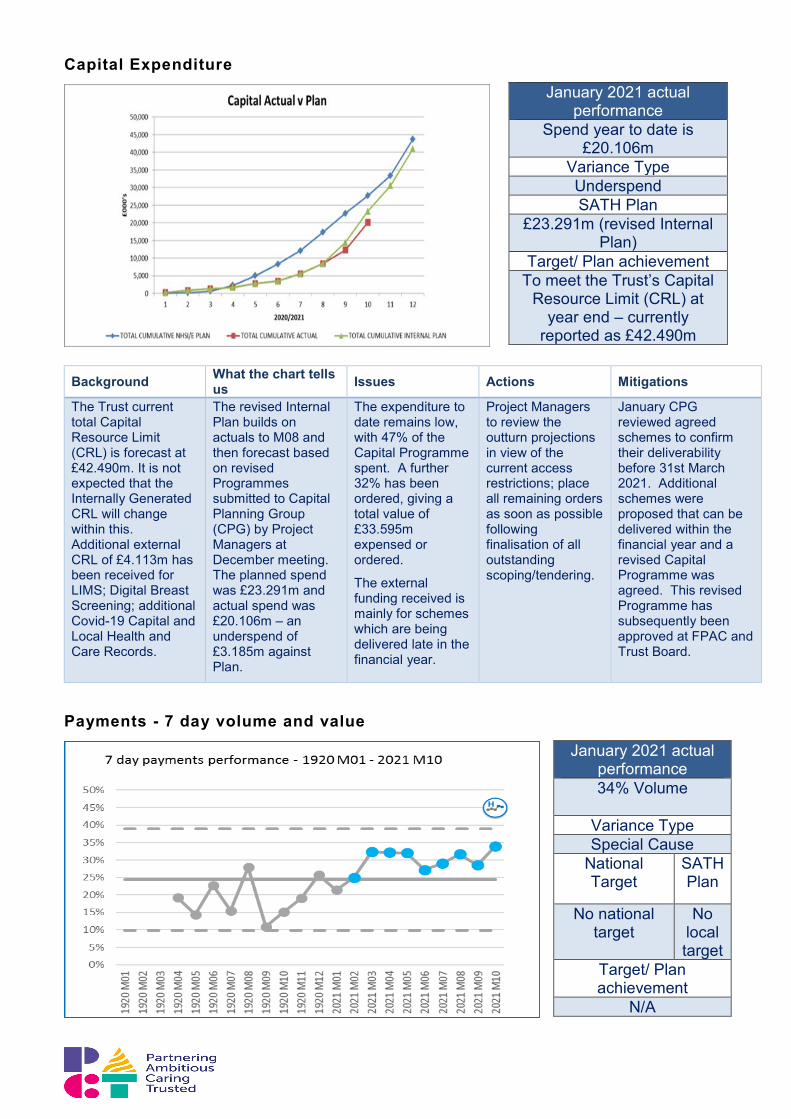
Capital Expenditure
Background What the chart tells
us Issues Actions Mitigations
The Trust current total Capital Resource Limit (CRL) is forecast at £42.490m. It is not expected that the Internally Generated CRL will change within this. Additional external CRL of £4.113m has been received for LIMS; Digital Breast Screening; additional Covid-19 Capital and Local Health and Care Records.
The revised Internal Plan builds on actuals to M08 and then forecast based on revised Programmes submitted to Capital Planning Group (CPG) by Project Managers at December meeting. The planned spend was £23.291m and actual spend was £20.106m – an underspend of £3.185m against Plan.
The expenditure to date remains low, with 47% of the Capital Programme spent. A further 32% has been ordered, giving a total value of £33.595m expensed or ordered.
The external funding received is mainly for schemes which are being delivered late in the financial year.
Project Managers to review the outturn projections in view of the current access restrictions; place all remaining orders as soon as possible following finalisation of all outstanding scoping/tendering.
January CPG reviewed agreed schemes to confirm their deliverability before 31st March 2021. Additional schemes were proposed that can be delivered within the financial year and a revised Capital Programme was agreed. This revised Programme has subsequently been approved at FPAC and Trust Board.
Payments - 7 day volume and value
January 2021 actual performance
Spend year to date is £20.106m
Variance Type Underspend SATH Plan
£23.291m (revised Internal Plan)
Target/ Plan achievement To meet the Trust’s Capital
Resource Limit (CRL) at year end – currently
reported as £42.490m
January 2021 actual performance 34% Volume
Variance Type Special Cause
National Target
SATH Plan
No national target
No local target
Target/ Plan achievement
N/A
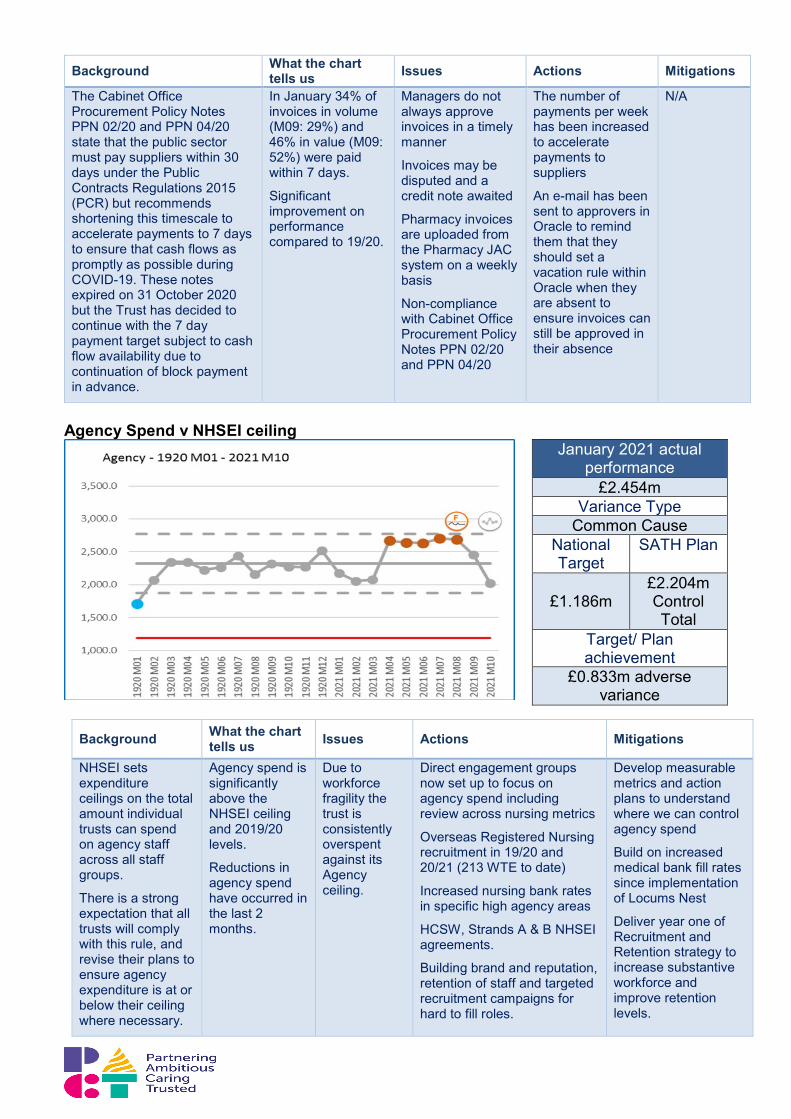
Background What the chart tells us Issues Actions Mitigations
The Cabinet Office Procurement Policy Notes PPN 02/20 and PPN 04/20 state that the public sector must pay suppliers within 30 days under the Public Contracts Regulations 2015 (PCR) but recommends shortening this timescale to accelerate payments to 7 days to ensure that cash flows as promptly as possible during COVID-19. These notes expired on 31 October 2020 but the Trust has decided to continue with the 7 day payment target subject to cash flow availability due to continuation of block payment in advance.
In January 34% of invoices in volume (M09: 29%) and 46% in value (M09: 52%) were paid within 7 days.
Significant improvement on performance compared to 19/20.
Managers do not always approve invoices in a timely manner
Invoices may be disputed and a credit note awaited
Pharmacy invoices are uploaded from the Pharmacy JAC system on a weekly basis
Non-compliance with Cabinet Office Procurement Policy Notes PPN 02/20 and PPN 04/20
The number of payments per week has been increased to accelerate payments to suppliers
An e-mail has been sent to approvers in Oracle to remind them that they should set a vacation rule within Oracle when they are absent to ensure invoices can still be approved in their absence
N/A
Agency Spend v NHSEI ceiling
Background What the chart tells us Issues Actions Mitigations
NHSEI sets expenditure ceilings on the total amount individual trusts can spend on agency staff across all staff groups.
There is a strong expectation that all trusts will comply with this rule, and revise their plans to ensure agency expenditure is at or below their ceiling where necessary.
Agency spend is significantly above the NHSEI ceiling and 2019/20 levels.
Reductions in agency spend have occurred in the last 2 months.
Due to workforce fragility the trust is consistently overspent against its Agency ceiling.
Direct engagement groups now set up to focus on agency spend including review across nursing metrics
Overseas Registered Nursing recruitment in 19/20 and 20/21 (213 WTE to date)
Increased nursing bank rates in specific high agency areas
HCSW, Strands A & B NHSEI agreements.
Building brand and reputation, retention of staff and targeted recruitment campaigns for hard to fill roles.
Develop measurable metrics and action plans to understand where we can control agency spend
Build on increased medical bank fill rates since implementation of Locums Nest
Deliver year one of Recruitment and Retention strategy to increase substantive workforce and improve retention levels.
January 2021 actual performance
£2.454m Variance Type
Common Cause National Target
SATH Plan
£1.186m
£2.204m Control Total
Target/ Plan achievement
£0.833m adverse variance
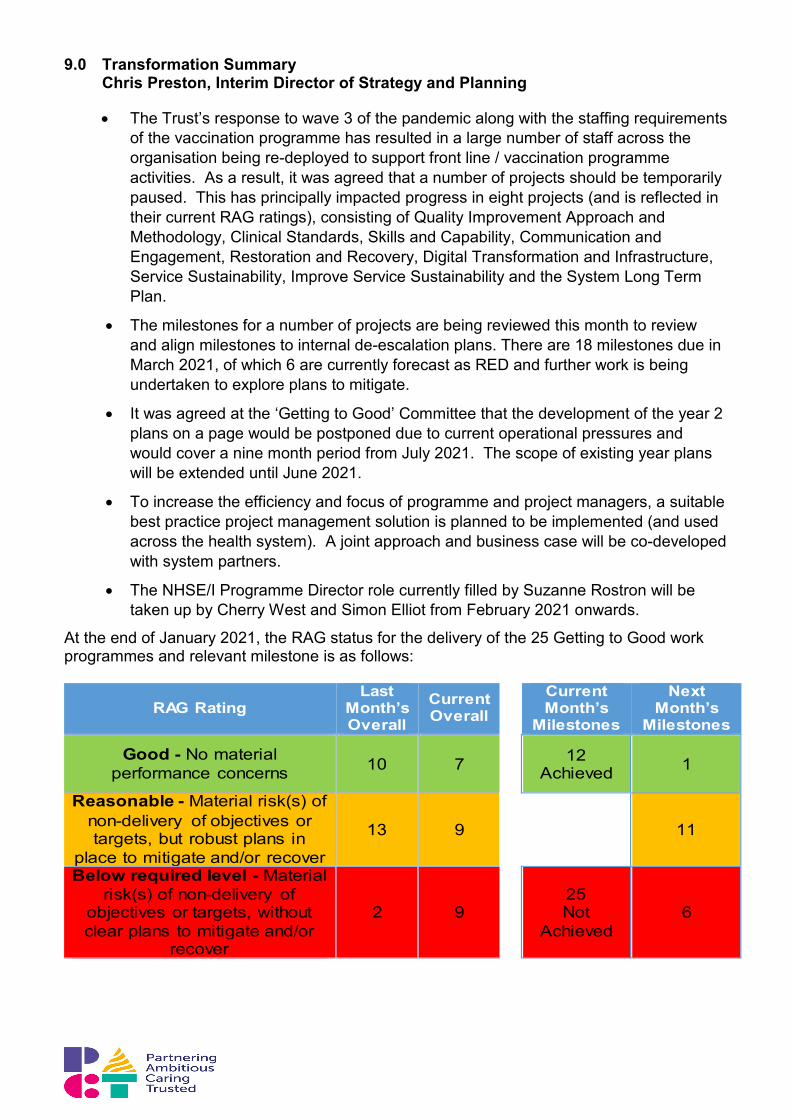
9.0 Transformation Summary Chris Preston, Interim Director of Strategy and Planning
• The Trust’s response to wave 3 of the pandemic along with the staffing requirements of the vaccination programme has resulted in a large number of staff across the organisation being re-deployed to support front line / vaccination programme activities. As a result, it was agreed that a number of projects should be temporarily paused. This has principally impacted progress in eight projects (and is reflected in their current RAG ratings), consisting of Quality Improvement Approach and Methodology, Clinical Standards, Skills and Capability, Communication and Engagement, Restoration and Recovery, Digital Transformation and Infrastructure, Service Sustainability, Improve Service Sustainability and the System Long Term Plan.
• The milestones for a number of projects are being reviewed this month to review and align milestones to internal de-escalation plans. There are 18 milestones due in March 2021, of which 6 are currently forecast as RED and further work is being undertaken to explore plans to mitigate.
• It was agreed at the ‘Getting to Good’ Committee that the development of the year 2 plans on a page would be postponed due to current operational pressures and would cover a nine month period from July 2021. The scope of existing year plans will be extended until June 2021.
• To increase the efficiency and focus of programme and project managers, a suitable best practice project management solution is planned to be implemented (and used across the health system). A joint approach and business case will be co-developed with system partners.
• The NHSE/I Programme Director role currently filled by Suzanne Rostron will be taken up by Cherry West and Simon Elliot from February 2021 onwards.
At the end of January 2021, the RAG status for the delivery of the 25 Getting to Good work programmes and relevant milestone is as follows:
RAG Rating Last
Month’s Overall
Current Overall
Current Month’s
Milestones
Next Month’s
Milestones
Good - No material performance concerns 10 7
12 Achieved 1
Reasonable - Material risk(s) of non-delivery of objectives or targets, but robust plans in
place to mitigate and/or recover 13 9
11
Below required level - Material risk(s) of non-delivery of
objectives or targets, without clear plans to mitigate and/or
recover
2 9
25 Not
Achieved 6

APPENDIX A – RAG STATUS AT PROGRAMME LEVEL
G2G Programme UHB QIP Priority
RAG Status Status Reason Previous Overall
Current Overall
1. Quality Strategy and Plan
a. Quality Improvement; b. Leadership Capacity; c. Clinical Improvement Plans
Draft Quality Strategy has been developed and is undergoing further review and iteration. Change request raised to change milestone for submission to Trust Board to March 2021.
2. Reducing Mortality and Excess Deaths
e. Standards for clinical services; i. Comms. and engagement strategy;
The Trust mortality group approved the Oris Structured Judgement Review Plus Model as the preferred mortality review tool for the Trust on the 14th January. An initial cohort of clinicians are being identified to undertake the training. Two initial training dates have been agreed as 23rd February & 3rd March and invitations are being circulated.
3. Quality / Regulatory Compliance
c. Clinical Improvement plans
The unprecedented operational pressures through January have resulted in many of our routine confirm and challenge meetings being cancelled due to availability of appropriate personnel. However, the clinical and operational teams remain fully committed to these improvements and to embedding the associated changes.
4. Maternity Transformation
Reprioritised all workstream project plans to incorporate 52 Ockenden actions. Presented workstream plans to Senior Leadership team. Recruited Quality Improvement Midwife. Milestone regarding review of LMS boundary will be amended as part of the extension of Year 1 plans to June 2021 (as agreed at G2G committee).
5. Increasing Community Engagement
Public community meeting attended by over 40 members of the public. Response volunteer scheme has been launched at both hospital sites with over 50 volunteers’ involved. The Trust held its second #SaTHhour on Mental health in Acute Care (with positive feedback received over twitter). A health lecture on
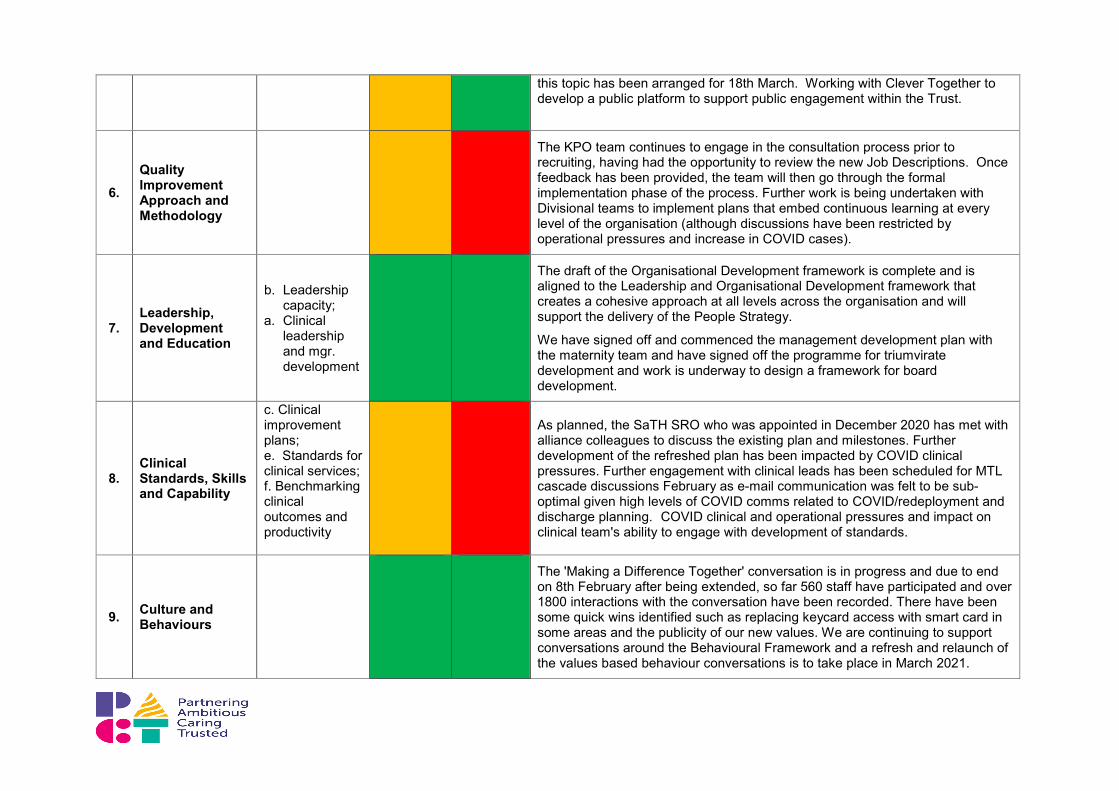
this topic has been arranged for 18th March. Working with Clever Together to develop a public platform to support public engagement within the Trust.
6. Quality Improvement Approach and Methodology
The KPO team continues to engage in the consultation process prior to recruiting, having had the opportunity to review the new Job Descriptions. Once feedback has been provided, the team will then go through the formal implementation phase of the process. Further work is being undertaken with Divisional teams to implement plans that embed continuous learning at every level of the organisation (although discussions have been restricted by operational pressures and increase in COVID cases).
7. Leadership, Development and Education
b. Leadership capacity;
a. Clinical leadership and mgr. development
The draft of the Organisational Development framework is complete and is aligned to the Leadership and Organisational Development framework that creates a cohesive approach at all levels across the organisation and will support the delivery of the People Strategy.
We have signed off and commenced the management development plan with the maternity team and have signed off the programme for triumvirate development and work is underway to design a framework for board development.
8. Clinical Standards, Skills and Capability
c. Clinical improvement plans; e. Standards for clinical services; f. Benchmarking clinical outcomes and productivity
As planned, the SaTH SRO who was appointed in December 2020 has met with alliance colleagues to discuss the existing plan and milestones. Further development of the refreshed plan has been impacted by COVID clinical pressures. Further engagement with clinical leads has been scheduled for MTL cascade discussions February as e-mail communication was felt to be sub-optimal given high levels of COVID comms related to COVID/redeployment and discharge planning. COVID clinical and operational pressures and impact on clinical team's ability to engage with development of standards.
9. Culture and Behaviours
The 'Making a Difference Together' conversation is in progress and due to end on 8th February after being extended, so far 560 staff have participated and over 1800 interactions with the conversation have been recorded. There have been some quick wins identified such as replacing keycard access with smart card in some areas and the publicity of our new values. We are continuing to support conversations around the Behavioural Framework and a refresh and relaunch of the values based behaviour conversations is to take place in March 2021.
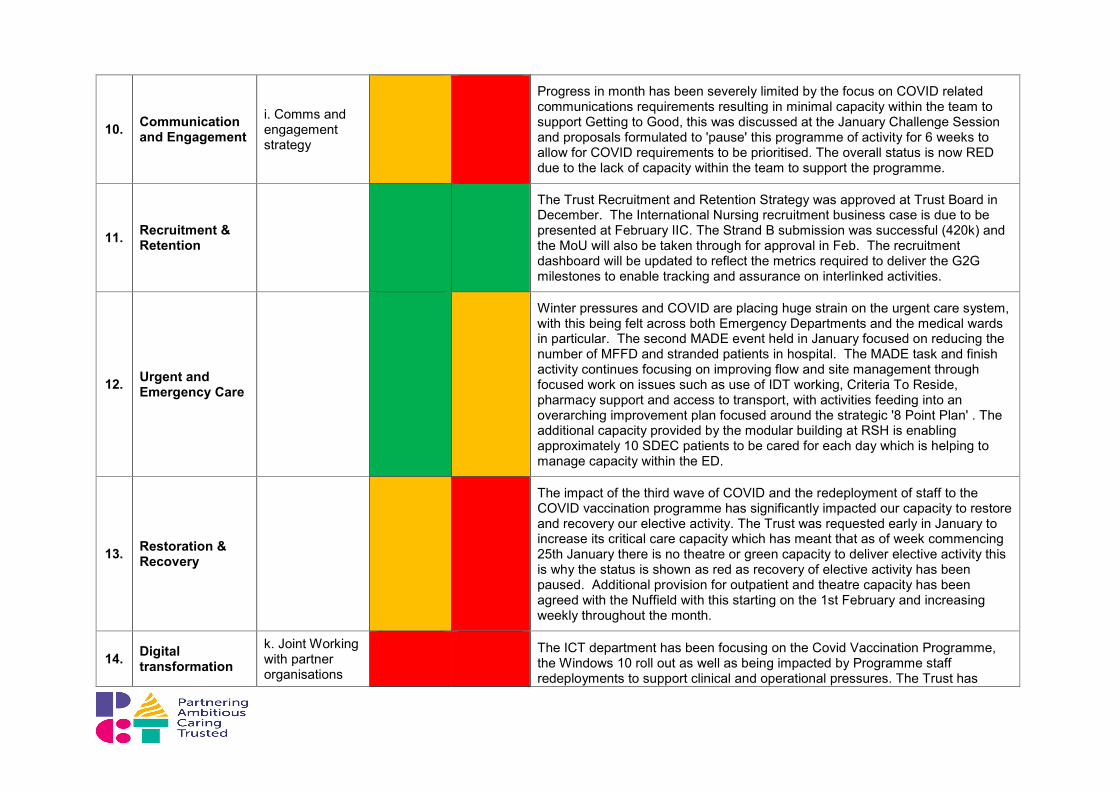
10. Communication and Engagement
i. Comms and engagement strategy
Progress in month has been severely limited by the focus on COVID related communications requirements resulting in minimal capacity within the team to support Getting to Good, this was discussed at the January Challenge Session and proposals formulated to 'pause' this programme of activity for 6 weeks to allow for COVID requirements to be prioritised. The overall status is now RED due to the lack of capacity within the team to support the programme.
11. Recruitment & Retention
The Trust Recruitment and Retention Strategy was approved at Trust Board in December. The International Nursing recruitment business case is due to be presented at February IIC. The Strand B submission was successful (420k) and the MoU will also be taken through for approval in Feb. The recruitment dashboard will be updated to reflect the metrics required to deliver the G2G milestones to enable tracking and assurance on interlinked activities.
12. Urgent and Emergency Care
Winter pressures and COVID are placing huge strain on the urgent care system,
with this being felt across both Emergency Departments and the medical wards in particular. The second MADE event held in January focused on reducing the number of MFFD and stranded patients in hospital. The MADE task and finish activity continues focusing on improving flow and site management through focused work on issues such as use of IDT working, Criteria To Reside, pharmacy support and access to transport, with activities feeding into an overarching improvement plan focused around the strategic '8 Point Plan' . The additional capacity provided by the modular building at RSH is enabling approximately 10 SDEC patients to be cared for each day which is helping to manage capacity within the ED.
13. Restoration & Recovery
The impact of the third wave of COVID and the redeployment of staff to the COVID vaccination programme has significantly impacted our capacity to restore and recovery our elective activity. The Trust was requested early in January to increase its critical care capacity which has meant that as of week commencing 25th January there is no theatre or green capacity to deliver elective activity this is why the status is shown as red as recovery of elective activity has been paused. Additional provision for outpatient and theatre capacity has been agreed with the Nuffield with this starting on the 1st February and increasing weekly throughout the month.
14. Digital transformation
k. Joint Working with partner organisations
The ICT department has been focusing on the Covid Vaccination Programme, the Windows 10 roll out as well as being impacted by Programme staff redeployments to support clinical and operational pressures. The Trust has

and Infrastructure
progressed the technical elements of the Vitals upgrade, Care Flow ED and EPR as far as is practical. The Careflow ED implementation is dependent on the trust wide Vitals upgrade and therefore the BadgerNet - Maternity system is being brought forward. A revised plan is in development.
15. Physical capacity and estates development
The overall programme is progressing well against the plan. The approval of the Estates plan will be moved into G2G Year 2 plans in order to better align with operational planning and the Hospital Transformation Programme (HTP) submission. The redevelopment of A&E will also be included in the Year 2 G2G programme.
16. Service Sustainability
h. Developing new models; k. Joint Working with partner organisations
Following confirmation of availability of resource to procure external support for producing date packs and initial risk assessment for specialties (to allow discussion of relative priority) a draft procurement document has been produced. Procurement support has been limited, linked to COVID pressures.
17.
Improve Service Sustainability: Reduction in face–to-face clinic appointments
Some progress made initially in month but this has been impacted by ongoing COVID pressures and decisions to step down activity and redeploy staff given emergency demand. A decision has been made after discussion at Executive Team level and Getting to Good Board to pause this objective for 4 to 6 weeks pending review of COVID situation
18. System Improvement and integration plan
System Improvement Plan: work is still ongoing to engage with System to review and set up the governance and monitoring arrangements for the System Improvement plan. Some of the immediate actions are being tracked through the UEC group. Discussions have been taking place about how we build the 6 month to 2 year improvement actions into the system annual integrated plan. Meetings are been set up to discuss this further with the System leads.
System Annual Integrated Plan 21/22: the planning round for next year will not take place until Q1 due to the operational pressures currently dealing with the latest wave of COVID. However weekly meeting with System planning leads are continuing to take place and there is an agreed set of actions to develop plan for Q1 and draft baseline plane for Q2-Q4 by March.
ICS application was submitted in January and awaiting formal feedback but informal feedback has been received and further work is required in a number of areas.

19. Develop OBC for Hospital Transformation programme
The recommendations of the Readiness Assessment undertaken by Attain will be incorporated into the programme scope and result in a number of new milestones. The Strategic Outline Case (SOC) is to be refreshed and approval will be dependent on the finalisation of the System Long Term Plan. Updated milestones are currently being reviewed and finalised.
20. System Long Term Plan
The System currently has additional support being provided to develop a financial Recovery Plan. The system is developing a plan and approach to produce a medium term financially sustainable strategy. This will be an integrated strategy that is looking at how services and clinical models can be transformed to provide sustainable services that provide quality and financial improvements which would form the basis of the System Long Term Plan. As the approach is still to be finalised and given other short term priorities and resource capacity constraints, it is unlikely that the original milestones to have this in place by March will be achievable.
21. Oversight, assurance, roles and accountabilities
g. Developing new working models; j. Clinical quality and risks
Progress is being made across all milestones although capacity constraints due to COVID have had some impact on timescales. Mapping of the Board Assurance Framework has been completed but is likely to further evolve as the Trust responds to, and learns from the Ockenden Report. In addition, there may be wider support required to enhance governance arrangements for the new Care Group Management Structure with the introduction of Divisions. The CQC Regulation 17 milestone is now flagged as red due to significant volume of work required to achieve compliance, and further time required to demonstrate improvements have been embedded. Additional resources would help to add some pace to the delivery but due to the nature of this milestone the Trust is unlikely to be fully compliant with Regulation 17 within the next 12 months.
22. Strong Financial Foundations
Continued engagement with regional and national finance teams for 2021 forecast outturn and exit run rate from 20/21. The Finance Department FFF accreditation plan is progressing well with 68% of tasks complete and there is reasonable assurance that the 31 March target will be met. The Trust has become a pathfinder for implementation of best practice SPC (system process control) financial reporting in the NHS. A department wide development day has been held, with high levels of positive feedback, for the 100 staff within Finance and Contracts, and it is planned to continue and extend this activity in 2021.
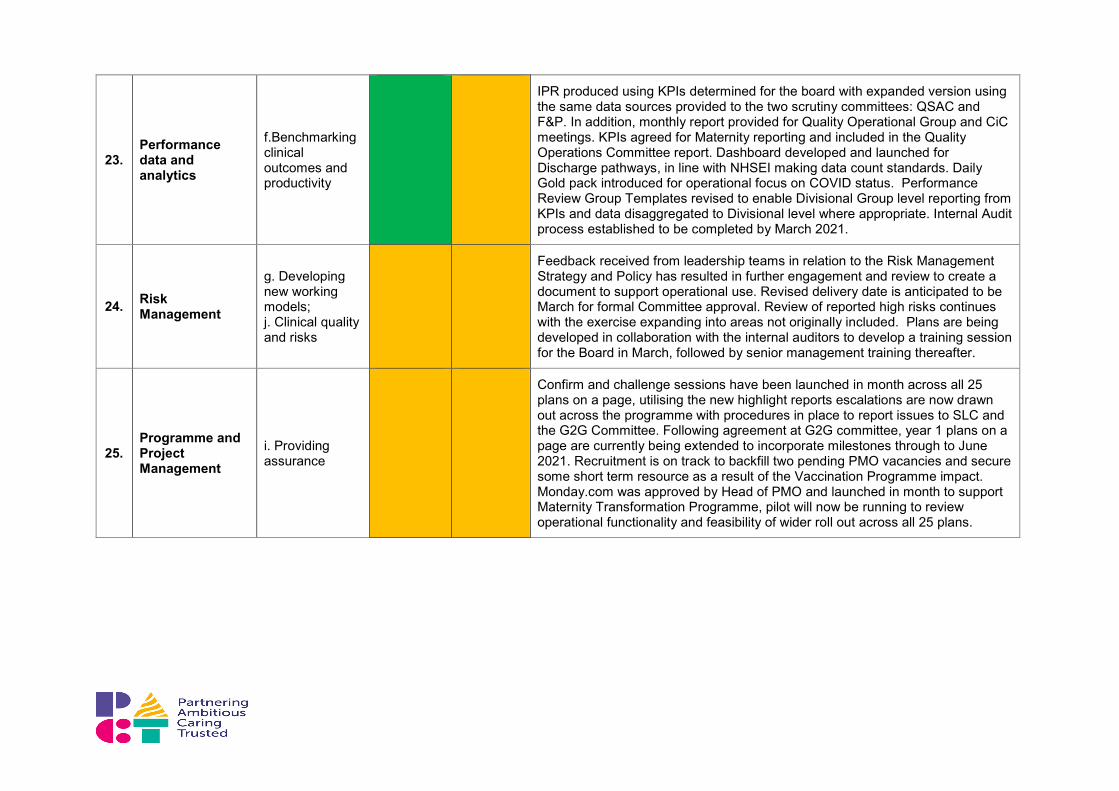
23. Performance data and analytics
f.Benchmarking clinical outcomes and productivity
IPR produced using KPIs determined for the board with expanded version using the same data sources provided to the two scrutiny committees: QSAC and F&P. In addition, monthly report provided for Quality Operational Group and CiC meetings. KPIs agreed for Maternity reporting and included in the Quality Operations Committee report. Dashboard developed and launched for Discharge pathways, in line with NHSEI making data count standards. Daily Gold pack introduced for operational focus on COVID status. Performance Review Group Templates revised to enable Divisional Group level reporting from KPIs and data disaggregated to Divisional level where appropriate. Internal Audit process established to be completed by March 2021.
24. Risk Management
g. Developing new working models; j. Clinical quality and risks
Feedback received from leadership teams in relation to the Risk Management Strategy and Policy has resulted in further engagement and review to create a document to support operational use. Revised delivery date is anticipated to be March for formal Committee approval. Review of reported high risks continues with the exercise expanding into areas not originally included. Plans are being developed in collaboration with the internal auditors to develop a training session for the Board in March, followed by senior management training thereafter.
25. Programme and Project Management
i. Providing assurance
Confirm and challenge sessions have been launched in month across all 25 plans on a page, utilising the new highlight reports escalations are now drawn out across the programme with procedures in place to report issues to SLC and the G2G Committee. Following agreement at G2G committee, year 1 plans on a page are currently being extended to incorporate milestones through to June 2021. Recruitment is on track to backfill two pending PMO vacancies and secure some short term resource as a result of the Vaccination Programme impact. Monday.com was approved by Head of PMO and launched in month to support Maternity Transformation Programme, pilot will now be running to review operational functionality and feasibility of wider roll out across all 25 plans.