Board Meeting PowerPoint Presentation
41
March 16, 2016 Board Meeting Deborah B. Goldberg, State Treasurer and Receiver-General Chairperson Massachusetts School Building Authority www.MassSchoolBuildings.org Jack McCarthy Executive Director Maureen Valente Chief Executive Officer
Transcript of Board Meeting PowerPoint Presentation
March 16, 2016
Board Meeting
Deborah B. Goldberg, State Treasurer and Receiver-General Chairperson
Massachusetts School Building Authority
www.MassSchoolBuildings.org
Jack McCarthy Executive Director
Maureen Valente Chief Executive Officer

Table of Contents Upcoming Board Meeting Outlook
Accelerated Repair Program Update Statements of Interest Site Visit Schedule
Update on the School Assessment Survey
Discussion on Model School Program Model Schools Incentive Points | Vote
Discussion on Construction Methodology
Discussion on MSBA Space Guidelines
Discussion on City of Quincy Poverty Factor | Vote
Finance Update Budget Update FY17 Outlook
2 www.MassSchoolBuildings.org

3
Upcoming Board Meeting Outlook
www.MassSchoolBuildings.org

4
Accelerated Repair Program Update
www.MassSchoolBuildings.org
Statements of Interest Site Visit Schedule

2016 Statements of Interest
5 www.MassSchoolBuildings.org
The Statement of Interest (“SOI”) filing period for calendar year 2016 opened on January 8, 2016. The closing dates for districts submitting for consideration are as follows: As of March 4, 2016 73 SOIs have been submitted:
Accelerated Repair Program (“ARP”) closed on Friday, February 12, 2016 Core Program closes on Friday, April 8, 2016
(61) Accelerated Repair Program SOIs (2) Potential New School SOIs (2) Potential Renovation/Addition SOIs (8) Potential Repair SOIs

6
Accelerated Repair Program Update
www.MassSchoolBuildings.org
Statements of Interest Site Visit Schedule

Site Visit Schedule
7 www.MassSchoolBuildings.org
February 2016 Review ARP SOI submissions for completeness - Complete March 2016 Review ARP SOI submissions and accompanying documents for content Recommend and schedule ARP staff study visits April 2016 Conduct ARP staff study visits Review CORE Program SOI submissions for completeness May 2016 Finalize ARP SOI recommendations Review CORE Program SOI submissions and accompanying documents for content
May 2016 - July 2016 2016 ARP Board invitations
August 2016 Conduct CORE Program Senior Study visits
November 2016 Finalize CORE Program SOI recommendations
December 2016 Issue 2017 SOI Opening Communications
January 2017 2016 Core Program Board invitations

8
Update on the School Assessment Survey
www.MassSchoolBuildings.org

Deploy a 2016 School Survey that accounts for every school in Massachusetts, communicates effectively with our past and future
surveys, and encompasses modern-day questions that help define what makes our schools great.
2016 School Survey Goals
9 www.MassSchoolBuildings.org

December – January 2016 Review of Survey Methodologies and Uses Review past surveys and methodologies Identify Sub-committees and areas February 2016 Request For Responses released Sub-committees evaluate identified areas March 2016 Consultant selection Finalize sub-committee work
April – August 2016 Evaluate Existing Data and Systems Develop Survey Methodology and Tools Train Survey Teams September 2016 – February 2017 Data Collection Site Visits January – May 2017 Reporting and Quality Assurance June 30, 2017 Issue Final Report
Project Timeline
10 www.MassSchoolBuildings.org

Building Condition
General Environment
Maintenance
Technology
Security
District Information
Sub-committee Areas
11 www.MassSchoolBuildings.org

Request For Responses available: February 3, 2016 Question Deadline: February 10, 2016 Question Responses Posted: February 12, 2016 Responses Due: Friday, February 26, 2016
2 Responses: STV, Incorporated Parsons Group
Selection Committee Meetings: March 2, 2016 March 10, 2016
Recommendation for Award to Consultant anticipated March 30, 2016
Consultant Selection
12 www.MassSchoolBuildings.org

13
Discussion on Model School Program
www.MassSchoolBuildings.org
Model School Incentive Points | Vote

14
Discussion on Construction Methodology
www.MassSchoolBuildings.org

Construction Methodology Summary Data 125 projects authorized for Project Funding Agreements by year between April 2008 and July 2014
15 www.MassSchoolBuildings.org

Construction Methodology Summary Data 115 of the 125 projects are Construction Manager at Risk-eligible (estimated construction > $5M)
16 www.MassSchoolBuildings.org

Construction Methodology Summary Data 115 of the 125 projects are Construction Manager at Risk-eligible (estimated construction > $5M)
49 Construction
Manager at Risk
66 Design Bid
Build 17 www.MassSchoolBuildings.org

Construction Methodology Summary Data 115 projects authorized for Project Funding Agreements between April 2008 and July 2014
18 www.MassSchoolBuildings.org

Construction Methodology Summary Data 66 Design Bid Build projects authorized for Project Funding Agreements between April 2008 and July 2014
19 www.MassSchoolBuildings.org

Construction Methodology Summary Data 49 Construction Manager at Risk projects authorized for Project Funding Agreements between April 2008 and July 2014
20 www.MassSchoolBuildings.org

Construction Methodology Summary Data Design Bid Build and Construction Manager at Risk Contractor participation in the 115 projects
21 www.MassSchoolBuildings.org
Design-Bid-Build Construction Manager at Risk
Total Projects 66 49
Awarded Contractors 19 13
Contractors with Two or More Projects
10 (53% of projects)
8 (62% of projects)
Projects Awarded to Two Most Active Contractors
32 (48% of projects)
23 (47% of projects)
Construction Methodology Summary Data
22 www.MassSchoolBuildings.org
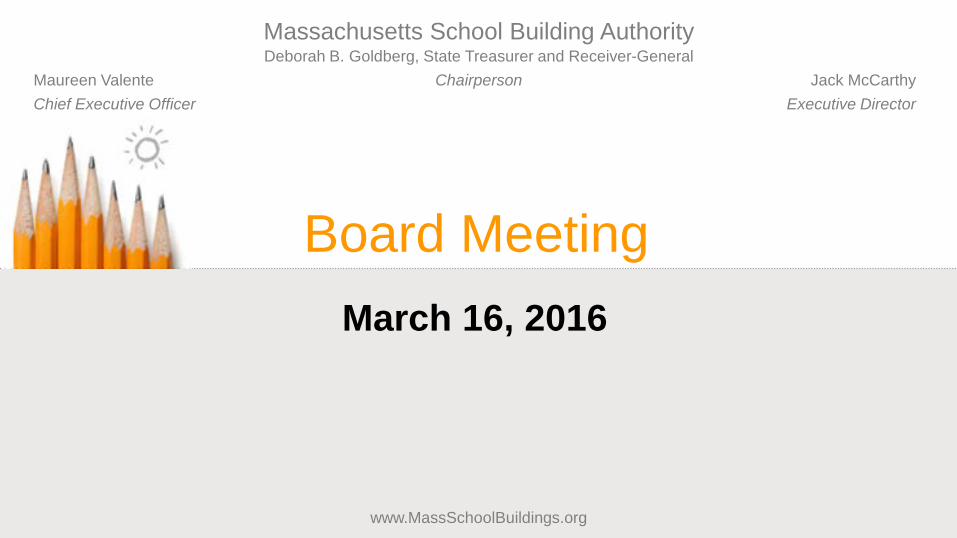
Additional observations from the Design Bid Build Contractor participation
Additional observations from the Construction Manager at Risk Contractor participation
Of the 19 contractors, 15 performed on three or fewer projects. The most projects awarded to one contractor in a given year between 2008 and 2014 are 6 in 2013. The pool of Design Bid Build projects continued to grow with at least one new contractor each year.
Of the 13 contractors, 9 performed on three or fewer projects. The most projects awarded to one contractor in a given year between 2010 and 2015 are 5 in 2011. Prior to 2015, the pool of Construction Manager at Risk projects continued to grow with at least one
new contractor each year.

Construction Methodology Summary Data Bid data reported for 64 of the 66 Design Bid Build projects
23 www.MassSchoolBuildings.org
Bids Received (Year)
Total Projects Qualified
Contractors Bids Submitted
2008 1 9 6
2009 6 9.3 5.8
2010 12 8.7 6.2
2011 10 7.4 5.8
2012 13 7.8 5.5
2013 13 6.8 4.2
2014 6 5.8 3.5
2015 3 3.7 3.0

Construction Methodology Summary Data Bid data reported for 47 of the 49 Construction Manager at Risk projects
24 www.MassSchoolBuildings.org
GMP Executed
(Year)
Total Projects
RFQ - Information
Requests
RFQ Responses
Qualified Contractors
RFP Responses
2010 7 11.7 9.6 5.6 5.1
2011 12 11.7 8.8 5.2 4.6
2012 7 8.1 6.7 5.3 4.3
2013 11 6.8 6.5 5.2 4.1
2014 5 7.0 7.0 5.6 5.2
2015 5 6.6 6.6 4.8 4.0

Construction Methodology Summary Data Core Program and its Projects 66 Design Bid Build projects and 49 Construction Manager at Risk projects in data set were Construction Manager at Risk-eligible
25 www.MassSchoolBuildings.org
71 New Construction or Model School projects 64% of Design Bid Build projects and 59% of Construction Manager at Risk projects
34 Addition/Renovation projects
26% of Design Bid Build projects and 35% of Construction Manager at Risk projects

Construction Methodology Summary Data Utilization Rates
26 www.MassSchoolBuildings.org
Districts now use Construction Manager at Risk at the same or greater rate as Design Bid Build
66 Design Bid Build projects were awarded to 19 contractors while 49 Construction Manager at Risk projects were awarded to 13 contractors
Design Bid Build Methodology has seen a decline per project in the average number of contractors qualifying to bid as well as submitting bids
Construction Manager at Risk Methodology has seen a steady level of qualified contractors through Requests For Qualification responses and submitted proposals

27
Discussion on MSBA Space Guidelines
www.MassSchoolBuildings.org
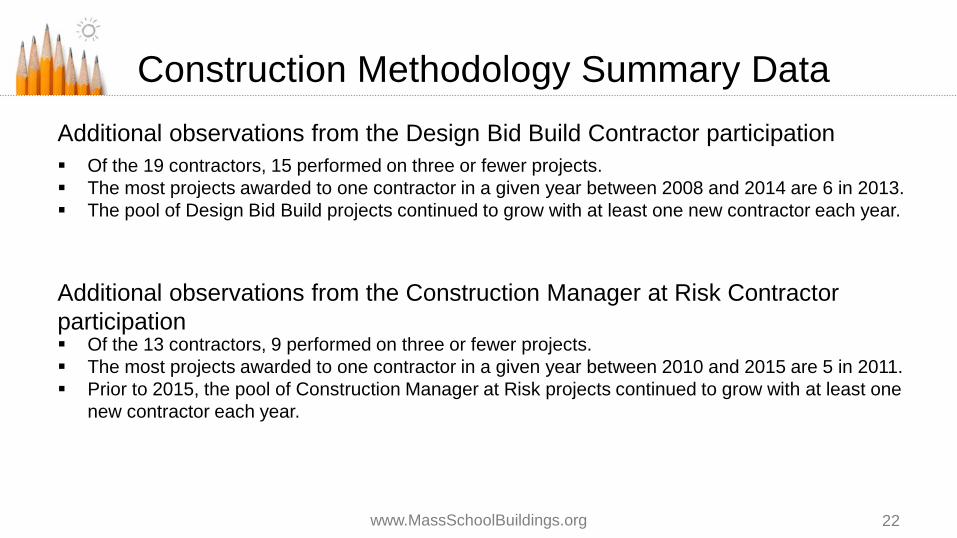
Where we started
MSBA Space Guidelines
28 www.MassSchoolBuildings.org
Oversized buildings with grander spaces Underutilized facilities Declining enrollment – school closings Failed operational overrides and school staff layoffs School projects paired with senior centers and other non-school projects Failed votes School moratorium creating pent-up demand – 428 Statements of Interest
filed in 2007

MSBA Space Guidelines
29 www.MassSchoolBuildings.org
Guideline Development Right-sized buildings
Spaces and square footage developed in conversations with superintendents and architects
Square foot per student for each project type (ES, MS and HS) Square foot per student for each program area
Creation of MSBA enrollment tool Early agreement on design enrollment Focus on student-centered spaces Focus on proven utilization of spaces Adherence to minimum classroom sizes

2007 to 2010 2009 to 2010
MSBA Space Guidelines
30 www.MassSchoolBuildings.org
Held to Gross Square Footage and to Net Square Footage within program areas
Community feedback on gymnasium size and need for a Chorus room
Changes to guidelines in multiple areas with a net increase in the Gross Square Footage / Student

MSBA Space Guidelines
31 www.MassSchoolBuildings.org

MSBA Space Guidelines
32 www.MassSchoolBuildings.org
2010 to present Educational Program as driver of design and justification for variations to the guidelines Facilities Assessment Subcommittee to vet Educational plan and Proposed plans Flexible in core academic, art, music, vocations and technology and administration and
guidance Special education reviewed and approved by Department of Elementary and Secondary
Education Space above guidelines not supported includes media center, health and physical
education (except as enrollment-based), auditorium, dining and food, medical custodial and maintenance.
Educational Profile Questionnaire in Eligibility Period Educational Plan Templates and sample educational plans, sample learning
environments (break-out spaces) and prototypical plans for science labs and best practices

Benefits Challenges
Conformance with MSBA Guidelines
33 www.MassSchoolBuildings.org
Focus on educational spaces Consistent evaluation between projects Controls size of facility and cost to
construct Controls cost of long-term operations
and maintenance Supports efforts of school and town
administrators with their stakeholders to right-size the educational building
Mitigates excessive disparity in funding for new schools
Allows districts to spread their money across all their schools
Communities may not be able to create a stand-alone facility for pools, field houses, ice rinks or large performance spaces
Community desire to keep an existing facility may not result in the “best” alternatives study for the school project
Challenges
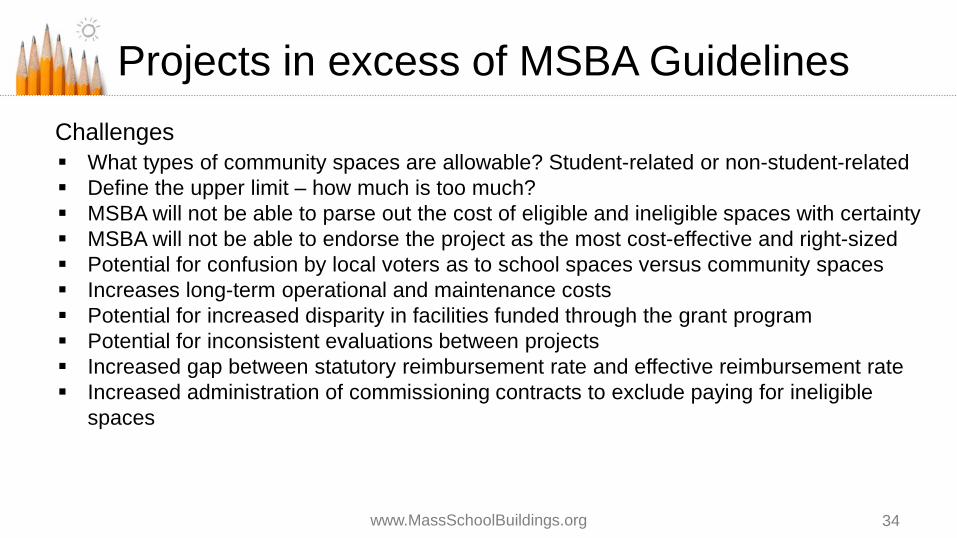
Projects in excess of MSBA Guidelines
34 www.MassSchoolBuildings.org
What types of community spaces are allowable? Student-related or non-student-related Define the upper limit – how much is too much? MSBA will not be able to parse out the cost of eligible and ineligible spaces with certainty MSBA will not be able to endorse the project as the most cost-effective and right-sized Potential for confusion by local voters as to school spaces versus community spaces Increases long-term operational and maintenance costs Potential for increased disparity in facilities funded through the grant program Potential for inconsistent evaluations between projects Increased gap between statutory reimbursement rate and effective reimbursement rate Increased administration of commissioning contracts to exclude paying for ineligible
spaces

Where are we now
MSBA Space Guidelines
35 www.MassSchoolBuildings.org
Strong focus on educational plan and student centered spaces Strong focus on flexible and adaptable buildings with plan for changes to
address future changes in educational delivery Hold to minimum class sizes to address changes in enrollment over time and
to ensure long-term flexibility of the building Adjusting gym size dependent upon the enrollment and need for teaching
spaces Careful review for spaces that could be undersized – special education,
classrooms, cafeteria Concentration on multifunctional spaces with high versatility

Under discussion | Spaces needed for schools of the future
MSBA Space Guidelines
36 www.MassSchoolBuildings.org
Technology Media Center
Changing educational trends
Further definition of the non-programmed space
Impact of distance learning, one to one technology, flipped classrooms
Reduced book storage Centralized vs. distributed space The role of the professional librarian
Collaboration spaces vs. dedicated classrooms Project based learning spaces – how many and of what size
Ubiquitous learning

37
Discussion on City of Quincy
Poverty Factor | Vote
www.MassSchoolBuildings.org

38
Finance Update*
www.MassSchoolBuildings.org
Budget Update FY17 Outlook
*Tabled to March 30, 2016 Board Meeting

39 www.MassSchoolBuildings.org
Expense Category FY15 Budget FY15 Expenditures
(7/1-6/30)
% Expended (FY15 Budget) FY16 Budget
FY16 YTD Expenditures
7/1-1/31% (FY16 Budget)
Administrative Expense Budget Total Administrative Expense Budget [6] 8,916,623$ 7,052,793$ 79.1% 8,480,608$ 4,590,735$ 54.1%
Other Post Employment Benefits (OPEB) [7] 100,000$ 100,000$ 100.0% 100,000$ -$ 0.0%
Capital Pipeline Professional Support Services & Issuance Related Costs Total Capital Program Professional Support Services 8,710,000$ 7,152,778$ 82.1% 10,699,684$ 5,181,576$ 48.4%
Arbitrage Rebate[10] 1,500,000$ 1,226,558$ 81.8% -$ 11,842,422$ n/a
Grant ProgramPrior Grants[11] 197,511,285$ 197,946,924$ 100.2% 185,093,670$ 83,857,227$ 45.3%Waiting List[12] 42,131,684$ 26,534,249$ 63.0% 25,489,887$ 20,561,882$ 80.7%Capital Pipeline Grants[13] 610,598,153$ 544,518,569$ 89.2% 585,000,000$ 266,061,293$ 45.5% Total Grant Program 850,241,122$ 768,999,742$ 90.4% 795,583,557$ 370,480,402$ 46.6%
Grand Total - Operating Budget 869,467,745$ 784,531,871$ 90.2% 814,863,849$ 392,095,136$ 48.1%
FY 16FY 15
MSBA Administrative Operations and Grant Programs Budget
Budget Update | January 31, 2016
40
Finance Update
www.MassSchoolBuildings.org
Budget Update FY17 Outlook

41 www.MassSchoolBuildings.org
FY15 Budget
FY15 Expenditures
(7/1-6/30)
% Expended
(FY15 Budget) FY16 Budget
FY16 YTD Expenditures
(7/1-1/31)% of FY16
Budget
Commissioning Consultants[1] 4,000,000$ 4,150,823$ 103.8% 3,800,000$ 1,837,691$ 48.4%Project Management Services[2] 2,300,000$ 1,519,176$ 66.1% 1,250,000$ 644,680$ 51.6%Architectural Services[3] 650,000$ 371,594$ 57.2% 680,000$ 241,709$ 35.5%Cost Estimating Services[4] 200,000$ 1,384$ 0.7% 100,000$ -$ 0.0%Audit & Other Compliance[5] 50,000$ -$ 0.0% -$ -$ n/aCapital Program Information Systems[6] 135,000$ 176,504$ 130.7% 43,184$ 3,388$ 7.8%Cost of Issuance[7] 1,000,000$ 932,954$ 93.3% 2,650,500$ 2,454,108$ 92.6%School Survey[8] -$ -$ NA 2,000,000$ -$ 0.0%Other[9] 250,000$ 344$ 0.1% 176,000$ -$ 0.0%Legal[10] 125,000$ -$ 0.0% -$ -$ n/a
Capital Program Support Services 8,710,000$ 7,152,778$ 82.1% 10,699,684$ 5,181,576$ 48.4%
Capital Pipeline - Project Related Support Services DetailBudget Update | January 31, 2016 cont.