BMC Bioinformatics BioMed Central - uni-rostock.de · BMC Bioinformatics Software Open ... Germany...
16
BioMed Central Page 1 of 16 (page number not for citation purposes) BMC Bioinformatics Open Access Software VANLO - Interactive visual exploration of aligned biological networks Steffen Brasch 1 , Lars Linsen 2 and Georg Fuellen* 3 Address: 1 Department of Mathematics and Computer Science, Ernst-Moritz-Arndt-University, Greifswald, Germany, 2 School of Engineering and Science, Jacobs University, Bremen, Germany and 3 Institute for Biostatistics and Informatics in Medicine and Ageing Research, University Rostock, Germany Email: Steffen Brasch - [email protected]; Lars Linsen - [email protected]; Georg Fuellen* - [email protected] * Corresponding author Abstract Background: Protein-protein interaction (PPI) is fundamental to many biological processes. In the course of evolution, biological networks such as protein-protein interaction networks have developed. Biological networks of different species can be aligned by finding instances (e.g. proteins) with the same common ancestor in the evolutionary process, so-called orthologs. For a better understanding of the evolution of biological networks, such aligned networks have to be explored. Visualization can play a key role in making the various relationships transparent. Results: We present a novel visualization system for aligned biological networks in 3D space that naturally embeds existing 2D layouts. In addition to displaying the intra-network connectivities, we also provide insight into how the individual networks relate to each other by placing aligned entities on top of each other in separate layers. We optimize the layout of the entire alignment graph in a global fashion that takes into account inter- as well as intra-network relationships. The layout algorithm includes a step of merging aligned networks into one graph, laying out the graph with respect to application-specific requirements, splitting the merged graph again into individual networks, and displaying the network alignment in layers. In addition to representing the data in a static way, we also provide different interaction techniques to explore the data with respect to application-specific tasks. Conclusion: Our system provides an intuitive global understanding of aligned PPI networks and it allows the investigation of key biological questions. We evaluate our system by applying it to real- world examples documenting how our system can be used to investigate the data with respect to these key questions. Our tool VANLO (Visualization of Aligned Networks with Layout Optimization) can be accessed at http://www.math-inf.uni-greifswald.de/VANLO . 1 Background 1.1 Introduction In many biological processes proteins play a key role. They are involved in biological regulation, development, growth, locomotion, metabolism, and reproduction. Therefore, the study and analysis of proteins is of high importance in the fields of biology and medicine. Due to their chemical structure proteins are able to interact with each other. These interactions trigger many biological processes. For example, signals from the exterior of a cell Published: 12 October 2009 BMC Bioinformatics 2009, 10:327 doi:10.1186/1471-2105-10-327 Received: 22 May 2009 Accepted: 12 October 2009 This article is available from: http://www.biomedcentral.com/1471-2105/10/327 © 2009 Brasch et al; licensee BioMed Central Ltd. This is an Open Access article distributed under the terms of the Creative Commons Attribution License (http://creativecommons.org/licenses/by/2.0 ), which permits unrestricted use, distribution, and reproduction in any medium, provided the original work is properly cited.
Transcript of BMC Bioinformatics BioMed Central - uni-rostock.de · BMC Bioinformatics Software Open ... Germany...

BioMed CentralBMC Bioinformatics
ss
Open AcceSoftwareVANLO - Interactive visual exploration of aligned biological networksSteffen Brasch1, Lars Linsen2 and Georg Fuellen*3Address: 1Department of Mathematics and Computer Science, Ernst-Moritz-Arndt-University, Greifswald, Germany, 2School of Engineering and Science, Jacobs University, Bremen, Germany and 3Institute for Biostatistics and Informatics in Medicine and Ageing Research, University Rostock, Germany
Email: Steffen Brasch - [email protected]; Lars Linsen - [email protected]; Georg Fuellen* - [email protected]
* Corresponding author
AbstractBackground: Protein-protein interaction (PPI) is fundamental to many biological processes. In thecourse of evolution, biological networks such as protein-protein interaction networks havedeveloped. Biological networks of different species can be aligned by finding instances (e.g. proteins)with the same common ancestor in the evolutionary process, so-called orthologs. For a betterunderstanding of the evolution of biological networks, such aligned networks have to be explored.Visualization can play a key role in making the various relationships transparent.
Results: We present a novel visualization system for aligned biological networks in 3D space thatnaturally embeds existing 2D layouts. In addition to displaying the intra-network connectivities, wealso provide insight into how the individual networks relate to each other by placing aligned entitieson top of each other in separate layers. We optimize the layout of the entire alignment graph in aglobal fashion that takes into account inter- as well as intra-network relationships. The layoutalgorithm includes a step of merging aligned networks into one graph, laying out the graph withrespect to application-specific requirements, splitting the merged graph again into individualnetworks, and displaying the network alignment in layers. In addition to representing the data in astatic way, we also provide different interaction techniques to explore the data with respect toapplication-specific tasks.
Conclusion: Our system provides an intuitive global understanding of aligned PPI networks and itallows the investigation of key biological questions. We evaluate our system by applying it to real-world examples documenting how our system can be used to investigate the data with respect tothese key questions. Our tool VANLO (Visualization of Aligned Networks with LayoutOptimization) can be accessed at http://www.math-inf.uni-greifswald.de/VANLO.
1 Background1.1 IntroductionIn many biological processes proteins play a key role.They are involved in biological regulation, development,growth, locomotion, metabolism, and reproduction.
Therefore, the study and analysis of proteins is of highimportance in the fields of biology and medicine. Due totheir chemical structure proteins are able to interact witheach other. These interactions trigger many biologicalprocesses. For example, signals from the exterior of a cell
Published: 12 October 2009
BMC Bioinformatics 2009, 10:327 doi:10.1186/1471-2105-10-327
Received: 22 May 2009Accepted: 12 October 2009
This article is available from: http://www.biomedcentral.com/1471-2105/10/327
© 2009 Brasch et al; licensee BioMed Central Ltd. This is an Open Access article distributed under the terms of the Creative Commons Attribution License (http://creativecommons.org/licenses/by/2.0), which permits unrestricted use, distribution, and reproduction in any medium, provided the original work is properly cited.
Page 1 of 16(page number not for citation purposes)

BMC Bioinformatics 2009, 10:327 http://www.biomedcentral.com/1471-2105/10/327
are mediated to the interior of the cell by protein-proteininteraction (PPI) of the signaling proteins. Such processesare also involved in diseases such as cancer. PPIs are fun-damental to life, and their investigation yields insight intothe evolution of animals [1] and into biochemical func-tion [2].
For each species its proteins and their interactions form aPPI network. The PPI networks of different species arerelated if they evolved from a common ancestor whosePPI network can be viewed as their common ancestral net-work. Learning more about the evolution of PPI networkshelps us understand the networks themselves. PPI net-works can be aligned by finding proteins with the samecommon ancestor, so-called orthologs [3,4]. Investigationof such an alignment allows for the detection of similari-ties and dissimilarities between different species. Forexample, the interaction network between key regulatorsof stem cell pluripotency (the proteins Oct4, Sox2, andNanog) is believed to be shared by mouse and human,while there are differences in the signaling network thatcontrols the key regulators [5]. In Section 1.2 we providethe fundamental biological background on proteins, PPInetworks, and their alignment. This description leads tothe formulation of the key questions that one wants toaddress by investigating aligned biological networks.
Since tackling these questions requires the simultaneousexploration of different types of relationships betweenproteins, research on biological networks demands thesupport of a graphical display of such networks. As biolo-gists are interested in viewing the interaction of the pro-teins within one species, but also the alignment based onthe orthologous proteins between the species, standardgraph layouts are of limited use. First attempts to the vis-ualization of aligned biological networks can mostly beregarded as ad-hoc approaches in terms of visualizationmethodology, see the related work in Section 1.3. Withthis paper, we intend to
• present a novel solution to the problem that appliesvisualization technology optimizing layout and inter-action,
• discuss our contribution in terms of visualizationmethods and how they relate to existing methodsfrom other application areas, and
• show how our interactive visual exploration systemis used in practice.
Instead of presenting yet another ad-hoc approach to vis-ualize aligned biological networks, we built an interactivevisualization system that allows for a systematic explora-tion of the data. Our system is based on a new 2.5D layout
approach, see Section 2.1, and provides the user with var-ious application-targeted interaction techniques to visu-ally explore the alignment, see Section 2.2. The layout hasto fulfill certain specific requirements, which are formu-lated in Section 1.4. How an application scientist caninteractively and visually explore network alignments isdescribed in an application scenario in Section 3.
1.2 Protein-Protein Interaction Networks and Key QuestionsProtein-protein interactions (PPIs) are transient or perma-nent connections between proteins, and they are impor-tant for many biological phenomena such as signaling,transcriptional regulation, and multi-enzyme complexes.They are explained by molecular adhesive forces betweenparts of the proteins (domains) which in turn can betracked down to the atomic level. The proteins of anorganism and their interactions form a PPI network.
Interaction networks evolve by the loss and gain of nodes(proteins) and links (interactions). It is assumed that thecomplex networks interconnecting the components of anorganism such as a human being are, like all of life, theresult of a more or less gradual evolutionary process ofdescent with modification. Emergence of biological com-plexity is nevertheless poorly understood, and a deeperunderstanding is of utmost importance.
As the PPI networks of different species evolved from acommon ancestor network, we are able to align them. Anetwork alignment for a number of networks from differentspecies specifies which nodes (representing the proteins)in one network correspond to (i.e. are orthologous to)which nodes in the other networks. This correspondencemay be one to one, or it may relate a set of paralogs in onespecies to an orthologous set of paralogs in another spe-cies. More precisely, we view proteins from one species tobe paralogous if they evolved by duplication after the spe-ciation event splitting the last common ancestor. Two pro-teins in one species that evolved from the same protein arenot understood as paralogous if they were already distinctproteins in the PPI network of the last common ancestor.In Additional File 1, we provide a more detailed discus-sion on the biological background of protein interactionnetwork evolution. In a recent strand of research severalgroups have begun to systematically compare interactionnetworks between organisms, and the network of oneorganism with itself [3]. In the first case, orthologous sub-networks are inferred, as described above. Paralogous sub-networks can be detected in the second case. In particular,the PathBlast tool [6] can detect orthologous paths in twonetworks. Given a path or a small network to search forand a network to search in, it returns orthologs of thequery path/network in the search network, displayed in agraphical "side by side" output [7,8]. PathBlast also aligns
Page 2 of 16(page number not for citation purposes)

BMC Bioinformatics 2009, 10:327 http://www.biomedcentral.com/1471-2105/10/327
networks for more than two species. Another networkalignment approach called "Local Graph Aligner" wasdeveloped based on a spin model [9]. This approach isused to align several networks and evaluates the statisticalsignificance of the alignment. Yet another approach, Net-workBlast [10], uses an efficient representation of align-ments and infers conserved complexes. The output ofNetworkBlast can be used as input for VANLO. In anotherapproach, networks are not directly aligned by their graphstructure. Instead, they are aligned based on modeling theevolution of the networks from a common ancestral PPInetwork using Bayesian methodology [11]. This approachallows the alignment of more than two large networks. Itdoes not only compute an alignment, it also explains howthe networks evolved.
In biology, scientists are not only faced with PPI networksbut with many other kinds of biological networks includ-ing regulatory ones that involve DNA-protein interactionand metabolic ones that include small metabolites asnodes. These networks are also related by evolution andcan be aligned. Therefore visualization techniques devel-oped for aligned PPI networks can also be used for thesekinds of biological networks. Analysis of all kinds of net-works will gain importance, in particular in biomedicine.After all, complex diseases must be tackled nowadays:cancer, arteriosclerosis and dementia are all multifacto-rial. They all have their cause in the interplay of a multi-tude of factors, many of which corresponding to networksgone out of order. In this context, comprehensive visuali-zation can be a trigger of medical progress.
Given aligned PPI networks of different species, biologistsare particularly keen on having means to answer the fol-lowing questions:
• What is the conserved core of the alignment, i.e., itsmost ancestral part?
• What are the cores of the underlying pairwise align-ments?
• What is new in each network?
The core of an alignment consisting of orthologous pro-teins in all species that share the same interactions mostlikely consists of proteins responsible for the same biolog-ical process and with the same function. This insightallows biologists to predict some protein properties fromaligned PPI networks [4]. Furthermore, the core of analignment is a good estimate for the network of the lastcommon ancestor of the species involved. The pairwisecores are good estimates for the last common ancestornetwork of two species. Hence, they should be exploredfor the networks of two species that are close in the species
tree. Detection of pairwise cores can help biologists toreconstruct the evolution of parts of the PPI network.
Newly developed parts in a PPI network are usuallyassumed to represent new functionality, that did not existbefore. After being identified, this new part may after-wards be subject to further investigations. Network com-parison should allow to find putative errors in one of thenetworks, or in the alignment. One hint for an error(mostly an error in the underlying databases) could be anedge existing only in one of the species, and the user canhave a closer look, trying to find out what the evidence forthis edge is and whether this interaction really exists.
1.3 Related Work1.3.1 Graph DrawingIt is intuitive to represent biological networks such as PPInetworks as graphs. In a PPI network the proteins can berepresented as vertices of a graph and the PPIs as edges ofthe graph. Therefore, visualizing biological networks is aspecial subject of graph drawing which is a well-studiedfield in information visualization [12].
The layout of a graph is most important because it deter-mines the human perception of the graph [13]. In graphdrawing one is generally interested in optimizing the lay-out of the graph with respect to some properties and con-straints. Many different approaches exist, depending onthe properties of the graph or on the information one isinterested to visually extract or highlight. Graphs are mostcommonly drawn using a 2D layout where vertices aredrawn as nodes and edges represented by lines. Plenty ofalgorithms exist for automated graph drawing [14]. Prob-ably the most prominent approach to layout a graph isgiven by the family of force-directed algorithms [15-20].The goal of these algorithms is to group interconnectednodes together and to spatially separate non-connectednodes. Therefore, attracting and repelling forces aredefined and applied for node interference. Typically, allnodes repel each other using pairwise repelling forces andall connected nodes attract each other (up to a minimumdistance). Algorithms like the one by Fruchterman andReingold [18] or the one by Kamada and Kawai [19] iter-atively compute a displacement for each node determinedby the defined forces until convergence. The advantage ofthese algorithms is their flexibility, i. e. the possibility todefine the forces according to a special application, whichmakes these algorithms suitable for many different graphsin diverse applications. Another iterative approach is todefine an energy function which penalizes bad propertiesof the layout, and then to use simulated annealing oranother optimization algorithm for iteratively optimizingthis function [15]. Within the field of biology, a widerange of graph layout algorithms are considered as can beseen in the numerous visualization tools for biological
Page 3 of 16(page number not for citation purposes)

BMC Bioinformatics 2009, 10:327 http://www.biomedcentral.com/1471-2105/10/327
networks like Cytoscape [21], ProViz [22], VisANT [23], orVANTED [24].
1.3.2 Visualizing Aligned NetworksAligned networks can be regarded as a set of graphs, wherethe alignment establishes connections between the graphsor, more precisely, between entities of the graphs (e.g.,some of the nodes are aligned across the networks). Forvisualizing an alignment of PPI networks differentapproaches have been considered and are used today. Fora detailed survey on the state of the art in visualizingaligned biological networks we refer to our report [25],where we divide the approaches into two main classes,namely "side by side" and "all in one".
The "side by side" approach, follows the idea to draw theindividual aligned networks next to each other in a 2Dlayout and to highlight the aligned nodes by the same rel-ative position and/or additional edges connecting them[3,6,26]. The advantage of this approach is that it is ableto intuitively handle paralogous proteins. However, thisapproach is inappropriate for large network alignmentsand is hardly readable if there are many additional edgesfor representing the alignment relation.
The "all in one" approach draws the aligned networks injust one node-link diagram where one node represents theorthologous proteins of all networks [27,28]. Obviously,fewer edges and nodes are needed with this visualizationbut problems with the interpretation of the edges and alsowith displaying paralogs arise [25]. These problems can bealleviated to some degree by using the idea of metagraphs[29].
An appropriate solution that combines the advantages ofboth classes is given by using 2.5D layouts [30], where theindividual networks are laid out in 2D and the relation-ship of the entities is implied by drawing all 2D layoutssimultaneously using the third dimension and by placingcorresponding entities on top of each other. Schreiber[31] used such an approach for the comparison of differ-ent biological networks in the context of metabolic path-ways. However, his approach does not support thevisualization of paralogous entities (proteins). Moreover,he did not provide any interactive exploration methodsand his approach is specialized for metabolic pathwaysand a KEGG [32] like layout.
In terms of visualization methodology, visualizingaligned biological networks is related to the representa-tion of evolving graphs. When considering evolving(dynamic) graphs one deals with one graph that changesover time, instead of an alignment of related graphs. Sev-eral approaches for so-called dynamic graph drawing exist[33-36]. The layout considerations of these approaches
could easily be adopted to laying out aligned networks,where the split representation, i.e., each time step isshown in a separate drawing window, corresponds to the"side-by-side" layout and the merged representation, i.e.,all time steps integrated into one drawing window, corre-sponds to the "all-in-one" layout. Some dynamic graphdrawing approaches also consider a 2.5D approach witheach time step drawn in a separate layer where the layersare placed on top of each other [37,38]. Given the keyquestions formulated in the section 1.2, we observed thatthey can be more intuitively answered when using ournovel 2.5D layout algorithm, which considers the specificlayout requirements described in Section 1.4. In particu-lar, following these requirements, paralogs as well asorthologs can be identified easily.
1.4 Layout RequirementsFor the visualization of aligned biological networks sev-eral approaches exist and they were surveyed and dis-cussed in our report [25] where we derived some generallayout requirements. We generally assume, as all existingapproaches do, that the layout should be displayed as anode link diagram. Therefore, the general requirementsfor node link diagrams should be met also by a layout foraligned networks. Such general requirements are:
• All nodes should be clearly separated,
• nodes connected by an edge should be placed closeto each other to prevent long edges,
• the number of edge crossings should be minimized,and
• available space should be used in an optimal way.
As a network alignment is not just a simple graph withoutfurther constraints. We derived some specific require-ments that should be met by aligned network layouts.These specific requirements, designed to address the keyquestions outlined in Section 1.2, are:
• The structure of individual networks should be easilyidentifiable,
• individual networks should be clearly separated,
• alignment relations, i.e., which nodes and links arecorresponding to which nodes and links in other net-works, should be shown in a visually intuitive man-ner, and
• the core of the alignment should be easily retrievableand comprehensible.
Page 4 of 16(page number not for citation purposes)

BMC Bioinformatics 2009, 10:327 http://www.biomedcentral.com/1471-2105/10/327
2 Implementation2.1 The LayoutWe developed a novel interactive visual network explora-tion system with respect to the requirements specifiedabove. Its main features are an appropriate aligned net-work layout and a range of helpful interaction mecha-nisms to visually explore the alignment.
2.1.1 2.5D SettingTaking into consideration the approaches discussed inSection 1.3, our layout is based on a 2.5D setting for thealigned graphs. The different networks are laid out in sep-arate equidistant layers placed on top of each other.
To support an intuitive understanding of orthologousproteins of different networks, orthologs are assigned thesame 2D position across the different layers. Therefore,the alignment relation is naturally and intuitively embed-ded into the layout and no additional edges, connectingthe orthologous proteins, are required, as they are in "sideby side". Thus, we only use one type of edge, namely theinteraction edges between proteins, which keeps the visu-alization simple.
Paralogs are handled such that they are drawn closelytogether in a structured way at 2D positions within a well-defined area around the 2D position of the orthologouspartners. Hence, paralogous structures can easily be iden-tified.
2.1.2 StrategyFor visualizing aligned networks with the above-men-tioned layout representations ("side by side" and "all inone", or 2.5D setting), the networks are first laid out asnode link diagrams in 2D. For the three layout representa-tions the same layout algorithm can be applied, becauseall of them need the individual networks laid out in 2Dwith general graph drawing requirements and theorthologs of the different networks should have the sameposition.
To ensure this global layout structure, where the ortholo-gous sets of paralogs of the different networks are posi-tioned to the same 2D positions within the respectivelayers, the aligned networks need to be handled simulta-neously. The strategy of our layout algorithm is
1. to build one common graph representing the com-plete network alignment by merging the correspond-ing orthologous sets of paralogs into one node,
2. to lay out this merged graph in 2D using knowngraph layout algorithms,
3. to split the previously merged paralogs and com-pute their local arrangement within each network, and
4. to map the networks to different layers, which arerendered in a 2.5D setting.
The first three steps are independent of the 2.5D settingsuch that other settings ("side by side" or "all in one") canbe used, if desired.
2.1.3 Layout AlgorithmOur algorithm consists of four steps, which are describedin this section. In Figure 1, we illustrate the individualsteps by giving an example. The example alignment con-sists of the two networks shown in Figure 1Ia) and 1Ib),where nodes with the same color are corresponding. Cor-responding nodes are orthologs if they appear in differentpanels and they are paralogs if they appear in the samepanel.
Merging into one graphThe given network alignment can be understood as onelarge graph with proteins as nodes. In a first step we col-lapse each orthologous set of corresponding paralogs,into one node. Hence, all proteins orthologous to eachother are represented by a single node in this mergedgraph. All edges in the merged graph represent PPIs. Themerged graph for our example is shown in Figure 1II). Theadvantage of using a merged graph is twofold. First, theorthologous proteins are already assigned to the sameposition, and secondly, the remaining graph is smallerand computing its layout becomes easier because the tra-ditional layout algorithms usually work better on smallgraphs.
Computing the layout of the merged graphThe merged graph now is laid out in 2D by applying oneof the graph layout algorithms mentioned in Section 1.3.For biological networks no additional graph-theoreticalinformation such as planarity or density can be assumeda priori. Therefore, no special layout algorithm for graphswith certain properties can be used. Heuristic methods area good choice in this case. In our visualization system weprovide the use of two force-directed algorithms, namelythe one by Fruchterman and Reingold [18] and the one byKamada and Kawai [19]. In addition, we provide the useof a simulated-annealing algorithm [15], as it allows us todefine an energy function adapted to our needs. The usermay choose her/his preferred algorithm or she/he maysimply test all three options and pick the result she/helikes best.
For our example the new layout is shown in Figure 1III).
Page 5 of 16(page number not for citation purposes)

BMC Bioinformatics 2009, 10:327 http://www.biomedcentral.com/1471-2105/10/327
Page 6 of 16(page number not for citation purposes)
The layout algorithmFigure 1The layout algorithm. In this example proteins with the same color are orthologous (if they are in different panels in rows 1, 3, or 4 of the figure) or paralogous (if they are in the same panel). The two networks in Ia) and Ib) are first merged to the graph in II). This graph is now laid out, as seen in III). This layout is assigned to the two individual networks as shown in IVa) and IVb). In the last step paralogs, that are still merged in the individual networks are laid out and the results are shown in Va) and Vb).

BMC Bioinformatics 2009, 10:327 http://www.biomedcentral.com/1471-2105/10/327
In our simulated annealing approach we have four mainterms. We sum up the lengths of the edges, the number ofedge crossings, and the inverse of the angles between allpairs of incident edges to penalize these properties. Wealso add penalties if two nodes are too close to each other,in order to always clearly separate all nodes. If nodes con-sist of paralogous proteins, the lengths of their adjacentedges are divided by the number of paralogs to allowlonger edges and therefore more space for these nodes.
Undo the merging stepStarting from the merged layout where all orthologoussets of paralogs have the same position, the final layout iscomputed. First the node positions computed for themerged graph are distributed onto the nodes of the indi-vidual networks, as shown in Figure 1IVa) and 1IVb).Afterwards the positions of the paralogous proteins haveto be modified, because they still have the same position.These layout computations for the sets of paralogs can bedone for each network individually. For one set of para-logs the free space around the position that is assigned tothe set is determined according to the number of mergedparalogs. Recall that the energy term used in the previousstep allocates more space for merged paralogs. Within thisfree space local 2D arrangements for the small subgraphsof paralogs need to be determined. The local arrangementwe chose for our implementation is to distribute the par-alogs equidistantly on a small circle within the free space,where the center of the circle is the previously assigned 2Dposition. After this step, the layout of the layers is com-pleted, see Figure 1Va) and 1IVb). In each of the networksthere was just one set of paralogs to be laid out.
Assigning the 2.5D settingFrom the graph layout the 2.5D representation of thealigned networks is obtained by assigning each networkan individual layer displayed in Cartesian coordinates atequidistant heights z. For each node, a three-dimensionalprimitive is rendered at (x, y, z) where (x, y) are the coor-dinates computed by the algorithm and z is the assignedheight for the network. The edges are connecting thenodes inside each individual network and therefore lieautomatically in one layer, i.e. the start- and endpointhave the same height coordinate z. No edges between dif-ferent layers are necessary, as orthologous groups are ren-dered on top of each other and are therefore easy toidentify just by position.
2.2 Interactive Visual ExplorationThe layout algorithm presented in the previous sectiongenerates an overall arrangement considering all proteinsand all relations among them. When exploring the data,the user may be interested in seeing the entire structure,but typically also wants to concentrate on certain aspects.We provide interaction mechanisms that support such a
visual exploration and analysis. Since all interactionsoperate on our 2.5D graph layout embedded in 3D space,all views are consistent and embedded into the overallcontext.
For the description of the interaction mechanisms that aresupported by our system, we make use of the taxonomyintroduced by Yi et al. [39].
ExploreSince we are using a 2.5D layout, rotation, translation,and zooming are supported. Different angles highlightdifferent aspects of the data set.
ReconfigureAlthough our 2.5D layout serves as the basis for all explo-ration tasks, we still support 2D layouts. One reason isthat application scientists are currently used to look at 2Dlayouts. Providing the 2D layouts in addition to our 2.5Dlayout allows them to easily correlate our visualization towhat they have in mind. We hope that this reduces thebarrier to use our tool. Another reason is that 2D layoutsmay be beneficial for non-interactive visualizations whichmay be rendered for publications. We support both tradi-tional 2D layouts, i.e. "side by side" and "all in one".
EncodeWe support different color encodings for different net-works. In addition, nodes can be encoded by shape infor-mation.
Abstract/ElaborateWhen exploring the entire aligned network, showing allparalogs may hinder the comprehension of the globalstructure. Therefore we support an abstraction mechanismthat collapses nodes representing paralogs into just onenode. When investigating a certain substructure these par-alogs are, of course, important to display therefore we canundo the abstraction at any time.
FilterIt is obvious that filtering is one of the main interactionfeatures. In particular, we allow displaying/hiding edgesor even complete individual networks. Of course, filteroperations embed other interaction mechanisms likeelaborating on paralogs.
In addition we found it useful to allow the user to storelayouts for alignments to continue the exploration at alater time point, and to allow the user to take screen shots.
3 Results and discussionFor our application scenario we decided to use an align-ment of the PPI networks of five species. We chose the PPInetwork of the insulin/IGF1 pathway. This pathway is of
Page 7 of 16(page number not for citation purposes)

BMC Bioinformatics 2009, 10:327 http://www.biomedcentral.com/1471-2105/10/327
major importance not just in diabetes research, but it isrelevant to molecular ageing in general [40]. The interac-tion data for our example is taken from the STRING [41]Web server (version 8.0), which integrates different kindsof biological data, for example databases such as KEGG[32], for building a protein interaction network. We inte-grated interactions traceable to databases or experiments;we did not use any data based on other evidence such astext-mining because they often contain errors. We onlytrusted interactions with a high confidence (STRING con-fidence score >0.7) and we deleted a few interactions thatwere listed by STRING under the label 'Experimental Data'even though they were predicted by orthology (e.g. theinteraction between PI3K and IRS1 in Pan troglodytes has
a score of 0.768 in STRING, but no experimental evi-dence).
Finally, we manually investigated interactions scoringbetween 0.6 and 0.7 and added them, if STRING listedexperimental evidence from BioGRID [42], BIND [43] orHPRD [44]. For the detection of synonyms and orthologsand also for the detection of paralogs we used iHop [45],HomoloGene [46], and Ensembl [47]. For the insulin/IGF1 network we found sufficient data for human, chim-panzee, mouse, rat, and fly. In the following we use ourvisualization system to explore the network alignmentthat is shown in Figure 2. The network of each species isshown in one layer and they are additionally color codedas follows: human (pink), chimpanzee (red), mouse
The Insulin/IGF1 PathwayFigure 2The Insulin/IGF1 Pathway. Alignment of human (pink), chimpanzee (red), mouse (orange), rat (yellow), and fly (gray). The layout is computed using our simulated annealing algorithm. All five species are shown and all paralogs (AKT1,2,3 and IRS1,2), too. For a better overview only the human network is labeled.
Page 8 of 16(page number not for citation purposes)

BMC Bioinformatics 2009, 10:327 http://www.biomedcentral.com/1471-2105/10/327
(orange), rat (yellow), and fly (gray). Two aspects of net-work evolution and some artifacts due to missing datacatch the eye immediately.
In the 2.5D layout in Figure 2, we can see that the IGF1/IGF1R part of the network (top right of the figure) is notfound in fly (gray) but it exists in mammals, and we inferthat it evolved in the lineage from the common ancestorof fly and mammals (called the ancestral bilaterian ani-mal by zoologists, see http://www.tolweb.org/Bilateria/)to mammals. This observation is in concordance withRussell and Kahn ([40], Box 1). More data (on deuteros-tomic animals at the later branching points along the lin-eage from the bilaterian ancestor to mammals, such as seaurchin, sea squirt, lancelet, fish, frog, and/or bird) wouldenable us to set a more precise time point at which thispart of the network may have evolved. The fly network(gray) is devoid of any paralogs; complexity of the path-way in mammals increased by duplication. The paralogsthat evolved in the mammalian species form two clusters,the IRS cluster and the AKT cluster, and the visualizationmakes it clear that these two clusters of duplicated nodesare accompanied by a large number of duplicated edges.Tracking these down in STRING, we observe that theduplicated edges are derived from KEGG. However, KEGGdoes not describe the interactions of each paralog individ-ually. Instead, it only lists the interactions of one repre-sentative AKT/IRS protein, and data processing bySTRING was done under the assumption that the interac-tions are valid for each paralog, an assumption that is notnecessarily true. Thus, the duplicated edges may be a dataprocessing artifact. On the other hand, if the assumptionis true, the interpretation is that in the insulin signalingpathway, interactions were usually kept after gene dupli-cation leading to paralogs. For example, the number ofedges from PI3K to the IRS cluster equals the number ofIRS paralogs (two for human, mouse and rat and one forfly, see also Figure 2) except for chimp, where for PI3Kthere is no interaction with the other proteins, as dis-cussed below. Such a scenario, if it reflects biological real-ity and is not a database artifact, indicates that the IRSparalogs are alternative stopovers in the standard signal-ing chain from IR to PI3K, via IRS (see [40], Box 1), indi-cating redundancy. (One specific explanation comes tomind: interaction data are often pooled over tissue types,so that it may well be that alternative paths are employedin different tissues, and these are regulated in a tissue-spe-cific way.)
Looking at the red network (chimpanzee, or chimp forshort), a large number of interactions (edges) existing inthe other networks are missing. In this situation filteringout the other networks and only looking at the network ofthe chimp and the human one for comparison supportsthe exploration. This is done easily and the filtered view is
shown in Figure 3. In chimp, only PDK1, PTEN and AKTare connected. There are no links (no red edges) connect-ing PDK1, PTEN and AKT to the other proteins. Here, thebiologist interpreting the network must know two factsfor a correct analysis: (a) human and chimpanzee are veryclosely related; their genomes and physiology are verysimilar, and (b) mouse and rat together form a group thatis in turn related to the human/chimpanzee group. Thus,the biologist concludes that the missing edges must bedue to missing data in STRING, and that they are notyielding insight into network evolution. In fact, chimpan-zee data are just recently becoming available and it is nowonder that these are incomplete. Moreover, the biologistcan use the network alignment to predict missing compo-nents (nodes and/or edges) in the chimpanzee networkwhich is expected to be almost identical to the humanone.
The interaction of fly FOXO1 (also known as dFOXO, Afxor CG3143) and IR (Figure 2 center) is only displayed incase of fly. Tracking down the link in STRING, an entryfrom the BIND database [48] is listed as evidence, whichin turn cites Puig et al. [49]. Their abstract includes thesentence "dFOXO [...] activates two key players of thedInR/dPI3K/dAkt pathway: the translational regulatord4EBP and the dInR itself". In short, FOXO activates InRin fly, where InR (Insulin receptor) is the ortholog of IR(Insulin receptor) in mammals. It is possible that the feed-back loop IR → PI3K → AKT → FOXO → IR (see also [40],Box 1) is not just active in fly, and that it also exists in theother species. Here, our visualization yielded an interest-ing hypothesis, which is not so obvious in a series of "sideby side" renderings.
Using filtering operations to mask out chimp, rat, and flyallows an easy comparison of human and mouse asshown in Figure 4. In this Figure the eye can easily identifythe identities and the differences. First of all, there is nodifference with respect to the nodes. However, some linksin human are missing in mouse. For example, these arelinks from SIRT1 to FOXO1, from IR to IGF1R, and fromIGF to IRS. All these links can be traced back to human-specific data incorporated into STRING; the links arereported in a publication supporting a BIND entry [50] orthey are derived from HPRD [44] and PID [51].
Finally, with the help of our visualization we are able toidentify the core of the network alignment, which consistsof the nodes and edges that are present for the largestnumber of species. Setting the minimum species thresh-old to 2, the core does not include the link between FOXOand INSR (only present in fly) that we discussed above,nor the interactions FOXO1 → PDK1, IRS → PTEN andPTEN → IR (in fly), nor the interactions that are presentonly in human.
Page 9 of 16(page number not for citation purposes)
BMC Bioinformatics 2009, 10:327 http://www.biomedcentral.com/1471-2105/10/327
If there are many paralogs it is very useful to use abstrac-tion, by collapsing the paralogs, reducing the number ofdisplayed nodes and edges. The information for findingthe core network will nevertheless not be missing in thisabstract view, see Figure 5. In particular, the edges fromPI3K to IRS can be seen much easier in Figure 5 than inFigure 2.
Researchers interested in one of the traditional layout set-tings such as a "side by side" layout, can obtain one by amouse click, see Figure 6. In this setting one can easily seethat there are many edges missing in the network of thechimpanzee (green). However, it is hard to recognizewhich edges do exist in most of the networks and there-fore might belong to the core of the alignment. Moreover,
it is hard to recognize the novel interactions discussedabove.
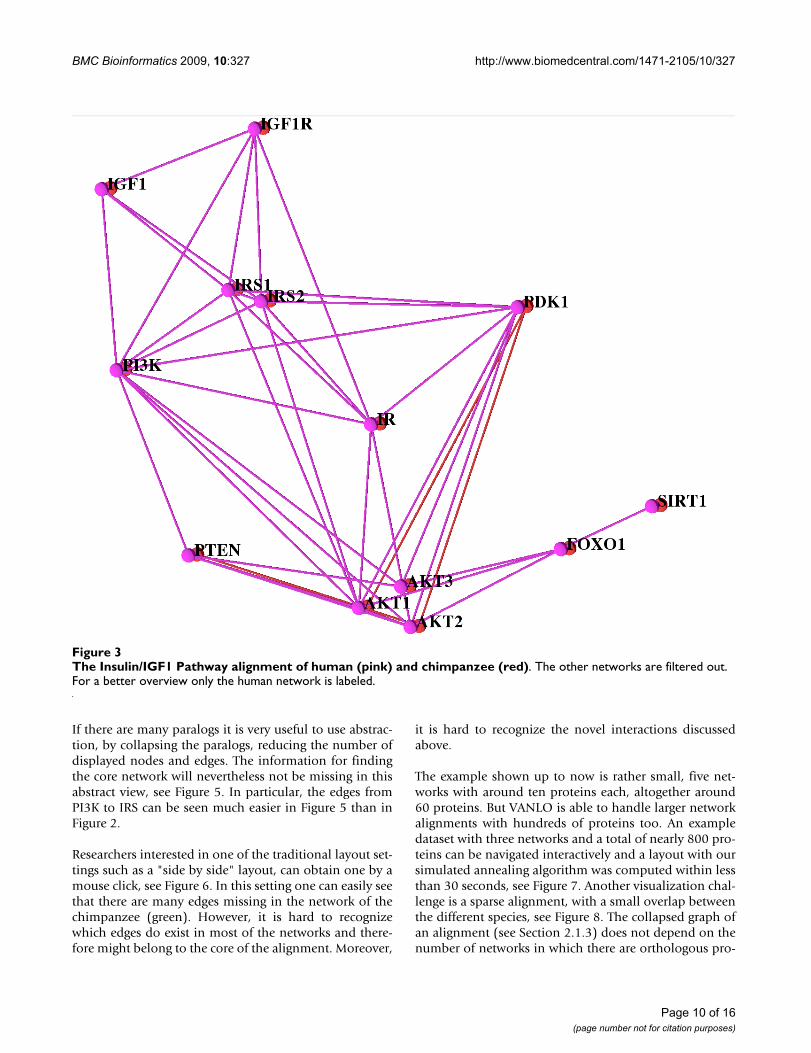
The example shown up to now is rather small, five net-works with around ten proteins each, altogether around60 proteins. But VANLO is able to handle larger networkalignments with hundreds of proteins too. An exampledataset with three networks and a total of nearly 800 pro-teins can be navigated interactively and a layout with oursimulated annealing algorithm was computed within lessthan 30 seconds, see Figure 7. Another visualization chal-lenge is a sparse alignment, with a small overlap betweenthe different species, see Figure 8. The collapsed graph ofan alignment (see Section 2.1.3) does not depend on thenumber of networks in which there are orthologous pro-
The Insulin/IGF1 Pathway alignment of human (pink) and chimpanzee (red)Figure 3The Insulin/IGF1 Pathway alignment of human (pink) and chimpanzee (red). The other networks are filtered out. For a better overview only the human network is labeled.
Page 10 of 16(page number not for citation purposes)

BMC Bioinformatics 2009, 10:327 http://www.biomedcentral.com/1471-2105/10/327
teins and therefore the layout computation for sparsegraphs is as efficient as the one for dense graphs.
In conclusion, our tool can be used for the detailedinspection of the similarities and differences of alignableinteraction networks, as we did for two (human andmouse, Figure 4) and five networks (Figure 2). In turn, abird's eye view of the latter alignment provided by ourtool yielded some quick insights into regions where para-logs are abundant, and regions where some subnetworksare not represented. Interaction mechanisms supportedthe analysis tasks by filtering the required informationand facilitating an interactive display of the parts to beinvestigated.
4 ConclusionThe visualization system for aligned biological networks(VANLO) we presented, enables the user to answer somekey questions concerning network alignments. It also pro-vides several interaction techniques allowing the user tovisually explore aligned networks. Additionally, a new lay-out approach using 2.5D is presented. This approach ful-fills all requirements for a layout of alignments. Thelayout turns out to be helpful to understand the structureof a network alignment. Also, traditional representationsare supported. Thus the visualization system is a very use-ful tool for biologists to explore alignments, to find outdetails and to render results.
The Insulin/IGF1 pathway alignment of the network for human (pink) and mouse (orange) onlyFigure 4The Insulin/IGF1 pathway alignment of the network for human (pink) and mouse (orange) only. The same layout and settings as in Figure 2 are used but the other three species are filtered out. Both networks are rather similar, the few dif-ferences (e.g. missing interaction between SIRT and FOXO1 in mouse) are easily recognizable.
Page 11 of 16(page number not for citation purposes)

BMC Bioinformatics 2009, 10:327 http://www.biomedcentral.com/1471-2105/10/327
With respect to limitations of the software and futurework, it would be useful to automatically include proper-ties of the proteins and to automatically map them toshape or color attributes. This would help the user to eas-ily predict properties of proteins, where they are notknown. Regarding the edges, it would be useful to allowdifferent edge/arrow shapes, for example, to denote regu-lation of a protein (gene product) by another protein(transcription factor). Moreover, for very large networksin particular (more than several hundred nodes), we aredeveloping ways to transform/simplify these before ren-dering them, based for example on the ideas of Royer et
al. [52]. Finally, a visualization of the entire evolutionaryhistory of an aligned set of networks, starting from a smallancestral network, is on our agenda.
5 Availability and requirementsThe software project presented in this manuscript is calledVANLO (Visualization of Aligned Networks with LayoutOptimization) and is available on http://www.math-inf.uni-greifswald.de/VANLO. The presented software isimplemented in C++, where the included graphs areimplemented using the boost graph library and for thegraphical user interface QT was used. The simulated
A network alignment where all paralogous nodes have been collapsedFigure 5A network alignment where all paralogous nodes have been collapsed. The alignment features the Insulin/IGF1 Path-way as in Figure 2, with the same layout. Fewer interactions and fewer proteins are shown, yielding a better overview of the overall structure.
Page 12 of 16(page number not for citation purposes)
BMC Bioinformatics 2009, 10:327 http://www.biomedcentral.com/1471-2105/10/327
Page 13 of 16(page number not for citation purposes)
The Insulin/IGF1 pathway alignment of the network for all five species, human (pink), chimpanzee (red), mouse (orange), rat (yellow), and fly (gray) in a "side by side" settingFigure 6The Insulin/IGF1 pathway alignment of the network for all five species, human (pink), chimpanzee (red), mouse (orange), rat (yellow), and fly (gray) in a "side by side" setting. The same layout as in Figure 2 is used.
A large alignment with more than 200 proteins per species and nearly 800 nodes overallFigure 7A large alignment with more than 200 proteins per species and nearly 800 nodes overall. The layout for this align-ment is computed by our simulated annealing algorithm in less than 30 seconds.

BMC Bioinformatics 2009, 10:327 http://www.biomedcentral.com/1471-2105/10/327
annealing layout algorithm is an own implementationand the other layout algorithms are, sometimes modified,the ones provided by the boost graph library. This firstpublication of the software is only for the use with Win-dows XP but it will later on be published in a platformindependent version. A manual for the software, includ-ing a file format description for the alignment data, andan explanation of the usage is given in Additional file 2.The work is currently published under the lesser gnu pub-lic license (LGPL), which allows every user to freely usethe software.
6 Authors' contributionsSB did the implementation work and together with LLaccomplished the theoretical work on the visualizationideas. GF developed the visualization scenario togetherwith the interpretation and initiated this project. All threeauthors contributed to the manuscript. All authors readand approved the final manuscript.
7 Authors' InformationSB studied mathematics and recieved his Diploma in2005 at the Ernst-Moritz-Arndt-Universität Greifswald,
Germany. Thereafter he worked as a scientific member inthe field of visualization and computer graphics at theUniversität Greifswald, Germany, where he is actuallydoing his Ph.D. on visualization of protein interactiondata. His research interests are in the fields of visualizationand graph theory.
LL is an Associate Professor of Computational Science andComputer Science at the School of Engineering and Sci-ence of the Jacobs University, Bremen, Germany. Hereceived his academic degrees from the Universität Karl-sruhe (TH), Germany, including a Diploma in computerscience in 1997 and a Ph.D. in computer science in 2001.He spent three years as a post-doctoral researcher and lec-turer at the Institute for Data Analysis and Visualization(IDAV) and the Department of Computer Science of theUniversity of California, Davis, U.S.A. He joined theDepartment of Mathematics and Computer Science of theErnst-Moritz-Arndt-Universität Greifswald, Germany, asan assistant professor in 2004. Since 2006 he holds hiscurrent position at Jacobs University. LL's research inter-ests are mainly in the areas of scientific and information
A sparse network alignment for three speciesFigure 8A sparse network alignment for three species. In the part on the left, most of the blue network is missing and in the part on the right, most of the green network is missing.
Page 14 of 16(page number not for citation purposes)
BMC Bioinformatics 2009, 10:327 http://www.biomedcentral.com/1471-2105/10/327
visualization but include certain topics in computergraphics and geometric modeling.
Additional material
AcknowledgementsWe thank Clemens Harder for his assistance in data acquisition.
References1. Davidson EH, Erwin DH: Gene regulatory networks and the
evolution of animal body plans. Science 2006,311(5762):796-800.
2. Sharan R, Ulitsky I, Shamir R: Network-based prediction of pro-tein function. Mol Syst Biol 2007, 3:88.
3. Sharan R, Ideker T: Modeling cellular machinery through bio-logical network comparison. Nature Biotechnology 2006,24(4):427-433.
4. Berg J, Lässig M: Cross-species analysis of biological networksby Bayesian alignment. Proc Natl Acad Sci USA 2006,103(29):10967-10972.
5. Boiani M, Schöler HR: Developmental cell biology: Regulatorynetworks in embryo-derived pluripotent stem cells. NatureReviews Molecular Cell Biology 2005, 6(11):872-881.
6. Kelley BP, Sharan R, Karp RM, Sittler T, Root DE, Stockwell BR,Ideker T: Conserved pathways within bacteria and yeast asrevealed by global protein network alignment. Proc Natl AcadSci USA 2003, 100(20):11394-11399.
7. Kelley BP, Yuan B, Lewitter F, Sharan R, Stockwell BR, Ideker T:PathBLAST: a tool for alignment of protein interaction net-works. Nucleic Acids Res 2004:83-88.
8. Sharan R, Suthram S, Kelley R, Kuhn T, McCuine S, Uetz P, Sittler T,Karp R, Ideker T: Conserved patterns of protein interaction inmultiple species. Proc Natl Acad Sci USA 2005, 102(6):1974-1979.
9. Berg J, Lässig M: Local graph alignment and motif search in bio-logical networks. Proc Natl Acad Sci USA 2004,101(41):14689-14694.
10. Kalaev M, Bafna V, Sharan R: Fast and Accurate Alignment ofMultiple Protein Networks. In RECOMB, of Lecture Notes in Com-puter Science Volume 4955. Edited by: Vingron M, Wong L. Springer;2008:246-256.
11. Dutkowski J, Tiuryn J: Identification of functional modules fromconserved ancestral protein protein interactions. Bioinformat-ics 2007, 23(13):i149-158.
12. Herman I, Melançon G, Marshall MS: Graph Visualization andNavigation in Information Visualization: A Survey. IEEE Trans-actions on Visualization and Computer Graphics 2000, 6:24-43.
13. Blythe J, McGrath C, Krackhardt D: The Effect of Graph Layouton Inference from Social Network Data. In Graph Drawing, Pas-sau, Germany, September 20-22, 1995 Edited by: Brandenburg FJ.Springer; 1996:40-51.
14. Di Battista G, Eades P, Tamassia R, Tollis IG: Algorithms for Draw-ing Graphs: An Annotated Bibliography. Comput Geometry: The-ory Appl 1994, 4:235-282.
15. Davidson R, Harel D: Drawing graphs nicely using simulatedannealing. ACM Transactions on Graphics 1996, 15(4):301-331.
16. Eades P: A Heuristic for Graph Drawing. Congressus Numeran-tium 1984, 42:149-160.
17. Frick A, Ludwig A, Mehldau H: A Fast Adaptive Layout Algo-rithm for Undirected Graphs. In Proc DIMACS Int Work GraphDrawing, GD, 894 Edited by: Tamassia R, Tollis IG. Berlin, Germany:Springer-Verlag; 1994:388-403.
18. Fruchterman TMJ, Reingold EM: Graph Drawing by Force-directed Placement. Software - Practice and Experience 1991,21(11):1129-1164.
19. Kamada T, Kawai S: An algorithm for drawing general undi-rected graphs. Inf Process Lett 1989, 31:7-15.
20. Noack A: An energy model for visual graph clustering. Proceed-ings of the 11th International Symposium on Graph Drawing (GD 2003),LNCS 2912 2003:425-436.
21. Shannon P, Markiel A, Ozier O, Baliga NS, Wang JT, Ramage D, AminN, Schwikowski B, Ideker T: Cytoscape: a software environmentfor integrated models of biomolecular interaction networks.Genome Res 2003, 13(11):2498-2504.
22. Iragne F, Nikolski M, Mathieu B, Auber D, Sherman D: ProViz: pro-tein interaction visualization and exploration. Bioinformatics2005, 21(2):272-274.
23. Hu Z, Mellor J, Wu J, Delisi C: VisANT: an online visualizationand analysis tool for biological interaction data. BMC Bioinfor-matics 2004, 5:17.
24. Junker BH, Klukas C, Schreiber F: VANTED: A system foradvanced data analysis and visualization in the context ofbiological networks. BMC Bioinformatics 2006, 7:109.
25. Brasch S, Linsen L, Fuellen G: Visualization of Aligned BiologicalNetworks: A Survey. In Proc 2007 International Conference onCyberworlds Edited by: Wolter FE, Sourin A. IEEE Computer Society,USA; 2007:49-53.
26. Koyutürk M, Kim Y, Subramaniam S, Szpankowski W, Grama A:Detecting conserved interaction patterns in biological net-works. J Comput Biol 2006, 13(7):1299-1322.
27. Bandyopadhyay S, Sharan R, Ideker T: Systematic identification offunctional orthologs based on protein network comparison.Genome Res 2006, 16(3):428-435.
28. Hirsh E, Sharan R: Identification of conserved protein com-plexes based on a model of protein network evolution. Bioin-formatics 2007, 23(2):e170-6.
29. Hu Z, Mellor J, Wu J, Kanehisa M, Stuart JM, Delisi C: Towardszoomable multidimensional maps of the cell. Nature Biotech-nology 2007, 25(5):547-554.
30. Brandes U, Dwyer T, Schreiber F: Visual Understanding of Met-abolic Pathways Across Organisms Using Layout in Two anda Half Dimensions. Journal of Integrative Bioinformatics 2004,1:119-132.
31. Schreiber F: Visual comparison of metabolic pathways. J VisLang Comput 2003, 14(4):327-340.
32. Kanehisa M, Goto S: KEGG: Kyoto Encyclopedia of Genes andGenomes. Nucleic Acids Res 2000, 28:27-30.
33. Branke J: Dynamic graph drawing. In Graph Drawing - Models andAlgorithms Edited by: Kaufmann M, Wagner D. Springer, Berlin;2001:228-246.
34. Brandes U, Wagner D: A Bayesian Paradigm for DynamicGraph Layout. In GD '97: Proceedings of the 5th International Sympo-sium on Graph Drawing London, UK: Springer-Verlag; 1997:236-247.
35. Diehl S, Görg C: Graphs, They Are Changing. In GD '02: RevisedPapers from the 10th International Symposium on Graph Drawing London,UK: Springer-Verlag; 2002:23-30.
36. Görg C, Birke P, Pohl M, Diehl S: Dynamic Graph Drawing ofSequences of Orthogonal and Hierarchical Graphs. In GraphDrawing Springer Berlin, Heidelberg; 2004:228-238.
37. Erten C, Kobourov SG, Le V, Navabi A: Simultaneous GraphDrawing: Layout Algorithms and Visualization Schemes. JGraph Algorithms Appl 2005, 9:165-182.
Additional file 1Background on Protein Protein Interaction Network Evolution. In the second supplement, the file protein_background.pdf, the evolution of pro-tein interaction networks of different species from one common ancestor species is explained. Due to their evolution from a common ancestor, PPI networks can be aligned. How an alignment is defined, is also explained in this supplement. Furthermore the reader finds a detailed explanation on orthologous and paralogous proteins.Click here for file[http://www.biomedcentral.com/content/supplementary/1471-2105-10-327-S1.PDF]
Additional file 2Manual. The file manual.pdf includes a manual for the use of the VANLO software and a file format specification for the input files used.Click here for file[http://www.biomedcentral.com/content/supplementary/1471-2105-10-327-S2.PDF]
Page 15 of 16(page number not for citation purposes)

BMC Bioinformatics 2009, 10:327 http://www.biomedcentral.com/1471-2105/10/327
Publish with BioMed Central and every scientist can read your work free of charge
"BioMed Central will be the most significant development for disseminating the results of biomedical research in our lifetime."
Sir Paul Nurse, Cancer Research UK
Your research papers will be:
available free of charge to the entire biomedical community
peer reviewed and published immediately upon acceptance
cited in PubMed and archived on PubMed Central
yours — you keep the copyright
Submit your manuscript here:http://www.biomedcentral.com/info/publishing_adv.asp
BioMedcentral
38. Brandes U, Corman SR: Visual unrolling of network evolutionand the analysis of dynamic discourse. Information Visualization2003, 2:40-50.
39. Yi JS, Kang Ya, Stasko J, Jacko J: Toward a Deeper Understandingof the Role of Interaction in Information Visualization. IEEETransactions on Visualization and Computer Graphics 2007,13(6):1224-1231.
40. Russell SJ, Kahn CR: Endocrine regulation of ageing. Nat Rev MolCell Biol 2007, 8:681-691.
41. von Mering C, Jensen LJ, Kuhn M, Chaffron S, Doerks T, Krüger B,Snel B, Bork P: STRING 7-recent developments in the integra-tion and prediction of protein interactions. Nucleic Acids Res2007:358-362.
42. Stark C, Breitkreutz BJ, Reguly T, Boucher L, Breitkreutz A, Tyers M:BioGRID: a general repository for interaction datasets.Nucleic Acids Res 2006:535-539.
43. Bader GD, Betel D, Hogue CW: BIND: the Biomolecular Inter-action Network Database. Nucleic Acids Res 2003, 31:248-250.
44. Mishra GR, Suresh M, Kumaran K, Kannabiran N, Suresh S, Bala P, Shi-vakumar K, Anuradha N, Reddy R, Raghavan TM, Menon S, Hanuman-thu G, Gupta M, Upendran S, Gupta S, Mahesh M, Jacob B, Mathew P,Chatterjee P, Arun KS, Sharma S, Chandrika KN, Deshpande N, Pal-vankar K, Raghavnath R, Krishnakanth R, Karathia H, Rekha B, NayakR, Vishnupriya G, Kumar HG, Nagini M, Kumar GS, Jose R, DeepthiP, Mohan SS, Gandhi TK, Harsha HC, Deshpande KS, Sarker M,Prasad TS, Pandey A: Human protein reference database-2006update. Nucleic acids research 2006.
45. Hoffmann R, Valencia A: Implementing the iHOP concept fornavigation of biomedical literature. Bioinformatics 2005,21(suppl_2):ii252-258.
46. Wheeler DL, Barrett T, Benson DA, Bryant SH, Canese K,Chetvernin V, Church DM, DiCuccio M, Edgar R, Federhen S, GeerLY, Helmberg W, Kapustin Y, Kenton DL, Khovayko O, Lipman DJ,Madden TL, Maglott DR, Ostell J, Pruitt KD, Schuler GD, Schriml LM,Sequeira E, Sherry ST, Sirotkin K, Souvorov A, Starchenko G, SuzekTO, Tatusov RL, Tatusova TA, Wagner L, Yaschenko E: Databaseresources of the National Center for Biotechnology Infor-mation. Nucleic Acids Research 2006:173-180.
47. Flicek P, Aken BL, Beal K, Ballester B, Caccamo M, Chen Y, Clarke L,Coates G, Cunningham F, Cutts T, Down T, Dyer SC, Eyre T, Fitzger-ald S, Fernandez-Banet J, Graf S, Haider S, Hammond M, Holland R,Howe KL, Howe K, Johnson N, Jenkinson A, Kahari A, Keefe D,Kokocinski F, Kulesha E, Lawson D, Longden I, Megy K, Meidl P,Overduin B, Parker A, Pritchard B, Prlic A, Rice S, Rios D, SchusterM, Sealy I, Slater G, Smedley D, Spudich G, Trevanion S, Vilella AJ,Vogel J, White S, Wood M, Birney E, Cox T, Curwen V, Durbin R,Fernandez-Suarez XM, Herrero J, Hubbard TJP, Kasprzyk A, ProctorG, Smith J, Ureta-Vidal A, Searle S: Ensembl 2008. Nucl Acids Res2008, 36(suppl_1):D707-714.
48. Bader GD, Donaldson I, Wolting C, Ouellette BFF, Pawson T, HogueCWV: BIND-The Biomolecular Interaction Network Data-base. Nucl Acids Res 2001, 29:242-245.
49. Puig O, Marr MT, Ruhf ML, Tjian R: Control of cell number byDrosophila FOXO: downstream and feedback regulation ofthe insulin receptor pathway. Genes Dev 2003,17(16):2006-2020.
50. Yang Y, Hou H, Haller EM, Nicosia SV, Ba W: Suppression ofFOXO1 activity by FHL2 through SIRT1-mediateddeacetylation. The EMBO Journal 2005, 24(5):1021-1032.
51. National Cancer Institute Center for Bioinformatics: PathwayInteraction Database. 2005 [http://pid.nci.nih.gov].
52. Royer L, Reimann M, Andreopoulos B, Schroeder M: UnravelingProtein Networks with Power Graph Analysis. PLoS ComputBiol 2008, 4(7):e1000108.
Page 16 of 16(page number not for citation purposes)
![BMC Bioinformatics BioMed Central - Virginia Tech · BMC Bioinformatics 2008, ... i.e. conventional agglomerative Hierarchical Clustering (HC) [2], KMC [18 ... Matlab code implementing](https://static.fdocuments.in/doc/165x107/5ac0038b7f8b9a5a4e8b7b72/bmc-bioinformatics-biomed-central-virginia-bioinformatics-2008-ie-conventional.jpg)