
bls_2097_1981.pdf
38
Occupational Injuries and Illnesses in 1979: Summary U.S. Department of Labor Bureau of Labor Statistics April 1981 Bulletin 2097 A* Tc°ue„ Digitized for FRASER http://fraser.stlouisfed.org/ Federal Reserve Bank of St. Louis
Transcript of bls_2097_1981.pdf

Occupational Injuries and Illnesses in 1979: Summary
U.S. Department of Labor Bureau of Labor Statistics April 1981
Bulletin 2097
A*Tc°ue„
Digitized for FRASER http://fraser.stlouisfed.org/ Federal Reserve Bank of St. Louis
Occupational Injuries and Illnesses in 1979: SummaryU.S. Department of Labor Raymond J. Donovan, Secretary Bureau of Labor Statistics Janet L. Norwood, Commissioner April 1981
Bulletin 2097
For sale by the Superintendent of Documents, U.S. Government Printing Oilier* Washington. D.C. 20402 - Price $2Digitized for FRASER
http://fraser.stlouisfed.org/ Federal Reserve Bank of St. Louis

Digitized for FRASER http://fraser.stlouisfed.org/ Federal Reserve Bank of St. Louis

Preface
Data for this publication were collected in accordance with the provisions of the Occupational Safety and Health Act of 1970. Estimates represent the injury and illness experience of employers in private sector establishments for 1978 and 1979. Report forms were mailed to employers in the year following the reference year of each survey. Additional data and narrative analysis will be published later this year.
This publication was prepared in the Office of Occupational SaMv and Health Statistics by the staff of
the Division of Periodic Surveys, under the direction of William Mead. Data were collected and tabulated in the Office of Statistical Operations with the cooperation of the regional offices of the Bureau of Labor Statistics and State agencies participating in the occupational safety and health statistical grants program.
Material in this publication is in the public domain and may, with appropriate credit, be reproduced without permission.
iiiDigitized for FRASER http://fraser.stlouisfed.org/ Federal Reserve Bank of St. Louis

Contents
PageDefinitions.................................................................................................................................... 1Tables:Injuries and illnesses
1. Occupational injury and illness incidence rates by industry, 1978 and 1979 ................. 22. Number of occupational injuries and illnesses, and lost workdays by industry
division, 1978 and 1979.................................................................................................. 133. Number of occupational injuries and illnesses by industry, 1979................................... 14
Injuries4. Occupational injury incidence rates by industry, 1978 and 1979 ................................... 165. Occupational injury incidence rates by industry division and employment size,
1978 and 1979................................................................. 266. Occupational injury incidence rates for lost workday cases by industry, 1978
and 1979 ....................... 27Illnesses
7. Number of occupational illnesses by industry division and category of illness, 1979... 29Fatalities
8. Occupational injury and illness fatalities and employment for employers with 11or more employees by industry division, 1978 and 1979 .............................................. 29
9. Causes of fatalities resulting from occupational injury and illness in 1978 and 1979in units with 11 or more employees, private sector, by industry division(Percent distribution by industry)................................................................................. 30
10. Causes of fatalities resulting from occupational injury and illness in 1978 and1979 in units with 11 or more employees, private sector, by industry division(Percent distribution by cause)...................................................................................... 30
Appendix A. Scope of survey and technical n o tes..................................................................... 31
ivDigitized for FRASER http://fraser.stlouisfed.org/ Federal Reserve Bank of St. Louis

Definitions
The definitions of occupational injuries and illnesses and lost workdays are from Recordkeeping Requirements under the Occupational Safety and Health Act o f 1970.Recordable occupational injuries and illnesses are:
1. Occupational deaths, regardless of the time between injury and death, or the length of the illness; or
2. Nonfatal occupational illnesses; or3. Nonfatal occupational injuries which involve one
or more of the following: Loss of consciousness, restriction of work or motion, transfer to another job, or medical treatment (other than first aid).Occupational injury is any injury such as a cut, fracture, sprain, amputation, etc., which results from a work accident or from exposure involving a single incident in the work environment.Occupational illness is any abnormal condition or disorder, other than one resulting from an occupational injury, caused by exposure to environmental factors associated with employment. It includes acute and chronic illnesses or disease which may be caused by inhalation, absorption, ingestion, or direct contact.Lost workday cases are cases which involve days away from work, or days of restricted work activity, or both.
1. Lost workday cases involving days away from work are those cases which result in days away from work, or a combination of days away from work and days of restricted work activity.
2. Lost workday cases involving restricted work activity are those cases which result in restricted work activity only.
Lost workdays—away from work are the number of workdays (consecutive or not) on which the employee would have worked but could not because of occupational injury or illness.
Lost workdays—restricted work activity are the number of workdays (consecutive or not) on which, because of injury or illness:
1. The employee was assigned to another job on a temporary basis; or
2. The employee worked at a permanent job less than full time; or
3. The employee worked at a permanently assigned job but could not perform all duties normally connected with it.
The number o f days away from work or days o f restricted work activity does not include the day of injury or onset of illness or any days on which the employee would not have worked even though able to work.
Incidence rates represent the number of injuries and/or illnesses or lost workdays per 100 full-time workers and were calculated as: (N/EH) X 200,000 where:
N = number of injuries and/or illnesses or lostworkdays
EH = total hours worked by all employees during calendar year.200,000 = base for 100 full-time equivalent workers
(working 40 hours per week, 50 weeks per year).
,1Digitized for FRASER http://fraser.stlouisfed.org/ Federal Reserve Bank of St. Louis

Table 1. Occupational Injury and illneaa Incidence rates by Industry, 1978 and 19791
Inc idence r a te s pe r 100 fu l l - t im e w orkers 5 /
In d u s try 2 /SICcode
3/
1979 annual average
employment ( in thousands)
4 /T o ta l
cases j>/Lost
workdaycases
N onfata lcases
w ithoutl0 8 t
workdaysLost
workdays
1978 1979 1978 1979 1978 1979 1978 1979
P r iv a te s e c to r T j . . ............................................. 74 ,541.7 9.4 9.5 4.1 4.3 5.3 5.2 63.5 67.7A g r ic u ltu re , f o r e s t r y , and f is h in g T j ................... 898.7 11.6 11.7 5.4 5.7 6.2 5.9 80.7 83.7
A g r ic u ltu ra l p rod uc tion ........................... 01-02 n .a . 12.8 13.0 5.8 6.3 7.0 6.7 81.3 84.8A g r ic u ltu ra l s e r v ic e s .................................................. 07 n .a . 10.3 10.5 5 .0 5.1 5.3 5.3 80.2 84.4F o re s t ry ......................... *............................... 08 n .a . 11.0 10.5 5.1 4 .9 5.9 5.6 79.1 78.9F ish in g , hu n tin g , and tra p p in g .............................. 09 n .a . 4.1 4.1 2.4 2.3 1 .6 1.8 75.3 48.6
Mining 8 / ........................................................ ........................ 960.0 11.5 11.4 6.4 6.8 5.0 4.6 143.2 150.5M etal mining 8 / ............................................................... 10 100.8 10.0 10.2 5.4 6.0 4.6 4.2 113.9 118.2A n th ra c ite m ining 8 / .................................................... 11 3.1 19.6 18.6 11.5 11.0 8 .0 7.6 310.5 267.1Bituminous coa l and l i g n i t e m ining Z f .............. 12 259.9 10.1 10.4 7.3 8.3 2.7 2.0 170.3 206.0O il and gas e x t r a c t io n ................................................ 13 472.9 13.9 13.6 6 .9 7.0 6.9 6.5 154.4 151.2
Crude petro leum and n a tu ra l g a s ....................... 131 n .a . 4.4 5 .4 2.1 3.2 2.3 2.2 42.7 53.0O il and gas f i e l d s e r v ic e s .................................. 138 n .a . 20.3 18.9 10.2 9.5 10.0 9.4 229.7 215.7
N onm etallie m in e ra ls , excep t fu e ls 8 / .............. 14 122.8 6.9 6.4 *•1 4.2 2.7 2.2 88.0 81.5C o n s tru c tio n . .................................... ................................... 4 ,483 .0 16.0 16.2 6.4 6.8 9.6 9.3 109.4 120.4
G eneral b u ild in g c o n tra c to r s .................................. 15 1,275 .7 15.9 16.3 6 .3 6.8 9 .6 9.5 105.3 111.2R e s id e n tia l b u ild in g c o n s tru c t io n .............. 152 620.2 13.3 13.0 5.9 6.1 7.4 6.9 101.5 108.0O pera tiv e b u i ld e r s .................................................... 153 85.4 15.7 15.7 6.3 6.9 9.3 8.8 76.4 84.9N o n re s id e n tia l b u ild in g c o n s tru c t io n ............ 154 570.1 19.2 19.7 6.6 ,7.5 12.5 12.2 114.9 118.3
Heavy c o n s tru c tio n c o n tra c to r s .............................. 16 918.4 16.6 16.6 6.2 6.7 10.3 9.9 110.9 123.1Highway and s t r e e t c o n s tru c tio n ....................... 161 276.4 15.2 15.5 5.8 6.3 9.4 9.1 105.9 123.8Heavy c o n s tru c tio n , excep t h ighw ay.. . . . . . . 162 641.9 17.2 17.1 6.4 6.9 10.7 10.2 113.2 122.8
S p ec ia l tra d e c o n tra c to r s ......................................... 17 2 ,288.6 15.8 16.0 6.6 6 .9 9 .2 9.0 111.0 124.3Plumbing, h e a tin g , and a i r c o n d i t io n in g .. . 171 553.0 16.9 17.0 5.9 6.2 11.0 10.8 93.4 97.6P a in tin g , paperhang ing , and d e c o r a t i n g . . . . 172 151.2 9 .4 9.6 4.6 5.2 4.8 4.4 99.0 104.1E le c t r ic a l work........................................................... 173 403.4 14.0 14.0 4.7 5.3 9.3 8.7 71.4 92.0Masonry, stonew ork, and p la s t e r in g ................ 174 364.0 15.6 16.4 7.4 7.7 8.2 8.7 121.1 133.1C arpen te rin g and f lo o r in g ..................................... 175 131.2 13.6 14.0 7.3 7.5 6.3 6.5 128.6 144.1Roofing and sh ee t-m e ta l w o r k . . . . . ................... 176 164.4 22.5 22.3 11.7 12.1 10.7 10.1 212.7 218.8Concrete work............................................................... 177 n .a . 14.6 13.8 6.6 7.0 7.9 6 .8 122.2 126.3Water w e ll d r i l l i n g .................................................. 178 n .a . 12.8 15.2 6.5 8.5 6.2 6.6 126.7 165.1M iscellaneous s p e c ia l tra d e c o n t r a c t o r s . . . 179 n .a . 16.9 17.5 7.2 7.6 9.6 9.9 124.4 152.8
M anufactu ring........................................................................ 21 ,062 .0 13.2 13.3 5.6 5.9 7.6 7.4 84.9 90.2D urable goods............................................................. 12 ,772 .0 14.2 14.2 5.9 6.3 8.3 7.9 89.1 95.1
Lumber and wood p ro d u c ts ........................................... 24 766.1 22.6 20.7 11.1 10.8 11.5 9.9 178.8 175.9Logging camps and logging c o n t r a c to r s ......... 241 88.3 25.9 24.2 15.6 14.8 10.2 9.3 316.2 311.9Sawmills and p lan ing m i l l s .................................. 242 237.0 21.7 19.4 11.1 10.4 10.6 8.9 192.9 178.5
Sawmills and p lan in g m i l l s , g e n e ra l .......... 2421 196.6 21.2 18.9 11.1 10.3 10.2 8.6 195.3 180.7Hardwood dim ension and f lo o r in g ................... 2426 33.7 20.8 20.3 8.8 9.8 11.9 10.5 149.4 143.2S p ec ia l p roduct saw m ills, n . e . c ................... 2429 n .a . 43.6 32.5 24.8 18.5 18.7 13.9 369.4 308.8
M illw ork, plywood, and s t r u c tu r a l members. 243 224.9 20.4 18.5 9.6 9.5 10.8 9 .0 139.6 149.8M illw ork...................................................................... 2431 76.8 23.0 20.6 10.2 9.6 12.8 11.0 137.7 138.2Wood k itc h e n c a b in e ts ......................................... 2434 53.0 17.8 17.5 8.5 9.0 9.2 8.5 114.6 119.1Hardwood veneer and plywood............................ 2435 28.1 20.0 18.1 8.9 8.4 11.1 9 .6 128.7 142.4Softwood veneer and plywood............................ 2436 49.2 16.2 14.1 8.5 8.7 7.7 5.4 161.6 183.9S tr u c tu r a l wood members, n . e . c ..................... 2439 n .a . 31.2 26.8 15.1 15.2 16.1 11.5 172.0 200.0
Wood c o n ta in e r s ........................................................... 244 47.0 21.4 21.3 10.9 11.5 10.4 9 .8 162.1 172.2N ailed wood boxes and shook........................... 2441 n .a . 23.3 20.0 11.4 11.0 11.8 8 .9 160.3 184.2Wood p a l l e t s and s k id s ....................................... 2448 n .a . 21.9 22.4 11.7 12.3 10.2 10.0 172.3 179.1Wood c o n ta in e rs , n . e . c .................................. .. 2449 n .a . 18.5 19.6 8.9 9.8 9.5 9.8 143.0 146.7
Wood b u ild in g s and mobile homes....................... 245 84.2 32.7 29.8 14.2 13.9 18.5 15.9 177.2 175.7Mobile homes................ ............................................ 2451 58.2 34.8 31.6 15.2 14.6 19.5 17.0 196.3 189.2P re fa b r ic a te d wood b u ild in g s ......................... 2452 n .a . 28.2 25.8 11.9 12.2 16.3 13.6 135.6 145.4
M iscellaneous wood p ro d u c ts ................................ 249 84.7 18.5 17.7 8.1 8.1 10.4 9.6 127.2 120.8Wood p re se rv in g ...................................................... 2491 n .a . 18.7 18.0 8.9 8.3 9.8 9.7 152.1 147.6P a r t ic le b o a rd ........................................................... 2492 n .a . 13.4 11.0 6.1 4.7 7.2 6.3 122.8 102.6Wood p ro d u c ts , n . e . c ........................................... 2499 n .a . 19.1 18.4 8.2 8.5 10.9 9 .9 122.4 117.0
See footnotes at end of table.
2Digitized for FRASER http://fraser.stlouisfed.org/ Federal Reserve Bank of St. Louis

Table 1. Continued— Occupational Injury and Illness Incidence rates by Industry, 1978 and 19791
Incidence rates per 100 full-time workers J5/
In d u s try 2 /SICcode
3 /
1979 annual average
employment ( in thousands)
4 /T o ta l
cases .6/Lost
workdaycases
N onfa ta lcases
w itho u tl0 8 t
workdaysLost
workdays
1978 1979 1978 1979 1978 1979 1978 1979
F u rn itu re and f i x t u r e s ................................................ 25 499.3 17.5 17.6 6 .9 7.1 10.6 10.4 95.9 99.6Household f u r n i tu r e ........................................... » . . 251 330.6 16.5 15.9 6.5 6.4 10 .0 9.4 91.7 89.7
Hood household f u r n i tu r e .................................. 2511 148.8 16.4 15.3 6.2 5.9 10.2 9.3 89.4 85.5U pholstered household f u r n i tu r e .................. 2512 101.9 15.4 15.5 6.1 6.1 9 .3 9.4 88.0 81.2M etal household f u r n i tu r e * .............................. 2514 32.0 17.8 17.0 7.2 7.4 10.6 9.6 96.5 104.3M attre sse s and b e d sp r in g s ................................ 2515 31.6 18.1 19.2 8.3 8.7 9.8 10.4 111.9 125.2Wood TV and rad io c a b in e ts .............................. 2517 n .a . 16.8 13.6 6.2 5.5 10.6 8.1 86.0 77.1Household f u r n i tu r e , n . e . c .............................. 2519 n .a . 20.4 18.5 6.8 9.0 13.5 9.5 85.0 103.7
O ffic e f u r n i tu r e ......................................................... 252 49.7 18.4 22.9 7.7 9.4 10.7 13.5 104.3 138.1Wood o f f ic e f u r n i tu r e ......................................... 2521 n .a . 18.3 22.3 7.9 8.6 10.4 13.7 98.2 126.8M etal o f f ic e f u r n i tu r e ....................................... 2522 n .a . 18.4 23.2 7.5 9.8 10.9 13.4 107.5 144.1
P u b lic b u ild in g and r e la te d f u r n i t u r e . . . . . 253 26.4 21.3 21.5 7.9 8.3 13.4 13.2 107.0 136.2P a r t i t i o n s and f i x t u r e s ......................................... 254 64.4 20.2 20.3 8.1 8.6 12.1 11.6 105.8 108.1
Wood p a r t i t i o n s and f i x t u r e s ......................... 2541 n .a . 19.1 19.0 7.7 8.0 11.4 11.0 104.7 103.2M etal p a r t i t i o n s and f i x t u r e s . ..................... 2542 n .a . 21.5 21.6 8 .6 9.3 12.9 12.3 107.0 113.2
M iscellaneous f u r n i tu r e and f i x t u r e s ............ 259 28.2 19.0 17.5 7.0 6.4 11.9 11.1 100.9 90.2D rapery hardw are and b lin d s and s h a d e s .. 2591 n.a* 16.9 15.6 5.9 6.4 10.9 9 .2 76.7 88.9F u rn itu re and f ix tu r e s , n . e . c ..................... 2599 n .a . 21.7 20.2 8.5 6.5 13.2 13.6 133.3 92.0
S tone, c la y , and g la s s p r o d u c ts . ....................... 32 709.7 16.8 16.8 7.8 8.0 9 .0 8.7 126.3 133.7F la t g l a s s ...................................................................... 321 19.4 18.1 15.3 5.3 5.8 12.8 9 .5 95.8 110.5G lass and g la ssw are , p re ssed o r blown.......... 322 44.4 14.6 14.8 7.6 7.9 7.0 6.8 134.5 141.6
G lass c o n ta in e r s ....................... ............................. 3221 74.1 15.7 15.9 9 .3 9.1 6.4 6 .8 176.5 173.7P ressed and blown g la s s , n . e . c . . . .............. 3229 58.7 13.1 13.3 5.3 6.4 7.8 6.9 79.1 100.4
Products o f purchased g la s s .............. ................. 323 46.9 20.5 20.0 7.7 7.2 12.8 12.8 99.3 109.9Cement, H yd rau lic ....................................................... 324 33.1 - 10.1 “ 5.0 5.1 - 97.9S tr u c tu r a l c lay p ro d u c ts ..................................... 325 51.9 18.5 20.2 8.9 9.6 9.6 10.5 131.4 139.2
B rick and s t r u c tu r a l c lay t i l e ..................... 3251 n .a . 21.2 22.4 10.4 11.1 10.8 11.3 149.4 147.8Ceramic w a ll and f lo o r t i l e . . . ..................... 3253 n .a . 14.2 19.2 6 .0 7.4 8.2 11.8 83.2 97.1Clay r e f r a c t o r i e s .................................................. 3255 n .a . 14.6 15.2 6.7 7.9 7.9 7.3 114.5 142.5S t r u c tu r a l c lay p ro d u c ts , n . e . c ................... 3259 n .a . 24.0 25.0 13.1 12.2 10.9 12.8 183.1 171.8
P o tte ry and r e la te d p ro d u c ts .............................. 326 47.4 16.7 17.0 8.2 8.7 8.5 8.3 116.2 130.3V itreou s plumbing f i x t u r e s .............................. 3261 n .a . 29.5 27.8 15.2 14.6 14.3 13.2 216.8 187.2V itreou s ch ina food u t e n s i l s .......................... 3262 n .a . 11.0 15.1 6 .9 8.6 4.1 6 .5 134.9 152.0F ine earthenw are food u t e n s i l s ..................... 3263 n .a . 13.9 13.2 7.1 7.1 6 .8 6.1 111.3 126.7P o rc e la in e l e c t r i c a l s u p p l ie s ....................... 3264 n .a . 14.4 14.2 5.8 5.8 8.6 8.3 77.1 106.6
3269 n .a . 12.2 12.2 5.8 6.6 6 .4 5.6 71.5 96.7C oncrete , gypsum, and p la s t e r p r o d u c t s . . . . 327 215.1 18.1 17.8 8.4 8.4 9.7 9.4 135.0 139.7
C oncrete b lock and b r i c k .................................. 3271 23.4 19.4 18.5 9.0 8.8 10.3 9.7 148.1 154.6Concrete p ro d u c ts , n . e . c ................................... 3272 71.9 24.2 24.7 11.7 12.1 12.5 12.6 165.8 180.6Ready-mixed c o n c re te ........................................... 3273 97.6 15.7 15.1 7.0 6.8 8.6 8 .3 123.1 122.3Lime................ ............................................ ................. 3274 n .a . 13.3 8 .9 6.7 5.7 6.6 3.2 131.4 113.0Gypsum p ro d u c ts ......................................... ............. 3275 n .a . 6.1 7.1 2.1 2.6 4 .0 4.5 58.0 60.8
Cut s to n e and sto ne p r o d u c t s . . . . . . ................ 328 n .a . 14.2 14.4 6.3 6.6 7.9 7.8 115.5 97.8M iscellaneous no n m eta llic m in era l
p ro d u c ts .................................................................. 329 150.3 16.7 16.6 7.7 8.1 9 .0 8.4 124.1 138.3A brasive p ro d u c ts .................................................. 3291 29.7 18.8 20.9 7.8 10.1 11.0 10.9 120.1 168.7A sbestos p r o d u c ts . ....................... ............... 3292 22.4 17.7 18.6 9.1 9.7 8.6 8.9 166.6 171.8G aske ts, pack ing , and s e a lin g d e v ic e s . . . 3293 n .a . 16.5 15.8 6 .7 6.5 9.8 9.3 104.8 88.7M ineral wool....................... ..................................... 3296 33.4 14.1 11.2 6.6 6.1 7.4 5.1 103.4 99.0Nonclay r e f r a c t o r i e s ........................................... 3297 n .a ? 18.8 20.6 10.0 10.9 8.8 9.7 167.4 222.3N onm etallic m in era l p ro d u c ts , n . e . c .......... 3299 n .a . - 11.1 - 5.6 - 5.5 82.7
Prim ary m etal i n d u s t r i e s . ................................ .. 33 1,250 .2 17.0 17.3 7.5 8.1 9 .5 9.2 123.6 134.7B la s t fu rnace and b a s ic s t e e l p r o d u c ts . . . . 331 569.1 13.0 12.7 5.0 5 .0 8 .0 7.7 95.9 100.2
B la s t fu rn aces and s t e e l m i l l s ..................... 3312 477.2 11.1 10.8 4.1 3.8 7.0 7.0 85.8 86.7E le c tro m e ta llu rg ic a l p ro d u c ts ....................... 3313 n .a . 14.9 13.4 6.4 6.6 8.5 6.7 116.1 127.8S te e l w ire and r e la te d p ro d u c ts ................... 3315 n .a . 20.2 21.8 9.2 10.8 11.0 10.9 149.6 162.2Cold f in is h in g o f s t e e l sh ap es..................... 3316 n .a . 27.1 28.2 11.8 13.4 15.3 14.8 179.5 226.3S te e l p ip e and tu b e s ........................................... 3317 30.7 27.1 23.3 11.2 11.1 15.9 12.1 151.8 156.5
Iro n and s t e e l fo u n d r ie s ...................................... 332 238.9 24.6 26.0 11.6 12.9 13.0 13.0 169.2 186.0Gray iro n fo u n d r ie s .............................................. 3321 146.3 24.4 25.2 11.5 12.6 12.9 12.6 159.1 172.0M alleable i ro n fo u n d r ie s .................................. 3322 21.0 25.0 26.7 11.1 11.5 13.9 15.2 158.7 174.8S te e l investm ent fo u n d r ie s .............................. 3324 n .a . - 21.4 - 9.4 - 12.0 - 110.0
3325 59.5 26.6 28.6 12.8 15.1 13.8 13.4 215.3 241.2
See footnotes at end of table.
3Digitized for FRASER http://fraser.stlouisfed.org/ Federal Reserve Bank of St. Louis
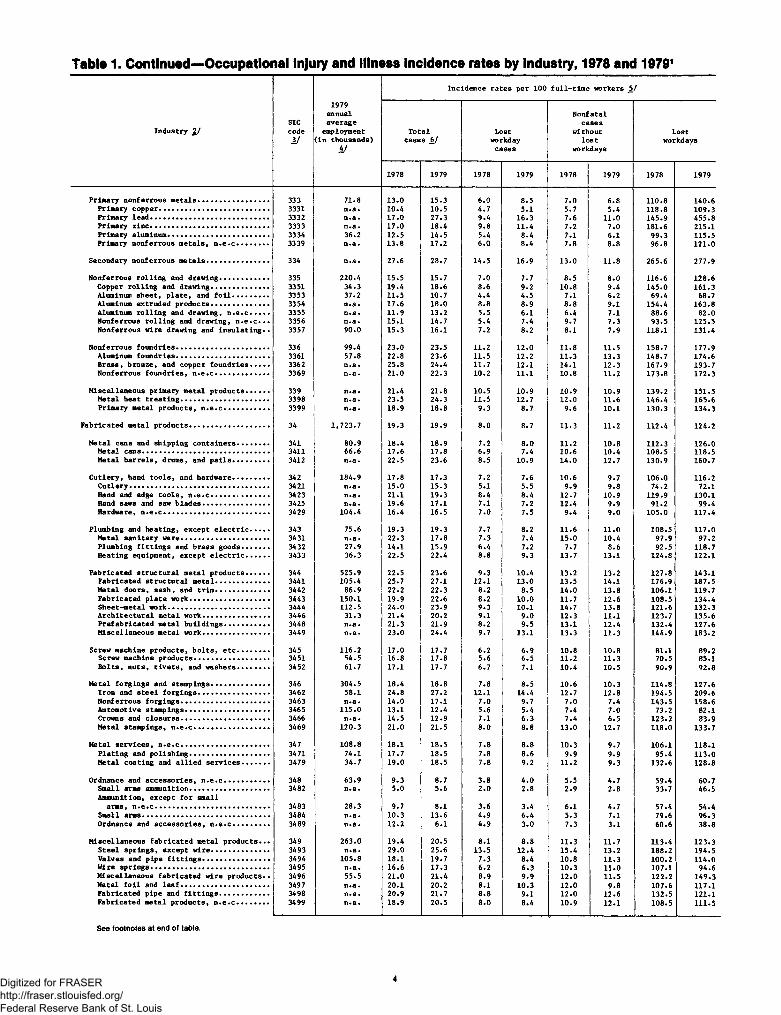
Table 1. Continued— Occupational Injury and Illness Incidence rates by Industry, 1978 and 19791
Incidence rates per 100 full-time workers J5/
In d u s try 2 /SICcode
3/
1979 annual average
employment ( in thousands)
4 /T o ta l
cases _6/Lost
workdaycases
N onfata l cases
w ithout lo s t
workdaysLost
workdays
1978 1979 1978 1979 1978 1979 1978 1979
Prim ary non ferrous m e ta ls ..................................... 333 71.8 13.0 15.3 6.0 8.5 7.0 6.8 110.8 140.6Prim ary copper......................................................... 3331 n .a . 10.4 10.5 4.7 5.1 5.7 5.4 118.6 109.3Prim ary le a d ............................................................. 3332 n .a . 17.0 27.3 9.4 16.3 7.6 11.0 145.9 455.8Prim ary z in c ............................................................. 3333 n .a . 17.0 18.4 9.8 11.4 7.2 7.0 181.6 215.1Primary aluminum......................... .......................... 3334 36.2 12.5 14.5 5.4 8.4 7.1 6.1 99.3 115.5Primary non ferrous m e ta ls , n . e . c ................ 3339 n .a . 13.8 17.2 6.0 8.4 7.8 8.8 96.8 121.0Secondary no n ferrous m e ta ls ................................ 334 n .a . 27.6 28.7 14.5 16.9 13.0 11.8 265.6 277.9N onferrous r o l l in g and draw ing......................... 335 220.4 15.5 15.7 7.0 7.7 8.5 8.0 116.6 128.6
Copper r o l l in g and draw ing.............................. 3351 34.3 19.4 18.6 8.6 9.2 10.8 9.4 145.0 161.3Aluminum sh e e t , p l a t e , and f o i l ................... 3353 37.2 11.5 10.7 4.4 4.5 7.1 6 .2 69.4 68.7Aluminum ex truded p ro d u c ts .............................. 3354 n .a . 17.6 18.0 8.8 8.9 8.8 9.1 154.4 163.8Aluminum r o l l in g and draw ing, n . e . c .......... 3355 n .a . 11.9 13.2 5.5 6.1 6.4 7.1 88.6 82.0N onferrous r o l l in g and draw ing, n . e . c . . . 3356 n .a . 15.1 14.7 5.4 7.4 9.7 7.3 93.5 125.5N onferrous w ire drawing and in s u l a t i n g . . 3357 90.0 15.3 16.1 7.2 8.2 8.1 7.9 118.1 131.4
N onferrous fo u n d r ie s ................................................ 336 99.4 23.0 23.5 11.2 12.0 11.8 11.5 158.7 177.9Aluminum fo u n d r ie s ................................................ 3361 57.8 22.8 23.6 11.5 12.2 11.3 13.3 148.7 174.6B ra ss , b ron ze, and copper fo u n d r ie s .......... 3362 n .a . 25.8 24.4 11.7 12.1 14.1 12.3 167.9 193.7N onferrous fo u n d r ie s , n . e . c ............................ 3369 n .a . 21.0 22.3 10.2 11.1 10.8 11.2 173.8 172.3M iscellaneous prim ary m etal p ro d u c ts ............ 339 n .a . 21.4 21.8 10.5 10.9 10.9 10.9 139.2 151.5M etal h ea t t r e a t i n g ............................................. 3398 n .a . 23.5 24.3 11.5 12.7 12.0 11.6 146.4 165.6Primary m etal p ro d u c ts , n . e . c ....................... 3399 n .a . 18.9 18.8 9.3 8.7 9.6 10.1 130.3 134.3
F a b ric a te d m etal p ro d u c ts ......................................... 34 1,723 .7 19.3 19.9 8.0 8.7 11.3 11.2 112.4 124.2M etal cans and sh ipp in g c o n ta in e r s ................ 341 80.9 18.4 18.9 7.2 8.0 11.2 10.8 112.3 126.0M etal c an s .................................................................. 3411 66.6 17.6 17.8 6.9 7.4 10.6 10.4 108.5 118.5M etal b a r r e l s , drums, and p a l l s ................... 3412 n .a . 22.5 23.6 8.5 10.9 14.0 12.7 130.9 160.7C u tle ry , hand to o ls , and h a r d w a r e . . . . . . . . . 342 184.9 17.8 17.3 7.2 7.6 10.6 9.7 106.0 116.2C u tle ry ........................................................................ 3421 n .a . 15.0 15.3 5.1 5.5 9.9 9.8 74.2 72.1
Hand and edge to o ls , n . e . c ............. .............. 3423 n .a . 21.1 19.3 8.4 8.4 12.7 10.9 119.9 130.1Hand saws and saw b la d e s .................................. 3425 n .a . 19.6 17.1 7.1 7.2 12.4 9.9 91.2 99.4Hardware, n . e . c ....................................................... 3429 104.4 16.4 16.5 7.0 7.5 9.4 9.0 105.0 117.4Plumbing and h e a tin g , excep t e l e c t r i c .......... 343 75.6 19.3 19.3 7.7 8.2 11.6 11.0 108.5 117.0
M etal s a n i ta ry w are............................................. 3431 n .a . 22.3 17.8 7.3 7.4 15.0 10.4 97.9 97.2Plumbing f i t t i n g s and b ra ss goods.............. 3432 27.9 14.1 15.9 6.4 7.2 7.7 8.6 92.5 118.7H eating equipm ent, excep t e l e c t r i c ............ 3433 36.3 22.5 22.4 8.8 9.3 13.7 13.1 124.8 122.1
F a b rica ted s t r u c tu r a l m etal p ro d u c ts ............ 344 525.9 22.5 23.6 9.3 10.4 13.2 13.2 127.8 143.1F a b r ic a te d s t r u c tu r a l m e ta l............................ 3441 105.4 25.7 27.1 12.1 13.0 13.5 14.1 176.9 187.5M etal do o rs , sa sh , and t r im ............................ 3442 86.9 22.2 22.3 8.2 8.5 14.0 13.8 106.1 119.7F a b rica ted p la te work................ ........................ 3443 150.1 19.9 22.6 8.2 10.0 11.7 12.6 108.5 134.4S h ee t-m etal work.................................................... 3444 1 1 2 . 5 24-0 23.9 9.3 10.1 14.7 13.8 121.6 132.3A rc h ite c tu ra l m eta l w o r k . . . ............................ 3446 31.3 21.4 20.2 9.1 9.0 12.3 11.1 123.7 135.6P re fa b r ic a te d m etal b u i ld in g s ....................... 3448 n .a . 21.3 21.9 8.2 9.5 13.1 12.4 132.4 127.6M iscellaneous m etal work.................................. 3449 n .a . 23.0 24.4 9.7 13.1 13.3 11.3 144.9 183.2Screw machine p ro d u c ts , b o l t s , e t c ................ 345 116.2 17.0 17.7 6.2 6.9 10.8 10.8 81.1 89.2Screw machine p ro d u c ts ....................................... 3451 54.5 16.8 17.8 5.6 6.5 11.2 11.3 70.5 85.1
B o lts , n u ts , r i v e t s , and w a s h e r s . . . .......... 3452 61.7 17.1 17.7 6.7 7.1 10.4 10.5 90.9 92.8M etal fo rg in g s and stam p ings.............................. 346 304.5 18.4 18.8 7.8 8.5 10.6 10.3 114.8 127.6Iro n and s t e e l fo rg in g s ..................................... 3462 58.1 24.8 27.2 12.1 14.4 12.7 12.8 194.5 209.6N onferrous fo rg in g s .............................................. 3463 n .a . 14.0 17.1 7.0 9.7 7.0 7.4 143.5 158.6Automotive stam pings........................................... 3465 115.0 13.1 12.4 5.6 5.4 7.4 7.0 73.2 82.1Crowns and c lo s u re s ............................................. 3466 n .a . 14.5 12.9 7.1 6.3 7.4 6.5 123.2 83.9(fe ta l stam pings, n . e . c ....................................... 3469 120.3 21.0 21.5 8.0 8.8 13.0 12.7 118.0 133.7M etal s e rv ic e s , n . e . c ............................................. 347 108.8 18.1 18.5 7.8 8.8 10.3 9.7 106.1 118.1
P la tin g and p o lis h in g ......................................... 3471 74.1 17.7 18.5 7.8 8.6 9.9 9.9 95.4 113.0M etal coa ting and a l l i e d s e r v ic e s .............. 3479 34.7 19.0 18.5 7.8 9.2 11.2 9.3 132.6 128.8Ordnance and a c c e s s o r ie s , n . e . c ....................... 348 63.9 9.3 8.7 3.8 4.0 5.5 4.7 59.4 60.7Sm all arms ammunition.........................................
Ammunition, excep t fo r sm all3482 n .a . 5.0 5.6 2.0 2.8 2.9 2.8 33.7 46.5
arm s, n . e . c ........................................................... 3483 28.3 9.7 8.1 3.6 3.4 6.1 4.7 57.4 54.4Small arm s.................................................................. 3484 n .a . 10.3 13.6 4.9 6.4 5.3 7.1 79.6 96.3Ordnance and a c c e s s o r ie s , n . e . c . . . . . . . . . 3489 n .a . 12.2 6.1 4.9 3.0 7.3 3.1 60.6 38.8M iscellaneous f a b r ic a te d m etal p r o d u c ts . . . 349 263.0 19.4 20.5 8.1 8.8 11.3 11.7 113.4 123.3S te e l s p r in g s , excep t w ire .............................. 3493 n .a . 29.0 25.6 13.5 12.4 15.4 13.2 188.2 194.5Valves and p ipe f i t t i n g s ................................... 3494 105.8 18.1 19.7 7.3 8.4 10.8 11.3 100.2 114.0Wire s p r in g s ............................................................. 3495 n .a . 16.6 17.3 6.2 6.3 10.3 11.0 107.1 94.6M iscellaneous f a b r ic a te d w ire p ro d u c ts . . 3496 55.5 21.0 21.4 8.9 9.9 12.0 11.5 122.2 149.3(fe ta l f o i l and l e a f ............................................. 3497 n .a . 20.1 20.2 8.1 10.3 12.0 9.8 107.6 117.1F a b ric a te d p ip e and f i t t i n g s ......................... 3498 n .a . 20.9 21.7 8.8 9.1 12.0 12.6 132.5 121.1F a b ric a te d m etal p ro d u c ts , n . e . c ................ 3499 n .a . 18.9 20.5 8.0 8.4 10.9 12.1 108.5 111.5
See footnotes at end of table.
4Digitized for FRASER http://fraser.stlouisfed.org/ Federal Reserve Bank of St. Louis

Table 1. Continued— Occupational Injury and Illness Incidence ratea by Induetry, 1978 and 19791
Incidence rates per 100 full-time workers _5/
In d u s try 2 /SICcode
3/
1979 annual average
employment ( in thousands)
4 /T o ta l
cases 6 /Lost
workdaycases
N onfata l cases
w ithout lo s t
workdaysLost
workdays
1978 1979 1978 1979 1978 1979 1978 1979
M achinery, excep t e l e c t r i c a l .................................. 35 2 ,481.6 14.4 14.7 5.4 5 .9 9 .0 8.7 75.1 83.6Engines and tu r b in e s ................................................ 351 145.4 12.4 13.3 5.2 6.2 7.2 7.1 89.2 112.5
T urbines and tu rb in e g e n e ra to r s e t s ......... 3511 41.2 9.3 9.5 3.1 4.2 6.2 5.3 47.9 59.0I n te rn a l com bustion e n g in es , n . e . c ............ 3519 104.2 14.0 14.9 6.2 7.0 7.8 7.9 110.2 133.9
Farm and garden m achinery.................................... 352 181.2 18.2 19.2 6.9 7.8 11.3 11.4 88.5 99.9Farm m achinery and equipm ent............ 3523 158.5 17.6 18.6 6.8 7.6 10.8 10.9 86.8 95.9Lawn and garden equipm ent................................ 3524 n .a . 23.4 23.4 7.9 9.0 15.4 14.4 102.0 127.1
C o nstruc tion and r e la te d m achinery................ 353 384.0 18.5 18.6 7.8 8.2 10.7 10.4 106.4 112.3C o nstru c tio n m achinery....................................... 3531 158.2 17.2 16.7 7.4 7.2 9.8 9.5 96.0 103.7Mining m achinery .................................................... 3532 34.5 21.5 20.1 7.8 8.2 13.6 11.9 116.9 116.8O il f i e l d m achinery............................................. 3533 85.3 19.8 20.0 8.7 9.6 11.1 10.4 123.1 130.9E lev a to rs and moving s ta i r w a y s . .................. 3534 n .a . 13.4 17.4 4.4 6.1 9.0 11.3 63.5 79.4Conveyors and conveying equipm ent.............. 3535 33.3 21.7 21.9 8.8 9.3 12.9 12.6 120.0 115.5H o is ts , c ra n e s , and m o n o ra ils ....................... 3536 n .a . 17.8 19.0 7.1 8.5 10.7 10.5 111.6 110.3I n d u s t r ia l tru c k s and t r a c t o r s ..................... 3537 39.2 18.4 18.4 7.9 8.3 10.5 10.1 108.0 107.3
M etalworking m achinery ........................................... 354 368.7 14.0 14.6 4.5 5.1 9.5 9.5 66.2 78.9Machine to o ls , m etal c u t t in g ty p e s ............ 3541 76.9 13.0 14.9 4.5 5.6 8.5 9.3 70.4 89.9Machine to o ls , m etal forming ty p e s ............ 3542 27.1 16.7 17.8 5.9 7.1 10.8 10.7 79.1 113.6S p ec ia l d ie s , t o o l s , j i g s , and f ix tu r e s . 3544 136.8 14.4 14.0 4.3 4.4 10.1 9.6 64.0 67.0Machine to o l a c c e s s o r ie s ....................... .. 3545 68.4 13.1 13.8 4.4 4.7 8.7 9.1 55.1 64.3Power d riv e n hand t o o l s ..................................... 3546 33.9 13.3 13.4 4.0 5.3 9.3 8.0 66.3 83.6R o llin g m ill m achinery ....................................... 3547 n .a . 16.4 18.2 5.5 6.6 10.9 11.6 101.1 143.1M etalworking m achinery, n . e . c ....................... 3549 n .a . 15.3 18.2 4.4 6.0 10.9 12.2 68.5 78.5
S p ec ia l in d u s try m achinery ................................. 355 205.2 15.9 15.6 5.5 5.9 10.4 9.7 79.9 82.5Food p rod uc ts m achinery .................................... 3551 46.7 19.4 17.0 6.6 6.8 12.8 10.2 102.3 99.9T e x ti le m a c h i n e r y . . . . . . ..................................... 3552 27.0 12.2 13.7 4.1 5.0 8 .0 8.7 66.8 73.3Woodworking m achinery ......................................... 3553 n .a . 18.1 18.5 7.0 7.7 11.1 10.8 86.5 103.8Paper in d u s tr ie s m achinery........................... .. 3554 n .a . 18.0 17.9 6.0 7.0 12.0 10.9 81.2 107.6P r in tin g tra d e s m achinery ................................ 3555 37.6 11.3 11.9 3.9 4.1 7.4 7.8 61.2 56.7S p ec ia l in d u s try m achinery , n . e . c .............. 3559 n .a . 17.1 16.4 6.0 6.0 11.1 10.4 79.3 77.6
G eneral in d u s t r i a l m achinery.............................. 356 329.0 15.2 16.0 5.5 6.5 9.7 9.5 77.8 89.0Pumps and pumping equipm ent........................... 3561 64.2 16.0 17.3 6.3 7.5 9.7 9.8 88.6 102.1B a ll and r o l l e r b e a r in g s ................................ 3562 58.6 10.9 10.9 3.8 4.5 7.1 6.4 59.5 64.7A ir and gas c o m p r e s s o r s . . . . . . . .............. 3563 31.8 12.9 14.4 4 .6 6.3 8.3 8.1 73.6 96.0Blowers and f a n s .................................................... 3564 42.5 18.4 18.3 6.7 7.1 11.7 11.2 88.3 99.3I n d u s t r ia l p a t t e r n s ............................................. 3565 n .a . 12.4 11.3 3.5 3.7 8.9 7.6 34.4 48.3Speed changers, d r iv e s , and g e a rs .............. 3566 26.5 19.5 20.1 6.7 7.7 12.8 12.4 90.7 109.3I n d u s t r ia l fu rn aces and ovens....................... 3567 n .a . 18.8 18.1 6.3 6.6 12.5 11.5 85.9 92.5Power tra n sm iss io n equipm ent, n . e . c .......... 3568 25.6 15.7 16.3 6.1 6.5 9.6 9.7 89.7 85.2G eneral in d u s t r i a l m achinery, n . e . c .......... 3569 n .a . 15.1 17.3 5.5 6 .9 9.6 10.4 73.9 85.3
O ffice and computing m achines........................... 357 396.9 4.9 5.4 2.0 2.3 2.9 3.1 27.1 32.6E le c tro n ic computing e q u i p m e n t . . . . . . . . . . 3573 319.5 4.4 4.7 1.9 2.1 2.5 2.6 24.4 29.8S cales and b a la n c e s , excep t l a b o ra to r y . . 3576 n .a . 11.2 13.0 3.0 3.6 8.2 9.4 49.1 54.9O ffice m achines, n . e . c ....................................... 3579 n -a . 8 .9 9.2 3.3 3.6 5.6 5.6 49.3 52.6
R e f r ig e ra tio n and se rv ic e m achinery .............. 358 187.7 17.3 17.4 6.5 7.0 10.8 10.4 86.7 102.9Automatic m erchandising m achines................ 3581 n .a . 24.9 21.9 8.8 9.9 16.0 12.0 96.4 123.4Commercial laundry equipm ent......................... 3582 n .a . 22.7 21.7 6.6 6.5 16.1 15.2 88.2 88.3R e f r ig e ra tio n and h e a tin g equipm ent.......... 3585 129.3 16.4 16.3 6.3 6.8 10.1 9.5 85.8 106.0Measuring and d isp en sin g pumps..................... 3586 n .a . 18.8 18.5 6.7 5.7 12.0 12.7 94.7 75.5S erv ice in d u s try m achinery, n . e . c .............. 3589 n .a . 17.8 19.4 6.3 7.5 11.5 11.9 86.0 93.2
M iscellaneous m achinery, excep te l e c t r i c a l ............................................................. 359 283.4 15.9 16.3 5.9 6.4 10.0 9.9 75.6 80.3C a rb u re to rs , p is to n s , r in g s , v a lv e s .......... 3592 43.0 10.7 10.9 4 .8 5.2 5.9 5.7 68.1 73.9
M achinery, excep t e l e c t r i c a l , n . e . c .......... 3599 240.5 16.8 17.3 6.1 6.6 10.7 10.7 76.9 81.5E le c tr ic and e le c tr o n ic equipm ent....................... 36 2,124.3 8.7 8.6 3.3 3.4 5.4 5.2 50.3 51.9
E le c t r ic d i s t r ib u t in g equipm ent....................... 361 124.7 11.4 11.9 4.0 4.7 7.4 7.2 57.7 66.5T ransform ers............................................................. 3612 55.4 12.5 13.8 4.6 5.8 7.9 8.0 66.1 71.3Sw itchgear and sw itchboard a p p a r a t u s . . . . 3613 69.3 10.3 10.4 3.5 3.8 6.8 6.6 50.2 62.7
E le c t r ic a l i n d u s t r i a l a p p a ra tu s ....................... 362 251.3 10.4 10.3 4 .0 4.1 6.4 6.2 64.6 64.8Motors and g e n e ra to rs ......................................... 3621 130.9 11.2 11.0 4.4 4.4 6.7 6.6 74.9 68.0I n d u s t r ia l c o n t ro ls ............................................. 3622 71.4 8.5 8.6 2.9 3.2 5.6 5.4 45.0 53.6Welding a p p a ra tu s , e l e c t r i c ............................ 3623 n .a . 15.1 15.7 5.3 6.4 9.7 9.3 67.5 80.5Carbon and g ra p h ite p ro d u c ts ......................... 3624 n .a . 7.7 7.2 3.9 4.0 3.8 3.1 78.6 81.4E le c t r ic a l i n d u s t r i a l a p p a ra tu s , n . e . c . . 3629 n .a . 8 .0 8.8 2.7 3.3 5.3 5.5 41.0 54.1
Household a p p lia n c e s ................................................ 363 180.0 12.6 12.6 4.5 4.5 8.0 8.1 70.0 73.1Household cooking equipm ent........................... 3631 n .a . 17.4 16.5 6.9 6.2 10.5 10.2 118.2 113.3Household r e f r ig e r a to r s and f r e e z e r s . . . . 3632 39.7 9.1 9.4 3.3 3.3 5.7 6.1 43.6 43.0Household laundry equipm ent........................... 3633 23.1 11.8 11.4 3.2 3.3 8.6 8.1 52.8 46.0E le c tr ic housewares and f a n s ......................... 3634 54.1 11.3 11.8 3.9 4.3 7.4 7.4 55.7 76.2Household vacuum c le a n e r s ................................ 3635 n .a . 8.9 8.7 4.1 3.7 4.8 5 .0 86.4 87.2Household a p p lia n c e s , n . e . c ............................ 3639 n .a . ** 23.4 ~ 10.2 13.2 ~ 160.1
See footnotes at end of table.
5Digitized for FRASER http://fraser.stlouisfed.org/ Federal Reserve Bank of St. Louis

Table 1. Continued— Occupational injury and lllneae Incidence ratea by industry, 1978 and 19791
Inc idence r a te s per 100 f u l l - t im e workers _5/
In d u s try 2 /SICcode
3/
1979 annual average
employment [in thousands)
hJT o ta l
cases .6/Lost
workdaycases
N onfata l cases
w ithout lo s t
workdaysLost
workdays
1978 1979 1978 1979 1978 1979 1978 1979
E le c t ic l ig h t in g and w iring equipm ent.......... 364 225.7 11.7 12.3 4.3 4.7 7.4 7.6 67.7 73.5E le c t r ic lamps........................................................ 3641 37.7 7.1 6.2 2.2 2.2 4.9 4.0 36.4 44.9C u rren t-c a rry in g w irin g d e v ic e s .................. 3643 92.1 9.8 11.1 3.4 4.2 6.4 6.9 59.8 67.2N o n cu rren t-ca rry ing w irin g d e v ic e s ............ 3644 25.6 21.2 20.7 8.6 8.2 12.6 12.4 126.8 129.2R e s id e n tia l l ig h t in g f i x t u r e s ....................... 3645 26.6 13.7 15.0 5.3 5.2 8.4 9.8 63.8 75.0Commercial l ig h t in g f i x t u r e s ......................... 3646 n .a . 20.8 17.9 7.6 7.4 13.2 10.5 127.9 101.2V ehicular l ig h t in g equipm ent......................... 3647 n .a . 6.5 8.6 2.6 3.5 3.9 5.1 47.9 52.9L igh tin g equipm ent, n . e . c ................................ 3648 n .a . 13.5 16.2 5.4 6.1 8.1 10.0 71.3 78.7
Radio and TV re c e iv in g e q u ip m e n t . . . . . .......... 365 114.2 8.8 8.4 3.4 3.6 5.4 4.8 52.7 51.8Radio and TV rec e iv in g s e t s ........................... 3651 86.9 8.8 8.6 3.2 3.5 5.6 5.1 51.4 51.0Phonograph re c o rd s ................................................ 3652 n .a . 9 .0 7.7 4.1 3.9 4 .9 3.8 57.4 54.3
Communication equipm ent......................................... 366 526.1 5.1 4.8 2.0 2.1 3.0 2.7 35.8 34.3Telephone and te leg ra p h a p p a ra tu s .............. 3661 168.6 6.2 5.6 2.8 2.9 3.4 2.7 60.9 49.0Radio and TV communication e q u ip m e n t.. . . 3662 357.5 4.6 4.5 1.7 1.8 2.9 2.7 24.8 27.5
E le c tro n ic components and a c c e s s o r ie s .......... 367 524.6 7.7 7.6 2.7 2.9 5.0 4.7 34.1 36.2E lec tro n tu b e s , re c e iv in g ty p e ..................... 3671 n .a . 3.9 4.5 1.4 1.9 2.5 2.6 24.0 30.0Cathode ray te le v is io n p ic tu re t u b e s . . . . 3672 n .a . 10.7 11.7 6.5 7.0 4.2 4.7 94.9 98.6E lec tro n tu b e s , t r a n s m it t in g ......................... 3673 n .a . 7.4 7.4 2.1 2.6 5.2 4.7 38.1 42.0Semiconductors and r e la te d d e v ic e s ............ 3674 199.6 6.4 6.1 2.3 2.4 4.1 3.6 28.8 31.6E le c tro n ic c a p a c i to rs ......................................... 3675 n .a . 5.9 5.3 2.0 2.2 3.9 3.1 24.7 27.4E le c tro n ic r e s i s t o r s ........................................... 3676 n .a . 9.0 8.0 3.1 3.2 5.9 4.7 41.7 33.8E le c tro n ic c o i l s and tr a n s fo rm e rs .............. 3677 n .a . 10.1 11.0 2.9 3.3 7.1 7.7 32.0 41.8E le c tro n ic c o n n e c to rs ......................................... 3678 n .a . - 9.3 - 2.4 - 6.9 - 31.2E le c tro n ic components, n . e . c ......................... 3679 206.3 8.8 8.7 2.9 3.1. 5.9 5.6 35.5 36.7
M iscellaneous e l e c t r i c a l equipment ands u p p l ie s ................................................................. 369 177.6 9.4 9.6 4.1 4.4 5.3 5.2 62.9 73.5
S to rage b a t t e r i e s .................................................. 3691 32.1 18.2 19.6 10.2 10.9 8 .0 8.6 178.5 207.1Primary b a t t e r i e s , dry and w et..................... 3692 n .a . 6.4 6.4 1.7 1.8 4.7 4.6 26.6 37.4X-ray app ara tu s and tu b e s ................................ 3693 n .a . 5.8 6.6 1.7 2.2 4.1 4.4 23.4 27.2Engine e l e c t r i c a l equipm ent...........................E le c t r ic a l equipment and
3694 87.9 7.3 7.2 2.9 3.1 4.4 4.0 42.1 47.4s u p p lie s , n . e . c .................................................. 3699 n .a . 14.1 11.7 6.0 5.0 8.1 6.7 69.7 64.4
T ra n sp o r ta tio n equipm ent........................................... 37 2 ,082.8 11.5 11.6 5.1 5.5 6 .3 6.1 78.0 85.9Motor v e h ic le s and equipm ent.............................. 371 994.6 11.3 11.6 5.1 5.5 6.1 6.1 73.9 81.3
Motor v e h ic le s and c ar b o d ie s ....................... 3711 464.2 8.1 8.1 4.0 3.8 4.1 4.2 52.7 52.3Truck and bus b o d ie s ........................................... 3713 45.8 29.5 29.7 11.9 12.7 17.5 17.0 132.6 139.6Motor v e h ic le p a r t s and a c c e s s o r ie s .......... 3714 444.4 11.4 11.9 5.1 5.9 6.3 6.0 81.7 96.3Truck t r a i l e r s ......................................................... 3715 n .a . 26.7 27.0 11.9 12.8 14.8 14.2 178.2 185.8S e lf-c o n ta in ed m obile homes........................... 3716 n .a . - 24.2 ~ 8.7 15.5 - 98.5
A irc r a f t and p a r t s .................................................... 372 611.0 6.5 7.1 2.5 3.0 4.0 4.1 37.7 49.1A i r c r a f t .............. ....................................................... 3721 333.3 4.8 5.2 1.9 2.4 2.9 2.8 31.6 44.0A irc r a f t eng ines and engine p a r t s . . . . . . . 3724 151.8 7.1 8.0 3.0 3.5 4.1 4.5 43.1 55.0A irc r a f t equipm ent, n . e . c ......................... .. 3728 125.8 11.2 10.9 3.7 4.0 7.5 6.9 49.6 55.8
Ship and boa t b u ild in g and r e p a i r in g ............ 373 224.4 21.3 24.0 10.8 12.4 10.4 11.5 195.5 215.2Ship b u ild in g and r e p a ir in g ............................ 3731 171.6 20.8 24.1 11.0 12.9 9.8 11.1 211.5 232.6Boat b u ild in g and r e p a ir in g ............................ 3732 52.9 22.8 23.7 9.9 10.7 12.8 12.9 136.0 156.9
R a ilro ad equipm ent.................................................... 374 73.7 19.7 19.8 9.1 10.1 10.5 9 .6 143.6 161.1M otorcycles, b ic y c le s , and p a r t s ..................... 375 n .a . 16.3 16.1 5.8 6.1 10.5 10.0 70.8 68.5Guided m is s i le s , space v e h ic le s , and
p a r t s ........................................................................ 376 102.0 4.2 3.1 1.5 1.4 2.7 1.7 23.0 20.8Guided m is s i le s and space v e h ic le s ............ 3761 81.2 3.6 2.7 1.4 1.3 2.2 1.4 20.3 19.9Space p ro p u ls io n u n i ts and p a r t s . .............. 3764 n .a . 7.2 4.2 2.5 1.8 4.7 2.4 38.0 25.5Space v e h ic le equipment, n . e . c ..................... 3769 n .a . 4.8 5.1 1.7 1.4 3.1 3.7 23.6 20.9
M iscellaneous tr a n s p o r ta t io n e q u ip m e n t.. . . 379 57.4 23.9 19.1 9.7 8.1 14.2 11.0 104.2 105.9Tanks and tank components................................ 3795 n .a . 9.2 9.6 4.4 5.6 4.8 3.9 46.5 58.2T ra n sp o r ta tio n equipm ent, n . e . c ................... 3799 n .a . 20.8 22.3 9.7 9.8 11.1 12.5 120.0 119.4
Instrum en ts and re la te d p ro d u c ts ......................... 38 688.9 6.9 7.2 2.6 2.8 4.3 4.4 37.0 40.0E ngineering and s c i e n t i f i c i n s t r u m e n t s . . . . 381 72.9 6.2 6.0 2.1 2.0 4.1 4 .0 28.5 29.6M easuring and c o n tro ll in g d e v i c e s . . . ............ 382 234.8 7.3 7.5 2.8 3.0 4.5 4.5 40.5 44.7
E nvironm ental c o n tro ls ....................................... 3822 49.3 9.7 9.4 3.8 4.1 5.9 5.3 64.9 75.7P rocess c o n tro l in s tru m e n ts ............................ 3823 50.9 6.5 6.9 2.6 2.8 3.9 4.1 33.3 37.4F lu id m eters and counting d e v ic e s .............. 3824 n .a . 12.4 10.1 4.3 4.3 8.1 5.8 55.3 55.8In strum en ts to measure e l e c t r i c i t y ............M easuring and c o n tro ll in g
3825 94.2 5.1 5.9 2.2 2.3 2.9 3.6 29.3 29.8d e v ic e s , n . e . c ............................. ...................... 3829 n .a . 8.6 9.4 2.5 3.0 6.1 6.4 31.7 45.6
O p tic a l In strum en ts and le n s e s ......................... 383 32.1 r i _ 6.6 2.4 2.5 3.7 4.0 36.6 32.4
See footnotes at end of table.
6Digitized for FRASER http://fraser.stlouisfed.org/ Federal Reserve Bank of St. Louis

Table 1. Continued— Occupational Injury and lllneee incidence ratee by Industry, 1978 and 19791
Inc idence r a te s pe r 100 f u l l - t i n e w orkers 5/
In d u s try I tSICcode1 /
1979 annual average
employment ( in thousands)
4 /T o ta l
cases j6/Lost
workdaycases
N onfata lcases
w ithoutl0 8 t
workdaysLost
workdays
1978 1979 1978 1979 1978 1979 1978 1979
M edical in s tru m en ts and s u p p l ie s ..................... 384 141.4 7.7 8.5 2 .9 3.2 4.8 5.2 39.8 46.7S u rg ic a l and m edical in s tru m e n ts ................ 3841 61.1 7.5 7.5 2.7 2 .8 4 .8 4 .7 40.7 44.0S u rg ic a l a p p lian ce s and s u p p l ie s ................ 3842 63.0 7.1 8 .8 2 .9 3 .4 4.2 5.3 37.3 49.3D ental equipment and s u p p l i e s . . . . . ............ 3843 n .a . 10.2 10.9 3.7 4 .0 6.5 6 .9 46.6 47.2
Ophthalmic goods......................................................... 385 45.9 7.7 6.8 2.9 2.7 4.8 4.1 39.4 53.3Photograph ic equipment and s u p p l ie s .............. 386 133.9 5.7 6.2 2.1 2.5 3.6 3.6 32.7 35.1M atches, c lo c k s , and w a tc h c a s e s .. ................... 387 28.1 6.7 6.4 2.3 2.6 4 .3 3.8 34.5 37.7
M iscellaneous m anufacturing in d u s t r i e s ............ 39 445.6 11.8 11.7 4.5 4.7 7.3 7.0 66.4 67.7Jew elry , s i lv e rw a re , and p la te d w are............ 391 60.9 6.2 6.5 2.5 2.7 3.7 3.8 41.5 45.6
Jew elry , p re c io u s m e ta l............................ 3911 39.8 4 .9 4.7 1.6 1.6 3.3 3.1 25.3 21.5S ilv erw are and p la te d w are.............................. 3914 n .a . 10.3 12.6 5.2 6.6 5.1 6 .0 88.5 135.5Je w e le rs ' m a te r ia ls and la p id a ry w o rk .. . 3915 n .a . 6 .4 6.2 2.4 2.2 3.9 4 .0 47.7 31.6
M usical in s tru m e n ts ........................... ...................... 393 23.8 13.8 13.6 4.4 5.3 9.4 8.3 54.3 82.2Toys and sp o r tin g goods................................ .. 394 120.9 13.9 13.5 5.4 5.6 8.5 7.9 81.7 78.5
D o lls ................ ................................. .......................... 3942 n .a . 8.4 7.4 2.4 2.6 5.9 4.8 28.7 40.5Game8, to y s , and c h i ld re n 's v e h i c l e s . . . . 3944 n .a . 14.1 12.0 5.6 5.0 8.5 7.0 85.4 77.5S p ortin g and a t h l e t i c goods, n . e . c ............ 3949 62.0 14.5 15.4 5.6 6.4 8.9 9 .0 85.0 84.2
Pens, p e n c i ls , o f f ic e and a r t s u p p l i e s . . . . 395 38.9 12.0 11.8 5.0 5 .0 7.0 6.8 58.8 68.8Pens and m echanical p e n c i l s ............................ 3951 n .a . 9 .8 10.0 3.8 4 .3 5.9 5.7 52.6 59.4Lead p e n c ils and a r t goods.............................. 3952 n .a . 15.5 15.8 6.5 6 .9 9.0 8.8 69.9 94.7Marking d e v ic e s ...................................................... 3953 n .a . 9 .6 7.0 3 .4 2.5 6.2 4.5 42.8 29.3Carbon paper and inked r ib b o n s ..................... 3955 n .a . 15.2 17.0 7.6 7.3 7.6 9.7 81.0 110.4
Costume jew elry and n o tio n s ................................ 396 58.7 8.1 9.2 3.2 3.3 4 .9 5 .8 46.0 48.2Costume je w e lry ...................................................... 3961 32.1 5 .6 6 .8 2 .3 2.4 3.3 4 .3 33.4 37.5A r t i f i c i a l f l o w e r s . . . . . ..................................... 3962 n .a . 12.3 10.2 4.5 4.2 7.7 6 .0 51.7 50.0B u tto n s ......................................................................... 3963 n .a . 7 .8 9.3 3.0 3.9 4 .8 5.4 44.2 55.5N eed les , p in s , and f a s t e n e r s ....................... 3964 n .a . 11.0 12.6 4.3 4.5 6.7 8.1 63.8 63.7
M iscellaneous m an ufac tu res.................................. 399 142.5 13.7 13.0 5.2 5.1 8.5 7.9 77.3 72.8Brooms and b r u s h e s . . » ......................................... 3991 n .a . 13.7 14.8 5 .8 6.6 7.9 8.2 94.3 79.4Signs and a d v e r t is in g d is p la y s ..................... 3993 48.2 14.5 14.0 5.2 5.3 9.3 8.7 79.7 72.0B u ria l c a s k e ts ......................................................... 3995 n .a . 17 .0 15.7 5.6 5.3 11.4 10.4 64.2 75.4Hard su rfa c e f lo o r c o v e r in g s ......................... 3996 n .a . 11.2 11.1 5.5 5.1 5.7 6.0 117.9 88.8M anufacturing in d u s t r ie s , n . e . c ................... 3999 n .a . 12.4 11.4 4.7 4.5 7.6 6 .9 64.9 67.9
Nondurable goods............................................................... 8 ,2 90 .0 11.8 11 .8 5.0 5 .3 6.8 6.5 78.4 82.3Food and k in d red p r o d u c t s . . . . . ..................... 20 1,728.1 19.4 19.9 8.9 9.5 10.5 10.4 132.2 141.8
Meat p ro d u c ts ................................................................ 201 359.5 28.4 29.8 13.2 14.3 15.2 15.5 168.9 194.0M eatpacking p la n t s ................................................ 2011 163.0 32.8 36.9 16.0 18.3 16.8 18.5 201.3 243.2Sausages and o th e r p repared m eats.............. 2013 69.3 24.9 23.2 11.2 11.8 13.7 11.4 158.1 175.4P o u ltry d re ss in g p la n t s ................................ .. 2016 111.7 23.6 23.9 9 .9 10.2 13.6 13.6 125.8 137.7P o u ltry and egg p ro c e ss in g .............................. 2017 n .a . 22.8 22.4 9.3 9.6 13.5 12.8 115.0 120.8
D airy p ro d u c ts ............................................................. 202 180.4 15.8 15.9 7.3 7.4 8.5 8.5 114.1 115.8Creamery b u t t e r .................................................... '2021 n .a . 14.4 15.7 5.8 5 .9 8.6 9.8 81.5 86.5Cheese, n a tu ra l and p ro c e sse d .............. .. 2022 33.2 15.9 14.9 8 .0 6.8 7.9 8.1 111.6 113.6Condensed and evapora ted m ilk ....................... 2023 n .a . 13.2 12.5 6.1 6.6 7.1 5.9 81.5 95.8Ic e cream and fro zen d e s s e r t s ....................... 2024 n .a . 15.4 18.4 7.4 8.8 8.0 9.6 107.0 109.3F lu id m ilk ................................................................... 2026 110.3 16.1 16.2 7.3 7.5 8.8 8.7 120.0 120.8
P reserved f r u i t s and v e g e ta b le s ....................... 203 254.9 17.1 17.2 8.0 8 .3 9.1 8.9 124.9 124.2Canned s p e c i a l t i e s ................................................ 2032 25.1 11.9 11.9 5.5 6.1 6 .4 5.8 90.6 96.5Canned f r u i t s and v e g e ta b le s .......................... 2033 102.9 19.2 18.7 8 .5 8 .6 10.7 10.1 122.9 122.7Dehydrated f r u i t s , v e g e ta b le s , s o u p s . . . . 2034 n .a . 17.6 18.6 9.7 9.6 7.9 9.0 140.6 161.1P ic k le s , sa u c e s , and sa la d d r e s s i n g s . . . . 2035 n .a . 15.6 17.5 6.7 8.1 8.9 9.3 143.0 107.8Frozen f r u i t s and v e g e ta b le s .............. .. 2037 49.8 19.4 17.1 9.8 8.4 9.6 8.7 152.9 137.7Frozen s p e c i a l t i e s ................................................ 2038 n .a . 13.2 15.7 6.5 8.2 6.7 7.5 99.8 122.0
G rain m ill p ro d u c ts .................................. .. 204 143.5 15.0 15.6 6.9 7.7 8.1 7.9 126.0 129.7F lour and o th e r g ra in m ill p ro d u c ts .......... 2041 25.1 15.3 16.1 7.2 8.2 8.1 7.9 125.8 138.6C erea l b re a k fa s t fo o d s ...................................... 2043 n .a . 15.1 14.1 6.9 6 .9 8.2 7.2 175.9 148.8Rice m il l in g ............................................................. 2044 n .a • 18.0 19.6 9.1 10.0 8.8 9.6 214.2 153.6Blended and prepared f l o u r .............................. 2045 n .a . 12.7 14.0 6.5 7.7 6.2 6.3 97.5 111.3Wet corn m il l in g .................................................... 2046 n .a . 10.4 10.8 4.1 6.2 6 .3 4 .6 73.0 93.2Dog, c a t , and o th e r p e t food.......................... 2047 n .a . 17.2 19.1 8.2 9.1 9 .0 10.0 166.2 158.7P repared fe e d s , n . e . c .................................... .. 2048 58.7 15.3 15.7 6.9 7.5 8 .4 8.2 109.1 120.4
Bakery p ro d u c ts ........................................................... 205 232.8 13.8 14.3 6 .4 7.0 7.4 7.3 119.3 129.2Bread, cake, and r e la te d p ro d u c ts .............. 2051 188.6 13.7 14.5 6 .4 7.1 7 .3 7.4 115.9 128.8Cookies and c ra c k e rs ........................................... 2052 44.2 14.1 13.5 6 .5 6.6 7.6 6.9 136.1 131.2
See footnotes at end of table.
7Digitized for FRASER http://fraser.stlouisfed.org/ Federal Reserve Bank of St. Louis

Table 1. Continued— Occupational Injury and Illnea8 Incidence rates by Industry, 1978 and 19791
In d u s try 2 /SICcode
3/
1979 annual average
employment ( in thousands)
4 /
Inc idence r a te s pe r 100 f u l l - t im e w orkers 5/
T o ta l cases jS/
Lostworkday
cases
N onfata lcases
w ithoutl o s t
workdaysLost
workdays
1978 1979 1978 1979 1978 1979 1978 1979
Sugar and c o n fe c tio n e ry p ro d u c ts . • . . ......... .. 206 108.8 14.8 14.5 7.1 7.3 7.7 7.2 104.2 111.2Raw cane su g a r......................................................... 2061 n .a . 25.5 24.0 11.7 10.8 13.7 13.1 134.9 184.3Cane sugar r e f in in g .............................................. 2062 n .a . 11.9 11.6 6.7 6.8 5.1 4.8 166.2 129.0Beet su g a r.................................................................. 2063 n .a . 22.3 19.3 12.7 * 13.2 9.6 6.1 125.0 139.7C onfec tionery p ro d u c ts ....................................... 2065 58.4 13.1 13.8 5.8 6 .4 7.3 7.4 87.6 99.2C hocolate and cocoa p ro d u c ts ......................... 2066 n .a . 10.9 10.3 4.1 4.5 6.8 5.7 62.1 77.3Chewing gum............................................................... 2067 n .a . 11.0 12.0 5.9 5.0 5.1 7.0 117.7 98.7F a ts and o i l s ............................................................... 207 44.1 20.2 20.0 9.2 9.5 11.0 10.5 144.7 159.1C ottonseed o i l m i l l s ....................... .................... 2074 n .a . 18.0 19.9 7.9 8 .9 10.0 11.0 165.4 228.5Soybean o i l m i l l s ........................... ...................... 2075 n .a . 16.5 15.9 7.8 8.1 8.7 7.8 126.5 137.1V egetable o i l m i l l s , n . e . c ............................. 2076 n .a . 12.8 17.3 4.9 8.9 7.9 8.4 83.6 195.4Animal and m arine f a t s and o i l s ................... 2077 n .a . 26.5 26.8 12.8 14.6 13.7 12.2 181.3 191.8S horten ing and cooking o i l s ........................... 2079 n .a . 18.3 18.0 7.6 6.9 10.7 11.0 115.2 108.6B e v erag es....................................................................... 208 238.0 23.0 23.5 10.0 10.6 13.0 12.9 132.7 146.8H a lt b e v e r a g e s . . . ........................... ...................... 2082 52.0 19.3 18.1 6.7 6.5 12.6 11.6 123.3 121.5M alt............................................................................... 2083 n .a . 27.3 27.9 16.8 14.1 10.5 13.8 249.9 255.7W ines, b rand y , and brandy s p i r i t s .............. 2084 n .a . 23.4 24.8 12.2 12.1 11.2 12.7 153.3 149.4D is t i l l e d l iq u o r , excep t b rand y .................. 2085 n .a . 16.1 17.6 7.6 8.4 8.5 9.2 123.2 150.4B o ttled and canned s o f t d r in k s ..................... 2086 140.5 26.4 27.4 11.8 12.8 14.5 14.6 141.4 162.7F lavo rin g e x t r a c ts and sy ru p s , n . e . c . . . . 2087 n .a . 8.2 9.9 3.7 4.7 4.5 5.2 52.7 55.2M iscellaneous foods and k indred p ro d u c ts . . 209 166.3 16.3 16.8 7.5 8.0 8.8 8.8 120.6 118.7Canned and cured sea fo o d s ................................ 2091 n .a . 22.3 24.4 10.2 10.4 12.1 14.0 173.5 163.5F resh o r fro zen packaged f i s h ....................... 2092 n .a . 20.4 22.0 10.0 10.7 10.3 11.3 150.0 143.1Roasted c o f fe e ......................................................... 2095 n .a . - 11.7 - 5.6 - 6.1 _ 79.0M acaroni and s p a g h e t t i ....................................... 2098 n .a . 17.5 18.8 9.2 9.7 8.3 9.1 163.6 198.5Food p re p a ra tio n s , n . e . c .................................. 2099 n .a . 14.7 14.2 6.5 6.7 8.2 7.5 102.4 100.5
Tobacco m anufac tu res.................................................. 21 69.9 8.7 9.3 4 .0 4.2 4.6 5 .0 58.6 64.8C ig a r e t te s ...................................................... .. 211 45.3 7.7 7.9 4.1 4.1 3.5 3.8 60.0 64.3C ig a rs ............................................................................... 212 n .a . 6 .9 7.4 2.7 3.0 4.2 4.4 41.4 64.3Chewing and smoking tob acco ................................ 213 n .a . 11.8 12.0 3.3 4.2 8.5 7.8 49.3 57.5Tobacco stemming and re d ry in g ............................ 214 n .a . 13.6 14.4 5.1 5.5 8.5 8.9 69.0 69.5
T e x ti le m ill p ro d u c ts .................................................. 22 888.5 10.2 9.7 3.4 3.4 6.8 6.3 61.5 61.3Weaving m i l l s , c o t to n .................................. .. 221 151.3 7.7 7.4 1.9 1.9 5.8 5.5 48.5 47.7Weaving m i l l s , s y n th e t ic s ..................................... 222 121.9 7.7 8.9 2.2 2.9 5.4 6.0 44.9 60.5Weaving and f in is h in g m i l l s , w ool.................. 223 19.9 14.9 13.6 6.6 6.6 8.3 7.0 118.6 110.6Narrow fa b r ic m i l l s ................................ ................. 224 25.5 10.9 11.0 4.1 4.7 6.8 6.3 62.4 73.7K n ittin g m i l l s . . . ...................................................... 225 229.3 8.5 7.7 3.1 2.9 5.4 4.7 46.5 41.9Women's h o s ie ry , excep t so ck s....................... 2251 31.4 5.1 4.3 2.0 1.8 3.1 2.4 36.3 25.1H osiery,, n . e . c ......................................................... 2252 33.3 5.8 5.2 2.3 2.2 3.4 3.0 34.9 34.8K nit ou terw ear m i l l s ........................................... 2253 72.5 7.5 6.2 2.6 2.1 4.9 4.1 35.9 30.3Knit underwear m i l l s .................. ........................ 2254 32.3 9.4 8.6 3.5 3.5 5.9 5.1 49.2 38.3C irc u la r k n it f a b r ic m i l l s . . . . . . . . . . . . . . 2257 33.7 12.0 12.0 4 .4 4.6 7.6 7.4 70.3 70.6Warp k n i t f a b r ic m i l l s ....................................... 2258 n .a . 12.1 11.5 3.5 4.1 8.5 7.4 61.1 65.3K n ittin g m i l l s , n . e . c .................................. .. 2259 n .a . 14.3 11.0 7.4 5.4 6.9 5.5 66.9 64.6T e x t i le f in is h in g , excep t wool.......................... 226 77.9 13.0 12.6 4 .9 4.9 8.1 7.7 91.4 86.2F in ish in g p la n ts , c o t to n .................................. 2261 31.0 11.1 10.6 4.4 3.9 6.7 6.6 84.8 77.9F in ish in g p la n ts , s y n th e t ic s ......................... 2262 30.4 13.7 13.6 5.2 5.4 8.5 8.2 95.4 94.9F in ish in g p la n ts , n . e . c ..................................... 2269 n.a* 15.6 14.9 5.2 5.9 10.4 9.0 98.2 86.3F lo o r covering m i l l s ................................................ 227 60.3 13.9 12.1 4.2 3.9 9.6 8.2 73.7 64.2Woven c a rp e ts and ru g s ...................................... 2271 n .a . 10.0 11.4 3.5 4.3 6.5 7.1 66.0 55.3T ufted c a rp e ts and ru g s .................................... 2272 n .a . 14.7 12.5 4 .4 3.9 10.3 8.6 75.4 66.4Yarn and th read m i l l s ............................................. 228 133.1 11.7 10.9 3.2 3.3 8.4 7.6 61.7 62.3Yarn m i l l s , excep t wool..................................... 2281 87.3 11.8 11.3 3.0 3.0 8.7 8.2 61.5 57.7Throwing and winding m i l l s ............................. 2282 25.9 11.3 10.5 3.4 3.6 7.9 6.9 49.3 70.2Wool yarn m i l l s ......................................... ............. 2283 n .a . 15.3 11.2 5.5 5*. 2 9.8 6.0 101.3 100.0Thread m i l l s ............................................................. 2284 n .a . 7.7 8 .8 2.4 3.0 5.3 5.8 45.9 45.3M iscellaneous t e x t i l e goods................................ 229 69.4 15.0 13.7 6.3 5.9 8.7 7.8 105.5 101.0F e l t goods, excep t woven f e l t s and h a t s . 2291 n .a . 23.5 18.7 10.8 8.1 12.7 10.6 164.6 130.5Lace goods................................................................. 2292 n .a . 10.9 9.5 3.1 3.5 7.8 6.0 70.8 92.0Paddings and u p h o ls te ry f i l l i n g ................... 2293 n .a . 18.4 15.1 9.9 8.4 8.4 6.6 176.4 153.6Processed t e x t i l e w aste ..................................... 2294 n .a . 16.3 13.5 6.5 5.8 9.7 7.7 91.0 108.2Coated f a b r ic s , no t ru b b e riz e d ..................... 2295 n .a . 16.7 14.7 6.7 6.2 9.9 8.5 128.6 101.1T ire cord and f a b r i c ........................................... 2296 n .a . 6 .8 7.6 2.9 3.8 3.9 3.7 68.8 73.3Nonwoven f a b r i c s ....................... ............................ 2297 n .a . 14.0 13.9 5.4 4.9 8.6 9.0 92.6 93.1Cordage and tw ine .................................................. 2298 n .a . 14.9 17.4 6.1 6.5 8.8 10.9 87.0 85.1T e x ti le goods, n . e . c .............. ................... .. 2299 n .a . 13.2 12.6 5 .0 5.7 8.2 6.9 64.6 95.0
See footnotes at end of table.
8Digitized for FRASER http://fraser.stlouisfed.org/ Federal Reserve Bank of St. Louis

Table 1. Continued— Occupational Injury and illnees Incidence rate8 by Induatry, 1978 and 19791
Incidence rates per 100 full-time workers J5/
In d u s try 2 /SICcode2 /
1979 annual average
employment ( in thousands)
4 /T o ta l
cases _6/Lost
workdaycases
N onfata lcases
w itho u tlo s t
workdaysLost
workdays
1978 1979 1978 1979 1978 1979 1978 1979
A pparel and o th e r t e x t i l e p ro d u c ts ..................... 23 1,312 .5 6 .5 6.5 2.2 2.2 4.3 4.3 32.4 34.1Men's and bo ys ' s u i t s and c o a ts ....................... 231 81.6 6.3 6.8 2.3 2.6 4.0 4.2 37.4 47.0Men's and bo ys ' f u r n is h in g s ................................ 232 365.6 7.7 8.1 2.7 2.9 5.0 5.2 40.4 44.4
Men's and bo ys ' s h i r t s and n ig h tw e a r . . . . 2321 103.8 5.8 6.0 2.0 2.1 3.8 3.9 27.4 30.2Men's and boys' underw ear................................ 2322 n .a . 8 .0 7.1 2.8 2.5 5.2 4.6 42.0 43.9Men's and boys' neckw ear.................................. 2323 n .a . 3.5 3.1 .9 .9 2.6 2.2 25.2 16.8Men's and boys' se p a ra te t r o u s e r s .............. 2327 78.7 7.0 8.6 2.5 3 .0 4.5 5.5 36.7 48.8Men's and bo ys' work c lo th in g ....................... 2328 101.1 10.4 10.6 3.8 4.1 6.5 6.5 61.1 63.2Men's and bo ys ' c lo th in g , n . e . c ................... 2329 n .a . 8.2 7.7 2.5 2.5 5.7 5.2 37.3 33.9
Women's and m is se s ' o u te rw ear............................ 233 438.7 4.8 4.2 1.3 1.3 3.5 2.9 17.6 19.5Women's and m is se s ' b lo u se s and w a i s t s . . 2331 63.7 4.6 3.2 1.0 .8 3.6 2.4 13.9 12.0Women's and m is se s ' d r e s s e s ........................... 2335 159.3 3.4 2.7 .9 .8 2.4 1.9 11.6 12.3Women's and m is se s ' s u i t s and c o a ts .......... 2337 64.0 4.5 4.0 1.3 1.3 3.2 2.7 18.5 24.3Women's and m is se s ' ou te rw ear, n . e . c . . . . 2339 151.8 6.6 6.1 1.9 1.9 4.7 4.2 25.1 28.1
Women's and c h i ld re n 's undergarm en ts............ 234 92.0 6.2 6.4 1.7 1.8 4.4 4.6 30.2 30.8Women's and c h i ld re n 's underw ear................ 2341 73.3 6.3 6.4 1.8 1.8 4.5 4 .6 30.4 32.6B ra s s ie re s and a l l i e d garm ents..................... 2342 18.7 5.5 6.5 1.7 1.6 3.8 4.9 29.3 23.3
H ats, c ap s , and m i l l i n e r y . . . .............................. 235 n .a . 7.5 7.7 2.7 2.5 4 .8 5.1 33.1 37.2M il l in e ry ................................................................... 2351 n .a . 4.4 4.4 .9 1.1 3.5 3.3 10.3 32.3Hats and cap s, excep t m i l l in e r y .................. 2352 n .a . ~ 8.2 2.8 5.4 38.0
C h ild re n 's o u te rw ear.............. ................................. 236 65.3 5.3 5.8 1 .8 1.8 3.4 4.0 29.5 30.2C h ild re n 's d re sse s and b lo u s e s ..................... 2361 26.7 4.3 5.6 1.2 1.7 3.1 3.9 20.9 30.3C h ild re n 's c o a ts and s u i t s .............................. 2363 n .a . - 5.9 - 1.8 - 4.1 - 32.5C h ild re n 's ou te rw ear, n . e . c ............................ 2369 n .a . 5.4 6.0 2.2 2.0 3.2 4.0 33.0 29.7
M iscellaneous a p p a re l and a c c e s s o r i e s . . . . . 238 58.2 6.4 6.1 2.2 2.4 4.2 3.7 31.9 30.0F ab ric d re ss and work g lo v e s ......................... 2381 n .a . 5.3 4.9 2.3 2.4 3.0 2.5 38.6 35.1Robes and d re ss in g gowns.................................. 2384 n .a . 6 .0 5.3 1.6 1.6 4.3 3.7 24.7 19.4W aterproof o u te rg arm en ts .................................. 2385 n .a . 7.0 5.6 1 .9 2.1 5.1 3.5 34.7 31.1A pparel b e l t s ........................................................... 2387 n .a . 8.3 9.8 2.6 3.3 5.7 6.5 31.3 37.1A pparel and a c c e s s o r ie s , n . e . c . . . . ............ 2389 n .a . 6.5 6.1 2.4 2.3 4.1 3.8 22.8 21.6
M iscellaneous fa b r ic a te d t e x t i l ep ro d u c ts .................................................................. 239 190.5 8.9 8.9 3.3 3.3 5.6 5.6 49.1 45.5
C u rta in s and d r a p e r ie s ....................................... 2391 29.1 8.6 8.6 3.2 2.9 5.3 5.7 50.3 40.9House f u rn is h in g s , n . e . c .................................. 2392 53.4 9.7 10.5 3.6 3.6 6.1 6.9 47.3 48.6T e x ti le b ag s.................................. .......................... 2393 n .a . 11.9 13.6 4.5 5.4 7.4 8.2 90.1 104.7Canvas and r e la te d p ro d u c ts ........................... 2394 n .a . 10.9 12.3 3.8 4.5 7.1 7.8 59.6 63.5P le a tin g and s t i t c h i n g ....................... .. 2395 n .a . 6.1 5.3 2.5 2.2 3.6 3.1 35.4 27.7Automotive and app are l trim m ings................ 2396 35.2 7.2 6.4 2.8 2.5 4.4 3.9 43.0 34.0S c h i f f l i machine em b ro id e rie s ....................... 2397 n .a . 6.2 4.5 2.8 1.9 3.4 2.6 49.2 20.8F a b ric a te d t e x t i l e p ro d u c ts , n . e . c ............ 2399 n .a . 9.8 8.4 3.5 3.4 6.3 5.0 47.8 42.4
Paper and a l l i e d p ro d u c ts ......................................... 26 706.7 13.5 13.5 5.7 6 .0 7.8 7.5 103.3 108.4Pulp m i l l s ...................................................................... 261 n .a . 11.1 11.6 3.5 4.5 7.6 7.1 82.7 98.7Paper m i l l s , excep t b u ild in g p a p e r ................ 262 177.5 10.3 11.0 4.6 4.9 5.7 6.0 106.5 108.4Paperboard m i l l s ......................................................... 263 65.1 12.3 12.9 4.9 5.0 7.4 7.8 106.7 102.5M iscellaneous converted paper p r o d u c t s . . . . 264 220.1 14.0 14.0 5.8 6.1 8.2 7.9 89.9 97.2Paper c o a tin g and g la z in g ................................ 2641 57.9 10.8 11.4 4.4 5.0 6.4 6.4 67.6 80.1E nvelopes......................................... .......................... 2642 24.6 16.8 17.9 6.6 7.9 10.1 9.9 100.3 114.3
Bags, excep t t e x t i l e bag s................................ 2643 50.6 16.2 15.8 6.8 6.4 9.4 9.4 99.3 101.1D le -cu t paper and b o a rd .................................... 2645 n .a . 13.4 13.8 6.1 6.2 7.3 7.6 90.7 95.7P ressed and molded pu lp goods................ .. 2646 n.a* 17.9 17.1 7.5 7.4 10.4 9.7 136.6 132.0S a n ita ry paper p ro d u c ts .................................... 2647 n .a . 10.3 10.5 3.9 4.5 6.4 6.0 83.2 90.0S ta tio n e ry p ro d u c ts .............................................. 2648 n .a . 15.8 15.9 6.4 8.0 9.4 7.9 83.9 111.2Converted paper p ro d u c ts , n . e . c ................... 2649 n .a . 16.4 15.1 7.2 7.0 9.1 8.1 105.6 107.4
Paperboard c o n ta in e rs and bo xes....................... 265 214.9 16.4 15.9 6.8 7.1 9.6 8.8 114.0 121.6Folding paperboard bo xes.................................. 2651 45.2 15.7 14.4 6.3 6 .0 9.4 8.4 99.3 101.6S et-up paperboard boxes.................................... 2652 n .a . 12.9 12.8 5.2 5.2 7.7 7.6 92.5 90.1C orrugated and s o l id f ib e r bo xes................ 2653 110.5 18.5 17.7 7.7 8.1 10.7 9.6 127.7 139.8S a n ita ry food c o n ta in e r s . ................................ 2654 26.8 12.4 12.7 5.5 5.9 6.9 6.8 104.3 96.0F ib er can s, drums, and s im ila r
p ro d u c ts .................................................................. 2655 n .a . 15.5 15.1 5.9 6.6 9.6 8.5 98.7 119.2B uild ing paper and board m i l l s ......................... 266 n .a . 13.3 11.1 5.7 5.7 7.6 5.3 106.7 122.5
P r in tin g and p u b lish in g ......................................... .. 27 1,239 .5 7.0 7.1 2.9 3.1 4.1 4.0 43.8 45.1Newspapers...................................................................... 271 423.0 5.8 6.0 2.6 2.8 3.2 3.2 44.2 46.2P e r io d ic a ls .................................................................... 272 80.5 2.9 2.8 1.2 1.3 1.7 1.5 16.9 18.9
See footnotes at end of table.
9Digitized for FRASER http://fraser.stlouisfed.org/ Federal Reserve Bank of St. Louis

Table 1. Continued— Occupational Injury and Illness Incidence rates by industry, 1978 and 19791
Incidence rates per 100 full-time workers b j
In d u s try 2/SICcode1 /
1979 annual average
employment ( in thousands)
4 /T o ta l
cases j>/Lost
workdaycases
N onfata l cases
w ithout l o s t
workdaysLost
workdays
1978 1979 1978 1979 1978 1979 1978 1979
Books.................................................... ............................ 273 103.4 7.2 7.3 2.7 2.9 4.5 4.4 36.6 39.4Book p u b lish in g .................................................. .. 2731 70.7 4.8 5.0 2.0 2.0 2.8 3.0 24.3 26.0Book p r in t in g ........................................................... 2732 32.7 12.3 12.1 4.2 4.7 8.1 7.4 63.4 66.5
M iscellaneous p u b lish in g .................................. .. 274 45.7 2.7 3.2 1.2 1.5 1.5 1.7 19.0 20.8Commercial p r i n t i n g . . .............................................. 275 409.2 8.7 8.6 3.6 3.7 5.1 4.9 53.0 50.9
Commercial p r in t in g , l e t t e r p r e s s ................ 2751 167.4 7.7 8.1 3.3 3.5 4.4 4.6 50.8 49.3Commercial p r in t in g , l i t h o g r a p h i c . . . . . . . 2752 219.2 9.1 8.8 3.6 3.5 5.5 5.2 52.5 49.0Engraving and p la te p r in t in g .......................... 2753 n .a . 8.0 7.2 2.7 3.3 5.3 3.9 55.0 44.6Commercial p r in t in g , g ra v u re ......................... 2754 n .a . 16.0 15.2 8.4 8.0 7.6 7.2 94.5 113.1
M anifold bu s in e ss form s..................................... 276 46.7 11.7 13.1 4.9 5.6 6.7 7.5 57.4 69.4G reeting card p u b lish in g ....................................... 277 n .a . 6.4 6.4 2.7 2.8 3.7 3.6 32.4 39.5Blankbooks and bookbind ing.................................. 278 64.0 11.0 10.0 4.2 4.0 6.8 6.0 58.4 55.5
Blankbooks and lo o se le a f b in d e r s . . . . . . . . 2782 n .a . 10.7 9.8 4.3 3.8 6.4 6.0 52.6 52.2Bookbinding and r e la te d w ork......................... 2789 n .a . 11.4 10.2 4.0 4.3 7.3 5.9 67.5 61.0
P r in tin g tra d e s e r v ic e s ......................................... 279 43.2 2.5 3.1 .9 1.2 1.6 1.9 14.1 22.6T y p e se ttin g ............................................................... 2791 n .a . 1.6 2.3 .6 1.0 1.0 1.2 10.8 26.0P hotoengrav ing.................................................. 2793 n .a . 3.2 3.9 1.3 1.2 1.9 2.7 15.2 17.3E lec tro ty p in g and s te r e o ty p in g ..................... 2794 n .a . 5.8 5.9 1.8 1.7 4 .0 4.1 17.6 18.0L ithog rap h ic platem aking s e r v ic e s .............. 2795 n .a . 4.3 4.8 1.4 1.7 2.9 3.1 24.9 17.0
Chem icals and a l l i e d p ro d u c ts ................................ 28 1,110.7 7.8 7.7 3.3 3.5 4.5 4.2 50.9 54.9I n d u s t r ia l in o rg an ic chem ica ls.......................... 281 163.3 6.2 5.8 2.6 2.6 3.6 3.2 49.6 46.9A lk a lie s and c h lo r in e ......................................... 2812 n .a . 5.1 4.8 2.4 2.4 2.7 2.4 54.9 44.2
Ino rg an ic p igm ents................................................ 2816 n .a . 10.0 9.5 4.9 4.2 5.1 5.3 88.6 58.5I n d u s t r ia l in o rg a n ic chem icals, n . e . c . . . 2819 106.7 5.9 5.3 2.2 2.3 3.7 3.0 40.7 43.3
P la s t ic s m a te r ia ls and s y n th e t ic s ................... 282 211.3 5.7 5.4 2.3 2.4 3.4 3.0 35.8 41.4P la s t i c s m a te r ia ls and r e s in s ....................... 2821 86.3 8.7 8.9 3.8 4.2 4.9 4.7 53.3 71.6C e llu lo s ic man-made f i b e r s .............................. 2823 n .a . - 2 .9 - 1.1 - 1 .8 - 25.3Organic f i b e r s , n o n c e l lu lo s ic ....................... 2824 96.6 2.5 2.3 .8 .7 1.7 1.6 17.9 14.4
D rugs................................................................................. 283 193.4 6.7 7.0 3.0 3.4 3.7 3.6 42.7 47.3B io lo g ic a l p ro d u c ts ....................................... 2831 n .a . 6.4 7.7 3.1 3.2 3.3 4.5 49.0 51.9M edicinals and b o ta n ic a l.................................. 2833 n .a . 7.1 8.8 4.0 4.0 3.1 4.7 58.2 54.1Pharm aceu tical p re p a ra t io n s ........................... 2834 154.2 6.7 6.8 2.9 3.3 3.8 3.5 40.0 45.9
Soap, c le a n e r s , and t o i l e t goods..................... 284 139.0 9.8 9.7 4.5 4.8 5.3 4.9 68.0 71.5Soap and o th e r d e te rg e n ts ................................ 2841 41.2 8.7 9.3 4.5 4.7 4.1 4.6 69.1 77.9P o lish e s and s a n i ta t io n goods....................... 2842 n .a . 12.8 12.7 5.2 6.1 7.6 6.6 81.8 81.7S urface a c tiv e a g e n ts ......................................... 2843 n .a . 14.2 9.8 5.9 4.9 8.3 4.9 78.9 64.7T o i le t p r e p a ra tio n s .............................................. 2844 58.0 8.5 8.2 3.9 4.0 4.6 4.2 58.2 61.5
P a in ts and a l l i e d p ro d u c ts .................................. 285 68.8 14.3 13.4 6.0 5.9 8.2 7.5 78.1 81.2I n d u s t r ia l o rgan ic chem ica ls.............................. 286 171.7 6.2 5.7 2.5 2.5 3.7 3.2 41.4 46.6
Gum and wood chem ica ls................ ...................... 2861 n .a . 9.2 9.7 4.0 4.5 5.2 5.2 64.3 71.2C yclic crudes and in te rm e d ia te s .............. .. 2865 37.2 9.9 7.7 3.8 3.3 6.0 4.3 63.1 58.8I n d u s t r i a l o rgan ic chem icals, n . e . c .......... 2869 n .a . 5.0 4.9 2.1 2.1 2.9 2.8 33.8 41.6
A g r ic u ltu ra l chem ica ls........................................... 287 69.9 9.1 9.9 3.6 4.2 5.5 5.6 56.7 62.3N itrogenous f e r t i l i z e r s ..................................... 2873 n . a . 7.8 9.0 2.9 3.1 4.9 5.9 43.1 50.2Phosphate f e r t i l i z e r s ......................................... 2874 n .a . 8.4 7.9 2.9 3.1 5.5 4.8 62.0 54.3F e r t i l i z e r s , m ixing o n ly .................................. 2875 n .a . 13.4 13.0 4.8 5.4 8.6 7.6 79.5 85.8A g r ic u ltu ra l chem icals, n . e . c ....................... 2879 n .a . 7.9 9.8 3.7 4.9 4.2 4.9 49.4 61.1
M iscellaneous chem ical p ro d u c ts ....................... 289 93.4 11.6 12.8 5.1 5.9 6.5 6.9 73.4 81.8A dhesives and s e a la n t s ....................................... 2891 n .a . 14.2 16.2 5.9 7.9 8.3 8.3 81.8 83.4E x p lo s iv e s ................................................................. 2892 n .a . 5.7 5.7 2.4 2.2 3.3 3.5 53.1 45.0P r in t in g in k ............................................................. 2893 n .a . 13.4 13.5 5.3 5.9 8.1 7.6 71.4 91.1Carbon b la c k ............................................................. 2895 n .a . 7.3 8.1 4.3 4.3 3.0 3.8 86.5 88.8Chemical p re p a ra tio n s , n . e . c .......................... 2899 n .a . 12.4 13.6 5.6 6.3 6.8 7.3 75.8 88.9
Petro leum and coa l p ro d u c ts ..................................... 29 210.0 7.9 7.7 3.4 3.6 4.5 4.1 58.3 62.0Petro leum r e f in in g .................................................... 291 165.4 6.0 5.6 2.7 2.7 3.3 2.9 46.0 46.0Paving and ro o fing m a te r ia l s .............................. 295 32.6 14.4 15.6 5.7 6.9 8.7 8.7 105.7 122.0
Paving m ix tures and b lo c k s .............................. 2951 n .a . 11.1 14.0 4.1 5.8 7.0 8.1 71.4 95.3A sphalt f e l t s and c o a t i n g s . . .......................... 2952 n .a . 16.3 16.4 6.6 7.4 9.7 8.9 125.8 135.6
M iscellaneous petro leum and coa lp ro d u c ts .................................................................. 299 n .a . 16.6 15.3 7.1 7.3 9.5 8.0 92.1 112.8
L u b ric a tin g o i l s and g re a s e s ......................... 2992 n .a . 13.8 14.9 5.9 7.3 7.9 7.6 79.0 117.1Petroleum and coa l p ro d u c ts , n . e . c ............ 2999 n .a . 27.2 17.3 11.4 7.3 15.7 10.0 140.9 90.0
See footnotes at end of table.
10Digitized for FRASER http://fraser.stlouisfed.org/ Federal Reserve Bank of St. Louis

Table 1. Continued— Occupational Injury and lllnesa Incidence rates by Industry, 1978 and 19791
Inc idence r a te s pe r 100 f u l l - t im e w orkers 5 /
In d u s try 2 /SICcode
3/
1979 annual average
employment ( in thousands)
4 /T o ta l
cases _6/Lost
workdaycases
N onfata l cases
w itho u t lo s t
workdaysLost
workdays
1978 1979 1978 1979 1978 1979 1978 1979
Rubber and m isce llaneou s p l a s t i c s p ro d u c ts . . 30 775.6 17.1 17.1 8.1 8.2 9.0 8.9 125.5 127.1T ire s and in n e r tu b e s ............................................. 301 121.9 15.4 15.0 11.4 11.2 3.9 3.8 207.1 207.1Rubber and p la s t i c s foo tw ear.............................. 302 23.0 12.9 14.3 6.6 6.3 6.3 8.0 84.7 116.0Reclaimed ru b b e r.................................... ................... 303 n .a . 30.5 30.0 17.4 22.4 13.1 7.6 373.3 510.4Rubber and p la s t i c s hose and b e l t in g ............ 304 n .a . 13.9 15.0 6.9 7.2 7.0 7.8 118.1 104.5F a b ric a te d rubber p ro d u c ts , n . e . c ................... 306 118.7 17.0 17.3 8.2 8.7 8.8 8.6 125.3 140.1M iscellaneous p la s t i c s p ro d u c ts ....................... 307 487.7 18.1 17.8 7.2 7.5 10.9 10.3 104.2 104.2
L ea ther and le a th e r p ro d u c ts .................................. 31 248.0 11.7 11.5 4.7 4.9 6.9 6.6 72.5 76.2L ea ther tann ing and f in i s h in g ............................ 311 19.9 23.8 21.8 11.8 11.9 11.9 9.9 203.1 182.8Boot and shoe c u t s to ck and f in d in g s ............ 313 n .a . 16 .0 13.5 6 .0 5.6 10.0 7.9 96.2 79.5Footwear, excep t ru b b e r......................................... 314 151.2 10.4 10.7 4.1 4.4 6.2 6.3 62.6 70.1
House s l ip p e r s ........................................... ............. 3142 n .a . 9 .0 9.7 4.0 4.6 5.0 5.1 65.0 71.1Men's footw ear, excep t a t h l e t i c .................. 3143 58.6 10.9 12.5 4.5 4.9 6.4 7.6 61.9 79.5Women's footw ear, except a t h l e t i c .............. 3144 60.6 9.5 9.3 3.6 4.0 5.9 5.3 62.5 68.0Footwear, excep t rubb e r, n . e . c ..................... 3149 n .a . 11.4 10.5 4.4 3.9 7.0 6.5 64.3 53.2
L ea ther g loves and m it te n s .................................. 315 n .a . 5.4 5.6 2.4 2.5 3.0 3.1 23.2 64.5Luggage............................................................................. 316 17.6 11.2 12.6 4.5 5.6 6.7 7.0 52.6 83.2Handbags and p e rso n a l le a th e r goods.............. 317 33.2 9.2 7.9 2.9 2.8 6.3 5.0 39.7 40.1
Women's handbags and p u r s e s . . . . . ................ 3171 n .a . 7.9 7.1 2.0 2.1 5.9 5.0 31.8 26.0P ersona l le a th e r goods, n . e . c ....................... 3172 n .a . 10.5 8.9 3.8 3.9 6.6 5.0 47.8 59.1
L ea ther goods, n . e . c ................................................ 319 n .a . “ 12.1 - 4.6 7.5 - 56.8T ra n sp o r ta tio n and p u b lic u t i l i t i e s ....................... 5 ,141 .0 10.1 10.2 5.7 5.9 4.3 4.1 102.3 107.0
R a ilroad t r a n s p o r ta t io n _8/....................................... 40 555.7 12.0 12.4 7.6 8.1 4.3 4.3 99.6 105.9Local and in te ru rb a n passenger t r a n s i t ............ 41 264.4 8.7 9.3 4.7 5.1 4.0 4.1 84.9 97.5Trucking and w arehousing........................................... 42 1 ,343 .0 16.2 15.8 9.4 9.5 6.8 6.3 177.1 188.7
T ruck ing, lo c a l and long d is ta n c e ................... 421 n .a . 16.3 15.7 9.5 9.5 6.7 6.2 182.1 192.2P u b lic w areho usin g ................................................... 422 90.9 15.5 16.5 7.4 8.1 8.0 8.4 105.7 139.6Trucking te rm in a l f a c i l i t i e s .............................. 423 n .a . 17.9 21.8 9.5 12.1 8.4 9.7 176.4 176.3
Water t r a n s p o r ta t io n .................................................... 44 216.7 14.4 14.1 7.8 7.8 6.6 6.2 272.1 286.1Water tr a n s p o r ta t io n s e r v ic e s ........................... 446 n .a . 21.9 21.1 12.2 11.8 9.6 9.2 459.5 467.0
T ra n sp o r ta tio n by a i r .................................................. 45 437.0 13.4 13.7 8.4 8.6 4.9 5.1 95.8 102.4P ip e lin e s , excep t n a tu ra l g a s ................................ 46 19.7 4.7 4.6 1.9 1.6 2.8 3.0 29.3 21.9T ra n sp o r ta tio n s e r v ic e s ......................... .................... 47 187.6 5.5 6.0 2.7 3.0 2.8 3.0 41.7 47.0
M iscellaneous t r a n s p o r ta t io n s e r v ic e s ......... 478 n .a . 17.9 21.8 7.6 10.1 10.3 11.7 119.8 169.3Communication.................................................................... 48 1,310 .2 2.7 2.8 1.5 1.7 1.2 1.1 28.7 29.0E le c t r ic , g a s , and s a n i ta ry s e r v ic e s ................ 49 806.8 9.0 8.9 4.4 4.4 4.6 4.5 76.5 73.0
E le c tr ic s e r v ic e s .................................................... .. 491 373.6 - 8.2 - 3.7 - 4.5 - 61.6S a n ita ry s e r v ic e s ...................................................... 495 47.6 25.9 24.1 15.1 14.2 10.8 9.8 223.0 209.8
W holesale and r e t a i l t r a d e ........................................... 20 ,269.0 7.9 8.0 3.2 3.4 4.7 4.6 44.9 49.0W holesale t r a d e ............................................................... 5 ,204 .0 8.9 8.8 3.9 4.1 5.0 4.7 57.5 59.1
W holesale tra d e —du rab le goods......................... 50 3,084.0 8.6 8.6 3.6 3.8 5.0 4 .8 51.8 52.8W holesale tr a d e —nondurab le goods.................. 51 2 ,120.0 9.3 9.1 4.4 4.5 4.9 4.5 65.8 68.7
R e ta il t r a d e ...................................................................... 15 ,066 .0 7.5 7.7 2.8 3.1 4.7 4.6 39.7 44.7B u ild ing m a te ria ls and garden s u p p l i e s . . . . 52 629.5 9.8 9.5 4.2 4.2 5.6 5.3 60.6 61.3Lumber and o th e r b u ild in g m a te r ia l s .......... 521 n .a . - 12.1 - 5 .6 - 6.5 “ 80.4G eneral m erchandise s t o r e s .................................. 53 2,276.2 9.1 9.8 3.8 4.2 5.3 5.6 48.6 55.9Food s to r e s .................................................................... 54 2,298.1 10.7 11.7 4.2 5.1 6.5 6.6 67.2 82.3Automotive d e a le rs and s e rv ic e s t a t i o n s . . . 55 1 ,827.5 8.0 7.9 2.5 2.7 5.4 5.2 39.0 41.7A pparel and accesso ry s t o r e s . . . . . . . . . . . . . . 56 950.2 2.3 2.6 .9 .9 1.4 1.7 14.8 16.2F u rn itu re and home fu rn ish in g s s t o r e s .......... 57 613.1 5.1 4.7 2.4 2.4 2.6 2.3 38.6 40.1E ating and d rin k in g p la c e s .................................. 58 4 ,580.4 7.5 7.6 2.5 2.8 4.9 4.8 28.7 32.4M iscellaneous r e t a i l ................................................ 59 1 ,890.5 3.8 3.8 1.6 1.6 2.1 2.2 23.8 25.1
F inance, In su rance , and r e a l e s t a t e ....................... 4 ,974.0 2.1 2.1 .8 .9 1.2 1.2 12.5 13.3B anking ............................................................................... 60 1 ,492.3 1.5 1.7 .6 .7 .9 1 .0 7.4 10.1C red it agencies o th e r than ban ks......................... 61 552.6 1.1 1.3 .4 .5 .7 .8 5.2 5.2S e c u r ity , commodity b ro k e rs , and s e r v i c e s . . . 62 201.4 .8 1.1 .3 .4 .5 .7 4.6 3.8Insu rance c a r r i e r s ......................................................... 63 1,204 .8 1 .9 2.0 .7 .8 1.2 1.2 12.1 10.3Insu rance a g e n ts , b ro k e rs and s e r v ic e .............. 64 430.2 .8 .8 .3 .3 .4 .5 - 5.2Real e s t a t e ........................................................................ 65 956.0 4.9 4.7 2.2 2.3 2.6 2.4 33.6 34.9
See footnotes at end of table.
11Digitized for FRASER http://fraser.stlouisfed.org/ Federal Reserve Bank of St. Louis

Table 1. Continued— Occupational inlury and Illnes8 Incidence rates by Industry, 1978 and 19791
In d u s try 2 /SICcode
3/
1979 annual average
employment ( in thousands)
4 /
Inc idence r a te s per 100 f u l l - t im e w orkers J5 /
T o ta l cases b j
Lostworkday
cases
N onfata lcases
w ithoutlo s t
workdaysLost
workdays
1978 1979 1978 1979 1978 1979 1978 1979
S e rv ic e s . ......................... ........................................................ 16 ,754 .0 5.5 5.5 2.4 2.5 3.1 3.0 36.2 38.1H otels and o th e r lodging p la c e s ............................ 70 1,053 .4 9.2 9.1 3.6 3.7 5.6 5.3 51.5 51.8P ersona l s e r v ic e s .......................................................... 72 923.9 3.5 3.2 1.5 1.5 1.9 1.7 28.1 25.5B usiness s e r v ic e s ........................................................... 73 2 ,875.0 4.9 5.0 2.2 2.4 2.7 2.6 34.9 35.4Auto r e p a i r , s e rv ic e s , and g a ra g e s ..................... 75 578.4 8.2 8.0 3.4 3.5 4.8 4.5 42.2 57.0M iscellaneous r e p a ir s e r v ic e s ............................... 76 286.7 10.0 9.3 4.5 4.2 5.5 5.1 69.3 70.8
M iscellaneous r e p a ir sh ops................................... 769 n .a . 12.4 11.9 5.4 5.3 7.0 6.6 80.4 89.3Motion p ic tu r e s ................................................................ 78 226.6 4.2 5.2 1.3 1.6 2.9 3.6 25.7 27.5Amusement and r e c re a t io n s e r v ic e s ....................... 79 705.0 8.4 8.3 3.7 3.7 4.7 4.6 46.7 58.5H ealth s e r v ic e s ................................................................ 80 4 ,979 .4 6.8 6.8 3.0 3.2 3.7 3.6 48.1 49.9E duca tional s e r v ic e s .................................................... 82 1,086 .2 3.2 3.3 1.3 1.3 1 .9 2.0 19.5 17.2S o cia l s e r v ic e s .............. ................................................. 83 1 ,085 .8 6.0 5.9 2.6 2.5 3.4 3.4 37.8 41.5Museums, b o ta n ic a l , and z o o lo g ic a l
gard en s......................................................... 84 n .a . 7.3 6.8 2.7 2.7 4.6 4.1 35.1 26.5M iscellaneous s e r v ic e s ....................... ........................ 944.4 1.9 2.2 .7 .8 1.2 1.3 10.3 11.1
1 To compare 1978 and 1979 survey data with data published in previous years, a statistical method was developed for generating the estimates to represent the small nonfarm employers in low-risk industries who were not surveyed. The estimating procedure involved averaging the data reported by small employers for the 1975,1976, and 1977 annual surveys.
* Totals for divisions and 2- and 3-digit sic codes include data for industries not shown separately.
* Standard Industrial Classification Manual, 1972 Edition, 1977 Supplement.4 Annual average employment for nonagricultural industries is based on the employment
and earnings survey conducted by the Bureau of Labor Statistics, in cooperation with the State agencies. The employment estimate for the services division is adjusted to exclude the employment for (a) nonfarm portion of agricultural services and (b) nonclassifiable establishments. Annual average employment for the agriculture, forestry, and fishing division is a composite of data from State unemployment insurance programs, and estimates of hired- farm workers engaged in agricultural production provided by the U.S. Department of Agriculture. The agricultural production employment estimate as originally published by the Department of Agriculture is adjusted to exclude employment on farms with fewer than 11 employees.
'The incidence rates represent the number of injuries and illnesses or lost workdays per 100 full-time workers and were calculated as: (N/EH X 200,000, where
N = number of injuries and illnesses or lost workdays EH = Total hours worked by all employees during calendar year200,000 = base for 100 full-time equivalent workers (working 40 hours per week, 50
weeks per year).
• Includes fatalities. Because of rounding, the difference between the total and the sum of the rates for lost workday cases and nonfatal cases without lost workdays does not reflect the fatality rate.
7 Excludes farms with fewer than 11 employees.' Data conforming to osha definitions for coal and lignite mining (sic 11 and 12) and metal
and nonmetal mining (sic 10 and 14), and for railroad transportation (sic 40) were provided by the Mine Safety and Health Administration, U.S. Department of Labor, and by the Federal Railroad Administration, U.S. Department of Transportation.
Note: Dashes indicate data that do not meet publication guidelines.n.e.c. = Not elswhere classified.n.a. = Data not available.
12Digitized for FRASER http://fraser.stlouisfed.org/ Federal Reserve Bank of St. Louis

Table 2. Number of occupational Injurlee and lllneeeee, and loet workdaye by Induetrydivision, 1978 and 19791(In thousands)
In d u s try d iv is io nT o ta l cases 2 J Lost workday
casesN o n fa ta l cases
w itho u t l o s t workdays L ost workdays
1978 1979 1978 1979 1978 1979 1978 1979
INJURIES AND ILLNESSESP riv a te s e c to r _3/.................. ............... 5 ,799.4 6,105.7 2,492 .0 2 ,757.7 3 ,30 2 .0 3 ,342.3 39 ,015.4 43 ,576.5
A g r ic u ltu re , f o r e s t r y , and f is h in g J3/. 67.1 66.0 31.4 32.2 35.6 33.7 467.0 473.9M ining......... ........................................................... 98.4 108.4 55.0 64.4 42.9 43.5 1 ,22 9 .2 1 ,43 4 .5C o n s tru c tio n .................................. .. 576.6 620.4 230.9 261.9 344.5 357.4 3 ,945.1 4,606 .5M anufacturing ...................................................... 2 ,581.6 2 ,681.9 1,084 .4 1 ,18 6 .0 1 ,49 5 .9 1 ,494 .9 16 ,567.7 18 ,211.1T ra n sp o rta tio n and p u b lic u t i l i t i e s * . • 462.9 487.3 264.5 285.9 197.4 200.3 4 ,70 6 .9 5,196 .1W holesale and r e t a i l t r a d e . ....................... 1 ,252 .2 1,325 .6 499.0 561.8 752.4 762.8 7 ,113 .4 8 ,075 .0
W holesale t r a d e ............................................. 413.8 434.5 182.5 202.4 231.0 231.6 2,675 .8 2,924 .6R e ta il t r a d e .................................................... 838.4 891.1 316.5 359.3 521.4 531.2 4 ,437 .5 5 ,150 .4
F inance, In su ran ce , and r e a l e s t a t e . •• 85.2 94.5 35.2 41.3 49 .8 53.0 519.5 584.8S e rv ic e s .......................................................... .. 675.5 721.4 291.6 324.2 383.5 396.8 4 ,46 6 .6 4 ,994 .6
INJURIESP riv a te s e c to r J3/. . . ........................... 5 ,656 .0 5 ,956 .8 2,438.5 2,701 .4 3,212 .5 3 ,250.4 38 ,173.9 42 ,636.9
A g r ic u ltu re , f o r e s t r y , and f is h in g 3_f• 63.7 62.8 30.2 31.4 33.4 31.3 453.5 462.5M ining...................................................................... 96.8 106.9 54.5 63.9 41.9 42.5 1 ,221 .7 1 ,428 .1C o n stru c tio n ........................................................ 568.8 611.8 228.5 258.9 339.2 351.8 3 ,899 .8 4 ,56 2 .4M anufacturing ...................................................... 2 ,494 .9 2 ,594.6 1,053.2 1,152 .7 1 ,440 .6 1 ,440 .9 16 ,066.7 17 ,630.6T ra n sp o rta tio n and p u b lic u t i l i t i e s . . . 454.9 479.0 260.9 282.3 193.1 195.6 4 ,661 .1 5,152 .1W holesale and r e t a i l t r a d e ................ .. 1 ,237 .2 1 ,309 .8 492.6 555.9 744.0 752.9 7 ,012.2 7,967.1
W holesale t r a d e ............................................. 408.4 429.0 180.5 200.3 227.6 228.2 2,644 .2 2,878 .4R e ta il t r a d e .................................................... 828.8 880.8 312.0 355.6 516.4 524.8 4 ,36 8 .0 5 ,088 .7
F inance, in su ra n c e , and r e a l e s t a t e . . . 83.3 92.5 34.3 40.5 48.8 51.9 502.1 566.7S e rv ic e s ...................................... .. 656.4 699.5 284.4 315.7 371.6 383.4 4 ,356 .7 4,867 .5
ILLNESSESSP riv a te s e c t o r a l / .............. .. 143.5 148.9 53.5 56.4 89.5 92.0 841.4 939.6
A g r ic u ltu re , f o r e s t r y , and f is h in g J / . 3.4 3 .2 1.2 .9 2.2 2.3 13.5 11.4M ining.................................... ................................. 1 .6 1 .6 .5 .5 1.1 1 .0 7.5 6.4C o n s tru c tio n ........................................................ 7 .8 8 .7 2.4 3.0 5.3 5.5 45.2 44.2M anufacturing ................................................... .. 86.7 87.4 31.3 33.3 55.3 54.0 500.9 580.5T ra n sp o rta tio n and p u b lic u t i l i t i e s . •• 7.9 8.4 3.5 3.6 4.4 4.7 45.8 44.0W holesale and r e t a i l t r a d e ....................... 15.0 15.8 6.4 5.8 8.4 9 .9 101.1 107.9
W holesale t r a d e ............................................. 5.4 5 .5 2.0 2.1 3.4 3.4 31.6 46.2R e ta il t r a d e .................................. .. 9 .6 10.3 4.4 3.7 5 .0 6.5 69.5 61.7
Finance, in su ra n c e , and r e a l e s t a t e * . • 1 .9 2 .0 .9 .8 1.0 1.1 17.4 18.1S e rv ic e s ................................................................ 19.2 21.9 7.2 8.5 11.9 13.4 109.9 127.1
1 To compare 1978 and 1979 survey data with data published in previous years, a statistical method was developed for generating the estimates to represent the small nonfarm employers in low-risk industries who were not surveyed. The estimating procedure involved averaging the data reported by small employers for the 1975,1976, and 1977 annual surveys.
2 Includes fatalities.3 Excludes farm with fewer than 11 employees.
Note: Because of rounding, components may not add to totals.
13Digitized for FRASER http://fraser.stlouisfed.org/ Federal Reserve Bank of St. Louis

Table 3. Number of occupational injurlee and lllneaaea by Induetry, 19791
In d u stry 2 /
In ju r ie s and i l l n e s s e s In ju r ie s I l l n e s s e s
SICcode1 /
T o ta lc a se s
(thousands)
L ost workday
ca se 8 (thousands)
Averagel o s t
workdays per l o s t workday
ca se
T o ta lc a se s
(thousands)
L ost workday
ca se 8 (th ou sands)
Averagel o s t
workdays per l o s t workday
c a se
T o ta lc a se s
(th ou sands)
L ostworkday
c a se s(thousands)
Averagel o s t
workdays p er l o s t workday
c a se
P riv a te se c to r j&/. . . . . .................................... 6 ,1 0 5 .7 2 ,7 5 7 .7 16 5 ,9 5 6 .8 2 ,7 0 1 .4 16 14 8 .9 56 .4 17A g r ic u ltu r e , f o r e s tr y , and f i s h in g j» / ............... 6 6 .0 32 .2 15 62 .8 31 .4 15 3 .2 .9 13
A g r ic u ltu r a l p rod u ction k j ............................... 01-02 38 .6 1 8 .8 13 36 .7 1 8 .3 13 1 .9 .5 10A g r ic u ltu r a l s e r v ic e s ........................................... 07 25 .6 1 2 .6 16 24 .4 12 .2 16 1 .2 .4 18F o r e s tr y .......................................................................... 08 1 .4 .6 16 1 .3 .6 16 .1 (6) 4F ish in g , h u n tin g , and tra p p in g ...................... 09 .5 .3 22 .4 .2 22 (6) (6) 21
M ining......................................................................................... 108 .4 64 .4 22 106 .9 6 3 .9 22 1 .6 .5 13M etal m ining 5 / .................................. • ..................... 10 9 .0 5 .3 20 8 .9 5 .2 20 .2 .1 10A n th ra cite m ining 5 ! .................... .. 11 .4 .2 24 .4 .2 25 (6) (6) 7Bitum inous c o a l and l i g n i t e m ining 5 / . . . 12 23 .5 1 8 .8 25 23 .1 18 .7 25 .4 .1 14O il and gas e x t r a c t i o n . . . .................................. 13 6 5 .9 33 .8 22 65 .2 33 .6 22 .7 .2 -Nonmetal l i e m in e r a ls , ex c e p t f u e l s j > / . . . 14 9 .6 6 .3 19 9 .4 6 .2 2.9 .3 .1 13
C on stru ctio n ...................................................................... .... 62 0 .4 261 .9 18 611 .8 258 .9 18 8 .7 3 .0 15General b u ild in g c o n tr a c to r s ........................... 15 17 3 .0 72 .1 16 171 .3 71 .5 16 1 .7 .6 17Heavy c o n str u c tio n c o n tr a c to r s ...................... 16 14 0 .5 56 .5 18 137 .6 55 .7 18 2 .9 .9 13S p e c ia l trad e c o n tr a c to r s .................................. 17 30 7 .0 133 .3 18 302.9 131 .8 18 4 .0 1 .5 16
M anufacturing.................................... ................ .................. 2 ,6 8 1 .9 1 ,1 8 6 .0 15 2 ,5 9 4 .6 1 ,1 5 2 .7 15 87 .4 33 .3 17D urable good s.................................... ................................ 1 ,7 5 8 .3 776.1 15 1 ,7 0 0 .7 754 .8 15 57 .5 21 .3 18
24 14 7 .7 76 .9 16 14 6 .0 76 .3 16 1 .7 ,7 1925 82 .5 33 .4 14 80 .8 32 .8 14 1 .7 .6 19
S ton e, c la y , and g la s s p r o d u c ts .................... 32 11 6 .4 55 .7 17 113 .3 54 .6 17 3 .1 1 .1 1733 211 .5 9 9 .0 17 206.2 97 .2 16 5 .3 1 .8 27
F ab ricated m etal products 34 331 .7 145 .2 14 332 .9 142.2 14 8 .8 3 .0 16M achinery, ex cep t e l e c t r i c a l . . 35 356.2 14 3 .9 14 345.5 13 9 .9 14 10 .8 4 .0 20E le c tr ic and e le c t r o n ic equipm ent............... 36 17 7 .0 70 .6 15 165 .6 66 .3 15 11 .4 4 .3 19T ran sp orta tion equipm ent.......... .. 37 240.1 11 3 .6 16 229.8 109 .4 16 10 .3 4 .1 16Instrum ents and r e la te d p r o d u c t s ................ 38 4 7 .3 1 8 .4 14 44 .6 17 .5 14 2 .7 .9 15M isce llan eo u s m anufacturing I n d u s tr ie s . . 39 4 8 .0 19 .2 14 46 .1 18 .6 14 1 .9 .6 18
Nondurable good s............................................................... 923 .6 40 9 .0 16 893 .8 397.9 16 29 .8 1 2 .0 16Food and k indred p r o d u c ts .................................. 20 331 .2 157 .8 15 319 .4 152 .2 15 1 1 .8 5 .7 14Tobacco m anu factures.............................................. 21 5 .6 2 .6 15 5 .6 2 .6 15 .1 (6) 8T e x t i le m i l l p ro d u cts ....................................... 22 84 .4 29 .5 18 82 .9 29 .1 18 1 .4 .4 13Apparel and o th er t e x t i l e p r o d u c ts ............. 23 74 .4 25 .6 15 72 .5 24 .9 15 2 .0 .7 16Paper and a l l i e d p ro d u cts .................................. 26 9 5 .6 4 2 .0 18 93 .9 4 1 .4 18 1 .7 .6 19P r in t in g and p u b lis h in g ....................................... 27 78 .2 33 .8 15 76 .9 33 .3 15 1 .3 .4 23Chem icals and a l l i e d p r o d u c ts ......................... 28 8 4 .2 38 .3 16 78 .7 36 .3 16 5 .5 2 .0 11Petroleum and c o a l p r o d u c ts ............................. 29 1 6 .3 7 .6 17 15 .8 7 .4 17 •5 .2 13Rubber and m isc e lla n e o u s p l a s t i c s
p rod u cts .............................................................• • • • 30 12 8 .3 61 .8 15 124 .0 60 .3 15 4 .3 1 .5 21Leather and le a th e r p r o d u c ts .......... ................ 31 25 .4 1 0 .9 16 24 .1 10 .3 15 1 .3 .5 23
T ran sp orta tio n and p u b lic u t i l i t i e s ............... .. 487 .3 28 5 .9 18 47 9 .0 282 .3 18 8 .4 3 .6 12R ailroad tra n sp o rta t io n 5 / ................................ 40 65 .5 4 2 .8 13 63 .7 41 .9 13 1 .8 .9 7L ocal and ln teru rb an p a ssen ger t r a n s i t . . 41 1 8 .8 10 .4 19 1 8 .6 10 .3 19 .2 .1 18Trucking and w arehousin g..................................... 42 205 .2 122 .7 20 20 3 .8 121 .9 20 1 .5 .8 21Water tr a n sp o r ta t io n .............................................. 44 2 8 .0 1 5 .5 36 27 .5 15 .3 37 .4 .2 23T ran sp orta tion by a i r . .................................. .. 45 53 .1 33 .2 12 51 .9 32 .3 12 1 .2 .8 10P ip e l in e s , excep t n a tu ra l g a s ........................ 46 .9 .3 13 .8 .3 14 (6) (6) -T ran sp orta tion s e r v ic e s ....................................... 47 10 .2 5 .1 16 10 .1 5 .1 16 .1 .1 -C om m unication.. . . . . . . . . . . . . . . . . . . . . . . . . . 48 36 .1 21 .4 17 34 .9 21 .0 17 1 .2 .3 11E le c tr ic , g a s , and sa n ita r y s e r v i c e s . . . . 49 6 9 .6 34 .6 17 67 .6 34 .1 17 2 .0 .5 7
W holesale and r e t a i l t r a d e . . . . . . . . . . . . . . . . . . 1 ,3 2 5 .6 561 .8 14 1 ,3 0 9 .8 555 .9 14 1 5 .8 5 .8 19W holesale t r a d e . . . . . . . . . . . . . . . . . . . . . . . . . . . 434 .5 202 .4 14 42 9 .0 200 .3 14 5 .5 2 .1 22
W holesale trad e——durable goods . . . . . . . . . a 50 255 .1 113 .1 14 252 .4 112 .2 14 2 .8 .9 32W holesale tra d e—nondurable go od s. . . . . . . 51 17 9 .4 89 .3 15 17 6 .6 88 .2 15 2 .8 1 .1 14
B p f a i 1 tra d e* . . . . . . . . . . . . . . . . . . . . . . . . . . . . . . 891 .1 359 .3 14 880 .8 355 .6 14 10 .3 3 .7 17B u ild in g m a te r ia ls and garden s u p p l ie s •• 52 54 .4 24 .1 15 53 .9 24 .0 15 .5 .2General m erchandise s t o r e s • • • • • • • • • • • • • • 53 16 3 .8 6 9 .8 13 16 2 .4 69 .4 13 1 .4 .4 11Food s t o r e s .................................................................... 54 205 .4 9 0 .0 16 204.8 89 .7 16 .7 .4A utom otive d e a le r s and s e r v ic e s t a t io n s . 55 13 6 .6 4 6 .8 15 135 .1 46 .1 15 1 .4 .7 23Apparel and a ccesso ry s t o r e s ........................... 56 18 .7 6 .7 17 18 .4 6 .6 17 .3 (6) -F urniture and home fu r n is h in g s s t o r e s * . . 57 25 .6 1 2 .8 17 25 .1 12 .6 17 .4 .2 -Eating and d rin k in g p la c e s ........................... 58 229 .8 8 4 .8 12 224 .9 83 .2 12 4 .9 1 .6 14M isce llan eo u s r e t a i l * * • • • • * ............................. 59 5 6 .9 24 .3 15 56 .1 24 .1 16 .8
See footnotes at end of table.
14Digitized for FRASER http://fraser.stlouisfed.org/ Federal Reserve Bank of St. Louis

Table 3. Continued—Number of occupational Injurlee and Illne88e8 by Indu8try, 19791In ju r ie s and i l l n e s s e s In ju r ie s I l l n e s s e s
In d u stry 2 / SICcode3 /
T ota lc a se s
(thousands)
Lost workday
case 8 (thousands)
Averagel o s t
workdays per l o s t workday
ca se
T o ta lc a se s
(th ou sands)
Lost workday
c a se s ( thousands)
Averagel o s t
workdays per l o s t workday
ca se
T o ta lc a se s
(th ou san d s)
Lostworkday
c a se s(thousands)
Averagel o s t
workdays per l o s t workday
ca se
F inance, in su ra n ce , and r e a l e s t a t e .................... 94 .5 41 .3 14 92 .5 40 .5 14 2 .0 0 .8 22Banking............................................................................. 60 22 .8 9 .7 14 22 .6 9 .7 14 .3 _ _C red it a g e n c ie s o th er than banks................. 61 6 .4 2 .3 11 6 .3 2 .3 11 .1 (6) -S e c u r ity , commodity b r o k e r s , and
s e r v ic e s ...................................................................... 62 2 .1 .8 9 2 .0 .8 91
•1 11IInsurance c a r r ie r s ................................... .............. 63 21 .7 8 .5 13 21 .4 8 .3 13 .3 .2 34Insurance a g e n ts , brokers and s e r v i c e . . . 64 2 .9 1 .1 18 2 .8 1 .1 - - - -R eal e s t a t e ................................................................... 65 36 .6 18 .1 15 35 .6 17 .7 15 1 .1 .5 18
S e r v ic e s ................................................................................... 721.4 324.2 15 699 .5 315.7 15 2 1 .9 8 .5 15H o te ls and o th er lod g in g p la c e s .................... 70 73 .5 30 .3 14 72 .0 29 .9 14 1 .5 .4 16P erson al s e r v ic e s ..................................................... 72 23 .5 10 .7 17 22 .5 10 .2 17 1 .0 .4 36B u sin ess s e r v ic e s ..................................................... 73 11 4 .4 53 .7 15 111 .2 52 .4 15 3 .3 1 .3 11Auto r e p a ir , s e r v ic e s , and g a r a g e s ............. 75 40 .9 18 .1 16 40 .2 17 .9 16 .7 - -
M isce llan eo u s r ep a ir s e r v i c e s ........................ 76 2 4 .0 10 .8 17 23 .5 10 .7 17 .5 .1 7Motion p ic tu r e s .......................................................... 78 8 .1 2 .5 17 7 .9 2 .5 17 .2 (6) -Amusement and r e c r e a t io n s e r v ic e s ............... 79 40 .2 17 .8 16 39 .2 17 .5 16 .9 .3 13H ealth s e r v ic e s .......................................................... 80 276 .5 130 .4 16 266 .6 126.3 16 9 .8 4 .1 13E d u cation al s e r v i c e s . . ......................................... 82 25 .4 9 .9 13 24 .5 9 .5 13 .9 .5 9S o c ia l s e r v ic e s .......................................................... 83 44 .3 19 .0 16 43 .1 18 .5 16 - - -Museums, b o ta n ic a l and z o o lo g ic a l
gard en s........................................................................ 84 1 .7 .7 10 1 .6 .6 10 .1 (6) 16M isce llan eo u s s e r v ic e s ......................................... 89 1 9 .0 7 .2 13 17 .7 6 .8 13 1 .3 .4 13
1 To compare 1979 survey data with data published in previous years, a statistical method was developed for generating the estimates to represent the small nonfarm employers in low-risk industries who were not surveyed. The estimating procedure involved averaging the data reported by small employers for the 1975,1976, and 1977 annual surveys.
2 Industry division totals include data for industries not shown separately.* Standard Industrial C lassification Manual, 1972 edition, 1977 supplement.4 Excludes farms with fewer than 11 employees.* Data conforming to osha definitions for coal and lignite mining (sic 11 and 12) and
metal and nonmetal mining (sic 10 and 14), and for railroad transportation (sic 40) were provided by the Mine Safety and Health Administration, U.S. Department of Labor, and by the Federal Railroad Administration, U.S. Department of Transportation.
* Estimates of fewer than 50 cases.
Note: Dashes indicate data that do not meet publication guidelines. Because of rounding, components may not add to totals.
The number of lost workdays for the 2-digit sic levels shown in this table can be approximated by multiplying the number of lost workday cases by the average lost workdays per lost workday case.
Approximations of average lost workdays per lost workday case for 3- and 4-digit sic levels can be derived by dividing the incidence rate of lost workdays by the incidence rate for lost workday cases appearing in tables 1 and 4.
15Digitized for FRASER http://fraser.stlouisfed.org/ Federal Reserve Bank of St. Louis

Table 4. Occupational Injury Incidence rates by Industry, 1978 and 19791
Inc idence r a te s p e r 100 fu l l - t im e w orkers 47
In d u s try 2 /SICcode
3/T o ta l
cases 5/Lost
workdaycases
N onfa ta l cases
w ithout lo s t
workdaysLost
workdays
1978 1979 1978 1979 1978 1979 1978 1979
P riv a te s e c to r _6/ .................................................. 9.2 9.2 4.0 4.2 5.2 5.0 62.1 66.2A g r ic u ltu re , f o r e s t r y , and f ish in g 67................... 11.0 11.1 5.2 5.5 5.8 5.5 78.3 81.7
A g r ic u ltu ra l p ro d u c tio n j6 /» » .................................. 01-02 12.2 12.4 5.6 6.2 6.5 6.2 78.9 83.2A g r ic u ltu ra l s e r v ic e s ......... ........................................ 07 9.7 10.0 4.8 5.0 4.9 5.0 78.5 81.8F o re s t ry ............................................................................... 08 10.4 10.0 5.0 4.8 5.3 5.1 78.9 78.5F ish in g , h u n tin g , and t r a p p in g * . . ....................... 09 3.7 3.9 2.1 2.1 1.6 1.7 62.4 46.1
M ining........................................................................................ 11.3 11.2 6.4 6.7 4.9 4.5 142.3 149.8M etal mining 7 / ............................................................... 10 9.9 10.0 5.4 5.9 4.5 4.1 113.1 117.2A n th ra c ite mining 7 / .................................................... 11 19.3 18.3 11.3 10.9 7.9 7.4 306.7 266.6Bituminous coa l and l i g n i t e mining ] _ / . ............ 12 9 .8 10.2 7.3 8.2 2.5 1.9 169.6 205.4O il and gas e x t r a c t io n ................................................ 13 13.7 13.4 6.9 6.9 6.8 6.5 153.4 150.6
Crude petroleum and n a tu ra l g a s ................ .. 131 4.4 5.4 2.0 3.2 2.3 2.2 42.3 52.9O il and gas f i e l d s e r v ic e s .................................. 138 20.0 18.7 10.1 9.4 9.8 9.2 228.4 214.7
N onm etallic m in e ra ls , excep t fu e ls J J .............. 14 6.8 6.3 4.1 4.1 2.6 2.1 87.4 80.8C o n s tru c tio n .......................................................................... 15.8 16.0 6.3 6.8 9.4 9.2 108.1 119.2
G eneral b u ild in g c o n t r a c to r s .................................. 15 15.7 16.1 6.2 6.7 9.5 9.4 104.1 110.3R e s id e n tia l b u ild in g c o n s tru c t io n .................. 152 13.2 12.9 5.9 6.0 7.3 6.8 100.0 107.3O perative b u i ld e r s .................................................... 153 15.5 15.5 6.2 6.8 9.3 8.7 76.2 84.1N o n re s id en tia l b u ild in g c o n s tru c tio n ............ 154 18.9 19.5 6.6 7.4 12.3 12.0 114.1 117.1
Heavy c o n s tru c tio n c o n tr a c to r s .............................. 16 16.2 16.3 6.2 6.6 10.0 9.7 105.5 121.8Highway and s t r e e t c o n s tru c t io n ....................... 161 15.0 15.2 5.7 6.2 9.2 9.0 104.7 121.7Heavy c o n s tru c tio n , excep t highw ay................ 162 16.8 16.7 6.4 6.8 10.4 9.9 111.7 80.4
S p ec ia l tra d e c o n tra c to r s ......................................... 17 15.6 15.8 6.5 6.9 9.1 8.9 109.8 123.0Plumbing, h e a tin g , and a i r c o n d i t io n in g .. . 171 16.7 16.8 5.8 6.1 10.9 10.7 92.3 96.7P a in tin g , paperhanging, and d e c o r a t in g . . . . 172 9.3 9.3 4.6 5.1 4.7 4.2 98.2 102.6E le c t r ic a l work........................................................... 173 13.9 13.9 4.7 5.3 9.2 8.6 70.3 91.4Masonry, stonew ork, and p la s t e r in g ................ 174 15.4 16.2 7.3 7.6 8.1 8.6 119.9 131.2C arpen te ring and f lo o r in g ..................................... 175 13.5 13.9 7.2 7.4 6.2 6.5 127.0 143.5Roofing and sh ee t-m e ta l work.............................. 176 22.3 22.1 11.7 12.0 10.6 10.0 211.2 217.4Concrete work.............. ................................................. 177 14.4 13.5 6.6 6.8 7.8 6.7 121.1 121.9Water w ell d r i l l i n g ....................... .......................... 178 12.7 15.0 6.5 8.5 6.2 6.5 126.1 165.0M iscellaneous s p e c ia l tra d e c o n t r a c to r s . . . 179 16.7 17.2 7.1 7.5 9.5 9.6 122.6 151.7
M anufactu ring........................................................................ 12.8 12.8 5.4 5.7 7.4 7.1 82.3 87.3D urable goods......................... .......................... ................. 13.7 13.7 5.8 6.1 7.9 7.6 86.3 92.0
Lumber and wood p ro d u c ts ........................................... 24 22.3 20.4 11.0 10.7 11.3 9.7 177.5 174.1Logging camps and logging c o n t r a c to r s ......... 241 25.6 24.0 15.5 14.7 9.9 9.1 315.5 310.4Sawmills and p lan ing m i l l s .................................. 242 21.5 19.2 11.0 10.3 10.5 8.8 191.4 176.9
Sawmills and p lan ing m il ls , g e n e ra l......... 2421 21.1 18.7 11.0 10.2 10.0 8.5 193.7 179.1Hardwood dim ension and f lo o r in g ................... 2426 20.6 19.9 8.8 9.6 11.8 10.3 149.2 141.4S p ec ia l product saw m ills, n . e . c ................... 2429 42.9 31.9 24.3 18.4 18.6 13.5 366.3 308.0
M illw ork, plywood, and s t r u c tu r a l members. 243 20.2 18.3 9.5 9.4 10.6 8.8 138.0 147.2MLllwork..................................................................... 2431 22.6 20.3 10.1 9.5 12.5 10.8 136.2 135.2Wood k itc h en c a b in e ts ......................................... 2434 17.6 17.3 8.5 8.9 9.1 8.4 113.8 117.1Hardwood veneer and plywood........................... 2435 19.7 17.8 8.8 8.4 10.9 9.4 127.2 141.6Softwood veneer and plywood........................... 2436 15.9 13.9 8.4 8.5 7.5 5.3 159.0 179.6S tu c tu ra l wood members, n . e . c ....................... 2439 30.9 26.5 15.0 15.1 15.9 11.4 170.7 199.1
Wood c o n ta in e r s ........................................................... 244 21.2 21.2 10.9 11.4 ip .3 9.7 161.5 171.1N ailed wood boxes and shook........................... 2441 23.1 19.8 11.3 11.0 11.7 8.8 159.9 183.6Wood p a l l e t s and s k id s ....................................... 2448 21.9 22.3 11.7 12.3 10.2 10.0 171.3 177.7Wood c o n ta in e rs , n . e . c ....................................... 2449 18.4 19.5 8.9 9.8 9.5 9.7 142.7 145.8
Wood b u ild in g s and m obile homes....................... 245 32.4 29.6 14.1 13.8 18.3 15.8 176.4 175.1Mobile homes............................................................. 2451 34.5 31.3 15.1 14.5 19.3 16.8 195.4 188.3P re fa b r ic a te d wood b u i ld in g s ......................... 2452 27.9 25.8 11.8 12.2 16.1 13.6 135.0 145.3
M iscellaneous wood p ro d u c ts ................................ 249 18.2 17.4 8.0 8.0 10.2 9.4 125.4 118.9Wood p re se rv in g ...................................................... 2491 18.4 17.8 8.7 8.2 9.7 9.6 150.8 145.8P a r tic le b o a rd ....................... ................................... 2492 13.2 10.8 6.1 4.6 7.1 6.2 121.4 100.1Wood p ro d u c ts , n . e . c ........................................... 2499 18.8 18.1 8 .0 8.3 10.7 9.7 120.5 115.1
See footnotes at end of table.
16Digitized for FRASER http://fraser.stlouisfed.org/ Federal Reserve Bank of St. Louis

Table 4. Continued— Occupational Injury Incidence rates by Industry, 1978 and 19791
Incidence rates per 100 full-time workers J t /
In d u s try 2 /SICcode2 /
T o ta l cases 5 /
Lostworkday
cases
N onfata l cases
w ithou t lo s t
workdaysLost
workdays
1978 1979 1978 1979 1978 1979 1978 1979
F u rn itu re and f i x t u r e s ................................................ 25 17.2 17.2 6.8 7.0 10.4 10.2 94.3 97.2Household f u r n i tu r e .................................................. 251 16.2 15.6 6.4 6.3 9.8 9.2 90.0 88.1
Wood household f u r n i tu r e .................................. 2511 16.1 15.0 6.1 5.9 10.0 9.1 88.0 84.3U pholstered household f u r n i tu r e ................... 2512 15.2 15.3 6.0 6.1 9.2 9.2 86.5 79.9M etal household f u r n i tu r e ................................ 2514 17.5 16.6 7.1 7.3 10.4 9.3 95.2 102.2M attre sse s and b e d sp r ln g s ................................ 2515 17.9 18.9 8.2 8.6 9.6 10.3 109.7 123.8Wood TV and rad io c a b in e ts .............................. 2517 15.9 12.2 5.8 4 .9 10.1 7.3 81.7 67.1Household f u r n i tu r e , n . e . c .............................. 2519 19.9 18.2 6.7 9.0 13.2 9.2 83.0 103.6
O ffice f u r n i tu r e ......................................................... 252 18.0 22.4 7.5 9.2 10.5 13.2 102.3 134.9Wood o f f ic e f u r n i tu r e .............. .. 2521 18.0 22.0 7.8 8.5 10.2 13.5 97.6 125.8M etal o f f ic e f u r n i tu r e ....................................... 2522 18.0 22.6 7.3 9.5 10.7 13.1 104.8 139.7
P u b lic b u ild in g and r e la te d f u r n i tu r e .......... 253 20.7 20.7 7.7 8.0 13.0 12.7 102.2 128.8P a r t i t io n s and f i x t u r e s ......................................... 254 20.0 19.9 8.0 8.5 12.0 11.4 104.9 104.6
Wood p a r t i t i o n s and f i x t u r e s ......................... 2541 18.9 18.9 7.6 7.9 11.3 10.9 104.4 100.6M etal p a r t i t i o n s and f i x t u r e s ....................... 2542 21.2 21.1 8.5 9.0 12.7 12.1 105.5 108.9
M iscellaneous f u r n i tu r e and f i x t u r e s ............ 259 18.8 17.1 7.0 6.3 11.8 10.8 100.3 86.9Drapery hardw are and b lin d s and sh ad es. . 2591 16.8 15.1 5.9 6.2 10.8 8.9 76.4 86.0F u rn itu re and f ix tu r e s , n . e . c ....................... 2599 21.5 19.8 8.4 6.4 13.1 13.4 132.5 88.2
S tone, c la y , and g la s s p ro d u c ts .............. 32 16.4 16.3 7.6 7.9 8.7 8.4 123.8 130.9F la t g l a s s ...................................................................... 321 17.9 15.2 5.3 5.7 12.6 9.4 94.0 110.0G lass and g la ssw are , p re sse d o r blown.......... 322 14.2 14.4 7.3 7.7 6.9 6.7 130.8 137.4
G lass c o n ta in e r s .................................................... 3221 15.3 15.5 9.0 8.9 6.3 6.6 170.8 169.3P ressed and blown g la s s , n . e . c ..................... 3229 12.7 12.9 5.1 6.2 7.6 6.7 78.0 96.5
P roducts of purchased g la s s ................................ 323 20.1 19.5 7.5 7.0 12.5 12.5 96.4 106.2Cement, h y d ra u lic ....................................................... 324 - 9.9 4.9 5 .0 " 96.1S tr u c tu r a l c lay p ro d u c ts ....................................... 325 18.3 19.9 8.8 9.5 9.4 10.3 130.2 137.0
B rick and s t r u c tu r a l c lay t i l e ............ .. 3251 21.0 22.3 10.3 11.0 10.7 11.2 148.8 146.3Ceramic w all and f lo o r t i l e ..................... 3253 14.0 18.8 5.9 7.2 8.1 11.6 82.6 92.2Clay r e f r a c t o r i e s . . . . ......................................... 3255 14.4 14.8 6.6 7.8 7.7 7.0 113.9 141.1S tr u c tu r a l c lay p ro d u c ts , n . e . c ................... 3259 23.6 24.6 12.9 12.0 10.7 12.6 176.5 169.5
P o tte ry and r e la te d p ro d u c ts .............................. 326 16.0 16.4 7.9 8.4 8.1 8.0 110.7 125.9V itreou s plumbing f i x t u r e s ......................... .. 3261 28.1 26.8 14.5 14.1 13.6 12.7 205.4 179.4V itreou s ch in a food u t e n s i l s ......................... 3262 10.5 14.7 6.6 8.3 3.9 6.4 121.1 144.9Fine earthenw are food u t e n s i l s ..................... 3263 13.6 13.1 7.0 7.1 6.6 6.0 110.5 120.3P o rc e la in e l e c t r i c a l s u p p l i e s . . . . . ............ 3264 14.0 13.6 5.6 5.7 8.4 7.9 73.3 104.4P o tte ry p ro d u c ts , n . e . c . . . . ............................ 3269 11.7 11.8 5.6 6.4 6.0 5.4 69.9 94.8
C oncrete , gypsum, and p la s t e r p r o d u c t s . . . . 327 17.7 17.5 8.3 8.3 9.4 9.2 133.6 138.3Concrete b lock and b r i c k .................................. 3271 19.2 18.2 8.9 8.7 10.2 9.5 146.3 153.2Concrete p ro d u c ts , n . e . c ................................ 3272 23.5 24.1 11.5 11.9 12.0 12.2 163.7 178.3Ready-mixed c o n c r e te . ......................................... 3273 15.5 14.9 7.0 6.8 8.5 8.1 122.0 121.5Lime..................... .......................................................... 3274 13.0 8.9 6.6 5.7 6.3 3.1 131.1 111.6Gypsum p r o d u c t s ................. ................................................ 3275 6.0 7.0 2.1 2.5 3.9 4.5 57.8 60.1
Cut sto ne and s to n e p r o d u c t s . . . ....................... 328 14.1 14.2 6.2 6.5 7.8 7.7 115.2 97.0M iscellaneous n o n m eta llic m in e ra l
p ro d u c ts .................................................... ............. 329 15.9 15.8 7.5 7.9 8.4 7.9 121.0 134.5A brasive p ro d u c ts .................................................. 3291 17.8 20.0 7.6 9.8 10.2 10.2 117.5 162.8A sbestos p ro d u c ts .................................................. 3292 16.6 17.0 8.8 9.3 7.8 7.7 156.1 166.3G askets, pack ing , and s e a lin g d e v ic e s . . . 3293 16.2 15.2 6.6 6.3 9.6 8.8 103.3 87.3M ineral w ool............................................................. 3296 12.9 10.2 6.4 5.9 6.4 4.3 101.6 97.4Nonclay r e f r a c t o r i e s ........................................... 3297 18.3 20.3 9.8 10.8 8.5 9.5 164.9 212.9N onm etallic m in era l p ro d u c ts , n . e . c .......... 3299 10.8 5.5 - 5 .3 79.4
Primary m etal i n d u s t r i e s ........................................... 33 16.5 16.9 7.3 7.9 9.2 8.9 120.5 130.7B la s t fu rnace and b a s ic s t e e l p r o d u c t s . . . . 331 12.6 12.3 4.9 4.9 7.7 7.4 95.1 98.3
B la s t fu rn aces and s t e e l m i l l s .............. .. 3312 10.7 10.4 4.0 3.7 6.7 6.7 85.2 84.8E le c tro m e ta llu rg ic a l p ro d u c ts ....................... 3313 14.6 13.1 6.3 6.6 8.3 6.5 115.7 126.3S te e l w ire and r e la te d p ro d u c ts .................. 3315 19.8 21.3 9.1 10.7 10.7 10.5 147.4 159.8Cold f in is h in g of s t e e l sh ap e s ..................... 3316 26.6 28.0 11.6 13.3 14.9 14.7 177.9 225.5S te e l p ip e and tu b e s ................ .......................... 3317 26.6 22.9 11.0 11.0 15.5 11.9 150.5 155.7
Iro n and s t e e l fo u n d r ie s ...................................... 332 24.3 25.7 11.4 12.8 12.9 12.8 166.7 182.8Gray iro n fo u n d r ie s .............................................. 3321 24.0 24.9 11.3 12.4 12.7 12.5 156.5 168.4M alleab le iro n fo u n d r ie s ................................. 3322 24.8 26.4 10.9 11.3 13.9 15.1 157.2 172.9S te e l Investm ent fo u n d r ie s ....................... .. 3324 - 21.1 - 9.3 - 11.8 - 108.3S te e l fo u n d r ie s , n . e . c ....................................... 3325 26.3 28.3 12.6 15.1 13.6 13.2 212.1 238.2
See footnotes at end of table.
17Digitized for FRASER http://fraser.stlouisfed.org/ Federal Reserve Bank of St. Louis

Table 4. Continued— Occupationallnjury Incidence ratee by Induatry, 1978 and 19791
In d u s try 2 /SICcode
3/
Inc idence r a te s pe r 100 f u l l - t im e w orkers 4 /
T o ta l cases 51
Lostworkday
cases
N onfata l cases
w ithout lo s t
workdaysLost
workdays
1978 1979 1978 1979 1978 1979 1978 1979
Primary nonferrous m e ta ls .................................... 333 12.7 14.8 5.8 8.1 6.8 6.6 108.9 123.4Primary cop per......................................................... 3331 10.0 10.1 4.6 4.9 5.4 5.2 117.6 107.3Primary le a d .................. .......................................... 3332 16.1 22.1 8 .8 11.2 7.3 10.9 129.2 154.0Primary z in c .................. .......................................... 3333 16.7 18.2 9.7 11.3 6.9 6.9 181.4 214.1Primary aluminum.................................................... 3334 12.3 14.4 5.4 8.3 6.9 6.0 98.0 114.5Primary no n ferrous m e ta ls , n . e . c ................ 3339 13.4 16.8 5.7 8.2 7.6 8.6 95.6 119.9Secondary no nferrous m e ta ls ................................ 334 24.8 27.1 12.6 15.8 12.2 11.2 185.5 231.5N onferrous r o l l in g and draw ing......................... 335 15.0 15.2 6 .8 7.5 8.2 7.7 114.2 126.2Copper r o l l in g and draw ing.............................. 3351 18.7 18.1 8.5 9.1 10.2 8.9 144.4 160.7Aluminum sh e e t , p l a t e , and f o i l ................... 3353 11.3 10.4 4.3 4.4 6.9 6 .0 69.0 68.4Aluminum ex truded p ro d u c ts .............................. 3354 17.0 17.7 8.5 8.7 8.5 8.9 150.1 161.4Aluminum r o l l in g and draw ing, n . e . c .......... 3355 10.9 12.6 4.9 6.1 6.0 6.5 85.7 82.0N onferrous r o l l in g and draw ing, n . e . c . . . 3356 14.4 13.9 5.3 6.9 9.1 7.0 91.5 123.0Nonferrous w ire drawing and I n s u la t in g . . 3357 14.8 15.7 7.0 8.0 7.8 7.6 115.0 127.3N onferrous fo u n d r ie s ................................................ 336 22.4 23.0 11.0 11.8 11.4 11.2 155.0 175.4Aluminum fo u n d r ie s ................................................ 3361 22.3 23.1 11.3 12.1 11.0 11.0 145.8 172.4B rass, bronze, and copper fo u n d r ie s .......... 3362 25.2 24.1 11.5 12.0 13.7 12.1 162.4 191.0N onferrous fo u n d r ie s , n . e . c ........................... 3369 20.2 21.7 9.9 10.9 10.3 10.8 169.3 169.3M iscellaneous prim ary m etal p ro d u c ts ............ 339 21.1 21.5 10.4 10.8 10.7 10.7 137.8 148.9M etal h e a t t r e a t i n g ............................................. 3398 23.2 24.1 11.4 12.7 11.8 11.4 144.7 165.2Primary m etal p ro d u c ts , n . e . c ....................... 3399 18.5 18.4 9.2 8.6 9.3 9.8 129.4 129.0
F a b ric a te d m etal p ro d u c ts ......................................... 34 18.8 19.4 7.8 8.5 11.0 10.8 110.0 121.3Metal cans and sh ipp in g c o n ta in e r s ................ 341 18.0 18.4 7.1 7.9 10.9 10.5 111.6 124.4M etal c an s .................................................................. 3411 17.2 17.4 6.9 7.3 10.3 10.1 107.7 116.8M etal b a r r e l s , drums, and p a i l s ................... 3412 22.2 23.3 8.4 10.8 13.8 12.5 130.1 159.9C u tle ry , hand to o ls , and hardw are ................... 342 17.0 16.5 7.0 7.3 10.0 9.2 102.4 109.6C u tle ry ........................................................................ 3421 14.0 14.3 4.8 5.2 9.2 9.1 68.5 65.6Hand and edge to o ls , n . e . c ..................... .. 3423 20.3 18.4 8.1 8.2 12.2 10.2 116.7 125.0Hand saws and saw b la d e s ......................... .. 3425 18.8 16.4 6.9 7.0 11.9 9.4 89.3 98.4Hardware, n . e . c ....................................................... 3429 15.7 15.8 6.7 7.1 9.0 8.6 101.4 109.3Plumbing and h e a tin g , except e l e c t r i c .......... 343 18.7 18.7 7.5 8.0 11.2 10.7 105.9 113.5Metal s a n i ta ry w are.............................................. 3431 21.9 17.4 7.2 7.3 14.7 10.1 96.5 94.6Plumbing f i t t i n g s and b ra s s goods.............. 3432 13.4 15.3 6.2 7.0 7.2 8.3 88.8 113.0H eating equipm ent, excep t e l e c t r i c ............ 3433 22.0 21.9 8.6 9.1 13.4 12.8 122.7 120.2F a b r ic a te d s t r u c tu r a l m etal p ro d u c ts ............ 344 22.2 23.3 9.2 10.3 12.9 13.0 126.8 141.7F a b ric a te d s t r u c tu r a l m e ta l............................ 3441 25.2 26.8 11.9 12.9 13.3 13.9 175.7 186.0M etal do o rs , sa sh , and tr im ............................ 3442 21.9 22.0 8.1 8.4 13.8 13.6 105.5 117.1F a b ric a te d p la te work......................................... 3443 19.5 22.2 8.1 9.9 11.4 12.3 107.0 133.5S hee t-m etal work.................................................... 3444 23.7 23.5 9.2 10.0 14.5 13.5 121.2 130.8A rc h ite c tu ra l m etal work.................................. 3446 21.0 20.0 9.0 9.0 12.0 11.0 122.8 134.6P re fa b r ic a te d m etal b u i ld in g s ....................... 3448 21.0 21.7 8.1 9.4 12.9 12.3 132.1 126.9M iscellaneous m etal w ork.................................. 3449 22.8 24.2 9.6 13.0 13.2 11.1 143.7 183.1Screw machine p ro d u c ts , b o l t s , e t c ................ 345 16.3 17.0 6 .0 6.7 10.3 10.3 79.0 86.4Screw machine p r o d u c ts . .................................... 3451 16.0 16.9 5.4 6.3 10.6 10.6 67.4 81.1B o lts , n u ts , r i v e t s , and w ashers................ 3452 16.5 17.1 6.5 7.0 10.0 10.1 89.8 91.2M etal fo rg in g s and s tam p ings.............................. 346 17.9 18.4 7.6 8.3 10.3 10.0 111.8 124.9Iro n and s t e e l fo rg in g s .................................... 3462 24.3 26.7 11.9 14.1 12.4 12.5 189.2 205.8N onferrous fo rg in g s ............................................. 3463 13.9 16.8 6.9 9.7 6.9 7.0 141.9 158.6Automotive stam pings........................................... 3465 12.7 12.0 5.5 5.2 7.2 6.8 71.7 80.5Crowns and c lo s u re s ............................................. 3466 14.4 12.6 7.1 6.3 7.3 6.3 123.2 83.7M etal stam pings, n . e . c . . . . .............................. 3469 20.4 20.9 7.8 8.6 12.6 12.3 114.3 130.1Metal s e rv ic e s , n . e . c .............................................. 347 17.2 17.6 7.5 8.5 9.6 9.1 102.3 114.3P la tin g and p o l is h in g ......................................... 3471 16.6 17.5 7.4 8.2 , 9.1 9 .3 90.8 107.9Metal coa ting and a l l i e d s e r v i c e s . . . . . . . 3479 18.6 17.9 7.7 9.0 10.9 8.9 130.7 128.0Ordnance and a c c e s s o r ie s , n . e . c ....................... 348 8.4 7.9 3.5 3.7 4.9 4.2 52.8 56.1Small arms a m m u n it io n . . . . . .............................. 3482 4.7 5.5 1 .8 2.8 2.9 2.7 29.4 45.9Ammunition, except fo r sm all
arm s, n . e . c ........................................................... 3483 8.8 7.2 3.4 3.2 5.4 4 .0 54.1 52.0Small arm s................................................................. 3484 8.9 12.2 4.2 5.7 4.7 6.5 63.6 82.8Ordnance and a c c e s s o r ie s , n . e . c ................... 3489 11.7 5.8 4.7 2.9 6.9 2.9 59.6 38.1M iscellaneous f a b r ic a te d m etal p ro d u c ts . . . 349 18.9 20.0 7.9 8.6 10.9 11.4 111.1 120.2S te e l sp rin g s , except w ire .............................. 3493 28.6 25.4 13.5 12.3 15.1 13.1 188.0 194.2Valves and pipe f i t t i n g s .................................. 3494 17.6 19.2 7.2 8.1 10.4 11.0 96.9 110.3Wire s p r in g s ............................................................. 3495 16.1 17.1 6.1 6.1 10.0 11.0 103.7 89.0M iscellaneous f a b r ic a te d w ire p ro d u c ts . . 3496 20.3 20.8 8 .7 9.6 11.5 11.2 120.4 145.0Metal f o i l and l e a f ............................................. 3497 19.8 19.9 8 .0 10.2 11.8 9.6 106.2 116.8F a b ric a te d p ipe and f i t t i n g s ......................... 3498 20.4 21.2 8.7 9.1 11.6 12.1 131.9 120.6F a b ric a te d m etal p ro d u c ts , n . e . c ................ 3499 18.3 20.0 7.8 8.2 10.5 11.8 107.1 109.5
See footnotes at end of table.
18Digitized for FRASER http://fraser.stlouisfed.org/ Federal Reserve Bank of St. Louis

Table 4. Continued— Occupational Injury Incidence rates by Industry, 1978 and 19791
Incidence rates per 100 full-time workers k j
Industry 2 / SICcode1 /
Total cases 5JLostworkdaycases
Nonfatalcaseswithoutlo s tworkdays
Lostworkdays
1978 1979 1978 1979 1978 1979 1978 1979
Machinery, except e l e c t r i c a l ............................... . 35 13.9 14.2 5.2 5.8 8.7 8.4 72.6 80.4Engines and tu rb in es......................... ................. .. 351 11.7 12.4 4.8 5.7 6.9 6.7 79.6 95.3
Turbines and turbine generator s e t s ......... 3511 9 .0 9.1 3.0 4.1 5.9 5 .0 47.3 58.0In tern a l combustion en gin es, n . e .c ............ 3519 13.0 13.8 5.7 6.4 7.3 7.4 96.2 110.1
Farm and garden machinery. . . . . . . ..................... 352 17.8 18.7 6 .7 - 7.6 11.0 11.1 86.5 98.2Farm machinery and equipment......................... 3523 17.2 18.1 6 .6 7.4 10.6 10.7 85.3 94.6Lawn and garden equipment................................ 3524 22.4 22.4 7.5 8.6 14.8 13.7 96.3 122.4
Construction and rela ted machinery................ 353 18.1 18.1 7.6 8.1 10.4 10.0 104.1 110.4Construction machinery....................................... 3531 16.7 16.3 7.3 7.1 9.4 9.2 94.5 101.3Mining machinery.................................................... 3532 21.3 19.7 7.8 8.1 13.5 11.6 115.6 115.8O il f i e ld m ach in ery........................................... 3533 19.3 19.4 8.6 9.4 10.7 10.0 121.6 129.1E levators and moving sta irw ays..................... 3534 13.0 17.2 4.1 6.1 8.9 11.1 58.5 79.3Conveyors and conveying equipment.............. 3535 21.4 21.6 8.6 9.2 12.7 12.4 117.8 114.9H o ists , cran es, and m onorails....................... 3536 17.5 18.7 7 .0 8.4 10.5 10.3 109.6 109.5In d u str ia l trucks and tr a c to r s ..................... 3537 17.7 17.8 7.7 8 .0 10.0 9 .8 101.0 104.5
Metalworking m achinery.......................................... 354 13.7 14.2 4.4 5.0 9 .3 9 .2 64.3 76.4Machine t o o ls , m etal c u ttin g ty p es............ 3541 12.7 14.6 4 .4 5.5 8.3 9.1 67.8 87.8Machine t o o ls , m etal forming typ es............ 3542 16.5 17.7 5.8 7.0 10.6 10.6 78.5 113.1S p ecial d ie s , t o o ls , j i g s , and f ix tu r e s . 3544 14.2 13.7 4 .2 4 .3 10.0 9 .4 62.3 66.1Machine to o l a c c e sso r ie s .................................. 3545 12.6 13.2 4.2 4.6 8.4 8 .6 53.1 61.1Power driven hand t o o l s ..................................... 3546 12.3 12.2 3.7 4.8 8.6 7.3 62.6 72.5R ollin g m ill machinery...................................... 3547 16.3 18.1 5 .4 6.6 10.8 11.5 100.6 142.8Metalworking machinery, n . e .c ....................... 3549 14.7 17.7 4.3 5.9 10.4 11.8 68.0 78.1
S p ecial industry machinery.................................. 355 15.6 15.3 5.4 5.8 10.2 9.5 78.3 80.9Food products machinery..................................... 3551 19.0 16.8 6.4 6.7 12.6 10.1 99.8 98.2T e x t ile machinery.................................................. 3552 11.9 13.3 4 .0 4.9 7.9 8.4 65.4 71.5Woodworking machinery......................................... 3553 17.7 18.2 6.9 7.6 10.8 10.6 83.9 102.2Paper In d u str ies machinery.............................. 3554 17.8 17.7 6 .0 6.9 11.8 10.8 81 .0 103.8P rinting trades machinery................................ 3555 10.9 11.8 3.8 4.1 7.1 7.7 59.3 56.3S p ecial industry machinery, n . e .c .............. 3559 16.9 15.9 5.9 5.9 10.9 10.0 78.5 76.2
General in d u s tr ia l machinery.............................. 356 14.7 15.5 5.4 6 .3 9.3 9.2 75.6 86.7Pumps and pumping equipment............ ............... 3561 15.3 16.8 6.2 7.3 9.1 9 .4 86.1 100.4B a ll and r o l le r b ear in gs.................................. 3562 10.0 10.2 3.5 4.2 6.5 5.9 55.3 61.0Air and gas compressors..................................... 3563 12.6 14.1 4.5 6.1 8.1 8 .0 71.6 92.5Blowers and f a n s . . ................................................ 3564 17.8 17.9 6.6 7 .0 11.2 10.9 87.3 98.4In d u str ia l p a ttern s.............................................. 3565 12.1 11.1 3.4 3.7 8.7 7.4 33.1 45.9Speed changers, d r iv e s , and gea rs.............. 3566 18.9 19.6 6.6 7.5 12.3 12.1 88.5 107.4In d u str ia l furnaces and ovens....................... 3567 18.3 17.7 6.1 6.5 12.2 11.2 84.5 91.4Power transm ission equipment, n . e .c .......... 3568 15.3 15.8 5 .9 6.4 9.3 9.4 87.5 83.0General in d u s tr ia l machinery, n . e .c .......... 3569 14.7 16.8 5.4 6.8 9.3 10.0 73.2 83.0
O ffice and computing machines............................ 357 4.6 5.1 1 .9 2.2 2.7 2 .9 25.4 30.2E lectron ic computing equipment..................... 3573 4.2 4.5 1.8 2.0 2.4 2 .4 22.8 27.5Scales and b a lances, except laboratory*. 3576 10.7 12.3 2.9 3.4 7.8 8 .9 47.2 53.2O ffice machines, n . e .c ....................................... 3579 8.6 9 .0 3.2 3.5 5.4 5 .5 47.1 51.7
R efrigeration and se r v ic e machinery.............. 358 16.5 16.7 6.2 6.7 10.3 10.0 82.9 97 .0Automatic m erchandising m achines................ 3581 24.4 21.4 8.6 9.8 15.8 11.6 94.1 121.9Commercial laundry equipment......................... 3582 22.4 21.2 6.6 6.4 15.8 14.8 88.0 87.9R efrigeration and heating equipm ent.. . . . 3585 15.4 15.5 6 .0 6.4 9.4 9.1 81.3 98.3Measuring and dispensin g pumps..................... 3586 17.8 17.5 6.4 5.5 11.4 12.0 93.3 73.7Service industry machinery, n . e .c .............. 3589 17.4 18.9 6.1 7.3 11.3 11.6 83.2 91.1
M iscellaneous machinery, excepte le c t r ic a l ............................................................. 359 15.5 15.9 5 .8 6.3 9.7 9.6 74.2 78.7Carburetors, p is to n s , r in g s , v a lv e s .......... 3592 10.3 10.4 4.7 5.1 5.6 5.3 66.4 73.0Machinery, except e le c t r i c a l , n . e .c .......... 3599 16.4 16.9 5.9 6 .5 10.4 10.4 75.6 79.8
E le c tr ic and e le c tr o n ic equipment....................... 36 8.1 8.1 3.1 3.2 5.0 4 .8 46.5 47.9E le c tr ic d is tr ib u tin g equipment....................... 361 10.8 11.4 3 .8 4 .5 7.0 6.9 55.7 64.2
Transformers........................................................... .. 3612 12.0 13.2 4.4 5.5 7.6 7.7 63.4 68.6Switchgear and switchboard a p p a r a tu s ... . 3613 9.8 9.9 3.4 3.7 6.4 6 .2 48.7 60.8
E le c tr ic a l in d u str ia l apparatus....................... 362 9.7 9.8 3.7 3.9 6 .0 5 .9 61.4 61.7Motors and gen erators......................................... 3621 10.4 10.4 4.2 4.2 6.2 6.2 71.3 64.5In d u str ia l c o n tr o ls .............................................. 3622 7.9 8.1 2.7 3 .0 5.2 5.1 41.4 50.7Welding apparatus, e l e c t r i c .............. ............. 3623 14.3 15.5 5.2 6.3 9.1 9.2 67.0 77.3Carbon and graphite products....................... 3624 7.4 6.9 3.7 3 .9 3.7 3 .0 77.6 80.3E le c tr ic a l in d u str ia l apparatus, n .e .c * . 3629 7.4 8.4 2.5 3.1 4 .9 5.3 38.2 52.2
Household ap p lian ces................................................ 363 11.8 11.7 4.2 4.1 7.5 7.6 64.9 66.3Household cooking equipment............................ 3631 16.8 15.5 6.7 5 .9 10.1 9.6 108.1 101.3Household refr ig e r a to r s and f r e e z e r s . . . . 3632 8.4 8.5 3.1 2.8 5.3 5.7 40.2 38.1Household laundry equipment............................ 3633 10.9 10.6 2.9 3 .0 8.0 7.6 47.2 41.1E le c tr ic housewares and fa n s ......................... 3634 10.6 11.0 3.6 4 .0 7.0 7.0 51.2 66.7Household vacuum c lea n e rs ................................ 3635 7.9 8.1 3.6 3.5 4.2 4 .6 80.8 82.1Household ap p lian ces, n . e .c ............................ 3639 ~ 22.6 ~ 10.0 “ 12.6 “ 156.5
See footnotes at end of table.
19Digitized for FRASER http://fraser.stlouisfed.org/ Federal Reserve Bank of St. Louis

Table 4. Continued— Occupational Injury Incidence ratee by Induatry, 1978 and 19791
Incidence rates per 100 full-time workers k !
In d u s try 2/SICcode
3/T o ta l
cases 5JLost
workdaycases
N onfata lcases
w ithoutlo s t
workdaysLost
workdays
1978 1979 1978 1979 1978 1979 1978 1979
E le c tlc l ig h t in g and w irin g equipm ent.......... 364 11.2 11.9 4.1 4.6 7.1 7.3 65.7 70.9E le c tr ic lamps......................................................... 3641 6.8 6.1 2.1 2.1 4.7 4.0 35.3 42.5C u rren t-c a rry in g w irin g d e v ic e s .................. 3643 9.3 10.6 3.2 4.0 6.1 6.5 56.5 64.2N on cu rren t-ca rry ing w irin g d e v ic e s ............ 3644 20.6 20.1 8.4 8.1 12.2 12.0 125.9 126.5R e s id e n tia l l ig h t in g f i x t u r e s ....................... 3645 13.4 14.6 5.2 5.0 8.2 9.6 63.3 73.1Commercial l ig h t in g f i x t u r e s ......................... 3646 20.5 17.5 7.6 7.3 12.9 10.1 127.1 99.8V ehicular l ig h t in g equipm ent......................... 3647 6.3 8.2 2.5 3.2 3.8 5.0 46.2 48.9L igh tin g equipm ent, n . e . c ....................... .... 3648 13.0 15.6 5.2 6.0 7.8 9.6 70.2 78.2
Radio and TV re c e iv in g equipm ent..................... 365 8.5 7.9 3.3 3.4 5.2 4.5 49.2 47.9Radio and TV re c e iv in g s e t s ........................... 3651 8.4 8.1 3 .0 3.2 5.3 4.8 47.0 46.2Phonograph r e c o rd s ................................................ 3652 8.8 7.5 4.1 3.8 4.7 3.7 56.8 53.2
Communication equipm ent......................................... 366 4.7 4.5 1.8 2.0 2.8 2.5 30.4 29.9Telephone and te le g ra p h a p p a ra tu s .............. 3661 5.4 4 .9 2.4 2.5 3.0 2.4 47.5 38.8Radio and TV communication eq u ip m en t.* .. 3662 4.3 4.3 1 .6 1.7 2.7 2.5 22.9 25.8
E le c tro n ic components and a c c e s s o r ie s .......... 367 7.0 6.9 2.5 2.7 4.5 4.2 31.7 33.5E lec tro n tu b e s , re c e iv in g t y p e . . . . ............ 3671 3.8 4.4 1.3 1.9 2.5 2.5 23.1 29.9Cathode ray te le v is io n p ic tu re t u b e s . . . . 3672 10.3 11.0 6.2 6.4 4.1 4.6 91.8 93.4E lec tro n tu b e s , t r a n s m it t in g ......................... 3673 6.9 6 .5 2.0 2.4 4.8 4.1 35.1 33.6Semiconductors and r e la te d d e v ic e s ............ 3674 5.5 5.3 2.0 2.2 3.5 3.1 25.7 28.5E le c tro n ic c a p a c i to rs ......................................... 3675 5.5 4.9 1.9 2.1 3.6 2.8 23.2 26.6E le c tro n ic r e s i s t o r s ........................................... 3676 8.0 7.4 2.8 3.0 5.2 4.4 40.5 32.5E le c tro n ic c o l l s and tra n s fo rm e rs .............. 3677 9.1 10.0 2.7 3.1 6.3 6.9 29.7 40.2E le c tro n ic c o n n e c to rs .............. .......................... 3678 8.9 - 2.3 - 6 .6 - 29.0E le c tro n ic components, n . e . c ......................... 3679 8.1 8.0 2.7 2.9 5.4 5.1 33.6 34.5
M iscellaneous e l e c t r i c a l equipment ands u p p l ie s ........................................... ...................... 369 8.8 9 .0 3.8 4.1 5.0 4.8 56.6 65.3
S torage b a t t e r i e s .................................................. 3691 16.5 17.9 9.1 10.0 7.3 7.9 149.1 167.4Primary b a t t e r i e s , dry and w et..................... 3692 5.9 5.9 1.6 1.7 4.3 4.2 25.0 36.7X-ray app ara tus and tu b e s ................................ 3693 5.3 6.3 1 .6 2.1 3.6 4.2 22.4 26.5Engine e l e c t r i c a l equipm ent............................ 3694 7.0 6.8 2.8 3.0 4.2 3.8 40.1 45.8E le c t r ic a l equipment and
s u p p lie s , n . e . c ......................................... .. 3699 13.7 11.2 5.9 4 .8 7.8 6.4 67.9 62.7T ra n sp o r ta tio n equipm ent................ ................... .. 37 11.0 11.1 5.0 5.3 6 .0 5.8 74.7 82.7
Motor v e h ic le s and equipm ent.............................. 371 10.8 11.1 4.9 5.3 5.9 5.8 69.1 76.8Motor v e h ic le s and car b o d ie s ................ .. 3711 7.7 7.7 3.8 3.6 3.9 4.1 47.1 48.4Truck and bus b o d ie s ........................................... 3713 28.6 28.9 11.5 12.5 17.0 16.4 128.7 138.3Motor v e h ic le p a r t s and a c c e s s o r ie s .......... 3714 10.8 11.3 4 .9 5.6 5.9 5.7 77.6 91.1Truck t r a i l e r s ........................................................ 3715 26.0 25.8 11.5 12.4 14.4 13.4 171.8 179.4S e lf-c o n ta in ed m obile homes............................ 3716 ~ 23.9 - 8.5 “ 15.3 - 96.7
A irc r a f t and p a r t s .................................................... 372 6.2 6.8 2.4 2.9 3.8 3.9 36.5 47.2A i r c r a f t ...................................................................... 3721 4.6 5.0 1.8 2.3 2.8 2.7 30.8 42.0A irc r a f t eng ines and eng ine p a r t s .............. 3724 6.8 7.8 3.0 3.5 3.8 4.3 42.2 53.4A irc r a f t equipm ent, n . e . c ................................ 3728 10.6 10.4 3.6 3.8 7.0 6.5 47.0 53.8
Ship and boa t b u ild in g and r e p a i r in g ............ 373 19.8 22.8 10.5 12.0 9.3 10.8 192.5 211.9Ship b u ild in g and r e p a i r in g ............................ 3731 19.2 22.7 10.7 12.4 8.5 10.3 208.3 229.2Boat b u ild in g and r e p a i r i n g . . . ..................... 3732 21.9 22.9 9.7 10.5 12.1 12.4 133.8 153.8
R a ilroad equ ipm en t................................................... 374 19.2 19.4 9.0 10.0 10.2 9.4 142.1 160.0M otorcycles, b ic y c le s , and p a r t s ..................... 375 15.7 15.5 5.6 5.8 10.1 9.6 68.3 66.2Guided m is s i le s , space v e h ic le s , and
p a r t s ........................................................................ 376 4.0 2.9 1.5 1.3 2.5 1.6 22.4 19.1Guided m is s i le s and space v e h ic le s ............ 3761 3.4 2.5 1.3 1.2 2.1 1.3 19.9 18.5Space p ro p u lsio n u n i t s and p a r t s ................ 3764 6.9 4.0 2.4 1.7 4.5 2.3 35.7 23.9Space v e h ic le equipm ent, n . e . c ..................... 3769 4.4 4.7 1.7 1.4 2.8 3.3 23.6 17.1
M iscellaneous t r a n s p o r ta t io n e q u ip m e n t.. . . 379 23.3 18.7 9.5 7.9 1^.8 10.8 101.1 104.1Tanks and tank components................................ 3795 8.9 9.3 4.3 5.6 4.6 3.7 46.0 58.1T ra n sp o r ta tio n equipm ent, n . e . c ................... 3799 19.7 21.6 9.4 9.5 10.3 12.1 117.1 117.7
Instrum en ts and r e la te d p ro d u c ts ......................... 38 6.4 6.8 2.4 2.7 4 .0 4.1 34.0 38.0E ngineering and s c i e n t i f i c in s t r u m e n t s . . . . 381 5.9 5.8 2.0 1 .9 3.9 3.9 26.5 28.5Measuring and c o n tro ll in g d e v ic e s .................. 382 6.9 7.0 2.6 2.8 4.3 4.2 36.8 41.6
Environm ental c o n tro ls ....................................... 3822 9.1 8.7 3.6 3.8 5.5 4.9 60.5 69.5Process c o n tro l in s tru m e n ts ........................... 3823 6.1 6.7 2.4 2.7 3.7 3.9 32.0 36.4F lu id m eters and counting d e v ic e s .............. 3824 11.8 9.7 4.1 4.2 7.7 5.5 53.3 54.6Instrum en ts to measure e l e c t r i c i t y ............ 3825 4.7 5.4 1 .9 2.1 2.8 3.3 24.0 26.8M easuring and c o n tro ll in g
d e v ice s , n . e . c .................................................... 3829 8.3 8.7 2.4 2.8 5.9 5.9 29.4 43.2O p tic a l instru m ents and le n s e s ......................... 383 5.8 6.2 2.3 2.4 3.5 3.8 35.0 30.4
See footnotes at end of table.
20Digitized for FRASER http://fraser.stlouisfed.org/ Federal Reserve Bank of St. Louis

Table 4. Continued— Occupational Injury Incidence rates by Industry, 1978 and 19791
Inc idence r a te s pe r 100 f u l l - t im e w orkers _4/
In d u s try 2JSICcode
3 /T o ta l
cases _5/ Lostworkday
cases
N onfata l cases
w ithout lo s t
workdaysLost
workdays
1978 1979 1978 1979 1978 1979 1978 1979
M edical in s tru m en ts and s u p p l ie s ..................... 384 7.2 8.1 2.7 3.1 4.4 4.9 37.5 44.9S u rg ica l and m edical in s tru m e n ts ................ 3841 6.7 7.0 2.4 2.7 4.2 4.3 36.8 41.9S u rg ica l a p p llan ce s and su p p l l e a ........ 3842 6.8 8.4 2.7 3.3 4.1 5.1 36.1 47.5D ental equipment and s u p p l ie s ....................... 3843 9.9 10.5 3.5 4.0 6.4 6.5 44.9 46.5
Ophthalmic goods........................................................ 385 6.7 6.0 2.4 2.3 4 .3 3.6 34.3 29.6P hotograph ic equipment and s u p p l ie s .............. 386 5.3 6.0 1 .9 2.4 3.4 3.5 30.0 34.3W atches, c lo c k s , and w a tch cases ....................... 387 6.1 6.0 2.1 2.5 4 .0 3.5 31.8 36.4
M iscellaneous m anufacturing i n d u s t r i e s ............ 39 11.3 11.2 4.3 4.5 7.0 6.7 63.0 64.8Jew elry , s ilv e rw a re , and p la te d w are............ 391 5.9 6.1 2.4 2.6 3.5 3.5 40.0 44.1
Jew elry , p re c io u s m e ta l..................................... 3911 4.6 4.4 1.5 1.5 3.1 2.8 23.9 20.6S ilverw are and p la te d w are.............................. 3914 9.9 12.1 5 .0 6.3 4 .9 5.7 86.3 131.5Je w e le rs ' m a te r ia ls and la p id a ry w o rk .. . 3915 6.2 6.0 2.3 2.1 3.8 3.8 46.3 31.1
M usical in s tru m e n ts .................................................. 393 13.4 13.2 4.2 5.2 9.2 8 .0 51.3 79.6Toys and sp o r tin g goods......................................... 394 13.1 12.7 5.0 5.3 8.1 7.4 74.4 73.3
Do 118...................................... ..................................... 3942 8.3 7.2 2.4 2.6 5.9 4.6 28.7 40.5Games, to y s , and c h i ld re n 's v e h i c l e s . . . . 3944 13.7 11.6 5.4 4 .9 8.3 6.7 80.7 74.4S p ortin g and a t h l e t i c goods, n . e . c ............ 3949 13.2 14.3 5.1 6 .0 8.1 8.3 74.8 76.6
Pens, p e n c i ls , o f f i c e and a r t s u p p l i e s . . . . 395 11.6 11.3 4.8 4.8 6.8 6.5 55.5 65.8Pens and m echanical p e n c i l s ........................... 3951 8.9 9.3 3.6 4.1 5.3 5.2 43.3 53.2Lead p e n c ils and a r t goods.............................. 3952 15.3 15.3 6.4 6.8 8.9 8.5 69.5 92.8Marking d e v ic e s ...................................................... 3953 9.2 6.8 3.3 2.5 5.9 4 .3 42.0 29.2Carbon paper and inked r i b b o n s . . . .............. 3955 15.0 16.5 7.5 6.9 7.4 9.5 80.9 107.9
Costume jew elry and n o tio n s ................................ 396 7.8 8.7 3.0 3.2 4.7 5.5 43.6 47.2Costume je w e lry ...................................................... 3961 5.3 6.2 2.2 2.3 3.1 3.9 31.0 35.8A r t i f i c i a l f lo w e rs ................................................ 3962 11.9 9.7 4.4 4.1 7.5 5.6 50.8 48.6B u tto n s .................................. ..................................... 3963 7.6 9.2 2.9 3.8 4.7 5.4 43.7 55.4N eed les , p in s , and f a s t e n e r s ......................... 3964 10.5 12.3 4.1 4.5 6.4 7.8 60.6 63.5
M iscellaneous m an ufac tu res .................................. 399 13.3 12.7 5.0 5.0 8.2 7.7 75.9 70.5Brooms and b r u s h e s . . . ......................................... 3991 13.0 14.4 5.6 6.6 7.4 7.8 91.9 78.0Signs and a d v e r t is in g d is p la y s ..................... 3993 14.3 13.9 5.1 5.2 9.2 8.6 78.4 71.7B u ria l c a s k e ts ......................................................... 3995 16.7 15.4 5.5 5.1 11.2 10.3 63.1 65.9Hard su rfa c e f lo o r c o v e r in g s ......................... 3996 10.4 10.4 5.4 4.9 5.0 5.5 116.3 82.2M anufacturing in d u s t r ie s , n . e . c ................... 3999 12.0 11.1 4.6 4.4 7.4 6.7 63.6 66.1
Nondurable goods............................................................... 11.4 11.5 4.9 5.1 6.5 6.4 76.3 79.9Food and k in dred p r o d u c ts . ................................ .. 20 18.7 19.2 8.6 9.2 10.1 10.0 128.4 136.4
Meat p r o d u c ts . ........................................................... 201 26.4 27.7 12.2 13.2 14.2 14.5 156.9 178.3Meatpacking p la n t s .................................... .. 2011 30.6 34.2 14.8 16.8 15.8 17.4 185.2 220.3Sausages and o th e r p repared m eats............ 2013 24.3 22.6 10.9 11.4 13.4 11.1 153.2 170.0P o u ltry d re ss in g p la n t s ..................................... 2016 21.2 21.4 9.0 9.1 12.2 12.3 115.2 125.0P o u ltry and egg p ro c e ss in g .............................. 2017 21.7 21.2 9.0 9.2 12.7 12.0 111.8 117.1
D airy p ro d u c ts ......................................... .. 202 15.6 15.8 7.2 7.4 8.4 8.4 113.4 114.4Creamery b u t t e r ....................................................... 2021 14.2 15.4 5.6 5.8 8.6 9.6 79.4 85.9Cheese, n a tu ra l and p ro c e sse d ....................... 2022 15.7 14.5 7.8 6.7 7.8 7.8 110.3 110.7Condensed and evapora ted m ilk ....................... 2023 12.9 12.3 6 .0 6.5 6.9 5.8 80.7 91.9Ice cream and fro ze n d e s s e r t s ....................... 2024 15.4 18.1 7.3 8.8 8 .0 9.3 106.6 108.0F lu id m ilk .................................................................. 2026 15.9 16.1 7.2 7.4 8.7 8 .6 119.5 120.0
P reserved f r u i t s and v e g e ta b le s ....................... 203 16.3 16.6 7.7 8.0 8.6 8.5 122.3 120.9Canned s p e c i a l t i e s ........................................... .. 2032 11.3 11.2 5.3 5.9 6.0 5.3 89.3 92.6Canned f r u i t s and v e g e ta b le s ......................... 2033 18.5 18.0 8.3 8.4 10.2 9.6 121.4 120.8Dehydrated f r u i t s , v e g e ta b le s , s o u p s . . . . 2034 16.6 18.0 9.0 9.2 7.6 8.7 135.7 155.7P ic k le s , sa u ces, and sa la d d r e s s i n g s . . . . 2035 15.3 17.1 6 .6 8.1 8.7 9.0 142.5 106.4Frozen f r u i t s and v e g e ta b le s ......................... 2037 18.2 16.3 9.3 8.0 8.9 8.3 146.5 130.8Frozen s p e c i a l t i e s . . . . . ....................... ............. 2038 12.9 15.3 6.3 8.0 6.6 7.3 98.1 119.5
G rain m il l p ro d u c ts ......................................... 204 14.7 15.3 6.8 7.6 7.9 7.7 124.6 127.9F lour and o th e r g ra in m il l p ro d u c ts .......... 2041 15.0 15.9 7.1 8.1 7.9 7.7 125.4 137.8C ereal b re a k fa s t fo o d s ....................... ............... 2043 14.9 14.0 6.9 6.8 8 .0 7.1 175.6 148.3Rice m il l in g ............................................................. 2044 17.5 19.1 9 .0 9.9 8.5 9.2 213.8 153.0Blended and prepared f l o u r . . . . . .................. 2045 12.5 13.9 6.3 7.7 6.2 6.2 93.8 111.1Wet corn m il l in g .................................................... 2046 10.1 10.5 4.0 6.1 6.1 4.4 71.0 91.7Dog, c a t , and o th e r p e t food ......................... 2047 17.0 18.6 8.1 8.9 8.9 9.6 165.1 157.4Prepared fe e d s , n . e . c . ....................................... 2048 14.9 15.4 6.8 7.3 8.1 8.1 107.3 117.4
Bakery p ro d u c ts ........................................................... 205 13.7 14.2 6.3 6.9 7.3 7.3 118.2 127.7Bread, cake, and r e la te d p r o d u c ts . ............ 2051 13.6 14.4 6.3 7.0 7.3 7.4 114.9 127.5Cookies and c ra c k e rs ........................................... 2052 13.8 13.2 6.4 6.4 7.4 6.8 134.0 128.3
See footnotes at end of table.
2 1Digitized for FRASER http://fraser.stlouisfed.org/ Federal Reserve Bank of St. Louis

Table 4. Continued— Occupational Injury Incidence ratee by Induetry, 1978 and 19791
Incidence rates per 100 full-time workers k j
In d u s try 2 /SICcode
3/T o ta l
cases 5 /Lost
workdaycases
N onfata lcases
w ithoutlo s t
workdaysLost
workdays
1978 1979 1978 1979 1978 1979 1978 1979
Sugar and con fection ery p r o d u c t s . .. . . . . . . . 206 14.5 14.3 7.0 7.1 7.5 7.1 102.6 109.9Saw cane sugar......................................................... 2061 25.0 23.5 11.5 10.6 13.5 12.9 133.7 182.9Cane sugar r e f in in g .............................................. 2062 11.7 11.6 6.7 6.8 5 .0 4.8 163.2 129.0Beet sugar................................................................. 2063 21.3 18.6 12.0 12.7 9.2 5.9 121.5 136.9C onfectionery products....................................... 2065 12.9 13.7 5.8 6.4 7.1 7.3 87.3 98.5Chocolate and cocoa products......................... 2066 10.6 10.1 4 .0 4.4 6.6 5.7 60.7 74.1Chewing gum............................................................... 2067 10.6 11.8 5 .6 4.9 5.0 6.9 112.9 97.9Fats and o i l s ......................... ...................................... 207 19.8 19.7 9.0 9.4 10.8 10.3 143.2 156.5Cottonseed o i l m i l l s ........................................... 2074 17.8 19.8 7.9 8.8 9.9 10.9 164.2 223.6Soybean o i l m i l l s .................................................. 2075 16.2 15.7 7.7 8.0 8.5 7.7 125.9 136.6Vegetable o i l m i l l s , n . e .c .............................. 2076 12.8 17.1 4.9 8.9 7.8 8.2 83.6 195.4Animal and marine fa t s and o i l s ................... 2077 26.1 26.4 12.6 14.3 13.5 12.1 177.7 186.5Shortening and cooking o i l s ............................ 2079 17.9 17.7 7.4 6.9 10.5 10.8 114.5 107.4Beverages........................................................................ 208 22.8 23.4 10.0 10.6 12.8 12.8 132.0 145.4Malt b e v e r a g e s . . . . . ............................................. 2082 19.0 17.9 6.6 6.5 12.3 11.4 122.4 119.8Malt............................................................................... 2083 26.8 27.8 16.6 14.0 10.2 13.8 248.8 255.2Wines, brandy, and brandy s p i r i t s .............. 2084 22.4 24.1 11.9 11.9 10.5 12.2 151.4 146.3D is t i l le d liq u o r , except brandy................... 2085 15.8 17 .3 ' 7.5 8.3 8.2 9.0 122.7 149.5Bottled and canned s o ft d rin k s..................... 2086 26.3 27.3 11.8 12.8 14.5 14.5 140.9 161.6Flavoring e x tra c ts and syrups, n . e . c . . . . 2087 7.9 9.7 3.7 4.6 4.2 5.0 52.6 53.4M iscellaneous foods and kindred p rod u cts .. 209 15.6 16.1 7.3 7.7 8.3 8.4 116.3 115.6Canned and cured seafood s................................ 2091 20.6 22.6 9.5 9.8 11.1 12.8 156.3 152.8Fresh or frosen packaged f i s h ................... 2092 18.5 20.3 9.3 10.0 9.2 10.2 140.6 136.8Roasted c o f f e e . . . . ................................................ 2095 - 11.6 - 5.6 - 6 .0 _ 78.1Macaroni and sp a g h e tti..................... ................. 2098 17.2 18.7 9.2 9.6 8.0 9.1 162.7 195.6Food preparations, n . e . c . ................................ 2099 14.3 13.9 6.4 6.6 7.9 7.3 100.9 99.4
Tobacco manufactures.................................................... 21 8.5 9.2 4 .0 4.2 4.5 5.0 57.6 64.5C ig a re tte s ...................................................................... 211 7.6 7.9 4.1 4.1 3.5 3.8 58.7 64.3C igars............................................................... ............... 212 6.7 7.3 2.6 3.0 4.1 4.3 41.3 64.1Chewing and smoking tobacco................................ 213 11.6 12.0 3.2 4.2 8.4 7.8 48.7 57.4Tobacco stemming and redrying............................ 214 13.5 14.2 5.0 5.4 8.4 8.7 68.7 68.6
T e x tile m ill products................................................. 22 10.0 9.6 3.3 3.4 6.7 6.2 60.5 60.7Weaving m il ls , co tto n .............................................. 221 7.6 7.4 1.9 1.9 5.7 5.5 48 .0 47.3Weaving m i l ls , sy n th e t ic s ..................................... 222 7.5 8.8 2.2 2.9 5.3 5.9 44.8 60.3Weaving and fin ish in g m i l ls , wool................... 223 14.4 13.2 6.4 6.4 8 .0 6.7 111.4 109.1Narrow fab r ic m i l l s .................................................. 224 10.7 10.9 4.1 4.7 6.6 6.2 61.8 73.5K nitting m i l l s ............................................................. 225 8.4 7.5 3.0 2 .9 5.4 4.6 45.3 41.4Women's h o siery , except so ck s....................... 2251 4.9 4.1 1.9 1.8 3.0 2 .3 31.5 24.8H osiery, n . e . c . . . . ..................... ............... 2252 5.6 5.1 2.3 2.2 3.3 2.9 34.6 34.5Knit outerwear m i l l s ........................................... 2253 7.4 6.1 2.5 2.1 4.8 4 .0 35.0 29.6Knit underwear m i l l s ........................................... 2254 9.2 8.4 3.5 3.4 5.7 5.0 48.2 37.7C ircular k n it fab r ic m i l l s .............................. 2257 11.9 11.8 4.4 4.5 7.5 7.3 70.1 69.8Warp k nit fab r ic m i l l s ....................................... 2258 12.0 11.3 3.5 4.1 8.4 7.2 60.7 65.2K nitting m il ls , n . e .c ......................................... 2259 13.8 10.9 7.2 5.4 6.6 5.5 63.8 64.0T e x tile f in ish in g , except wool................ .. 226 12.7 12.3 4.8 4 .8 7.9 7.5 90.4 84.5F in ish ing p la n ts , c o tto n .................................. 2261 10.8 10.2 4.3 3.9 6.4 6.3 84.0 76.5Fin ish ing p la n ts , sy n th e t ic s ......................... 2262 13.5 13.3 5.1 5.3 8.4 8 .0 94.8 93.4F in ish ing p la n ts , n . e .c ..................................... 2269 15.2 14.5 5.1 5.7 10.1 8.8 96.3 84.0Floor covering m i l l s ................................................ 227 13.7 12.0 4.2 3.9 9.5 8.1 73.4 63.8Woven carpets and ru gs....................................... 2271 9 .8 11.3 3.4 4.2 6.4 7.1 65.5 55.3Tufted carpets and rugs.................................... 2272 14.5 12.4 4.3 3.9 10.2 8.5 75.2 65.9Yarn and thread m i l l s ............................................. 228 11.5 10.7 3.2 3.2 8.3 7.5 61.2 61.7Yarn m i l ls , except wool..................................... 2281 11.7 11.1 3.0 3.0 8.7 8.1 61.1 57.3Throwing and winding m i l l s ....................... .. 2282 10.8 10.1 3.3 3.5 7.5 6.6 48.4 69.5Wool yarn m i l l s ...................................................... 2283 14.8 10.8 5.4 5.0 9.4 5.7 101.0 97.5Thread m i l l s ............................................................. 2284 7.6 8.7 2.3 2.9 5.3 5.7 44.7 45.1M iscellaneous t e x t i l e goods................ ............... 229 14.6 13.3 6.2 5.8 8.4 7.5 102.6 100.3F elt goods, except woven f e l t s and h a ts . 2291 22.4 17.8 10.5 7.8 11.9 10.0 162.3 127.9Lace goods.................................................................. 2292 10.8 9.4 3.0 3.5 7.8 5.9 54.2 92.0Paddings and upholstery f i l l i n g . . . ............ 2293 18.3 14.9 9.8 8.4 8.4 6.5 174.5 153.1Processed t e x t i l e w aste..................................... 2294 16.1 13.3 6.5 5.7 9.6 7.6 89.7 107.9Coated fa b r ic s , not rubberized..................... 2295 15.5 14.2 6.4 6 .0 9.1 8.2 123.6 99.5Tire cord and fa b r ic ........................................... 2296 6.7 7.4 2.8 3.8 3.8 3.6 67.9 72.9Nonwoven fa b r ic s .................................................... 2297 13.8 13.7 5.3 4.9 8.5 8.8 92.1 92.9Cordage and tw ine.................................................. 2298 14.7 17.0 6.1 6.5 8.6 10.5 86.8 84.5T e x tile goods, n . e .c ........................................... 2299 12.9 12.5 4.9 5.7 8 .0 6.8 62.3 94.9
See footnotes at end of table.
22Digitized for FRASER http://fraser.stlouisfed.org/ Federal Reserve Bank of St. Louis

Table 4. Continued— Occupational Injury Incidence ratea by Induatry, 1978 and 19791
Incidence rates per 100 full-time workers 4/
In d u s try 2 /SICcode2 /
T o ta l cases 5J
Lostworkday
cases
N onfata l cases
w ithout l0 8 t
workdaysLost
workdays
1978 1979 1978 1979 1978 1979 1978 1979
A pparel and o th e r t e x t i l e p ro d u c ts ..................... 23 6.4 6.3 2.1 2.2 4.3 4.1 31.3 33.1Men's and bo ys ' s u i t s and c o a ts ....................... 231 6.3 6.7 2.3 2.6 3.9 4.1 36.6 46.6Men's and bo ys ' f u rn is h in g s ................................ 232 7.5 7.9 2.6 2.8 4.9 5.1 39.1 42.9
Men's and bo ys ' s h i r t s and n ig h tw e a r . . . . 2321 5.7 5.9 2.0 2.0 3.7 3.9 26.8 29.6Men's and bo ys ' underw ear................................ 2322 7.9 7.0 2.7 2.5 5.2 4.5 41.2 39.8Men's and b o ys ' neckw ear.................. ............... 2323 3.3 3.0 .9 .9 2.4 2.1 13.9 13.4Men's and bo ys ' s e p a ra te t r o u s e r s .............. 2327 6.8 8.5 2.5 3.0 4.3 5.5 36.2 48.3Men's and bo ys ' work c lo th in g ....................... 2328 10.0 10.2 3.7 4.0 6.3 6.2 59.0 60.1Men's and bo ys ' c lo th in g , n . e . c ................... 2329 8.0 7.6 2.4 2.4 5.6 5.2 36.6 33.3
Women's and m is se s ' ou te rw ear........................... 233 4.7 4.1 1.3 1.2 3.4 2.8 16.9 18.9Women's and m is se s ' b lo u se s and w a i s t s . . 2331 4.6 3.2 1 .0 .8 3.6 2.4 13.6 11.8Women's and m is se s ' d r e s s e s ........................... 2335 3.3 2.6 .9 .7 2.4 1.9 10.9 12.0Women's and m is se s ' s u i t s and c o a ts .......... 2337 4.5 3.9 1.3 1 .3 3.2 2.6 18.3 24.1Women'8 and m is se s ' ou te rw ear, n . e . c . . . . 2339 6.4 5.9 1.9 1 .8 4.5 4.1 24.2 26.8
Women's and c h i ld re n 's undergarm ents............ 234 6.0 6.4 1.7 1 .7 4.3 4.6 30.0 30.5Women's and c h i ld re n 's u n d e r w e a r . . . . . . . . 2341 6.1 6.3 1.7 1.8 4.4 4.5 30.1 32.4B ra ss ie re s and a l l i e d garm ents..................... 2342 5.4 6.4 1.7 1 .5 3.7 4.9 29.3 23.2
H ats, cap s, and m i l l in e ry ................................ .. 235 7.3 7.5 2.6 2.5 4.6 5.0 31.4 37.1M il l in e ry .................................................................... 2351 4.4 4.4 .9 1.1 3.5 3.3 10.3 32.3Hats and cap s, except m i l l in e r y .................. 2352 - 8 .0 - 2.7 - 5 .3 - 37.9
C h ild re n '8 ou te rw ear................................................ 236 5.1 5.7 1.8 1.8 3.3 3.9 28.6 29.7C h ild re n 's d re sse s and b lo u se s ..................... 2361 4.3 5.4 1.2 1.6 3.1 3.8 20.0 29.3C h ild re n 's c o a ts and s u i t s .............................. 2363 - 5.8 - 1.8 - 4 .0 - 32.5C h ild re n 's ou te rw ear, n . e . c ............................ 2369 5.2 5.9 2.0 2.0 3.2 3.9 31.9 29.4
M iscellaneous ap p are l and a c c e s s o r ie s .......... 238 6.3 6.0 2.1 2.3 4.2 3.7 31.1 28.6F ab ric d re ss and work g lo v e s ......................... 2381 5.2 4.8 2.2 2.3 3.0 2.5 37.2 34.9Robes and d re ss in g gowns.................................. 2384 5.7 5.3 1.5 1.6 4.2 3.7 24.3 19.2W aterproof ou te rg arm en ts .................................. 2385 6.9 5.5 1.9 2.1 5.0 3.4 33.4 31.1A pparel b e l t s ........................................................... 2387 8.1 9.6 2.5 3.2 5.6 6.4 30.7 29.0A pparel and a c c e s s o r ie s , n . e . c ..................... 2389 6.5 5.8 2.4 2.2 4.1 3.5 22.8 21.5
M iscellaneous fa b r ic a te d t e x t i l ep ro d u c ts .................................................................. 239 8.6 8.6 3.2 3.2 5.4 5.4 46.7 44.0
C u rta in s and d r a p e r ie s ....................................... 2391 8.4 8.2 3.2 2.8 5.2 5.3 49.8 39.4House f u rn is h in g s , n . e . c .................................. 2392 9.6 10.2 3.5 3.6 6.1 6.6 45.8 48.0T e x ti le b ag s ............................................................. 2393 11.6 13.3 4.4 5.4 7.2 7.9 88.8 104.4Canvas and r e la te d p ro d u c ts ............................ 2394 10.6 12.0 3.8 4.5 6.8 7.5 58.1 60.0P le a tin g and s t i t c h i n g ....................................... 2395 6.1 5.3 2.5 2.1 3.6 3.1 35.4 27.6Automotive and app are l trim m ings................ 2396 6.3 5.9 2.3 2.3 4.0 3.6 35.4 31.1S c h i f f l i machine e m b ro id e rie s ....................... 2397 6.2 4.3 2.8 1 .9 3.4 2.5 48.8 19.8F a b r ic a te d t e x t i l e p ro d u c ts , n . e . c ............ 2399 9.5 8.2 3.3 3.3 6.2 4.9 46.5 41.1
Paper and a l l i e d p ro d u c ts ......................................... 26 13.3 13.3 5.6 5.9 7.7 7.4 101.5 106.7Pulp m i l l s ...................................................................... 261 10.5 11.1 3.4 4 .4 7.1 6.7 81.5 96.8Paper m i l l s , except b u ild in g p a p e r ................ 262 10.0 10.6 4.5 4.8 5.5 5.8 103.3 106.2Paperboard m i l l s ......................................................... 263 12.0 12.7 4.8 5 .0 7.2 7.7 105.8 102.2M iscellaneous converted paper p r o d u c t s . . . . 264 13.8 13.7 5.7 6.0 8.0 7.7 88.7 95.3
Paper c o a tin g and g la z in g ................................ 2641 10.5 11.1 4.3 4.9 6.2 6.2 66.8 79.3E nvelopes.................................................. ................. 2642 16.6 17.4 6.6 7.7 10 .0 9.6 100.0 111.8Bags, excep t t e x t i l e b ag s................................ 2643 16.0 15.7 6.6 6.4 9.3 9.3 96.9 99.8D ie -cu t paper and b o a r d . . . . .................. .. 2645 13.2 13.5 6.0 6.0 7.2 7.5 89.5 92.1P ressed and molded pulp goods....................... 2646 17.8 17.1 7.4 7.4 10.4 9.7 136.5 132.0S a n ita ry paper p ro d u c ts ......................... .. 2647 10.0 10.2 3.8 4.4 6.2 5.8 81.3 86.3S ta tio n e ry p ro d u c ts .............................................. 2648 15.7 15.8 6.4 8.0 .9 .3 7.8 83.8 110.7Converted paper p ro d u c ts , n . e . c ................... 2649 16.2 14.8 7.1 6.9 9.0 7.9 104.9 104.7
Paperboard c o n ta in e rs and bo xes....................... 265 16.2 15.7 6.7 7.0 9.5 8.7 112.6 120.1F olding paperboard bo xes.................................. 2651 15.4 14.1 6.2 5.9 9.2 8.2 96.8 99.6S et-up paperboard bo xes.................................... 2652 12.8 12.7 5.1 5.2 7.6 7.5 89.2 89.6C orrugated and s o l id f ib e r boxes................ 2653 18.3 17.6 7.7 8.1 10.6 9.5 126.9 138.3S a n ita ry food c o n ta in e r s ..................................F ib er can s, drums, and s im ila r
2654 12.2 12.6 5.4 5.9 6.8 6.7 102.4 94.2p ro d u c ts .................................................................. 2655 15.3 14.9 5.9 6.5 9.4 8.4 98.4 118.6
B u ild ing paper and board m i l l s ......................... 266 13.1 10.7 5.6 5.7 7.5 5.0 104.6 122.1P r in tin g and p u b lish in g .............................................. 27 6.9 7.0 2.9 3.0 4.0 4.0 42.8 44.1
Newspapers...................................................................... 271 5.8 5.9 2.6 2.8 3.2 3.1 43.2 45.7P e r io d ic a ls .................................................................... 272 2.8 2.8 1.1 1.3 1.7 1.4 16.8 18.1
See footnotes at end of table.
23Digitized for FRASER http://fraser.stlouisfed.org/ Federal Reserve Bank of St. Louis

Table 4. Continued— Occupational injury Incidence ratea by Industry, 1978 and 19791
Incidence rates per 100 full-time workers k j
In d u s try 2 /SICcode
3/T ota l
cases J5/Lost
workdaycases
N onfata lcases
w ithou tlo s t
workdaysLost
workdays
1978 1979 1978 1979 1978 1979 1978 1979
B ooks................................................................................ 273 7.0 7.2 2.6 2.8 4.4 4.4 35.2 38.0Book p u b lish in g ...................................................... 2731 4.7 4.9 1.9 1.9 2.8 3.0 23.5 25.1Book p r in t in g ........................................................... 2732 12.1 11.7 4.1 4.6 8.0 7.1 60.6 64.1
M iscellaneous p u b lish in g ...................................... 274 2.6 3.2 1.2 1.4 1.4 1.8 18.5 19.4Commercial p r in t in g .................................................. 275 8.5 8.5 3.5 3.6 5.0 4.9 51.7 50.1
Commercial p r in t in g , l e t t e r p r e s s ................ 2751 7.6 7.9 3.2 3.4 4.3 4.4 49.3 47.9Commercial p r in t in g , l i th o g r a p h ic .............. 2752 9.0 8.7 3.6 3.5 5.4 5.2 51.3 48.6Engraving and p la te p r in t in g ......................... 2753 7.8 7.2 2.7 3.3 5.1 3.9 55.0 44.5Commercial p r in t in g , g ra v u re ......................... 2754 15.5 14.7 8.1 7.8 7.4 6.9 92.9 111.1
M anifold bu s in e ss form s......................................... 276 11.5 12.9 4 .9 5.5 6.6 7.4 57.2 68.3G reeting card p u b lish in g ....................................... 277 6.3 6.3 2.6 2.7 3.7 3.5 31.9 38.3Blankbooks and bookbind ing.................................. 278 10.7 9.8 4.2 4.0 6.5 5.8 57.9 54.1
Blankbooks and lo o se le a f b in d e r s ................ 2782 10.4 9.5 4.2 3.8 6.1 5.7 52.1 50.8Bookbinding and r e la te d w ork......................... 2789 11.3 10.1 4.0 4.3 7.3 5.8 67.0 59.9
P r in tin g tra d e s e r v ic e s ......................................... 279 2.4 3.0 .9 1.1 1.5 1.9 13.8 18.6T y p e se ttin g ...................................... ........................ 2791 1.6 2.1 .6 .9 1 .0 1.2 10.8 19.9Photoengrav ing......................................................... 2793 3.2 3.8 1.2 1.1 1.9 2.6 14.0 16.2E lec tro ty p in g and s te r e o ty p in g ..................... 2794 5.4 5.5 1.5 1.7 3.9 3.8 17.0 18.0L ithog rap h ic platem aking s e r v ic e s .............. 2795 4.2 4.6 1.4 1.7 2.8 2.9 24.9 16.9
Chemicals and a l l i e d p ro d u c ts ................................ 28 7.2 7.2 3.1 3.3 4.1 3.9 48.9 52.9In d u s t r ia l in o rg an ic ch em ica ls......................... 281 5.8 5.5 2.4 2.5 3.3 3.0 48.4 45.4
A lk a lie s and c h lo r in e ......................................... 2812 4.9 4.6 2.3 2.3 2.6 2.3 54.3 43.1Ino rgan ic p igm ents................................................ 2816 9.5 8.9 4.5 3.9 5.0 5.0 81.3 52.3I n d u s t r ia l in o rg an ic chem icals, n . e . c . . . 2819 5.5 4.9 2.1 2.2 3.4 2.7 40.0 42.0
P la s t ic s m a te r ia ls and s y n th e t ic s .................. 282 5.3 5.1 2.2 2.3 3.1 2.8 34.7 39.6P la s t ic s m a te r ia ls and r e s i n s ....................... 2821 7.9 8.3 3.5 4.0 4.4 4.3 51.4 67.7C e llu lo s ic man-made f i b e r s .............................. 2823 - 2.9 - 1.0 - 1 .8 - 25.2Organic f ib e r s , n o n c e l lu lo s ic ....................... 2824 2.4 2.2 .7 .7 1.7 1.5 17.6 14.1
D rugs................................................................................. 283 6.1 6.5 2.8 3.1 3.3 3.4 39.5 44.4B io lo g ic a l p ro d u c ts ............................................. 2831 6.0 7.1 2.9 3.0 3.0 4.1 46.2 47.3M edicinals and b o ta n ic a ls ................................ 2833 6.5 8.0 3.7 3.7 2.8 4.3 57.2 51.7P harm aceu tical p re p a ra t io n s ............................ 2834 6.1 6.3 2.7 3.1 3.4 3.2 36.4 43.1
Soap, c le a n e r s , and t o i l e t goods..................... 284 9.3 9.3 4.3 4.6 4 .9 4.7 64.5 70.2Soap and o th e r d e te rg e n ts ................................ 2841 8.2 8.8 4.4 4.4 3.8 4.4 67.5 76.2P o lish es and s a n i ta t io n goods....................... 2842 12.1 12.1 5.0 5.9 7.1 6.2 72.9 79.9Surface a c t iv e a g e n ts ......................................... 2843 13.4 9.1 5.8 4.7 7.6 4.4 78.2 63.1T o ile t p re p a ra t io n s ............................................. 2844 7.9 8.0 3.7 4.0 4.1 4 .0 56.1 60.7
P a in ts and a l l i e d p ro d u c ts .................................. 285 13.6 12.8 5.9 5.7 7.7 7.1 77.3 79.3I n d u s t r ia l o rgan ic chem ica ls.............................. 286 5.6 5.1 2.3 2.3 3.3 2.8 39.1 44.7
Gum and wood chem ica ls....................................... 2861 8.7 9.6 3.8 4.5 4.9 5.1 62.4 71.1Cyclic crudes and in te rm e d ia te s .................. 2865 8.8 6.9 3.4 3.1 5.4 3.7 60.8 56.2I n d u s t r ia l o rgan ic chem icals, n . e . c .......... 2869 4.4 4.3 1.9 1 .9 2.5 2.4 31.6 39.8
A g r ic u ltu ra l chem ica ls........................................... 287 8.6 9.0 3.3 3.8 5.2 5.2 54.8 59.4N itrogenous f e r t i l i z e r s ................ 2873 7.4 8.8 2.8 3.0 4 .5 5.8 42.3 49.9Phosphate f e r t i l i z e r s ......................................... 2874 8.0 7.6 2.7 3.0 5.3 4.6 60.0 53.3F e r t i l i z e r s , m ixing o n ly .................................. 2875 13.0 12.6 4.6 5.2 8.4 7.4 78.7 83.2A g r ic u ltu ra l chem icals, n . e . c ....................... 2879 7.0 7.8 3.2 3.9 3.8 3.9 46.0 55.2
M iscellaneous chemical p ro d u c ts ....................... 289 11.0 12.0 4.9 5.7 6.1 6.3 71.8 80.5Adhesives and s e a la n t s ...................................... 2891 13.2 15.3 5.6 7.7 7.6 7.6 80.0 82.6E x p lo siv es.................................................................. 2892 5.5 5.2 2.3 2.2 3.1 3.0 51.9 44.2P r in tin g in k ............................................................. 2893 12.8 12.7 5.2 5.7 7*. 5 7.0 70.0 87.7Carbon b la c k ............................................................. 2895 7.2 7.9 4 .3 4.2 2.9 3.7 86.5 88.6Chemical p re p a ra tio n s , n . e . c ......................... 2899 11.8 12.8 5.4 6.0 6.4 6.8 73.9 87.7
Petroleum and coa l p ro d u c ts .................................... 29 7.7 7.5 3.3 3.5 4 .3 3.9 57.2 61.1Petroleum r e f in in g .................................................... 291 5.7 5.3 2.6 2.6 3.1 2.7 45.0 45.1Paving and roo fing m a te r ia l s .............................. 295 14.0 15.4 5.6 6.8 8.4 8.5 104.0 121.8
Paving m ix tures and b lo c k s .............................. 2951 10.8 13.7 3.9 5.7 6.8 8.0 69.5 95.0A sphalt f e l t s and c o a tin g s .............................. 2952 15.9 16.2 6.5 7.4 9.4 8.8 124.3 135.4
M iscellaneous petro leum and coa lp ro d u c ts .................................................................. 299 16.2 14.8 7.0 7.0 9.2 7.7 90.9 109.3
L u b ric a tin g o i l s and g re a s e s ..................... 2992 13.2 14.4 5.8 7.0 7.4 7.4 77.5 113.5Petroleum and coa l p ro d u c ts , n . e . c ............ 2999 27.2 16.8 11.4 7.0 15.7 9.7 140.9 87.0
See footnotes at end of table.
24Digitized for FRASER http://fraser.stlouisfed.org/ Federal Reserve Bank of St. Louis

Table 4. Continued— Occupational Injury Incidence rates by Industry, 1978 and 19791
Inc idence r a te s pe r 100 f u l l - t im e w orkers .4/
In d u s try 2 /SICcode1 /
T o ta l cases _5/
Lostworkday
cases
N onfata lcases
w ithoutlo s t
workdaysLost
workdays
1978 1979 1978 1979 1978 1979 1978 1979
Rubber and m isce llaneou s p la s t i c s p ro d u c ts . . 30 16.6 16.5 7.9 8.0 8.7 8.5 121.7 122.9T ire s and in n e r tu b e s .............................................. 301 15.0 14.6 11.2 10.9 3.7 3.7 196.7 195.6Rubber and p la s t i c s foo tw ear.............................. 302 12.1 12.6 6.2 5.6 5.8 7.0 78.1 102.1Reclaimed ru b b e r......................................................... 303 30.5 29.9 17.4 22.4 13.1 7.5 373.3 510.4Rubber and p la s t i c s hose and b e l t in g ............ 304 13.5 14.4 6.8 7.0 6.7 7.4 115.3 99.6F a b ric a te d rubber p ro d u c ts , n . e . c ................... 306 16.4 16.7 8.0 8.5 8.4 8.2 122.9 136.2M iscellaneous p l a s t i c s p ro d u c ts ....................... 307 17.5 17.2 7.0 7.3 10.5 9 .9 102.0 102.2
L ea the r and le a th e r p ro d u c ts .................................. 31 11.0 10.9 4.5 4.7 6.5 6.2 68.9 70.6L ea ther tann ing and f in i s h in g ............................ 311 21.8 20.2 11.1 11.3 10.6 8.9 194.6 176.1Boot and shoe c u t s to ck and f in d in g s ............ 313 15.5 12.7 5.8 5.3 9.7 7.4 92.2 76.0Footwear, excep t r u b b e r . . . .................................. 314 9.8 10.2 3.9 4.1 5.9 6.1 59.3 63.4
House s l ip p e r s ......................................................... 3142 8.7 9.2 3.9 4.4 4.8 4.8 63.4 64.9Men's foo tw ear, excep t a t h l e t i c . . . . .......... 3143 10.5 11.9 4.3 4.6 6.2 7.3 58.9 71.9Women's foo tw ear, excep t a t h l e t i c .............. 3144 9.1 8.9 3.5 3.8 5.6 5.1 59.1 59.6Footwear, excep t rubb e r, n . e . c ..................... 3149 10.2 10.0 3.7 3.9 6.5 6.1 59.9 52.1
L ea ther g loves and m itte n s .................................. 315 5.4 5.5 2.4 2.5 3.0 3.0 23.2 64.2Luggage............................................................................. 316 10.8 12.1 4.3 5.3 6.5 6.8 48.5 76.9Handbags and p e rso n a l le a th e r goods.............. 317 8.8 7.6 2.8 2.8 6 .0 4.8 37.0 38.6
Women's handbags and p u rs e s ........................... 3171 7.7 7.0 2.0 2.1 5.7 4.9 31.2 26.0P ersona l le a th e r goods, n . e . c ....................... 3172 9.8 8.5 3.6 3.7 6.2 4 .8 42.9 55.5
L ea ther goods, n . e . c ................................................ 319 - 11.5 - 4 .4 - 7.1 - 53.4T ra n sp o r ta tio n and p u b lic u t i l i t i e s ....................... 9 .9 9 .9 5.7 5.8 4.2 4 .0 101.3 106.1
R a ilro ad t r a n s p o r ta t io n T j ....................................... 40 11.7 12.0 7.5 7.9 4.2 4.1 98.5 104.7Local and in te ru rb a n passen ger t r a n s i t ............ 41 8.7 9.2 4.7 5.1 4 .0 4.1 84.2 96.6Trucking and w arehousing........................................... 42 16.1 15.7 9.3 9.4 6.7 6.3 176.0 187.5
T ruck ing, lo c a l and long d is ta n c e ................... 421 16.1 15.6 9.5 9.5 6.6 6.1 180.9 190.9P u b lic w arehousing.................................................... 422 15.2 16.3 7.4 8.0 7.8 8 .3 104.5 138.5Trucking te rm in a l f a c i l i t i e s .............................. 423 17.9 21.7 9.5 12.0 8.3 9.7 176.4 176.1
Water t r a n s p o r ta t io n ......... .......................................... 44 14.1 13.9 7.7 7.8 6.4 6.1 268.9 284.1Water tr a n s p o r ta t io n s e r v ic e s ........................... 446 21.5 20.8 12.1 11.7 9.4 9.0 454.0 465.2
T ra n sp o r ta tio n by a i r .................................................. 45 12.9 13.4 8.1 8.4 4 .8 5.0 93.7 100.3P ip e lin e s , excep t n a tu ra l g a s ................................ 46 4.6 4.4 1.9 1.6 2.7 2.8 29.2 21.8T ra n sp o r ta tio n s e r v ic e s .............................................. 47 5.5 5.9 2.7 3.0 2.7 2.9 41.4 46.7
M iscellaneous t r a n s p o r ta t io n s e r v ic e s ......... 478 17.8 21.7 7.6 10.0 10.1 11.6 119.4 169.2Communication...................................... ............................ 48 2.6 2.8 1.5 1.7 1.1 1.1 28.2 28.7E le c t r ic , g a s , and s a n i ta r y s e r v ic e s ................ 49 8.8 8.6 4.3 4.3 4.5 4.3 76.0 72.6
E le c t r ic s e r v ic e s .................................................. .. 491 - 8.0 - 3.7 - 4.3 - 61.2S a n ita ry s e r v ic e s ....................................................... 495 25.8 23.9 15.0 14.1 10.7 9.7 222.4 209.4
W holesale and r e t a i l t r a d e ........................................... 7.8 7.9 3.1 3.4 4.7 4.5 44.3 48.3W holesale t r a d e ............................................................... 8 .8 8 .7 3.9 4.0 4.9 4.6 56.8 58.2
W holesale tra d e — du rab le goods......................... 50 8.5 8.5 3.5 3.8 5.0 4.7 51.0 51.8W holesale tra d e —nondurable goods................... 51 9.2 8.9 4.4 4.5 4.8 4 .4 65.2 67.8
R e ta il t r a d e ...................................................................... 7.4 7.6 2.8 3.1 4.6 4.5 39.1 44.1B u ild ing m a te r ia ls and garden s u p p l i e s . . . . 52 9.7 9.4 4.1 4.2 5.5 5.2 60.2 60.9
Lumber and o th e r b u ild in g m a te r ia l s .......... 521 - 12.0 - 5.6 - 6 .4 79.8G eneral m erchandise s t o r e s .................................. 53 9.0 9.7 3.7 4.1 5.3 5.5 48.0 55.6Food s to r e s .................................................................... 54 10.6 11.7 4.2 5.1 6.4 6.6 66.5 81.8Automotive d e a le rs and se rv ic e s t a t i o n s . . . 55 7.9 7.8 2.5 2.7 5.4 5.1 38.0 40.8A pparel and accesso ry s t o r e s ....................... .. 56 2.2 2.6 .9 .9 1.3 1.7 14.7 16.1F u rn itu re and home fu rn ish in g s ' s t o r e s ......... 57 5.0 4.7 2.4 2.3 2.6 2.3 37.9 39.3E ating and d rin k in g p la c e s .................................. 58 7.4 7.4 2.5 2.7 4.9 4.7 28.1 31.6M iscellaneous r e t a i l ................................................ 59 3.7 3.7 1.6 1.6 2.1 2.1 23.5 24.9
F inance, in su ran ce , and r e a l e s t a t e ....................... 2 .0 2.1 .8 .9 1.2 1.2 12.1 12.9Banking......................... ....................................................... 60 1.5 1.7 .6 .7 .9 1 .0 6.9 10.0C red it agenc ies o th e r than ban ks......................... 61 1.1 1.2 .4 .5 .7 .7 5.1 5.0S e c u r ity , commodity b ro k e rs , and s e r v i c e s . . . 62 .8 1.0 .3 .4 .5 .6 4.5 3.8Insu rance c a r r i e r s ......................................................... 63 1 .9 2.0 .7 .8 1.2 1.2 11.8 9.7Insu rance a g e n ts , b ro k e rs and s e r v ic e .............. 64 .8 .7 .3 .3 .4 .4 - -Real e s t a t e ........................................................................ 65 4.7 4.6 2.1 2.3 2.5 2.3 32.6 33.8
See footnotes at end of table.
25Digitized for FRASER http://fraser.stlouisfed.org/ Federal Reserve Bank of St. Louis

Table 4. Continued— Occupational Injury Incidence rates by Industry, 1978 and 19791
Inc idence r a t e s per 100 f u l l - t im e w orkers k j
In d u s try 2 /SICcode
3/T o ta l
cases _5/Lost
workdaycases
N onfata lcases
w itho u tl o s t
workdaysLost
workdays
1978 1979 1978 1979 1978 1979 1978 1979
S e rv ic e s ................................................................................... 5.3 5.3 2.3 2.4 3.0 2.9 35.4 37.1H otels and o th e r lodging p la c e s ........................... 70 9.0 8.9 3.5 3.7 5.5 5.2 50.8 51.0P ersona l s e r v ic e s ........................................................... 72 3.4 3.1 1.5 1.4 1.9 1.7 26.0 23.4B usiness s e r v ic e s ........................................................... 73 4.8 4.9 2.2 2.3 2.6 2.6 34.5 34.8Auto r e p a i r , s e r v ic e s , and g a r a g e s . . . . * ......... 75 8.1 7.9 3.4 3.5 4.7 4.4 41.7 56.8M iscellaneous r e p a ir s e r v i c e s . . . . . . . . .............. 76 9.7 9.1 4.4 4.1 5.3 5.0 68.5 70.4
M iscellaneous r e p a ir sh ops................................. 769 12.0 11.6 5.3 5.2 6.7 6.4 79.2 88.8Motion p ic tu r e s ............................................................... 78 4.1 5.1 1.3 1.6 2.8 3.4 25.4 27.1Amusement and r e c r e a t io n s e r v ic e s ....................... 79 8.0 8.1 3.6 3.6 4.4 4.5 44.8 57.7H ealth s e r v ic e s ............................................................... 80 6.6 6.6 3.0 3.1 3.6 3.5 46.9 48.6E duca tional s e r v ic e s .................................................... 82 3.1 3.2 1.2 1.2 1 .9 2.0 19.0 16.6S o cia l s e r v ic e s ............................................................... 83 5.8 5.7 2.5 2.5 3.3 3.2 36.8 39.5Museums, b o ta n ic a l , and zo o lo g ic a l
ga rdens......................... .............................................. 84 7.1 6.4 2.6 2.5 4.4 3.9 34.6 24.3M iscellaneous s e r v ic e s ................................................ 89 1.8 2.0 .7
..8 1.1 1.2 10.0 10.4
.5 Includes fatalities. Because of rounding, the difference between the total and
the sum of the rates for lost workday cases and nonfatal cases without lost workdays does not reflect the fatality rate.
• Excludes farms with fewer than 11 employees.7 Data conforming to the osha definitions for coal and lignite mining (sic 11 and
12) and metal and nonmetal mining (sic 10 and 14), and for railroad transportation (sic 40) were provided by the Mine Safety and Health Administration, U.S. Department of Labor, and by the Federal Railroad Administration, U.S. Department of Transportation.
Note: Dashes indicate data that do not meet publication guidelines. n.e.c. = Not elsewhere classified.
per year).
1 To compare 1978 and 1979 survey data with data published in previous years, a statistical method was developed for generating the estimates to represent the small nonfarm employers in low-risk industries who were not surveyed. The estimating procedure involved averaging the data reported by small employers for the 1975,1976, and 1977 annual surveys.
2 Totals for divisions and 2- and 3-digit sic codes include data for industries not shown separately.
3 Standard Industrial Classification Manual, 1972 Edition, 1977 supplement.4 The incidence rates represent the number of injuries or lost workdays per 100
full-time workers and were calculated as: (N/EH) X 200,000, whereN = number of injuries or lost workdaysEH = total hours worked by all employees during calendar year200,000 = base for 100 full-time equivalent workers (working 40 hours per
Table 5. Occupational Injury Incidence rates by Industry division and employment size, 1978 and 1979
Inc idence r a te s pe r 100 f u l l - t im e w orkers 1 /
In d u s try d iv is io n 1 to emplo
2 /19
yees20 to 49 employees
50 to 99 employees
100 to 249 employees 250 to 499
employees500 to 999 employees
1,000 to 2,499 employees 2,500 employees
o r more
1978 1979 1978 1979 1978 1979 1978 1979 1978 1979 1978 1979 1978 1979 1978 1979
P riv a te s e c to r J3/....................... 4 .0 3.9 9.0 8.8 11.6 11.8 12.8 12.9 12.2 12.2 10.4 10.6 8.6 8.5 6.9 7.1A g r ic u ltu re , f o r e s t r y , and f ish in g _3/. 6.5 6 .0 10.4 9.7 13.5 13.6 14.6 14.9 16.5 15.7 14.0 14.0 21.7 21.4 _ _M ining...................................................................... 7.5 6 .0 12.5 12.5 13.4 14.1 12.8 13.5 12.8 12.2 9.5 10.0 8.4 7.6 .9 4.1C o n stru c tio n ......................................................... 9 .4 9 .3 17.9 18.0 21.3 21.1 21.1 22.2 20.7 18.9 18.3 19.6 17.4 14.5 6.2 10.5M anufactu ring.................................. .................... 8 .5 8.3 14.8 14.5 17.7 17.7 17.8 17.8 15.2 15.4 11.9 12.3 9.0 9.2 6.6 6.6T ra n sp o r ta tio n and pu b lic u t i l i t i e s . . . 6 .4 5.7 10.5 10.6 12.5 13.4 10.2 9.6 10.0 10.2 10.4 10.5 9.2 9.1 9.9 10.1W holesale and r e t a i l t r a d e ......................... 3.2 3.1 8.0 7.5 10.2 10.7 11.8 12.4 11.3 11.9 11.3 11.4 10.9 11.0 10.0 11.7W holesale t r a d e ........................... ................. 4.5 4 .3 9.0 8.9 11.4 11.2 12.6 12.2 11.8 12.7 10.8 11.0 7.1 6.0 1.3 .8R e ta il t r a d e . . * . . ........................................ 2.6 2.7 7.5 6 .8 9.7 10.5 11.3 12.5 11.1 11.6 11.5 11.6 11.6 12.1 10.2 11.8F inance, In su ran ce , and r e a l e s t a t e . . . 1 .3 1.3 1.7 1.6 2.1 2.4 2.6 2.5 2.8 3.0 2.5 2.6 2.3 2.5 2.1 2.3S e rv ic e s ................................................................. 1 .8 1 .8 3.6 3.7 6.0 5.9 7.5 7.7 7.8 7.4 7.6 7.2 7.5 7.2 5.6 5.8
* The incidence rates represent the number of injuries per 100 full-time workers and were calculated as: (N/EH) X 200,000 where
N = number of injuriesEH = total hours worked by all employees during calendar year200,000 = base for 100 full-time equivalent workers (working 40 hours per week, 50 weeks
per year).
2 To compare 1978 and 1979 survey data with data published in previous years, a statistical method was developed for generating the estimates to represent the small nonfarm employers In low-risk industries who were not surveyed. The estimating procedure involved averaging the data reported by small employers for the 1975,1976, and 1977 annual surveys.
3 Excludes farms with fewer than 11 employees.
Note: Dashes indicate data that do not meet publication guidelines.
26Digitized for FRASER http://fraser.stlouisfed.org/ Federal Reserve Bank of St. Louis

Table 6. Occupational Injury Incidence rates for lost workday cases by Industry, 1978 and 19791
Incidence rates per 100 full-time workers _2/
Lost workday i n ju r i e s L ost workdays
In d u s try SIC T o ta l lo s t Cases in v o lv ing Cases involv ing T o ta l lo s t Number of Number of dayscode workday days away days of workdays days away of r e s t r i c t e d
3/ cases from work 4J r e s t r i c t e d work from work work a c t i v i t y 5/a c t i v i t y only
1978 1979 1978 1979 1978 1979 1978 1979 1978 1979 1978 1979
P r iv a te s e c to r b f .............................................. 4 .0 4.2 3.7 3.9 0.3 0.3 62.1 66.2 57.4 61.0 4.7 5.2A g r ic u ltu re , f o r e s t r y , and f is h in g 6 / .............. 5.2 5.5 5.1 5.3 .1 .2 78.3 81.7 74.2 76.9 4.1 4.8
A g r ic u ltu ra l p rod uc tion j> /.............................. 01-02 5.6 6.2 5.5 5.9 .1 .2 78.9 83.2 74.7 78.4 4.2 4.8A g r ic u ltu ra l s e r v ic e s ......................................... 07 4.8 5.0 4.7 4.8 .1 .2 78.5 81.8 74.5 77.0 4.0 4.7F o re s t ry ......................... . .......................................... 08 5.0 4.8 4.7 4.4 .3 .4 78.9 78.5 73.4 71.8 5.5 6.6F ish in g , h u n tin g , and tra p p in g .............. .. 09 2.1 2.1 2.0 2.1 - - 62.4 46.1 59.5 44.1
M ining.................................................................................... 6 .4 6.7 6.0 6.3 .4 .4 142.3 149.8 134.5 143.6 7.8 6.2M etal m ining 7 / ....................................................... 10 5.4 5.9 3.8 3.8 1.6 2.1 113.1 117.2 94.1 95.5 18.9 21.7A n th ra c ite mining 7 / ........................................... 11 11.3 10.9 11.3 10.7 (8) .2 306.7 266.6 297.0 257.1 9.7 9.4Bitum inous coa l and l i g n i t e mining 7 / . . . 12 7.3 8.2 6.8 8 .0 .5 .2 169.6 205.4 159.4 201.1 10.2 4.3O il and gas e x t r a c t io n ....................................... 13 6.9 6.9 6.8 6.7 .1 .2 153.4 150.6 148.4 146.5 5.0 4.1N onm etallic m in e ra ls , excep t f u e ls _7 / • • • 14 4.1 4.1 3.9 3.8 .2 .3 87.4 80.8 81.1 74.0 6.3 6 .8
C o n s tru c tio n ................ i ................................................... 6.3 6 .8 6.2 6.5 .2 .2 108.1 119.2 103.3 113.9 4.8 5.3G eneral b u ild in g c o n tr a c to r s ..................... 15 6.2 6.7 6.1 6.5 .1 .2 104.1 110.3 99.2 105.3 4 .9 4.9Heavy c o n s tru c tio n c o n tr a c to r s ..................... 16 6.2 6.6 6.0 6.3 .2 .2 109.5 121.8 105.5 117.0 4.0 4.8S p ec ia l tra d e c o n tra c to r s .............................. 17 6.5 6.9 6.4 6.7 .1 .2 109.8 123.0 104.7 117.4 5.1 5.6
M anufactu ring .................................................................... 5.4 5.7 4.9 5.1 .5 .6 82.3 87.3 74.2 78.2 8.1 9.1D urable goods.................................................................. 5.8 6.1 5.1 5.4 .6 .7 86.3 92.0 77.1 81.6 9.2 10.4
Lumber and wood p ro d u c ts ....................... .. 24 11.0 10.7 10.7 10.3 .3 .4 177.5 174.1 169.9 166.9 7.6 7.2F u rn itu re and f i x t u r e s ....................................... 25 6.8 7.0 6.4 6.4 .4 .6 94.3 97.2 88.5 89.8 5.8 7.4S tone, c la y , and g la s s p ro d u c ts ................... 32 7.6 7.9 7.2 7.3 .4 .6 123.8 130.9 116.1 121.6 7.6 9.3Prim ary m etal in d u s t r i e s .................................. 33 7.3 7.9 6.2 6.7 1.1 1.2 120.5 130.7 105.1 113.9 15.4 16.8F a b r ic a te d m etal p ro d u c ts ................................ 34 7.8 8.5 7.2 7.9 .6 .6 110.0 121.3 102.1 111.6 7.9 9.7M achinery, excep t e l e c t r i c a l ......................... 35 5.2 5.8 4.7 5.1 .5 .7 72.6 80.4 64.1 70.8 8.5 9.6E le c t r ic and e le c tr o n ic equipm ent.............. 36 3.1 3.2 2.6 2.7 .4 .5 46.5 47.9 39.2 40.0 7.3 7.9T ra n sp o r ta tio n equipm ent.................................. 37 5.0 5.3 4 .0 4.3 1.0 1.0 74.7 82.7 61.0 67.5 13.7 15.2Instrum en ts and r e la te d p ro d u c ts ................ 38 2.4 2.7 2.2 2.4 .2 .3 34.0 38.0 30.0 32.8 4.0 5.2M iscellaneous m anufacturing i n d u s t r i e s . . 39 4.3 4.5 4.1 4.2 .2 .3 63.0 64.8 57.9 59.7 5.1 5.1
Nondurable goods........................................................... 4 .9 5.1 4.5 4.7 .4 .4 76.3 79.9 69.8 73.0 6.4 6.9Food and k indred p ro d u c ts .............. ................. 20 8.6 9.2 8.2 8.7 .4 .5 128.4 136.9 121.3 129.1 7.0 7.8Tobacco m anufac tu res................ .......................... 21 4.0 4.2 2.4 2.7 1.6 1.5 57.6 64.5 39.4 46.6 18.2 17.9T e x ti le m il l p ro d u c ts ......................................... 22 3.3 3.4 3.1 2.9 .2 .4 60.5 60.7 55.4 54.9 5.1 5.8A pparel and o th e r t e x t i l e p ro d u c ts ............ 23 2.1 2.2 2.1 2.1 (8) .1 31.3 33.1 29.8 31.3 1.5 1.8Paper and a l l i e d p ro d u c ts ................................ 26 5.6 5.9 5.1 5.3 .5 .6 101.5 106.7 94.1 98.2 7.4 8.5P r in tin g and p u b lish in g ..................................... 27 2.9 3.0 2.8 2.9 .1 .1 42.8 44.1 40.4 41.5 2.4 2.6Chemicals and a l l i e d p ro d u c ts ....................... 28 3.1 3.3 2.6 2.8 .5 .5 48.9 52.9 40.1 43.4 8.8 9.5Petro leum and coa l p ro d u c ts ............................ 29 3.3 3.5 2.5 2.7 .8 .8 57.2 61.1 45.8 49.3 11.4 11.8Rubber and m isce llaneou s p l a s t i c s
p ro d u c ts .................................................................. 30 7.9 8.0 7.0 7.1 .9 .9 121.7 122.9 107.4 108.5 14.3 14.4L ea the r and le a th e r p ro d u c ts ......................... 31 4.5 4.7 4.4 4.5 .1 .2 68.9 70.6 66.0 67.6 2.9 3.0
T ra n sp o r ta tio n and p u b lic u t i l i t i e s . . . . . . . . . 5 .7 5 .8 5.2 5.3 .4 .5 101.3 106.1 93.1 97.4 8.2 8.7R a ilro ad t r a n s p o r ta t io n T j .............................. 40 7.5 7.9 6.9 7.1 .6 .8 98.5 104.7 92.4 96.6 6.1 8.1L ocal and in te ru rb a n passenger t r a n s i t . . 41 4.7 5.1 4.5 4.8 .2 .3 84.2 96.6 80.8 92.4 3.4 4.2Trucking and w arehousing................................... 42 9.3 9.4 9.3 9.3 (8) .1 176.0 187.5 173.4 184.2 2.5 3.3Water t r a n s p o r ta t io n ............................................ 44 7.7 7.8 7.6 7.7 (8) .1 268.9 284.1 265.2 281.1 3.7 3.0T ra n sp o r ta tio n by a i r ......................................... 45 8.1 8.4 7.6 7.8 .5 .5 93.7 100.3 88.1 95.0 5.6 5.3P ip e l in e s , excep t n a tu ra l g a s ....................... 46 1.9 1.6 1 .8 1.5 (8) .1 29.2 21.8 27.6 20.4 1.6 1.4T ra n sp o r ta tio n s e r v ic e s ..................................... 47 2.7 3.0 2.7 2.9 (8) .1 41.4 46.7 40.8 45.0 .6 1.7Communlcation........................................................... 48 1.5 1.7 1.1 1.1 .4 .5 28.2 28.7 16.0 16.3 12.1 12.4E le c t r ic , g a s , and s a n i ta r y s e r v i c e s . . . . 49 4.3 4.3 3.2 3.2 1.1 1.1 76.0 72.6 57.5 54.7 18.5 17.9
W holesale and r e t a i l t r a d e ....................................... 3.1 3.4 3.0 3.2 .1 .2 44.3 48.3 41.6 45.4 2.7 2.9W holesale t r a d e ........................................................... 3.9 4 .0 3.7 3.9 .2 .1 56.8 58.2 52.8 54.5 4.0 3.7
W holesale tra d e —du rab le goods..................... 50 3.5 3.8 3.4 3.6 .1 .2 51.0 51.8 47.0 47.9 4.0 3.8W holesale tra d e —nondurab le goods. . . . . . . 51 4.4 4.5 4.2 4.3 .1 .2 65.2 67.8 61.0 64.4 4.1 3.4
R e ta il t r a d e ................................................................. 2.8 3.1 2.7 2.9 .1 .1 39.1 44.1 37.0 41.5 2.1 2.6B uild ing m a te ria ls and garden s u p p l i e s . . 52 4.1 4.2 4 .0 4.0 .1 .2 60.2 60.9 56.0 56.3 4.2 4.6G eneral m erchandise s t o r e s .............................. 53 3.7 4.1 3.5 3.9 .2 .2 48.0 55.6 44.7 51.8 3.3 3.8Food s to r e s ............................................................... 54 4.2 5.1 4.1 5.0 (8) .1 66.5 81.8 65.6 79.1 .9 2.7Automotive d e a le rs and se rv ic e s t a t i o n s . 55 2.5 2.7 2.4 2.6 .1 .1 38.0 40.8 35.5 37.7 2.5 3.1A pparel and accesso ry s t o r e s ......................... 56 .9 .9 .9 .9 (8) (8) 14.7 16.1 13.8 15.1 .9 1.0F u rn itu re and home fu rn ish in g s s t o r e s . . . 57 2.4 2.3 2.3 2.2 .1 .1 37.9 39.3 35.2 36.7 2.7 2.6E ating and d rink ing p la c e s .............................. 58 2.5 2.7 2.4 2.5 .1 .2 28.1 31.6 26.5 29.7 1.6 1.9M iscellaneous r e t a i l ........................................... 59 1.6 1.6 1.5 1.5 .1 .1 23.5 24.9 21.1 22.5 2.4 2.4
See footnotes at end of table.
27Digitized for FRASER http://fraser.stlouisfed.org/ Federal Reserve Bank of St. Louis

Table 6. Continued— Occupational injury incidence rates for lost workday cases by Industry, 1978 and 1979’
Inc idence r a te s per 100 f u l l - t im e w orkers I f
Lost workday in ju r i e s L ost workdays
In d u s try SIC T o ta l lo s t Cases in v o lv ing Cases invo lv ing T o ta l lo s t Number of Number of dayscode workday days away days of workdays days away of r e s t r i c t e d
3/ cases from work 4/ r e s t r i c t e d work from work work a c t i v i t y 5/a c t i v i t y only
1978 1979 1978 1979 1978 1979 1978 1979 1978 1979 1978 1979
F inance, in su ran ce , and r e a l e s t a t e ................... 0 .8 0 .9 0.8 0.9 (8) (8) 12.1 12.9 11.3 11.7 0 .8 1.1B ank ing ....................................................................... 60 .6 .7 .6 .7 (8) (8) 6.9 10.0 6.3 8.6 .6 1.4C red it agenc ies o th e r than ban ks................ 61 .4 .5 .4 .4 (8) (8) 5.1 5.0 4.7 4.5 .4 .5S e c u r ity , commodity b ro k e rs , and
s e r v ic e s ................................................................. 62 .3 .4 .3 .4 (8) - 4.5 3.8 4.4 3.6 .1 -
Insu rance c a r r i e r s ................................................ 63 .7 .8 .7 .7 (8) (8) 11.8 9.7 11.1 9.0 .7 .7Insu rance a g e n ts , b rok e rs and s e r v i c e . . . 64 .3 .3 .3 .3 (8) (8) 4.8 - 4.1 - .7 -
Real e s t a t e ............................................................... 65 2.1 2.3 2.1 2.2 (8) .1 32.6 33.8 31.0 31.8 1.6 2.0S e rv ic e s ............................................................................... 2.3 2.4 2.2 2.3 .1 .1 35.4 37.1 33.5 34.9 1.9 2.1
H otels and o th e r lodging p l a c e s . . .............. 70 3.5 3.7 3.4 3.6 .1 .1 50.8 51.0 48.8 48.9 2.0 2.1P ersona l s e r v ic e s .................................................. 72 1.5 1.4 1.4 1.4 (8) (8) 26.0 23.4 25.0 22.4 .9 .9Business s e r v ic e s .................................................. 73 2.2 2.3 2.1 2.2 .1 .1 34.5 34.8 32.5 32.3 1.9 2.4Auto r e p a i r , s e rv ic e s , and g a rag e s ............ 75 3.4 3.5 3.1 3.3 .3 .2 41.7 56.8 37.4 52.1 4.3 4.6M iscellaneous r e p a ir s e r v ic e s ....................... 76 4.4 4.1 4.3 3.9 .1 .2 68.5 70.4 60.6 65.9 7.9 4.5Motion p ic tu r e s ...................................................... 78 1.3 1.6 1.3 1.6 (8) (8) 25.4 27.1 24.5 25.9 .8 1.1Amusement and r e c re a tio n s e r v ic e s .............. 79 3.6 3.6 3.1 3.4 .4 .2 44.8 57.7 41.4 52.8 3.4 4.9H ealth s e r v ic e s ...................................................... 80 3.0 3.1 2.9 3.1 (8) (8) 46.9 48.6 45.4 46.9 1.5 1.6E duca tion al s e r v ic e s ........................................... 82 1.2 1.2 1.2 1.2 (8) (8) 19.0 16.6 18.0 14.9 1 .0 1.7S o cia l s e r v ic e s ...................................................... 83 2.5 2.5 2.5 2.4 (8) .1 36.8 39.5 34.3 36.5 2.5 3.0Museums, b o ta n ic a l and z o o lo g ica lg a rd en s.................................................................... 84 2.6 2.5 2.6 2.4 (8) .1 34.6 24.3 32.5 23.3 2.1 1.0M iscellaneous s e r v ic e s ....................................... 89 .7 .8 .6 .7 (8) (8) 10.0 10.4 8.4 8.8 1.6 1.6
1 To compare 1978 and 1979 survey data with data published in previous years, a statistical method was developed for generating the estimates to represent the small nonfarm employers in low-risk industries who were not surveyed. The estimating procedure involved averaging the data reported by small employers for the 1975, 1976, and 1977 annual surveys.
2 The incidence rates represent the number of lost workday injuries or lost workdays per 100 full-time workers and were calculated as: (N/EH X 200,000, where
N = number of lost workday injuries or lost workdaysEH = total hours worked by all employees during calendar year200,000 = base for 100 full-time equivalent workers (working 40 hours per week, 50
weeks per year).3 S t a n d a r d I n d u s t r i a l C l a s s i f i c a t i o n M a n u a l , 1972 Edition, 1977 supplement.
4 Also includes cases which involved both days away from work and days of restricted work activity.
5 The number of days of restricted work activity includes those resulting from cases involving restricted work activity only and days resulting from cases involving days away from work and days of restricted work activity.
• Excludes farms with fewer than 11 employees.7 Data conforming to osha definitions for coal and lignite mining (SIC 11 and 12) and metal and
nonmetal mining (sic 10 and 14), and for railroad transportation (sic 40) were provided by the Mine Safety and Health Administration, U.S. Department of Labor, and by the Federal Railroad Administration, U.S. Department of Transportation.
8 Incidence rates less than 0.05.NoTE’.Dashes indicate data that do not meet publication guidelines.
28Digitized for FRASER http://fraser.stlouisfed.org/ Federal Reserve Bank of St. Louis

Table 7. Number of occupational Illnesses by Industry division and category of illness, 19791(In thousands)
In d u s try d iv is io n T o ta li l l n e s s e s
Number of i l l n e s s e s by catego ry
Skind ise a se s
ord iso rd e rs
Dustd ise a se s
of the lungs
R e sp ira to ry c o n d itio n s
due toto x ic agen ts
PoisoningD iso rders
due to p h y s ic a l
agen ts
D iso rders a sso c ia te d
w ith repeated trauma
A ll o th e r occupat io n a l
i l ln e s s e s
148.9 67.9 1.7 13.2 5.8 15.1 21.9 23.3A g ric u ltu re , f o r e s t r y , and f is h in g 2 / . 3.3 2.3 (3) .1 .2 .2 .1 .4M ining..................................................................... 1 .5 .5 .3 .1 .1 .2 .1 .2C o n s tru c tio n ........................................................ 8.7 3.5 .2 1.1 .4 1.5 .4 1.5M anufacturing.............................................• • • • 87.3 41.6 .9 7.8 3.2 8.6 18.8 6.3T ra n sp o rta tio n and p u b lic u t i l i t i e s . . . 8.4 3.5 .1 .9 .3 1.2 .9 1.5W holesale and r e t a i l t r a d e ......................... 15.8 6.1 .1 1.3 .8 1.6 .8 5.1
W holesale t r a d e ............................................. 5.5 1.5 .1 .4 .3 .6 .5 2.1R e ta il t r a d e .................................................... 10.3 4.6 (3) .9 .5 1.0 .3 2.9
Finance, in su ra n c e , and r e a l e s t a t e . . . 2.0 .5 (3) .2 .1 .1 .1 1.0S e rv ic e s ................................................................. 21.9 9.8 .1 1.7 .6 1.7 .7 7.3
1 To compare 1979 survey data with data published in previous years, a statistical method was developed for generating the estimates to represent the small nonfarm employers in low-risk industries who were not surveyed. The estimating procedure involved averaging the data reported by small employers for the 1975, 1976, and 1977 annual surveys.
2 Excludes farms with fewer than 11 employees.3 Fewer than 50 cases.
No te : Because of rounding, components may not add to totals.
Table 8. Occupational injury and illness fatalities and employment for employers with 11 or more employees by Industry division, 1978 and 1979
In d u stry d iv is io n
Annual average employment I f
F a ta l i t i e s
1978 1979 1978 1979
Number(thousands)
PercentNumber(thousands)
P ercen t Number Percen t Number P ercen t
P riv a te s e c to r .................. ............... 59,297 100 61,660 100 4,590 100 4,950 100A g r ic u ltu re , f o r e s t r y , and f i s h in g . . 838 1 876 1 95 2 110 2M ining................................................................. 787 1 890 1 345 8 490 10C o n stru c tio n ...................................... ............. 3,028 5 3,138 5 925 20 960 19M anufacturing................................................. 19,759 33 20,325 33 1,170 26 1,100 22T ra n sp o rta tio n and p u b lic u t i l i t i e s . 4,464 8 4,637 8 835 18 915 19W holesale and r e t a i l t r a d e ..................... 14,410 24 14,938 24 655 14 930 19Finance, in su ra n c e , and re a l e s t a t e . 3,711 6 3,905 6 200 4 85 2S e rv ic e s ............................................................ 12,300 21 12,951 21 365 8 360 7
1 Annual average employment for nonagricultural industries is based on the employment and earnings survey conducted by the Bureau of Labor Statistics, in cooperation with State agencies. The employment estimate for the services division is adjusted to exclude the employment for the nonfarm portion of agricultural services and nonclassifiable establishments. The employment estimates have been adjusted based on County Business Patterns to exclude establishm ents with fewer than 11 employees. Annual average employment for the agriculture, forestry, and fishing division is a
composite of data from State unemployment insurance programs and estimates of hired-farm workers engaged in agricultural production provided by the U.S. Department of Agriculture. The agricultural production employment estim ate as originally published by the Department of Agriculture is adjusted to exclude employment on farms with fewer than 11 employees.
Note: Because of rounding, components may not add to totals.
29Digitized for FRASER http://fraser.stlouisfed.org/ Federal Reserve Bank of St. Louis

Table 9. Causes of fatalities resulting from occupational Injury and Illness In 1978 and 19791 In units with 11 or more employees, private sector, by industry division(Percent distribution by industry)
Cause 2/ T ota l3/
A g ricu ltu re , f o re s t ry ,
and f ish in g
Mining— o i l and gas e x tra c tio n
onlyConstruc
tio nManufac
tu r in gTranspor
ta t io n and pu b lie
u t i l i t i e s 4/
Wholes a le and
r e t a i l trad e
Finance, insuran ce , and r e a l
e s ta teS erv ices
T ota l - a l l causes............ 100 100 100 100 100 100 100 100 100O ver-the-road motor v e h ic le s . . 28 27 17 15 18 45 40 52 23H eart a t ta c k s .................................... 10 9 9 10 7 7 15 22 17In d u s tr ia l v e h ic le s or
equipment........................................ 10 22 22 15 12 5 3 4 8F a l l s ..................................................... 10 5 10 26 8 4 5 4 8E le c tro c u tio n s ................................. 8 6 18 11 6 8 3 3 10A irc ra f t c ra sh es .................. ........... 7 9 10 2 4 18 4 6 13Struck by o b je c ts o th er than
v eh ic le s or equipment.............. 5 10 4 6 9 3 2 1 3P lan t machinery o p e r a t io n s . . . . 4 3 1 1 12 (5) 2 0 (5)Gun sh o ts ............................................ 4 0 0 (5) 1 2 19 2 4Caught in , under, o r between
o b je c ts o ther than ve h ic le s or equipment................................. 4 4 0 8 5 1 1 0 1
E xplosions.......................................... 3 0 2 2 5 1 1 4 3F i r e s ..................................................... 2 1 5 1 6 1 1 0 0Gas in h a la t io n ................................. 2 1 1 1 4 1 1 0 2A ll o th e r . .......................................... 4 5 4 2 4 3 4 3 9
1 Because at the industry division level sampling errors are large, it is impossible to 1 2 3 4 Excludes railroads,estimate year-to-year changes precisely. Therefore, the results are for the 2 years rather than * Less than 1 percent,a comparison between them.
2 Cause is defined as the object or event associated with the fatality. Note: Percentages may not add to 100 due to rounding.3 Excludes coal, metal and nonmetal mining, and railroads for which data are not
available.
Table 10. Causes of fatalities resulting from occupational Injury and Illness In 1978 and 19791 In units with 11 or more employees, private sector, by Industry division(Percent distribution by cause)
Cause 2/ T ota l3/ A g ricu ltu re , f o re s t ry , and f ish in g
M in in g - o i l and gas e x tra c tio n only
Constructio n Manufactu r in gTranspor
ta t io n and pub licu t i l i t i e s k j
Wholesa le and r e t a i l
trad e
Finance, insuran ce , and r e a l
e s ta teS erv ices
O ver-the-road motor v e h ic le s . . 100 2 3 11 17 30 25 5 6H eart a t ta c k s ................................... 100 2 4 19 17 13 27 6 12In d u s tr ia l veh ic le s or
equipment........................................ 100 5 10 31 34 9 5 1 6F a l l s ..................................................... 100 1 5 51 22 7 9 1 5E le c tro c u tio n s ................................. 100 2 11 30 21 20 6 1 10A irc ra f t c ra sh es ............................. 100 3 6 5 14 48 9 3 13Struck by o b je c ts o th er than
v e h ic le s or equipment.............. 100 4 3 24 47 12 6 1 4P la n t machinery o p e ra tio n s . . . . 100 2 2 6 82 2 8 0 1Gun sh o ts ............................................ 100 0 0 1 7 7 78 1 7Caught in , under, o r between
o b je c ts o th er than v e h ic le s o r equipment................................. 100 3 0 48 40 5 4 0 2
E xplosions.......................................... 100 0 3 16 50 8 8 5 9F i r e s ..................................................... 100 1 8 11 61 10 10 0 0Gas in h a la t io n ................................. 100 2 2 13 61 9 11 0 6A ll o th e r ............................................ 100 3 6 12 26 17 17 2 17
1 Because at the industry division level sampling errors are large, it is impossible to 4 Excludes railroads, estimate year-to-year changes precisely. Therefore, the results are for the 2 years rather thana comparison between them. Note: Percentages may not add to 100 due to rounding.
2 Cause is defined as the object or event associated with the fatality.3 Excludes coal, metal and nonmetal mining, and railroads for which data are not
available.
30Digitized for FRASER http://fraser.stlouisfed.org/ Federal Reserve Bank of St. Louis

Appendix A. Scope of Survey and Technical Notes
Scope of surveyThe occupational injury and illness data reported
through the annual survey were based on records which employers maintain under the Occupational Safety and Health Act in the following industries: Agriculture, forestry, and fishing, SIC 01-09; oil and gas extraction, SIC 13; construction, SIC 15-17; manufacturing, SIC 20-39; transportation and public utilities, SIC 41-42 and 44-49; wholesale and retail trade, SIC 50-59; finance, insurance, and real estate, SIC 60-67; and services, SIC 70-87 and 89. Excluded from the survey were self- employed individuals; farmers with fewer than 11 employees; employers regulated by other Federal safety and health laws; and Federal, State, and local government agencies.
Although the 1979 annual survey covered employers in virtually all private sector industries, employers with fewer than 11 employees in low-risk industries were not required to participate. This was in response to the proposal of the Office of Management and Budget and the Commission on Federal Paperwork to reduce the paperwork burden required of employers. To maintain comparability with earlier data, a statistical method was used to represent the previous experience of low-risk industries in the private sector.
Data conforming to definitions of recordable occupational injuries and illnesses for coal, metal, and nonmetal mining, and railroad transportation were provided by the Mine Safety and Health Administration, U.S. Department of Labor, and the Federal Railroad Administration, U.S. Department of Transportation. In a separate reporting system, agencies of the Federal Government are filing reports on occupational injuries and illnesses with the Secretary of Labor comparable with those of private industry. At this time, State and local government agencies are not represented in the national sample.
Of the 285,000 sample units selected to participate in the 1979 survey, approximately 264,000 or 93 percent responded. The 1979 estimates were based on reports from about 96,000 establishments in manufacturing and 168,000 in nonmanufacturing industries.Sample design
The sample was selected to represent virtually all private industries. Because the survey is a Federal-State
cooperative program and the data had to meet the needs of those State agencies which generated statewide data, the universe fram e was s tra tif ied by State/industry/employment-size before sample selection. Optimum allocation was achieved by distributing the sample to each size group proportionate to the total employment and the variation among size groups. The sampling ratios for various employment-size groups ranged from all units above a certain size class selected with certainty through declining proportions in each smaller employment-size group. The certainty strata were usually greater than 100 employees, although these may have ranged downward in employment size depending upon total employment in the industry. The ratios determined for each industry/employment-size group were used to select a sample within a State/in- dustry/employment-size estimating cell.Estimating procedures
Weighting. The inverse of the sampling ratios determined the weight for the size class from which the unit was selected. By this procedure, sample units represented all units in their size class for a particular industry. State and national weights often differed since each sample unit might represent a different proportion of the universe. The unit weight for each State was used to produce estimates; the national weight was used for remaining States. Weights of responding units were adjusted in each sampling cell to account for nonresponse in that cell. Units were then shifted into the estimating cell determined by industry classification and reported employment. Each unit carried into the estimating cell the weight of its sampling cell, which was adjusted for nonresponse. Data for each unit were multiplied by the appropriate nonresponse-adjusted weight. The products were then aggregated to obtain totals for the estimating cell.Benchmarking. Data were further adjusted to reflect the actual employment in an industry during the survey year. Since the universe file which provided the sample frame was not current to the reference year of the survey, data were benchmarked to reflect current employment levels.
The benchmarking procedure related the employment31Digitized for FRASER
http://fraser.stlouisfed.org/ Federal Reserve Bank of St. Louis

estimate in sampling to the actual employment for the reference year of the survey. The ratio of the actual employment to the weighted employment estimate is called the benchmark factor. The aggregated weighted nonresponse-adjusted characteristics of the estimating cell were multiplied by the benchmark factor so that the cell became more representative of the universe during the survey reference year.Estimates for small nonfarm employers. Data were collected for nonfarm employers with fewer than 11 employees in high-risk industry groups. Data were notcollected for small nonfarm (low-risk) groups:
SIC 41SIC 44 (except 446)SIC 45-46SIC 47 (except 478)SIC 48SIC 50-51
employers in the following
SIC 53 SIC 55-59 SIC 60-67 SIC 70-73 SIC 78 and 79 SIC 80-87 and 89
The injury and illness data of low-risk industries were estimated from the experience of these industries in 1975, 1976, and 1977.Federal-State cooperation
To eliminate duplicate reporting and to ensure maximum comparability, respondents completed a single reporting form for both national and State estimates.Rounding of published estimates
The original tabulations estimated fatalities and non- fatal injuries and illnesses rounded to the nearest whole unit. Percents were computed after rounding.
Industrial classificationReporting units were classified into industries by their
principal product or activity. The data were tabulated according to the 1972 edition of the Standard Industrial Classification Manual, 1977 SupplementPublication guidelines
The bls tabulating system generates occupational injury and illness estimates for approximately 625 SIC industry levels. This report, however, excludes estimates for several 2-, 3-, and 4-digit SIC levels if one of the following situations occurred:
1. Estimates for the industry level were based on reports from fewer than three companies. Moreover, if three or more companies reported data for the industry, one firm could employ not more than 50 percent of the workers or two companies combined could employ not more than 75 percent.
2. 1979 annual average employment for the industry was less than 10,000. However, industries with annual average employment of less than 10,000 were published if the majority of the employment for an industry was reported in the survey.
3. Relative standard error for lost workday cases at 1 standard deviation was more than 15 percent for the industry level in manufacturing and 20 percent in nonmanufacturing.
4. Benchmark factor for the industry level was less than 0.90 or greater than 1.49.
Data for an unpublished industry were included in the total for the broader industry level of which it is a part. In addition to deleting industries, selected items of data were suppressed for publishable industries when the relative standard error for the estimate equaled or exceeded 60 percent.
it US. GOVERNMENT HUNTING OFFICE : 1981 0 -3 4 1 -2 7 0 (4909)
32Digitized for FRASER http://fraser.stlouisfed.org/ Federal Reserve Bank of St. Louis

Bureau of Labor Statistics Regional Offices
Region I1603 JFK Federal Building Government Center Boston, Mass. 02203 Phone: (617) 223-6761
Region IISuite 3400 1515 Broadway New York, N.Y. 10036 Phone: (212) 944-3121
Region III3535 Market Street P.O. Box 13309 Philadelphia, Pa. 19101 Phone: (215) 596-1154
Region IV1371 Peachtree Street, N.E. Atlanta, Ga. 30367 Phone: (404) 881-4418
Region V9th FloorFederal Office Building 230 S. Dearborn Street Chicago, III. 60604 Phone: (312) 353-1880
Region VISecond Floor555 Griffin Square Building Dallas, Tex. 75202 Phone: (214) 767-6971
Regions VII and VIII911 Walnut Street Kansas City, Mo. 64106 Phone: (816) 374-2481
Regions IX and X450 Golden Gate Avenue Box 36017San Francisco, Calif. 94102 Phone: (415) 556-4678
Digitized for FRASER http://fraser.stlouisfed.org/ Federal Reserve Bank of St. Louis


