Black Box Design Report - UMD ISRaustin/enes489p/projects2010b/BlackBox-Final... · Manufacturers:...
50
Black Box System Design Ahmad Asi, Benjimin Chang, Mehdi Dadfarnia, Serge Kamta, and Ifzalul Khan December 14, 2010
Transcript of Black Box Design Report - UMD ISRaustin/enes489p/projects2010b/BlackBox-Final... · Manufacturers:...
Black Box System Design
Ahmad Asi, Benjimin Chang, Mehdi Dadfarnia, Serge Kamta, and Ifzalul Khan
December 14, 2010
Abstract
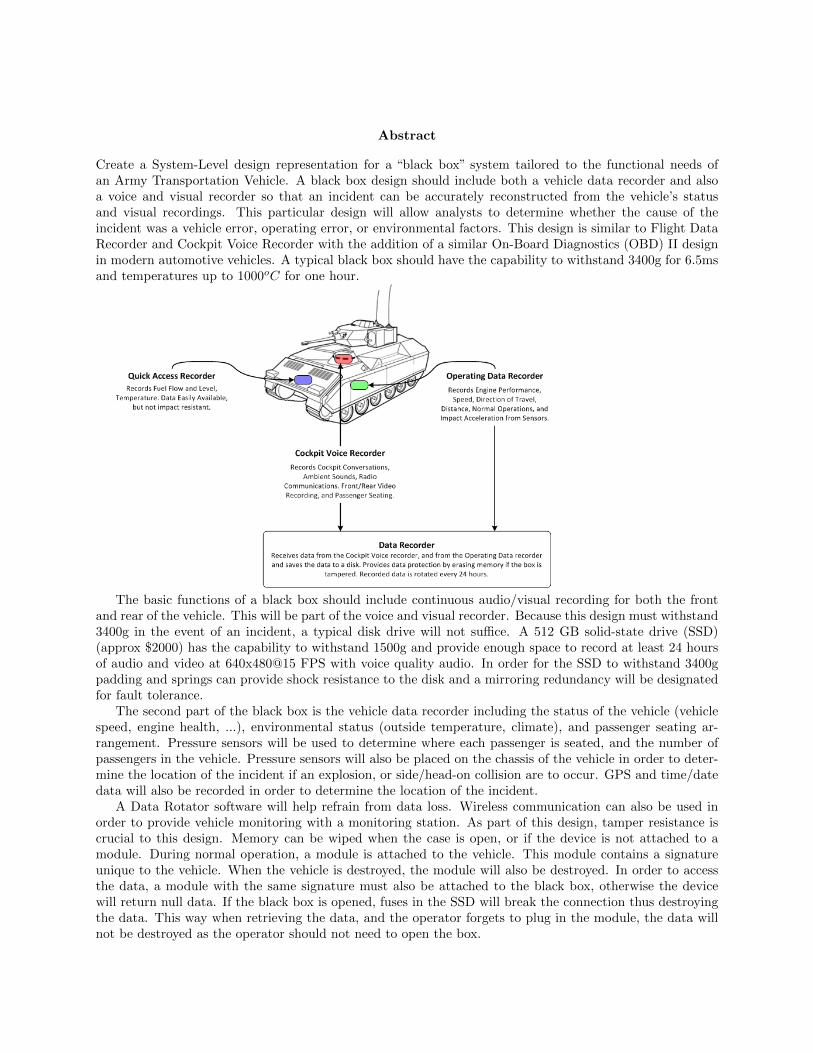
Create a System-Level design representation for a “black box” system tailored to the functional needs ofan Army Transportation Vehicle. A black box design should include both a vehicle data recorder and alsoa voice and visual recorder so that an incident can be accurately reconstructed from the vehicle’s statusand visual recordings. This particular design will allow analysts to determine whether the cause of theincident was a vehicle error, operating error, or environmental factors. This design is similar to Flight DataRecorder and Cockpit Voice Recorder with the addition of a similar On-Board Diagnostics (OBD) II designin modern automotive vehicles. A typical black box should have the capability to withstand 3400g for 6.5msand temperatures up to 1000oC for one hour.
The basic functions of a black box should include continuous audio/visual recording for both the frontand rear of the vehicle. This will be part of the voice and visual recorder. Because this design must withstand3400g in the event of an incident, a typical disk drive will not suffice. A 512 GB solid-state drive (SSD)(approx $2000) has the capability to withstand 1500g and provide enough space to record at least 24 hoursof audio and video at 640x480@15 FPS with voice quality audio. In order for the SSD to withstand 3400gpadding and springs can provide shock resistance to the disk and a mirroring redundancy will be designatedfor fault tolerance.
The second part of the black box is the vehicle data recorder including the status of the vehicle (vehiclespeed, engine health, ...), environmental status (outside temperature, climate), and passenger seating ar-rangement. Pressure sensors will be used to determine where each passenger is seated, and the number ofpassengers in the vehicle. Pressure sensors will also be placed on the chassis of the vehicle in order to deter-mine the location of the incident if an explosion, or side/head-on collision are to occur. GPS and time/datedata will also be recorded in order to determine the location of the incident.
A Data Rotator software will help refrain from data loss. Wireless communication can also be used inorder to provide vehicle monitoring with a monitoring station. As part of this design, tamper resistance iscrucial to this design. Memory can be wiped when the case is open, or if the device is not attached to amodule. During normal operation, a module is attached to the vehicle. This module contains a signatureunique to the vehicle. When the vehicle is destroyed, the module will also be destroyed. In order to accessthe data, a module with the same signature must also be attached to the black box, otherwise the devicewill return null data. If the black box is opened, fuses in the SSD will break the connection thus destroyingthe data. This way when retrieving the data, and the operator forgets to plug in the module, the data willnot be destroyed as the operator should not need to open the box.
Contents
1 Problem Statement 31.1 Why is the black box needed? . . . . . . . . . . . . . . . . . . . . . . . . . . . . . . . . . . . . 31.2 Who will use it? . . . . . . . . . . . . . . . . . . . . . . . . . . . . . . . . . . . . . . . . . . . 31.3 Where will they use it? . . . . . . . . . . . . . . . . . . . . . . . . . . . . . . . . . . . . . . . 31.4 Who are the project stakeholders and what are their concerns? . . . . . . . . . . . . . . . . . 31.5 If successful, what are the potential benefits of this project? . . . . . . . . . . . . . . . . . . . 41.6 What factors are likely to drive the economics of development? . . . . . . . . . . . . . . . . . 4
2 Use Case Development 52.1 Project Stakeholders . . . . . . . . . . . . . . . . . . . . . . . . . . . . . . . . . . . . . . . . . 52.2 Actors . . . . . . . . . . . . . . . . . . . . . . . . . . . . . . . . . . . . . . . . . . . . . . . . . 52.3 Use Case 1: Installation and Testing . . . . . . . . . . . . . . . . . . . . . . . . . . . . . . . . 62.4 Use Case 2: Normal Operation (Recording and Interpreting Data) . . . . . . . . . . . . . . . 72.5 Use Case 3: Retrieving Data . . . . . . . . . . . . . . . . . . . . . . . . . . . . . . . . . . . . 82.6 Use Case 4: Accident/Abnormal Operations . . . . . . . . . . . . . . . . . . . . . . . . . . . . 92.7 Use Case 5: Maintenance (Black Box System Maintenance and Physical Data) . . . . . . . . 102.8 Black Box System Outline . . . . . . . . . . . . . . . . . . . . . . . . . . . . . . . . . . . . . . 102.9 System Boundary . . . . . . . . . . . . . . . . . . . . . . . . . . . . . . . . . . . . . . . . . . . 122.10 Relationship Between Each Actor and Use Cases . . . . . . . . . . . . . . . . . . . . . . . . . 122.11 Dependencies Among the System Functionalities . . . . . . . . . . . . . . . . . . . . . . . . . 14
3 Textual Scenarios 153.1 Use Case 1: Installation and Testing . . . . . . . . . . . . . . . . . . . . . . . . . . . . . . . . 153.2 Use Case 2: Normal Operation (Recording and Interpreting Data) . . . . . . . . . . . . . . . 173.3 Use Case 3: Retrieving Data . . . . . . . . . . . . . . . . . . . . . . . . . . . . . . . . . . . . 203.4 Use Case 4: Accident/Abnormal Operations . . . . . . . . . . . . . . . . . . . . . . . . . . . . 203.5 Use Case 5: Maintenance . . . . . . . . . . . . . . . . . . . . . . . . . . . . . . . . . . . . . . 21
4 Simplified Models of System Behavior 234.1 Use Case 1: Installation and Testing . . . . . . . . . . . . . . . . . . . . . . . . . . . . . . . . 234.2 Use Case 2: Normal Operation (Recording and Interpreting Data) . . . . . . . . . . . . . . . 234.3 Use Case 3: Retrieving Data . . . . . . . . . . . . . . . . . . . . . . . . . . . . . . . . . . . . 234.4 Use Case 5: Maintenance (Black Box System Maintenance and Physical Data) . . . . . . . . 31
5 Requirements Engineering 335.1 Traceability . . . . . . . . . . . . . . . . . . . . . . . . . . . . . . . . . . . . . . . . . . . . . . 355.2 Effectiveness Analysis: A Brief Description . . . . . . . . . . . . . . . . . . . . . . . . . . . . 355.3 Library . . . . . . . . . . . . . . . . . . . . . . . . . . . . . . . . . . . . . . . . . . . . . . . . 36
6 System-Level Design 376.1 System Structure . . . . . . . . . . . . . . . . . . . . . . . . . . . . . . . . . . . . . . . . . . . 37
1

7 Simplified Approach to Tradeoff Analysis 397.1 Total System Cost . . . . . . . . . . . . . . . . . . . . . . . . . . . . . . . . . . . . . . . . . . 397.2 Formula for System Cost . . . . . . . . . . . . . . . . . . . . . . . . . . . . . . . . . . . . . . 407.3 System Performance . . . . . . . . . . . . . . . . . . . . . . . . . . . . . . . . . . . . . . . . 407.4 Constraints . . . . . . . . . . . . . . . . . . . . . . . . . . . . . . . . . . . . . . . . . . . . . . 407.5 Minimize . . . . . . . . . . . . . . . . . . . . . . . . . . . . . . . . . . . . . . . . . . . . . . . 407.6 Subject To: . . . . . . . . . . . . . . . . . . . . . . . . . . . . . . . . . . . . . . . . . . . . . . 407.7 Bounds . . . . . . . . . . . . . . . . . . . . . . . . . . . . . . . . . . . . . . . . . . . . . . . . 417.8 Value Constraints . . . . . . . . . . . . . . . . . . . . . . . . . . . . . . . . . . . . . . . . . . . 417.9 Trade-Off Analysis . . . . . . . . . . . . . . . . . . . . . . . . . . . . . . . . . . . . . . . . . . 417.10 Summary . . . . . . . . . . . . . . . . . . . . . . . . . . . . . . . . . . . . . . . . . . . . . . . 43
8 System-Component Testing (Validation/Verification) 44
9 Appendix 469.1 Key Terms and Definitions . . . . . . . . . . . . . . . . . . . . . . . . . . . . . . . . . . . . . 46
2
Chapter 1
Problem Statement
1.1 Why is the black box needed?
The Black Box will give us feedback about health of vehicle and crashes/accidents and allow for accessibilityto data involving the vehicle’s mechanical and electrical status. The Black Box will give us instant feedbackfor any physical anomalies, and will also give the command center access to the data on the Black Box.Because the Black Box is designed to withstand a large impact, it will also secure the data in the Black Box.
1.2 Who will use it?
The Black Box will be used by Field Technician Soldiers, and Command Center mechanic to diagnose andrepair any issues that may arise while out on the field or at home base. If an accident were to occur, a DataAnalyst can use the Black Box to determine the cause of the accident, and provide ways to prevent a futureaccident.
1.3 Where will they use it?
Field technicians and passengers in the vehicle can use the Black Box on the field to determine vehicle status.At the Command Center, mechanics and analysts will use the Black Box to identify any anomalies with thevehicle, record normal operation data, and to determine the causes of accidents if any should occur.
1.4 Who are the project stakeholders and what are their con-cerns?
• ENES489P Black-Box Team and Advisors: Improvement of vehicles, functional integration of asingle model of the Black Box into multiple vehicle classes
• Military Logistics Agency
• Soldier: Field Technician Soldiers, Command Center Mechanics
• Budget: Finances for research and development, manufacturing, and usage
• Military Doctrine
• Manufacturers: Manufacturing of the Black Box system, software system testing and design
3

1.5 If successful, what are the potential benefits of this project?
Several potential benefits of this project include:
• Vehicle Tracking through GPS
• Remotely monitoring vehicle status
• Detect and report the reliability of the vehicle
• Efficiency data to improve vehicle and overall system performance
• Modular versatility that allows integration into several types of vehicles
1.6 What factors are likely to drive the economics of development?
• Safety and accident prevention
• Vehicle maintenance
• Cost of black-box maintenance
• Hardware and software costs
4

Chapter 2
Use Case Development
2.1 Project Stakeholders
• The Black Box system project stakeholders include: ENES489P Black-Box Team and Advisors, MilitaryLogistics Agency, Soldier, Budget, Military Doctrine, Manufacturers
• Figure 2.1 shows a graphical layout of each stakeholders and their relationship with the Black Boxsystem design.
Research &
Development
Tes!ng
Manufacture
Fielding/
Training
ENES489P
Military Logis!cs
Agency
Soldier
Budget
Military
Doctrine
Manufacturers
System Use
Figure 2.1: Relationship between Stakeholders and their Concerns
2.2 Actors
• Environment (Vehicle): The vehicle to be used for the Black Box system
5
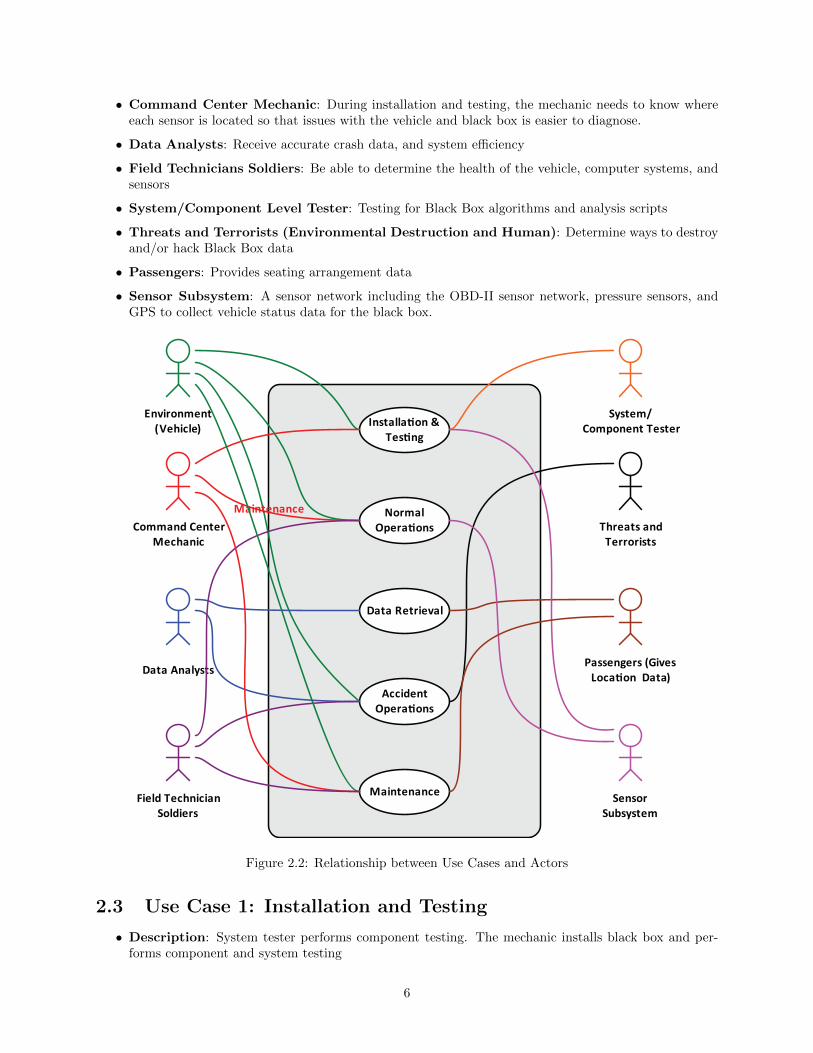
• Command Center Mechanic: During installation and testing, the mechanic needs to know whereeach sensor is located so that issues with the vehicle and black box is easier to diagnose.
• Data Analysts: Receive accurate crash data, and system efficiency
• Field Technicians Soldiers: Be able to determine the health of the vehicle, computer systems, andsensors
• System/Component Level Tester: Testing for Black Box algorithms and analysis scripts
• Threats and Terrorists (Environmental Destruction and Human): Determine ways to destroyand/or hack Black Box data
• Passengers: Provides seating arrangement data
• Sensor Subsystem: A sensor network including the OBD-II sensor network, pressure sensors, andGPS to collect vehicle status data for the black box.
Environment
(Vehicle)
Command Center
Mechanic
Data Analysts
Field Technician
Soldiers
Installa!on &
Tes!ng
Normal
Opera!ons
Data Retrieval
Accident
Opera!ons
System/
Component Tester
Threats and
Terrorists
Passengers (Gives
Loca!on Data)
Maintenance
Sensor
Subsystem
Maintenance
Figure 2.2: Relationship between Use Cases and Actors
2.3 Use Case 1: Installation and Testing
• Description: System tester performs component testing. The mechanic installs black box and per-forms component and system testing
6
• Primary Actors: Vehicle, System Tester, Sensor Subsystem, Command Center Mechanic
• Pre-Conditions: Vehicle, black box, and sensor systems are assembled, and the sensor system andvehicle have been tested by manufacturer
• Flow of Events:
– System Tester checks that the black box is functional and meets the general physical and behav-ioral requirements set by designers (ENES489P design team)
– Mechanic checks that vehicle and sensor system are in working order before installing the blackbox. Also performs his own simulation on the black box to check that it is functional and meetsbehavioral requirements.
– Mechanic installs black box and integrates the three subsystems into one system.
– Mechanic performs an overall system test to check if the black box is securely located, and isfunctioning in accordance with the sensor network.
• Post-Conditions:
– Black box is installed and integrated with vehicle and sensor network. Follows the behavioralrequirements set by design team
• Alternative Flow of Events:
– Component tester finds fault in design requirements in black box, components must be repro-grammed or replaced, if this cannot be accomplished, a fundamental redesign is necessary.
– Mechanic finds fault in black box, vehicle, or sensor network, and the damaged system must berepaired or replaced before installation is possible.
– Mechanic finds that after installation and integration, black box does not function properly withsensor network and is not secure within the vehicle, reprograming or repositioning of black box isnecessary. If the system test still fails, replacement may be necessary.
• New Requirements:
– Manufacturer provides location of black box placement inside vehicle
– Black box must be compatible with given sensor network, and the two systems must be testedtogether before installation.
– Accurate measurements for the placement of the black box within the vehicle must be taken beforeinstallation
2.4 Use Case 2: Normal Operation (Recording and InterpretingData)
• Description: Records engine control unit data (including fault codes), power supply, seatbelts, seats,location of vehicle, temperature outside vehicle, and also audio/video data. Audio/video data can beused as Vehicle Boundary Recording, where the vehicle operator can use the outside viewing area videofootage for normal operations.
• Primary Actors: Sensor Subsystem, Vehicle, and Field Technician Soldiers
• Pre-conditions: The sensor subsystem is set and computer software is available on black box com-puter. Sufficient power is suppliled to the black box and sensor subsystem.
• Flow of Events:
7
– Records OBD-II PID (Parameter Identification Numbers) which includes data from the enginecontrol unit and non-standard PID (eg. power, seatbelts, passenger location, temperature) viadata acquisition software (similar software to Baravian Technic[2]) on a computer. Fault codesare included in the recordings.
– Records vehicle location via GPS computer software,
– Records audio and video data via cameras (connected to USB ports) on a computer.
– Save data on solid-state disk for data redundancy
– Data Rotator software is implemented. Data is saved in one-minute packets, designated as ’bad’for problematic/malfunctioning/error data and ’good’ for nonproblematic data, and the datarotator deletes the oldest ’good’ data if the solid state drive’s capacity reaches 70%
• Post-Conditions: Data saved in hard drive for data retrieval (Use Case 3)
• Assumptions: Pre-Conditions have been met.
• New Requirements:
– Computer Type: Includes wireless connectivity capability
– Additional solid-state disk for data redundancy
– Power Supply
– Backup Battery
– Command center data requesting and retrieval
– Tamper resistance for both computer and additional solid-state disk
– Vehicle layout, boundaries, and limitations
2.5 Use Case 3: Retrieving Data
• Description: This use case (process) is needed when there is the necessity to monitor the health ofthe vehicle in the normal basis or to research the causes of failure in case any incident happens to thevehicle. Data retrieving can be done on site or remotely from the command center through wirelesscommunication. Here we are concerned with on-site data retrieving.
• Primary Actors: Data Analysts, Field technician
• Pre-Conditions:
– Black box is powered ON, and is functioning properly
– Decision on the retrieving mode
• Flow of Events (On-Site):
– Verify that the black box is powered ON
– Connect the Reader Device to the black box
– Pass the system security-access (Authentication)
– Download the data from the black box hard drive
– Log out when download is completed
– Disconnect the reader device
• Alternative Flow of Events (Remote access):
– Identify the vehicle location
8
– Launch wireless communication
– Pass security access (Authentication)
– Initiate data download
– Log out when download is completed
• Post-Conditions:
– Register log-in information and operation time
– Black box remains powered ON
• New requirements:
– The black box does not lost data after the retrieving process
– The black box does not interfere with the vehicle’s functions
2.6 Use Case 4: Accident/Abnormal Operations
• Description: This scenario occurs when the black box is subject to external factors such as humanand environment threats. The black box hardware must be able to withstand extreme temperaturesand forces, while the software must be resilient to human threats by encrypting data and throughvarious security features.
• Primary Actors: Terrain (Outside Environment), Human Threats
• Pre-Conditions: System is installed in vehicle
• Flow of Events:
– System withstands High Temperatures (i.e. Desert Temperatures)
– System withstands Low Temperatures (i.e. Arctic Temperatures)
– System withstands high forces
– System functions underwater
• Post-Conditions: System still functions
• Alternative Flow of Events: System fails to withstand any of the conditions listed above.
• New Requirements:
– The black box must withstand any vibration while driving in the field.
– The black box must survive explosion if any should occur
– Trusted Platform Module (TPM) hardware and software
– After an accident, the data rotator does not delete data and records until full. If there is a mainpower loss, the system performs Normal Operations (see Use Case 2: Normal Operations) for 30minutes, using the backup battery as power source, and then switches to work as a locator beacon.This will allow an additional 30 minutes of post-accidental data to be recorded.
9
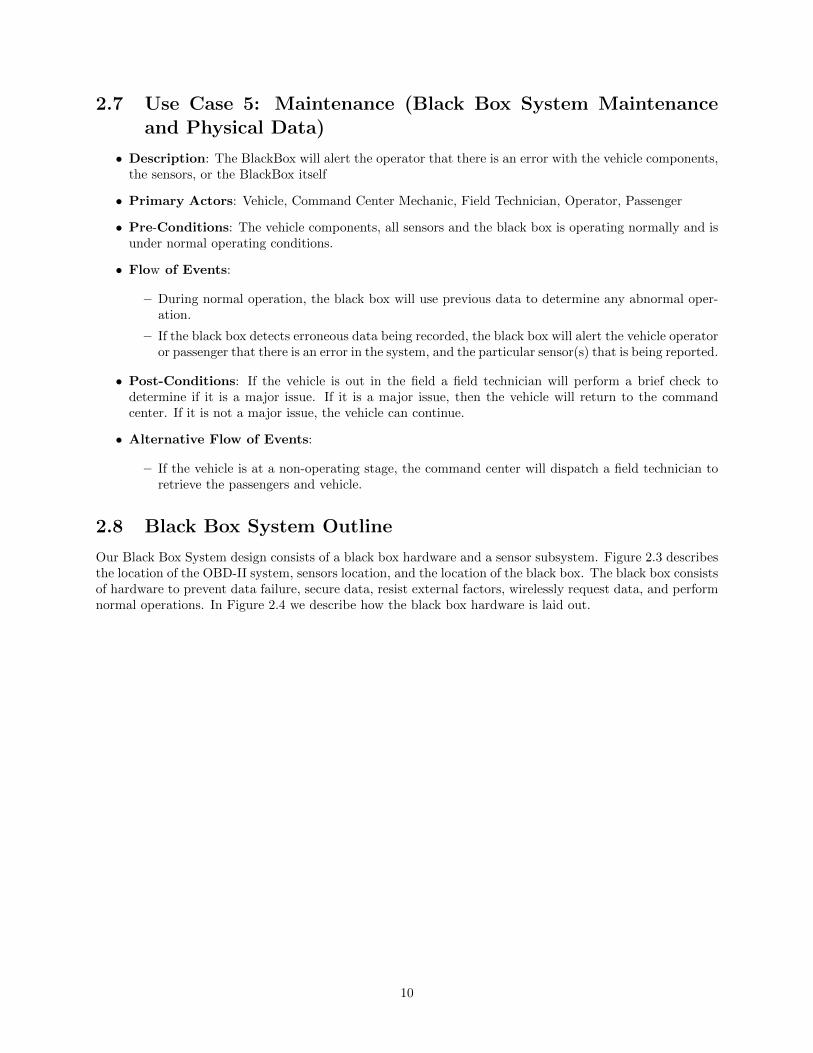
2.7 Use Case 5: Maintenance (Black Box System Maintenanceand Physical Data)
• Description: The BlackBox will alert the operator that there is an error with the vehicle components,the sensors, or the BlackBox itself
• Primary Actors: Vehicle, Command Center Mechanic, Field Technician, Operator, Passenger
• Pre-Conditions: The vehicle components, all sensors and the black box is operating normally and isunder normal operating conditions.
• Flow of Events:
– During normal operation, the black box will use previous data to determine any abnormal oper-ation.
– If the black box detects erroneous data being recorded, the black box will alert the vehicle operatoror passenger that there is an error in the system, and the particular sensor(s) that is being reported.
• Post-Conditions: If the vehicle is out in the field a field technician will perform a brief check todetermine if it is a major issue. If it is a major issue, then the vehicle will return to the commandcenter. If it is not a major issue, the vehicle can continue.
• Alternative Flow of Events:
– If the vehicle is at a non-operating stage, the command center will dispatch a field technician toretrieve the passengers and vehicle.
2.8 Black Box System Outline
Our Black Box System design consists of a black box hardware and a sensor subsystem. Figure 2.3 describesthe location of the OBD-II system, sensors location, and the location of the black box. The black box consistsof hardware to prevent data failure, secure data, resist external factors, wirelessly request data, and performnormal operations. In Figure 2.4 we describe how the black box hardware is laid out.
10

On-Board Diagnos�csBuilt-in vehicle sensor network for
various vehicle sub-systems
Black Box (Obsecured)Located below sea!ng area for
obsecurity
Right Boundary
Camera
Le! Boundary
Camera
Rear Boundary
Camera
Front Boundary
Camera
Pressure Sensors
Used for passenger detec!on
Camera/GPS/Monitor
Records vehicle interior events,
provide user feedback of black box,
and provides loca!on data
Figure 2.3: Complete Black Box system layout diagram showing the location of each subsystem
• Sensors
– Microphone: Cockpit audio recording
– Camera: Vehicle boundary (left, right, front, rear), and cockpit video recording
– OBD-II: Vehicle Condition Recording and Monitoring
– GPS: Vehicle Geo-Tracking
– Pressure Sensor: Passenger Location
• Vehicle (environment)
– Vehicle Layout: Diagram of the vehicle and the location of each sensor
• Black Box
– Back-Up Battery: To provide power if main power is lost. Used as a post-accident auxiliarypower for GPS and 30 minutes of recording
– Command Center Data Requesting: The command center can request data from the vehiclewireless by assigning a unique ID to each individual vehicle
– Environmental Condition: Records conditions of the environment
– Data Analyzing: Black-box must also be able to analyze input data and output accurate systeminformation for use by analysts and technician (use baselines, past data, etc)
– Tamper Resistance: Prevents unauthorized access by requiring a dongle for data access, de-stroys data if Black Box is opened
– Solid State Disk: For shock resistant data storage
– Data Acquisition Unit: Receives data from sensors to be recorded onto disk
11
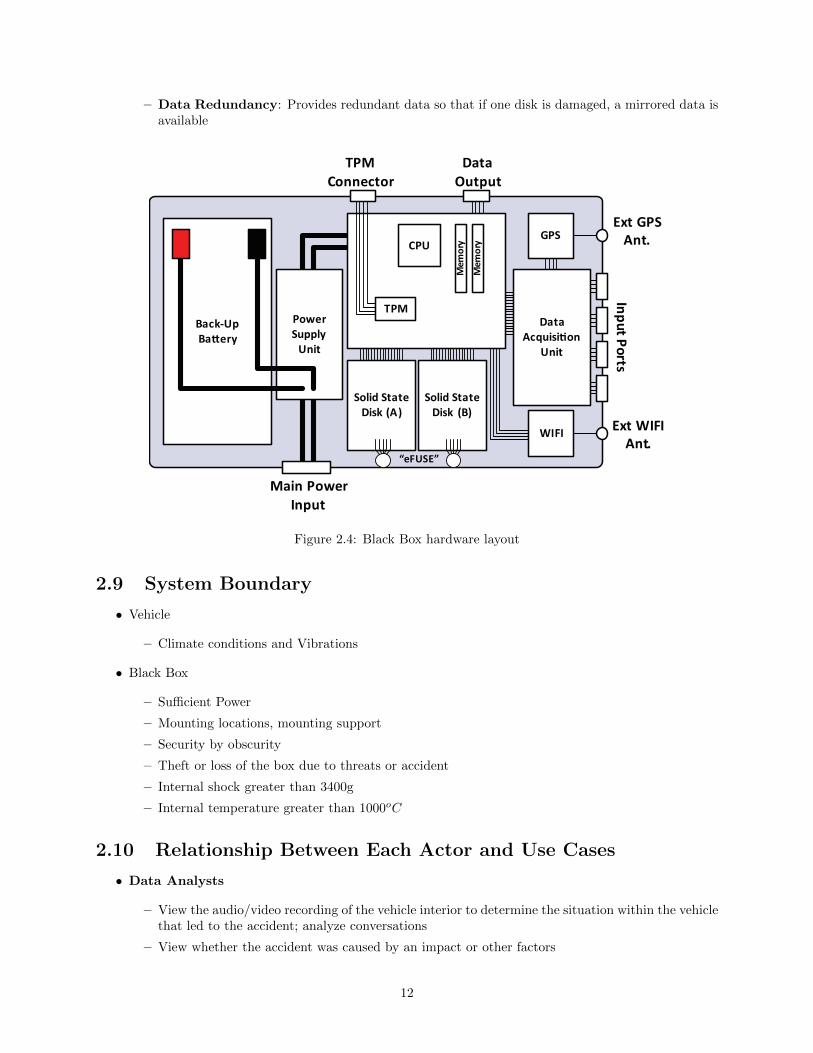
– Data Redundancy: Provides redundant data so that if one disk is damaged, a mirrored data isavailable
Back-Up
Ba!ery
Data
Acquisi"on
Unit
GPS
WIFI
Main Power
Input
Solid State
Disk (A)
Solid State
Disk (B)
Data
Output
TPM
ConnectorIn
pu
t Po
rts
Ext GPS
Ant.
Ext WIFI
Ant.
Power
Supply
Unit
CPU
Me
mo
ry
Me
mo
ry
TPM
“eFUSE”
Figure 2.4: Black Box hardware layout
2.9 System Boundary
• Vehicle
– Climate conditions and Vibrations
• Black Box
– Sufficient Power
– Mounting locations, mounting support
– Security by obscurity
– Theft or loss of the box due to threats or accident
– Internal shock greater than 3400g
– Internal temperature greater than 1000oC
2.10 Relationship Between Each Actor and Use Cases
• Data Analysts
– View the audio/video recording of the vehicle interior to determine the situation within the vehiclethat led to the accident; analyze conversations
– View whether the accident was caused by an impact or other factors
12

– Determine the condition of the vehicle before and during the accident
– Locate the geographic location of the accident
– Determine whether the environment play a role in the accident
– Being able to understand the standard operating condition compared to the data acquired duringaccident
– Requires a dongle to be inserted with the correct unique key for the black box, none or invalidkeys will prevent data from being retrieved
• Field Technician Soldiers
– Preview the boundaries of the vehicle to determine any potential threats
– Being able to acknowledge the conditions of the vehicle and report issues to technicians
– Being able to know the geographic location
– The passenger can request to send data to the command center or base station to verify vehiclecondition
– Determine if the environment is safe (eg. climate, and weather)
– Determine possible repairs and maintenance issues with black-box, vehicle, sensors, and physicalsystems
• Command Center Mechanics
– Determine malfunctions within the system that could lead to catastrophic failure
– Use analysis from black-box to determine efficiency of systems, software, hardware, and sensornetworks.
– Passengers (Pressure Sensor)
– The black box knows where each passenger is seated
– The mechanic installs the black box inside the vehicle
– Passengers can preview the boundaries of the vehicle and determine the geographic location
• Vehicle
– Records vehicle interior audio/video every 24 hours (if an accident has occurred, data will not beerased after 24 hours)
– Records the boundaries of the vehicle every 24 hours (if an accident has occurred, data will notbe erased after 24 hours)
– Collect data from sensors within the vehicle for report generation
– Keep track of where the vehicle navigational path so that the user can determine where the vehiclehas been
– Receive requests from Command Center to transmit data from the Black Box to the substation.
– Records the temperature, humidity, and other environmental factors that may [have] contribute(d)to the accident
– Generate a operating report for the vehicle operators or accident report for analysts
– Prevent unauthorized access to the black box
– Provide data redundancy to prevent data loss if one disk in the array is damaged
• Human Threats
– Determine the location of the Black Box that is retrieved by enemy
– Deny access to the data if no dongle is detected (TPM); data is destroyed (eFUSE) if the blackbox is opened.
13

2.11 Dependencies Among the System Functionalities
• Sufficient Power must be available for the black box
• During installation, the technician should know where each sensor is located for troubleshooting
14

Chapter 3
Textual Scenarios
3.1 Use Case 1: Installation and Testing
During installation, the technician must know the number of sensors used, types of sensors, and the locationof each sensor. After installation phase is completed, the black box will need to be tested for compatibilitywith the vehicle. Figure 3.1 shows an activity diagram of this use case.
15

Major reconfiguration
required
Minor calibration needed
Mechanic receives black
box from systems analyst
Test Software verifies
compatibility
Notify manufacture
Mechanic installs black
box
Input compartment dimensions
Input Types of Sensors
Input Number
of Sensors
No
Yes
No
Yes
Installed Correctly?
Is the black Box compatible?
Figure 3.1: Activity Diagram for Installation and Testing
• Installation
– Component-Level Testing
– Black Box Location: System-Level Testing
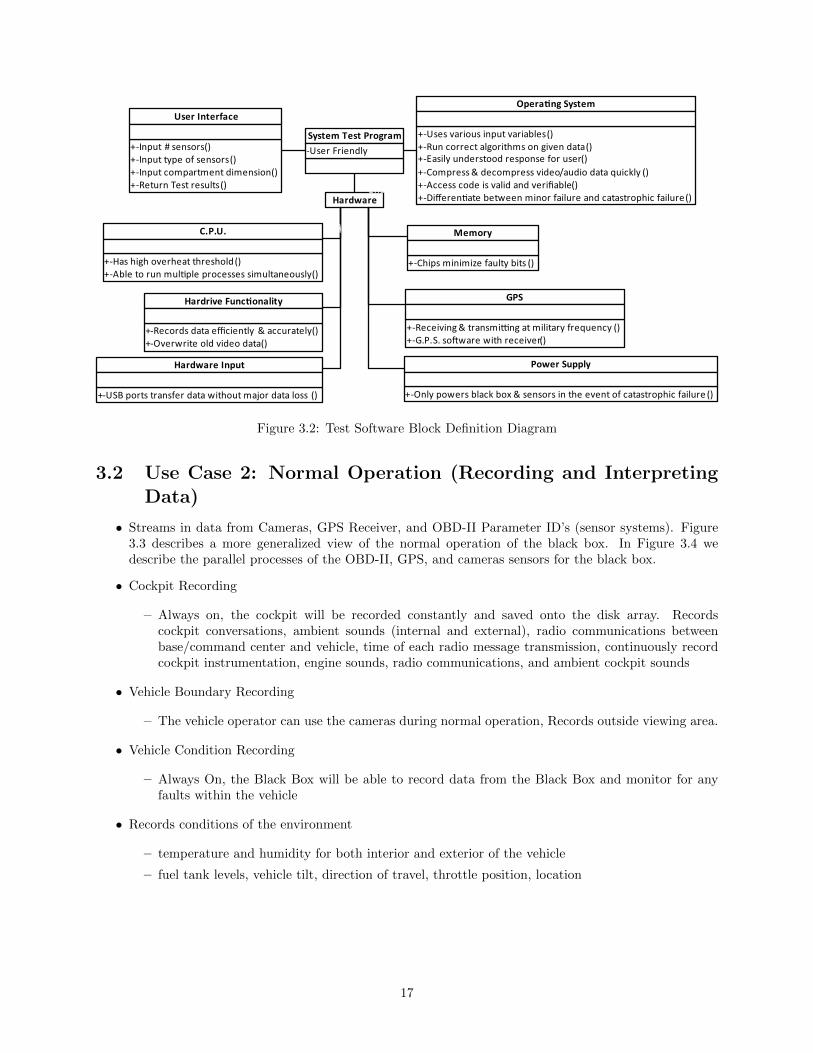
• Figure 3.2 is the block definition diagram to describe the test software.
16
Hardware-End1*
-End2*
-End3
*
-End4
*
-End11
*
-End12
*
-End5
*
-End6 *
-End7
*
-End8 *
-End9
*
-End10 *
-End13
*-End14 *
-End15
*
-End16 *
-End17
*
-End18 *
System Test Program
-User Friendly
+-Uses various input variables()
+-Run correct algorithms on given data()
+-Easily understood response for user()
+-Compress & decompress video/audio data quickly ()
+-Access code is valid and verifiable()
+-Differen#ate between minor failure and catastrophic failure()
Opera!ng System
+-Only powers black box & sensors in the event of catastrophic failure ()
Power Supply
+-Chips minimize faulty bits ()
Memory
+-Receiving & transmi$ng at military frequency ()
+-G.P.S. so%ware with receiver()
GPS
+-Input # sensors()
+-Input type of sensors()
+-Input compartment dimension()
+-Return Test results()
User Interface
+-USB ports transfer data without major data loss ()
Hardware Input
+-Records data efficiently & accurately()
+-Overwrite old video data()
Hardrive Func!onality
+-Has high overheat threshold()
+-Able to run mul#ple processes simultaneously()
C.P.U.
Figure 3.2: Test Software Block Definition Diagram
3.2 Use Case 2: Normal Operation (Recording and InterpretingData)
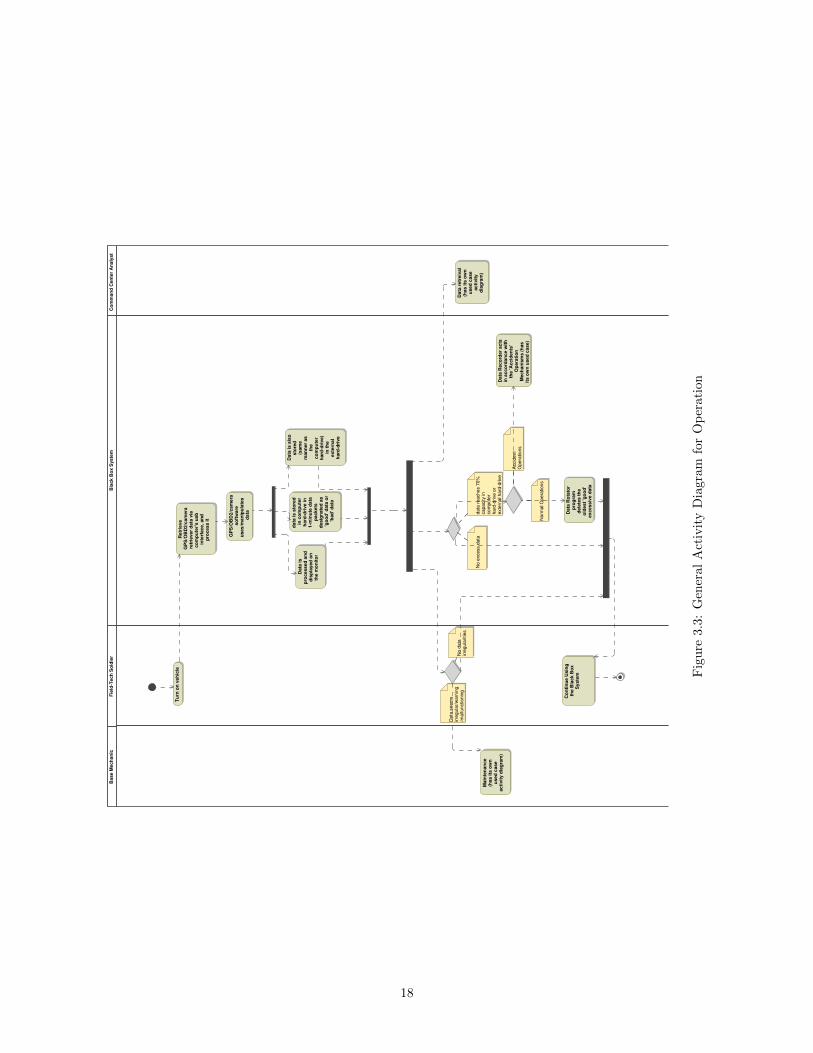
• Streams in data from Cameras, GPS Receiver, and OBD-II Parameter ID’s (sensor systems). Figure3.3 describes a more generalized view of the normal operation of the black box. In Figure 3.4 wedescribe the parallel processes of the OBD-II, GPS, and cameras sensors for the black box.
• Cockpit Recording
– Always on, the cockpit will be recorded constantly and saved onto the disk array. Recordscockpit conversations, ambient sounds (internal and external), radio communications betweenbase/command center and vehicle, time of each radio message transmission, continuously recordcockpit instrumentation, engine sounds, radio communications, and ambient cockpit sounds
• Vehicle Boundary Recording
– The vehicle operator can use the cameras during normal operation, Records outside viewing area.
• Vehicle Condition Recording
– Always On, the Black Box will be able to record data from the Black Box and monitor for anyfaults within the vehicle
• Records conditions of the environment
– temperature and humidity for both interior and exterior of the vehicle
– fuel tank levels, vehicle tilt, direction of travel, throttle position, location
17
Da
ta i
s a
lso
s
tore
d
(sa
me
m
an
ne
r a
s
the
c
om
pu
ter
ha
rd-d
riv
e)
in t
he
e
xte
rna
l h
ard
-dri
ve
Re
trie
ve
G
PS
/OB
D2
/ca
me
ra
retr
iev
er
da
ta v
ia
co
mp
ute
r's
us
b
inte
rfa
ce
, a
nd
p
roc
es
s i
t
da
ta i
s s
tore
d i
n c
om
pu
ter
ha
rd-d
riv
e i
n
1-m
inu
te d
ata
p
ac
ke
ts
de
sig
na
ted
as
'g
oo
d' d
ata
or
'b
ad
' d
ata
GP
S/O
BD
2/c
am
era
so
ftw
are
u
se
s/m
an
ipu
late
s d
ata
Da
ta i
s
pro
ce
ss
ed
an
d
dis
pla
ye
d o
n
the
mo
nit
or
No
exce
ss d
ata
da
ta r
ea
ch
es 7
0%
ca
pa
city in
co
mp
ute
r h
ard
-drive
or
exte
rna
l h
ard
-drive
Tu
rn o
n v
eh
icle
Da
ta s
ee
ms
irre
gu
lar/
wa
rnin
g/m
alfu
nctio
nin
gN
o d
ata
irre
gu
laritie
sD
ata
re
tre
iva
l (h
as
its
ow
n
us
ed
ca
se
a
cti
vit
y
dia
gra
m)
Bla
ck
Bo
x S
ys
tem
Fie
ld-T
ec
h S
old
ier
Ba
se
Me
ch
an
icC
om
ma
nd
Ce
nte
r A
na
lys
t
Da
ta R
ec
ord
er
ac
ts
in a
cc
ord
an
ce
wit
h
the
'A
cc
ide
nts
' O
pe
rati
on
M
ec
ha
nis
ms
(h
as
it
s o
wn
us
ed
ca
se
)
Co
nti
nu
e U
sin
g
the
Bla
ck
Bo
x
Sy
ste
m
Ma
inte
na
nc
e
(ha
s i
ts o
wn
u
se
d c
as
e
ac
tiv
ity
dia
gra
m)
Da
ta R
ota
tor
pro
gra
m
de
lete
s t
he
o
lde
st
'go
od
' e
xc
es
siv
e d
ata
No
rma
l O
pe
ratio
ns
Accid
en
t O
pe
ratio
ns
Fig
ure
3.3
:G
ener
al
Act
ivit
yD
iagra
mfo
rO
per
ati
on
18

Data
is a
lso
sto
red
(s
am
e
man
ner
as
the
co
mp
ute
r h
ard
-dri
ve)
in t
he
exte
rnal
hard
-dri
ve
Web
cam
so
ftw
are
u
ses/m
an
ipu
late
s d
ata
Retr
ieve O
BD
-II
Para
mete
r ID
sen
so
r syste
m d
ata
via
co
mp
ute
r's
usb
in
terf
ace,
an
d p
rocess it
Retr
ieve G
PS
re
trie
ver
data
via
co
mp
ute
r's
usb
in
terf
ace,
an
d p
rocess it
Retr
ive
web
cam
feed
via
co
mp
ute
r's
usb
in
terf
ace
an
d p
rocess it
No e
xcess d
ata
data
reaches 7
0%
capacity in
com
pute
r hard
-drive o
r exte
rnal hard
-drive
Tu
rn o
n v
eh
icle
Data
seem
s
irre
gula
r/w
arn
ing
/malfunctionin
gN
o d
ata
irre
gula
rities
Data
retr
eiv
al
(has its
ow
n
used
case
acti
vit
y
dia
gra
m)
Bla
ck B
ox S
yste
mF
ield
-Tech
So
ldie
rB
ase M
ech
an
icC
om
man
d C
en
ter
An
aly
st
data
is
sto
red
in
co
mp
ute
r h
ard
-dri
ve in
1-m
inu
te
data
packets
desig
nate
d
as 'g
oo
d'
data
or
'bad
' d
ata
Data
Reco
rder
acts
in
acco
rdan
ce w
ith
th
e 'R
eliab
ilit
y'
Mech
an
ism
s (
has
its o
wn
used
case)
data
is s
tore
d in
co
mp
ute
r h
ard
-dri
ve in
1-m
inu
te d
ata
p
ackets
d
esig
nate
d a
s 'g
oo
d' d
ata
or
'b
ad
' d
ata
data
is s
tore
d
in c
om
pu
ter
hard
-dri
ve in
1-m
inu
te d
ata
p
ackets
d
esig
nate
d a
s
'go
od
' d
ata
or
'bad
' d
ata
Co
nti
nu
e U
sin
g
the B
lack B
ox
Syste
m
GP
S s
oft
ware
u
ses/m
an
ipu
late
s d
ata
OB
D-I
I d
iag
no
sti
cs
so
ftw
are
u
ses/m
an
ipu
late
s d
ata
Data
is
pro
cessed
an
d
dis
pla
yed
on
th
e m
on
ito
r
Data
is a
lso
sto
red
(sam
e
man
ner
as t
he
co
mp
ute
r h
ard
-dri
ve)
in
the e
xte
rnal
hard
-dri
ve
Data
Ro
tato
r p
rog
ram
d
ele
tes t
he
old
est
'go
od
' excessiv
e d
ata
Main
ten
an
ce
(has its
ow
n
used
case
acti
vit
y d
iag
ram
)
Data
is a
lso
sto
red
(sam
e
man
ner
as t
he
co
mp
ute
r h
ard
-dri
ve)
in
the e
xte
rnal
hard
-dri
ve
Data
is
pro
cessed
an
d
dis
pla
yed
on
th
e m
on
ito
r
Data
is
pro
cessed
an
d d
isp
layed
on
th
e
mo
nit
or
Norm
al O
pera
tions
Accid
ent
Opera
tions
Fig
ure
3.4
:A
ctiv
ity
Dia
gra
mfo
rO
per
ati
on
19

3.3 Use Case 3: Retrieving Data
• Modes of Data Retrieval: Figure 3.5 the process in which data is retrieved from the black box.
– The Command Center can request data remotely and be able to monitor the vehicle’s health.
– For local access, a technician can insert a reader containing the unique ID for authentication toretrieve data
Check PowerConnect ReaderLog InDownload DataRelease Reader
Power OnBlack Box Locate VehicleOn MapInitiateConnection
Local Access?Black Box Active?
Figure 3.5: Activity Diagram for Retrieving Data
3.4 Use Case 4: Accident/Abnormal Operations
When an accident has occurred and the vehicle is damaged, the black box must be resilient to externalthreats as it acts as an independent hardware. Figure 3.6 shows the process after an accident has occurred.
20
Black Box operating under normal
conditions
Environmental Effects
Data Rotator software does
not delete oldest 'Good' data. Records until it fills up
Combat Effects
Data rotator software
enables system to act under
normal conditions for 30
minutes and then switches
to a locator beacon.
Is Main Power Supply Available?
YES
YES
NO
NO
Car Accident?
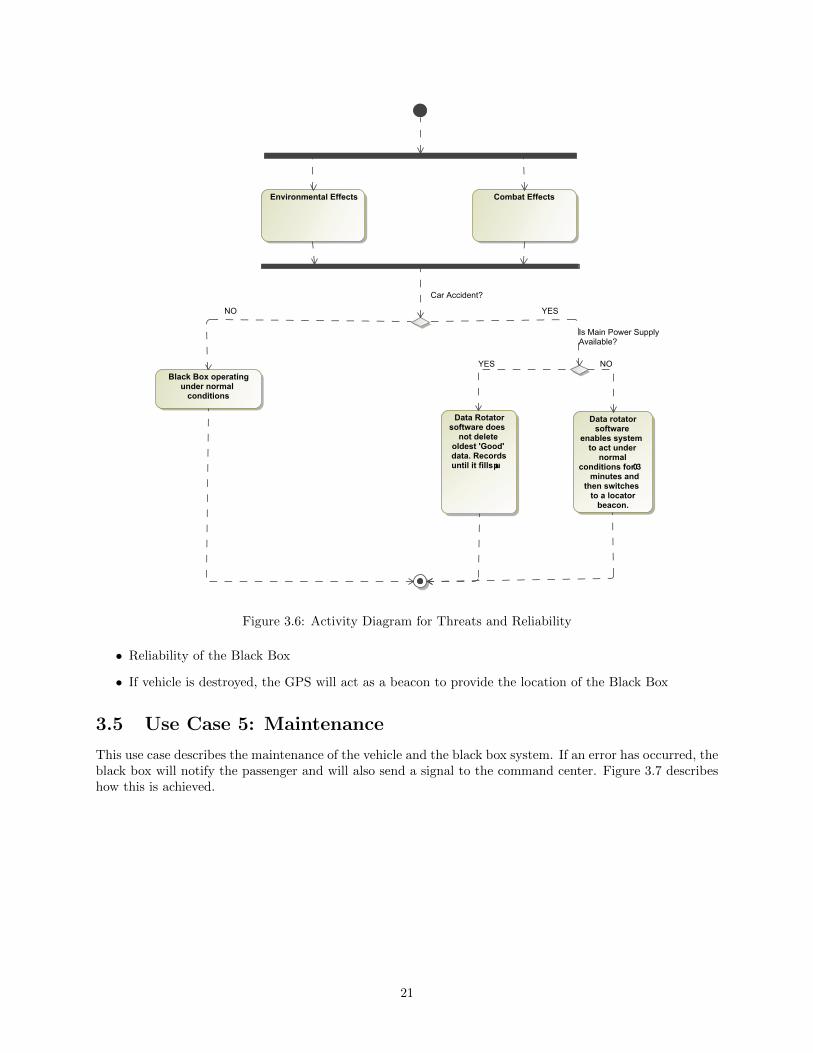
Figure 3.6: Activity Diagram for Threats and Reliability
• Reliability of the Black Box
• If vehicle is destroyed, the GPS will act as a beacon to provide the location of the Black Box
3.5 Use Case 5: Maintenance
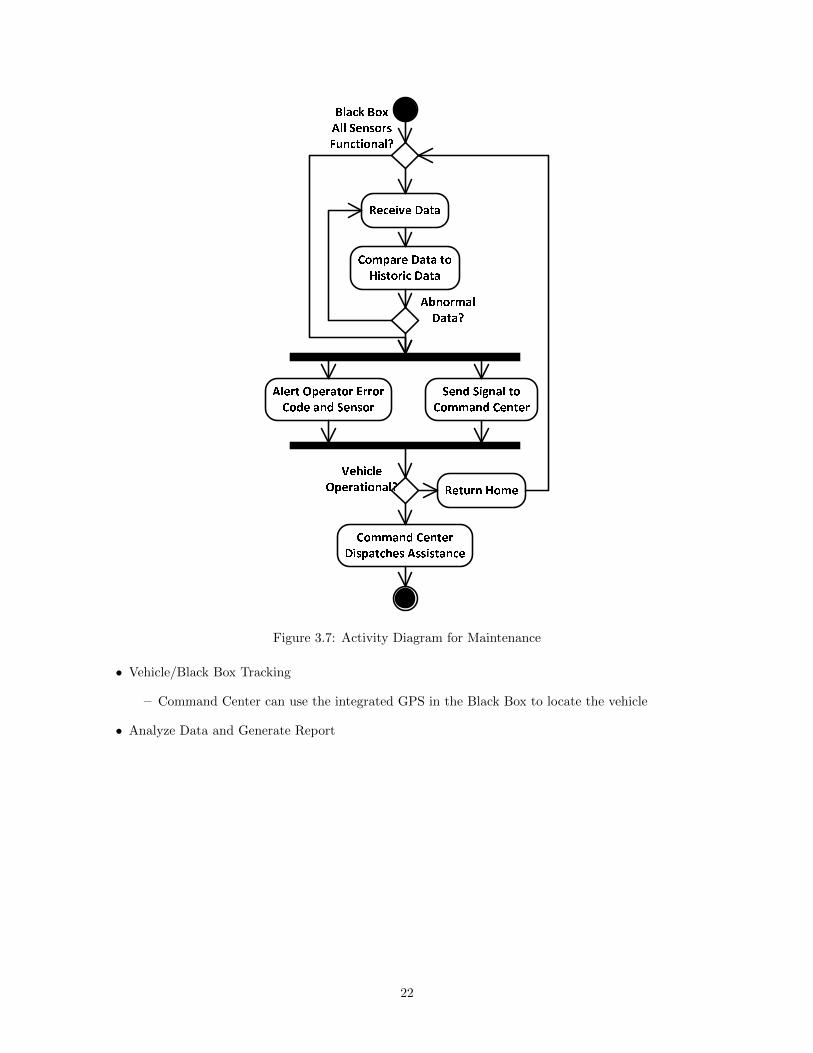
This use case describes the maintenance of the vehicle and the black box system. If an error has occurred, theblack box will notify the passenger and will also send a signal to the command center. Figure 3.7 describeshow this is achieved.
21
Receive DataCompare Data toHistoric DataAlert Operator ErrorCode and Sensor Send Signal to Command Center
Return HomeCommand CenterDispatches Assistance
Abnormal Data?Vehicle Operational?
Black BoxAll Sensors Functional?
Figure 3.7: Activity Diagram for Maintenance
• Vehicle/Black Box Tracking
– Command Center can use the integrated GPS in the Black Box to locate the vehicle
• Analyze Data and Generate Report
22
Chapter 4
Simplified Models of System Behavior
4.1 Use Case 1: Installation and Testing
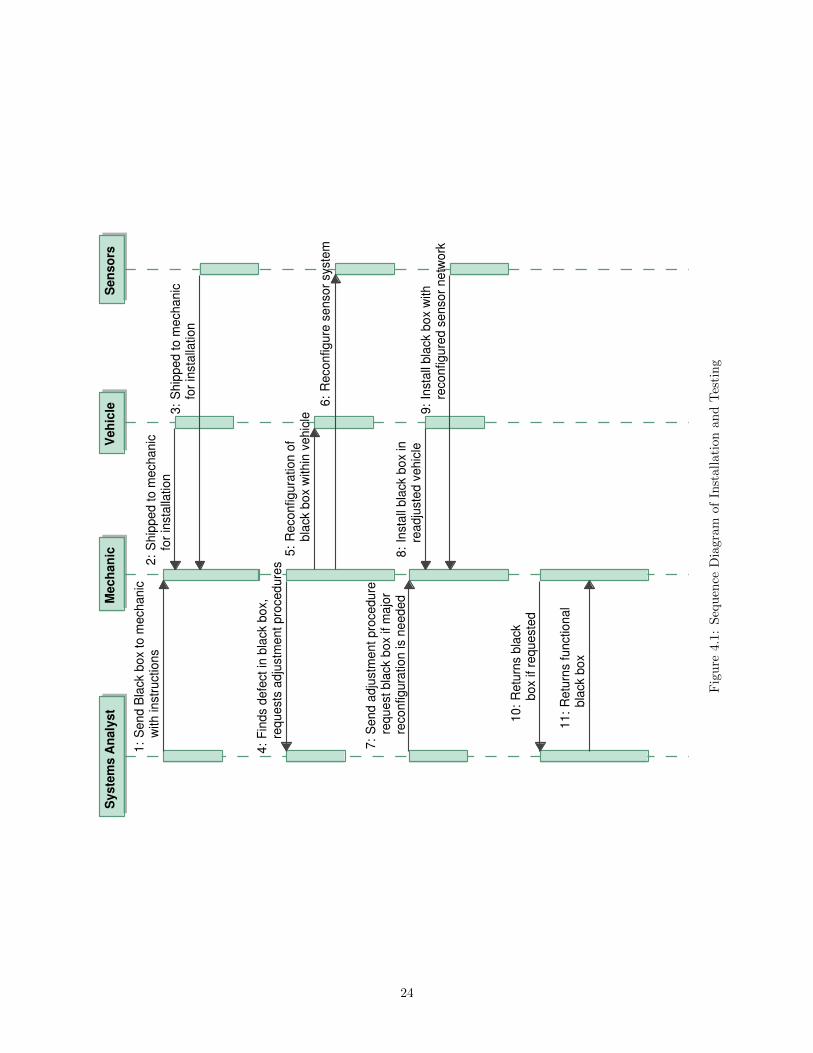
• See Figure 4.1. This figure describes a ’timeline’ of how installation and testing is performed on theBlack Box system.
4.2 Use Case 2: Normal Operation (Recording and InterpretingData)
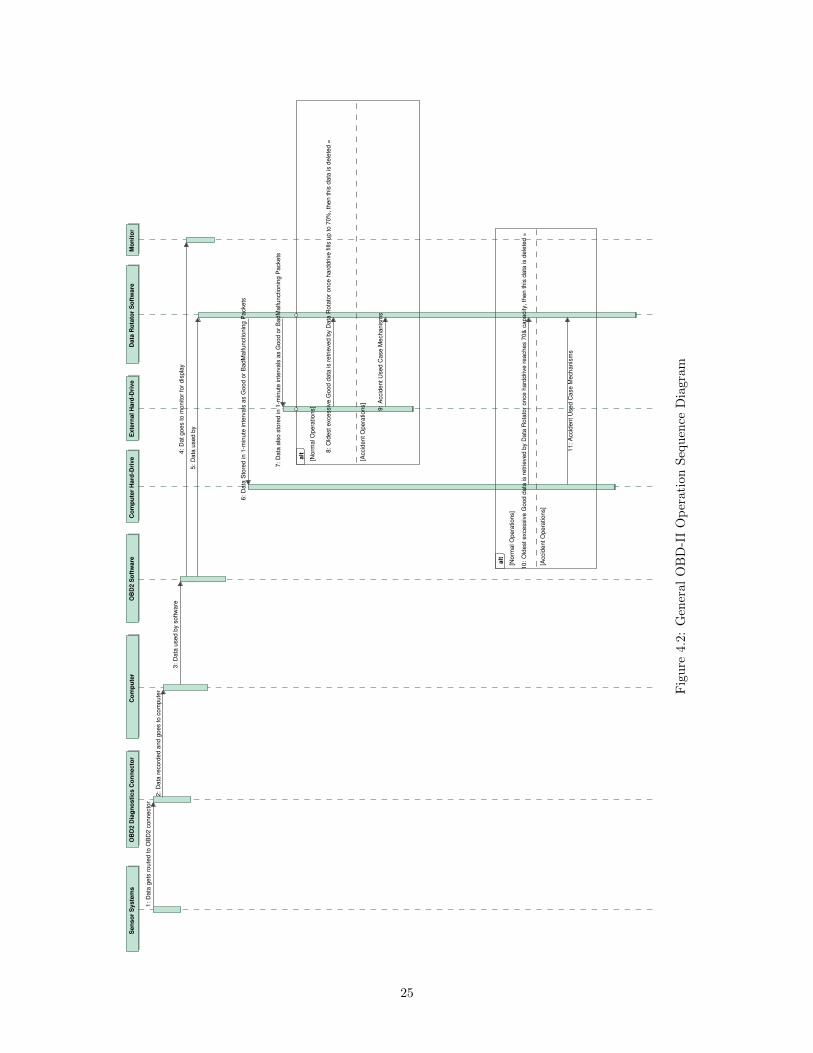
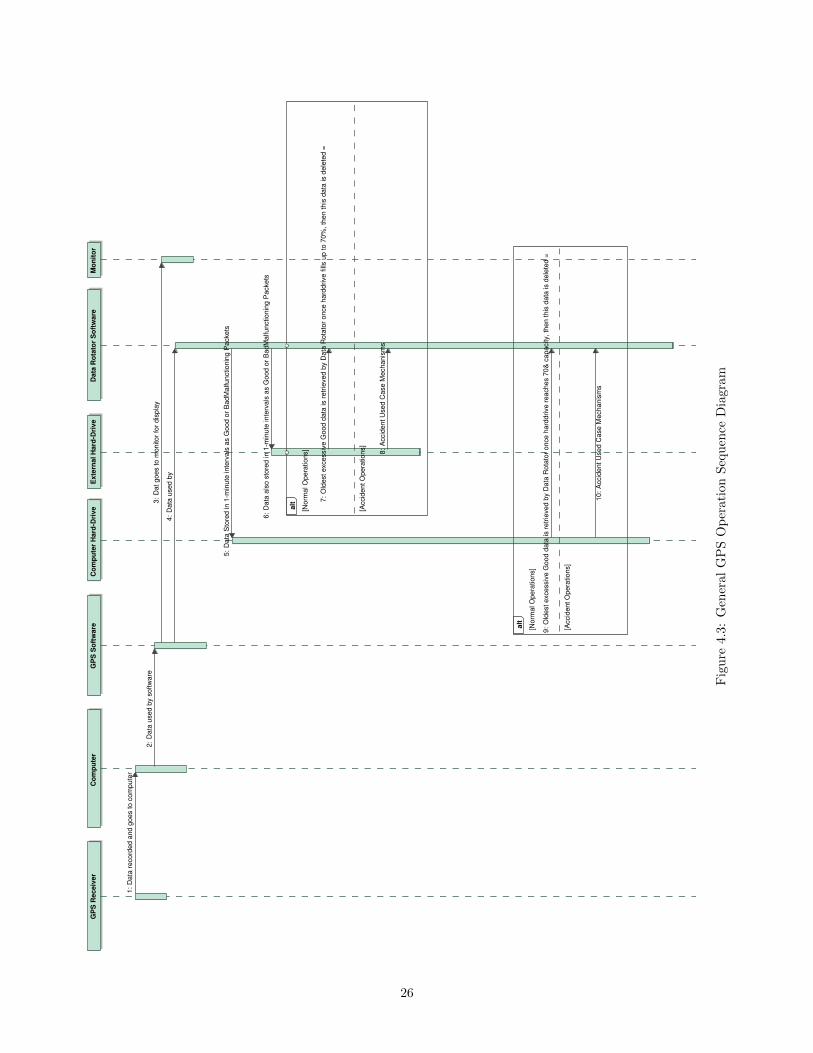
• Figures 4.2, 4.3, 4.4 describes a generalized sequence diagram of each individual sensor system (OBD-II,GPS, camera) used for operation.
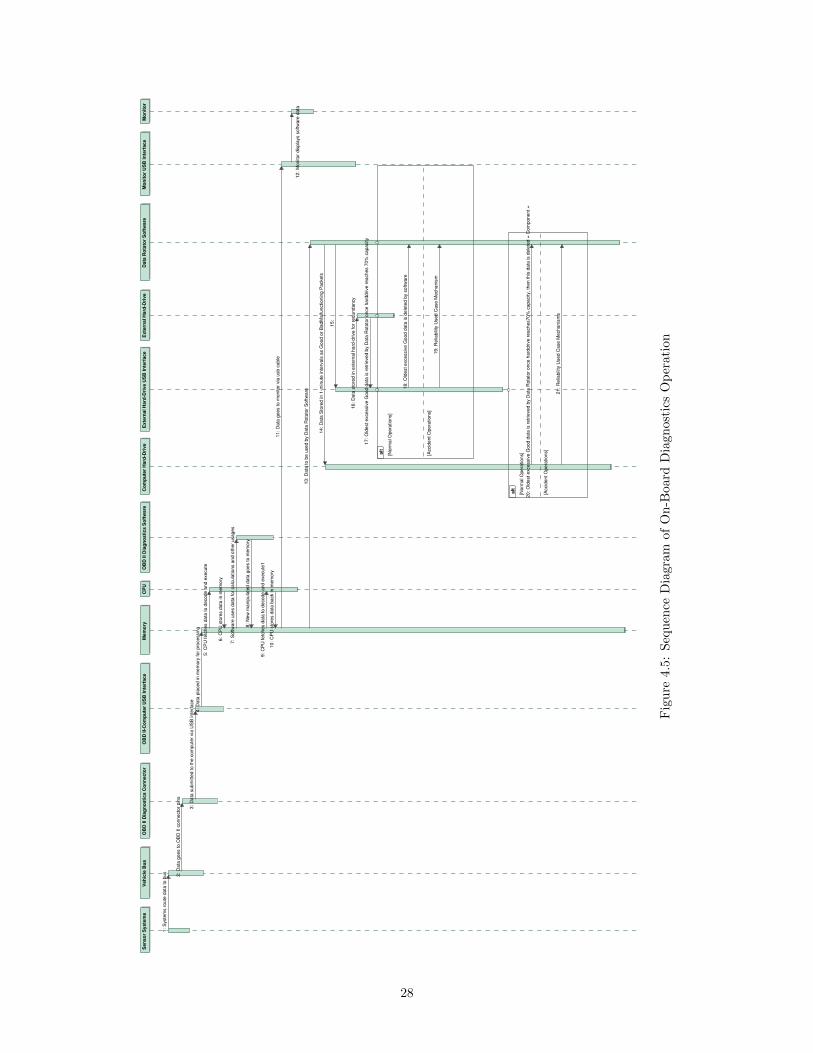
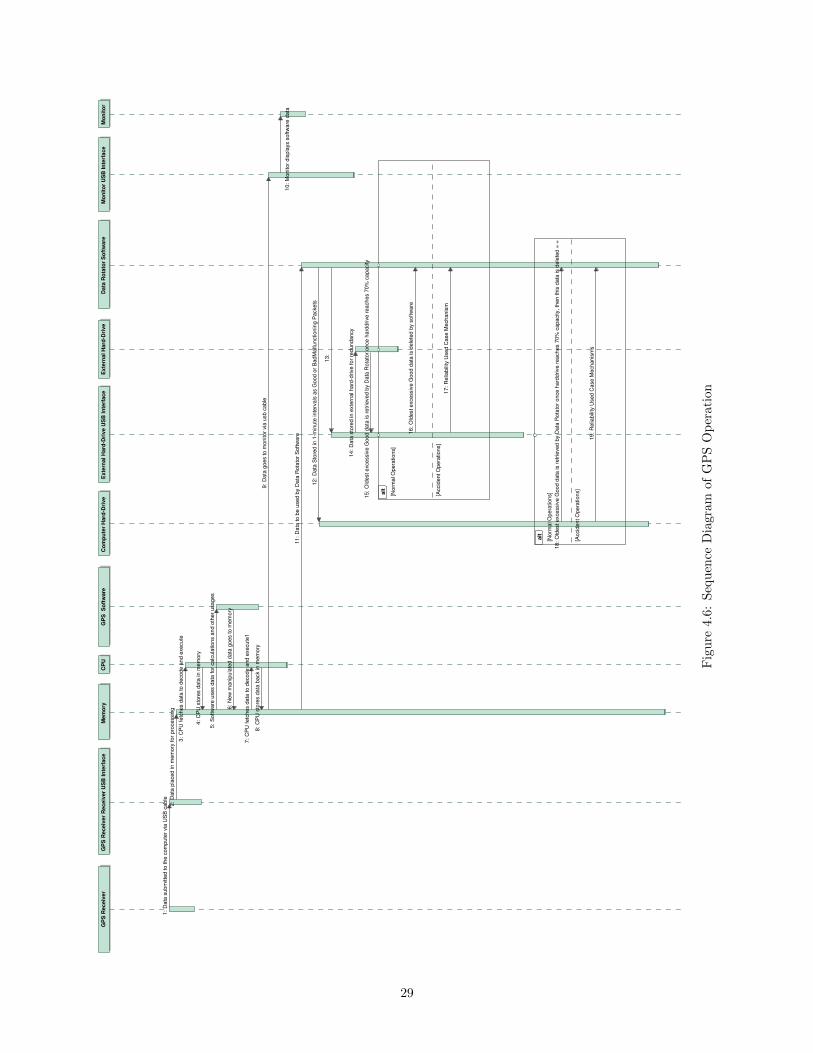
• Figures 4.5, 4.6, 4.7 describes the sequence of events achieved by each sensor system.
4.3 Use Case 3: Retrieving Data
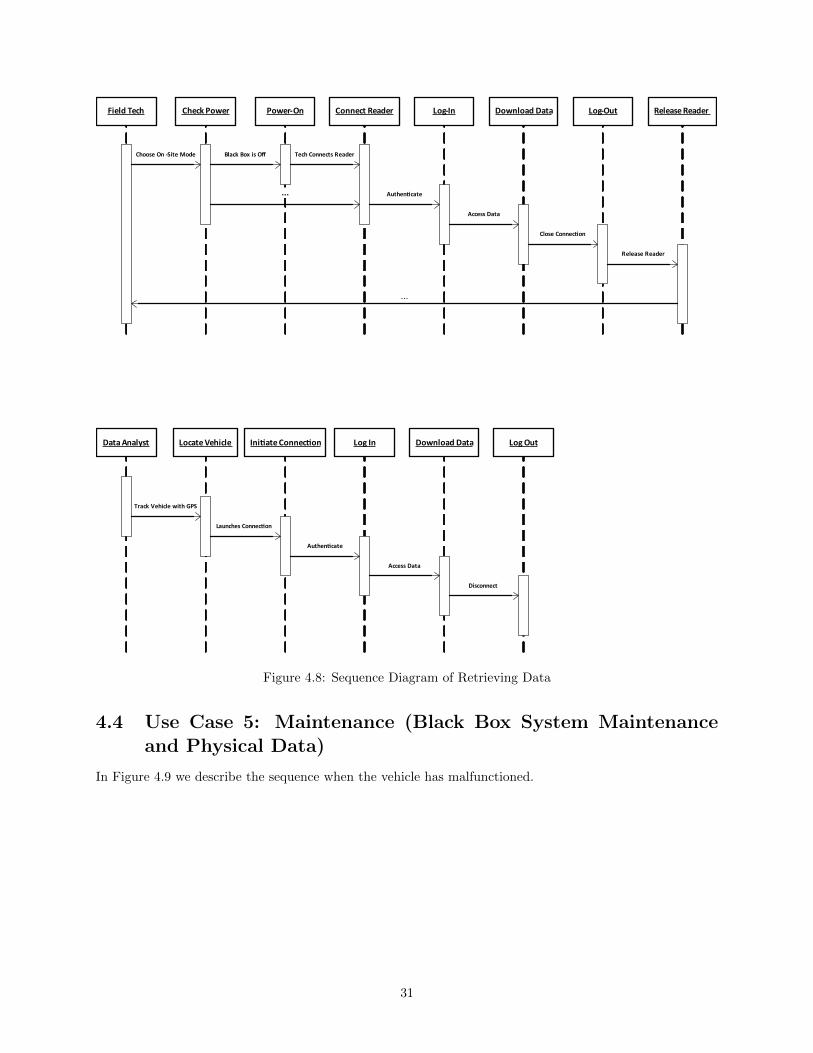
In Figure 4.8 we describe two ways of retrieving data from the black box. The sequence of physically accessingthe data, and remotely accessing the data is described in 4.8.
23
Sy
ste
ms
An
aly
st
Me
ch
an
icS
en
so
rsV
eh
icle
Se
nd
Bla
ck b
ox t
o m
ech
an
ic
with
in
str
uctio
ns
1:
Se
nd
ad
justm
en
t p
roce
du
rere
qu
est
bla
ck b
ox if
ma
jor
reco
nfig
ura
tio
n is n
ee
de
d
7:
Re
turn
s f
un
ctio
na
l b
lack b
ox
11
:
Fin
ds d
efe
ct
in b
lack b
ox,
req
ue
sts
ad
justm
en
t p
roce
du
res
4:
Re
co
nfig
ura
tio
n o
f b
lack b
ox w
ith
in v
eh
icle
5:
Re
co
nfig
ure
se
nso
r syste
m6
:
Re
turn
s b
lack
bo
x if
req
ue
ste
d1
0:
Sh
ipp
ed
to
me
ch
an
icfo
r in
sta
llatio
n3
:
Insta
ll b
lack b
ox w
ith
reco
nfig
ure
d s
en
so
r n
etw
ork
9:
Sh
ipp
ed
to
me
ch
an
ic
for
insta
llatio
n2
:
Insta
ll b
lack b
ox in
rea
dju
ste
d v
eh
icle
8:
Fig
ure
4.1
:Seq
uen
ceD
iagra
mof
Inst
allati
on
and
Tes
ting
24
Co
mp
ute
rD
ata
Ro
tato
r S
oft
ware
OB
D2 D
iag
no
sti
cs C
on
necto
rO
BD
2 S
oft
ware
Sen
so
r S
yste
ms
Co
mp
ute
r H
ard
-Dri
ve
Exte
rnal H
ard
-Dri
ve
Mo
nit
or
[Norm
al O
pera
tions]
[Accid
ent O
pera
tions]
alt
[Norm
al O
pera
tions]
[Accid
ent O
pera
tions]
alt
Data
used b
y s
oftw
are
3:
Data
Sto
red in 1
-min
ute
inte
rvals
as G
ood o
r B
adM
alfunctionin
g P
ackets
6:
Data
als
o s
tore
d in 1
-min
ute
inte
rvals
as G
ood o
r B
adM
alfunctionin
g P
ackets
7:
Data
record
ed a
nd g
oes to c
om
pute
r2:
Dat goes to m
onitor
for
dis
pla
y4:
Data
used b
y
5:
Data
gets
route
d to O
BD
2 c
onnecto
r1:
Old
est excessiv
e G
ood d
ata
is r
etr
ieved b
y D
ata
Rota
tor
once h
ard
drive r
eaches 7
0&
capacity, th
en this
data
is d
ele
ted =
10:
Accid
ent U
sed C
ase M
echanis
ms
11: O
ldest excessiv
e G
ood d
ata
is r
etr
ieved b
y D
ata
Rota
tor
once h
ard
drive fill
s u
p to 7
0%
, th
en this
data
is d
ele
ted =
8:
Accid
ent U
sed C
ase M
echanis
ms
9:
Fig
ure
4.2
:G
ener
al
OB
D-I
IO
per
ati
on
Seq
uen
ceD
iagra
m
25
Co
mp
ute
rD
ata
Ro
tato
r S
oft
ware
GP
S R
eceiv
er
GP
S S
oft
ware
Co
mp
ute
r H
ard
-Dri
ve
Exte
rnal H
ard
-Dri
ve
Mo
nit
or
[Norm
al O
pera
tions]
[Accid
ent O
pera
tions]
alt
[Norm
al O
pera
tions]
[Accid
ent O
pera
tions]
alt
Data
used b
y s
oftw
are
2:
Data
Sto
red in 1
-min
ute
inte
rvals
as G
ood o
r B
adM
alfunctionin
g P
ackets
5:
Data
als
o s
tore
d in 1
-min
ute
inte
rvals
as G
ood o
r B
adM
alfunctionin
g P
ackets
6:
Data
record
ed a
nd g
oes to c
om
pute
r1:
Dat goes to m
onitor
for
dis
pla
y3:
Data
used b
y
4:
Old
est excessiv
e G
ood d
ata
is r
etr
ieved b
y D
ata
Rota
tor
once h
ard
drive r
eaches 7
0&
capacity, th
en this
data
is d
ele
ted =
9:
Accid
ent U
sed C
ase M
echanis
ms
10: O
ldest excessiv
e G
ood d
ata
is r
etr
ieved b
y D
ata
Rota
tor
once h
ard
drive fill
s u
p to 7
0%
, th
en this
data
is d
ele
ted =
7:
Accid
ent U
sed C
ase M
echanis
ms
8:
Fig
ure
4.3
:G
ener
al
GP
SO
per
ati
on
Seq
uen
ceD
iagra
m
26

Co
mp
ute
rD
ata
Ro
tato
r S
oft
ware
Cam
era
sC
am
era
So
ftw
are
Co
mp
ute
r H
ard
-Dri
ve
Exte
rnal H
ard
-Dri
ve
Mo
nit
or
[Norm
al O
pera
tions]
[Accid
ent O
pera
tions]
alt
[Norm
al O
pera
tions]
[Accid
ent O
pera
tions]
alt
Data
used b
y s
oftw
are
2:
Data
Sto
red in 1
-min
ute
inte
rvals
as G
ood o
r B
adM
alfunctionin
g P
ackets
5:
Data
als
o s
tore
d in 1
-min
ute
inte
rvals
as G
ood o
r B
adM
alfunctionin
g P
ackets
6:
Data
record
ed a
nd g
oes to c
om
pute
r1:
Dat goes to m
onitor
for
dis
pla
y3:
Data
used b
y
4:
Old
est excessiv
e G
ood d
ata
is r
etr
ieved b
y D
ata
Rota
tor
once h
ard
drive r
eaches 7
0&
capacity, th
en this
data
is d
ele
ted =
9:
Accid
ent U
sed C
ase M
echanis
ms
10: O
ldest excessiv
e G
ood d
ata
is r
etr
ieved b
y D
ata
Rota
tor
once h
ard
drive fill
s u
p to 7
0%
, th
en this
data
is d
ele
ted =
7:
Accid
ent U
sed C
ase M
echanis
ms
8:
Fig
ure
4.4
:G
ener
al
Cam
era
Op
erati
on
Seq
uen
ceD
iagra
m
27
OB
D II-
Co
mp
ute
r U
SB
In
terf
ace
Exte
rnal H
ard
-Dri
ve U
SB
In
terf
ace
Data
Ro
tato
r S
oft
ware
OB
D II D
iag
no
sti
cs C
on
necto
rO
BD
II D
iag
no
sti
cs S
oft
ware
Mo
nit
or
US
B In
terf
ace
Co
mp
ute
r H
ard
-Dri
ve
Veh
icle
Bu
sE
xte
rnal H
ard
-Dri
ve
Mem
ory
Sen
so
r S
yste
ms
Mo
nit
or
CP
U
[Norm
al O
pera
tions]
[Accid
ent O
pera
tions]
alt
[Norm
al O
pera
tions]
[Accid
ent O
pera
tions]
alt
Data
pla
ced in m
em
ory
for
pro
cessin
g4:
Relia
bili
ty U
sed C
ase M
echanis
m19:
Old
est excessiv
e G
ood d
ata
is d
ele
ted b
y s
oftw
are
18:
Data
sto
red in e
xte
rnal hard
-drive for
redundancy
16:
Data
Sto
red in 1
-min
ute
inte
rvals
as G
ood o
r B
adM
alfunctionin
g P
ackets
14:
15:
Data
subm
itte
d to the c
om
pute
r via
US
B inte
rface
3:
New
manip
ula
ted d
ata
goes to m
em
ory
8:
Monitor
dis
pla
ys s
oftw
are
data
12:
Old
est excessiv
e G
ood d
ata
is r
etr
ieved b
y D
ata
Rota
tor
once h
ard
drive r
eaches70%
capacity, th
en this
data
is d
ele
ted =
Com
ponent =
20:
Relia
bili
ty U
sed C
ase M
echanis
ms
21:
Data
goes to O
BD
II connecto
r pin
s2:
Old
est excessiv
e G
ood d
ata
is r
etr
ieved b
y D
ata
Rota
tor
once h
ard
drive r
eaches 7
0%
capacity
17:
Data
goes to m
onitor
via
usb c
able
11:
Data
to b
e u
sed b
y D
ata
Rota
tor
Softw
are
13:
Softw
are
uses d
ata
for
calc
ula
tions a
nd o
ther
usages
7:
CP
U fetc
hes d
ata
to d
ecode a
nd e
xecute
5: C
PU
fetc
hes d
ata
to d
ecode a
nd e
xecute
19:
Syste
ms r
oute
data
to b
us
1:
CP
U s
tore
s d
ata
in m
em
ory
6: CP
U s
tore
s d
ata
back in m
em
ory
10:
Fig
ure
4.5
:Seq
uen
ceD
iagra
mof
On-B
oard
Dia
gn
ost
ics
Op
erati
on
28
GP
S R
ec
eiv
er
Re
ce
ive
r U
SB
In
terf
ac
eE
xte
rna
l H
ard
-Dri
ve
US
B I
nte
rfa
ce
Da
ta R
ota
tor
So
ftw
are
GP
S R
ec
eiv
er
GP
S
So
ftw
are
Mo
nit
or
US
B I
nte
rfa
ce
Co
mp
ute
r H
ard
-Dri
ve
Ex
tern
al
Ha
rd-D
riv
eM
em
ory
Mo
nit
or
CP
U
[No
rma
l O
pe
ratio
ns]
[Accid
en
t O
pe
ratio
ns]
alt
[No
rma
l O
pe
ratio
ns]
[Accid
en
t O
pe
ratio
ns]
alt
Da
ta p
lace
d in
me
mo
ry f
or
pro
ce
ssin
g2
:
Re
liab
ility
Use
d C
ase
Me
ch
an
ism
17
:
Old
est
exce
ssiv
e G
oo
d d
ata
is d
ele
ted
by s
oft
wa
re1
6:
Da
ta s
tore
d in
exte
rna
l h
ard
-drive
fo
r re
du
nd
an
cy
14
:
Da
ta S
tore
d in
1-m
inu
te in
terv
als
as G
oo
d o
r B
ad
Ma
lfu
nctio
nin
g P
acke
ts1
2:
13
:
Da
ta s
ub
mitte
d t
o t
he
co
mp
ute
r via
US
B c
ab
le
1:
Ne
w m
an
ipu
late
d d
ata
go
es t
o m
em
ory
6:
Mo
nito
r d
isp
lays s
oft
wa
re d
ata
10
:
Old
est
exce
ssiv
e G
oo
d d
ata
is r
etr
ieve
d b
y D
ata
Ro
tato
r o
nce
ha
rdd
rive
re
ach
es 7
0%
ca
pa
city,
the
n t
his
da
ta is d
ele
ted
= =
1
8:
Re
liab
ility
Use
d C
ase
Me
ch
an
ism
s1
9:
Old
est
exce
ssiv
e G
oo
d d
ata
is r
etr
ieve
d b
y D
ata
Ro
tato
r o
nce
ha
rdd
rive
re
ach
es 7
0%
ca
pa
city
15
:
Da
ta g
oe
s t
o m
on
ito
r via
usb
ca
ble
9:
Da
ta t
o b
e u
se
d b
y D
ata
Ro
tato
r S
oft
wa
re1
1:
So
ftw
are
use
s d
ata
fo
r ca
lcu
latio
ns a
nd
oth
er
usa
ge
s5
:
CP
U f
etc
he
s d
ata
to
de
co
de
an
d e
xe
cu
te3
: CP
U f
etc
he
s d
ata
to
de
co
de
an
d e
xe
cu
te1
7:
CP
U s
tore
s d
ata
in
me
mo
ry4
:
CP
U s
tore
s d
ata
ba
ck in
me
mo
ry8
:
Fig
ure
4.6
:Seq
uen
ceD
iagra
mof
GP
SO
per
ati
on
29

Ca
me
ra R
ec
eiv
er
US
B I
nte
rfa
ce
Ex
tern
al
Ha
rd-D
riv
e U
SB
In
terf
ac
eD
ata
Ro
tato
r S
oft
wa
reC
am
era
sC
am
era
So
ftw
are
Mo
nit
or
US
B I
nte
rfa
ce
Co
mp
ute
r H
ard
-Dri
ve
Ex
tern
al
Ha
rd-D
riv
eM
em
ory
Mo
nit
or
CP
U
[No
rma
l O
pe
ratio
ns]
[Accid
en
t O
pe
ratio
ns]
alt
[No
rma
l O
pe
ratio
ns]
[Accid
en
t O
pe
ratio
ns]
alt
Da
ta p
lace
d in
me
mo
ry f
or
pro
ce
ssin
g2
:
Re
liab
ility
Use
d C
ase
Me
ch
an
ism
17
:
Old
est
exce
ssiv
e G
oo
d d
ata
is d
ele
ted
by s
oft
wa
re1
6:
Da
ta s
tore
d in
exte
rna
l h
ard
-drive
fo
r re
du
nd
an
cy
14
:
Da
ta S
tore
d in
1-m
inu
te in
terv
als
as G
oo
d o
r B
ad
Ma
lfu
nctio
nin
g P
acke
ts1
2:
13
:
Da
ta s
ub
mitte
d t
o t
he
co
mp
ute
r via
US
B c
ab
le
1:
Ne
w m
an
ipu
late
d d
ata
go
es t
o m
em
ory
6:
Mo
nito
r d
isp
lays s
oft
wa
re d
ata
10
:
Old
est
exce
ssiv
e G
oo
d d
ata
is r
etr
ieve
d b
y D
ata
Ro
tato
r o
nce
ha
rdd
rive
re
ach
es 7
0%
ca
pa
city,
the
n t
his
da
ta is d
ele
ted
= =
1
8:
Re
liab
ility
Use
d C
ase
Me
ch
an
ism
s1
9:
Old
est
exce
ssiv
e G
oo
d d
ata
is r
etr
ieve
d b
y D
ata
Ro
tato
r o
nce
ha
rdd
rive
re
ach
es 7
0%
ca
pa
city
15
:
Da
ta g
oe
s t
o m
on
ito
r via
usb
ca
ble
9:
Da
ta t
o b
e u
se
d b
y D
ata
Ro
tato
r S
oft
wa
re1
1:
So
ftw
are
use
s d
ata
fo
r ca
lcu
latio
ns a
nd
oth
er
usa
ge
s5
:
CP
U f
etc
he
s d
ata
to
de
co
de
an
d e
xe
cu
te3
: CP
U f
etc
he
s d
ata
to
de
co
de
an
d e
xe
cu
te1
7:
CP
U s
tore
s d
ata
in
me
mo
ry4
:
CP
U s
tore
s d
ata
ba
ck in
me
mo
ry8
:
Fig
ure
4.7
:Seq
uen
ceD
iagra
mof
Cam
era
Op
erati
on
30
Field Tech Check Power Power-On Connect Reader Log-In Download Data Log-Out Release Reader
Choose On -Site Mode Black Box is Off Tech Connects Reader
... Authen"cate
Access Data
Close Connec"on
Release Reader
Data Analyst Locate Vehicle Ini"ate Connec"on Log In Download Data Log Out
Track Vehicle with GPS
Launches Connec"on
Authen"cate
Access Data
Disconnect
...
Figure 4.8: Sequence Diagram of Retrieving Data
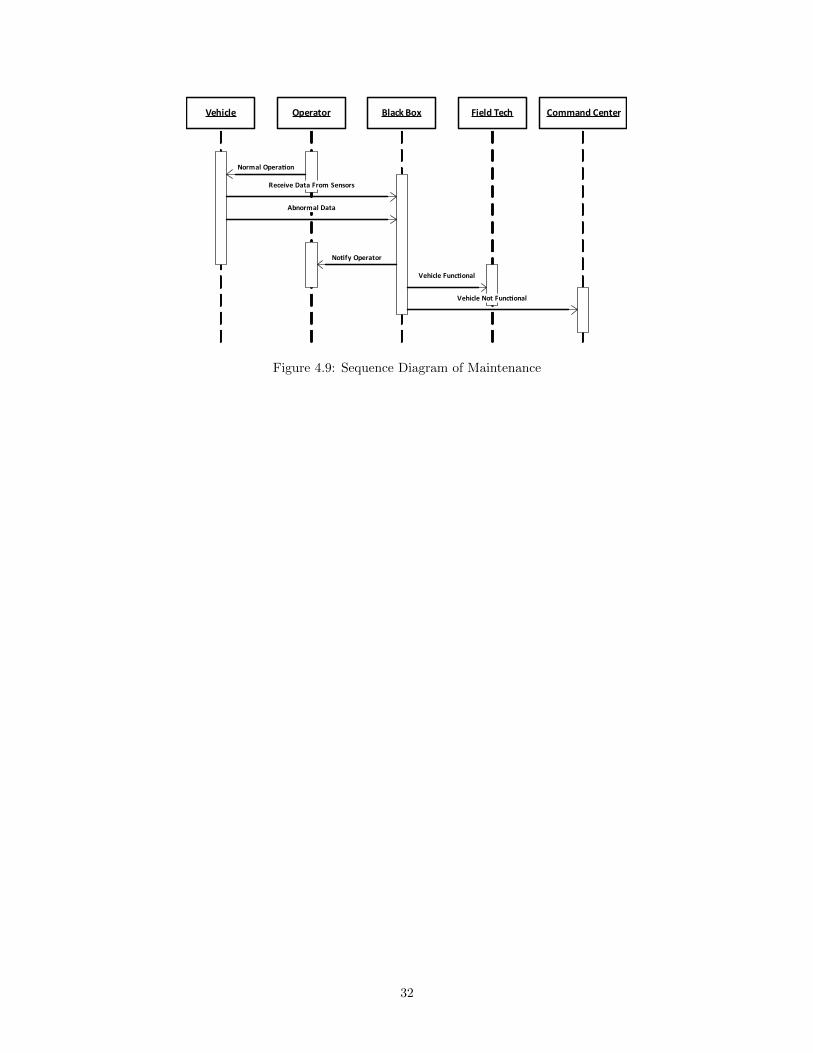
4.4 Use Case 5: Maintenance (Black Box System Maintenanceand Physical Data)
In Figure 4.9 we describe the sequence when the vehicle has malfunctioned.
31
Vehicle Operator Field Tech Command Center
Normal Opera!on
Black Box
Receive Data From Sensors
Abnormal Data
No!fy Operator
Vehicle Func!onal
Vehicle Not Func!onal
Figure 4.9: Sequence Diagram of Maintenance
32
Chapter 5
Requirements Engineering
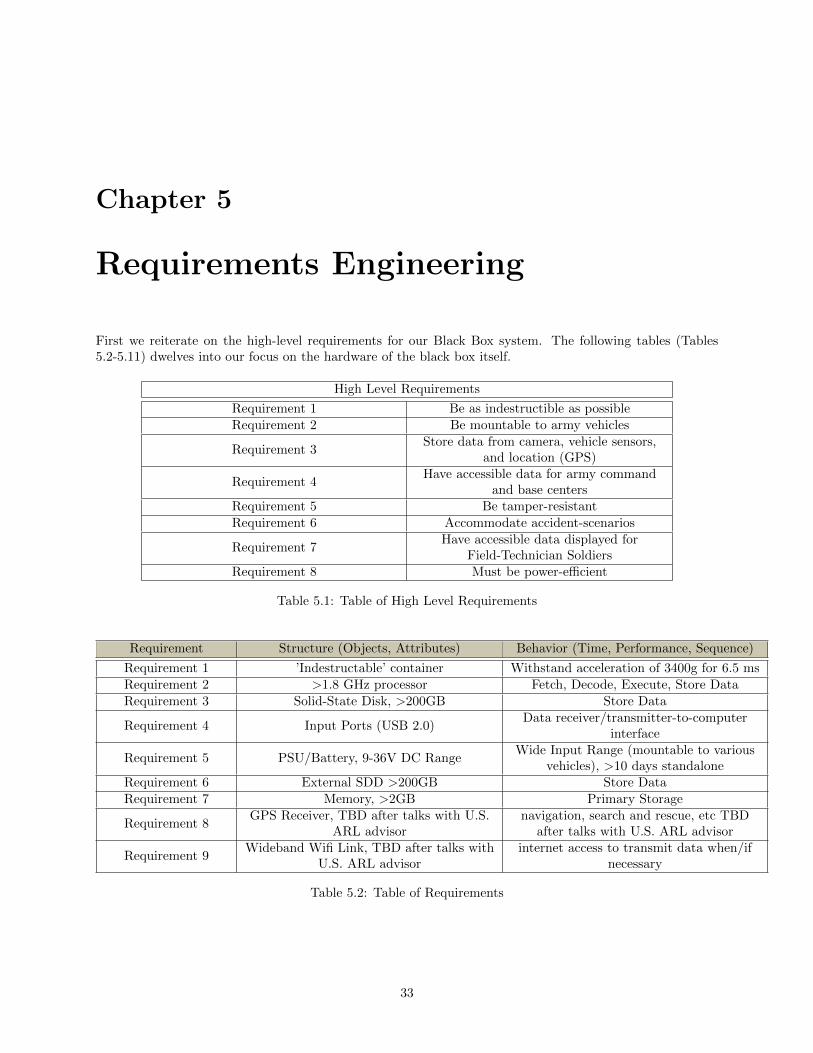
First we reiterate on the high-level requirements for our Black Box system. The following tables (Tables5.2-5.11) dwelves into our focus on the hardware of the black box itself.
High Level Requirements
Requirement 1 Be as indestructible as possible
Requirement 2 Be mountable to army vehicles
Requirement 3Store data from camera, vehicle sensors,
and location (GPS)
Requirement 4Have accessible data for army command
and base centersRequirement 5 Be tamper-resistant
Requirement 6 Accommodate accident-scenarios
Requirement 7Have accessible data displayed for
Field-Technician SoldiersRequirement 8 Must be power-efficient
Table 5.1: Table of High Level Requirements
Requirement Structure (Objects, Attributes) Behavior (Time, Performance, Sequence)
Requirement 1 ’Indestructable’ container Withstand acceleration of 3400g for 6.5 ms
Requirement 2 >1.8 GHz processor Fetch, Decode, Execute, Store Data
Requirement 3 Solid-State Disk, >200GB Store Data
Requirement 4 Input Ports (USB 2.0)Data receiver/transmitter-to-computer
interface
Requirement 5 PSU/Battery, 9-36V DC RangeWide Input Range (mountable to various
vehicles), >10 days standaloneRequirement 6 External SDD >200GB Store Data
Requirement 7 Memory, >2GB Primary Storage
Requirement 8GPS Receiver, TBD after talks with U.S.
ARL advisornavigation, search and rescue, etc TBD
after talks with U.S. ARL advisor
Requirement 9Wideband Wifi Link, TBD after talks with
U.S. ARL advisorinternet access to transmit data when/if
necessary
Table 5.2: Table of Requirements
33

Index Requirement
CT1 Withstand >3400g of force
CT2 Withstand 3400g force for at least 6.5 milliseconds
CT3 Be at least 99% reliable
CT4 Cost < TBD
Table 5.3: Container Requirements
Index Requirement
PRC1 Be at least 99% reliable
PRC2 Processor Speed >1.8 GHz
PRC3 Able to run several processes at once
PRC4 Cost <$600
Table 5.4: Processor Requirements
Index Requirement
CHD1 Be at least 99% reliable
CHD2 Storage >200GB
CHD3 Dependence from Trusted Platform Module Software (additional cost)
CHD4 Cost < $3000
Table 5.5: SSD Requirements
Index Requirement
IP1 Be at least 99% reliable
IP2 USB 2.0
IP3 DC Connector
Table 5.6: Input Port Requirements
Index Requirement
PSU1Standalone battery only power black box/cameras (for first 30 minutes) and
locator beacon (after 30 minutes) upon car battery failurePSU2 Power system for at least >10 hours standalone
PSU3 Black box is compatible with at least 9V-36V battery input range
PSU4 Cost <$1000
PSU5 Be at least 99% reliable
Table 5.7: PSU/Battery Requirements
Index Requirement
EHD1 Be at least 99% reliable.
EHD2 Storage >200GB
EHD3 Dependence from Trusted Platform Module Software (additional cost)
EHD4 Cost <$3000
Table 5.8: External/Redundant SSD Requirements
34
Index Requirement
RAM1 Be at least 99% reliable
RAM2 Primary Storage >2 GB
RAM3 Cost <$200
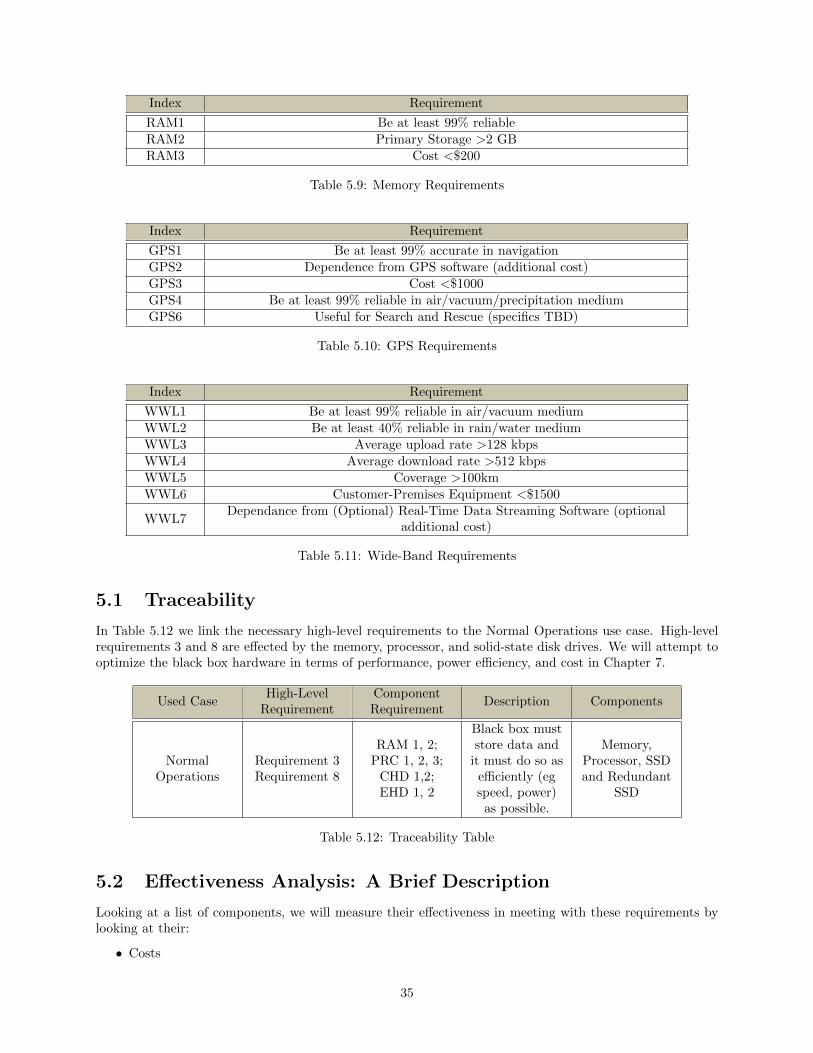
Table 5.9: Memory Requirements
Index Requirement
GPS1 Be at least 99% accurate in navigation
GPS2 Dependence from GPS software (additional cost)
GPS3 Cost <$1000
GPS4 Be at least 99% reliable in air/vacuum/precipitation medium
GPS6 Useful for Search and Rescue (specifics TBD)
Table 5.10: GPS Requirements
Index Requirement
WWL1 Be at least 99% reliable in air/vacuum medium
WWL2 Be at least 40% reliable in rain/water medium
WWL3 Average upload rate >128 kbps
WWL4 Average download rate >512 kbps
WWL5 Coverage >100km
WWL6 Customer-Premises Equipment <$1500
WWL7Dependance from (Optional) Real-Time Data Streaming Software (optional
additional cost)
Table 5.11: Wide-Band Requirements
5.1 Traceability
In Table 5.12 we link the necessary high-level requirements to the Normal Operations use case. High-levelrequirements 3 and 8 are effected by the memory, processor, and solid-state disk drives. We will attempt tooptimize the black box hardware in terms of performance, power efficiency, and cost in Chapter 7.
Used CaseHigh-Level
RequirementComponentRequirement
Description Components
NormalOperations
Requirement 3Requirement 8
RAM 1, 2;PRC 1, 2, 3;
CHD 1,2;EHD 1, 2
Black box muststore data and
it must do so asefficiently (egspeed, power)as possible.
Memory,Processor, SSDand Redundant
SSD
Table 5.12: Traceability Table
5.2 Effectiveness Analysis: A Brief Description
Looking at a list of components, we will measure their effectiveness in meeting with these requirements bylooking at their:
• Costs
35

• Performance (ability of component to accomplish requirement)
• Power Efficiency
Our trade-off analysis will look forward to accomplish the 3 following variables:
• Minimum Cost of System Implementation
• Maximum Power Efficiency of System Components
• Maximum Performance of System Components
5.3 Library
Here is a library of components that we have available. Using these components, we will be doing a trade-offanalysis between the memory, processor, and the SSD as there are a few different options for them.
Component Performance NormalizedPerformance
Normalized PowerEfficiency
Cost
WiFi Link (A) Coverage (km)WWL1 2000 1 1 $300.00
Input Ports (B) Speed (MB/s)IP1 480 1 1 $20.00
Container (C) Force (g)CT1 3400 1 1 $8,000.00
PSU (D) Lifetime (days)PSU1 30 1 1 $1,000.00
SSD/ExternalSSD(E)
Storage (GB)
HD1 960GB 1 0.6 $2,900.00HD2 480GB 0.5 0.8 $1,300.00HD3 200GB 0.21 1 $600.00
Processor (F) Processing Speed(GHz)
PRC1 3 1 0.72 $550.00PRC2 2.66 0.89 0.85 $270.00PRC3 2.26 0.75 1 $210.00
Memory (G) Primary Storage(GB)
RAM1 8GB 1 0.63 $200.00RAM2 4GB 0.5 0.81 $130.00RAM3 2GB 0.25 1 $65.00
GPS Receiver (H) MappingAccuracy (%)
GPS1 99.00% 1 1 $500.00
Table 5.13: Library of System Components
36

Chapter 6
System-Level Design
6.1 System Structure
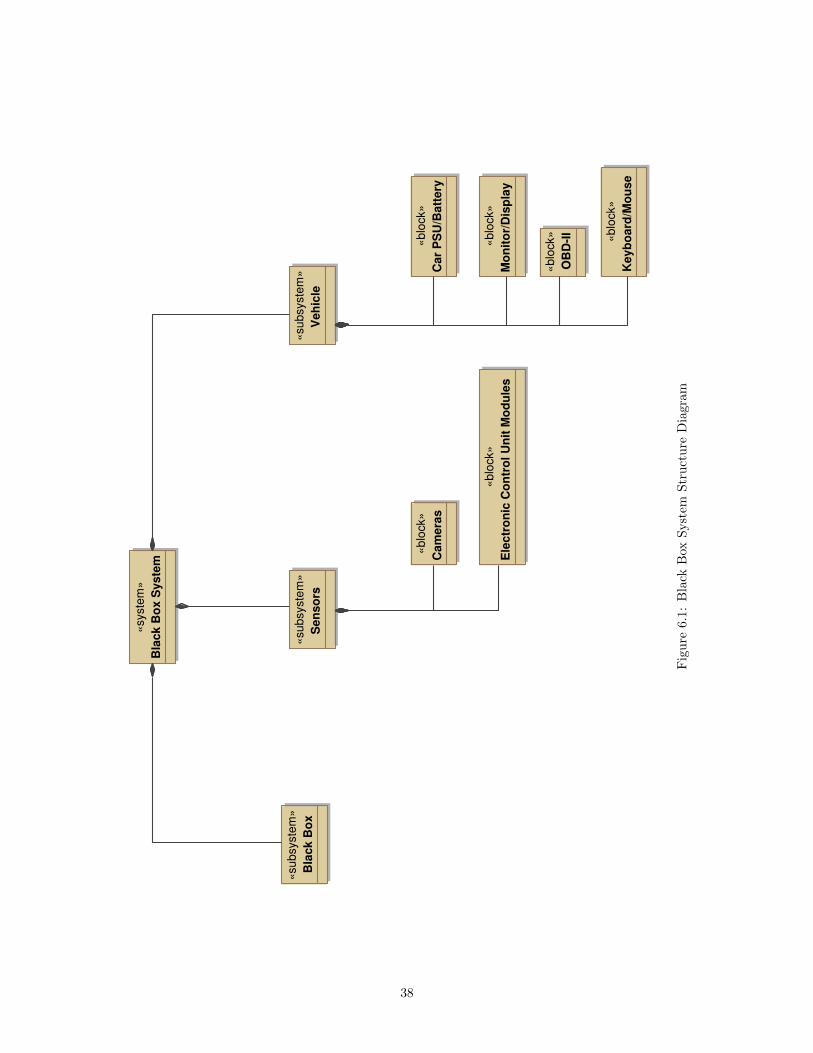
Figure 6.1 shows the general structure of the whole black box system, whereas Figure 6.2 focuses on theblack box itself (inside the ’indestructable containter’) and all the hardware/software involved in it
«block»
Real-Time Data Streaming (Optional)
«block»
'Indestructable' Cover/Container
«block»
OBD-II Diagnostic Software
«block»
Trusted Platform Module
«block»
Data Rotator Program
«block»
Operating Software
«block»
Wideband Wifi Link
«block»
External Hard Drive
«block»
Camera Software
«block»
GPS Software
«block»
Memory/CPU
«block»
GPS Receiver
«subsystem»
Software
«subsystem»
Black Box
«subsystem»
Hardware
«block»
PSU/Battery
«block»
Input Ports
«block»
Processor
«block»
Hard Drive
Figure 6.2: Black Box Structure Diagram
37
«blo
ck»
Ele
ctr
on
ic C
on
tro
l U
nit
Mo
du
les
«syste
m»
Bla
ck B
ox S
yste
m
«blo
ck»
Keyb
oard
/Mo
use
«blo
ck»
Car
PS
U/B
att
ery
«blo
ck»
Mo
nit
or/
Dis
pla
y
«subsyste
m»
Sen
so
rs
«subsyste
m»
Veh
icle
«subsyste
m»
Bla
ck B
ox
«blo
ck»
Cam
era
s
«blo
ck»
OB
D-I
I
Fig
ure
6.1
:B
lack
Box
Syst
emS
truct
ure
Dia
gra
m
38
Chapter 7
Simplified Approach to TradeoffAnalysis
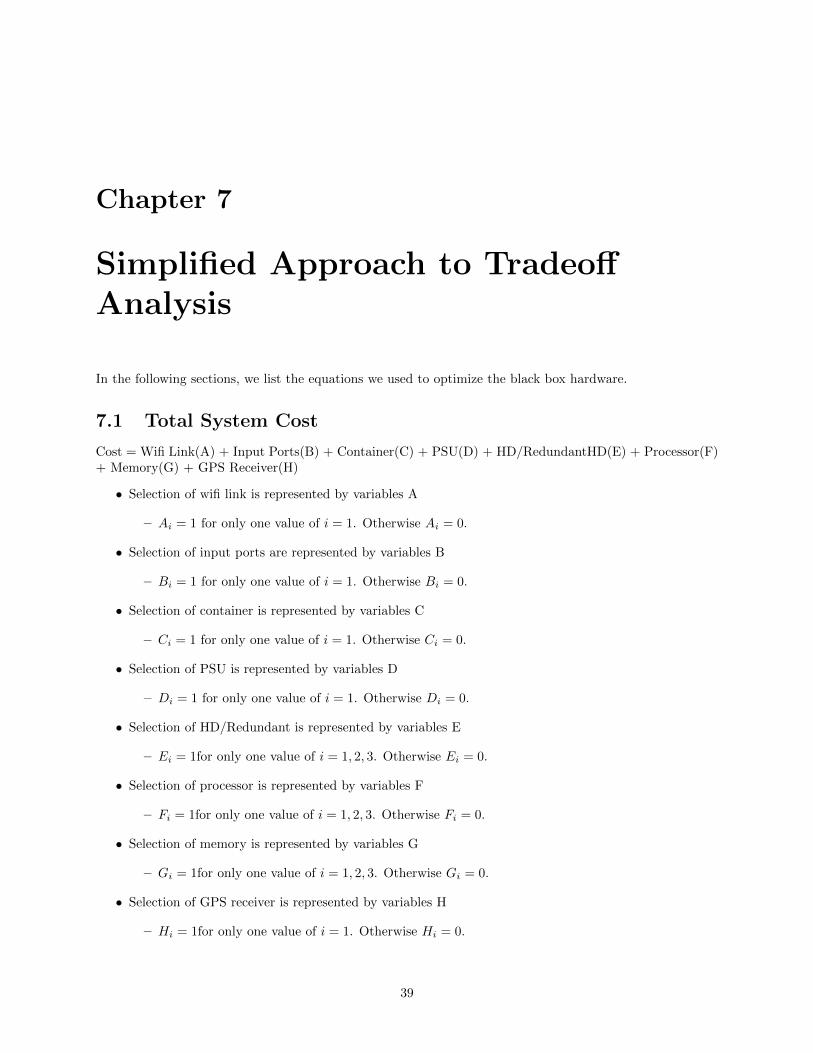
In the following sections, we list the equations we used to optimize the black box hardware.
7.1 Total System Cost
Cost = Wifi Link(A) + Input Ports(B) + Container(C) + PSU(D) + HD/RedundantHD(E) + Processor(F)+ Memory(G) + GPS Receiver(H)
• Selection of wifi link is represented by variables A
– Ai = 1 for only one value of i = 1. Otherwise Ai = 0.
• Selection of input ports are represented by variables B
– Bi = 1 for only one value of i = 1. Otherwise Bi = 0.
• Selection of container is represented by variables C
– Ci = 1 for only one value of i = 1. Otherwise Ci = 0.
• Selection of PSU is represented by variables D
– Di = 1 for only one value of i = 1. Otherwise Di = 0.
• Selection of HD/Redundant is represented by variables E
– Ei = 1for only one value of i = 1, 2, 3. Otherwise Ei = 0.
• Selection of processor is represented by variables F
– Fi = 1for only one value of i = 1, 2, 3. Otherwise Fi = 0.
• Selection of memory is represented by variables G
– Gi = 1for only one value of i = 1, 2, 3. Otherwise Gi = 0.
• Selection of GPS receiver is represented by variables H
– Hi = 1for only one value of i = 1. Otherwise Hi = 0.
39
7.2 Formula for System Cost
• CostC = CWWL1A1 + CIP1B1 + CCT1C1 + CPSU1D1 + CHD1E1 + CHD2E2 + CHD3E3 + CPRC1F1 +CPRC2F2 + CPRC3F3 + CRAM1G1 + CRAM2G2 + CRAM3G3 + CGPS1H1
• CostC = 300A1 + 20B1 + 8000C1 + 1000D1 + 2900E1 + 1300E2 + 600E3 + 550F1 + 270F2 + 210F3 +200G1 + 130G2 + 65G3 + 500H1
7.3 System Performance
• P = PWWL1A1+PIP1B1+PCT1C1+PPSU1D1+PHD1E1+PHD2E2+PHD3E3+PPRC1F1+PPRC2F2+PPRC3F3 + PRAM1G1 + PRAM2G2 + PRAM3G3 + PGPS1H1
• P = 2000A1 + 480B1 + 3400C1 + 30D1 + 960E1 + 480E2 + 200E3 + 3.0F1 + 2.66F2 + 2.26F3 + 8G1 +4G2 + 2G3 + 0.99H1
7.4 Constraints
• $10000 < Cost < $14000
• 6 < norm(Performance) < 8
• 6.5 < norm(PowerEfficiency) < 8
• A1 = 1
• B1 = 1
• C1 = 1
• D1 = 1
• E1 + E2 + E3 = 1
• F1 + F2 + F3 = 1
• G1 + G2 + G3 = 1
• H1 = 1
7.5 Minimize
• 290E1 + 130E2 + 60E3 + 55F1 + 27F2 + 21F3 + 20G1 + 13G2 + 6.5G3
7.6 Subject To:
• 1.2 ≤ 1E1 + 0.5E2 + 0.21E3 + 1F1 + 0.887F2 + 0.75F3 + 1G1 + 0.5G2 + 0.25G3 ≤ K1
• K2 ≤ 0.6E1 + 0.8E2 + 1E3 + 0.72F1 + 0.85F2 + 1F3 + 0.63G1 + 0.81G2 + 1G3 ≤ 3
• E1 + E2 + E3 = 1
• F1 + F2 + F3 = 1
• G1 + G2 + G3 = 1
40

7.7 Bounds
• 0 ≤ A1 ≤ 1
• 0 ≤ B1 ≤ 1
• 0 ≤ C1 ≤ 1
• 0 ≤ D1 ≤ 1
• 0 ≤ E1 ≤ 1
• 0 ≤ E2 ≤ 1
• 0 ≤ E3 ≤ 1
• 0 ≤ F1 ≤ 1
• 0 ≤ F2 ≤ 1
• 0 ≤ F3 ≤ 1
• 0 ≤ G1 ≤ 1
• 0 ≤ G2 ≤ 1
• 0 ≤ G3 ≤ 1
• 0 ≤ H1 ≤ 1
7.8 Value Constraints
• A1, B1, C1, D1, E1, E2, E3, F1, F2, F3, G1, G2, G3, H1 are integers
• Change to value of K1 and K2 to get various points with different costs, power factors, and performance
7.9 Trade-Off Analysis
For the black box hardware, we can perform trade-off analysis on the memory, processor, and solid statedrive to optimize performance, power efficiency, and cost.
Point Cost Performance Power Factor
1 3650 3.00 1.954 3370 2.89 2.087 3310 2.75 2.2310 2050 2.50 2.1513 1770 2.39 2.2817 1640 1.75 2.6122 1070 2.10 2.4824 935 1.35 2.8527 875 1.21 3.00
41
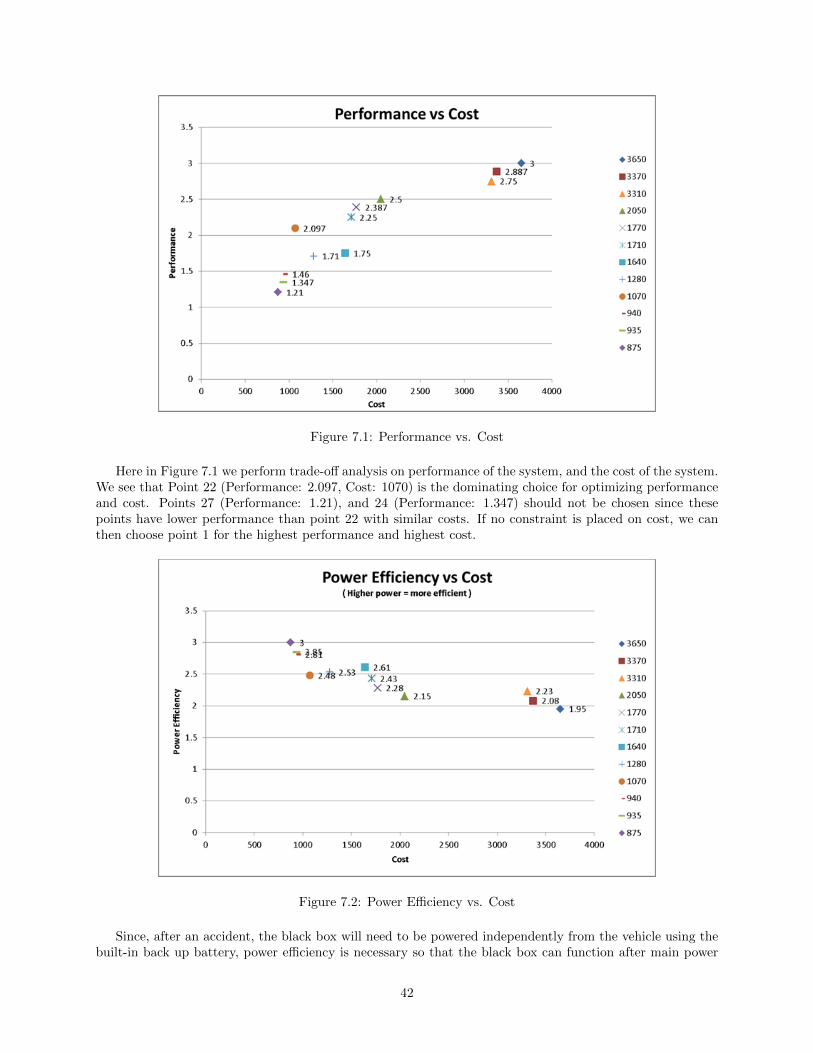
Figure 7.1: Performance vs. Cost
Here in Figure 7.1 we perform trade-off analysis on performance of the system, and the cost of the system.We see that Point 22 (Performance: 2.097, Cost: 1070) is the dominating choice for optimizing performanceand cost. Points 27 (Performance: 1.21), and 24 (Performance: 1.347) should not be chosen since thesepoints have lower performance than point 22 with similar costs. If no constraint is placed on cost, we canthen choose point 1 for the highest performance and highest cost.
Figure 7.2: Power Efficiency vs. Cost
Since, after an accident, the black box will need to be powered independently from the vehicle using thebuilt-in back up battery, power efficiency is necessary so that the black box can function after main power
42
is lost. In Figure 7.2 we attempt to optimize power efficiency of the hardware and cost of the black box.We see in 7.2 no points are dominating, however, since we want to maximize power efficiency, we can choosepoint 27 as this has the lowest cost, and highest power efficiency.
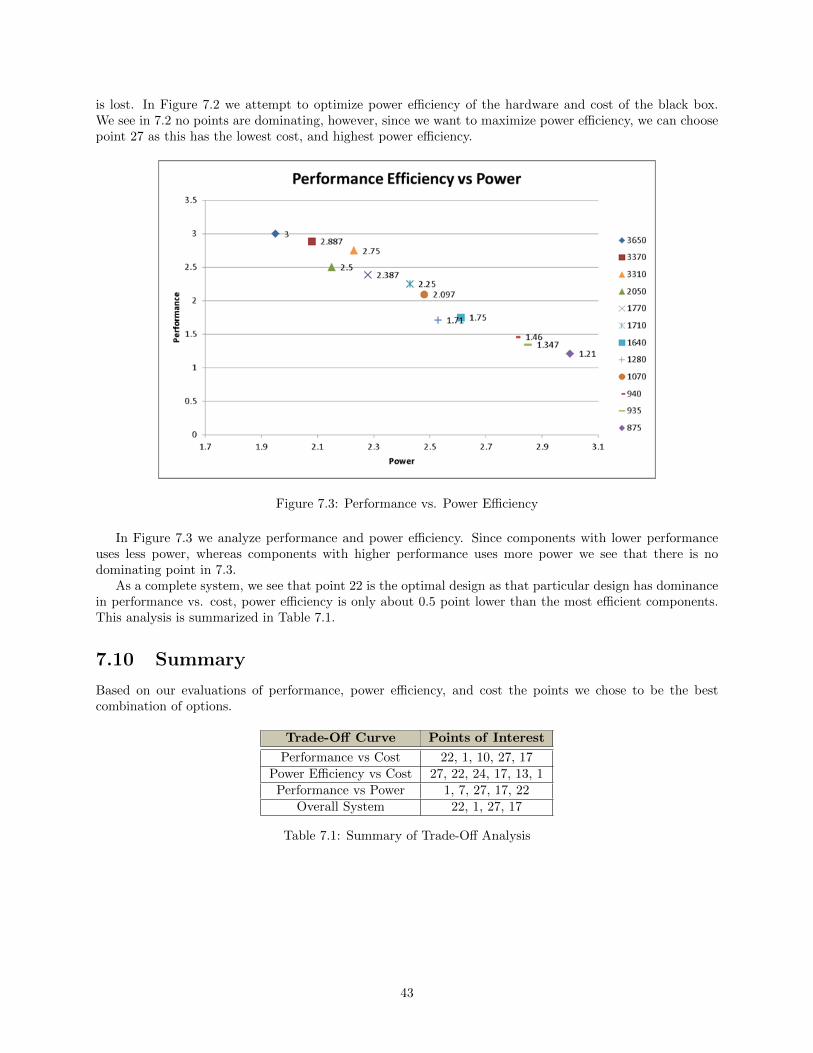
Figure 7.3: Performance vs. Power Efficiency
In Figure 7.3 we analyze performance and power efficiency. Since components with lower performanceuses less power, whereas components with higher performance uses more power we see that there is nodominating point in 7.3.
As a complete system, we see that point 22 is the optimal design as that particular design has dominancein performance vs. cost, power efficiency is only about 0.5 point lower than the most efficient components.This analysis is summarized in Table 7.1.
7.10 Summary
Based on our evaluations of performance, power efficiency, and cost the points we chose to be the bestcombination of options.
Trade-Off Curve Points of Interest
Performance vs Cost 22, 1, 10, 27, 17Power Efficiency vs Cost 27, 22, 24, 17, 13, 1Performance vs Power 1, 7, 27, 17, 22
Overall System 22, 1, 27, 17
Table 7.1: Summary of Trade-Off Analysis
43
Chapter 8
System-Component Testing(Validation/Verification)
The two questions that we will try to answer:
• Are we building the right product?
• Are we building the product right?
We will do a brief system-component testing on the requirements from our traceability matrix that have todeal with our trade-off analysis. These are requirements RAM2, PRC2, PRC3, CHD2, and EHD2.
• RAM2: Primary Storage > 2GB
– Testing RAM2 : test the memory with a computer to make sure it reaches requirement
• PRC2: Processor Speed > 1.8 GHz
– Testing PRC2 : test the processor’s speed with a computer to make sure it reaches req.
• PRC3: Able to run several processes at once
– Demonstration PRC3 : demonstrate that the processor meets this req. with a computer.
• CHD2: Storage > 200GB
– Testing CHD2 : Check the storage amount with a computer to make sure it reaches req.
• EHD2: Storage > 200GB
– Testing EHD2 : Same as Testing CHD2
44
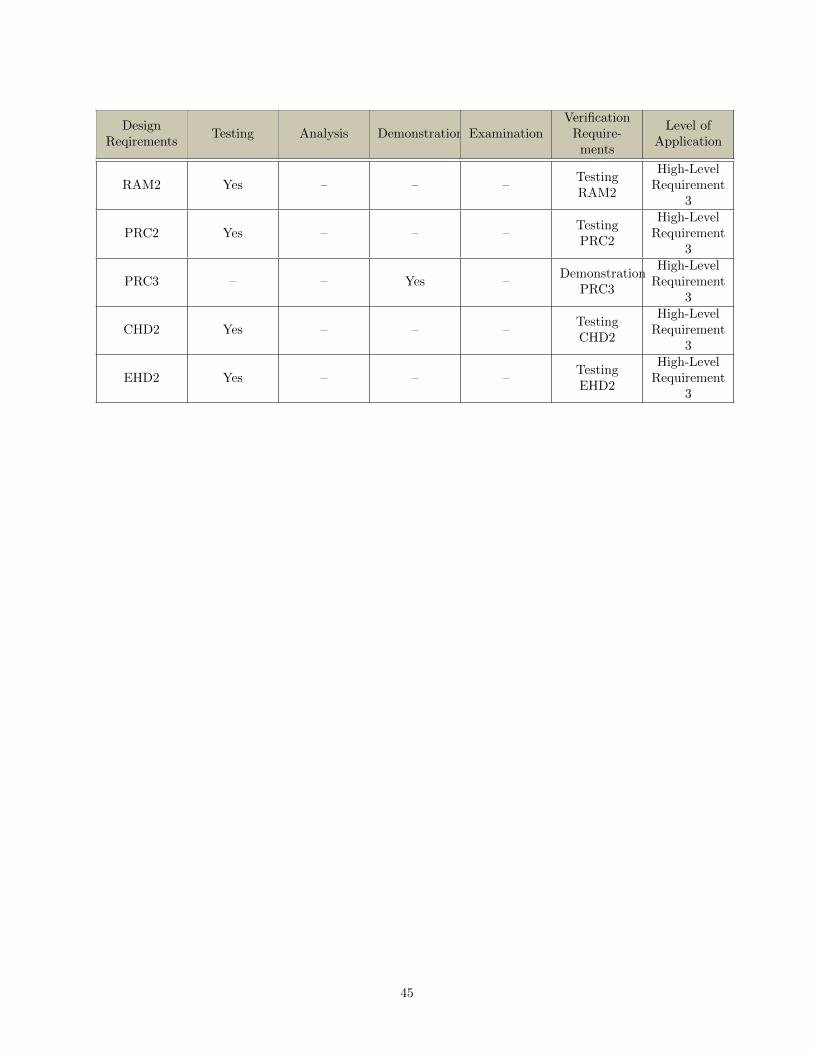
DesignReqirements
Testing Analysis Demonstration ExaminationVerification
Require-ments
Level ofApplication
RAM2 Yes – – –TestingRAM2
High-LevelRequirement
3
PRC2 Yes – – –TestingPRC2
High-LevelRequirement
3
PRC3 – – Yes –Demonstration
PRC3
High-LevelRequirement
3
CHD2 Yes – – –TestingCHD2
High-LevelRequirement
3
EHD2 Yes – – –TestingEHD2
High-LevelRequirement
3
45
Chapter 9
Appendix
9.1 Key Terms and Definitions
• Cockpit Recorders: Records vehicle interior conversations, ambient sounds (internal and external),radio communications between base/command center and vehicle, time of each radio message trans-mission, continuously record cockpit instrumentation, the outside viewing area, engine sounds, radiocommunications, and ambient cockpit sounds
• Data Recorder: Records speed, direction of travel, tilt, distance, throttle position, impact/shock(from impact sensors), operation of horns/headlights, seat belts, air bags, impact acceleration, mate-rial degradation, engine performance, control and actuator positions, time of day, geographical posi-tion(from GPS and/or beacon), ECU data, OBD-II data, passenger sensors, weaponry system data,tire pressure
• Data Rotater Software: A theoretical software that stores data in 1-minute bundles, designatedas ’bad’ for problematic/malfunctioning/error data and ’good’ for non-problematic data. The datarotater deletes the oldest ’good’ data if the solid state drive’s capacity reaches 70%. In case of anaccident, it does not delete data and records until full if there is a main car power loss but enablessystem to act under Normal Operations (see used case ’normal operations’) for 30 minutes and thenswitches to work as a locater beacon if the main car power is not cut off’
• Disk Redundancy: A set of two disks to provide data reliability
• GPS/Navigation: Provides location data of the vehicle
• Impact Sensor Network: A network of pressure sensors located on the vehicles exterior frame todetermine the impact location
• OBD II: Vehicles sensor network to provide vehicle’s health and status information
• Power Supply: Provides power to the backup battery and to the internal components of the BlackBox
• Pressure Sensors: Provides passenger seating arrangements
• Quick Access Recorder: Records fuel flow, cockpit and outside temperatures, fuel tank levels
• Sensor Subsystem: The different sensor systems in the vehicle, coming from the vehicle’s variouselectronic control unit modules, is routed to the OBD-II, which we connect our black box system toread off the data.
• Trusted Platform Module (TPM): Data security requiring a dongle when retrieving data withphysical access to the Black Box
46

• Wireless Link: Provides a communication link between the vehicle and the Command Center. Allowsfor secure remote access to the vehicle’s Black Box data through the use of a unique identifier.
47

Bibliography
[1] Class Notes
[2] http://www.bavariantechnic.com/
48


![Simulation-Based Design Using SysML - Part 2: Celebrating ...austin/enes489p/lecture-resources/SysML-Simulation-Part2...[OMG, 2007a] and COBs support engineering analysis templates](https://static.fdocuments.in/doc/165x107/5ecf4b86ef0e483c994b6a59/simulation-based-design-using-sysml-part-2-celebrating-austinenes489plecture-resourcessysml-simulation-part2.jpg)