· PDF fileMaster Black Belt(LSS), ... Kalicharan Sabath BE(Mech.), MBA (Operations and...
5
Volume No: 1 (2016), Issue No: 7 (July) July 2016 www. IJRMS.com Page 6 Abstract: The fast changing economic conditions such as global competition, customer demand for high quality product, product variety and reduced lead– time, declining profit margin etc. had a major impact on manufacturing indus- tries. To respond to these needs various industrial engi- neering and quality management strategies such as ISO 9000, TQM, Kaizen, JIT manufacturing, Enterprise Re- source Planning, Business Process Reengineering, Lean management etc. have been developed. A new paradigm in this area of manufacturing strategies is Six sigma. The Six Sigma approach has been increasingly adopted world- wide in the manufacturing sector in order to enhance pro- ductivity and quality performance and to make the process robust to quality variations. The Objective of this paper is to present sort out problems in brainstorm session. Where continuous improvement requires creativity or path to the accelerating growth of the organization vision. Key Words: Fish bone, Brainstrom, flexible Hoshin Kanri,Lotus, Variation. Introduction: People are responsible for the Problem. The problem may have been caused by people who are inexperienced, who cannot attend problems promptly and so on. Problems are defects in a product or service that cost organization money. Rayabarapu Ramakrishna B.Tech(IT), MBA(HRM), Master Black Belt(LSS), Ushaa Technologies, Hyderabad. Kalicharan Sabath BE(Mech.), MBA (Operations and Finance), UGC-NET, (Ph. D) Green Belt(LSS),VJIM,Hyderabad. Fig : Brainstorming Eg: Organizations face rising costs and increasing compe- tition every day. Six Sigma increases revenue by enabling your organization to do more with less – Sell, manufac- ture and provide more products or services using less re- sources. Six Sigma DMAIC(Define–Measure-Analyze- Improve-Control) methodology in production process which provides a framework to identify, quantify and eliminate sources of variation in an operational process. THINK OUT OF THE BOX The organization or work place limited by range of cat- egories. Categorize: According to National Institute of Standards and Technol- ogy (NIST), when we apply the Fishbone technique to solve business problems, the possible causes are usually classified into six generic categories: Fig : Thinking in a direction Lean Six Sigma as a Tool for Reducing Variations and Business Transformations
-
Upload
nguyentram -
Category
Documents
-
view
222 -
download
0
Transcript of · PDF fileMaster Black Belt(LSS), ... Kalicharan Sabath BE(Mech.), MBA (Operations and...
Volume No: 1 (2016), Issue No: 7 (July) July 2016 www. IJRMS.com Page 6
Volume No: 1 (2016), Issue No: 7 (July) July 2016 www. IJRMS.com Page 7
Abstract:The fast changing economic conditions such as global competition, customer demand for high quality product, product variety and reduced lead– time, declining profit margin etc. had a major impact on manufacturing indus-tries. To respond to these needs various industrial engi-neering and quality management strategies such as ISO 9000, TQM, Kaizen, JIT manufacturing, Enterprise Re-source Planning, Business Process Reengineering, Lean management etc. have been developed. A new paradigm in this area of manufacturing strategies is Six sigma. The Six Sigma approach has been increasingly adopted world-wide in the manufacturing sector in order to enhance pro-ductivity and quality performance and to make the process robust to quality variations. The Objective of this paper is to present sort out problems in brainstorm session. Where continuous improvement requires creativity or path to the accelerating growth of the organization vision.
Key Words: Fish bone, Brainstrom, flexible Hoshin Kanri,Lotus, Variation.
Introduction:People are responsible for the Problem. The problem may have been caused by people who are inexperienced, who cannot attend problems promptly and so on. Problems are defects in a product or service that cost organization money.
Rayabarapu Ramakrishna B.Tech(IT), MBA(HRM),Master Black Belt(LSS),
Ushaa Technologies, Hyderabad.
Kalicharan Sabath BE(Mech.), MBA (Operations and Finance),
UGC-NET, (Ph. D)Green Belt(LSS),VJIM,Hyderabad.
Fig : BrainstormingEg: Organizations face rising costs and increasing compe-tition every day. Six Sigma increases revenue by enabling your organization to do more with less – Sell, manufac-ture and provide more products or services using less re-sources. Six Sigma DMAIC(Define–Measure-Analyze-Improve-Control) methodology in production process which provides a framework to identify, quantify and eliminate sources of variation in an operational process.
THINK OUT OF THE BOXThe organization or work place limited by range of cat-egories.
Categorize:According to National Institute of Standards and Technol-ogy (NIST), when we apply the Fishbone technique to solve business problems, the possible causes are usually classified into six generic categories:
Fig : Thinking in a direction
Lean Six Sigma as a Tool for Reducing Variations and Business Transformations

Volume No: 1 (2016), Issue No: 7 (July) July 2016 www. IJRMS.com Page 6
Volume No: 1 (2016), Issue No: 7 (July) July 2016 www. IJRMS.com Page 7
1.Method2.Man3.Management4.Mother Nature5.Material6.Machine
Category and Description:Method: Methods are ways of doing things or the Proce-dures followed to accomplish a task.
Man:Anyone involved with the process.
Management:Management refers to project management;Poor management Decisions/Thoughts.
Mother Nature:Temperature ,Humidity,Atmospheric pressure, Lighting, Noise conditions, Vibration, Electric emission etc.
Material:Material basically refers to a physical thing. A bad diskette is one typical example. Software can’t always handle er-rors caused by bad material, for instance a bad backup tape, so while material may be the least likely cause, it is a possible cause.
Machine:A machine in software usually refers to the hardware, and there are a lot of possibilities that a problem can be due to the machine, such as performance issues. Lack of Ac-curacy, Gage wavering over time.
SOLUTION:There are several quality tools are available to Identify ,Analyze, and Fix the problem.
Few quality tools are like:
1.Flow charts2.Pareto tool3.Histogram4.Fishbone 5.5 whys…etc
1. Flow Chart (Perfect Path):Flow Charts are often the starting point for process im-provement. They are graphical displays that help create a common understanding of a process.
Advantages of Flow Charts:a)Primarily used to clarify the steps of a process and to create a common understanding in brain storming ses-sion.b)When the cause of a problem is unclearc)When i’s unclear how a process actually operates and how it should operate..etc
Eg: The best way to reach Home (flexible Hoshin Kanri)
Flow Chart - Flexible Hoshin Kanri
What is a fish bone diagram ?1.Fish bone diagrams are popular tools in the Lean six sigma tool kit .A fishbone logically organize potential root causes to a Problem.2.Label the fish head .It should be the “Y” you are trying to effect in your project. 3.Remember, the fish head stinks! The “Problem” should be an undesirable effect.

Volume No: 1 (2016), Issue No: 7 (July) July 2016 www. IJRMS.com Page 8
Volume No: 1 (2016), Issue No: 7 (July) July 2016 www. IJRMS.com Page 9
Depending on how far you want to go with your thinking, it could grow wider and wider and expand the possibili-ties.
KEY ELEMENTS TO THINK ABOUTThe issue or challenge is placed in the centre square. Each of the eight areas expand to generate as many facts, ideas or information as you can come up with. The issue is then surrounded by eight new related areas/ideas. You may CHOOSE to take one of these latest pieces of info/ideas to expand even further!
Example: Students are sitting like petals around the is-sue and generating ideas as input given by customer. Ref :PDCA flow Chart MOCK Engineering Research Center (ERC) Location : RIMT-Punjab.Dept : MBA
Fig :A.PDCA Flow chart.
C. Check Sheet:1.Data recording2.Who,where,what and How
Fishbone: When to use it:You may find it helpful to use the Fishbone diagram in the following cases:1.To analyze and find the root cause of a complicated problem
Fishbone diagram / Cause–and–Effect Dia-gram, Ishikawa Diagram
Here are the various tasks involved in constructing a Fish-bone diagram:1.Define the problem2.Brainstorm3.Identify causes
1. Define the problem
The first step is fairly simple and straightforward. We have to define the problem for which the root cause has to be identified.
2. Brainstorm: it consists of 1.Affinity Chart2.Brainstorming3.Check Sheet4.Flow Charts
A. Affinity Chart:Organizes facts, opinions, ideas, and issues into a natural grouping.
B.Brainstorming:Gathers ideas from people who are potential contributors.
a)Lotus
Lotus Tool can be help full to generate ideas. How Does It Work?This tool will help you manage and categories large amounts of information related to a particular topic or is-sue, with each lotus petal relating to the original topic/issue.
Volume No: 1 (2016), Issue No: 7 (July) July 2016 www. IJRMS.com Page 8
Volume No: 1 (2016), Issue No: 7 (July) July 2016 www. IJRMS.com Page 9
2.When there are many possible causes for a problem3.If the traditional way of approaching the problem (trial and error, trying all possible causes, and so on) is very time consuming4.The problem is very complicated and the project team cannot identify the root cause.
When not to use it: 1.The problem is simple or is already known.2.The team size is too small for brainstorming.3.There is a communication problem among the team members.4.There is a time constraint; all or sufficient headcount is not available for brainstorming.5.The team has experts who can fix any problem without much difficulty.
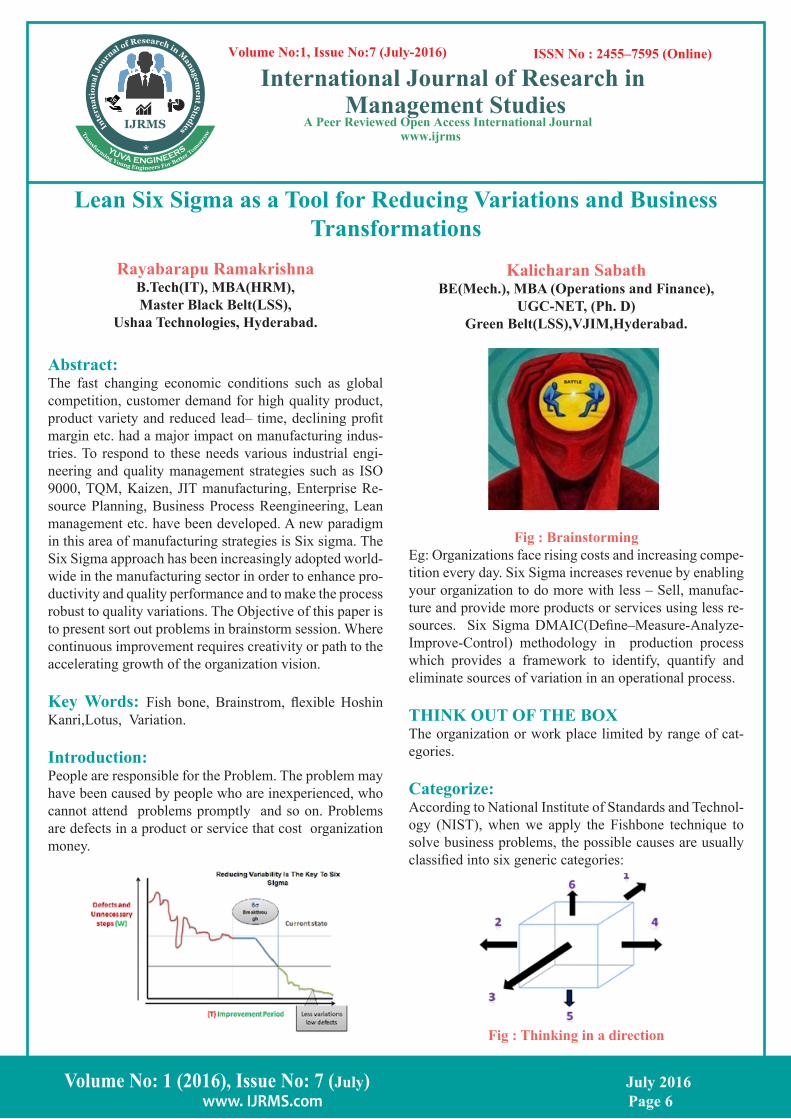
Should we focus on the Y or the X?
A.The Five why’sThe 5 whys is one of the simplest tools in the Lean Six-sigma toolkit. Children under the age of 6 are particularly good at this technique!
Remember the story A king who has seven sons!!!
It is s simply asking why five times to work back the causal chain. We may not need all 5 whys or you may use more than 5.
This technique can uncover the root cause to a problem.
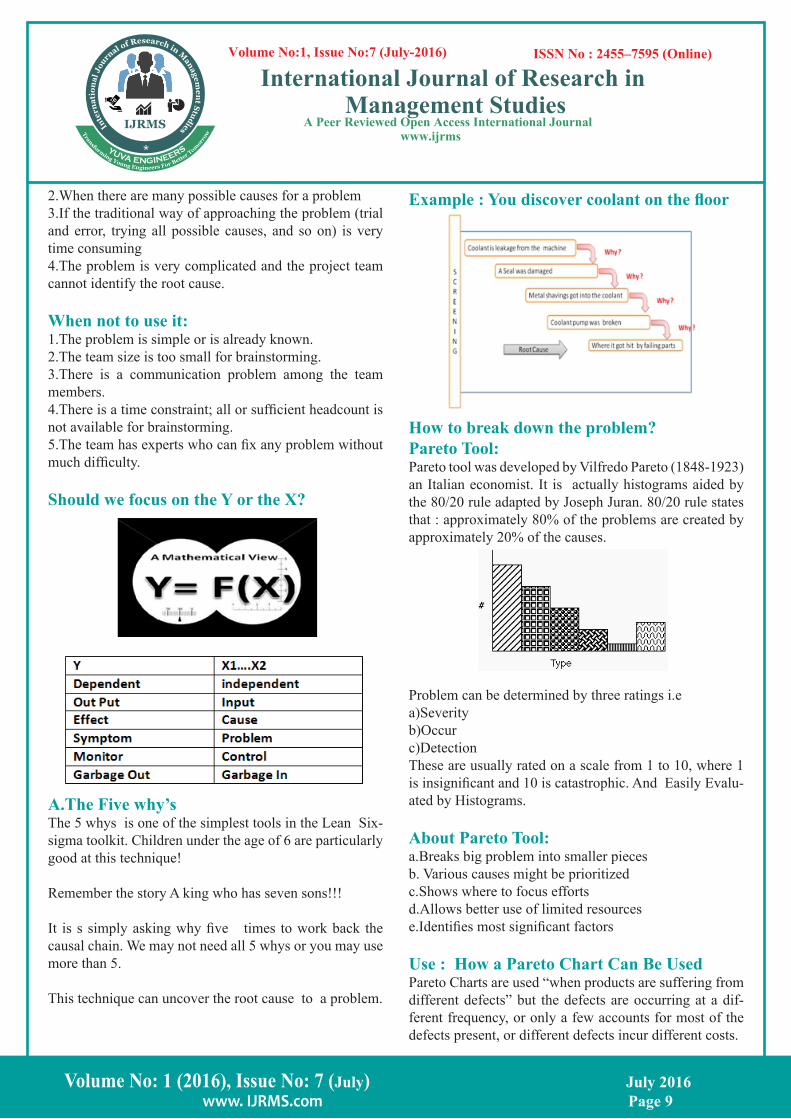
Example : You discover coolant on the floor
How to break down the problem? Pareto Tool: Pareto tool was developed by Vilfredo Pareto (1848-1923) an Italian economist. It is actually histograms aided by the 80/20 rule adapted by Joseph Juran. 80/20 rule states that : approximately 80% of the problems are created by approximately 20% of the causes.
Problem can be determined by three ratings i.ea)Severity b)Occurc)Detection These are usually rated on a scale from 1 to 10, where 1 is insignificant and 10 is catastrophic. And Easily Evalu-ated by Histograms.
About Pareto Tool:a.Breaks big problem into smaller pieces b. Various causes might be prioritized c.Shows where to focus efforts d.Allows better use of limited resourcese.Identifies most significant factors
Use : How a Pareto Chart Can Be UsedPareto Charts are used “when products are suffering from different defects” but the defects are occurring at a dif-ferent frequency, or only a few accounts for most of the defects present, or different defects incur different costs.

Volume No: 1 (2016), Issue No: 7 (July) July 2016 www. IJRMS.com Page 10
Volume No: 1 (2016), Issue No: 7 (July) July 2016 www. IJRMS.com Page 11
Lean Six Sigma decreases your organization’s costs by removing “Waste” from a process. Which does not have any value,waste is any activity within a process that isn’t required to manufacture a product or provide a service that is up to specification. Lean Six Sigma enables you to fix process problems by applying appropriate tools and that cost your organization valuable resources.
Note: Thinking is not enough. You have to act and that will re-quire support.
References :nist.gov , ASQ.org , excel-easy.com,Wikipedia,
What we see from that is a product line may experience a range of defects. The manufacturer could concentrate on reducing the defects which make up a bigger percentage of all the defects or focus on eliminating the defect that causes monetary loss.
Figure 1: Restaurant Complaints with count
Figure 1.a : Pareto Diagram Example