Birds, Insects, and Refractive Index Gradients as the Source of Clear-Air Return for Meteorological...
42
Birds, Insects, and Birds, Insects, and Refractive Index Gradients Refractive Index Gradients as the Source of Clear-Air as the Source of Clear-Air Return for Meteorological Return for Meteorological Radars Radars William Martin William Martin November 9, 2005 November 9, 2005
-
Upload
ann-sanders -
Category
Documents
-
view
214 -
download
0
Transcript of Birds, Insects, and Refractive Index Gradients as the Source of Clear-Air Return for Meteorological...

Birds, Insects, and Refractive Birds, Insects, and Refractive Index Gradients as the Source of Index Gradients as the Source of
Clear-Air Return for Meteorological Clear-Air Return for Meteorological RadarsRadars
William MartinWilliam Martin
November 9, 2005November 9, 2005

2
Weather radar can provide valuable wind field information for studying atmospheric phenomena and for use in numerical forecast models
NEXRADs commonly see significant and wide spread clear-air return in the lower several kilometers of the atmosphere
However, if the signal is caused by migrating birds, then a significant bias may be present
3
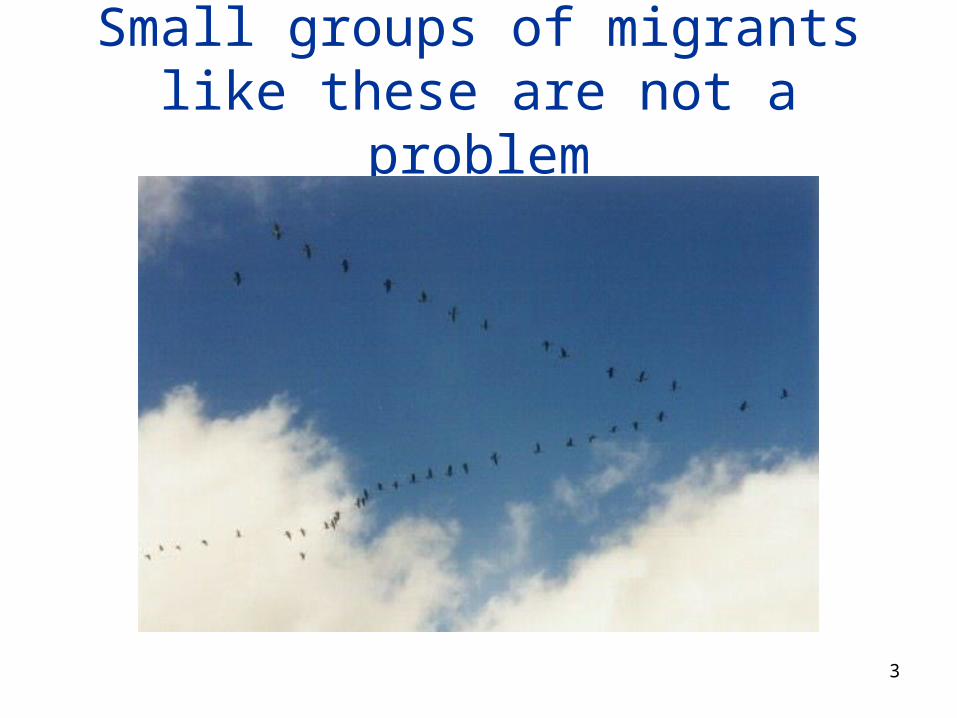
Small groups of migrants like these are not a problem

4
Typical Nocturnal Clear-Air Return
Range rings are every 400 min the vertical, or every 15 kmin the horizontal
This image shows strong reflectivity to a depth of about4 km.
But what is reflecting radar energy?
Velocity is determined bythe Doppler shift of thesignal
Radar antenna tilt=1.5o
5
Diurnal Cycle of Reflectivity is Interesting
24 hours of KTLX NEXRAD clear-air data from August, 2002
Show Animation
6
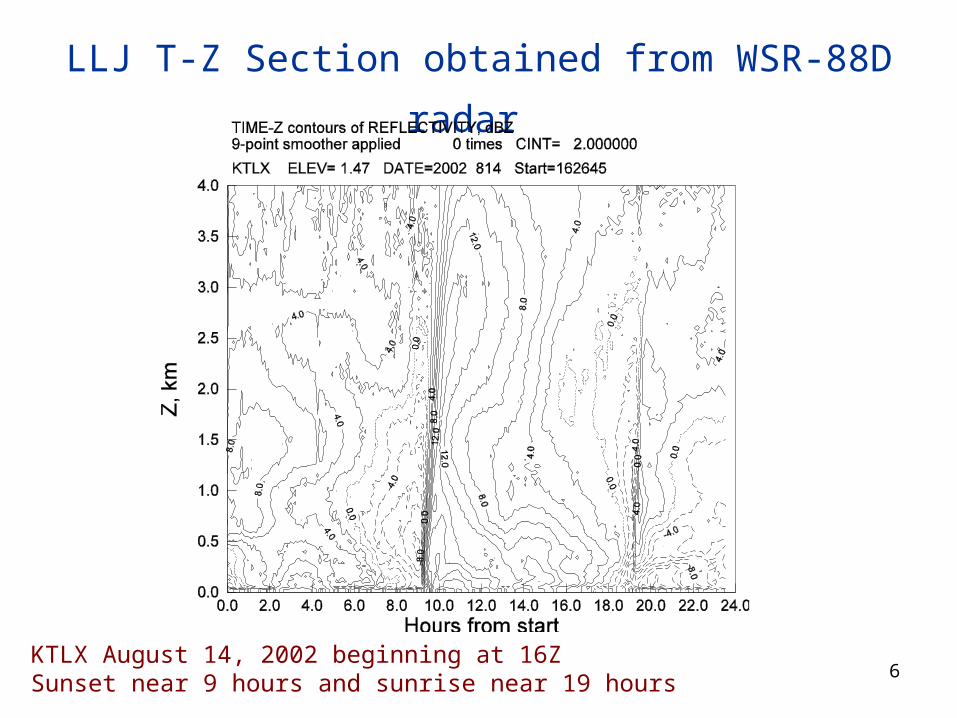
LLJ T-Z Section obtained from WSR-88D radar
KTLX August 14, 2002 beginning at 16ZSunset near 9 hours and sunrise near 19 hours

7
T-Z sections of dBZ and V
rapid change in dBZ less rapid change in V
8
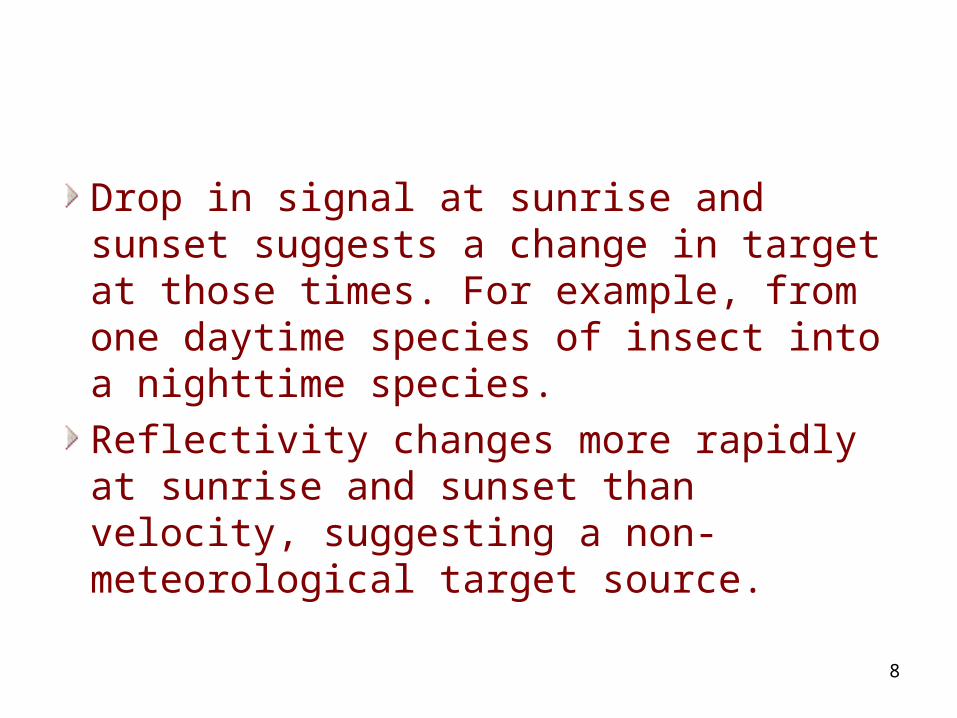
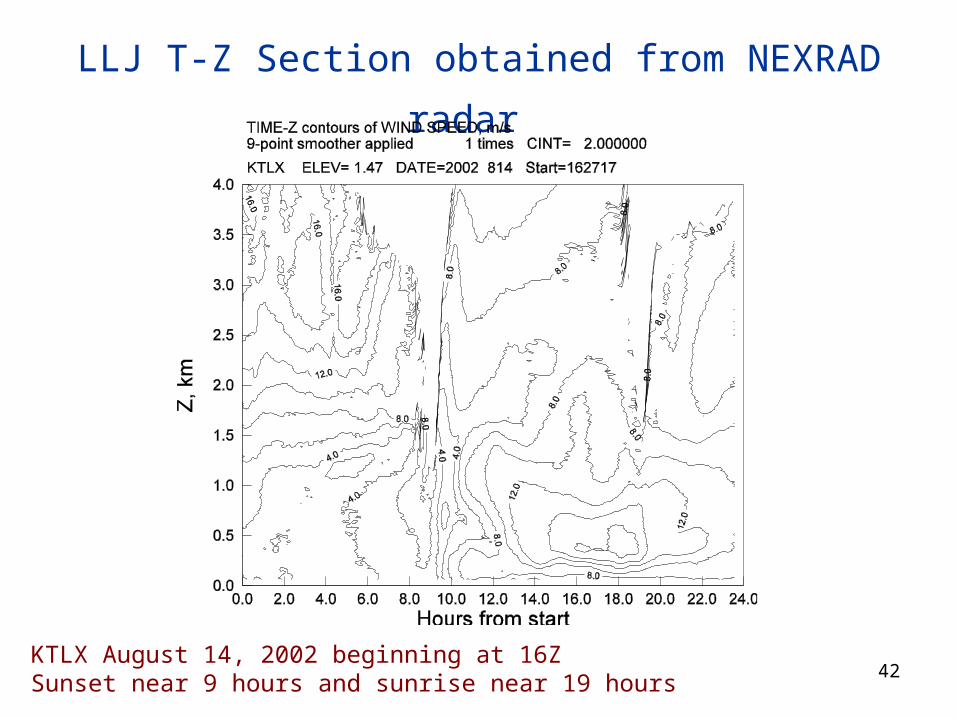
Drop in signal at sunrise and sunset suggests a change in target at those times. For example, from one daytime species of insect into a nighttime species.
Reflectivity changes more rapidly at sunrise and sunset than velocity, suggesting a non-meteorological target source.

9
Clear-Air Targets are Generally Either:
Birds
Insects
Refractive index inhomogeneities
Dust and dirt particles tend to be too small to provide much signal

10
Historically, insects were identified as the most common source of clear-air return: Hardy and Katz (1969).Recent work has identified migratory birds as an important source of nocturnal return which seriously biases wind measurements: Wilczak et al. (1995), O’Bannon (1995), Jungbluth et al. (1995), Zrnic & Ryzhkov (1998), Gauthreaux and Belser (1998). These studies were driven by observations of occasionally large differences between rawinsondes and radar wind profiles.But the extent of the problem is still unclear. Wilson et al. (1994) found mostly insects in a detailed study of clear-air return in a variety of circumstances.

11
Some Radar Equations
4
6
4
22
6
22
:
6.80
.
log10
log20log109.128)(
D
giveswhichscatterRayleighFrom
Zhr
Vol
DZ
ZdBZ
lossesrdBZhP
dBmP
i i
tr
Reflectivity factor
Backscatter cross-section
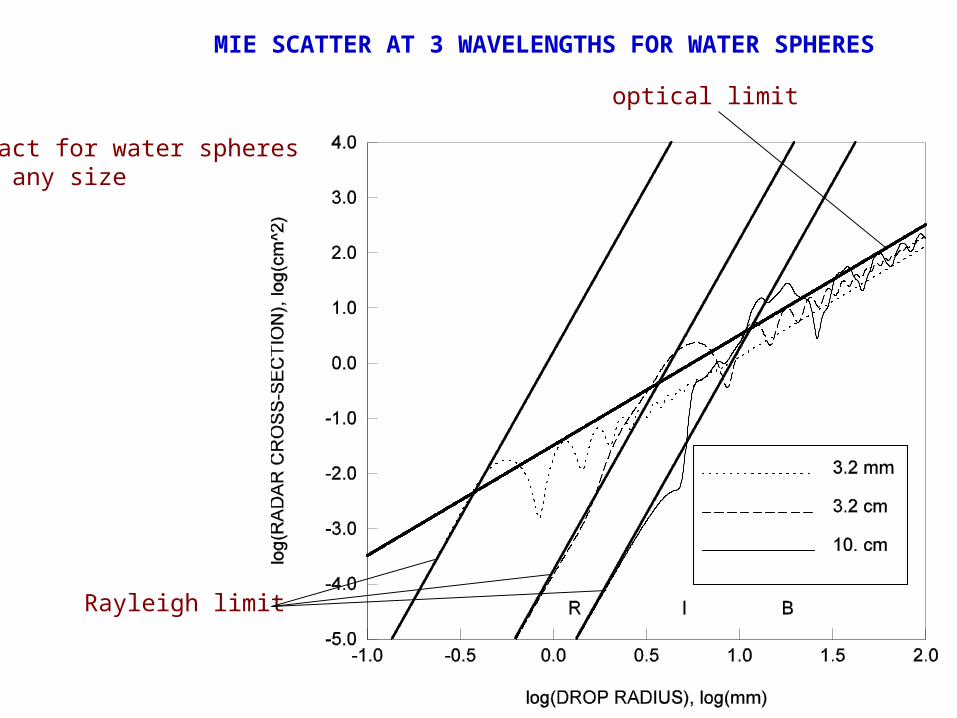
MIE SCATTER AT 3 WAVELENGTHS FOR WATER SPHERES
optical limit
Rayleigh limit
exact for water spheresof any size

Radar Cross-Sections of Some Common Targets for 3 cm Radar
TARGET RADAR CROSS-SECTION, cm2
Birds 10-2 to 103 with 20 typical
Insects 10-3 to 10 with 1 typical
Mosquito 10-3
Sand piper 20
Robin 20
Locust 10
Moth 1
Butterfly 10-1

Refractive Index InhomogeneitiesReflections and Bragg Scatter
Simultaneous radar and refractivity soundings, Lane and Meadows (1963).
15
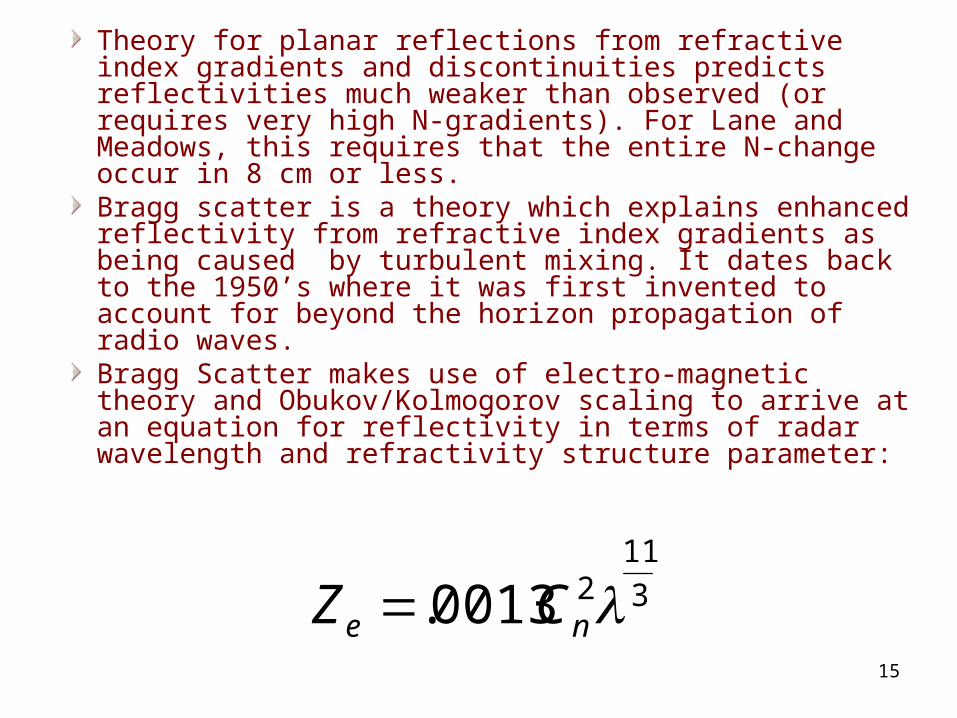
Theory for planar reflections from refractive index gradients and discontinuities predicts reflectivities much weaker than observed (or requires very high N-gradients). For Lane and Meadows, this requires that the entire N-change occur in 8 cm or less.Bragg scatter is a theory which explains enhanced reflectivity from refractive index gradients as being caused by turbulent mixing. It dates back to the 1950’s where it was first invented to account for beyond the horizon propagation of radio waves.Bragg Scatter makes use of electro-magnetic theory and Obukov/Kolmogorov scaling to arrive at an equation for reflectivity in terms of radar wavelength and refractivity structure parameter:
3
1120013. ne CZ

16
Conceptual Diagram from Glover et al., 1968

17
Case #1 Gust Front with DOW3
Clear-air thunderstorm outflow seen by DOW3 June 11, 2000 in the afternoon
DOW3 is a 3 cm mobile radar

RHI scan of dBZ
Range rings are 500 m
ground clutter
probable birdsreflectivity ~15 dBZor a backscatter cross-section of 10 cm2
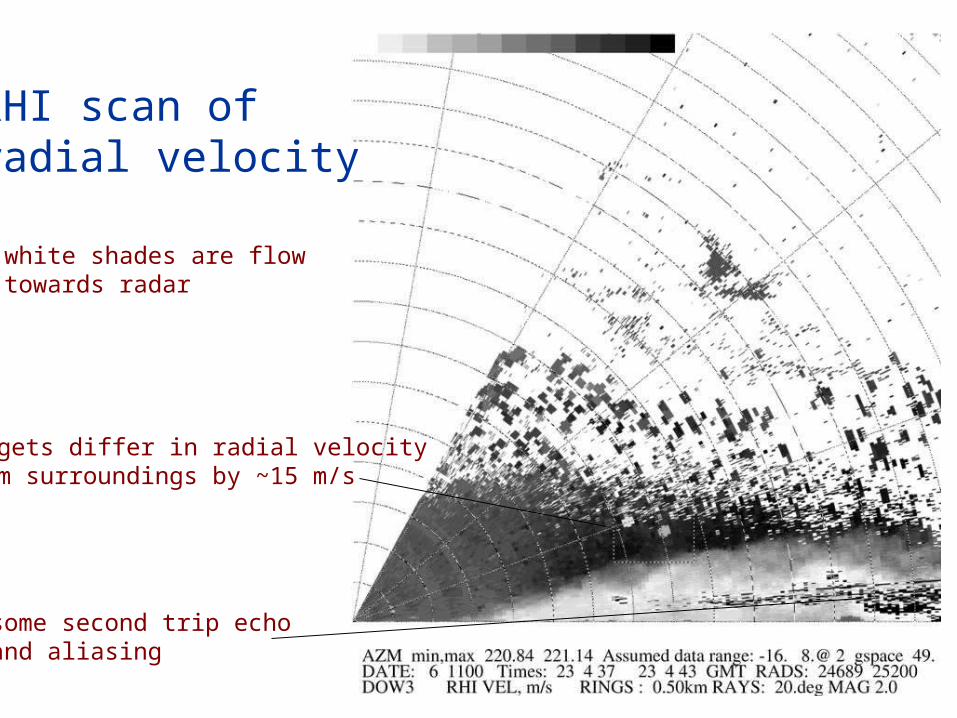
Targets differ in radial velocityfrom surroundings by ~15 m/s
RHI scan ofradial velocity
white shades are flowtowards radar
some second trip echo and aliasing

But what are the targetsahead of and behind thedensity current?

21
2
2
23
42
)(
)(
o
on
L
nn
nLC
3
1120013. ne CZ
estimate Cn2 from scaling arguments as:
for use in:

22
Location Cn
2, m-2/3 dBZ
Within current, Lo=1000 m
5X10-11 -7
Near Head Lo=100 m
2X10⁻¹⁰ 0
These values are quite close to those observed, though typicalCn
2 values reported in literature are 10-13 to 10-16
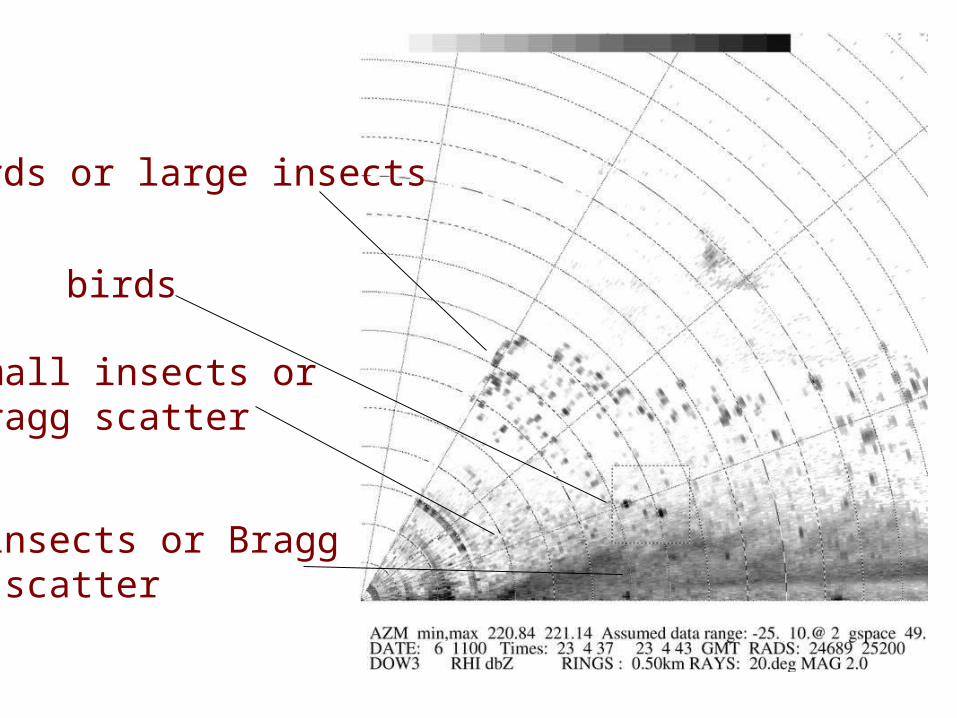
birds or large insects
birds
small insects orBragg scatter
insects or Bragg scatter

24
Case #2 DOW3 and KGLD near Midnight
DOW3 co-located with the KGLD WSR-88D on May 30, 2000 near midnight in clear airBoth scanned the same air at the same timeDOW3 is a 3 cm radar and KGLD is 10 cmBecause of the wavelength difference, Bragg scatter should be 18 dBZ stronger with KGLD.From Mie scattering calculations, signals from KGLD should be from 0 dBZ stronger than DOW3 for small insects to 20 dBZ stronger for large birds

25
Reflectivity in box is observed to be about 11 +- 4 dBZ stronger in KGLD
Both scans have same tilt (2.5o) and range, but dBZ scales are different
26
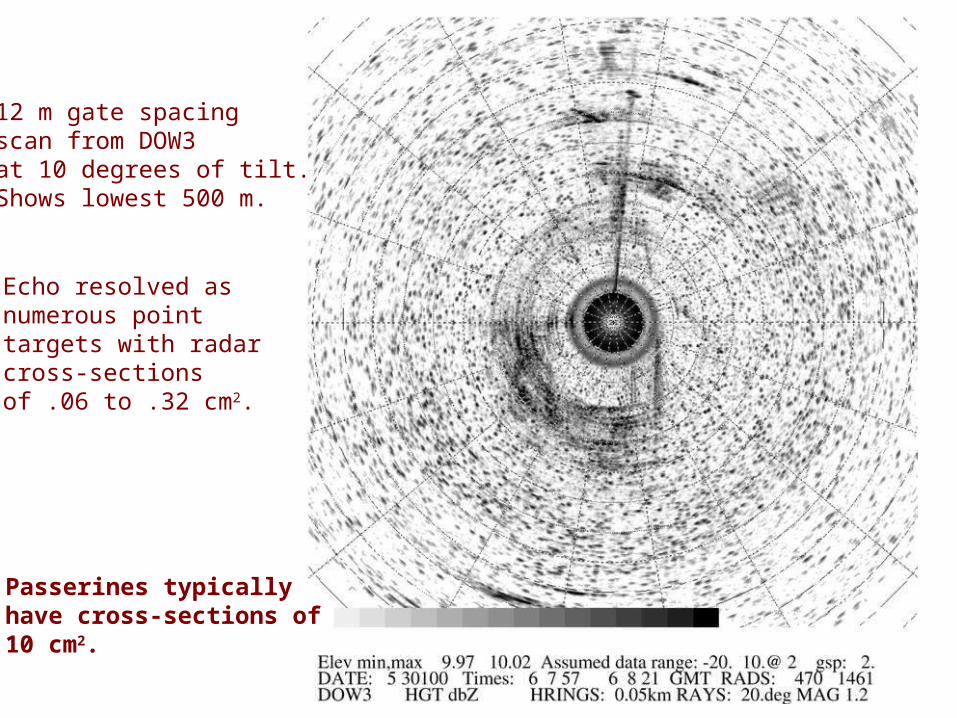
12 m gate spacingscan from DOW3at 10 degrees of tilt.Shows lowest 500 m.
Echo resolved asnumerous pointtargets with radar cross-sectionsof .06 to .32 cm2.
Passerines typicallyhave cross-sections of10 cm2.

27
RHI scan showingpoint targets up to 2 kmabove the ground
range rings are every 200m
nearly continuous signalin layer below 200 m.Bragg scatter?
weak echo region about-12 dBZ, or .002 cm2 ofcross-section.
28
Estimate of Target Density
By counting targets in a sector, a target density of 5.0X10⁻³ per m3 is estimated from the previous figure. This would be roughly one target every 60 m, or about 1 billion birds flying over all of Kansas.For comparison, bird migration traffic rates (MTR) are reported by ornithologists with units of bird crossings per mile of front per hour.The DOW3 data imply an MTR of 730000.Ornithologists report “heavy” MTR values of 5000 calculated from moon-watching data.Gauthreaux (1998) reports MTR along Gulf Coast as high as 200000, with 20000 typical.

29
DOW3 has revealed the targets to be most probably insects
Low radar cross-section inconsistent with passerine birds.
High target density inconsistent with all but the most extreme migrations.

30
Case #3 KTLX and UMASS near Midnight
UMASS 3 mm radar located at Max Westheimer field, about 15 miles from KTLX WSR-88DStrong nocturnal clear-air signal, to 25 dBZLarge numbers of moths had been noticed anecdotally

31
PPI scan from KTLXshown dBZ to 25
spatially continuoussignal implies hightarget density
much stronger than KGLD echofrom case #2
32
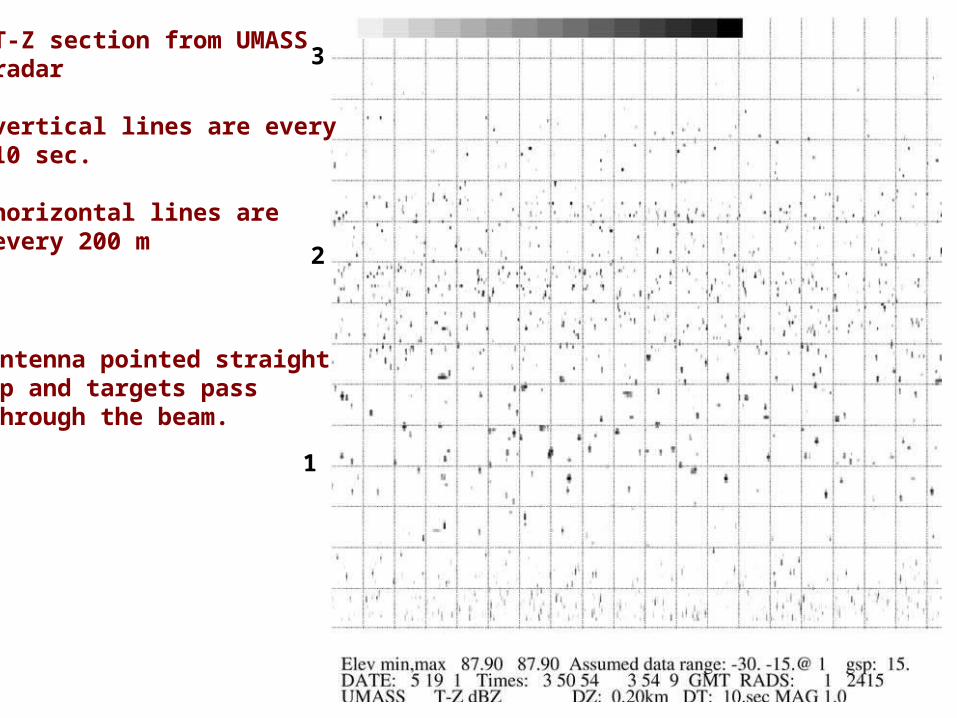
T-Z section from UMASSradar
vertical lines are every10 sec.
horizontal lines areevery 200 m
Antenna pointed straightup and targets passthrough the beam.
1
2
3
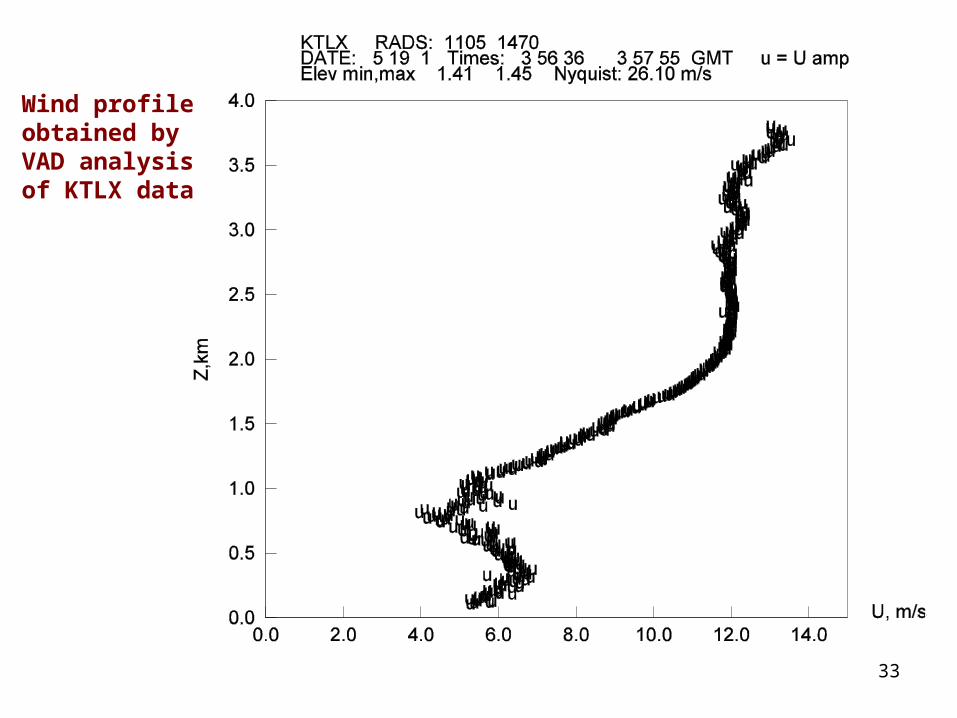
33
Wind profileobtained byVAD analysisof KTLX data

34
Radar cross-sections of targets at all levels are, for the strongest reflectors, .2 to .5 cm2. Too small to be birds.
Target density is estimate to be 10-4 per m3, twenty times that seen by KGLD from case #2.
Calculated KTLX reflectivity based on this cross-section and number density gives a reflectivity factor of 25 dBZ, close to that observed.
UMASS has revealed the targets to be almost certainly insects:

35
Summary
High resolution radars for two cases of nocturnal clear-air return strongly implies that the targets were mostly, if not entirely insects.
This agrees with Wilson et al. (1994).
This disagrees with Gauthreaux et al. (1998) and Wilczak et al. (1995).
36
Discrimination of Birds and Insects as Radar Targets
Bird behavior is too variable for patterns to be reliable. Though there are definite patterns of behavior, birds can migrate at any time of the day or night, in any direction, against the wind, with the wind, ahead of and behind fronts, and on any day of the year.

37
Radar cross-section. Birds can be ruled out if radar cross-section is below 10 cm2 as passerines have cross-sections of 10 to 30 cm2.Spatial granularity. Granular signal implies point targets. Combined with cross-section measurements, it can confirm birds.Number Density. A high number density of targets could exclude birds.

38
Symmetry of PPI echo. Bilateral symmetry in PPI pattern is sometimes seen, and ought to be present whenever the targets are aligned. Birds may be more likely to do this. Usually this pattern is not seen at night, which is consistent with an insect explanation.
Use of polarization information (Zrnić & Ryzhkov, 1998). This needs more research; will be available in the future on WSR-88Ds.
Height of echo above ground. Perhaps insects can not reach the same altitudes attained by birds.

39
KTLX dBZ PPI scanat 15 Z, Aug. 15, 2001
Shows bilateral-symmetricecho pattern probably due to either bird or insect alignment

40
END

41
Migrating Birds and Precipitation?
From Radar Ornithology Lab website, Clemson University
42
LLJ T-Z Section obtained from NEXRAD radar
KTLX August 14, 2002 beginning at 16ZSunset near 9 hours and sunrise near 19 hours