Stories and sculptures - Engaging families in ZSL London Zoo's Tiger Territory

Bird and tree distribution modelling at the ZSL Berbak Carbon
Initiative Berbak National Park, Jambi Province, Sumatra
Murray Collins*, Dedi Rahman, Karen Jeffers, Laura Darcy, Dolly Priatna,
Erwin A Perbatakusuma, Waluyo Sugito, and Basit
Berbak Carbon Initiative, ZSL Indonesia, JL. Gunung Gede 11A, Bogor, Java Barat,
Indonesia.
*Corresponding author [email protected]
Abstract We discuss the results of bird surveys from the Berbak Carbon Initiative (BCI), a
REDD+ pilot project managed by the Zoological Society of London (ZSL) in Jambi
province, Sumatra, Indonesia. Our objective was to explore the ways in which different
species are distributed across the Berbak landscape and to assess avian species richness in the
different forest classes. We sampled 24 sites representing the different habitat types found at
the site including primary and secondary peat swamp forest (PSF), mixed agriculture,
beach/coastal mud flat and swamp bush. This latter habitat is a grassy swamp which grows
after fire has destroyed forest. At each of the 24 points DR performed point count surveys for
birds (one in early morning, one early evening). We recorded a total of 177 bird species, with
161 species being recorded in primary forest, 62 being recorded in secondary forest, 42
species in the swamp bush, and 51 species in the coastal environment.
Since it is not possible to sample everywhere, we used species distribution modelling
(SDM) to predict habitat suitability for a selection of the observed species. We chose a
selection of 40 species for which sufficient presence points were available and used the
Maximum Entropy approach (Maxent), using predictor variables derived from SPOT V
remote sensing imagery (Satellite Pour L'Observation de La Terre, V). From these species we
assessed model performance and then examined the predicted habitat suitability maps for the
better performing models. Where possible we compared the basic ecological knowledge of a
species with the predictive models of the selected species. We focus here on 3 particular
species for which we have ecological knowledge and which represent both ends of the
spectrum of specialisation.
The highly generalist Crested myna (Acridotheres cristatellus), was predicted to have
higher habitat preference to the areas outside the intact forest blocks whereas, conversely, the
specialised Rhinoceros hornbill (Buceros rhinoceros) was predicted to find more suitable
habitat in the remaining intact forest. Intriguingly, many of the models suggest an area of
high importance for generalist birds is in an area of swamp bush/forest-edge matrix habitat in
the south-west of the project area. Future surveys and further model development are planned
to assess the true importance of these habitats for generalist species. However, despite this
apparent importance for the modelled species, we continue to emphasise that the highest
overall species richness was found in the intact primary forest areas.
Introduction Deforestation in the tropics is a fundamental driver of biodiversity loss (Sodhi et al.,
REF). A great deal of hope for biodiversity conservation is therefore pinned on mechanisms
which promise to stem this loss, in particular the REDD+ mechanism. Whilst positive
relationships have been established between biodiversity and forest carbon on the widest
scales (REF REF), trade-offs between carbon stores and biodiversity have been found on a

regional scale, particularly where the huge stores of carbon in PSF are involved (Paoli et al.,
2011?). However, few studies on the relationship between carbon and biodiversity at the fine
scale have been produced. These analyses are hampered by a lack of data, and so a crucial
first step in attempting to explore approaches for conserving both carbon and biodiversity is
to collect high-level data on how these values are distributed. Whilst the biodiversity
conservation component of the BCI remit covers the analysis of a range of taxa, we chose
birds for one of the first major surveys for the site since a) Berbak National Park (BNP) is an
Important Bird Area, and b) birds are a useful taxon to monitor since they are quite well
understood and readily identifiable using regional field guides even in remote areas such as
Berbak. Birds can be efficiently surveyed using indirect methods (Stotz et al., 1996,
Sutherland, 2006). Futhermore they display ecological congruence with other taxa in the
tropics (Schultz et al., 2004), and so may represent broader measures of diversity that are, of
course, also of interest to the project.
Many SDM techniques are available. Here we decided to use the maximum entropy
approach (Maxent; Phillips et al., 2005; Phillips Dudik & Schapire 2006) since it performs
well with relatively few presence points (Hernandez et al. 2006), and the fact that it is
immune to the false absences (Elith et al., 2006) which were doubtlessly generated after
having conducted only one field survey.
Technically, the Maxent approach involves software being trained through the use of
presence points and a series of predictor variables derived from remote sensing data.
Commonly these include climate variables e.g. CLIMOD. However, in our case, we are
examining relationships on a much smaller scale, at which climatic variables are relatively
homogenous. As such we rely here upon predictor variables derived solely from remote
sensing data (sensu Lahoz-Montfort et al., 2010). The software uses presence-only locations
and remote sensing variables to produce the distribution maps, which display the suitability
of each map cell as a function of the values of the environmental variables of that cell
(Saatchi et al., 2008). The final mapping products therefore show the least constrained (hence
maximum entropy) predicted habitat suitability models for each species that still agree with
the presence data. Bias in the data collection points can be mitigated by providing the
software with a bias grid providing a priori probability of sampling in each each cell
(Phillips, 2005).
Methods i. Study site: ZSL Berbak Carbon Initiative
The BCI study site is an area of predominantly peat swamp forest in eastern Sumatra.
Berbak’s forests are managed under legislation specific to different land classifications
including:
1. Berbak National Park under the control of central government in Jakarta;
2. Protection forest under the control of Jambi provincial government;
3. Hutan tahura, also managed by the provincial government;
4. Production forest managed by a timber concessionnaire.
BCI is a pilot REDD+ pilot project co-managed by the Zoological Society of London
(ZSL) and the Government of Indonesia, and funded for three years by the UK government’s
Darwin initiative.
ii. Field surveys
The field survey site selection was purposive, in order that surveys were performed in
the full range of different habitats at the BCI site. To design the sampling approach, DP used
a habitat map produced from the supervised classification of a high resolution satellite image
(SPOT V; ZSL classification), and selected 24 approximate locations to be sampled. DR (an

highly experienced field researcher) then led field teams to the pre-selected locations. Upon
arrival at the pre-selected locations, GPS coordinates were recorded using Garmin Csx?,
along with the environmental conditions (habitat, weather) and timing. At each site, 5 sub-
sites were selected 50 metres from a centre point in order to maximise the range of viewing
conditions and micro-habitats present.
Point counts were performed twice at each site, once in the morning (07.00-10.00),
and once in the afternoon (15.00-18.00). During each of these periods, 30 minutes were spent
at each of the 5 sub-sites, the remainder of the time being spent moving from sub-site to sub-
site. In order to reduce bias, surveys were not performed on days with inclement weather.
Each bird observed at the site, either visually or aurally, was recorded, .
Identifications were confirmed using the Birdlife guide for the region (REF!). These
observations gave us, in total, a month of data collected across a range of different habitats
and micro-habitats, during homogenous climatic conditions.
Figure. 1. Bird sampling locations at BCI.
iii. Data analysis: Summary statistics and species distribution modelling
In order to analyse the data we used some elementary summary statistics to produce a
bird list for the park and BCI. We also calculated bird species richness in the different land
class types as derived from the initial ZSL SPOT V supervised classification. Whilst this
baseline information is useful and contributes to the requirement of a fundamental Darwin
project outcome (determine species richness across forest types), we wanted to improve the
analysis in two ways:

First, we wanted to make use of species presence data points from across the site, and
use these to take a predictive approach. This is because, despite continued deforestation in
Jambi, BNP still retains a large amount of forest and swamp, and is remote and inaccessible.
The makes it very expensive and logistically difficult to run surveys across the entire site.
Furthermore, tiger conflict increases the hazard for crepuscular research activity. Second, we
wanted to remove any subjectivity from the original supervised classification land cover
assessment, and to take a more finer- scaled approach. That is, rather than saying solely that a
given species X is more often found in habitat that we classified as primary forest, we wanted
to know how (or whether) the presence of different species related to readily quantifiable
predictor variables that we could derive for the entire BCI site from satellite imagery.
Ultimately, we used a list of 40 species for which more than 8 points were available.
To assess model performance we used the area under the Receiever Operating Characteristic
(ROC) curve (AUC; Philips 2005; Saatchi et al., 2008).
iii. Data analysis c) Remote sensing imagery
Our study is carried out on a small scale where variables often used in species
distribution modelling (SDM) such as climatic variables (e.g. CLIMOND/Bioclim data set)
are quite homogenous. Furthermore, other commonly used predictor variables such as slope
and aspect built from digital elevation models are homogenous across the site, since the
coastal swamps of Jambi are low-lying and flat. We confirmed this by examining a Shuttle
Radar and Topography Mission (SRTM) dataset from NASA for the area (CIAT).
We found 1 case in the literature where small-scale species distribution modelling had
been performed solely using remote sensing predictor variables, in particular the Lahoz-
Montfort et al (2010) was influential. Following their approach, we searched for LANDSAT
7 images of the BCI area, which falls on the intersection between two paths of the satellite.
LANDSAT 7 imagery is, unfortunately, degraded after a failure in 2003 of the scan line
corrector instrument (SLC-off) which has resulted in large gaps in the images which need to
be filled with data from other sources to make a gap-free composite. We examined the result
of a gap-filled image for the site analysed by an analyst at the NGO BIOTROP, in which it
was quite apparent that there had been gap filling, which in turn we felt would reduce the
quality of any derived predictor variables.
We then turned to LANDSAT 5 imagery, which is freely available at the USGS
Global Visualisation site (http://glovis.usgs.gov/). Whilst we found a relatively cloud-free
image for the western side of our study area (125/61; level L1T) there was persistent cloud
cover in all of the scenes for the littoral area at 124/61 (Level L1T). We radio-metrically
corrected the scenes then performed a mosaic operating on bands 1, 2, 3, 4, 5 & 7. To make
the corrections and derive variables we first calculated the LANDSAT 7 digital number
equivalent for the LANDSAT 5 data using standard coefficients and then converted these to
radiance and finally reflectance values, again using published coefficients (REF) and the
metadata for the respective LANDSAT images stored in the metadata (REFS IN THE
COLARADO STATE DOCS).
BOX 1.
Radiance L = (gain * DN7) + bias where L is the calculated radiance [in Watts / (sq.
in step 2), and the gain and bias are band-specific numbers. The latest gain and bias
numbers for the Landsat 7 ETM+ sensor are given in Chandler et al. (2009 REF
COLORADO) and are shown in the following table.
Ban
d
Gain Bias

1 0.778740 -6.98
2 0.798819 -7.20
3 0.621654 -5.62
4 0.639764 -5.74
5 0.126220 -1.13
7 0.043898 -0.39
We then produced a series of derived predictor variables including Non-Differentiated
Vegetation Index (NDVI), SAVI (which is similar to NDVI but attempts to correct for
background soil conditions), greenness, brightness and wetness. These variables were
produced using the following equations:
Brightness=("band1radiance"*0.3561)+("band2radiance"*0.3972)+("Band3radiance"
*0.3904)+("band4radiance"*0.6966)+("band5radiance"*0.2286
)+("band7radiance"+0.1596 )
Greeness=("Band1radiance"*-0.3344)+("band2radiance"*-
0.3544)+("Band3radiance"*-0.4556)+("band4radiance"*0.6966)+("band5radiance"*-
0.0242)+("band7radiance"+-0.2630)
Wetness=("Band1radiance"*0.2626)+("band2radiance"*0.2141)+("Band3radiance"*
0.0926)+("band4radiance"*0.0656)+("band5radiance"*-0.7629)+("band7radiance"*-
0.5388)
NDVI=(band 4 – band 3) / (band 4 + band 3)
SAVI=(1+ L)*(band 4 – band 3) / (band 4 + band 3 +L) where the Top Of
Atmosphere reflectances are used for each band and L is a soil brightness correction
factor. From Huete (1988), L=0.5 is used in most conditions.
However, despite choosing the least-poor quality scenes, we were not satisfied with
the resulting products. Dissatisfied, we then turned to MODIS imagery
(http://glovis.usgs.gov/), exploring variables which have been used successfully to model
species distributions elsewhere such as Leaf Area Index (Saatchi et al2008). However, for our
small-scale modelling purposes we felt that the resolution of these images was too low.
Finally we turned to images from the Satellite Pour L'Observation de La Terre, V
(SPOTV). Whilst these images must be bought, land cover classification for carbon
assessments and the demands of species distribution modelling were of such a high priority
that two scenes from August 2007 were purchased which covered the entire BCI area. These
very high resolution images (2.5*2.5m) had limited cloud cover, making them more readily
suited to the present task of SDM. The scattered clouds were masked out using a supervised
classification. We re-sampled the original raster images to 10*10m. From these pre-corrected
images we derived a series of predictor variables following Cheng (REF, IN THE SAT
FOLDER; BOX1.2). These variables were then converted into the .ascii format for entry into
the Maxent software

Box 1.1: Variables and
formulae
1. difference vegetation index
(DVI),
2. ratio vegetation index
(RVI; Jordan,),
3. normalized difference
vegetation index (NDVI),
4. re-normalized difference
vegetation index (RDVI)
5. soil adjusted vegetation
index (SAVI)
6. the second modified soil
adjusted vegetation index
(MSAVI2)
7. infrared percentage
vegetation index (IPVI)
8. modified simple ratio
(MSR).
9. Non-Differentiated
Vegetation Index NDVI
Results i. Summary statistics
We counted a total of 177 species in our survey. Based upon the habitat classification
from the SPOT imagery, we found 161 bird species in the primary forest, 62 species in the
secondary forest and 42 species in the swamp bush, whilst the beach surveys yielded 51
species.
ii.Maxent SDMs: composite species richness approach
We modelled a total of 40 species for which a sufficient number of presence points
were available to run through Maxent. We then created a composite image of the mean of all
modelled species, in order to attempt to create a species richness map for the area of interest
(AOI), shown in figure 2.1 below. This map suggests that the area to the south-west of the
AOI is the richest for bird species sampled. This area is a matrix of swamp bush, agriculture
and secondary forest. The apparently high species richness in these sites reflects the fact that,
from our limited ecological knowledge, a majority of the species that we modelled are a)
habitat generalists or b) more easily observed in the more open areas that are subject to
species-specific detectability biases. Due to these concerns, we decided to abandon this all-
species richness assessment approach, and examine a selection of species models on an
individual basis, with a more meaningful, narrower selection of species.
Figure 2.1 Predictions of habitat suitability probability from across the BCI, as derived from
a composite of 40 Maxent models of bird species observed during surveys.

iii.Maxent SDMs: individual species distribution
Here we describe, on a model by model basis, the results from the modelling of 2
generalist species and a forest specialist species to test the ecological validity of our results.
a) Crested Myna (Acridotheres cristatellus).
In terms of model performance, the AUC was 0.744, indicating a relatively good
performance against a random performance of 0.5. The model indicates that the most suitable
habitat for this species is the large open swamp bush/secondary forest matrix in the western
part of the map below and, similarly, the large cleared area in the centre of the park which
was burned in the fires of 1997. This fits with our ecological knowledge of the species which
is described in the literature as a generalist which prefers forest edge and open areas. This
also may explain the prediction of a strip of high suitability between the forest edge and the
beginning of a patch of agricultural development in the south-west of the AOI.

b) Common hill Myna (Gracula religiosa)
Similar to the performance of the previous model, the AUC for G.religiosa, another
species of Myna, was 0.69. Equally, the predictions of the model were very similar to the
areas on the forest periphery predicted to be of highest suitability for the species. This again
fits with published ecological knowledge of the species, which is described as being a
gregarious forest-edge species.

c) Rhinoceros hornbill (Buceros rhinoceros)
The model for the Rhinoceros hornbill performed nearly as well as the Crested Myna
with an AUC value of 0.695. The species is predicted to be largely restricted to what we have
classified as intact forest areas from the supervised classification of SPOT V imagery.
Ecologically, this also makes sense in that hornbills require large mature trees in which to
nest, and also to feed upon.
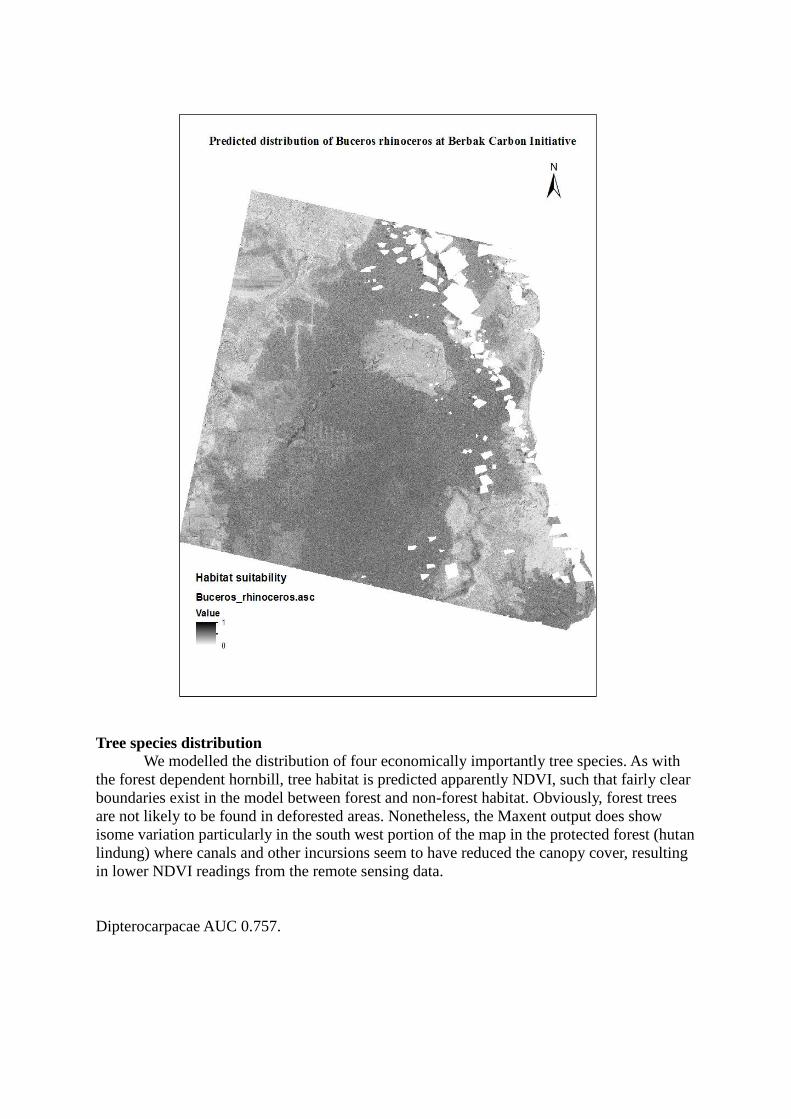
Tree species distribution
We modelled the distribution of four economically importantly tree species. As with
the forest dependent hornbill, tree habitat is predicted apparently NDVI, such that fairly clear
boundaries exist in the model between forest and non-forest habitat. Obviously, forest trees
are not likely to be found in deforested areas. Nonetheless, the Maxent output does show
isome variation particularly in the south west portion of the map in the protected forest (hutan
lindung) where canals and other incursions seem to have reduced the canopy cover, resulting
in lower NDVI readings from the remote sensing data.
Dipterocarpacae AUC 0.757.

Discussion and ideas for model development Our initial results showed some promising variation in the predicted habitat suitability
in accordance with ecological knowledge of the focal species. The generalist species were
predicted to have more suitable habitat outside the main forest block, whilst the habitat
specialist was predicted to have more suitable habitat inside the forest block. The selection of
birds with such specific habitat requirements (nesting in old trees) may prove useful in
assessing the quality of habitat across the site in the medium term.
We chose the particular cases of the generalist Myna versus the specialised Hornbill
since they show the maximum variation in our models. However, there is a great deal of
similarity between the models we have produced, largely falling into two categories: 1.
generalists who are predicted to have more suitable habitat outside of the heavily forested
areas, and a 2.) forest specialists who are predicted to find habitat in the forested areas only.
This apparent partitioning suggests that our models are detecting macro-scale differences in
habitat suitability, and will ultimately demonstrate the difference in species composition of
the broadest land use types at Berbak, rather than providing fine scale distribution maps. This
is probably because:

a) whilst we have data on the presence of 177 species at the site, all of this data comes from
only 24 observation sites. This necessarily limits potential to explore more sophisticated
differences in distribution between each species, since there is only ever a maximum of 24
data points to provide variation in habitat preference;
b) there is such a clear division between land cover at the site, and relative homogeneity
within each habitat type i.e. rather than having a gradation between forest to non-forest,
abrubt transitions from forest to non-forest occur (e.g. at the edge of burn zones), and when
the forest does begin, the variables that we have measured so far (e.g. NDVI) are relatively
homogenous on this small scale.
In order to refine our models, we therefore intend to:
1. develop further predictor variables based on the remote sensing layers, such as the
degree of fragmentation; variation in remote sensing variables such as NDVI as proxy
measures for disturbance (sensu Lahoz-Montfort et al.,2011).
2. supplement the existing data sets with repeat surveys, and adding extra survey points
in the blocks of primary forest.
3. employ presence/absence models using the “R” package to test the performance of
models between this and the Maxent outputs.


![Task-Driven Modular Networks for Zero-Shot Compositional ... · Compositional zero-shot learning (CZSL) is a special case of zero-shot learning (ZSL) [21,13]. In ZSL the learner observes](https://static.fdocuments.in/doc/165x107/5eb8d2d73e42c7454216139e/task-driven-modular-networks-for-zero-shot-compositional-compositional-zero-shot.jpg)