
Biotrade + project:Workshop: policy options for ...€¦ · Biotrade + project:Workshop: policy...
35
Biotrade + project:Workshop: policy options for sustainable biomasse trade Global Biomass Resources – Potential opportunities for trade Dr. Heinz Kopetz World Bioenergy Association, Stockholm Vienna, 3 June 2015 Messe Wien – Congress center Schubert 4 World Bioenergy Association (WBA) – join the global voice of bioenergy!
Transcript of Biotrade + project:Workshop: policy options for ...€¦ · Biotrade + project:Workshop: policy...

Biotrade + project:Workshop: policy options for sustainable biomasse trade
Global Biomass Resources – Potential opportunities for trade
Dr. Heinz Kopetz
World Bioenergy Association, Stockholm
Vienna, 3 June 2015
Messe Wien – Congress center
Schubert 4
World Bioenergy Association (WBA) – join the global voice of bioenergy!

Global Biomass Resources – Potential opportunities for trade
Structure:
Global issues: population, energy demand, emissions, land endowment
Facts and examples
outlook
Join the World Bioenergy Association (WBA)
Global Biomass Resources – Potential opportunities for trade
• Purpose of the project: guidelines for an european trade strategy for 2020 and beyond, sustainably sourced and efficiently used biomass; focus: wood chips, pellets, torrefied biomass and pyrolysis oil
• Key assumptions for ths presentation:
climate mitigation policy is getting serious
economic growth and population growth continue
Europe develops a global responsibility
Join the World Bioenergy Association (WBA)

Bioenergy and climate change
towards 2035:
Economic growth and climate mitigation
2035: more energy needed – growth of population and the economies
the carbon budget approach: halving the use of fossil fuels required to comply with the 2°C target
How to close the gap?
more renewable energies
better energy efficiency
What can be the role of bio-energy and of bio-energy trade?
World Bioenergy Association (WBA) – join the global voice of bioenergy! – www.worldbioenergy.org

Global Biomass Resources – Potential opportunities for trade perspectives 2035
2035
Required reduction of global ghg emissions minus 50%
Expected population by 2035: 8,3bn beople
Increased global energy demand additional 50 - 100EJ
Global C02 per capita emissions/year:
2012: ca 4,6 tons (variations from 16 tons to 1 ton)
Target 2035: 2,2 tons per capita
High emitters: North America, Middle East, Australia
Medium emitters: Europe, China
Low emitters: Africa, India developing countries

Global Biomass Resources – Potential opportunities for trade
Global population
Global Population bn
2011 Trends to 2035
World 7 058 Growth
Africa 1 072 Strong growth
Americas 942 Almost stable
Asia 4 216 Strong growth
Europe 740 Stable, declining
Oceania 37 -
The projected population growth will mainly take place in Africa and Asia, In these continents they will need more land for food!
Join the World Bioenergy Association!

Global Biomass Resources – Potential opportunities for trade
Global energy demand
Energy consumption
per capita
Trends towards 2035
World 21 900kWh (79 GJ) growing
Africa low Strong growth
Americas North Amer: very high
South Amer: low
Small growth
Growth
Asia Rather low Strong growth
Europe High
(38 000kWh; 137GJ)
Rather stable, maybe
decline
Oceania High
Join the World Bioenergy Association (WBA)

Global Biomass Resources – Potential opportunities for trade
energy demand and CO2 emissions
Energy demand and CO2 emissions/capita
CO2 emisions What should be the
trends towards 2035
World 4,6 t/cap and year Should decline by 50%
Africa low Small increase
Americas
North: high
South: low
Strong decrease
Small decrease
Asia
China: medium
Other countries: low
Small Decrease
Small increase
Europe medium Strong decrease
Oceania Rather high (AU)
Africa, Asia, South America: increasing energy demand, will need much more RES Europe: reduce emissions and energy demand, more res North America: strong reduction in emissions and strong growth in res!
Join the World Bioenergy Association!

Global Biomass Resources – Potential opportunities for trade
available arable land per capita
Arab land/cap ha Trends towards 2035
World 0,20 reduced
Africa 0,22 Strongly reduced
Americas 0,39 Rather stable
Asia 0,11 Strongly reduced
Europe 0,37 Rather stable
Oceania 1,30 oversupply
Join the World bioenergy Association (WBA)
Americas and Europe have a good endowment with arable land/capita, Africa and especially Asia not. In these continents arable land/cap will go Decline futher due to population growth. due to the growing population!
Global Biomass Resources – Potential opportunities for trade
Period 2015 – 2025
Big differences in the infrastructure to use biomass between North America, Africa and Europe.
Europe
Biomass to power plants
Biomass district heating systems
Millions of biomass boilers, pellets stoves
Europe continues to import more biomass, doing so Europe helps to to build up a supply structure in exporting countries, but sooner or later these countries will need part of this biomass in their own countries.
Europe needs efforts to increase the European supply of biomass!

Global Biomass Resources – Potential opportunities for trade
conclusions 1
World situation Short term
Until 2025
Longer term
Beyond 2025
Africa Strong growth in energy demand and
population, arable land per capita low
as compared to Europe and Americas,
Deforestation, unsustainable forest
management
Limited export
Possibilities for
Europe,
Building up a
Bioenergy
structure
Africa will need all
its
Bioenergy
For Africa
Americas Canada: huge bioenergy potential as
compared to the population,
USA: huge bio-potential but also high
fossil CO2 emissions,
Latin America: big bioenergy potential,
Import
possibilities for
Europe
Import possibilities
for Europe but less
and less from the
USA
Asia Strong growth in energy demand and
population, arable land very scarce
Demand for
bioenergy imports Strong demand for
imports
Europe Well endowed with arable land and
forests, stable population
Good import
possibilities –
America
Reduced import
possib., Europe has
to use its resources
better
Oceania Low population, huge potential for
bioenergy
Exports to Asia

Global Biomass Resources – Potential opportunities for trade
Structure:
Global issues: population, energy demand, emissions, land endowment
Facts and examples
outlook
Join the World Bioenergy Association (WBA)

Bioenergy and climate change
Biomass for energy: origin and potential by 2035
Forestry: fuel wood, forest residues, wood industry residues, black liquor (lignin from pulp mills) recovered wood, wood from landscape cleaning, processed forms; charcoal, pellets
Agriculture: animal by-products (manure-biogas), agriculutral by-products like straw, rice husk, sun flower shells, empty fruit bunch, bagasse, kernels from olive trees etc., energy crops, short rotatation coppices etc.
Waste streams: MSW (municipal solid waste – organic fraction), sewage sludge, waste from food industry,
World Bioenergy Association (WBA) – join the global voice of bioenergy! – www.worldbioenergy.org

Structure of global biomass supply 2010 source IPCC study
Biomass sector % EJ
Forestry (87%)
Fuelwood 67% 34.7
Charcoal 7% 3.62
Forest residues 1% 0.52
Black liquor 1% 0.52
Wood industry
residues 5% 2.59
Recovered wood 6% 3.11
Agriculture (10%)
Animal byproducts 3% 1.55
Agricultural
byproducts 4% 2.07
Energy crops 3% 1.55
Wastes (3%) MSW and landfill
gas 3% 1.55
Total 54.7
Table 22 Overview of biomass supply sources (in EJ, 2010)
Bioenergy 2014 estimated with 58.5 EJ, hereof 3,5 EJ pellets, 3 EJ biofuels)

The use of bioenergy by continents: Asia is leading, followed by Africa and the Americas

Bioenergy and climate change
2010 2035
Forestry 47.2 Medium increase
Agriculture 5.4 Strong increase
Waste 1.6 Strong increase
total 54.2 125 - 150
Supply of biomass, EJ (source 2010 IPCC)
Additional 80 EJ until 2035!

Global Biomass Resources – Potential opportunities for trade
Biomass in Europe 2012 and 2035
2012: bioenergy in Europe EU28
116Mtoe (4,8 EJ, 1 333 TWh as prim. Energy)
2014: Pellets consumption 0,35EJ (20 Mt equals 96TWh or 8,27 Mtoe.)
2035: bioenergy in EU europe as part of a climate mitigation strategy
Ca 200 – 230 Mtoe (about 9 EJ)
Assumed share of pellets 20% would be 40 Mtoe (ca 100 Mt pellets )
2035: European production: ?
2035: Imported pellets: ?
5 Mha decidated energy crops for solid biomass deliver 60Mt solid biomass as dry matter (1,08 EJ = 30 Mtoe = 300 TWh) that is 75% of the assumed 100 Mt pellets
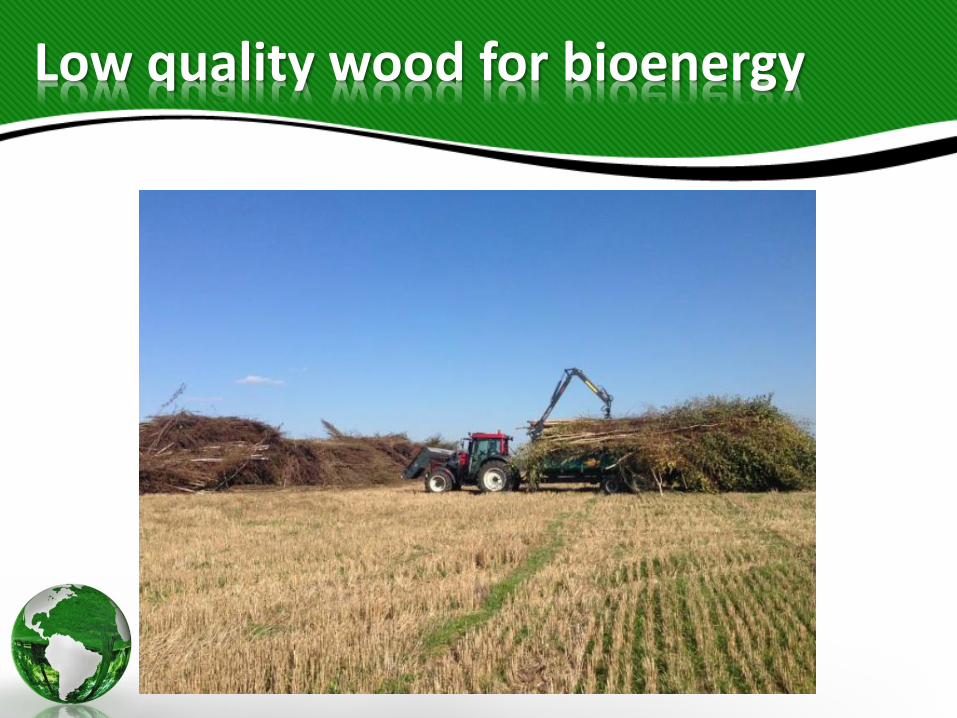
Low quality wood for bioenergy

Straw for bioenergy

A few clarifications
• ILUC is a misleading concept, that does not depict the real world, underestimates the innovation and dynamic of the agric. sector
• First generation fueLs are a by-product of the protein production, a too low limitiation as now in Europe limits the protein production and causes more protein imports from abroad.
• Dirty carbon and renewable carbon: dirty (fossil) carbon would remain in the earth crust forever if humans would not dig it out. The use of fossil carbon leads to a huge carbon debt! Renewable carbon in biomass origins from the atmosphere and is given back to it by decay or by use. It is part of the natural carbon cycle.
• Nature as example: we need a fossil free energy system but not a low carbon society – nature is not a low carbon system!
• !


Bioenergy and climate change
Overview about technologies for treatment of biomass:
- Baling, chipping
- Drying, grinding
- Pelletizing, briquetting
- Torrefaction
- Steam explosion
- Pyrolysis
World Bioenergy Association (WBA) – join the global voice of bioenergy! – www.worldbioenergy.org

Global Biomass Resources – Potential opportunities for trade
Structure:
Global issues: population, energy demand, emissions, land endowment
Facts and examples
outlook
Join the World Bioenergy Association (WBA)

Global Biomass Resources – Potential opportunities for trade
conclusions
!
Join the World Bioenergy Association!
Biomass trade is a global not an European issue
• Europe Short term opportunities:
Import possibilities from Africa and America
• Europe long term opportunities:
Import possibilities mainly from Canada and South America

Principles in the use of biomass
Efficiency
Sustainability
Cost competitive
Regional priority for production and use

Philip Lowe, former Directeur General of the EU energy
department:
Biomass is the only renewable, affordable energy source
available on-demand. European countries need to make
sure it is sourced sustainably, writes Philip Lowe.
Bioenergy and climate change

Philip Lowe: “Sweden is already getting it right.
Bioenergy is today the largest source of energy in the
overall mix, accounting for one-third of Sweden's energy
consumption. Since 1990, the Swedish economy has
grown by more than 50% in real terms, and at the same
time, greenhouse gas emissions have decreased by 23%. A
leading factor in this decoupling between economic growth
and emissions is the steady growth of bioenergy use, in all
sectors of the Swedish economy.”
Bioenergy and climate change

To cope with this challenge:
join the World Bioenergy Association (WBA)
World Bioenergy Association (WBA) – join the global voice of bioenergy! – www.worldbioenergy.org

World Bioenergy Association (WBA)
World Bioenergy Association (WBA) – join the global voice of bioenergy! – www.worldbioenergy.org

ANDRITZ
Iour official sponsor ANDRITZ and our silver sponsors:
KWB pellet boilers, AGRANA ethanol producer
Official Sponsors:
Thank you for your attention!

conclusions from this analysis by 2035: high emitter countries:
will have to reduce fossil fuels strongly in their energy mix; they will have to use a big share of their biomass in their own country, they are big difference between USA and Canada
Low emitter countries:
Africa – strong growth in energy demand, unsustainable biomasse use for cooking! They will need their biomass to replace unsustainable use by sustainable practices and cover part ot the growing demand by indigenous sustainable biomass
Medium emitters like Europe:
Limited import possiblilities from Africa and USA, better possibilites from Canada, Latin America and Russia, if a political accord can be reached.
Global Biomass Resources – Potential opportunities for trade conclusions


