
Biopolymers and bacterial carbonate for protection of...
81
Domien Fraeye natural stones Biopolymers and bacterial carbonate for protection of Academic year 2014-2015 Faculty of Engineering and Architecture Chairman: Prof. dr. ir. Korneel Rabaey Vakgroep Biochemische en Microbiële Technologie Chairman: Prof. dr. ir. Luc Taerwe Department of Structural Engineering Master of Science in Civil Engineering Master's dissertation submitted in order to obtain the academic degree of Counsellors: Yusuf Cagatay Ersan, Jianyun Wang Supervisors: Prof. dr. ir. Nele De Belie, Prof. dr. ir. Nico Boon
-
Upload
truonghanh -
Category
Documents
-
view
215 -
download
3
Transcript of Biopolymers and bacterial carbonate for protection of...
Domien Fraeye
natural stonesBiopolymers and bacterial carbonate for protection of
Academic year 2014-2015Faculty of Engineering and Architecture
Chairman: Prof. dr. ir. Korneel RabaeyVakgroep Biochemische en Microbiële Technologie
Chairman: Prof. dr. ir. Luc TaerweDepartment of Structural Engineering
Master of Science in Civil EngineeringMaster's dissertation submitted in order to obtain the academic degree of
Counsellors: Yusuf Cagatay Ersan, Jianyun WangSupervisors: Prof. dr. ir. Nele De Belie, Prof. dr. ir. Nico Boon

Acknowledgement
i
Acknowledgement
This master thesis would not have been established without the theoretical, technical and personal
support of many people.
My promoters prof. dr. ir. Nele De Belie and prof. dr. ir. Nico Boon who always brought me back to the
basics of the investigation. They helped me see the fundamental principles of my master thesis and
therefore deserve my thanks.
My counsellors Yusuf Çağatay Erşan, Jianyun Wang and Willem De Muynck have greatly aided in the
establishment of my master thesis. They are thanked for all my practical lab questions that they solved,
for their opinions on my results that gave me a better insight on the subject and for their fruitful
corrections and comments that they gave on the essay which you have before you.
I always felt welcome at LabMET and assistance in the lab, if it was technical or theoretical, was always
present. I want to thank Jana De Bodt, Greet Van de Velde and Renée Graveel for their technical
assistance and Frederiek – Maarten Kerckhof and Filipe Bravo Da Silva for their theoretical assistance.
A thanks to Philip Van den Heede, Tommy De Ghein, Marc Scheerlinck, Dieter Hillewaere from the
Magnel laboratory, who helped me with theoretical and technical questions I had.
I want to thank Hilde De Clercq and Tanaquil Berto from the KIK-IRPA for making their DRMS device
available on short notice and helping me with the operation of the device.
Family and friends gave a large personal support and always showed interest in my continues
lengthened lectures about my master thesis.
Admission to use
The author(s) gives (give) permission to make this master dissertation available for consultation and
to copy parts of this master dissertation for personal use.
In the case of any other use, the copyright terms have to be respected, in particular with regard to the
obligation to state expressly the source when quoting results from this master dissertation.
Domien Fraeye
May 22, 2015
Abstract
ii
Abstract
Biopolymers and bacterial carbonate for protection of natural stones
by
Domien Fraeye
Master’s dissertation submitted in order to obtain the academic degree of
Master of Science in Civil Engineering
Academic year 2014-2015
University Ghent
Supervisors: prof. dr. ir. Nele De Belie, prof. dr. ir. Nico Boon
Counsellors: Yusuf Çağatay Erşan, Jianyun Wang
Faculty of Engineering and Architecture Department of Structural Engineering
Chairman: Prof. dr. ir. Luc Taerwe
Faculty of Bioscience Engineering Department of Biochemical and Microbial Technology
Chairman: Prof. dr. ir. Korneel Rabaey
The first goal of this master’s dissertation was to investigate the feasibility of a ‘hydrophobic concrete’
through the use of the hydrophobic biofilm produced by Bacillus subtilis under stressed conditions. In
order to obtain the most hydrophobic biofilm, an optimal growth procedure of the bacteria was
investigated.
The second goal was to further optimize the surface treatment by use of bacterially induced calcium
carbonate precipitation on Maastricht limestone. The bacterium used was a ureolytic strain, Bacillus
sphaericus. The optimized treatment was then applied on degraded Euville and Avesnes limestone and
iron sandstone to improve the surface properties, which were characterized by ultrasonic velocity and
drilling resistance measurements. This treatment was also compared with the commercial ethyl silicate
KSE 300 treatment from Remmers.
The hydrophobic character of the Bacillus subtilis biofilm could not be achieved in this study. This was
attributed to the limited extracellular polymeric substances (EPS) formation under investigated
conditions.
The procedure for ureolytic induced calcium carbonate precipitation was further optimized. The
influence of the number of treatments and treatment time was investigated to obtain an optimal
treatment for the Maastricht, Euville and Avesnes limestone and iron sandstone. The effect of the
treatment was much more pronounced for the Maastricht stone than for the Euville and Avesnes
limestone and iron sandstone. The effect of the ethyl silicate treatment on the hardness profile was
comparable with the effect due to biodeposition treatment.
Keywords: biofilm, biodeposition, urea, bacteria, stone.
iii
Biopolymers and bacterial carbonate for protection
of natural stones
Domien Fraeye
Supervisors: prof. dr. ir. N. De Belie, prof. dr. ir. Nico Boon, Yusuf Çağatay Erşan and Jianyun Wang
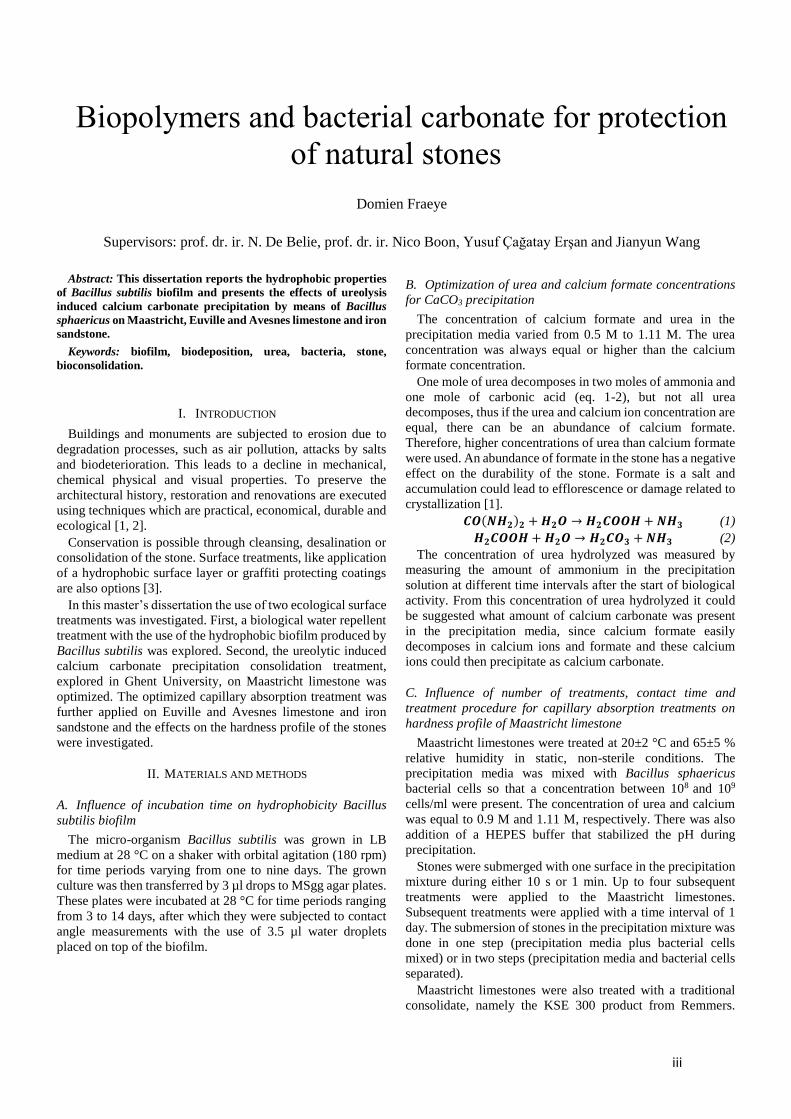
Abstract: This dissertation reports the hydrophobic properties
of Bacillus subtilis biofilm and presents the effects of ureolysis
induced calcium carbonate precipitation by means of Bacillus
sphaericus on Maastricht, Euville and Avesnes limestone and iron
sandstone.
Keywords: biofilm, biodeposition, urea, bacteria, stone,
bioconsolidation.
I. INTRODUCTION
Buildings and monuments are subjected to erosion due to
degradation processes, such as air pollution, attacks by salts
and biodeterioration. This leads to a decline in mechanical,
chemical physical and visual properties. To preserve the
architectural history, restoration and renovations are executed
using techniques which are practical, economical, durable and
ecological [1, 2].
Conservation is possible through cleansing, desalination or
consolidation of the stone. Surface treatments, like application
of a hydrophobic surface layer or graffiti protecting coatings
are also options [3].
In this master’s dissertation the use of two ecological surface
treatments was investigated. First, a biological water repellent
treatment with the use of the hydrophobic biofilm produced by
Bacillus subtilis was explored. Second, the ureolytic induced
calcium carbonate precipitation consolidation treatment,
explored in Ghent University, on Maastricht limestone was
optimized. The optimized capillary absorption treatment was
further applied on Euville and Avesnes limestone and iron
sandstone and the effects on the hardness profile of the stones
were investigated.
II. MATERIALS AND METHODS
A. Influence of incubation time on hydrophobicity Bacillus
subtilis biofilm
The micro-organism Bacillus subtilis was grown in LB
medium at 28 °C on a shaker with orbital agitation (180 rpm)
for time periods varying from one to nine days. The grown
culture was then transferred by 3 µl drops to MSgg agar plates.
These plates were incubated at 28 °C for time periods ranging
from 3 to 14 days, after which they were subjected to contact
angle measurements with the use of 3.5 µl water droplets
placed on top of the biofilm.
B. Optimization of urea and calcium formate concentrations
for CaCO3 precipitation
The concentration of calcium formate and urea in the
precipitation media varied from 0.5 M to 1.11 M. The urea
concentration was always equal or higher than the calcium
formate concentration.
One mole of urea decomposes in two moles of ammonia and
one mole of carbonic acid (eq. 1-2), but not all urea
decomposes, thus if the urea and calcium ion concentration are
equal, there can be an abundance of calcium formate.
Therefore, higher concentrations of urea than calcium formate
were used. An abundance of formate in the stone has a negative
effect on the durability of the stone. Formate is a salt and
accumulation could lead to efflorescence or damage related to
crystallization [1].
𝑪𝑶(𝑵𝑯𝟐)𝟐 + 𝑯𝟐𝑶 → 𝑯𝟐𝑪𝑶𝑶𝑯 + 𝑵𝑯𝟑 (1)
𝑯𝟐𝑪𝑶𝑶𝑯 + 𝑯𝟐𝑶 → 𝑯𝟐𝑪𝑶𝟑 + 𝑵𝑯𝟑 (2)
The concentration of urea hydrolyzed was measured by
measuring the amount of ammonium in the precipitation
solution at different time intervals after the start of biological
activity. From this concentration of urea hydrolyzed it could
be suggested what amount of calcium carbonate was present
in the precipitation media, since calcium formate easily
decomposes in calcium ions and formate and these calcium
ions could then precipitate as calcium carbonate.
C. Influence of number of treatments, contact time and
treatment procedure for capillary absorption treatments on
hardness profile of Maastricht limestone
Maastricht limestones were treated at 20±2 °C and 65±5 %
relative humidity in static, non-sterile conditions. The
precipitation media was mixed with Bacillus sphaericus
bacterial cells so that a concentration between 108 and 109
cells/ml were present. The concentration of urea and calcium
was equal to 0.9 M and 1.11 M, respectively. There was also
addition of a HEPES buffer that stabilized the pH during
precipitation.
Stones were submerged with one surface in the precipitation
mixture during either 10 s or 1 min. Up to four subsequent
treatments were applied to the Maastricht limestones.
Subsequent treatments were applied with a time interval of 1
day. The submersion of stones in the precipitation mixture was
done in one step (precipitation media plus bacterial cells
mixed) or in two steps (precipitation media and bacterial cells
separated).
Maastricht limestones were also treated with a traditional
consolidate, namely the KSE 300 product from Remmers.
iv
Traditional products were applied as to have a reference for the
increase in hardness on limestones for the biodeposition
treatments.
The consolidation effect of bio-genic precipitation on the
limestones hardness profile was investigated through the use
of ultrasonic measurements and the drilling resistance
measurement system (DRMS). Ultrasonic measurements were
performed up to a depth of 10 cm from the treated surface. Due
to their non-destructive character, they could be performed on
each stone before the treatment and at the end of the treatment.
DRMS was done up to a depth of 3.8 cm from the treated
surface. For these measurements, reference stones (untreated
stones) were required since the DRMS is destructive and
cannot be performed on the same stone before and after
treatment. DRMS was done three weeks after the treatment.
D. Influence of number of treatments and absorption time of
treatment for capillary absorption treatments on hardness
profile of Avesnes and Euville limestone and iron sandstone.
Similar treatments applied on Maastricht limestones were
also applied on Avesnes, Euville and iron sandstones. Both
biodeposition treatments and traditional consolidate
treatments with the KSE 300 product from Remmers were
applied on the stones.
The effect of the precipitation on the hardness profiles of the
stone were investigated by means of ultrasonic measurements
and DRMS, as used with Maastricht stones.
III. RESULTS AND DISCUSSION
A. Influence of incubation time on hydrophobicity Bacillus
subtilis biofilm
All contact angles lied in the range of 4 to 40°. A contact
angle larger than 90° results in a hydrophobic surface. The
results indicate that no hydrophobic biofilms were present. A
possible reason for this could be limited EPS formation.
Further research should be conducted to obtain a hydrophobic
biofilm as previously reported by Epstein et al. [4] and Branda
et al. [5].
B. Optimization of urea and calcium formate concentrations
for CaCO3 precipitation
It was shown that a higher urea and calcium formate
concentration resulted in a higher concentration of urea
degraded. This results in a higher amount of calcium carbonate
precipitation, if sufficient calcium ions are present.
If the calcium formate concentration was lower than the urea
concentration, then the percentage hydrolyzed urea was lower
compared with a solution containing an equal amount of urea
and calcium formate.
The highest concentration tested for calcium formate was
1.11 M, which was close to the solubility of the product (1.28
M at 20 °C). Therefore, it was decided to keep the
concentration of calcium formate at 0.9 M in further
treatments. The concentration of urea and calcium formate
were kept equal, since a higher concentration of urea compared
to the concentration of calcium formate resulted in a negative
effect on the urea hydrolysis.
C. Influence of number of treatments, contact time and
treatment procedure for capillary absorption treatments on
hardness profile of Maastricht limestone
A higher number of treatments and/or a higher absorption
time resulted in a higher increase in the hardness profile of the
Maastricht stone after treatment. The ultrasonic measurements
also showed an increase in solids inside the stone after the
treatment. For a high number of treatments, however, there
was an effect of the humidity of the stones on the ultrasonic
measurements. This made it difficult to obtain good
quantitative results.
Strength increases ranging from 1.2 to 2.4 times the original
strength over a depth of 38 mm of the limestones were
observed with DRMS. A single 10 s ethyl silicate treatment
with the KSE 300 product resulted in a strength increase of the
Maastricht stone that was in between a single and double 10 s
biodeposition treatment.
D. Influence of number of treatments and absorption time of
treatment for capillary absorption treatments on hardness
profile of Avesnes and Euville limestone and iron sandstone.
Due to the low porosity and thus a low capillary absorbed
mass of the solutions for the Avesnes, Euville and iron
sandstone compared to the Maastricht stone [2], there was no
visible effect of the treatment for neither biodeposition nor the
ethyl silicate KSE 300 product. In this study it was shown that
Avesnes, Euville and iron sandstone have a higher hardness
profile compared to the Maastricht stone. This also made it
more difficult to observe an additional strength increase in the
Avesnes, Euville and iron sandstone.
IV. CONCLUSIONS
Capillary absorption biodeposition treatment for Maastricht
stones resulted into a strength increases up to 140 % compared
to the untreated stones. The effect of the biodeposition
treatment on the hardness profile of a Maastricht stone was
comparable to the effect by the traditional consolidate KSE
300 by Remmers.
For capillary absorption treatments on Euville and Avesnes
and iron sandstones, there was no visible strengthening effect
for neither biodeposition treatment nor traditional consolidate
treatment with the KSE 300 product.
REFERENCES
[1] De Muynck, W., De Belie, N. and Verstraete, W., 2010a. Microbial carbonate precipitation in construction materials: A review. Ecological
Engineering 36, 118-136.
[2] Dusar, M., Dreesen, R. en De Naeyer, A., 2009. Natuursteen in Vlaanderen, versteend verleden. Mechelen, Wolters Kluwer België
NV.
[3] Doehne, E.F., Price, C.A. and Institute, T.G.C., 2011. Stone Conservation: An Overview of Current Research, J Paul Getty Museum
Publications.
[4] Epstein, A.K., Pokroy, B., Seminara, A. and Aizenberg, J., 2011. Bacterial biofilm shows persistent resistance to liquid wetting and gas
penetration. Proceedings of the National Academy of Sciences 108,
995-1000.
[5] Branda, S.S., González-Pastor, J.E., Ben-Yehuda, S., Losick, R. and
Kolter, R., 2001. Fruiting body formation by Bacillus subtilis. Proceedings of the National Academy of Sciences 98, 11621-11626.
Table of contents
v
Table of contents
Acknowledgement .................................................................................................................................... i
Abstract ....................................................................................................................................................ii
Extended abstract ................................................................................................................................... iii
Table of contents ...................................................................................................................................... v
List of abbreviations and symbols ......................................................................................................... viii
Chapter 1: Literature review ................................................................................................................... 1
1. Biofilms ........................................................................................................................................ 1
1.1. Introduction ......................................................................................................................... 1
1.2. Steps of biofilm formation ................................................................................................... 1
1.2.1. Surface conditioning film on substratum .................................................................... 1
1.2.2. Transport of microorganisms near the surface ........................................................... 2
1.2.3. Adhesion of microorganism to surface (step 1: reversible) ........................................ 2
1.2.4. Adhesion of microorganism to surface (step 2: irreversible) ...................................... 2
1.2.5. Microcolony formation ................................................................................................ 3
1.2.6. Biofilm maturation ...................................................................................................... 3
1.2.7. Biofilm cell detachment/dispersal ............................................................................... 3
2. Hydrophobicity quantification .................................................................................................... 3
3. Bacillus subtilis biofilm resistance to liquid wetting ................................................................... 4
4. Precipitation of CaCO3 ................................................................................................................. 6
5. Microbiologically Induced Carbonate Precipitation (MICP) ........................................................ 7
6. Biodeposition treatments............................................................................................................ 8
6.1. Calcite Bioconcept (France) ................................................................................................. 8
6.2. University of Granada (Spain).............................................................................................. 8
6.3. University of Ghent (Belgium) ............................................................................................. 9
6.4. Biobrush consortium (United Kingdom) ............................................................................ 10
6.5. Bioreinforce consortium (Italy) ......................................................................................... 10
6.6. Activator medium (Spain) .................................................................................................. 11
7. Influencing parameters for biodeposition treatment with use of urea .................................... 11
7.1. Urea and calcium dosage .................................................................................................. 11
7.2. Pore structure .................................................................................................................... 12
7.3. Temperature ...................................................................................................................... 12
Chapter 2: Materials .............................................................................................................................. 14
1. Nutrients .................................................................................................................................... 14
Table of contents
vi
2. Bacterial strains ......................................................................................................................... 15
2.1. Bacillus subtilis ................................................................................................................... 15
2.2. Bacillus sphaericus ............................................................................................................. 15
3. Natural stones ........................................................................................................................... 15
3.1. Maastricht limestone ........................................................................................................ 15
3.2. Euville stone ...................................................................................................................... 15
3.3. Iron sandstone ................................................................................................................... 16
3.4. Avesnes stone .................................................................................................................... 16
4. Tetraethyl orthosilicate (TEOS) consolidate KSE 300 (Remmers, 2014) ................................... 17
5. Activated Compact Denitrifying Core (ACDC) and Cyclic EnRiched Ureolytic Powder (CERUP) 17
Chapter 3: Methods .............................................................................................................................. 18
1. TAN measurement with steam distillation ................................................................................ 18
2. pH measurement ....................................................................................................................... 18
3. Contact angle measurements ................................................................................................... 18
4. Cultivating bacterial strains ....................................................................................................... 19
4.1. Bacillus subtilis ................................................................................................................... 19
4.2. Bacillus sphaericus ............................................................................................................. 20
5. Biodeposition............................................................................................................................. 21
6. Treatment through capillary absorption and submersion ........................................................ 22
7. Ultrasonic measurements ......................................................................................................... 25
8. Drilling Resistance Measurement System (DRMS) .................................................................... 26
9. Statistical analysis ...................................................................................................................... 27
Chapter 4: Results ................................................................................................................................. 28
1. Contact angle measurements Bacillus subtilis biofilm .............................................................. 28
2. Optimization of concentration calcium formate and urea for urea hydrolysis by Bacillus
sphaericus .......................................................................................................................................... 28
3. Influence of the concentration of calcium formate and urea on pH of the media ................... 32
4. Influence of HEPES buffer, tap and demi water on urea hydrolysis ......................................... 36
5. Influence of HEPES buffer, tap and demi water on pH level of the media ............................... 37
6. Influence of calcium source on urea hydrolysis ........................................................................ 37
7. Influence of calcium source on pH level precipitation media ................................................... 38
8. Ultrasonic measurements ......................................................................................................... 39
8.1. Maastricht limestone ........................................................................................................ 39
8.2. Euville stone ...................................................................................................................... 45
8.3. Iron sandstone ................................................................................................................... 46
8.4. Avesnes stone .................................................................................................................... 46
Table of contents
vii
9. DRMS ......................................................................................................................................... 47
9.1. Maastricht limestone ........................................................................................................ 47
9.2. Euville stone ...................................................................................................................... 50
9.3. Iron sandstone ................................................................................................................... 51
9.4. Avesnes stone .................................................................................................................... 52
Chapter 5: Discussion ............................................................................................................................ 54
1. Contact angle measurements Bacillus subtilis biofilm .............................................................. 54
2. Optimization of the concentration of calcium formate and urea for urea hydrolysis by Bacillus
sphaericus .......................................................................................................................................... 54
3. Influence of the concentration of calcium formate and urea on pH of precipitation media ... 54
4. Ultrasonic measurements ......................................................................................................... 55
4.1. Maastricht limestone ........................................................................................................ 55
4.2. Euville, Avesnes and iron sandstone ................................................................................. 55
5. DRMS ......................................................................................................................................... 56
5.1. Maastricht limestone ........................................................................................................ 56
5.2. Euville, Avesnes and iron stone ......................................................................................... 56
Conclusions ............................................................................................................................................ 58
References ............................................................................................................................................. 59
Attachment A: statistical analysis.......................................................................................................... 67
Attachment B: absorbed mass stones ................................................................................................... 68
List of abbreviations and symbols
viii
List of abbreviations and symbols
ACDC activated compact denitrifying core
CERUP cyclic enriched ureolytic powder
CFU colony forming units
DIC dissolved inorganic carbon
DRMS drilling resistance measurement system
EPS extracellular polymeric substances
eq./eqs. equation/equations
g gravitational acceleration (9.81 m/s²)
HEPES 4-(2-hydroxyethyl)-1-piperazineethanesulfonic acid
MICP microbiologically induced carbonate precipitation
MOPS 3-(N-morpholino)propanesulfonic acid
N/A not applicable
OD610 optical density for 610 nm light beam
OMP outer membrane proteins
RH relative humidity
rpm rotations per minute
TEOS tetraethyl orthosilicate
1. Biofilms
1
Chapter 1: Literature review
1. Biofilms
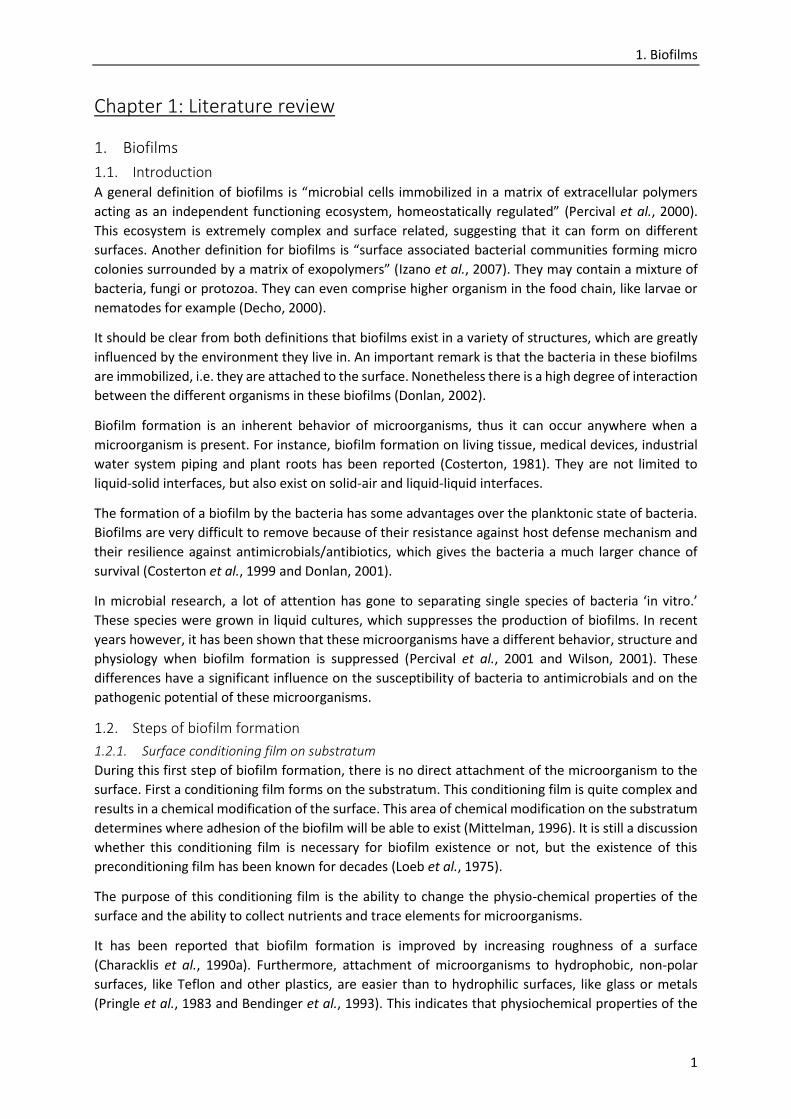
1.1. Introduction A general definition of biofilms is “microbial cells immobilized in a matrix of extracellular polymers
acting as an independent functioning ecosystem, homeostatically regulated” (Percival et al., 2000).
This ecosystem is extremely complex and surface related, suggesting that it can form on different
surfaces. Another definition for biofilms is “surface associated bacterial communities forming micro
colonies surrounded by a matrix of exopolymers” (Izano et al., 2007). They may contain a mixture of
bacteria, fungi or protozoa. They can even comprise higher organism in the food chain, like larvae or
nematodes for example (Decho, 2000).
It should be clear from both definitions that biofilms exist in a variety of structures, which are greatly
influenced by the environment they live in. An important remark is that the bacteria in these biofilms
are immobilized, i.e. they are attached to the surface. Nonetheless there is a high degree of interaction
between the different organisms in these biofilms (Donlan, 2002).
Biofilm formation is an inherent behavior of microorganisms, thus it can occur anywhere when a
microorganism is present. For instance, biofilm formation on living tissue, medical devices, industrial
water system piping and plant roots has been reported (Costerton, 1981). They are not limited to
liquid-solid interfaces, but also exist on solid-air and liquid-liquid interfaces.
The formation of a biofilm by the bacteria has some advantages over the planktonic state of bacteria.
Biofilms are very difficult to remove because of their resistance against host defense mechanism and
their resilience against antimicrobials/antibiotics, which gives the bacteria a much larger chance of
survival (Costerton et al., 1999 and Donlan, 2001).
In microbial research, a lot of attention has gone to separating single species of bacteria ‘in vitro.’
These species were grown in liquid cultures, which suppresses the production of biofilms. In recent
years however, it has been shown that these microorganisms have a different behavior, structure and
physiology when biofilm formation is suppressed (Percival et al., 2001 and Wilson, 2001). These
differences have a significant influence on the susceptibility of bacteria to antimicrobials and on the
pathogenic potential of these microorganisms.
1.2. Steps of biofilm formation
1.2.1. Surface conditioning film on substratum
During this first step of biofilm formation, there is no direct attachment of the microorganism to the
surface. First a conditioning film forms on the substratum. This conditioning film is quite complex and
results in a chemical modification of the surface. This area of chemical modification on the substratum
determines where adhesion of the biofilm will be able to exist (Mittelman, 1996). It is still a discussion
whether this conditioning film is necessary for biofilm existence or not, but the existence of this
preconditioning film has been known for decades (Loeb et al., 1975).
The purpose of this conditioning film is the ability to change the physio-chemical properties of the
surface and the ability to collect nutrients and trace elements for microorganisms.
It has been reported that biofilm formation is improved by increasing roughness of a surface
(Characklis et al., 1990a). Furthermore, attachment of microorganisms to hydrophobic, non-polar
surfaces, like Teflon and other plastics, are easier than to hydrophilic surfaces, like glass or metals
(Pringle et al., 1983 and Bendinger et al., 1993). This indicates that physiochemical properties of the
Chapter 1: Literature review
2
substratum also affect the microbial adhesion. However, this conclusion needs to be handled with
care, since some studies have proven to be contradictory. This contradiction is due to the fact that
there is no standardized method for hydrophobicity measurements (Percival et al., 2011).
1.2.2. Transport of microorganisms near the surface
Transport of the microorganisms can be either in a laminar or turbulent flow. Laminar flow consists of
parallel streamlines and is visualized as a smooth flow. This flow does not consist of intermixing of the
fluid, in other words, all the particles follow similar paths and have a transversal direction (Fletcher et
al., 1982 and Lappin-Scott et al., 1993).
Turbulent flow is characterized by intermixing of the microorganism and nutrients and thus increases
the microbial adherence (Parceval et al., 1999). Eddy currents, which consist of random upward and
downward forces help this mixing and adhesion process.
If no flow is present, then Brownian diffusion, gravity and microbial motility still help the attachment
process (Bryers, 1987). Certainly motility helps the adhesion process (Fletcher, 1977 and Marmur et
al., 1986). Contrary, when a reduction of motility was present there was also a reduction in adhesion
(Fletcher, 1977).
1.2.3. Adhesion of microorganism to surface (step 1: reversible)
If the planktonic microorganism reaches close proximity of the surface, its adhesion to it depends on
the net attraction and repulsion forces between the two surfaces. These interaction forces consist of
van der Waals forces (Deneyer et al., 1993), electrostatic and hydrophobic forces (Melo et al., 1997
and Kumar et al., 2006).
When distances between two surfaces are greater than 50 nm, only van der Waals forces are present.
For distances around 10-20 nm, both van der Waal and electrostatic forces are present and when the
distance between the two surfaces gets lower than 1.5 nm, all three forces are present (van der Waal,
electrostatic and hydrophobic) (Percival et al., 2011).
The first adhesion step is reversible and when the environment is not favorable for a microbial
attachment, it will detach from the surface (Ghannoum et al., 2004). As already discussed, this
adhesion can be enhanced by using a rougher and a more hydrophobic surface (Palmer et al., 1997) or
coating the surface with a conditioning film (Schwartz et al., 1998, Kalmokof et al., 2001 and Liu et al,
2004).
A biofilm can consist of multiple microorganisms that sustain or destroy each other. The metabolic
byproducts produced by one microorganism can serve as support for the growth of another
microorganism (Molobela, 2010). It can also be that the attachment of one microorganism lies the
fundaments for the attachment of others (Dunne, 2002). On the other hand, the depletion of nutrients
and production of toxins by some microorganisms can decrease the diversity in microorganisms within
the biofilm (Marsh, 1995).
1.2.4. Adhesion of microorganism to surface (step 2: irreversible)
After a reversible attachment, a molecular binding will occur between the microorganism and the
substratum (Kumar et al., 2006). For this process, the microorganisms that have reversible bounds
produce exopolysaccharides that bind microorganisms and substratum together (An et al., 2000,
Rachid et al. 2000 and Li et al, 2007). After this adhesion process, an increased amount of extracellular
polymeric substances (EPS) is produced by the bacteria. Additionally, the resistance against UV light
and antibiotics also increases due to the production of these extra EPS compounds (O’Toole et al.,
2000).
2. Hydrophobicity quantification
3
A number of structures, such as fimbriae, flagella, outer membrane proteins (OMP), curli and EPS play
an important role in the production of the biofilm (Watnick et al., 1999). Fimbriae affects the cell
hydrophobicity, because it contains hydrophobic amino acid residues (Rosenberg et al., 1986). Flagella
motility takes care of the forces that repel bacteria from abiotic surfaces (Giaouris et al., 2006) and is
thus important in the early stages of attachment. After the surface is reached, curli, OMP and other
appendages are needed to have a stable cell-to-surface and cell-to-cell attachment (Molobela, 2010).
1.2.5. Microcolony formation
After the bacteria is attached to the surface, it becomes stable for microcolony formation (O’Tool et
al., 2000). The bacteria can multiply and produce chemical signals that are transmitted between the
bacterial cells, which allow for an effective communication. If the magnitude of these signals reaches
a certain level, then the production of exopolysaccharides starts. Bacteria can multiple embedded in
the exopolysaccharide matrix and become a microcolony (Prakash et al., 2003). When the
microcolonies grow in size, they are separated from each other by fluid filled channels (Allison, 2003).
1.2.6. Biofilm maturation
This process only starts once the bacteria are irreversibly adhered to the surface. The complexity and
density of the biofilm increases while the attached microorganisms start to grow. Growth of the biofilm
is limited by the nutrients available in the environment and by the removal of metabolic waste out of
the biofilm (O’ Toole et al., 1998). It has also been reported that there is an optimal flow across the
biofilm for a maximal growth (Carpentier et al., 1993).
There are also some other factors that determine the growth of the biofilm: internal pH, oxygen,
osmolality, electrolyte concentration, carbon source, temperature and flux of materials and surface
types (Molobela, 2010).
The biofilm reaches a critical mass at some point and the outer layers start to generate planktonic
microorganisms. These organisms escape the biofilm and can colonize other free surfaces. The cells
that are situated near the surface start dying because of a lack of nutrients, a decrease in pH, pO2 or
an accumulation of toxic metabolic products (Dunne, 2002).
1.2.7. Biofilm cell detachment/dispersal
A lot of factors can influence the detachment of biofilm cells. One example is that shear effects of the
surrounding liquid apply enough pressure to detach cells (Brugnoni et al., 2007). Some bacteria also
stop producing EPS, after which they are detached from the colony (Herrera et al, 2007). The spreading
of microorganism is either done by shedding new cells or detachment of parts from biofilm (Spiers et
al., 2003). These microorganism can start a new colony once they are transported to a new location.
The detachment process is characterized as an interfacial transfer process that involves the transfer of
cells and other components of the biofilm to the surrounding liquid (Characklis, 1990a and b).
It is not a given fact that detachment from surfaces is disadvantages for survival of the biofilm.
However, it has been found that biofilms with higher detachment rates have more active cells. Biofilm
detachment has also been reported when low amounts of nutrients are available. The detachment is
thus used for obtained a generic diversity of microorganisms and for discarding unfavorable habitats
(Percival et al., 2011).
2. Hydrophobicity quantification So far, there is no uniform method to measure/quantify the hydrophobicity of substances. If solid
materials need to be quantified, then the contact angle measurement for flat surfaces (Figure 1) and
the thin-layer wicking method for particulate materials are the most common methods (Teixeira et al.,
Chapter 1: Literature review
4
1998). For microbial cells, used methods are: salt aggregation test, microbial adhesion to
hydrocarbons, microsphere adhesion and hydrophobic interaction chromatography. It is noted that
there are more methods used, but these are the most common ones. The number of testing methods
is also higher for hydrophobicity measurements on microbial cells compared to solid surfaces (Doyle,
2000 and van der Mei et al., 1987).
Some of these microbial hydrophobicity methods are influenced by temperature, time, pH, ionic
strength or relative concentration of interacting species (Ofek et al., 1994).
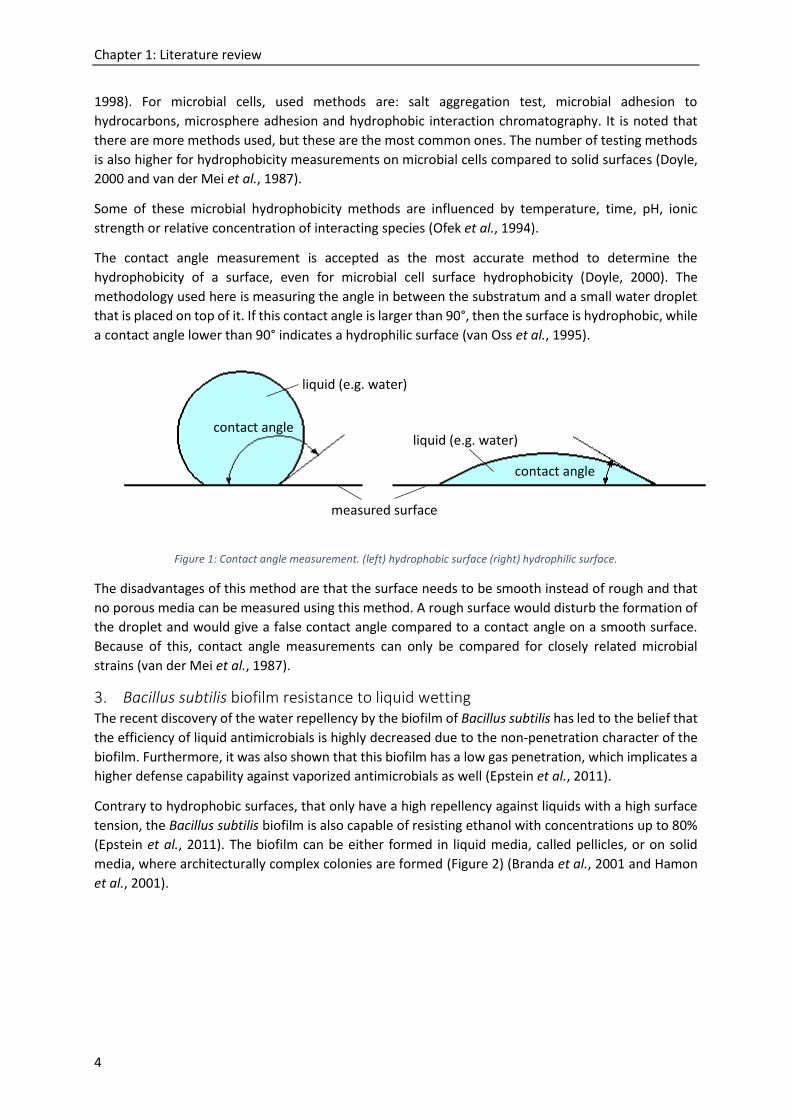
The contact angle measurement is accepted as the most accurate method to determine the
hydrophobicity of a surface, even for microbial cell surface hydrophobicity (Doyle, 2000). The
methodology used here is measuring the angle in between the substratum and a small water droplet
that is placed on top of it. If this contact angle is larger than 90°, then the surface is hydrophobic, while
a contact angle lower than 90° indicates a hydrophilic surface (van Oss et al., 1995).
Figure 1: Contact angle measurement. (left) hydrophobic surface (right) hydrophilic surface.
The disadvantages of this method are that the surface needs to be smooth instead of rough and that
no porous media can be measured using this method. A rough surface would disturb the formation of
the droplet and would give a false contact angle compared to a contact angle on a smooth surface.
Because of this, contact angle measurements can only be compared for closely related microbial
strains (van der Mei et al., 1987).
3. Bacillus subtilis biofilm resistance to liquid wetting The recent discovery of the water repellency by the biofilm of Bacillus subtilis has led to the belief that
the efficiency of liquid antimicrobials is highly decreased due to the non-penetration character of the
biofilm. Furthermore, it was also shown that this biofilm has a low gas penetration, which implicates a
higher defense capability against vaporized antimicrobials as well (Epstein et al., 2011).
Contrary to hydrophobic surfaces, that only have a high repellency against liquids with a high surface
tension, the Bacillus subtilis biofilm is also capable of resisting ethanol with concentrations up to 80%
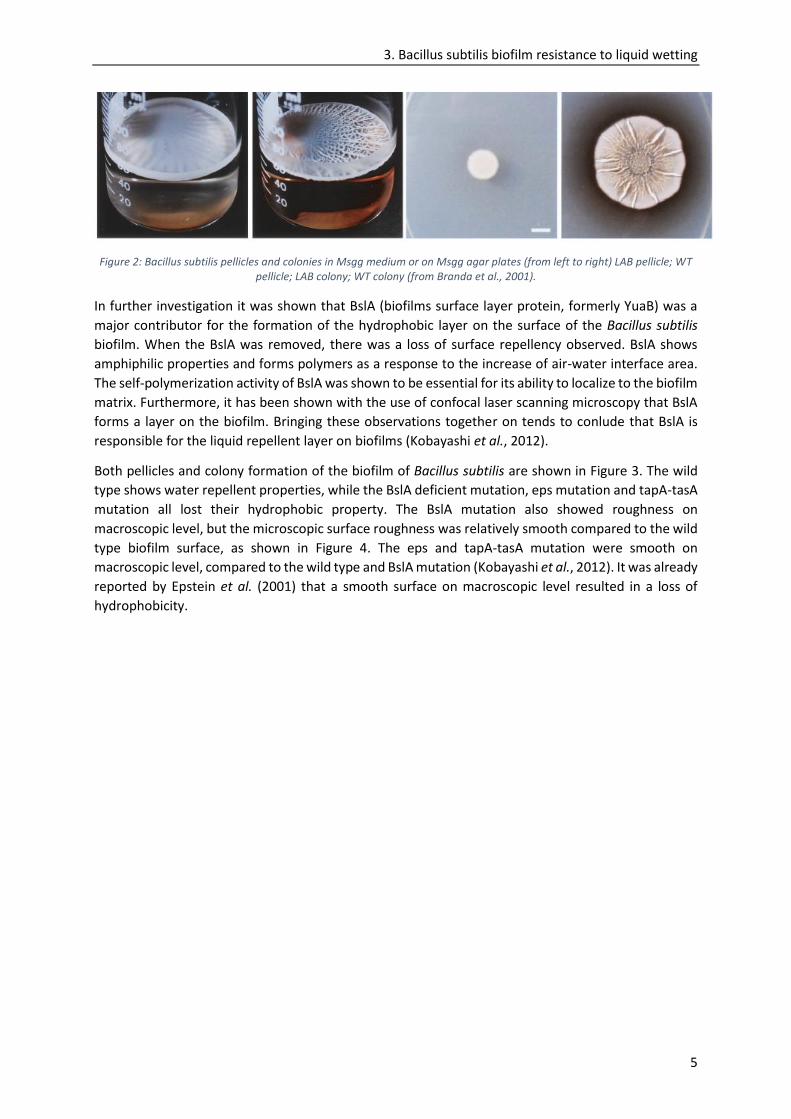
(Epstein et al., 2011). The biofilm can be either formed in liquid media, called pellicles, or on solid
media, where architecturally complex colonies are formed (Figure 2) (Branda et al., 2001 and Hamon
et al., 2001).
contact angle
contact angle
liquid (e.g. water)
measured surface
liquid (e.g. water)
3. Bacillus subtilis biofilm resistance to liquid wetting
5
Figure 2: Bacillus subtilis pellicles and colonies in Msgg medium or on Msgg agar plates (from left to right) LAB pellicle; WT pellicle; LAB colony; WT colony (from Branda et al., 2001).
In further investigation it was shown that BslA (biofilms surface layer protein, formerly YuaB) was a
major contributor for the formation of the hydrophobic layer on the surface of the Bacillus subtilis
biofilm. When the BslA was removed, there was a loss of surface repellency observed. BslA shows
amphiphilic properties and forms polymers as a response to the increase of air-water interface area.
The self-polymerization activity of BslA was shown to be essential for its ability to localize to the biofilm
matrix. Furthermore, it has been shown with the use of confocal laser scanning microscopy that BslA
forms a layer on the biofilm. Bringing these observations together on tends to conlude that BslA is
responsible for the liquid repellent layer on biofilms (Kobayashi et al., 2012).
Both pellicles and colony formation of the biofilm of Bacillus subtilis are shown in Figure 3. The wild
type shows water repellent properties, while the BslA deficient mutation, eps mutation and tapA-tasA
mutation all lost their hydrophobic property. The BslA mutation also showed roughness on
macroscopic level, but the microscopic surface roughness was relatively smooth compared to the wild
type biofilm surface, as shown in Figure 4. The eps and tapA-tasA mutation were smooth on
macroscopic level, compared to the wild type and BslA mutation (Kobayashi et al., 2012). It was already
reported by Epstein et al. (2001) that a smooth surface on macroscopic level resulted in a loss of
hydrophobicity.

Chapter 1: Literature review
6
Figure 3: Water repellency biofilm Bacillus subtilis. 2xSGG liquid (left) or solid medium (right) was used. For colony formation, top, side and detailed top view are shown. Five-microliter water drops were colored with xylene cyanol. (from top to bottom) wild type Bacillus subtilis; bslA deficient mutant Bacillus subtilis; eps deficient mutant Bacillus subtilis; tapA-tasA
deficient mutant Bacillus subtilis. Scale bars, 2 mm (from Kobayashi et al., 2012).
Figure 4: Surface microstructure of wild-type and BslA mutant biofilm. Scale bars, 10 µm (from Kobayashi et al., 2012).
4. Precipitation of CaCO3 Calcium carbonate precipitation is a chemical process governed by four parameters: (1) the calcium
ion concentration, (2) the dissolved inorganic carbon concentration (3) the pH level (4) the availability
of nucleation sites (Hammes et al., 2002). If the ion activity product of calcium and carbonate ions
exceeds the solubility constant of calcium carbonate (𝐾𝑠𝑜 𝑐𝑎𝑙𝑐𝑖𝑡𝑒), then there is precipitation of CaCO3
(eq. 1) (Morse, 1983).

5. Microbiologically Induced Carbonate Precipitation (MICP)
7
𝐶𝑎2+ + 𝐶𝑂32− ⇌ 𝐶𝑎𝐶𝑂3 𝐾𝑠𝑜 𝑐𝑎𝑙𝑐𝑖𝑡𝑒,25°𝐶 = 4.8 ∗ 10−9 (1)
The concentration of carbonate ions is influenced by the dissolved inorganic carbon (DIC) and the pH
level in an aqueous environment (eqs. 2 – 5 at 25°C and 1 atm).
𝐶𝑂2 (𝑔) ⇌ 𝐶𝑂2 (𝑎𝑞) 𝑘𝐻 = 29 (2)
𝐶𝑂2 (𝑎𝑞) + 𝐻2𝑂 ⇌ 𝐻2𝐶𝑂3∗ 𝑝𝐾 = 2.8 (3)
𝐻2𝐶𝑂3∗ ⇌ 𝐻+ + 𝐻𝐶𝑂3
− 𝑝𝐾 = 6.4 (4)
𝐻𝐶𝑂3− ⇌ 𝐻+ + 𝐶𝑂3
2− 𝑝𝐾 = 10.3 (5)
If this aqueous environment is connected with the atmosphere, then the concentration of dissolved
inorganic carbon is also related to environmental parameters of the atmosphere, such as temperature
and partial pressure of carbon dioxide (Stumm et al., 1981).
5. Microbiologically Induced Carbonate Precipitation (MICP) Microbiologically induced carbonate precipitation is a process where solidified carbonate crystals (e.g.
calcium carbonate) are deposited in a biological system (Mann, 2002). There is a difference in between
biological induced and biological controlled mineralization (Lowenstan et al., 1989). In case of a
biological induced mechanism, the type of mineral produced is largely dependent on the
environmental conditions and no specific molecular mechanism or specialized structures are being
involved (Rivadeneyra et al., 1994; Knorre et al., 2000). For biological controlled mineralization, the
microorganism controls the nucleation and growth of the mineral particles to a high degree. The
mineralization process is dependent on the microorganism and independent of environmental
conditions (Lowenstan et al., 1989). MICP is mostly a biological induced mechanism (De Myunck et al.,
2010b).
Microorganism can alter all four parameters (concentration of calcium ions, concentration of DIC, pH
level and availability of nucleation sites) in the precipitation reaction of calcium carbonate, but their
ability to generate an alkaline environment, both autotrophic and heterotrophic, is their primary
function (Castanier et al., 1999).
The most common form of MICP in aquatic environments for autotrophic bacteria is obtained with
photosynthetic organisms such as cyanobacteria and algae. They consume dissolved 𝐶𝑂2 so that the
pH increases, since 𝐶𝑂2 is in equilibrium with 𝐻𝐶𝑂3− and 𝐶𝑂3
2− (eqs. 2 – 5). This increase in pH induces
calcium carbonate precipitations if calcium ions are present (eq. 1) (McConnaughey et al., 1997;
Whiffin et al., 2004).
The sulphur cycle is the first heterotrophic path that can be chosen for MICP. During this process,
dissimilatory sulphate reduction is carried out by sulphate reducing bacteria under anoxic conditions.
This results in a release of 𝐻𝐶𝑂3− and 𝐻2𝑆 (Wright, 1999). The escape of 𝐻2𝑆 to the environment leads
to an increase in pH and thus induces calcium carbonate precipitation.
The second heterotrophic path is by means of the nitrogen cycle. The hydrolysis of urea is the most
common mechanism for MICP. Urea hydrolysis is catalyzed by the urease enzyme and is degraded into
carbamate and ammonia. Carbamate spontaneously degrades to carbonic acid and ammonia (Mobley
et al., 1989). The ammonia and carbonic acid molecules equilibrate in water, which results in an
increase in pH (Mobley et al., 1989). Other heterotrophic paths by means of the nitrogen cycle are: the
oxidative deamination of amino acids and the dissimilatory reduction of nitrate in anaerobiosis or
microaerophily (De Myunck et al., 2010b).
Chapter 1: Literature review
8
The discovery of microbial involvement in carbonate precipitation has led to its further in-depth
exploration in several fields. In the field of bioremediation, MICP could be used for biodegradation of
organic pollutants (Chaturvedi et al., 2006) or for the removal of metal ions. Another option was to use
MICP to enhance the properties of soil. Typical examples in this sector are the strengthening of sand
columns (Whiffin et al., 2007) and the enhancement of oil recovery from oil reserves (Nemati et al.,
2005). The construction material sector can also benefit from MICP. The treatment could be used to
strengthen and improve the durability of natural and composite stones. Either a depositary layer with
consolidation effect is placed on top of the material or the MICP is used as a binding material (i.e.
biocementation) (De Myunck et al., 2010b).
6. Biodeposition treatments
6.1. Calcite Bioconcept (France) The University of Nantes, the Laboratory for the research of historic monuments and the company
Calcite Bioconcept were among the first to further develop the ability of bacteria to precipitate calcium
carbonate (Le Metayer-Levrel et al., 1999).
First, they conducted a wide assay to find the suitable microorganism. This was done by isolating
bacteria from natural carbonate producing environments and investigating their carbonatogenic yield
(ratio of weight calcium carbonate produced to weight of organic matter inserted). This led to the use
of Bacillus cereus, which had the highest carbonatogenic yield (0.6 g CaCO3/ g organic matter inserted)
(Castanier et al., 1999).
Second, they optimized a suitable nutrient for the bacteria and the frequency of feeding the bacteria.
The media consists of proteins that stimulate oxidative deamination of amino acids in aerobiosis and
a source of nitrate is present for the dissimilatory nitrate reduction to ammonium in aerobiosis or
microaerophily. The nutrient media designed stimulated carbonate production through the nitrogen
cycle. A fungicide was also added to prevent the unwanted growth of fungi (Orial et al., 2002).
Microbial treatment of the surface was conducted by spraying the entire surface. Depending on the
stone type, the bacteria was fed either daily or in alternating days with a suitable media. This way, a
surficial calcareous coating was created on the stone. The number of feedings was limited to five due
to economic constraints (Le Metayer-Levrel et al., 1999).
An in situ application on a Tuffeau limestone area of 50 m² indicated a decrease in water absorption
of 5 times. The gas permeability stayed the same before and after the treatment (Le Metayer-Levrel
et al., 1999). Long term behavior indicated that a treatment every ten years was needed. The durability
of the treatment is dependent on the orientation, the micro-relief and the environment of the stone.
In marine and rural environments, the effect of the treatment was gone after four years, while in urban
environments the treatment was still effective (Orial, 2000).
6.2. University of Granada (Spain) It was observed that the method of Calcite Bioconcept was only a superficial treatment of a few
microns thickness, thus indicating that it is ineffective for in-depth treatments. Furthermore, the
treatment blocked the stone pores and did not consolidate in the stone. At last, there is a potential
drawback to the use of the Bacillus stain in stone conservation due to its formation of endospores.
Endospores are a dormant, non-reproductive structure produced by certain bacteria. They may lead
to germination and uncontrolled biofilm growth if the environmental condition are appropriate
(Rodriguez-Navarro et al., 2003).
It was therefore suggested that Myxocuccus xanthus should be used for the creation of a consolidating
carbonate matrix in the pores of the limestone. In previous research, crystallization of struvite
6. Biodeposition treatments
9
((𝑁𝐻4)𝑀𝑔𝑃𝑂4. 6𝐻2𝑂) and calcite were already obtained by dead cells and cellular fractions of
Myxocuccus xanthus (Gozález-Munoz et al., 1996). Myxocuccus xanthus was tested in different culture
media and there was no observation of a dormant stage. There were also no fruiting bodies observed
upon application of the treatment on stone specimens and after drying the stones. Due to the use of
these dead cells uncontrolled bacterial growth was prevented.
The production of carbonate ions was induced by a medium containing a pancreatic digest of casein
that functioned as the nitrogen source. The effect of a phosphate buffer on the carbonate production
was also investigated. The phosphate buffer had a thorough effect on the carbonate productivity and
the saturation preceding the nucleation of carbonate crystals. The buffer also prevented rapid local pH
variations and thus the possibility of a high saturation rate. This resulted in a more mechanical stress
resistant calcite crystallization (De Muynck et al., 2010b).
The carbonate consolidate was present in the stone up to a depth of several hundred microns and it
did not seal or plug the pores. It was observed that plugging is mainly a consequence of EPS film
formation (Tiano et al., 1999) and in the treatment with Myxocuccus xanthus a limited amount of EPS
production was observed.
6.3. University of Ghent (Belgium) The microbial hydrolysis of urea was proposed as a starting point (eqs. 6 – 9) to obtain a calcite layer
on limestone. Due to its easy controllability and its potential to produce high amounts of carbonate
within a short time frame, the procedure has an advantage over the other treatments (Dick et al.,
2006).
𝐶𝑂(𝑁𝐻2)2 + 𝐻2𝑂 → 𝐻2𝐶𝑂𝑂𝐻 + 𝑁𝐻3 (6)
𝐻2𝐶𝑂𝑂𝐻 + 𝐻2𝑂 → 𝐻2𝐶𝑂3 + 𝑁𝐻3 (7)
2 𝑁𝐻3 + 2 𝐻2𝑂 ⇌ 2 𝑁𝐻4+ + 2 𝑂𝐻− (8)
2 𝑂𝐻− + 𝐻2𝐶𝑂3 ⇌ 𝐶𝑂32− + 2 𝐻2𝑂 (9)
The urease enzyme catalyzes the urea hydrolysis. The urea is degraded into ammonium and carbonate,
which results in an increase in pH and carbonate concentration (Stocks-Ficher et al., 1999). If calcium
ions are present and the ion activity product of calcium and carbonate ions exceeds the solubility
constant of calcium carbonate, then precipitation of calcium carbonate will occur. Due to the negative
load of the bacterial cells, calcium ions will bind to the cell wall and thus crystallization of calcium
carbonate will occur around the cell structure.
The choice of bacterial strains was determined mainly by two factors: the ζ-potential and the ureolytic
activity. The ζ-potential depicts the electric potential difference between the dispersion medium and
the stationary layer of fluid attached to the dispersed particle. A higher zeta potential indicates a higher
attraction of calcium ions to the cell wall resulting in a higher adhesion of the precipitated calcium
carbonate to the cell surface. A high ureolytic activity or urea degradation rate results in a high
carbonate concentration. Bacillus sphaericus and closely related strains came out as the most
promising strains (Dick et al., 2006).
A further constriction of the chosen bacterial strain was obtained by a treatment procedure of the
stone surface by using the different bacterial strains. Deposition of carbonate on the stone surface was
achieved in two steps. First, biofilm production needed to be present on the stone surface. To achieve
this goal, limestones were submerged for two week in a liquid media inoculated with 1 % of a bacterial
strain. After these two weeks, calcium chloride was added to the media so that calcium carbonate
Chapter 1: Literature review
10
precipitation was enabled. In the third week, the limestones were immersed in a fresh media so that
a new biofilm layer could be formed and in the fourth week, calcium chloride was added to the media.
This resulted in two most promising Bacillus sphaericus strains for further investigation (Dick et al.,
2006).
6.4. Biobrush consortium (United Kingdom) The goal of Biobrush (BIOremediation for Building Restoration of the Urban Stone Heritage) was to
integrate the existing knowledge about the use of bacterial strains for the treatment of weathered
stones into a conservation practice and to subsequently link the salt removal process to the process of
biodeposition (May, 2005).
The Biobrush consortium investigated the use of fresh water bacteria isolated from a stream in
Somerset (UK) to obtain precipitation of calcite. From ten bacterial strains that were able to deposit
calcite on stone surfaces, the bacterial strain Pseudomonas putida was selected as the most promising
bacteria for further investigation (Zamarreňo et al., 2009).
The in situ trails consisted of brushing the bacteria on the stone surface. Afterwards the stones were
covered with moistened Japanese paper. A layer of Carbogel prepared with a growth media (consisting
of yeast extract, dextrose and calcium acetate) was deposited onto this paper. Tris-HCl was mixed into
the Carbogel to increase the pH level. At last, the Carbogel was covered with a PE sheet (May, 2005).
The treatment resulted in a decrease in water absorption by 5 %. The open porosity decreased by 1 %.
Following a two week treatment showed similar consolidation effect with the traditional consolidates.
The effect of temperature increase on bacterial activity and calcium carbonate precipitation was
reported by Zamarreňo et al. (2009). Enhanced bacterial activity, thus CaCO3 precipitation was
achieved when the temperature was raised from 10 to 40 °C.
6.5. Bioreinforce consortium (Italy) It was noted that the decrease in water absorption after biodeposition treatment was mainly due to
the blocking of the pores, instead of the presence of precipitated calcium carbonate. The biodeposition
method also implicated the formation of new substances inside the stone due to the chemical reaction
between the stone minerals and by-products of the bacterial metabolism. At last, the biodeposition
treatment induces fruiting body formation on the stone surface due to the growth of air-borne fungi
fed by the nutrients necessary for the bacterial development (Tiano et al., 2006).
These problems can be avoided by using polypeptides that control the growth of calcium crystals in
the pores. A suggestion to use organic matrix macromolecules extracted from Mytilus californianus
was made. The use of matrix macromolecules resulted in a more durable carbonate precipitation
compared to the single use of calcium chloride or calcium hydroxide (Tiano et al., 1995).
There was a small decrease in porosity and water absorption, but the practical use was limited due to
the complexity of the extraction procedure and insufficient reduction on the water absorption (Tiano
et al., 1995). The use of acid functionalized proteins was proposed due to its high amount of aspartic
acid in the macromolecules (Tiano et al., 2006).
Calcium and carbonate ions were added as ammonium carbonate and calcium chloride. In some cases
calcite nanoparticles were added to maintain a saturated carbonate solution in the pores for a long
period of time. The treatment was applied on the stone by spraying.
Further investigation together with the European Bioreinforce (BIOmediated calcite precipitation for
monumental stones REINFORCEment) project was focused on the clarification of the genetic
background of crystal formation in bacteria. It was noted that the genes responsible for calcite
7. Influencing parameters for biodeposition treatment with use of urea
11
formation could be cloned and transferred to an appropriate expression vector, enabling the
overproduction of the molecules inducing crystal formation (De Muynck et al., 2010b).
The ability of autoclaved cells and cell fragments to provide calcite crystallization was proven and thus
living cells would no longer be needed. It was observed that dead cells from active calcinogenic strains
showed a higher and/or faster production of calcium carbonate crystals than dead cells from less active
strains. Further investigation indicated that the effect of the treatment was still too small to be feasible
(Mastromei et al., 2008).
6.6. Activator medium (Spain) It was shown that the majority of bacterial strains isolated from building materials were able to induce
carbonate precipitation (Urzi et al., 1999). Due to this fact, a proposition was made to make a medium
that could activate the calcinogenic strains that are present in the microbiota of the stone (Jimenez-
Lopez et al., 2007).
Bacto-casitone (a source of carbon and nitrogen) was proposed as the activator of the calcinogenic
bacteria. It was also believed that the production of acids would be low, since no carbohydrates were
added. Due to the fact that neither microorganisms, workers nor an equipment were needed, this was
claimed to be an easier treatment than the ones were bacterial inoculated media were used (Jimenez-
Lopez et al., 2007).
Addition of Myxococcus xanthus to the media was proposed if activation time of the bacteria needed
to be limited. It was shown that the calcite deposit created by the combined action of Myxococcus
xanthus and the microbial community was stronger than the sole action of either Myxococcus xanthus
or the culture media. Additionally, there was also no change in porosity of the stones observed
(Jimenez-Lopez et al., 2007).
It was observed that spore forming bacteria able to germinate upon the application of the culture
media on the stones contributed in large degree to the precipitation of calcite. A possible drawback to
the use of these spore forming bacteria is their uncontrolled growth upon germination. Nonetheless,
it has already been found that no increase in microbiota were present immediately after or four years
after the application of calcinogenic bacteria is present (Le Metayer-Levrel et al., 1999).
7. Influencing parameters for biodeposition treatment with use of urea
7.1. Urea and calcium dosage In most studies about MICP, the scope is on microbial aspects such as the type of microorganism and
the metabolic pathway. The effect of the chemical parameter, i.e. the concentration of calcium ions
and the concentration of urea is little investigated. However, these parameters also have a significant
effect on the calcium carbonate precipitation (De Muynck et al., 2010a).
A first study observed a difference in the weight of stones that were treated with media containing
varying concentrations of calcium ions, but the effect of the calcium ion concentration on the
effectiveness of the treatment was not clarified (Jimenez-Lopez et al., 2008). Due to this study, De
Muynck et al. (2010a) set up an investigation to clarify the influence of the concentration of calcium
ions and urea on the biodeposition reaction. It was found that a raising concentration of urea and
calcium ended up in a weight gain in the treated stones.
There is however an optimal concentration of urea and calcium, above which an additional amount of
urea and calcium will have a much smaller beneficial strengthening effect (i.e. additional precipitation
of CaCO3 and hence, increased protective effect) compared to the detrimental effects (i.e.
accumulation of salts and urea in the pores and discoloration) (De Muynck et al., 2010a).
Chapter 1: Literature review
12
Sonication experiments showed an effective consolidation at low calcium concentration (≤ 3.4 mg
𝐶𝑎2+ 𝑐𝑚−2). A higher dosage did not improve the consolidation. The waterproof effect, on the other
hand, continued to increase with increasing calcium dosage. A decrease of the initial water uptake
could be observed at intermediate and high calcium dosages (≥ 3.4 mg 𝐶𝑎2+ 𝑐𝑚−2). A change in the
chromatic spectrum of the surface was observed at calcium dosages of 3.4 mg 𝐶𝑎2+ 𝑐𝑚−2 and higher.
This visual change could be attributed to the dosage of calcium salts and the amount of carbonate
precipitated (De Muynck et al., 2010a).
It was concluded by De Muynck et al. (2010a), that an optimal concentration of urea and calcium
chloride dihydrate in the biodeposition medium was 20 g/l and 50 g/l respectively. The optimum
calcium dosage on the stone is 12.3 mg 𝐶𝑎2+ 𝑐𝑚−2.
7.2. Pore structure The pores structure of a stone affects the transport of liquid in the pores (i.e. travel distance from
contact surface liquid-stone trough capillary absorption and quantity of transported liquid) and so it
will also affect the efficiency of the biodeposition treatment in terms of penetration depth and amount
of calcium carbonate precipitated (De Muynck et al., 2011).
The pore size distribution is considered as one of the most important parameters that determines the
capacity for fluid storage and salt accumulation in the stone (Dick et al., 2006). The pore size needs to
be two to five times larger than the bacterial cells to obtain maximum absorption of the cells (Samonin
et al., 2004). This means that stones with a high degree of macropores (diameter pores > 7.5 µm) will
absorb more bacterial cells (1 to 4 µm) than stones with a high degree of micropores (diameter pores
< 7.5 µm) (Richard et al., 2007). Carbonate precipitation will thus occur at larger depths in macroporous
stone than at microporous stones. Pore size, however is not the only parameter playing a role in the
transport of bacteria inside the stone. The absorption of bacteria is determined by a wide range of
physical, chemical and microbiological factors (De Muynck et al., 2011).
It was concluded by De Muynck et al. (2011) that stones with the highest macroporosity showed the
highest biogenic carbonate production due to the fact that absorption of bacteria is known to occur in
pores with a diameter of 4 to 20 µm. This confirms the suggestion by Richard et al. (2007). Test also
revealed that this larger absorption of bacterial cells, resulted in a larger amount of calcium carbonate
crystallized. This resulted in a greater decrease of water uptake and a higher resistance to water
related degradation processes, such as salt attacks and freezing-thawing cycles (De Muynck et al.,
2011).
7.3. Temperature The influence of environmental parameters such as temperature and salinity is already reported as an
important factor on the biogenic calcium carbonate precipitation (Knorre et al., 2000; Rivadeneyra et
al., 2004). A raising temperature lowers the solubility of calcium carbonate and a temperature
difference also influences the growth and activity of bacterial cells.
An increasing temperature between 2 and 32 °C results in an increasing calcium carbonate
crystallization rate (Novitsky, 1981; Cacchio et al., 2003). Another study revealed that the urease
activity of Sporosarcina pasteurii increases with 0.04 mM of urea hydrolyzed per minute for every
degree of temperature increase in between 25 and 60 °C (Whiffin et al., 2004). It was also observed
that the morphology of the precipitated calcium carbonate changed with changing temperatures
(Zamareno et al., 2009b).
De Muynck et al. (2013) reported that the Bacillus sphaericus strain has the highest urea
decomposition rate compared to the strains Sporosacina ureae, Sporosarcina psychrophila and

7. Influencing parameters for biodeposition treatment with use of urea
13
Sporosarcina pasteurii at temperatures of 10, 20, 28 and 37 °C. It was also confirmed that an increasing
temperature resulted in an increasing ureolytic activity both in experiments in solution and inside
limestone prisms. Diffusion of urea through the stone was also reported to be influenced by the
temperature as an increase in temperature resulted in a higher transportation.
Chapter 2: Materials
14
Chapter 2: Materials
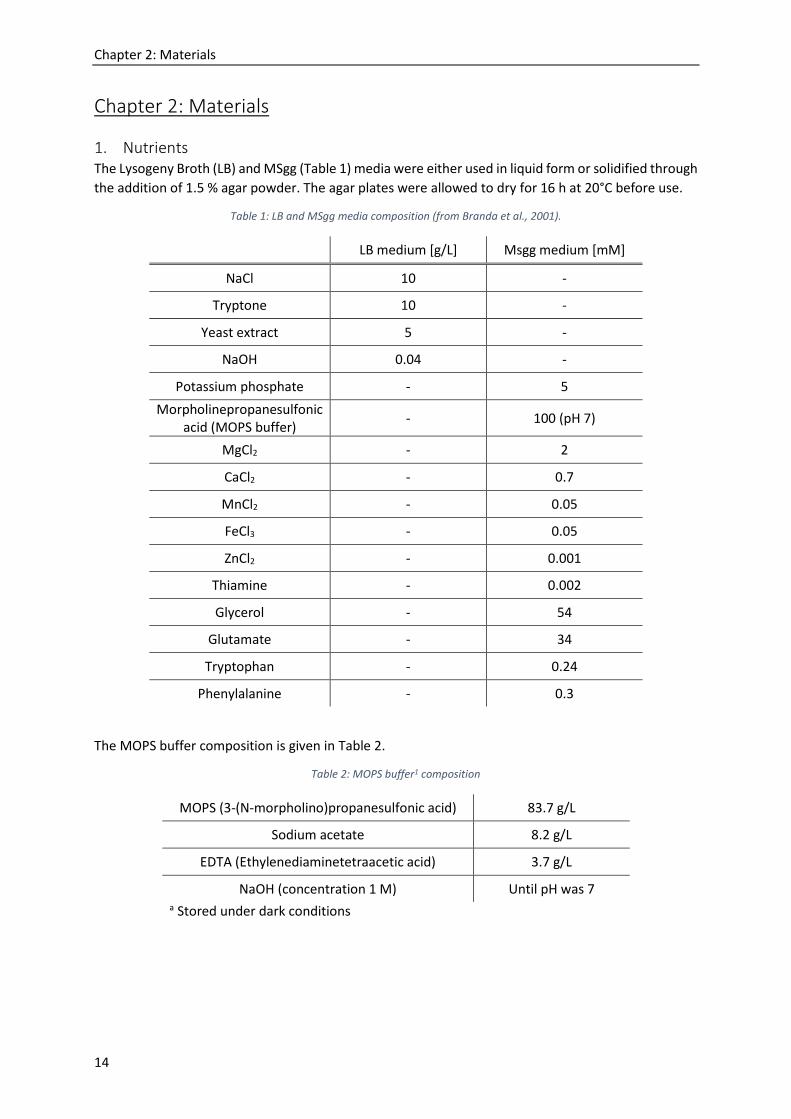
1. Nutrients The Lysogeny Broth (LB) and MSgg (Table 1) media were either used in liquid form or solidified through
the addition of 1.5 % agar powder. The agar plates were allowed to dry for 16 h at 20°C before use.
Table 1: LB and MSgg media composition (from Branda et al., 2001).
LB medium [g/L] Msgg medium [mM]
NaCl 10 -
Tryptone 10 -
Yeast extract 5 -
NaOH 0.04 -
Potassium phosphate - 5
Morpholinepropanesulfonic acid (MOPS buffer)
- 100 (pH 7)
MgCl2 - 2
CaCl2 - 0.7
MnCl2 - 0.05
FeCl3 - 0.05
ZnCl2 - 0.001
Thiamine - 0.002
Glycerol - 54
Glutamate - 34
Tryptophan - 0.24
Phenylalanine - 0.3
The MOPS buffer composition is given in Table 2.
Table 2: MOPS buffer1 composition
MOPS (3-(N-morpholino)propanesulfonic acid) 83.7 g/L
Sodium acetate 8.2 g/L
EDTA (Ethylenediaminetetraacetic acid) 3.7 g/L
NaOH (concentration 1 M) Until pH was 7 a Stored under dark conditions
2. Bacterial strains
15
2. Bacterial strains
2.1. Bacillus subtilis Bacillus subtilis NCIB 3610 (wild type) is known to be able to form endospores and to produce a
considerable amount of biofilm. LB media was used to grow Bacillus subtilis strains prior to tests for
biofilm formation.
2.2. Bacillus sphaericus Bacillus sphaericus LMG 22257 (Belgian co-ordinated collection of micro-organisms, Ghent) shows a
high urease activity, a continuous formation of closely packed calcium carbonate crystals and has a
large negative zeta-potential (Dick et al., 2006).
The growth media for Bacillus sphaericus consisted of 20 g/l yeast extract and 20 g/l urea. This mixture
was autoclaved at 120°C for 20 minutes.
3. Natural stones
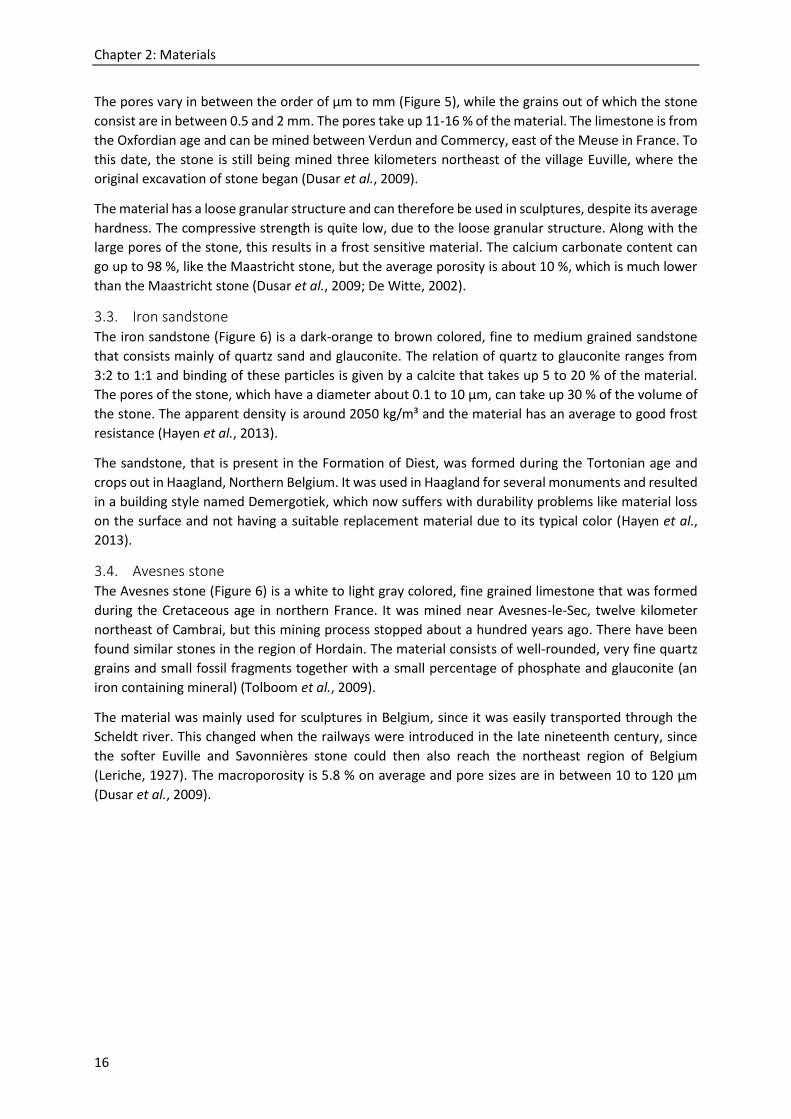
3.1. Maastricht limestone The Maastricht limestone (Figure 6) (also known as Maastricht stone, Tuffeau de Maastricht, Mergel
or Maastrichtien) has a pale yellow color and consists mostly of microfossils and sand-size fragments
of microcrystalline carbonate. It is a soft bioclastic calcarenite of the Upper Cretaceous age belonging
to the Maastricht formation that has surfaced in southern Limburg between Belgium and the
Netherlands. The Maastricht stone is mostly used for restoration purposes and is one of the few native
Dutch natural stones that is still used in the building industry (Koudelka et al., 2013).
The material is very homogeneous, which makes it ideal for lab use. The sub-angular grains consist
primarily out of sparitic calcite, which are skeletons of sea organisms and shell fragments. Secondarily,
micritic calcite and rare silicate grains are often present. The interconnection between the grains is
rare, but when it is present it mainly consists of spartic calcite (Koudelka et al., 2013).
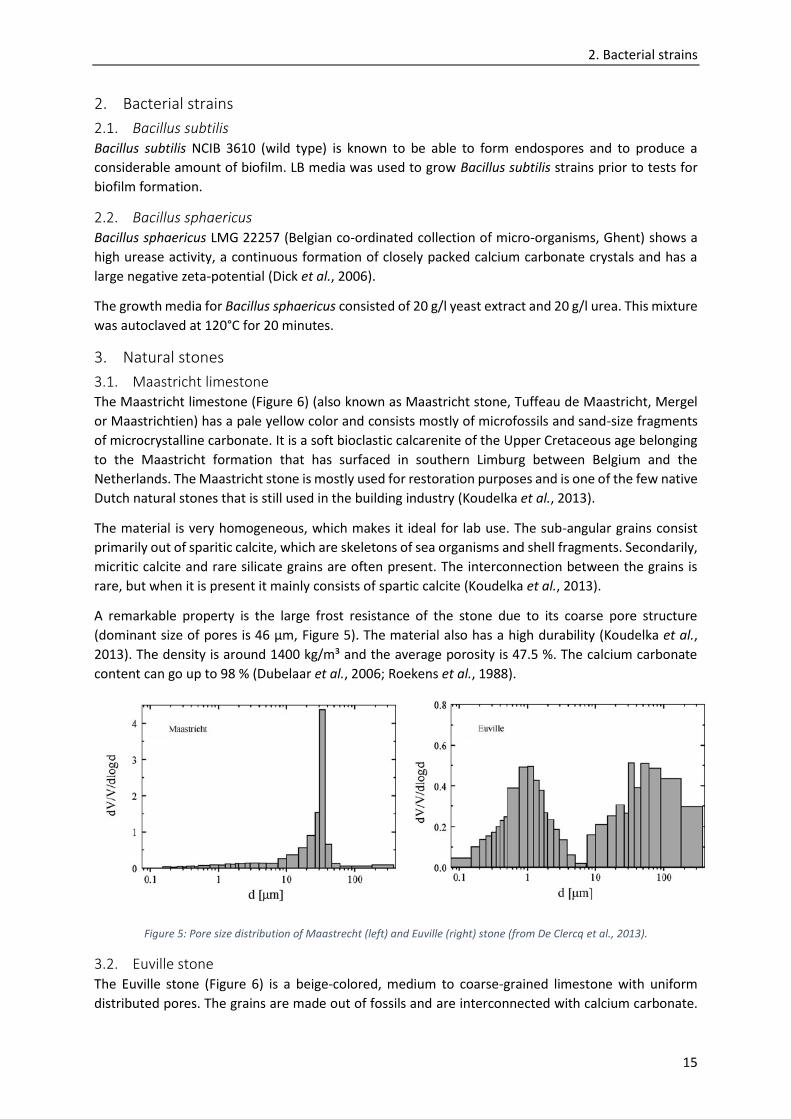
A remarkable property is the large frost resistance of the stone due to its coarse pore structure
(dominant size of pores is 46 µm, Figure 5). The material also has a high durability (Koudelka et al.,
2013). The density is around 1400 kg/m³ and the average porosity is 47.5 %. The calcium carbonate
content can go up to 98 % (Dubelaar et al., 2006; Roekens et al., 1988).
Figure 5: Pore size distribution of Maastrecht (left) and Euville (right) stone (from De Clercq et al., 2013).
3.2. Euville stone The Euville stone (Figure 6) is a beige-colored, medium to coarse-grained limestone with uniform
distributed pores. The grains are made out of fossils and are interconnected with calcium carbonate.
Chapter 2: Materials
16
The pores vary in between the order of µm to mm (Figure 5), while the grains out of which the stone
consist are in between 0.5 and 2 mm. The pores take up 11-16 % of the material. The limestone is from
the Oxfordian age and can be mined between Verdun and Commercy, east of the Meuse in France. To
this date, the stone is still being mined three kilometers northeast of the village Euville, where the
original excavation of stone began (Dusar et al., 2009).
The material has a loose granular structure and can therefore be used in sculptures, despite its average
hardness. The compressive strength is quite low, due to the loose granular structure. Along with the
large pores of the stone, this results in a frost sensitive material. The calcium carbonate content can
go up to 98 %, like the Maastricht stone, but the average porosity is about 10 %, which is much lower
than the Maastricht stone (Dusar et al., 2009; De Witte, 2002).
3.3. Iron sandstone The iron sandstone (Figure 6) is a dark-orange to brown colored, fine to medium grained sandstone
that consists mainly of quartz sand and glauconite. The relation of quartz to glauconite ranges from
3:2 to 1:1 and binding of these particles is given by a calcite that takes up 5 to 20 % of the material.
The pores of the stone, which have a diameter about 0.1 to 10 µm, can take up 30 % of the volume of
the stone. The apparent density is around 2050 kg/m³ and the material has an average to good frost
resistance (Hayen et al., 2013).
The sandstone, that is present in the Formation of Diest, was formed during the Tortonian age and
crops out in Haagland, Northern Belgium. It was used in Haagland for several monuments and resulted
in a building style named Demergotiek, which now suffers with durability problems like material loss
on the surface and not having a suitable replacement material due to its typical color (Hayen et al.,
2013).
3.4. Avesnes stone The Avesnes stone (Figure 6) is a white to light gray colored, fine grained limestone that was formed
during the Cretaceous age in northern France. It was mined near Avesnes-le-Sec, twelve kilometer
northeast of Cambrai, but this mining process stopped about a hundred years ago. There have been
found similar stones in the region of Hordain. The material consists of well-rounded, very fine quartz
grains and small fossil fragments together with a small percentage of phosphate and glauconite (an
iron containing mineral) (Tolboom et al., 2009).
The material was mainly used for sculptures in Belgium, since it was easily transported through the
Scheldt river. This changed when the railways were introduced in the late nineteenth century, since
the softer Euville and Savonnières stone could then also reach the northeast region of Belgium
(Leriche, 1927). The macroporosity is 5.8 % on average and pore sizes are in between 10 to 120 µm
(Dusar et al., 2009).
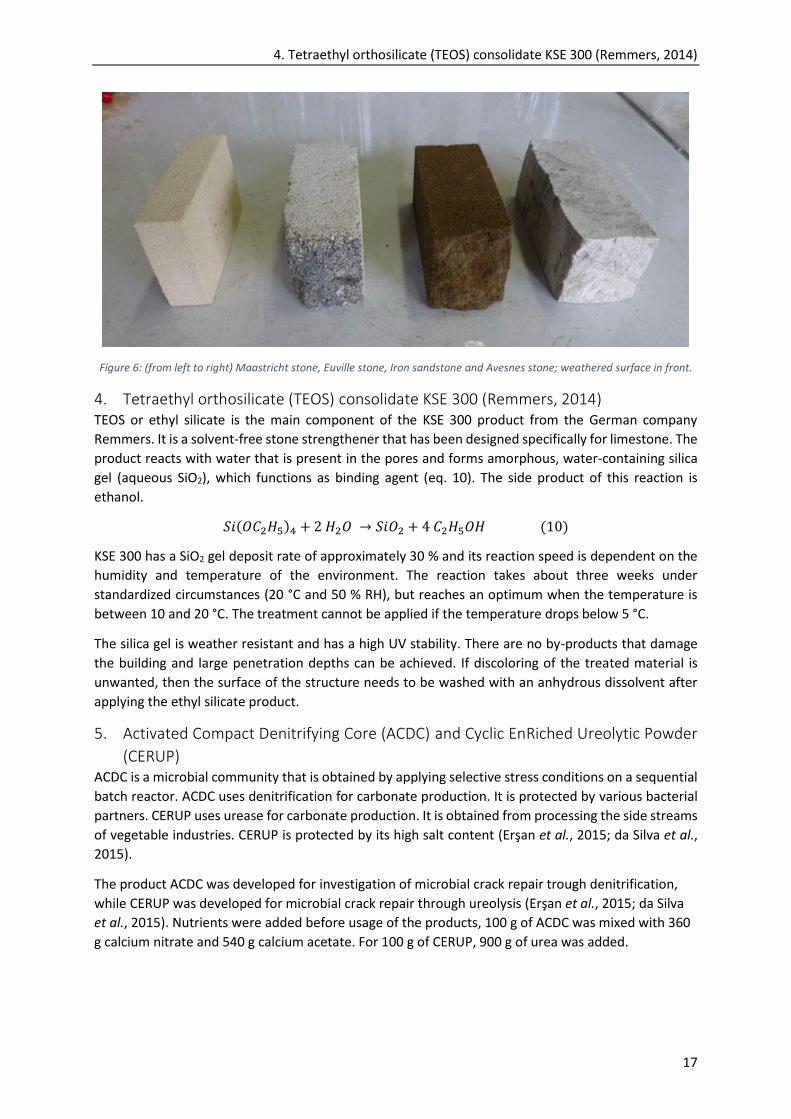
4. Tetraethyl orthosilicate (TEOS) consolidate KSE 300 (Remmers, 2014)
17
Figure 6: (from left to right) Maastricht stone, Euville stone, Iron sandstone and Avesnes stone; weathered surface in front.
4. Tetraethyl orthosilicate (TEOS) consolidate KSE 300 (Remmers, 2014) TEOS or ethyl silicate is the main component of the KSE 300 product from the German company
Remmers. It is a solvent-free stone strengthener that has been designed specifically for limestone. The
product reacts with water that is present in the pores and forms amorphous, water-containing silica
gel (aqueous SiO2), which functions as binding agent (eq. 10). The side product of this reaction is
ethanol.
𝑆𝑖(𝑂𝐶2𝐻5)4 + 2 𝐻2𝑂 → 𝑆𝑖𝑂2 + 4 𝐶2𝐻5𝑂𝐻 (10)
KSE 300 has a SiO2 gel deposit rate of approximately 30 % and its reaction speed is dependent on the
humidity and temperature of the environment. The reaction takes about three weeks under
standardized circumstances (20 °C and 50 % RH), but reaches an optimum when the temperature is
between 10 and 20 °C. The treatment cannot be applied if the temperature drops below 5 °C.
The silica gel is weather resistant and has a high UV stability. There are no by-products that damage
the building and large penetration depths can be achieved. If discoloring of the treated material is
unwanted, then the surface of the structure needs to be washed with an anhydrous dissolvent after
applying the ethyl silicate product.
5. Activated Compact Denitrifying Core (ACDC) and Cyclic EnRiched Ureolytic Powder
(CERUP) ACDC is a microbial community that is obtained by applying selective stress conditions on a sequential
batch reactor. ACDC uses denitrification for carbonate production. It is protected by various bacterial
partners. CERUP uses urease for carbonate production. It is obtained from processing the side streams
of vegetable industries. CERUP is protected by its high salt content (Erşan et al., 2015; da Silva et al.,
2015).
The product ACDC was developed for investigation of microbial crack repair trough denitrification,
while CERUP was developed for microbial crack repair through ureolysis (Erşan et al., 2015; da Silva
et al., 2015). Nutrients were added before usage of the products, 100 g of ACDC was mixed with 360
g calcium nitrate and 540 g calcium acetate. For 100 g of CERUP, 900 g of urea was added.
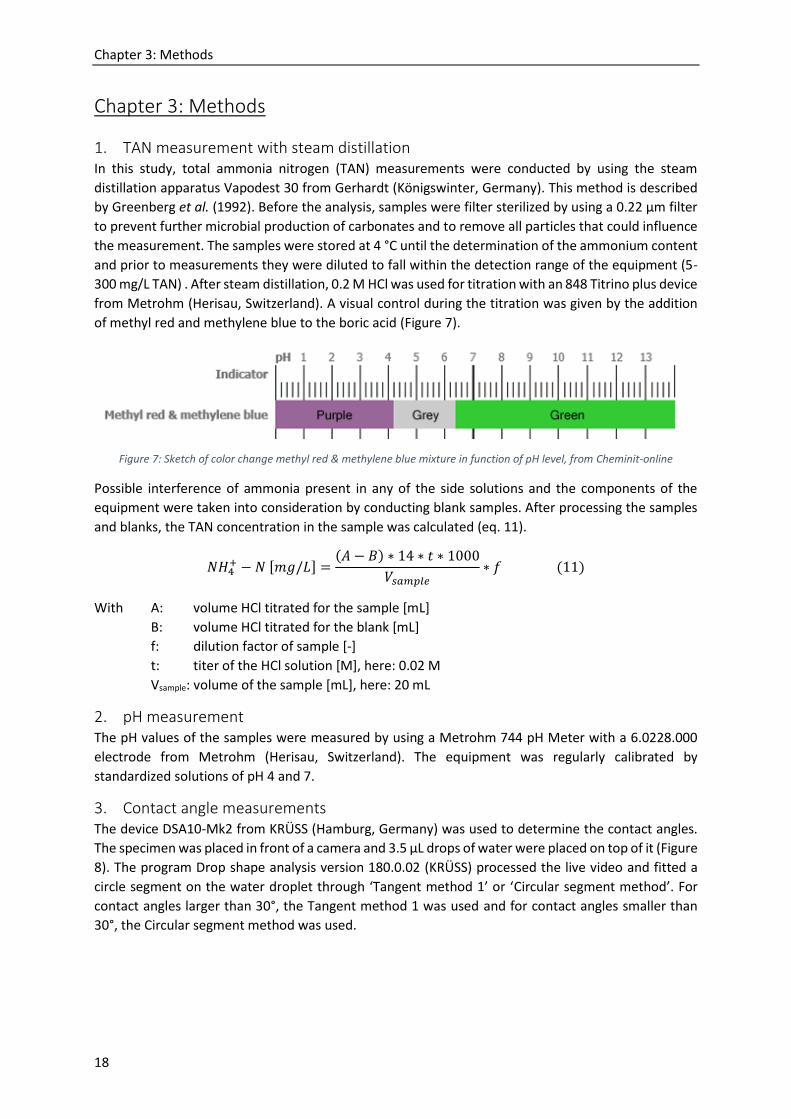
Chapter 3: Methods
18
Chapter 3: Methods
1. TAN measurement with steam distillation In this study, total ammonia nitrogen (TAN) measurements were conducted by using the steam
distillation apparatus Vapodest 30 from Gerhardt (Königswinter, Germany). This method is described
by Greenberg et al. (1992). Before the analysis, samples were filter sterilized by using a 0.22 µm filter
to prevent further microbial production of carbonates and to remove all particles that could influence
the measurement. The samples were stored at 4 °C until the determination of the ammonium content
and prior to measurements they were diluted to fall within the detection range of the equipment (5-
300 mg/L TAN) . After steam distillation, 0.2 M HCl was used for titration with an 848 Titrino plus device
from Metrohm (Herisau, Switzerland). A visual control during the titration was given by the addition
of methyl red and methylene blue to the boric acid (Figure 7).
Figure 7: Sketch of color change methyl red & methylene blue mixture in function of pH level, from Cheminit-online
Possible interference of ammonia present in any of the side solutions and the components of the
equipment were taken into consideration by conducting blank samples. After processing the samples
and blanks, the TAN concentration in the sample was calculated (eq. 11).
𝑁𝐻4+ − 𝑁 [𝑚𝑔/𝐿] =
(𝐴 − 𝐵) ∗ 14 ∗ 𝑡 ∗ 1000
𝑉𝑠𝑎𝑚𝑝𝑙𝑒∗ 𝑓 (11)
With A: volume HCl titrated for the sample [mL]
B: volume HCl titrated for the blank [mL]
f: dilution factor of sample [-]
t: titer of the HCl solution [M], here: 0.02 M
Vsample: volume of the sample [mL], here: 20 mL
2. pH measurement The pH values of the samples were measured by using a Metrohm 744 pH Meter with a 6.0228.000
electrode from Metrohm (Herisau, Switzerland). The equipment was regularly calibrated by
standardized solutions of pH 4 and 7.
3. Contact angle measurements The device DSA10-Mk2 from KRÜSS (Hamburg, Germany) was used to determine the contact angles.
The specimen was placed in front of a camera and 3.5 µL drops of water were placed on top of it (Figure
8). The program Drop shape analysis version 180.0.02 (KRÜSS) processed the live video and fitted a
circle segment on the water droplet through ‘Tangent method 1’ or ‘Circular segment method’. For
contact angles larger than 30°, the Tangent method 1 was used and for contact angles smaller than
30°, the Circular segment method was used.
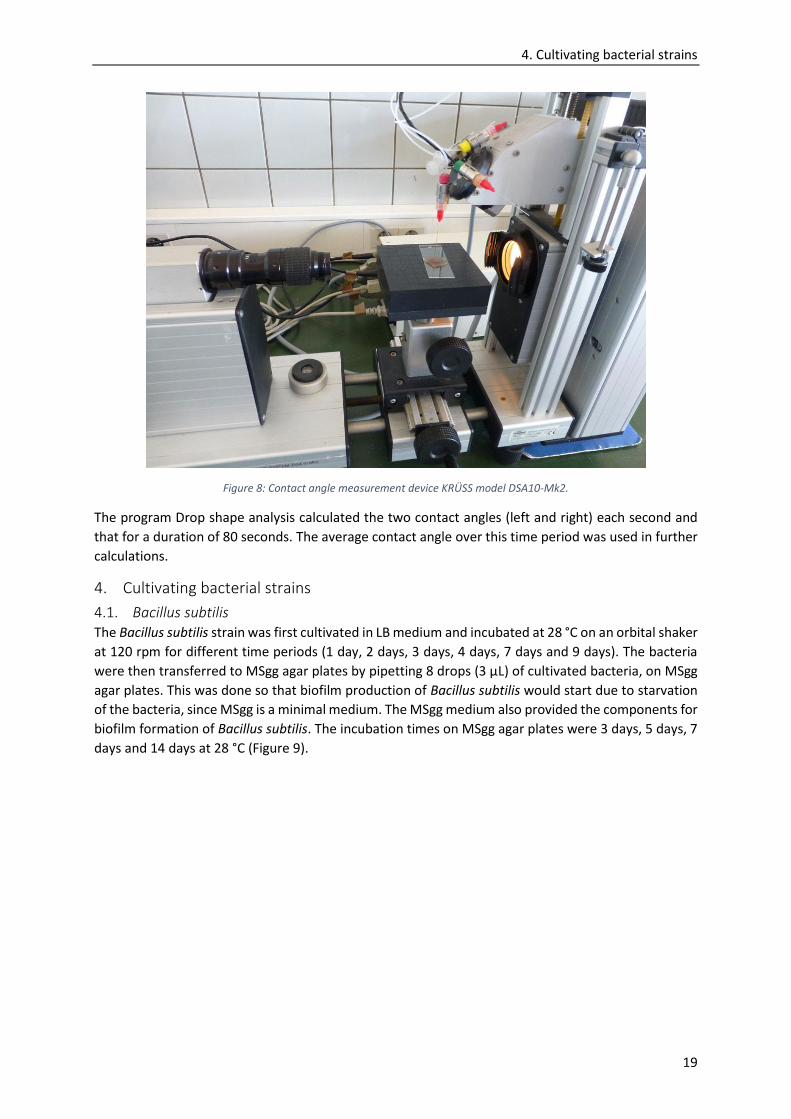
4. Cultivating bacterial strains
19
Figure 8: Contact angle measurement device KRÜSS model DSA10-Mk2.
The program Drop shape analysis calculated the two contact angles (left and right) each second and
that for a duration of 80 seconds. The average contact angle over this time period was used in further
calculations.
4. Cultivating bacterial strains
4.1. Bacillus subtilis The Bacillus subtilis strain was first cultivated in LB medium and incubated at 28 °C on an orbital shaker
at 120 rpm for different time periods (1 day, 2 days, 3 days, 4 days, 7 days and 9 days). The bacteria
were then transferred to MSgg agar plates by pipetting 8 drops (3 µL) of cultivated bacteria, on MSgg
agar plates. This was done so that biofilm production of Bacillus subtilis would start due to starvation
of the bacteria, since MSgg is a minimal medium. The MSgg medium also provided the components for
biofilm formation of Bacillus subtilis. The incubation times on MSgg agar plates were 3 days, 5 days, 7
days and 14 days at 28 °C (Figure 9).
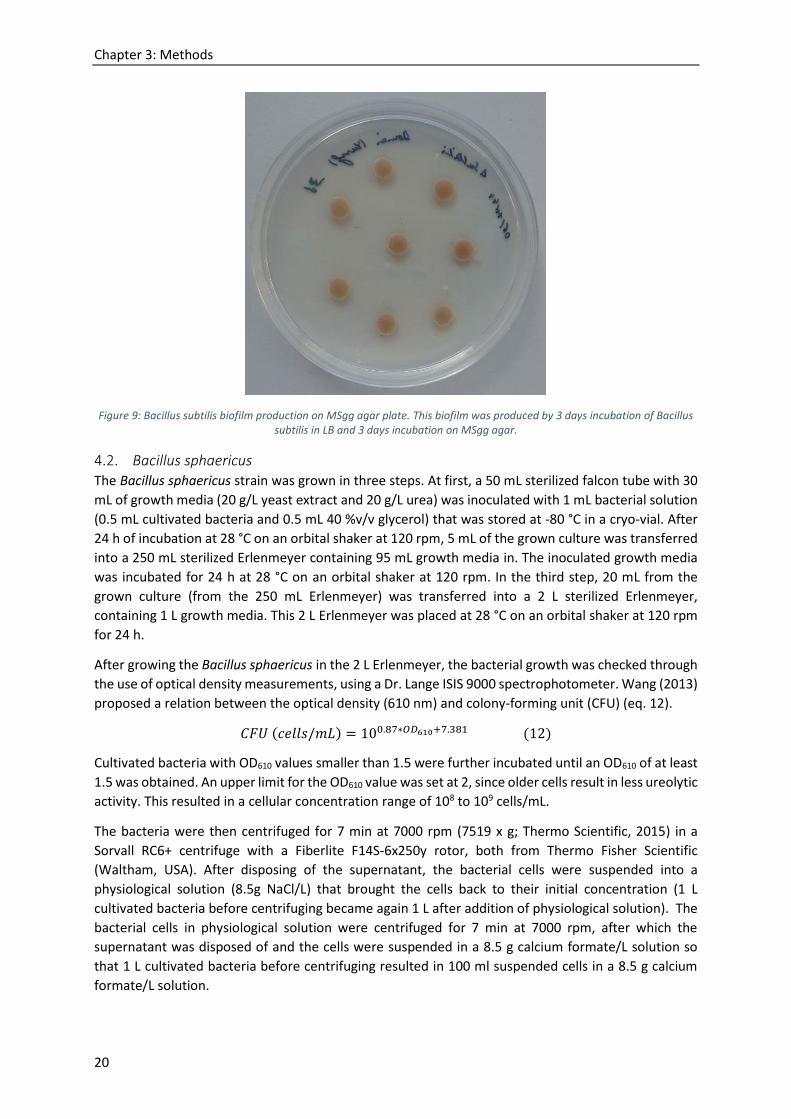
Chapter 3: Methods
20
Figure 9: Bacillus subtilis biofilm production on MSgg agar plate. This biofilm was produced by 3 days incubation of Bacillus subtilis in LB and 3 days incubation on MSgg agar.
4.2. Bacillus sphaericus The Bacillus sphaericus strain was grown in three steps. At first, a 50 mL sterilized falcon tube with 30
mL of growth media (20 g/L yeast extract and 20 g/L urea) was inoculated with 1 mL bacterial solution
(0.5 mL cultivated bacteria and 0.5 mL 40 %v/v glycerol) that was stored at -80 °C in a cryo-vial. After
24 h of incubation at 28 °C on an orbital shaker at 120 rpm, 5 mL of the grown culture was transferred
into a 250 mL sterilized Erlenmeyer containing 95 mL growth media in. The inoculated growth media
was incubated for 24 h at 28 °C on an orbital shaker at 120 rpm. In the third step, 20 mL from the
grown culture (from the 250 mL Erlenmeyer) was transferred into a 2 L sterilized Erlenmeyer,
containing 1 L growth media. This 2 L Erlenmeyer was placed at 28 °C on an orbital shaker at 120 rpm
for 24 h.
After growing the Bacillus sphaericus in the 2 L Erlenmeyer, the bacterial growth was checked through
the use of optical density measurements, using a Dr. Lange ISIS 9000 spectrophotometer. Wang (2013)
proposed a relation between the optical density (610 nm) and colony-forming unit (CFU) (eq. 12).
𝐶𝐹𝑈 (𝑐𝑒𝑙𝑙𝑠/𝑚𝐿) = 100.87∗𝑂𝐷610+7.381 (12)
Cultivated bacteria with OD610 values smaller than 1.5 were further incubated until an OD610 of at least
1.5 was obtained. An upper limit for the OD610 value was set at 2, since older cells result in less ureolytic
activity. This resulted in a cellular concentration range of 108 to 109 cells/mL.
The bacteria were then centrifuged for 7 min at 7000 rpm (7519 x g; Thermo Scientific, 2015) in a
Sorvall RC6+ centrifuge with a Fiberlite F14S-6x250y rotor, both from Thermo Fisher Scientific
(Waltham, USA). After disposing of the supernatant, the bacterial cells were suspended into a
physiological solution (8.5g NaCl/L) that brought the cells back to their initial concentration (1 L
cultivated bacteria before centrifuging became again 1 L after addition of physiological solution). The
bacterial cells in physiological solution were centrifuged for 7 min at 7000 rpm, after which the
supernatant was disposed of and the cells were suspended in a 8.5 g calcium formate/L solution so
that 1 L cultivated bacteria before centrifuging resulted in 100 ml suspended cells in a 8.5 g calcium
formate/L solution.

5. Biodeposition
21
5. Biodeposition The precipitation media consisted out of a calcium source (calcium chloride or calcium formate), urea
and HEPES buffer. The urea and calcium source ranges from 0.5 M to 1.11 M, while the HEPES buffer
is chosen constant at 0.11 M (Table 3).
The suspended Bacillus sphaericus cells were added to the precipitation media with a concentration of
10-1 (900 ml of precipitation media was mixed with 100 ml of suspended cells). This means that the
concentration of bacterial cells in the precipitation media is equal to the concentration of bacterial
cells in the growth medium before centrifuging.
Table 3: Composition precipitation media, all solution were made in triplicates
Solution Urea [M] Calcium
formate [M] Calcium
chloride [M] HEPES buffer
[M] Tap/demi
water
1 0.5 0.5 0 0.11 Tap
2 0.7 0.5 0 0.11 Tap
3 0.7 0.7 0 0.11 Tap
4 0.9 0.5 0 0.11 Tap
5 0.9 0.7 0 0.11 Tap
6 0.9 0.9 0 0.11 Tap
7 1.11 0.5 0 0.11 Tap
8 1.11 0.7 0 0.11 Tap
9 1.11 0.9 0 0.11 Tap
10 1.11 1.11 0 0.11 Tap
11 1.11 0 1.11 0 Demi
12 1.11 0 1.11 0.11 Demi
13 1.11 0 1.11 0 Tap
14 1.11 0 1.11 0.11 Tap
The highest concentration was chosen as 1.11 M by considering the solubility of calcium formate (1.28
M at 20 °C). From decomposition of 1 mole of urea, 1 mole of 𝐶𝑂32− is produced (eqs. 13, 14 and 15)
(De Muynck et al., 2010b).
(𝑁𝐻2)2𝐶𝑂 + 𝐻2𝑂 → 𝐻2𝐶𝑂𝑂𝐻 + 𝑁𝐻3 (13)
𝐻2𝐶𝑂𝑂𝐻 + 𝐻2𝑂 → 𝑁𝐻3 + 𝐻2𝐶𝑂3 (14)
𝐻2𝐶𝑂3 (𝑎𝑞) ⇌ 𝐻𝐶𝑂3 (𝑎𝑞)− ⇌ 𝐶𝑂3 (𝑎𝑞)
2− (15)
Therefore, by considering the stoichiometry of CaCO3 precipitation (eq. 16, 𝐾𝑠𝑝, 20°𝐶 = 4.8 ∗ 10−8
(Patnaik, 2003)), in each batch the tested calcium formate concentrations were either equal to or lower
than the tested urea concentration. Urea hydrolysis depends on several environmental conditions and
sometimes the efficiency can be lower. In order to compensate the 𝐶𝑂32−deficiency due to possible
inhibition of urea hydrolysis, higher urea concentrations than calcium concentrations were used.
𝐶𝑎2+ + 𝐶𝑂3 (𝑎𝑞)2− ⇌ 𝐶𝑎𝐶𝑂3 (16)
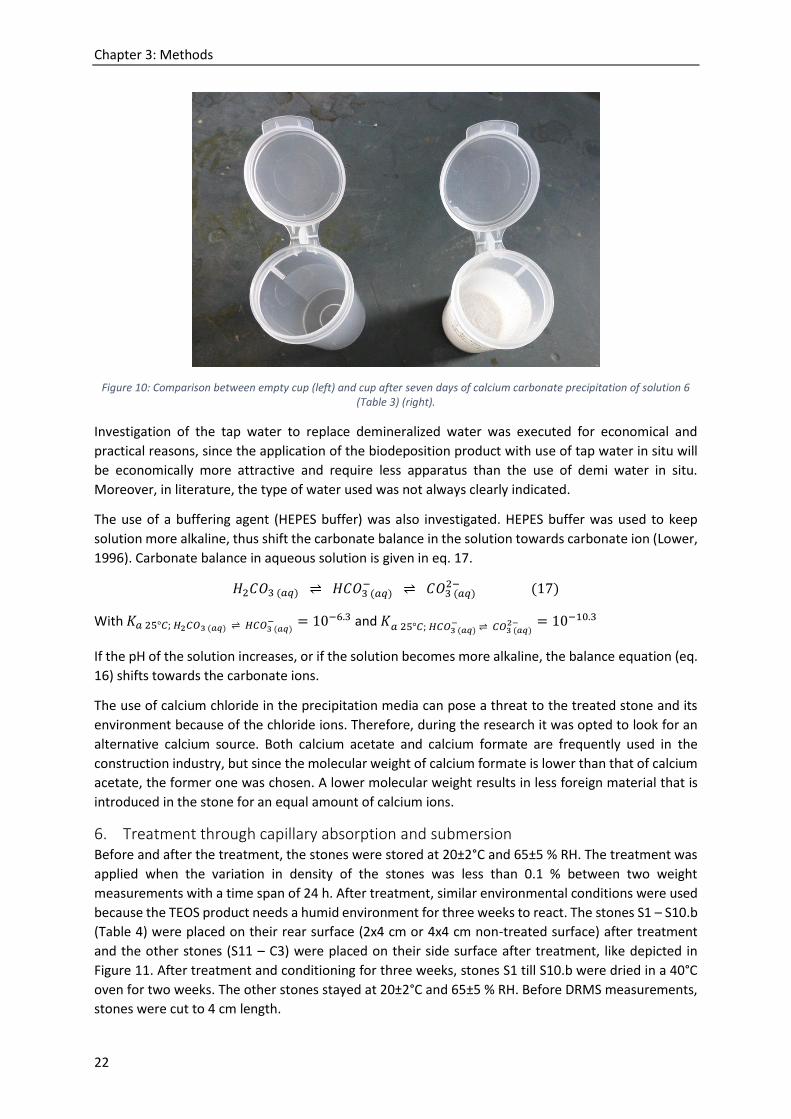
Chapter 3: Methods
22
Figure 10: Comparison between empty cup (left) and cup after seven days of calcium carbonate precipitation of solution 6 (Table 3) (right).
Investigation of the tap water to replace demineralized water was executed for economical and
practical reasons, since the application of the biodeposition product with use of tap water in situ will
be economically more attractive and require less apparatus than the use of demi water in situ.
Moreover, in literature, the type of water used was not always clearly indicated.
The use of a buffering agent (HEPES buffer) was also investigated. HEPES buffer was used to keep
solution more alkaline, thus shift the carbonate balance in the solution towards carbonate ion (Lower,
1996). Carbonate balance in aqueous solution is given in eq. 17.
𝐻2𝐶𝑂3 (𝑎𝑞) ⇌ 𝐻𝐶𝑂3 (𝑎𝑞)− ⇌ 𝐶𝑂3 (𝑎𝑞)
2− (17)
With 𝐾𝑎 25°𝐶; 𝐻2𝐶𝑂3 (𝑎𝑞) ⇌ 𝐻𝐶𝑂3 (𝑎𝑞)− = 10−6.3 and 𝐾𝑎 25°𝐶; 𝐻𝐶𝑂3 (𝑎𝑞)
− ⇌ 𝐶𝑂3 (𝑎𝑞)2− = 10−10.3
If the pH of the solution increases, or if the solution becomes more alkaline, the balance equation (eq.
16) shifts towards the carbonate ions.
The use of calcium chloride in the precipitation media can pose a threat to the treated stone and its
environment because of the chloride ions. Therefore, during the research it was opted to look for an
alternative calcium source. Both calcium acetate and calcium formate are frequently used in the
construction industry, but since the molecular weight of calcium formate is lower than that of calcium
acetate, the former one was chosen. A lower molecular weight results in less foreign material that is
introduced in the stone for an equal amount of calcium ions.
6. Treatment through capillary absorption and submersion Before and after the treatment, the stones were stored at 20±2°C and 65±5 % RH. The treatment was
applied when the variation in density of the stones was less than 0.1 % between two weight
measurements with a time span of 24 h. After treatment, similar environmental conditions were used
because the TEOS product needs a humid environment for three weeks to react. The stones S1 – S10.b
(Table 4) were placed on their rear surface (2x4 cm or 4x4 cm non-treated surface) after treatment
and the other stones (S11 – C3) were placed on their side surface after treatment, like depicted in
Figure 11. After treatment and conditioning for three weeks, stones S1 till S10.b were dried in a 40°C
oven for two weeks. The other stones stayed at 20±2°C and 65±5 % RH. Before DRMS measurements,
stones were cut to 4 cm length.
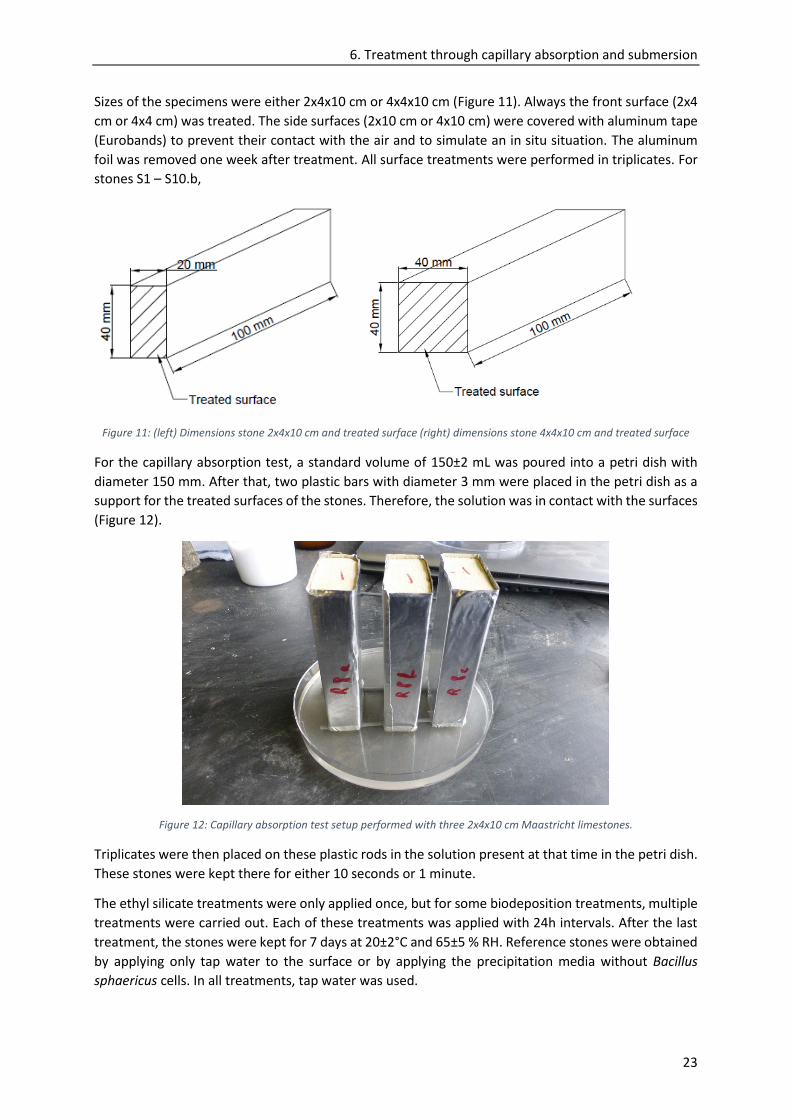
6. Treatment through capillary absorption and submersion
23
Sizes of the specimens were either 2x4x10 cm or 4x4x10 cm (Figure 11). Always the front surface (2x4
cm or 4x4 cm) was treated. The side surfaces (2x10 cm or 4x10 cm) were covered with aluminum tape
(Eurobands) to prevent their contact with the air and to simulate an in situ situation. The aluminum
foil was removed one week after treatment. All surface treatments were performed in triplicates. For
stones S1 – S10.b,
Figure 11: (left) Dimensions stone 2x4x10 cm and treated surface (right) dimensions stone 4x4x10 cm and treated surface
For the capillary absorption test, a standard volume of 150±2 mL was poured into a petri dish with
diameter 150 mm. After that, two plastic bars with diameter 3 mm were placed in the petri dish as a
support for the treated surfaces of the stones. Therefore, the solution was in contact with the surfaces
(Figure 12).
Figure 12: Capillary absorption test setup performed with three 2x4x10 cm Maastricht limestones.
Triplicates were then placed on these plastic rods in the solution present at that time in the petri dish.
These stones were kept there for either 10 seconds or 1 minute.
The ethyl silicate treatments were only applied once, but for some biodeposition treatments, multiple
treatments were carried out. Each of these treatments was applied with 24h intervals. After the last
treatment, the stones were kept for 7 days at 20±2°C and 65±5 % RH. Reference stones were obtained
by applying only tap water to the surface or by applying the precipitation media without Bacillus
sphaericus cells. In all treatments, tap water was used.
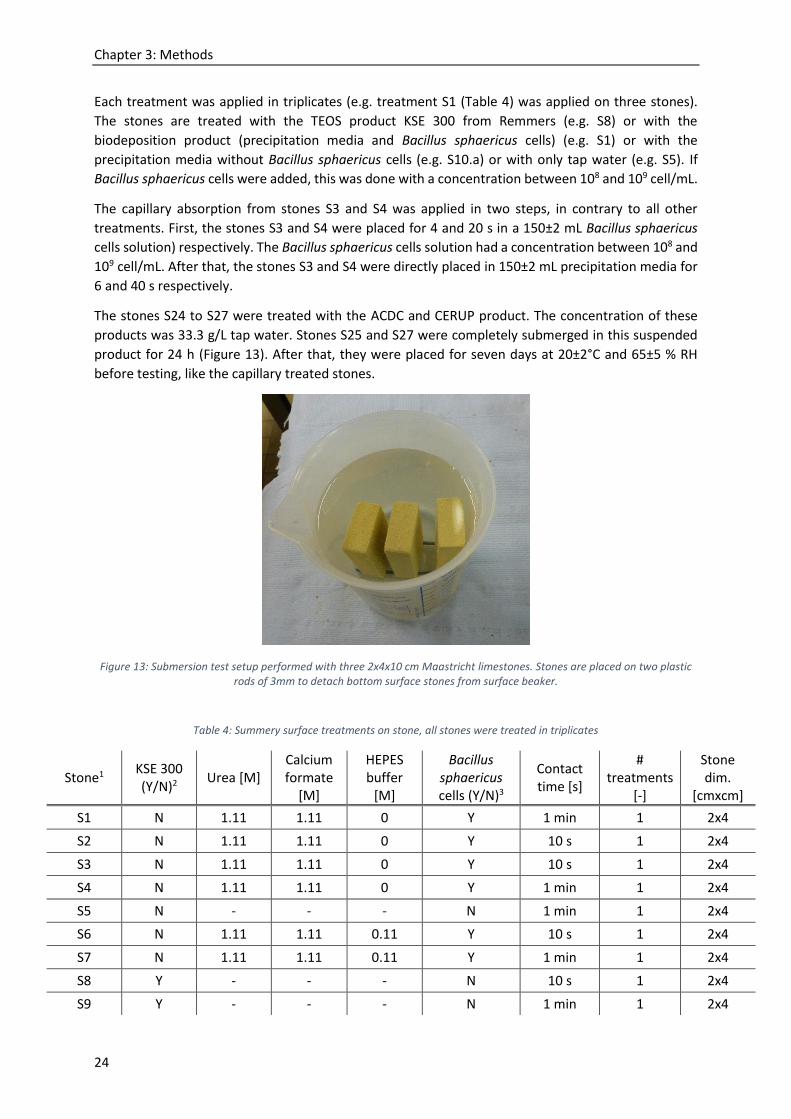
Chapter 3: Methods
24
Each treatment was applied in triplicates (e.g. treatment S1 (Table 4) was applied on three stones).
The stones are treated with the TEOS product KSE 300 from Remmers (e.g. S8) or with the
biodeposition product (precipitation media and Bacillus sphaericus cells) (e.g. S1) or with the
precipitation media without Bacillus sphaericus cells (e.g. S10.a) or with only tap water (e.g. S5). If
Bacillus sphaericus cells were added, this was done with a concentration between 108 and 109 cell/mL.
The capillary absorption from stones S3 and S4 was applied in two steps, in contrary to all other
treatments. First, the stones S3 and S4 were placed for 4 and 20 s in a 150±2 mL Bacillus sphaericus
cells solution) respectively. The Bacillus sphaericus cells solution had a concentration between 108 and
109 cell/mL. After that, the stones S3 and S4 were directly placed in 150±2 mL precipitation media for
6 and 40 s respectively.
The stones S24 to S27 were treated with the ACDC and CERUP product. The concentration of these
products was 33.3 g/L tap water. Stones S25 and S27 were completely submerged in this suspended
product for 24 h (Figure 13). After that, they were placed for seven days at 20±2°C and 65±5 % RH
before testing, like the capillary treated stones.
Figure 13: Submersion test setup performed with three 2x4x10 cm Maastricht limestones. Stones are placed on two plastic rods of 3mm to detach bottom surface stones from surface beaker.
Table 4: Summery surface treatments on stone, all stones were treated in triplicates
Stone1 KSE 300 (Y/N)2
Urea [M] Calcium formate
[M]
HEPES buffer
[M]
Bacillus sphaericus cells (Y/N)3
Contact time [s]
# treatments
[-]
Stone dim.
[cmxcm]
S1 N 1.11 1.11 0 Y 1 min 1 2x4
S2 N 1.11 1.11 0 Y 10 s 1 2x4
S3 N 1.11 1.11 0 Y 10 s 1 2x4
S4 N 1.11 1.11 0 Y 1 min 1 2x4
S5 N - - - N 1 min 1 2x4
S6 N 1.11 1.11 0.11 Y 10 s 1 2x4
S7 N 1.11 1.11 0.11 Y 1 min 1 2x4
S8 Y - - - N 10 s 1 2x4
S9 Y - - - N 1 min 1 2x4
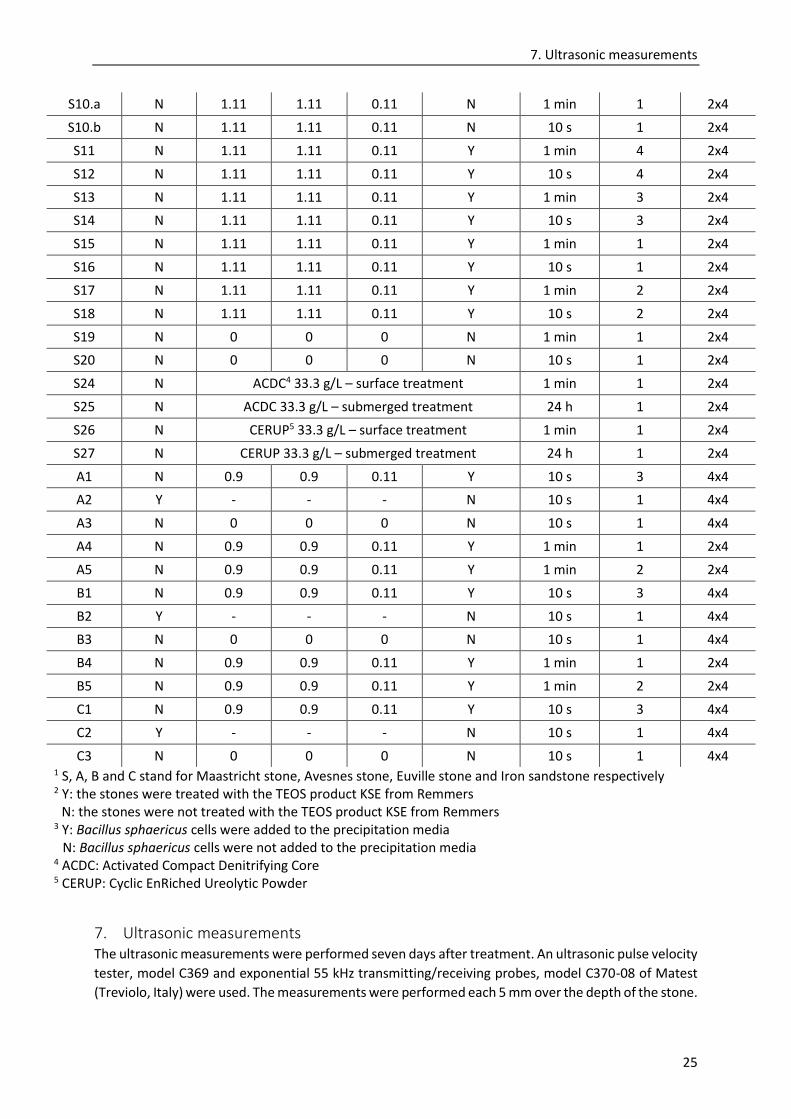
7. Ultrasonic measurements
25
S10.a N 1.11 1.11 0.11 N 1 min 1 2x4
S10.b N 1.11 1.11 0.11 N 10 s 1 2x4
S11 N 1.11 1.11 0.11 Y 1 min 4 2x4
S12 N 1.11 1.11 0.11 Y 10 s 4 2x4
S13 N 1.11 1.11 0.11 Y 1 min 3 2x4
S14 N 1.11 1.11 0.11 Y 10 s 3 2x4
S15 N 1.11 1.11 0.11 Y 1 min 1 2x4
S16 N 1.11 1.11 0.11 Y 10 s 1 2x4
S17 N 1.11 1.11 0.11 Y 1 min 2 2x4
S18 N 1.11 1.11 0.11 Y 10 s 2 2x4
S19 N 0 0 0 N 1 min 1 2x4
S20 N 0 0 0 N 10 s 1 2x4
S24 N ACDC4 33.3 g/L – surface treatment 1 min 1 2x4
S25 N ACDC 33.3 g/L – submerged treatment 24 h 1 2x4
S26 N CERUP5 33.3 g/L – surface treatment 1 min 1 2x4
S27 N CERUP 33.3 g/L – submerged treatment 24 h 1 2x4
A1 N 0.9 0.9 0.11 Y 10 s 3 4x4
A2 Y - - - N 10 s 1 4x4
A3 N 0 0 0 N 10 s 1 4x4
A4 N 0.9 0.9 0.11 Y 1 min 1 2x4
A5 N 0.9 0.9 0.11 Y 1 min 2 2x4
B1 N 0.9 0.9 0.11 Y 10 s 3 4x4
B2 Y - - - N 10 s 1 4x4
B3 N 0 0 0 N 10 s 1 4x4
B4 N 0.9 0.9 0.11 Y 1 min 1 2x4
B5 N 0.9 0.9 0.11 Y 1 min 2 2x4
C1 N 0.9 0.9 0.11 Y 10 s 3 4x4
C2 Y - - - N 10 s 1 4x4
C3 N 0 0 0 N 10 s 1 4x4 1 S, A, B and C stand for Maastricht stone, Avesnes stone, Euville stone and Iron sandstone respectively 2 Y: the stones were treated with the TEOS product KSE from Remmers
N: the stones were not treated with the TEOS product KSE from Remmers 3 Y: Bacillus sphaericus cells were added to the precipitation media
N: Bacillus sphaericus cells were not added to the precipitation media 4 ACDC: Activated Compact Denitrifying Core 5 CERUP: Cyclic EnRiched Ureolytic Powder
7. Ultrasonic measurements The ultrasonic measurements were performed seven days after treatment. An ultrasonic pulse velocity
tester, model C369 and exponential 55 kHz transmitting/receiving probes, model C370-08 of Matest
(Treviolo, Italy) were used. The measurements were performed each 5 mm over the depth of the stone.
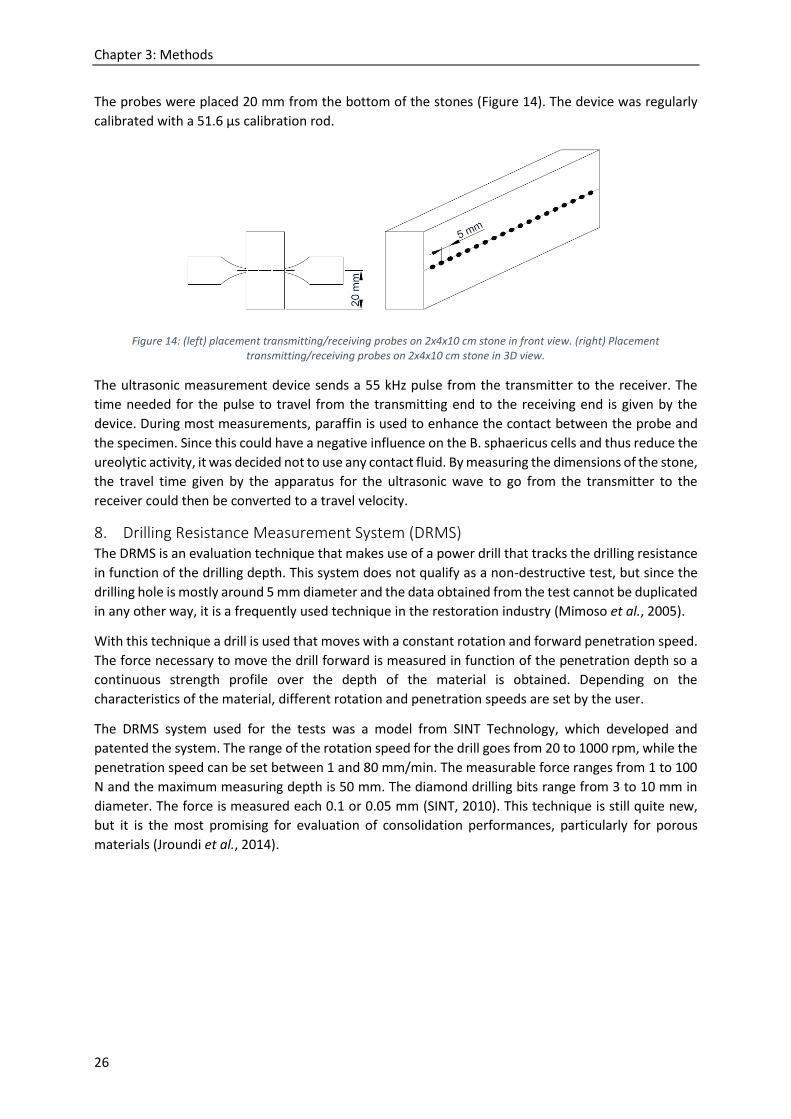
Chapter 3: Methods
26
The probes were placed 20 mm from the bottom of the stones (Figure 14). The device was regularly
calibrated with a 51.6 µs calibration rod.
Figure 14: (left) placement transmitting/receiving probes on 2x4x10 cm stone in front view. (right) Placement transmitting/receiving probes on 2x4x10 cm stone in 3D view.
The ultrasonic measurement device sends a 55 kHz pulse from the transmitter to the receiver. The
time needed for the pulse to travel from the transmitting end to the receiving end is given by the
device. During most measurements, paraffin is used to enhance the contact between the probe and
the specimen. Since this could have a negative influence on the B. sphaericus cells and thus reduce the
ureolytic activity, it was decided not to use any contact fluid. By measuring the dimensions of the stone,
the travel time given by the apparatus for the ultrasonic wave to go from the transmitter to the
receiver could then be converted to a travel velocity.
8. Drilling Resistance Measurement System (DRMS) The DRMS is an evaluation technique that makes use of a power drill that tracks the drilling resistance
in function of the drilling depth. This system does not qualify as a non-destructive test, but since the
drilling hole is mostly around 5 mm diameter and the data obtained from the test cannot be duplicated
in any other way, it is a frequently used technique in the restoration industry (Mimoso et al., 2005).
With this technique a drill is used that moves with a constant rotation and forward penetration speed.
The force necessary to move the drill forward is measured in function of the penetration depth so a
continuous strength profile over the depth of the material is obtained. Depending on the
characteristics of the material, different rotation and penetration speeds are set by the user.
The DRMS system used for the tests was a model from SINT Technology, which developed and
patented the system. The range of the rotation speed for the drill goes from 20 to 1000 rpm, while the
penetration speed can be set between 1 and 80 mm/min. The measurable force ranges from 1 to 100
N and the maximum measuring depth is 50 mm. The diamond drilling bits range from 3 to 10 mm in
diameter. The force is measured each 0.1 or 0.05 mm (SINT, 2010). This technique is still quite new,
but it is the most promising for evaluation of consolidation performances, particularly for porous
materials (Jroundi et al., 2014).
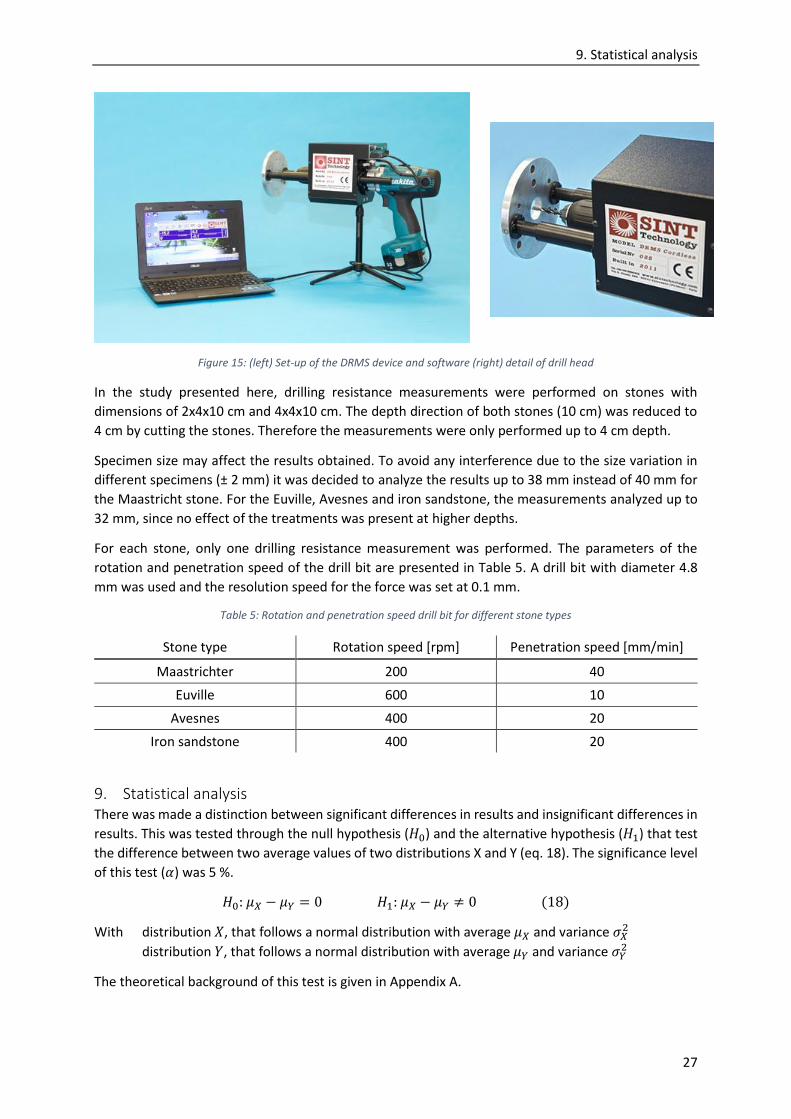
9. Statistical analysis
27
Figure 15: (left) Set-up of the DRMS device and software (right) detail of drill head
In the study presented here, drilling resistance measurements were performed on stones with
dimensions of 2x4x10 cm and 4x4x10 cm. The depth direction of both stones (10 cm) was reduced to
4 cm by cutting the stones. Therefore the measurements were only performed up to 4 cm depth.
Specimen size may affect the results obtained. To avoid any interference due to the size variation in
different specimens (± 2 mm) it was decided to analyze the results up to 38 mm instead of 40 mm for
the Maastricht stone. For the Euville, Avesnes and iron sandstone, the measurements analyzed up to
32 mm, since no effect of the treatments was present at higher depths.
For each stone, only one drilling resistance measurement was performed. The parameters of the
rotation and penetration speed of the drill bit are presented in Table 5. A drill bit with diameter 4.8
mm was used and the resolution speed for the force was set at 0.1 mm.
Table 5: Rotation and penetration speed drill bit for different stone types
Stone type Rotation speed [rpm] Penetration speed [mm/min]
Maastrichter 200 40
Euville 600 10
Avesnes 400 20
Iron sandstone 400 20
9. Statistical analysis There was made a distinction between significant differences in results and insignificant differences in
results. This was tested through the null hypothesis (𝐻0) and the alternative hypothesis (𝐻1) that test
the difference between two average values of two distributions X and Y (eq. 18). The significance level
of this test (𝛼) was 5 %.
𝐻0: 𝜇𝑋 − 𝜇𝑌 = 0 𝐻1: 𝜇𝑋 − 𝜇𝑌 ≠ 0 (18)
With distribution 𝑋, that follows a normal distribution with average 𝜇𝑋 and variance 𝜎𝑋2
distribution 𝑌, that follows a normal distribution with average 𝜇𝑌 and variance 𝜎𝑌2
The theoretical background of this test is given in Appendix A.
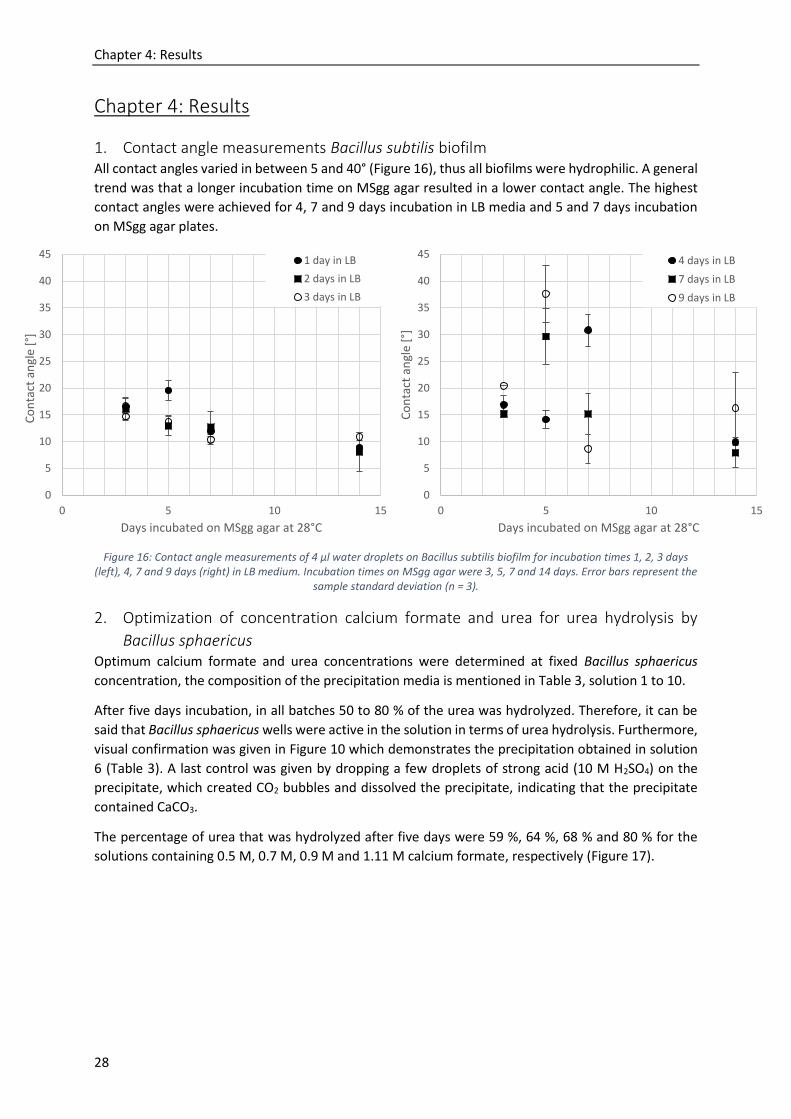
Chapter 4: Results
28
Chapter 4: Results
1. Contact angle measurements Bacillus subtilis biofilm All contact angles varied in between 5 and 40° (Figure 16), thus all biofilms were hydrophilic. A general
trend was that a longer incubation time on MSgg agar resulted in a lower contact angle. The highest
contact angles were achieved for 4, 7 and 9 days incubation in LB media and 5 and 7 days incubation
on MSgg agar plates.
Figure 16: Contact angle measurements of 4 µl water droplets on Bacillus subtilis biofilm for incubation times 1, 2, 3 days (left), 4, 7 and 9 days (right) in LB medium. Incubation times on MSgg agar were 3, 5, 7 and 14 days. Error bars represent the
sample standard deviation (n = 3).
2. Optimization of concentration calcium formate and urea for urea hydrolysis by
Bacillus sphaericus Optimum calcium formate and urea concentrations were determined at fixed Bacillus sphaericus
concentration, the composition of the precipitation media is mentioned in Table 3, solution 1 to 10.
After five days incubation, in all batches 50 to 80 % of the urea was hydrolyzed. Therefore, it can be
said that Bacillus sphaericus wells were active in the solution in terms of urea hydrolysis. Furthermore,
visual confirmation was given in Figure 10 which demonstrates the precipitation obtained in solution
6 (Table 3). A last control was given by dropping a few droplets of strong acid (10 M H2SO4) on the
precipitate, which created CO2 bubbles and dissolved the precipitate, indicating that the precipitate
contained CaCO3.
The percentage of urea that was hydrolyzed after five days were 59 %, 64 %, 68 % and 80 % for the
solutions containing 0.5 M, 0.7 M, 0.9 M and 1.11 M calcium formate, respectively (Figure 17).
0
5
10
15
20
25
30
35
40
45
0 5 10 15
Co
nta
ct a
ngl
e [°
]
Days incubated on MSgg agar at 28°C
1 day in LB
2 days in LB
3 days in LB
0
5
10
15
20
25
30
35
40
45
0 5 10 15
Co
nta
ct a
ngl
e [°
]
Days incubated on MSgg agar at 28°C
4 days in LB
7 days in LB
9 days in LB
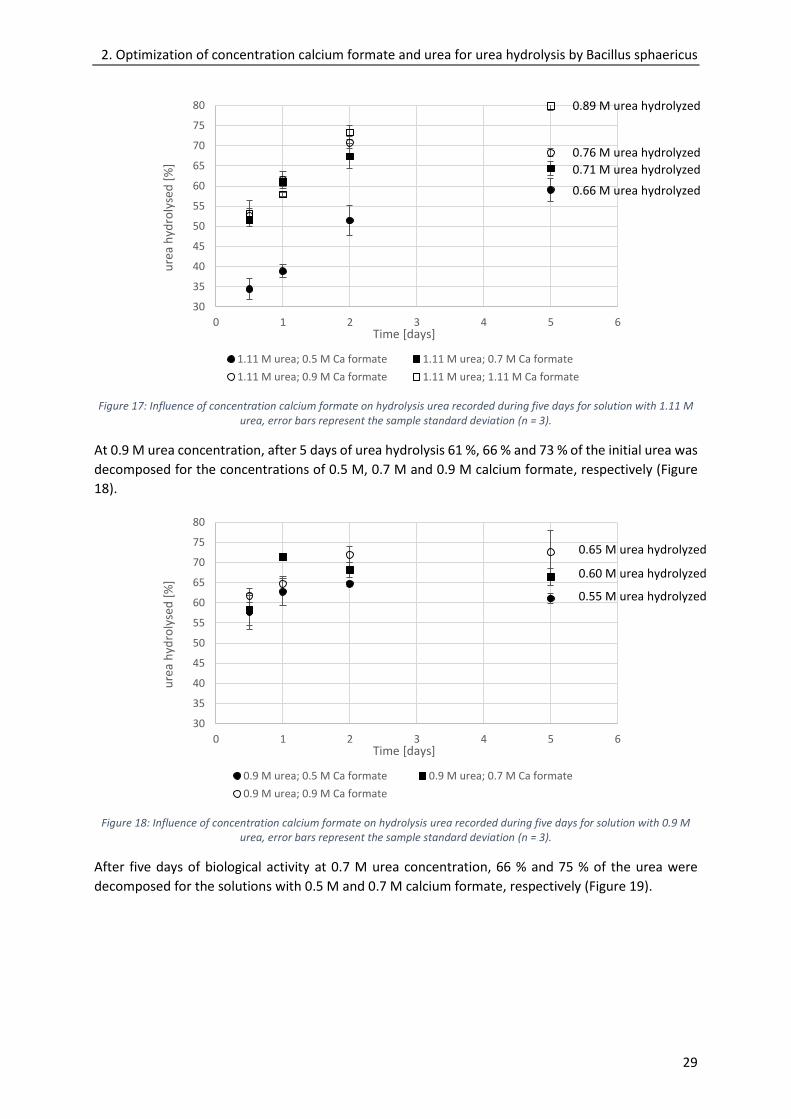
2. Optimization of concentration calcium formate and urea for urea hydrolysis by Bacillus sphaericus
29
Figure 17: Influence of concentration calcium formate on hydrolysis urea recorded during five days for solution with 1.11 M urea, error bars represent the sample standard deviation (n = 3).
At 0.9 M urea concentration, after 5 days of urea hydrolysis 61 %, 66 % and 73 % of the initial urea was
decomposed for the concentrations of 0.5 M, 0.7 M and 0.9 M calcium formate, respectively (Figure
18).
Figure 18: Influence of concentration calcium formate on hydrolysis urea recorded during five days for solution with 0.9 M urea, error bars represent the sample standard deviation (n = 3).
After five days of biological activity at 0.7 M urea concentration, 66 % and 75 % of the urea were
decomposed for the solutions with 0.5 M and 0.7 M calcium formate, respectively (Figure 19).
30
35
40
45
50
55
60
65
70
75
80
0 1 2 3 4 5 6
ure
a h
ydro
lyse
d [
%]
Time [days]
1.11 M urea; 0.5 M Ca formate 1.11 M urea; 0.7 M Ca formate
1.11 M urea; 0.9 M Ca formate 1.11 M urea; 1.11 M Ca formate
30
35
40
45
50
55
60
65
70
75
80
0 1 2 3 4 5 6
ure
a h
ydro
lyse
d [
%]
Time [days]
0.9 M urea; 0.5 M Ca formate 0.9 M urea; 0.7 M Ca formate
0.9 M urea; 0.9 M Ca formate
0.89 M urea hydrolyzed
0.76 M urea hydrolyzed
0.71 M urea hydrolyzed
0.66 M urea hydrolyzed
0.65 M urea hydrolyzed
0.60 M urea hydrolyzed
0.55 M urea hydrolyzed
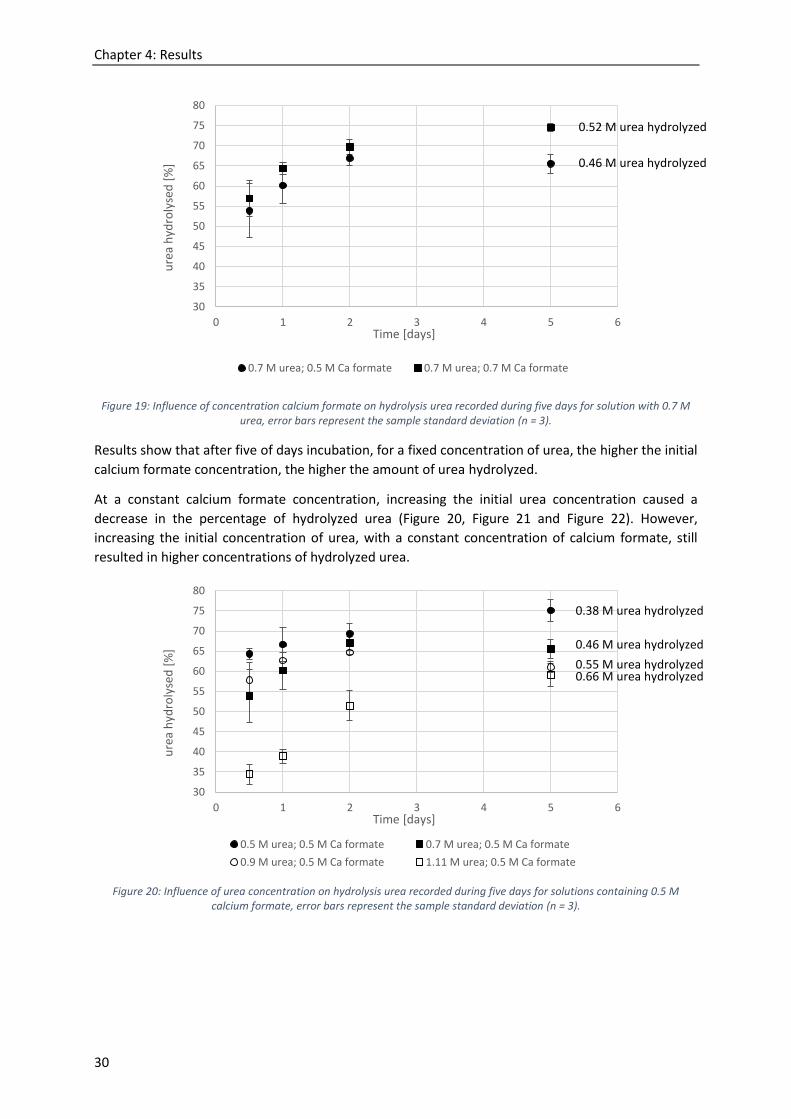
Chapter 4: Results
30
Figure 19: Influence of concentration calcium formate on hydrolysis urea recorded during five days for solution with 0.7 M urea, error bars represent the sample standard deviation (n = 3).
Results show that after five of days incubation, for a fixed concentration of urea, the higher the initial
calcium formate concentration, the higher the amount of urea hydrolyzed.
At a constant calcium formate concentration, increasing the initial urea concentration caused a
decrease in the percentage of hydrolyzed urea (Figure 20, Figure 21 and Figure 22). However,
increasing the initial concentration of urea, with a constant concentration of calcium formate, still
resulted in higher concentrations of hydrolyzed urea.
Figure 20: Influence of urea concentration on hydrolysis urea recorded during five days for solutions containing 0.5 M calcium formate, error bars represent the sample standard deviation (n = 3).
30
35
40
45
50
55
60
65
70
75
80
0 1 2 3 4 5 6
ure
a h
ydro
lyse
d [
%]
Time [days]
0.7 M urea; 0.5 M Ca formate 0.7 M urea; 0.7 M Ca formate
30
35
40
45
50
55
60
65
70
75
80
0 1 2 3 4 5 6
ure
a h
ydro
lyse
d [
%]
Time [days]
0.5 M urea; 0.5 M Ca formate 0.7 M urea; 0.5 M Ca formate
0.9 M urea; 0.5 M Ca formate 1.11 M urea; 0.5 M Ca formate
0.52 M urea hydrolyzed
0.46 M urea hydrolyzed
0.38 M urea hydrolyzed
0.46 M urea hydrolyzed
0.55 M urea hydrolyzed 0.66 M urea hydrolyzed
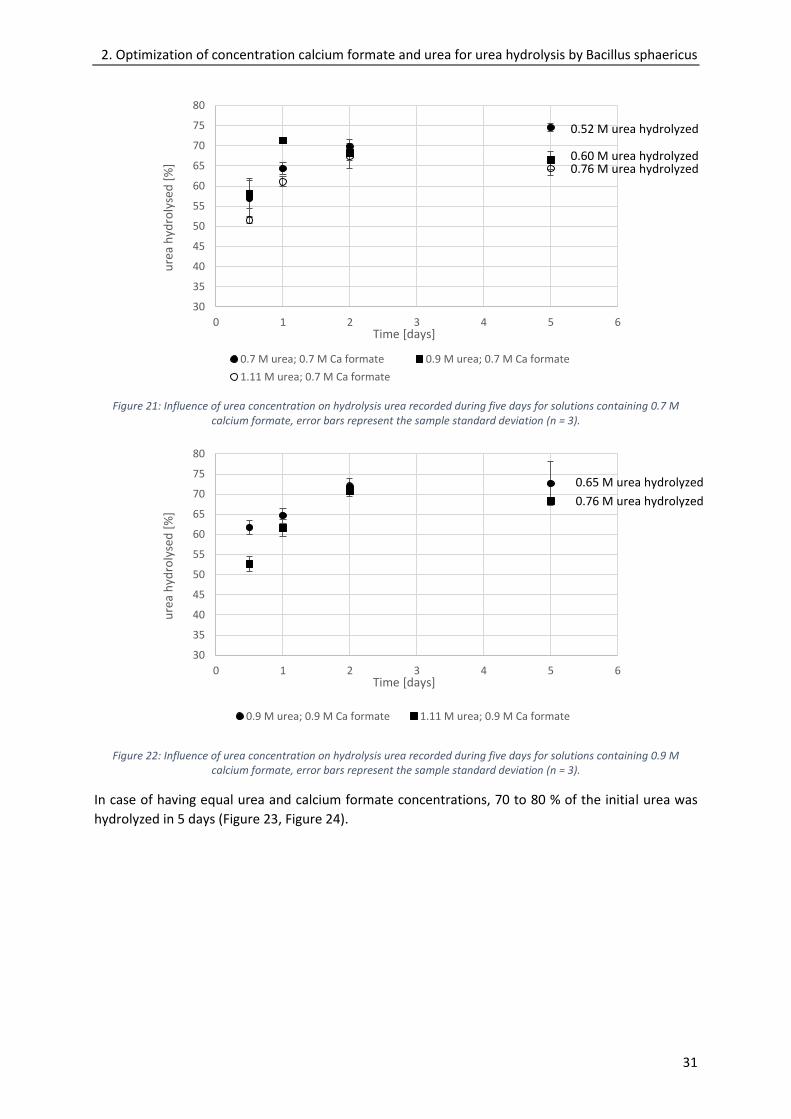
2. Optimization of concentration calcium formate and urea for urea hydrolysis by Bacillus sphaericus
31
Figure 21: Influence of urea concentration on hydrolysis urea recorded during five days for solutions containing 0.7 M calcium formate, error bars represent the sample standard deviation (n = 3).
Figure 22: Influence of urea concentration on hydrolysis urea recorded during five days for solutions containing 0.9 M calcium formate, error bars represent the sample standard deviation (n = 3).
In case of having equal urea and calcium formate concentrations, 70 to 80 % of the initial urea was
hydrolyzed in 5 days (Figure 23, Figure 24).
30
35
40
45
50
55
60
65
70
75
80
0 1 2 3 4 5 6
ure
a h
ydro
lyse
d [
%]
Time [days]
0.7 M urea; 0.7 M Ca formate 0.9 M urea; 0.7 M Ca formate
1.11 M urea; 0.7 M Ca formate
30
35
40
45
50
55
60
65
70
75
80
0 1 2 3 4 5 6
ure
a h
ydro
lyse
d [
%]
Time [days]
0.9 M urea; 0.9 M Ca formate 1.11 M urea; 0.9 M Ca formate
0.52 M urea hydrolyzed
0.60 M urea hydrolyzed 0.76 M urea hydrolyzed
0.65 M urea hydrolyzed
0.76 M urea hydrolyzed
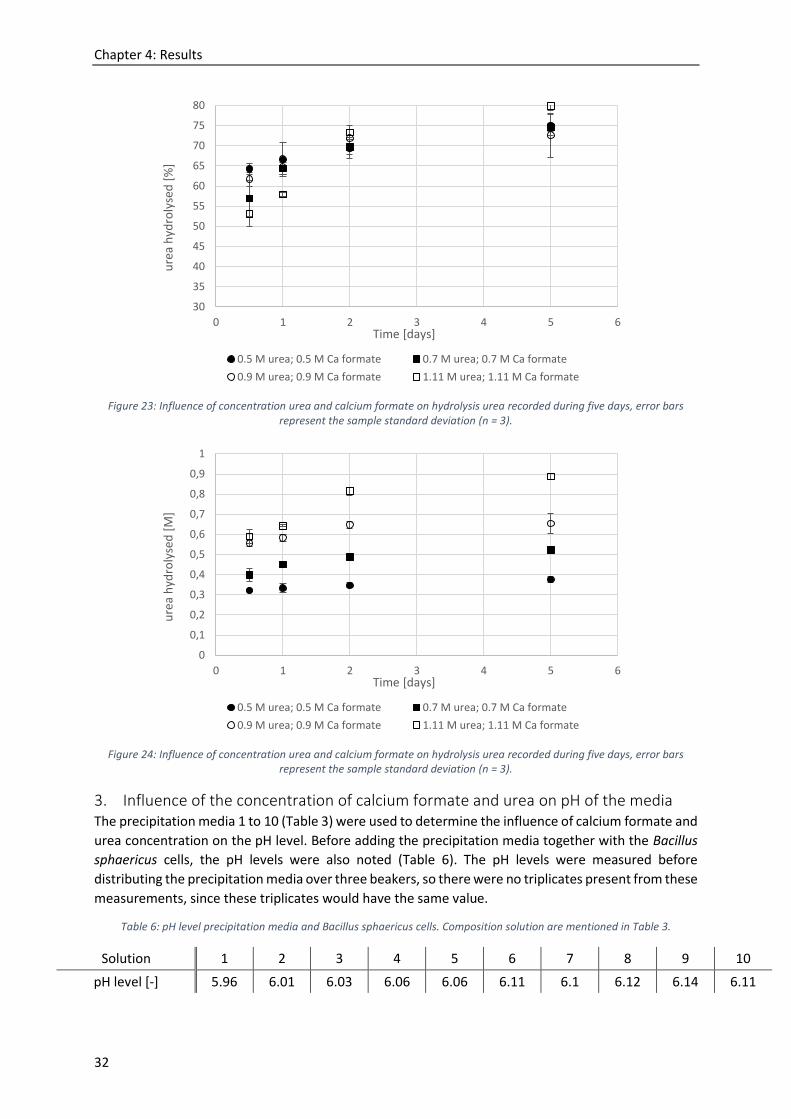
Chapter 4: Results
32
Figure 23: Influence of concentration urea and calcium formate on hydrolysis urea recorded during five days, error bars represent the sample standard deviation (n = 3).
Figure 24: Influence of concentration urea and calcium formate on hydrolysis urea recorded during five days, error bars represent the sample standard deviation (n = 3).
3. Influence of the concentration of calcium formate and urea on pH of the media The precipitation media 1 to 10 (Table 3) were used to determine the influence of calcium formate and
urea concentration on the pH level. Before adding the precipitation media together with the Bacillus
sphaericus cells, the pH levels were also noted (Table 6). The pH levels were measured before
distributing the precipitation media over three beakers, so there were no triplicates present from these
measurements, since these triplicates would have the same value.
Table 6: pH level precipitation media and Bacillus sphaericus cells. Composition solution are mentioned in Table 3.
Solution 1 2 3 4 5 6 7 8 9 10
pH level [-] 5.96 6.01 6.03 6.06 6.06 6.11 6.1 6.12 6.14 6.11
30
35
40
45
50
55
60
65
70
75
80
0 1 2 3 4 5 6
ure
a h
ydro
lyse
d [
%]
Time [days]
0.5 M urea; 0.5 M Ca formate 0.7 M urea; 0.7 M Ca formate
0.9 M urea; 0.9 M Ca formate 1.11 M urea; 1.11 M Ca formate
0
0,1
0,2
0,3
0,4
0,5
0,6
0,7
0,8
0,9
1
0 1 2 3 4 5 6
ure
a h
ydro
lyse
d [
M]
Time [days]
0.5 M urea; 0.5 M Ca formate 0.7 M urea; 0.7 M Ca formate
0.9 M urea; 0.9 M Ca formate 1.11 M urea; 1.11 M Ca formate
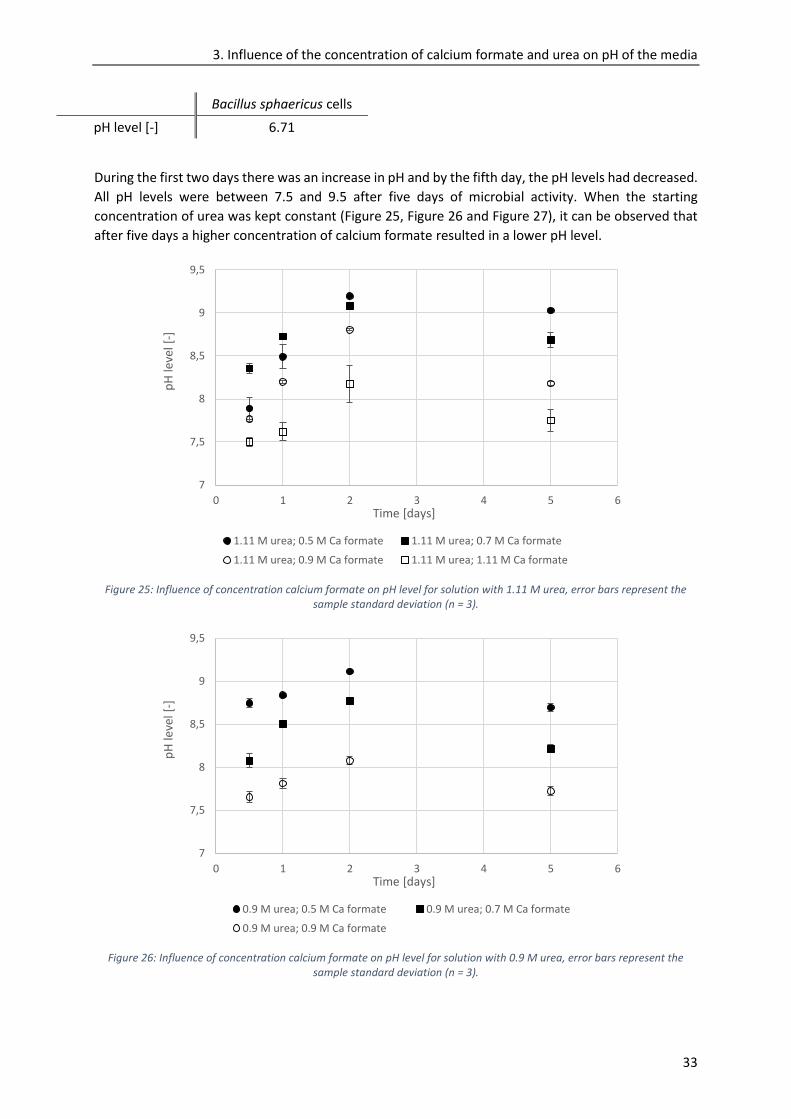
3. Influence of the concentration of calcium formate and urea on pH of the media
33
Bacillus sphaericus cells
pH level [-] 6.71
During the first two days there was an increase in pH and by the fifth day, the pH levels had decreased.
All pH levels were between 7.5 and 9.5 after five days of microbial activity. When the starting
concentration of urea was kept constant (Figure 25, Figure 26 and Figure 27), it can be observed that
after five days a higher concentration of calcium formate resulted in a lower pH level.
Figure 25: Influence of concentration calcium formate on pH level for solution with 1.11 M urea, error bars represent the sample standard deviation (n = 3).
Figure 26: Influence of concentration calcium formate on pH level for solution with 0.9 M urea, error bars represent the sample standard deviation (n = 3).
7
7,5
8
8,5
9
9,5
0 1 2 3 4 5 6
pH
leve
l [-]
Time [days]
1.11 M urea; 0.5 M Ca formate 1.11 M urea; 0.7 M Ca formate
1.11 M urea; 0.9 M Ca formate 1.11 M urea; 1.11 M Ca formate
7
7,5
8
8,5
9
9,5
0 1 2 3 4 5 6
pH
leve
l [-]
Time [days]
0.9 M urea; 0.5 M Ca formate 0.9 M urea; 0.7 M Ca formate
0.9 M urea; 0.9 M Ca formate
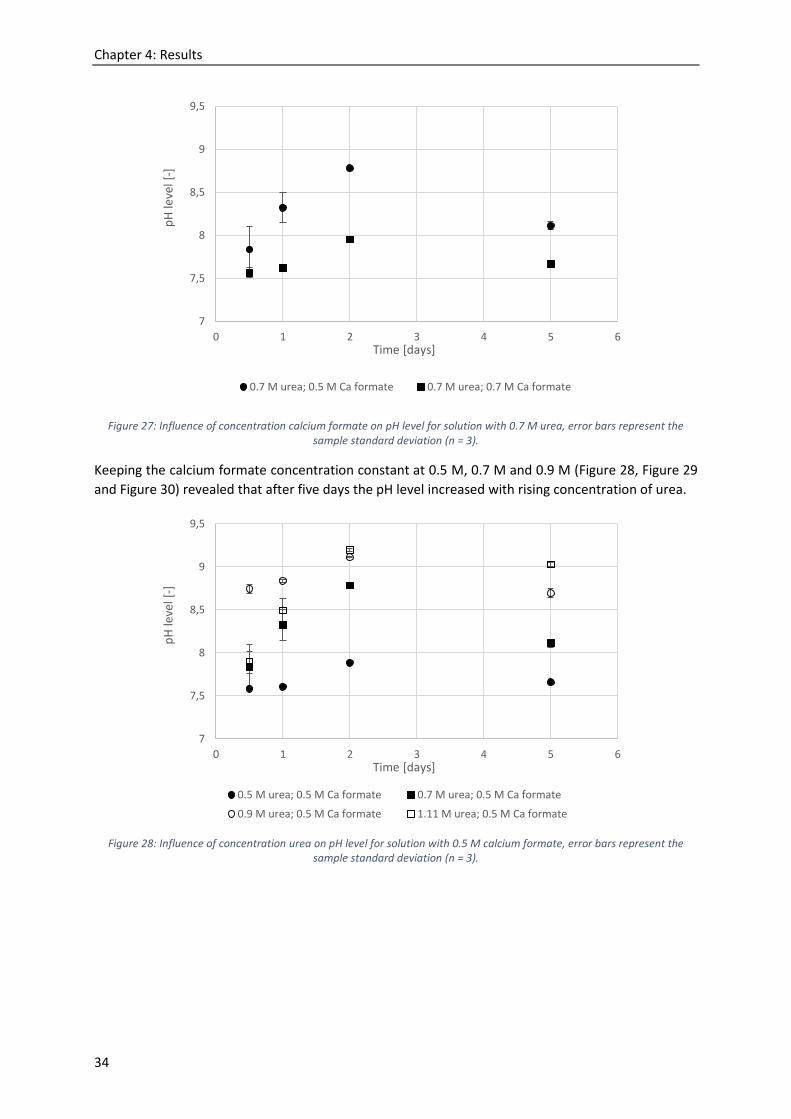
Chapter 4: Results
34
Figure 27: Influence of concentration calcium formate on pH level for solution with 0.7 M urea, error bars represent the sample standard deviation (n = 3).
Keeping the calcium formate concentration constant at 0.5 M, 0.7 M and 0.9 M (Figure 28, Figure 29
and Figure 30) revealed that after five days the pH level increased with rising concentration of urea.
Figure 28: Influence of concentration urea on pH level for solution with 0.5 M calcium formate, error bars represent the sample standard deviation (n = 3).
7
7,5
8
8,5
9
9,5
0 1 2 3 4 5 6
pH
leve
l [-]
Time [days]
0.7 M urea; 0.5 M Ca formate 0.7 M urea; 0.7 M Ca formate
7
7,5
8
8,5
9
9,5
0 1 2 3 4 5 6
pH
leve
l [-]
Time [days]
0.5 M urea; 0.5 M Ca formate 0.7 M urea; 0.5 M Ca formate
0.9 M urea; 0.5 M Ca formate 1.11 M urea; 0.5 M Ca formate
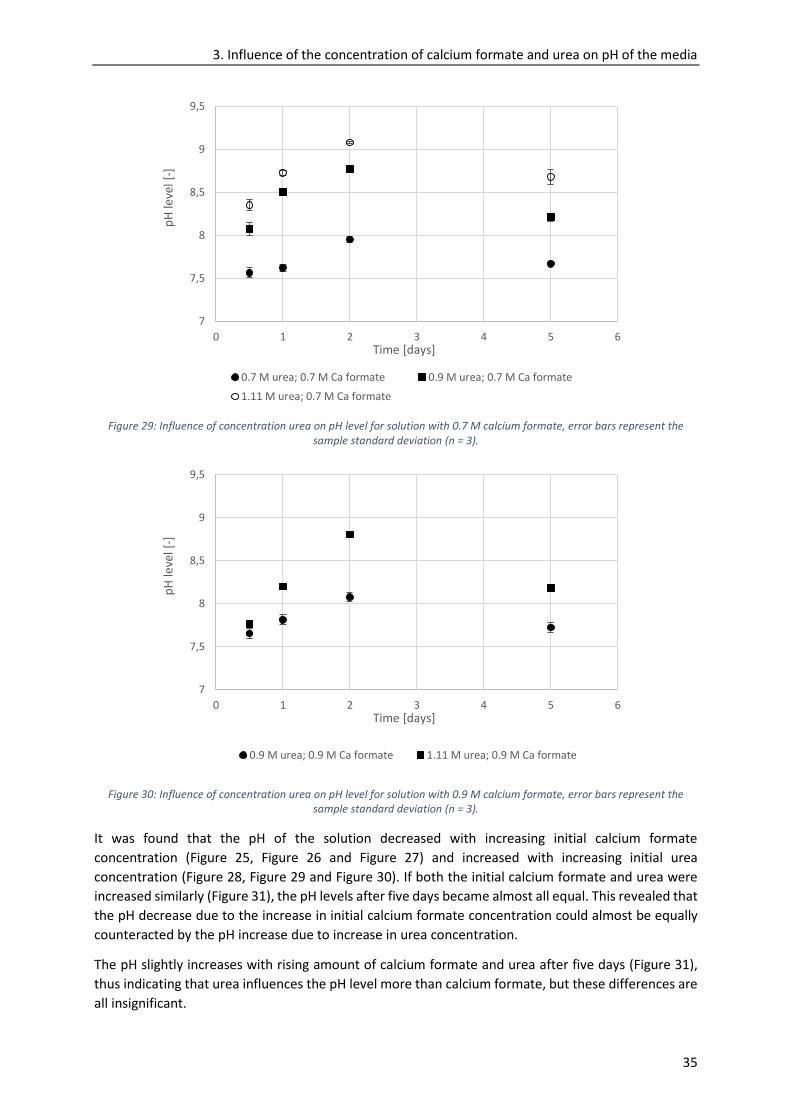
3. Influence of the concentration of calcium formate and urea on pH of the media
35
Figure 29: Influence of concentration urea on pH level for solution with 0.7 M calcium formate, error bars represent the sample standard deviation (n = 3).
Figure 30: Influence of concentration urea on pH level for solution with 0.9 M calcium formate, error bars represent the sample standard deviation (n = 3).
It was found that the pH of the solution decreased with increasing initial calcium formate
concentration (Figure 25, Figure 26 and Figure 27) and increased with increasing initial urea
concentration (Figure 28, Figure 29 and Figure 30). If both the initial calcium formate and urea were
increased similarly (Figure 31), the pH levels after five days became almost all equal. This revealed that
the pH decrease due to the increase in initial calcium formate concentration could almost be equally
counteracted by the pH increase due to increase in urea concentration.
The pH slightly increases with rising amount of calcium formate and urea after five days (Figure 31),
thus indicating that urea influences the pH level more than calcium formate, but these differences are
all insignificant.
7
7,5
8
8,5
9
9,5
0 1 2 3 4 5 6
pH
leve
l [-]
Time [days]
0.7 M urea; 0.7 M Ca formate 0.9 M urea; 0.7 M Ca formate
1.11 M urea; 0.7 M Ca formate
7
7,5
8
8,5
9
9,5
0 1 2 3 4 5 6
pH
leve
l [-]
Time [days]
0.9 M urea; 0.9 M Ca formate 1.11 M urea; 0.9 M Ca formate
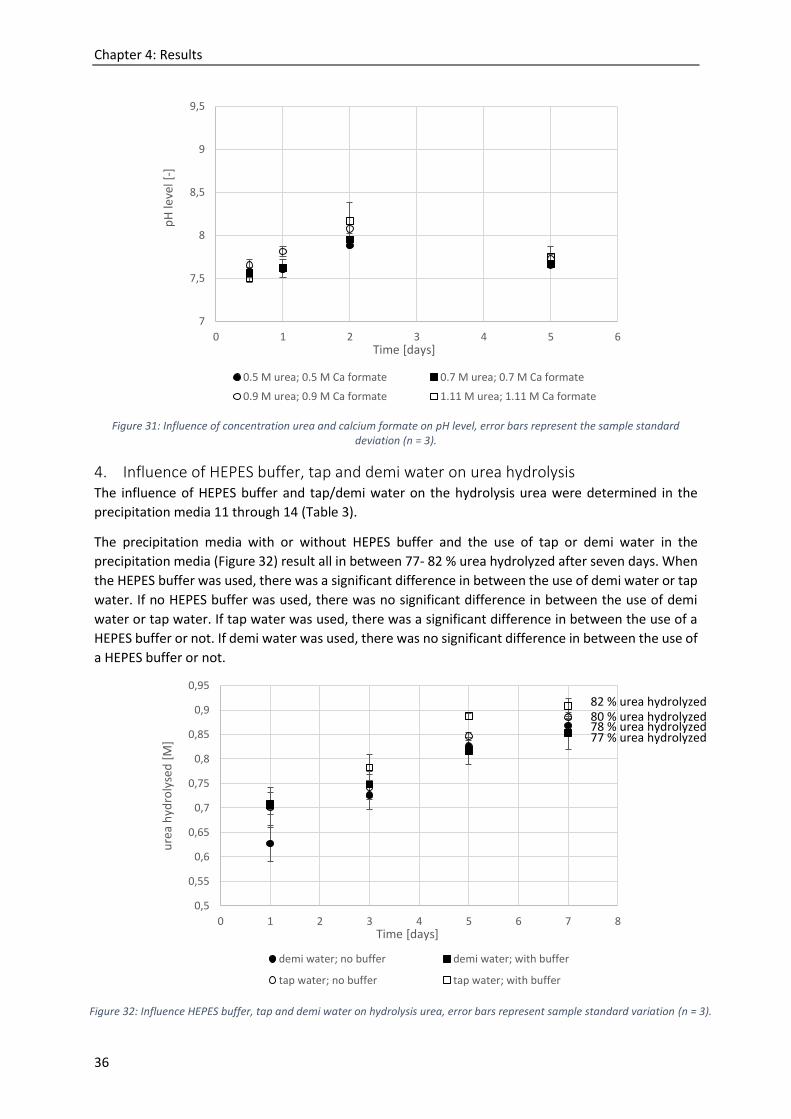
Chapter 4: Results
36
Figure 31: Influence of concentration urea and calcium formate on pH level, error bars represent the sample standard deviation (n = 3).
4. Influence of HEPES buffer, tap and demi water on urea hydrolysis The influence of HEPES buffer and tap/demi water on the hydrolysis urea were determined in the
precipitation media 11 through 14 (Table 3).
The precipitation media with or without HEPES buffer and the use of tap or demi water in the
precipitation media (Figure 32) result all in between 77- 82 % urea hydrolyzed after seven days. When
the HEPES buffer was used, there was a significant difference in between the use of demi water or tap
water. If no HEPES buffer was used, there was no significant difference in between the use of demi
water or tap water. If tap water was used, there was a significant difference in between the use of a
HEPES buffer or not. If demi water was used, there was no significant difference in between the use of
a HEPES buffer or not.
Figure 32: Influence HEPES buffer, tap and demi water on hydrolysis urea, error bars represent sample standard variation (n = 3).
7
7,5
8
8,5
9
9,5
0 1 2 3 4 5 6
pH
leve
l [-]
Time [days]
0.5 M urea; 0.5 M Ca formate 0.7 M urea; 0.7 M Ca formate
0.9 M urea; 0.9 M Ca formate 1.11 M urea; 1.11 M Ca formate
0,5
0,55
0,6
0,65
0,7
0,75
0,8
0,85
0,9
0,95
0 1 2 3 4 5 6 7 8
ure
a h
ydro
lyse
d [
M]
Time [days]
demi water; no buffer demi water; with buffer
tap water; no buffer tap water; with buffer
82 % urea hydrolyzed
78 % urea hydrolyzed 77 % urea hydrolyzed
80 % urea hydrolyzed
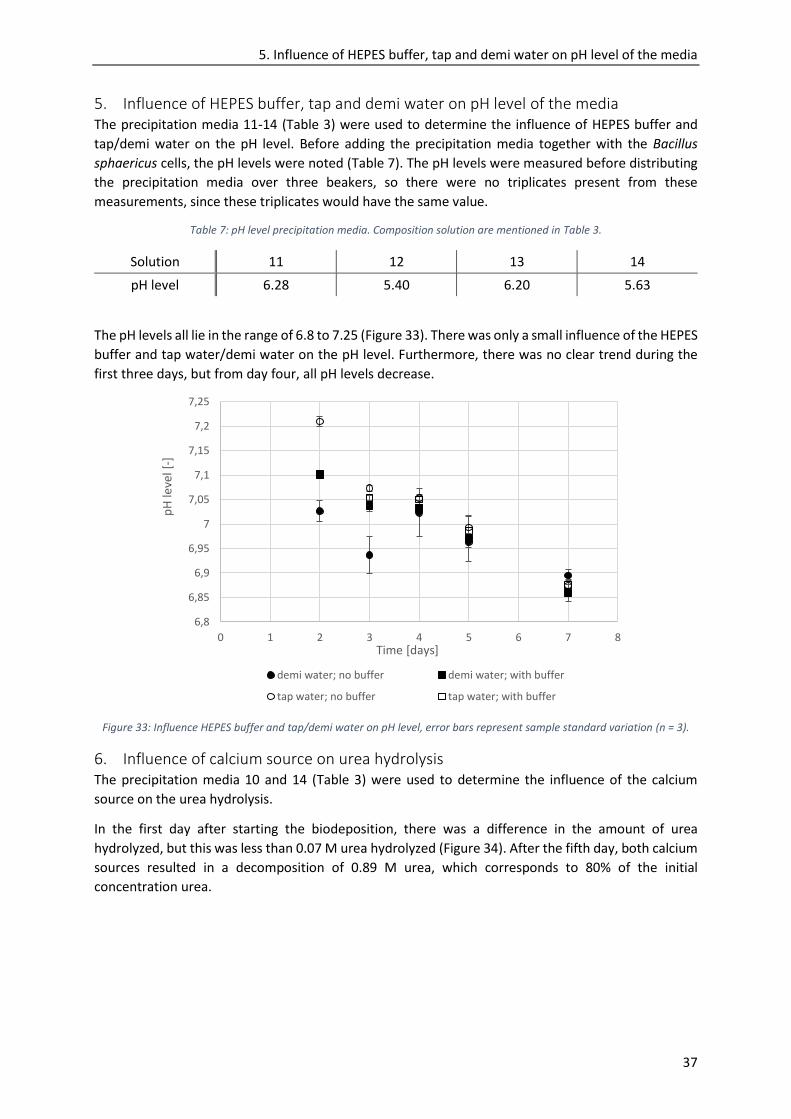
5. Influence of HEPES buffer, tap and demi water on pH level of the media
37
5. Influence of HEPES buffer, tap and demi water on pH level of the media The precipitation media 11-14 (Table 3) were used to determine the influence of HEPES buffer and
tap/demi water on the pH level. Before adding the precipitation media together with the Bacillus
sphaericus cells, the pH levels were noted (Table 7). The pH levels were measured before distributing
the precipitation media over three beakers, so there were no triplicates present from these
measurements, since these triplicates would have the same value.
Table 7: pH level precipitation media. Composition solution are mentioned in Table 3.
Solution 11 12 13 14
pH level 6.28 5.40 6.20 5.63
The pH levels all lie in the range of 6.8 to 7.25 (Figure 33). There was only a small influence of the HEPES
buffer and tap water/demi water on the pH level. Furthermore, there was no clear trend during the
first three days, but from day four, all pH levels decrease.
Figure 33: Influence HEPES buffer and tap/demi water on pH level, error bars represent sample standard variation (n = 3).
6. Influence of calcium source on urea hydrolysis The precipitation media 10 and 14 (Table 3) were used to determine the influence of the calcium
source on the urea hydrolysis.
In the first day after starting the biodeposition, there was a difference in the amount of urea
hydrolyzed, but this was less than 0.07 M urea hydrolyzed (Figure 34). After the fifth day, both calcium
sources resulted in a decomposition of 0.89 M urea, which corresponds to 80% of the initial
concentration urea.
6,8
6,85
6,9
6,95
7
7,05
7,1
7,15
7,2
7,25
0 1 2 3 4 5 6 7 8
pH
leve
l [-]
Time [days]
demi water; no buffer demi water; with buffer
tap water; no buffer tap water; with buffer
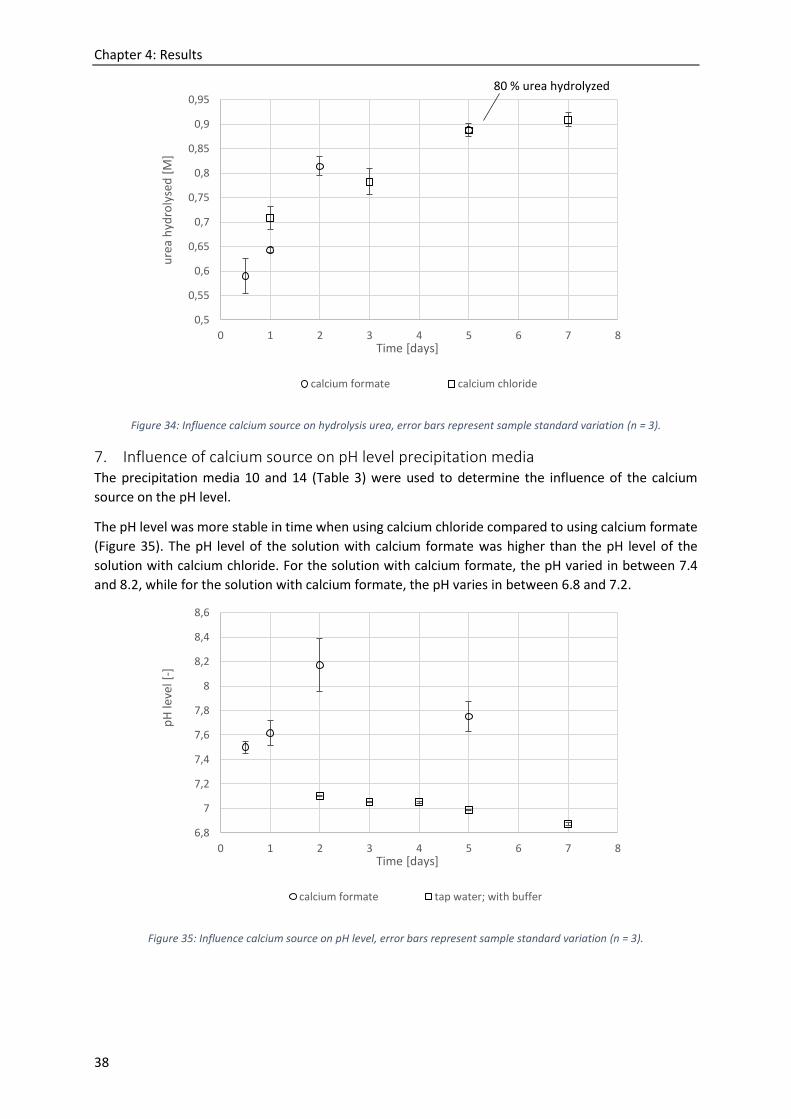
Chapter 4: Results
38
Figure 34: Influence calcium source on hydrolysis urea, error bars represent sample standard variation (n = 3).
7. Influence of calcium source on pH level precipitation media The precipitation media 10 and 14 (Table 3) were used to determine the influence of the calcium
source on the pH level.
The pH level was more stable in time when using calcium chloride compared to using calcium formate
(Figure 35). The pH level of the solution with calcium formate was higher than the pH level of the
solution with calcium chloride. For the solution with calcium formate, the pH varied in between 7.4
and 8.2, while for the solution with calcium formate, the pH varies in between 6.8 and 7.2.
Figure 35: Influence calcium source on pH level, error bars represent sample standard variation (n = 3).
0,5
0,55
0,6
0,65
0,7
0,75
0,8
0,85
0,9
0,95
0 1 2 3 4 5 6 7 8
ure
a h
ydro
lyse
d [
M]
Time [days]
calcium formate calcium chloride
6,8
7
7,2
7,4
7,6
7,8
8
8,2
8,4
8,6
0 1 2 3 4 5 6 7 8
pH
leve
l [-]
Time [days]
calcium formate tap water; with buffer
80 % urea hydrolyzed
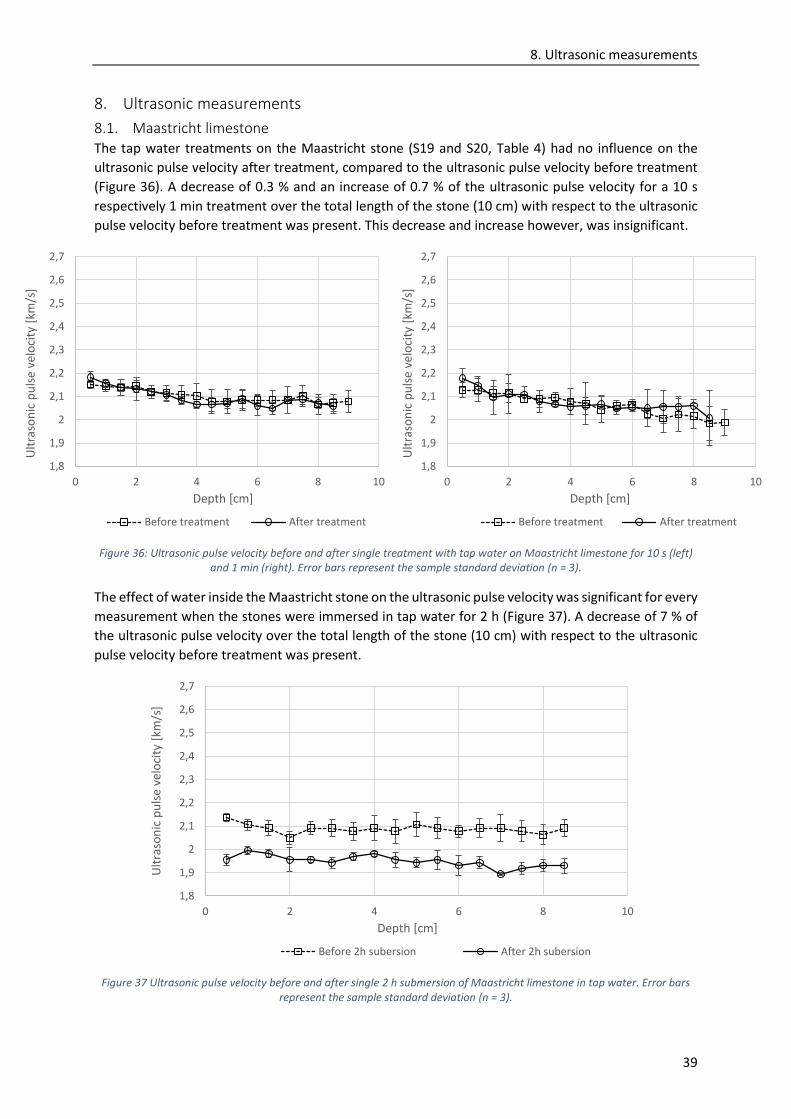
8. Ultrasonic measurements
39
8. Ultrasonic measurements
8.1. Maastricht limestone The tap water treatments on the Maastricht stone (S19 and S20, Table 4) had no influence on the
ultrasonic pulse velocity after treatment, compared to the ultrasonic pulse velocity before treatment
(Figure 36). A decrease of 0.3 % and an increase of 0.7 % of the ultrasonic pulse velocity for a 10 s
respectively 1 min treatment over the total length of the stone (10 cm) with respect to the ultrasonic
pulse velocity before treatment was present. This decrease and increase however, was insignificant.
Figure 36: Ultrasonic pulse velocity before and after single treatment with tap water on Maastricht limestone for 10 s (left) and 1 min (right). Error bars represent the sample standard deviation (n = 3).
The effect of water inside the Maastricht stone on the ultrasonic pulse velocity was significant for every
measurement when the stones were immersed in tap water for 2 h (Figure 37). A decrease of 7 % of
the ultrasonic pulse velocity over the total length of the stone (10 cm) with respect to the ultrasonic
pulse velocity before treatment was present.
Figure 37 Ultrasonic pulse velocity before and after single 2 h submersion of Maastricht limestone in tap water. Error bars represent the sample standard deviation (n = 3).
1,8
1,9
2
2,1
2,2
2,3
2,4
2,5
2,6
2,7
0 2 4 6 8 10
Ult
raso
nic
pu
lse
velo
city
[km
/s]
Depth [cm]
Before treatment After treatment
1,8
1,9
2
2,1
2,2
2,3
2,4
2,5
2,6
2,7
0 2 4 6 8 10
Ult
raso
nic
pu
lse
velo
city
[km
/s]
Depth [cm]
Before treatment After treatment
1,8
1,9
2
2,1
2,2
2,3
2,4
2,5
2,6
2,7
0 2 4 6 8 10
Ult
raso
nic
pu
lse
velo
city
[km
/s]
Depth [cm]
Before 2h subersion After 2h subersion
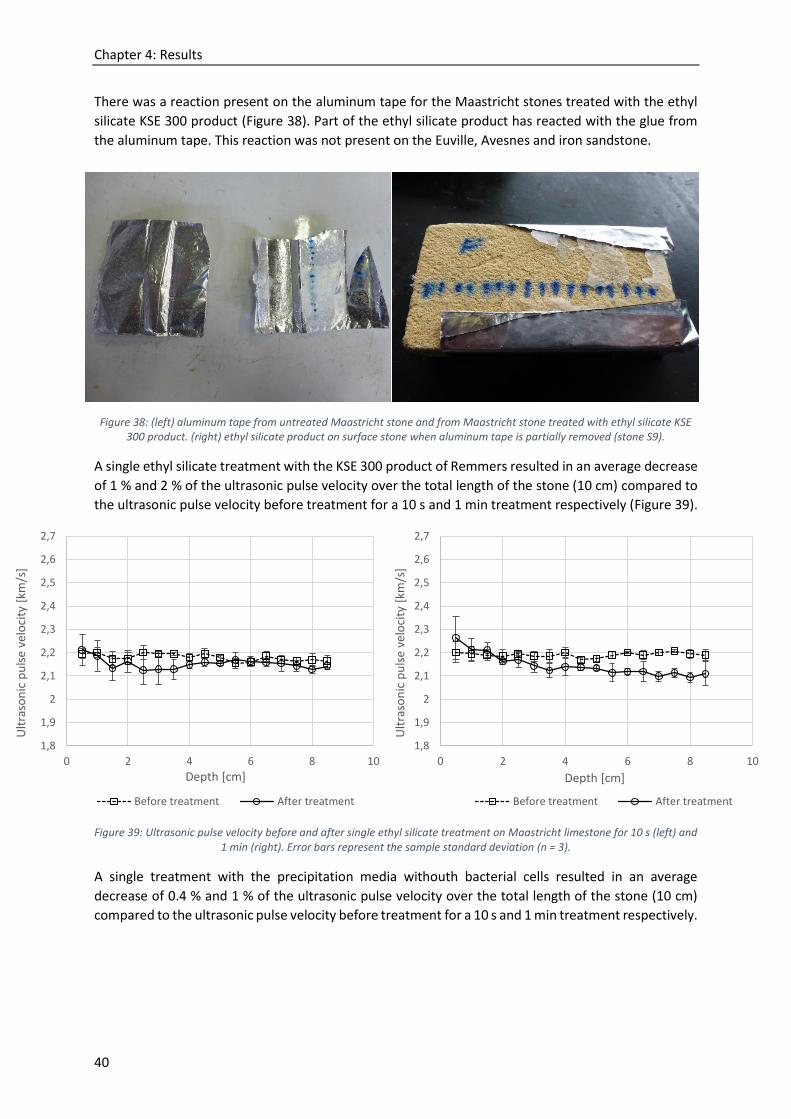
Chapter 4: Results
40
There was a reaction present on the aluminum tape for the Maastricht stones treated with the ethyl
silicate KSE 300 product (Figure 38). Part of the ethyl silicate product has reacted with the glue from
the aluminum tape. This reaction was not present on the Euville, Avesnes and iron sandstone.
Figure 38: (left) aluminum tape from untreated Maastricht stone and from Maastricht stone treated with ethyl silicate KSE 300 product. (right) ethyl silicate product on surface stone when aluminum tape is partially removed (stone S9).
A single ethyl silicate treatment with the KSE 300 product of Remmers resulted in an average decrease
of 1 % and 2 % of the ultrasonic pulse velocity over the total length of the stone (10 cm) compared to
the ultrasonic pulse velocity before treatment for a 10 s and 1 min treatment respectively (Figure 39).
Figure 39: Ultrasonic pulse velocity before and after single ethyl silicate treatment on Maastricht limestone for 10 s (left) and 1 min (right). Error bars represent the sample standard deviation (n = 3).
A single treatment with the precipitation media withouth bacterial cells resulted in an average
decrease of 0.4 % and 1 % of the ultrasonic pulse velocity over the total length of the stone (10 cm)
compared to the ultrasonic pulse velocity before treatment for a 10 s and 1 min treatment respectively.
1,8
1,9
2
2,1
2,2
2,3
2,4
2,5
2,6
2,7
0 2 4 6 8 10
Ult
raso
nic
pu
lse
velo
city
[km
/s]
Depth [cm]
Before treatment After treatment
1,8
1,9
2
2,1
2,2
2,3
2,4
2,5
2,6
2,7
0 2 4 6 8 10
Ult
raso
nic
pu
lse
velo
city
[km
/s]
Depth [cm]
Before treatment After treatment

8. Ultrasonic measurements
41
Figure 40: Ultrasonic pulse velocity before and after single reference treatment with precipitation media without bacterial cells on Maastricht limestone for 10 s (left) and 1 min (right). Error bars represent the sample standard deviation (n = 3).
A single biodeposition treatment that was performed in two steps (first absorption of Bacillus
sphaericus cells, then absorption of precipitation media) resulted in an average increase of 10 % and 8
% of the ultrasonic pulse velocity over the total length of the stone (10 cm) compared to the ultrasonic
pulse velocity before treatment for a 10 s and 1 min treatment respectively (Figure 41).
Figure 41: Ultrasonic pulse velocity before and after single biodeposition treatment performed in two steps (first absorption of Bacillus sphaericus cells, then absorption of precipitation media) on Maastricht limestone for 10 s (left) and 1 min (right).
Error bars represent the sample standard deviation (n = 3).
A single biodeposition treatment with no HEPES buffer in the precipitation media resulted in an
average increase of 7 % and 5 % of the ultrasonic pulse velocity over the total length of the stone (10
cm) compared to the ultrasonic pulse velocity before treatment for a 10 s and 1 min treatment
respectively (Figure 42).
1,8
1,9
2
2,1
2,2
2,3
2,4
2,5
2,6
2,7
0 2 4 6 8 10
Ult
raso
nic
pu
lse
velo
city
[km
/s]
Depth [cm]
Before treatment After treatment
1,8
1,9
2
2,1
2,2
2,3
2,4
2,5
2,6
2,7
0 2 4 6 8 10
Ult
raso
nic
pu
lse
velo
city
[km
/s]
Depth [cm]
Before treatment After treatment
1,8
1,9
2
2,1
2,2
2,3
2,4
2,5
2,6
2,7
0 2 4 6 8 10
Ult
raso
nic
pu
lse
velo
city
[km
/s]
Depth [cm]
Before treatment After treatment
1,8
1,9
2
2,1
2,2
2,3
2,4
2,5
2,6
2,7
0 2 4 6 8 10
Ult
raso
nic
pu
lse
velo
city
[km
/s]
Depth [cm]
Before treatment After treatment
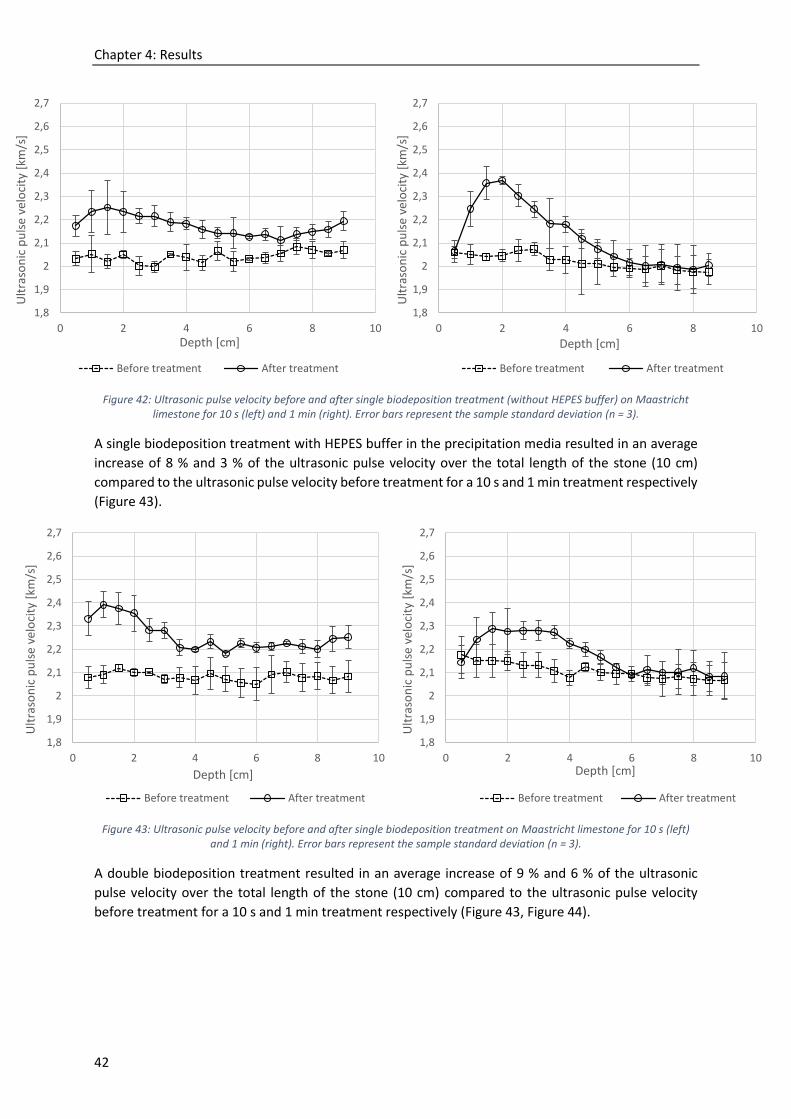
Chapter 4: Results
42
Figure 42: Ultrasonic pulse velocity before and after single biodeposition treatment (without HEPES buffer) on Maastricht limestone for 10 s (left) and 1 min (right). Error bars represent the sample standard deviation (n = 3).
A single biodeposition treatment with HEPES buffer in the precipitation media resulted in an average
increase of 8 % and 3 % of the ultrasonic pulse velocity over the total length of the stone (10 cm)
compared to the ultrasonic pulse velocity before treatment for a 10 s and 1 min treatment respectively
(Figure 43).
Figure 43: Ultrasonic pulse velocity before and after single biodeposition treatment on Maastricht limestone for 10 s (left) and 1 min (right). Error bars represent the sample standard deviation (n = 3).
A double biodeposition treatment resulted in an average increase of 9 % and 6 % of the ultrasonic
pulse velocity over the total length of the stone (10 cm) compared to the ultrasonic pulse velocity
before treatment for a 10 s and 1 min treatment respectively (Figure 43, Figure 44).
1,8
1,9
2
2,1
2,2
2,3
2,4
2,5
2,6
2,7
0 2 4 6 8 10
Ult
raso
nic
pu
lse
velo
city
[km
/s]
Depth [cm]
Before treatment After treatment
1,8
1,9
2
2,1
2,2
2,3
2,4
2,5
2,6
2,7
0 2 4 6 8 10
Ult
raso
nic
pu
lse
velo
city
[km
/s]
Depth [cm]
Before treatment After treatment
1,8
1,9
2
2,1
2,2
2,3
2,4
2,5
2,6
2,7
0 2 4 6 8 10
Ult
raso
nic
pu
lse
velo
city
[km
/s]
Depth [cm]
Before treatment After treatment
1,8
1,9
2
2,1
2,2
2,3
2,4
2,5
2,6
2,7
0 2 4 6 8 10
Ult
raso
nic
pu
lse
velo
city
[km
/s]
Depth [cm]
Before treatment After treatment
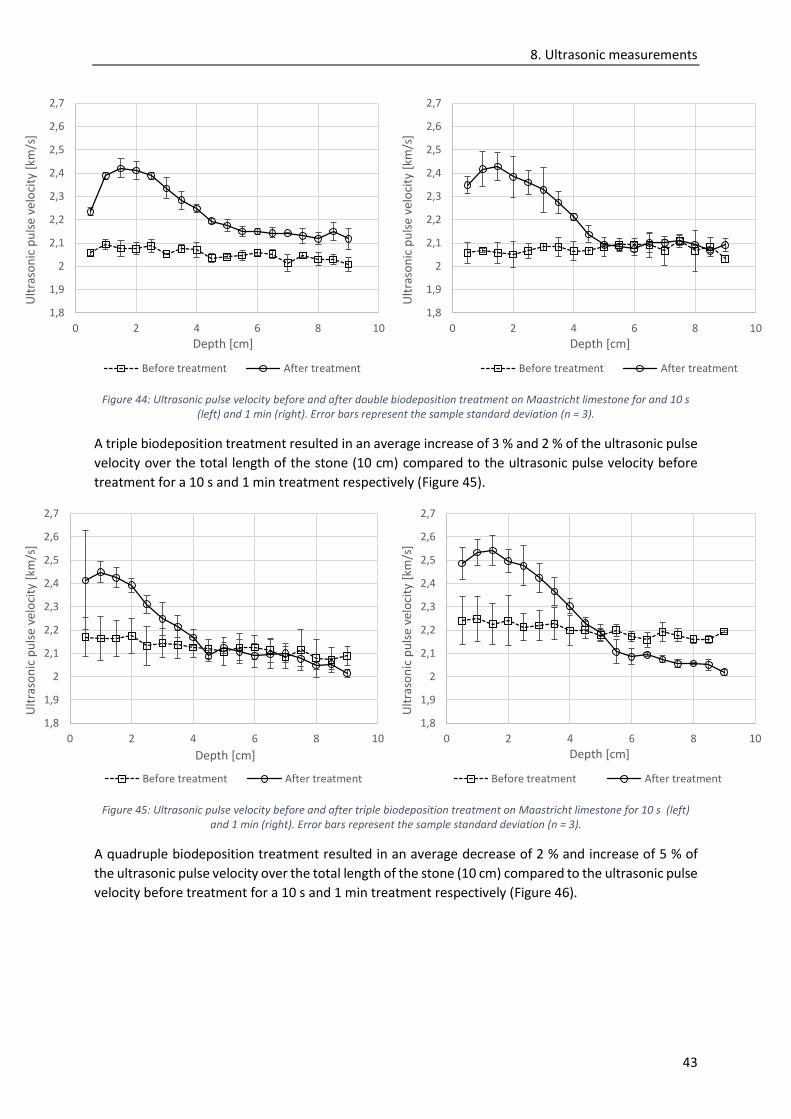
8. Ultrasonic measurements
43
Figure 44: Ultrasonic pulse velocity before and after double biodeposition treatment on Maastricht limestone for and 10 s (left) and 1 min (right). Error bars represent the sample standard deviation (n = 3).
A triple biodeposition treatment resulted in an average increase of 3 % and 2 % of the ultrasonic pulse
velocity over the total length of the stone (10 cm) compared to the ultrasonic pulse velocity before
treatment for a 10 s and 1 min treatment respectively (Figure 45).
Figure 45: Ultrasonic pulse velocity before and after triple biodeposition treatment on Maastricht limestone for 10 s (left) and 1 min (right). Error bars represent the sample standard deviation (n = 3).
A quadruple biodeposition treatment resulted in an average decrease of 2 % and increase of 5 % of
the ultrasonic pulse velocity over the total length of the stone (10 cm) compared to the ultrasonic pulse
velocity before treatment for a 10 s and 1 min treatment respectively (Figure 46).
1,8
1,9
2
2,1
2,2
2,3
2,4
2,5
2,6
2,7
0 2 4 6 8 10
Ult
raso
nic
pu
lse
velo
city
[km
/s]
Depth [cm]
Before treatment After treatment
1,8
1,9
2
2,1
2,2
2,3
2,4
2,5
2,6
2,7
0 2 4 6 8 10
Ult
raso
nic
pu
lse
velo
city
[km
/s]
Depth [cm]
Before treatment After treatment
1,8
1,9
2
2,1
2,2
2,3
2,4
2,5
2,6
2,7
0 2 4 6 8 10
Ult
raso
nic
pu
lse
velo
city
[km
/s]
Depth [cm]
Before treatment After treatment
1,8
1,9
2
2,1
2,2
2,3
2,4
2,5
2,6
2,7
0 2 4 6 8 10
Ult
raso
nic
pu
lse
velo
city
[km
/s]
Depth [cm]
Before treatment After treatment
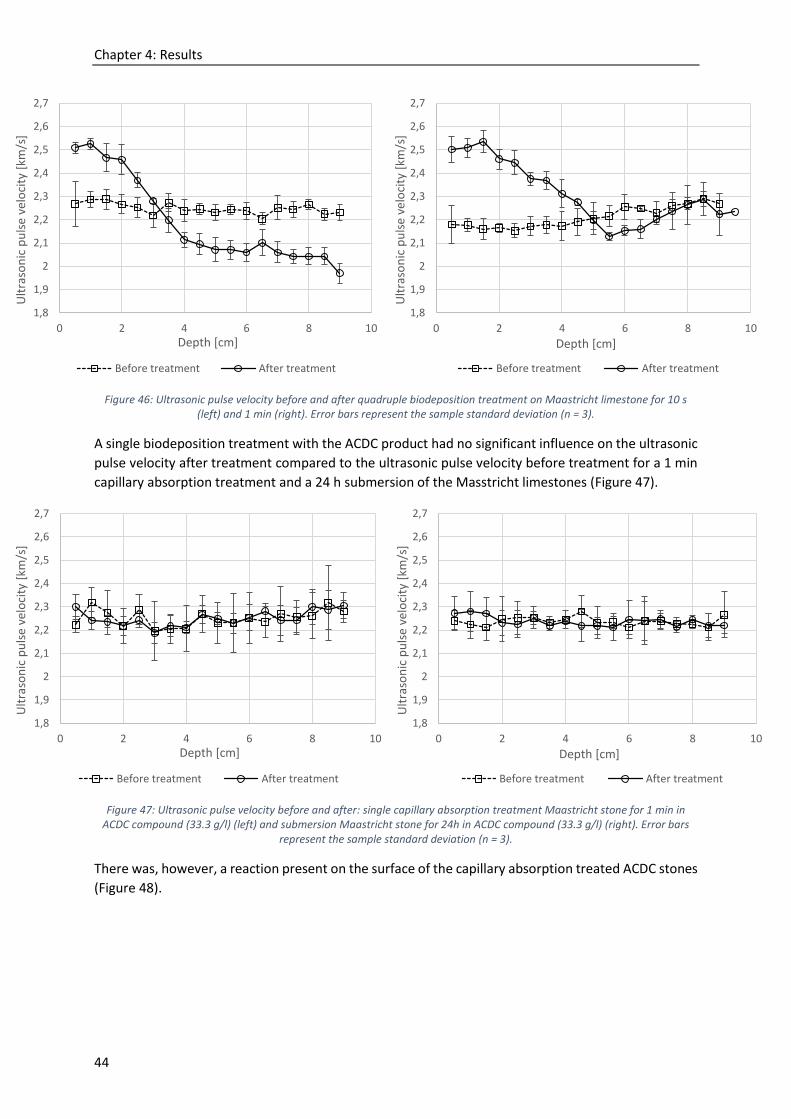
Chapter 4: Results
44
Figure 46: Ultrasonic pulse velocity before and after quadruple biodeposition treatment on Maastricht limestone for 10 s (left) and 1 min (right). Error bars represent the sample standard deviation (n = 3).
A single biodeposition treatment with the ACDC product had no significant influence on the ultrasonic
pulse velocity after treatment compared to the ultrasonic pulse velocity before treatment for a 1 min
capillary absorption treatment and a 24 h submersion of the Masstricht limestones (Figure 47).
Figure 47: Ultrasonic pulse velocity before and after: single capillary absorption treatment Maastricht stone for 1 min in ACDC compound (33.3 g/l) (left) and submersion Maastricht stone for 24h in ACDC compound (33.3 g/l) (right). Error bars
represent the sample standard deviation (n = 3).
There was, however, a reaction present on the surface of the capillary absorption treated ACDC stones
(Figure 48).
1,8
1,9
2
2,1
2,2
2,3
2,4
2,5
2,6
2,7
0 2 4 6 8 10
Ult
raso
nic
pu
lse
velo
city
[km
/s]
Depth [cm]
Before treatment After treatment
1,8
1,9
2
2,1
2,2
2,3
2,4
2,5
2,6
2,7
0 2 4 6 8 10
Ult
raso
nic
pu
lse
velo
city
[km
/s]
Depth [cm]
Before treatment After treatment
1,8
1,9
2
2,1
2,2
2,3
2,4
2,5
2,6
2,7
0 2 4 6 8 10
Ult
raso
nic
pu
lse
velo
city
[km
/s]
Depth [cm]
Before treatment After treatment
1,8
1,9
2
2,1
2,2
2,3
2,4
2,5
2,6
2,7
0 2 4 6 8 10
Ult
raso
nic
pu
lse
velo
city
[km
/s]
Depth [cm]
Before treatment After treatment
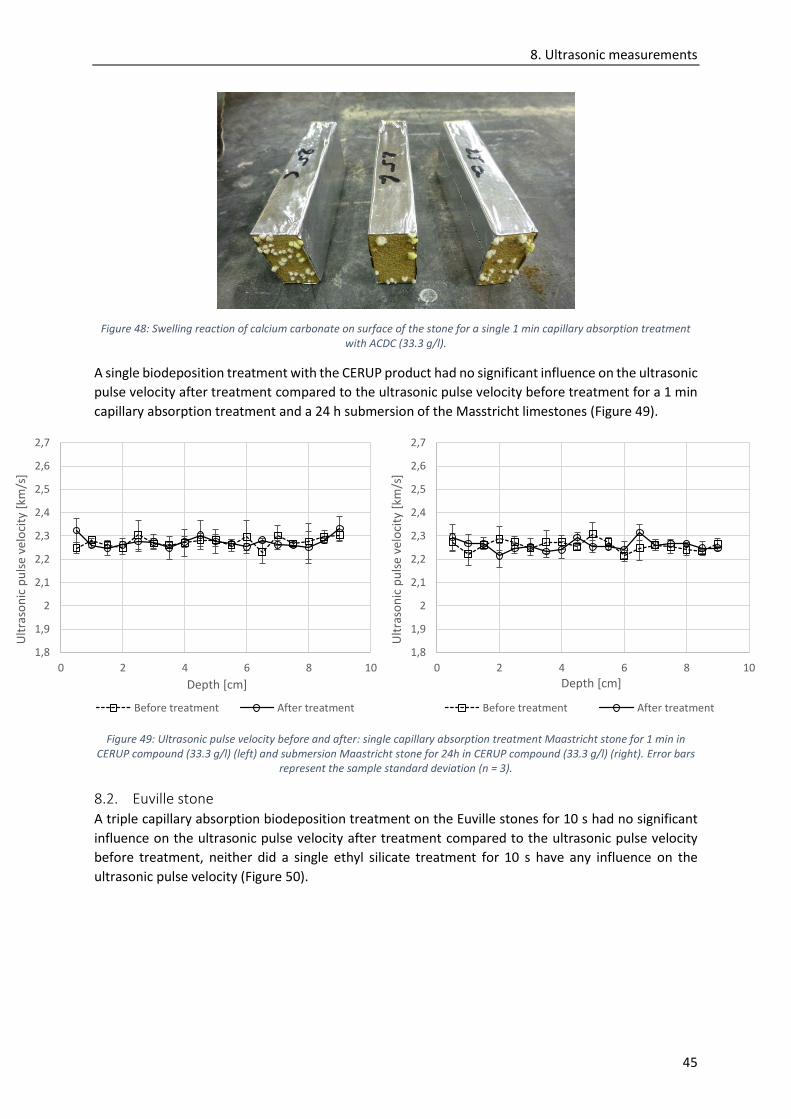
8. Ultrasonic measurements
45
Figure 48: Swelling reaction of calcium carbonate on surface of the stone for a single 1 min capillary absorption treatment with ACDC (33.3 g/l).
A single biodeposition treatment with the CERUP product had no significant influence on the ultrasonic
pulse velocity after treatment compared to the ultrasonic pulse velocity before treatment for a 1 min
capillary absorption treatment and a 24 h submersion of the Masstricht limestones (Figure 49).
Figure 49: Ultrasonic pulse velocity before and after: single capillary absorption treatment Maastricht stone for 1 min in CERUP compound (33.3 g/l) (left) and submersion Maastricht stone for 24h in CERUP compound (33.3 g/l) (right). Error bars
represent the sample standard deviation (n = 3).
8.2. Euville stone A triple capillary absorption biodeposition treatment on the Euville stones for 10 s had no significant
influence on the ultrasonic pulse velocity after treatment compared to the ultrasonic pulse velocity
before treatment, neither did a single ethyl silicate treatment for 10 s have any influence on the
ultrasonic pulse velocity (Figure 50).
1,8
1,9
2
2,1
2,2
2,3
2,4
2,5
2,6
2,7
0 2 4 6 8 10
Ult
raso
nic
pu
lse
velo
city
[km
/s]
Depth [cm]
Before treatment After treatment
1,8
1,9
2
2,1
2,2
2,3
2,4
2,5
2,6
2,7
0 2 4 6 8 10
Ult
raso
nic
pu
lse
velo
city
[km
/s]
Depth [cm]
Before treatment After treatment
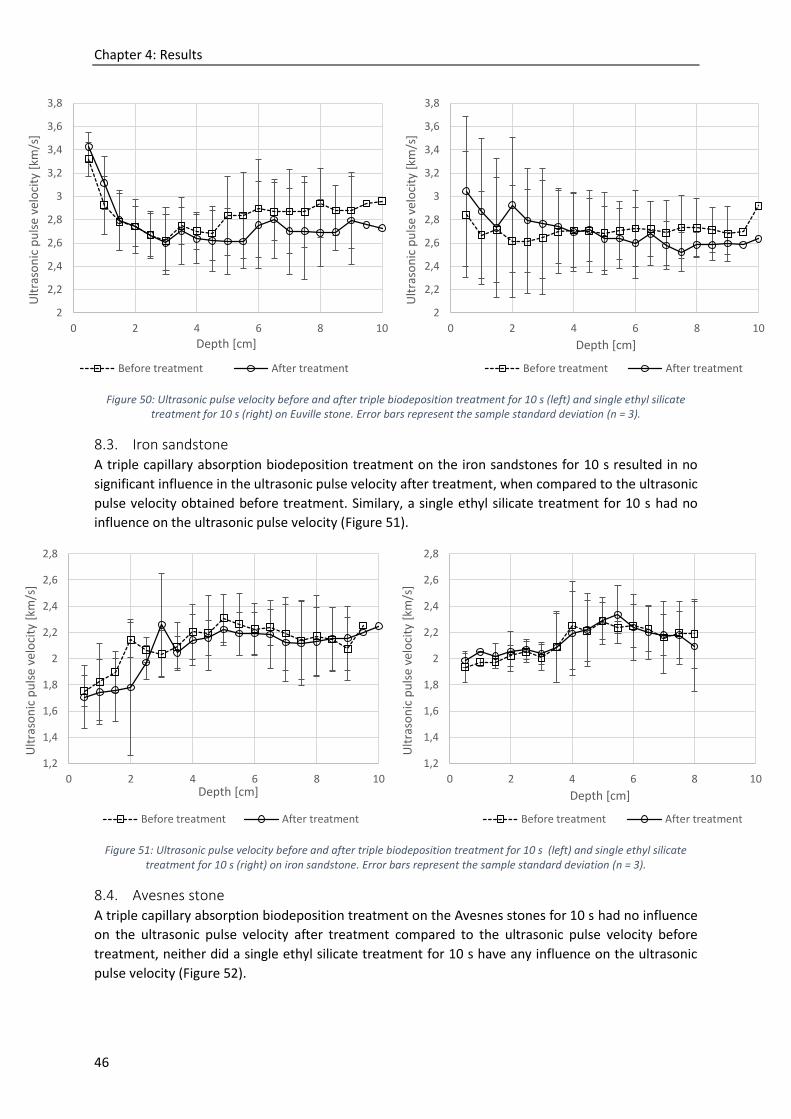
Chapter 4: Results
46
Figure 50: Ultrasonic pulse velocity before and after triple biodeposition treatment for 10 s (left) and single ethyl silicate treatment for 10 s (right) on Euville stone. Error bars represent the sample standard deviation (n = 3).
8.3. Iron sandstone A triple capillary absorption biodeposition treatment on the iron sandstones for 10 s resulted in no
significant influence in the ultrasonic pulse velocity after treatment, when compared to the ultrasonic
pulse velocity obtained before treatment. Similary, a single ethyl silicate treatment for 10 s had no
influence on the ultrasonic pulse velocity (Figure 51).
Figure 51: Ultrasonic pulse velocity before and after triple biodeposition treatment for 10 s (left) and single ethyl silicate treatment for 10 s (right) on iron sandstone. Error bars represent the sample standard deviation (n = 3).
8.4. Avesnes stone A triple capillary absorption biodeposition treatment on the Avesnes stones for 10 s had no influence
on the ultrasonic pulse velocity after treatment compared to the ultrasonic pulse velocity before
treatment, neither did a single ethyl silicate treatment for 10 s have any influence on the ultrasonic
pulse velocity (Figure 52).
2
2,2
2,4
2,6
2,8
3
3,2
3,4
3,6
3,8
0 2 4 6 8 10
Ult
raso
nic
pu
lse
velo
city
[km
/s]
Depth [cm]
Before treatment After treatment
2
2,2
2,4
2,6
2,8
3
3,2
3,4
3,6
3,8
0 2 4 6 8 10
Ult
raso
nic
pu
lse
velo
city
[km
/s]
Depth [cm]
Before treatment After treatment
1,2
1,4
1,6
1,8
2
2,2
2,4
2,6
2,8
0 2 4 6 8 10
Ult
raso
nic
pu
lse
velo
city
[km
/s]
Depth [cm]
Before treatment After treatment
1,2
1,4
1,6
1,8
2
2,2
2,4
2,6
2,8
0 2 4 6 8 10
Ult
raso
nic
pu
lse
velo
city
[km
/s]
Depth [cm]
Before treatment After treatment
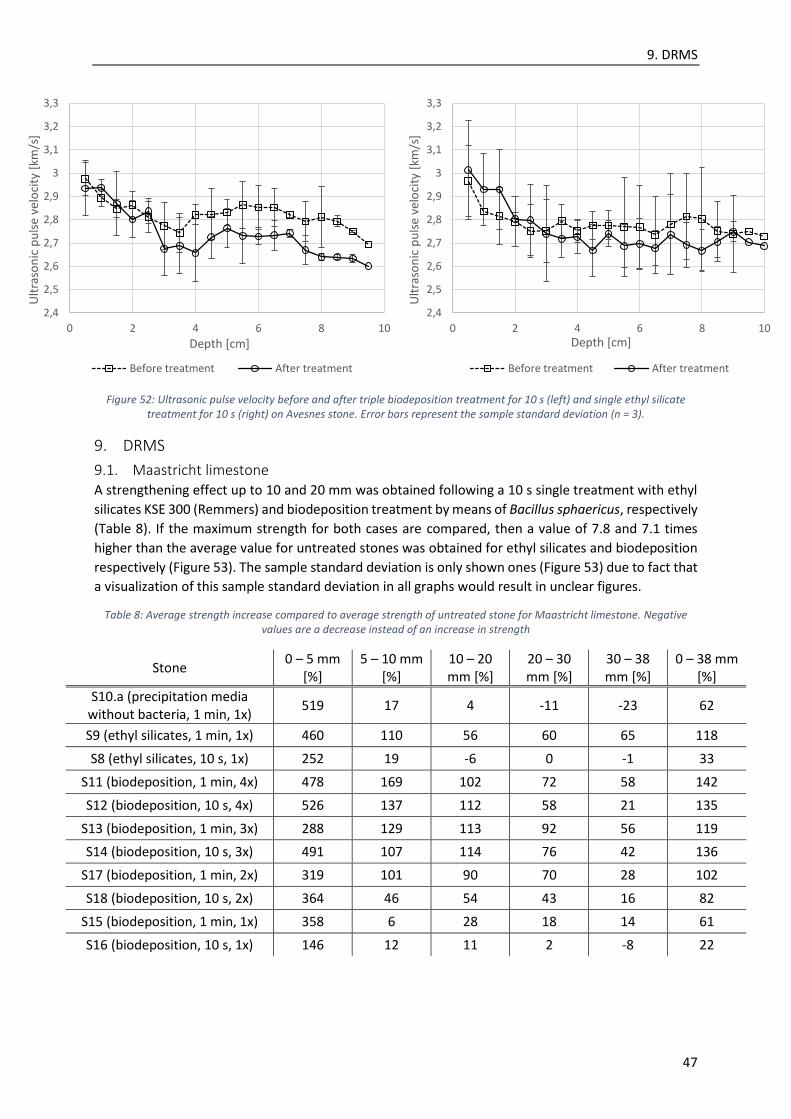
9. DRMS
47
Figure 52: Ultrasonic pulse velocity before and after triple biodeposition treatment for 10 s (left) and single ethyl silicate treatment for 10 s (right) on Avesnes stone. Error bars represent the sample standard deviation (n = 3).
9. DRMS
9.1. Maastricht limestone A strengthening effect up to 10 and 20 mm was obtained following a 10 s single treatment with ethyl
silicates KSE 300 (Remmers) and biodeposition treatment by means of Bacillus sphaericus, respectively
(Table 8). If the maximum strength for both cases are compared, then a value of 7.8 and 7.1 times
higher than the average value for untreated stones was obtained for ethyl silicates and biodeposition
respectively (Figure 53). The sample standard deviation is only shown ones (Figure 53) due to fact that
a visualization of this sample standard deviation in all graphs would result in unclear figures.
Table 8: Average strength increase compared to average strength of untreated stone for Maastricht limestone. Negative values are a decrease instead of an increase in strength
Stone 0 – 5 mm
[%] 5 – 10 mm
[%] 10 – 20 mm [%]
20 – 30 mm [%]
30 – 38 mm [%]
0 – 38 mm [%]
S10.a (precipitation media without bacteria, 1 min, 1x)
519 17 4 -11 -23 62
S9 (ethyl silicates, 1 min, 1x) 460 110 56 60 65 118
S8 (ethyl silicates, 10 s, 1x) 252 19 -6 0 -1 33
S11 (biodeposition, 1 min, 4x) 478 169 102 72 58 142
S12 (biodeposition, 10 s, 4x) 526 137 112 58 21 135
S13 (biodeposition, 1 min, 3x) 288 129 113 92 56 119
S14 (biodeposition, 10 s, 3x) 491 107 114 76 42 136
S17 (biodeposition, 1 min, 2x) 319 101 90 70 28 102
S18 (biodeposition, 10 s, 2x) 364 46 54 43 16 82
S15 (biodeposition, 1 min, 1x) 358 6 28 18 14 61
S16 (biodeposition, 10 s, 1x) 146 12 11 2 -8 22
2,4
2,5
2,6
2,7
2,8
2,9
3
3,1
3,2
3,3
0 2 4 6 8 10
Ult
raso
nic
pu
lse
velo
city
[km
/s]
Depth [cm]
Before treatment After treatment
2,4
2,5
2,6
2,7
2,8
2,9
3
3,1
3,2
3,3
0 2 4 6 8 10
Ult
raso
nic
pu
lse
velo
city
[km
/s]
Depth [cm]
Before treatment After treatment
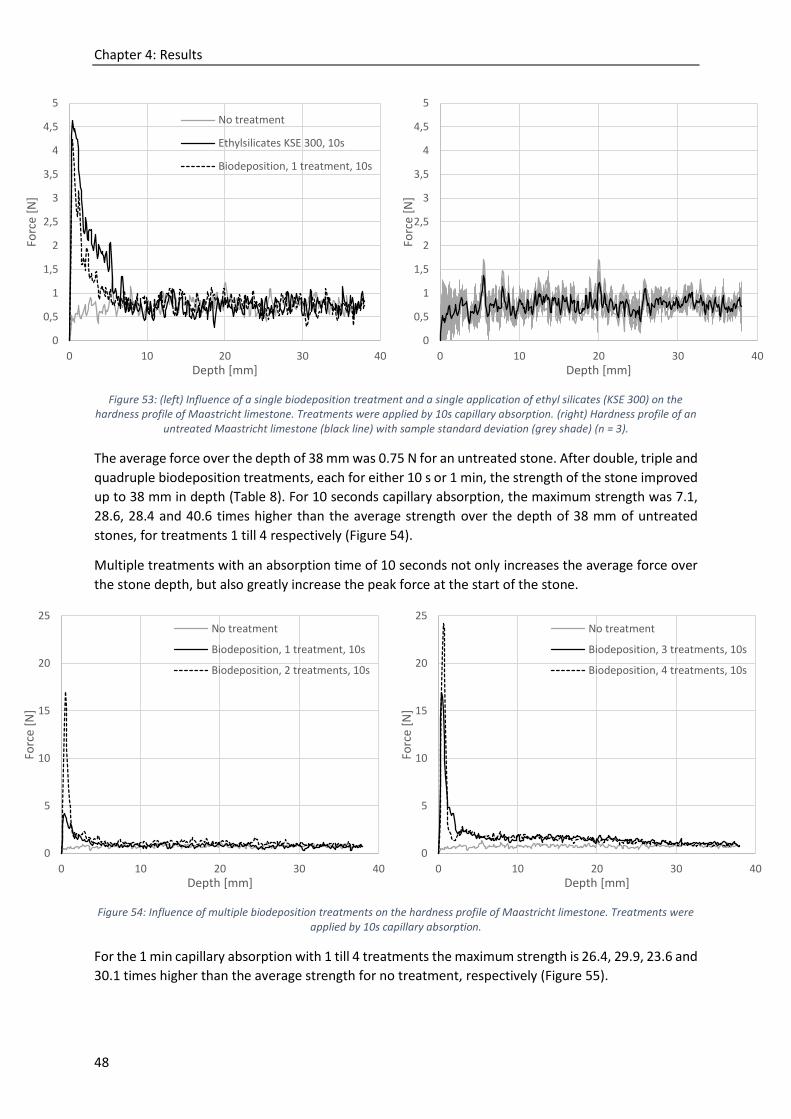
Chapter 4: Results
48
Figure 53: (left) Influence of a single biodeposition treatment and a single application of ethyl silicates (KSE 300) on the hardness profile of Maastricht limestone. Treatments were applied by 10s capillary absorption. (right) Hardness profile of an
untreated Maastricht limestone (black line) with sample standard deviation (grey shade) (n = 3).
The average force over the depth of 38 mm was 0.75 N for an untreated stone. After double, triple and
quadruple biodeposition treatments, each for either 10 s or 1 min, the strength of the stone improved
up to 38 mm in depth (Table 8). For 10 seconds capillary absorption, the maximum strength was 7.1,
28.6, 28.4 and 40.6 times higher than the average strength over the depth of 38 mm of untreated
stones, for treatments 1 till 4 respectively (Figure 54).
Multiple treatments with an absorption time of 10 seconds not only increases the average force over
the stone depth, but also greatly increase the peak force at the start of the stone.
Figure 54: Influence of multiple biodeposition treatments on the hardness profile of Maastricht limestone. Treatments were applied by 10s capillary absorption.
For the 1 min capillary absorption with 1 till 4 treatments the maximum strength is 26.4, 29.9, 23.6 and
30.1 times higher than the average strength for no treatment, respectively (Figure 55).
0
0,5
1
1,5
2
2,5
3
3,5
4
4,5
5
0 10 20 30 40
Forc
e [N
]
Depth [mm]
No treatment
Ethylsilicates KSE 300, 10s
Biodeposition, 1 treatment, 10s
0
0,5
1
1,5
2
2,5
3
3,5
4
4,5
5
0 10 20 30 40
Forc
e [N
]
Depth [mm]
0
5
10
15
20
25
0 10 20 30 40
Forc
e [N
]
Depth [mm]
No treatment
Biodeposition, 1 treatment, 10s
Biodeposition, 2 treatments, 10s
0
5
10
15
20
25
0 10 20 30 40
Forc
e [N
]
Depth [mm]
No treatment
Biodeposition, 3 treatments, 10s
Biodeposition, 4 treatments, 10s

9. DRMS
49
Figure 55: Influence of multiple biodeposition treatments on the hardness profile of Maastricht limestone. Treatments were applied by 1 min capillary absorption.
The effect of multiple treatments for a longer capillary absorption time (1 min instead of 10s) resulted
in a higher average force over the whole depth. The peak force at the surface for multiple 1 min
treatments was more uniform than the peak force for multiple 10 s treatments.
The difference between the longer absorption time versus the shorter absorption time was mainly
presented by the same peak values for different treatments in the case of 1 minute capillary absorption
versus the heightening peak with increasing treatments for 10 seconds capillary absorption. The
average values over the depth of 38 mm were also larger for the 1 minute treatment compared to the
10 s treatment, but this observation was only valid for a low number of repeated treatments (1 or 2).
When the number of treatments was increased to 4, there is no difference in average value over the
stone depth for 1 minute versus 10 seconds capillary absorption.
Instead of using only a non-treated sample for reference, also a sample treated by the chemicals (urea,
calcium formate and HEPES buffer) with no bacteria was used as a reference for the biodeposition
treatment. This treatment shows a high peak strength the first 2 mm, but deeper in the stone, the
force drops to the same range or lower than the values for untreated stones (Figure 56).
0
5
10
15
20
25
0 10 20 30 40
Forc
e [N
]
Depth [mm]
No treatment
Biodeposition, 1 treatment, 1 min
Biodeposition, 2 treatments, 1 min
0
5
10
15
20
25
0 10 20 30 40
Forc
e [N
]
Depth [mm]
No treatment
Biodeposition, 3 treatments, 1 min
Biodeposition, 4 treatments, 1 min

Chapter 4: Results
50
Figure 56: Influence of precipitation media without bacteria and ethyl silicate treatment on the hardness profile of Maastricht limestone. Treatments were applied by 1 min capillary absorption.
9.2. Euville stone The average force over the depth of 32 cm for the untreated stone was 13.38 N. There was an average
force increase of 7 % and decrease of 1 % of the stones treated with three 10 s biodeposition
treatments and a single ethyl silicate treatment respectively, compared to the average force of the
stone without treatment.
Figure 57: (left) Influence of a triple biodeposition and a single ethyl silicate treatment on the hardness profile of an Euville stone. Treatments were applied by 10 s capillary absorption. (right) Hardness profile of an untreated Euville stone (black
line) with sample standard deviation (grey shade) (n = 3).
A single and double biodeposition treatment for 1 min resulted in an average force increase of 9 % and
decrease of 2 % respectively, compared to the average force of the stone without treatment.
0
5
10
15
20
25
30
35
40
0 5 10 15 20 25 30 35 40
Forc
e [N
]
Depth [mm]
No treatment
Ethylsilicates KSE 300, 1 min
Precipitation media without bacteria, 1 min
6
8
10
12
14
16
18
20
22
24
0 5 10 15 20 25 30 35
Forc
e [N
]
Depth [mm]
No treatment
Biodeposition. 3 treatments. 10s
Ethylsilicates KSE 300. 1x. 10s
6
8
10
12
14
16
18
20
22
24
0 5 10 15 20 25 30 35
Forc
e [N
]
Depth [mm]
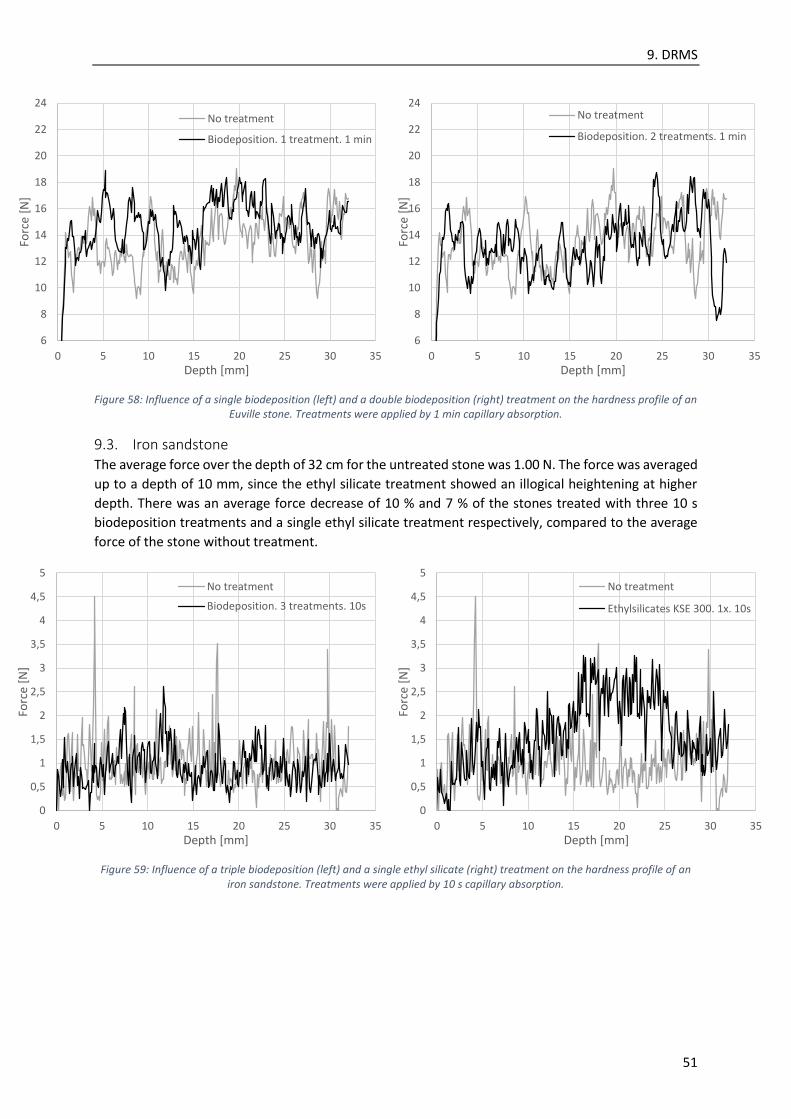
9. DRMS
51
Figure 58: Influence of a single biodeposition (left) and a double biodeposition (right) treatment on the hardness profile of an Euville stone. Treatments were applied by 1 min capillary absorption.
9.3. Iron sandstone The average force over the depth of 32 cm for the untreated stone was 1.00 N. The force was averaged
up to a depth of 10 mm, since the ethyl silicate treatment showed an illogical heightening at higher
depth. There was an average force decrease of 10 % and 7 % of the stones treated with three 10 s
biodeposition treatments and a single ethyl silicate treatment respectively, compared to the average
force of the stone without treatment.
Figure 59: Influence of a triple biodeposition (left) and a single ethyl silicate (right) treatment on the hardness profile of an iron sandstone. Treatments were applied by 10 s capillary absorption.
6
8
10
12
14
16
18
20
22
24
0 5 10 15 20 25 30 35
Forc
e [N
]
Depth [mm]
No treatment
Biodeposition. 1 treatment. 1 min
6
8
10
12
14
16
18
20
22
24
0 5 10 15 20 25 30 35
Forc
e [N
]
Depth [mm]
No treatment
Biodeposition. 2 treatments. 1 min
0
0,5
1
1,5
2
2,5
3
3,5
4
4,5
5
0 5 10 15 20 25 30 35
Forc
e [N
]
Depth [mm]
No treatment
Biodeposition. 3 treatments. 10s
0
0,5
1
1,5
2
2,5
3
3,5
4
4,5
5
0 5 10 15 20 25 30 35
Forc
e [N
]
Depth [mm]
No treatment
Ethylsilicates KSE 300. 1x. 10s
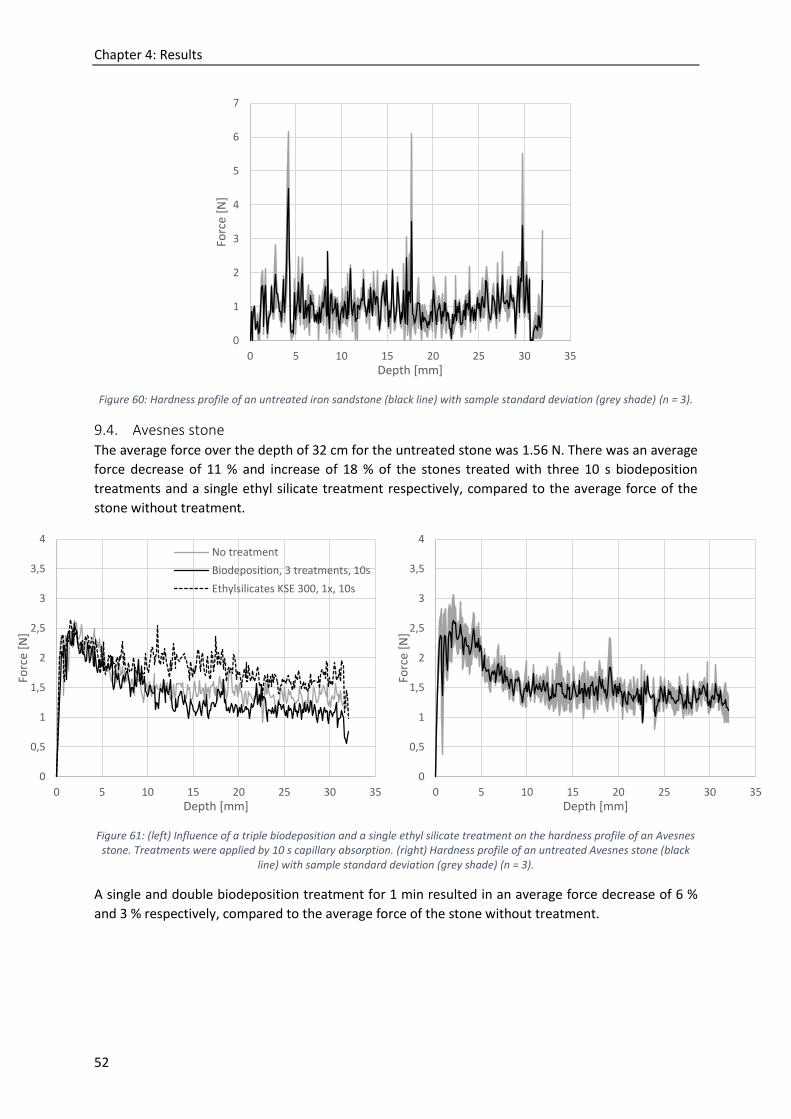
Chapter 4: Results
52
Figure 60: Hardness profile of an untreated iron sandstone (black line) with sample standard deviation (grey shade) (n = 3).
9.4. Avesnes stone The average force over the depth of 32 cm for the untreated stone was 1.56 N. There was an average
force decrease of 11 % and increase of 18 % of the stones treated with three 10 s biodeposition
treatments and a single ethyl silicate treatment respectively, compared to the average force of the
stone without treatment.
Figure 61: (left) Influence of a triple biodeposition and a single ethyl silicate treatment on the hardness profile of an Avesnes stone. Treatments were applied by 10 s capillary absorption. (right) Hardness profile of an untreated Avesnes stone (black
line) with sample standard deviation (grey shade) (n = 3).
A single and double biodeposition treatment for 1 min resulted in an average force decrease of 6 %
and 3 % respectively, compared to the average force of the stone without treatment.
0
1
2
3
4
5
6
7
0 5 10 15 20 25 30 35
Forc
e [N
]
Depth [mm]
0
0,5
1
1,5
2
2,5
3
3,5
4
0 5 10 15 20 25 30 35
Forc
e [N
]
Depth [mm]
No treatment
Biodeposition, 3 treatments, 10s
Ethylsilicates KSE 300, 1x, 10s
0
0,5
1
1,5
2
2,5
3
3,5
4
0 5 10 15 20 25 30 35
Forc
e [N
]
Depth [mm]
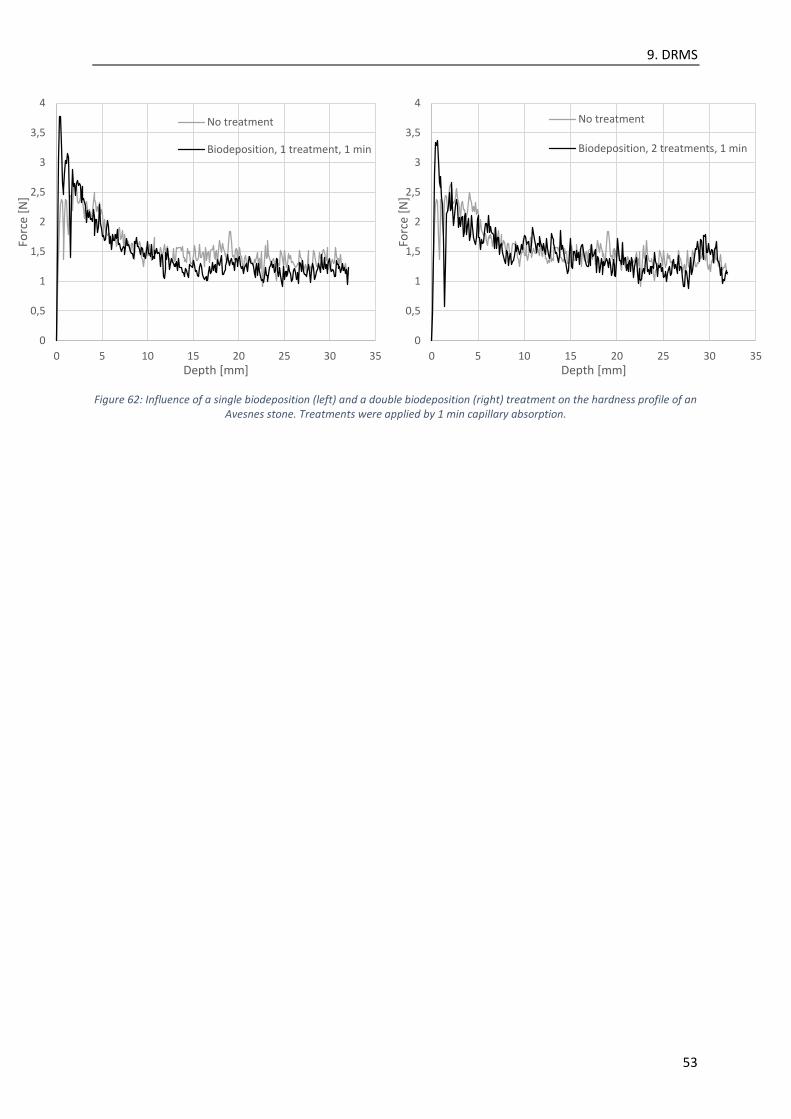
9. DRMS
53
Figure 62: Influence of a single biodeposition (left) and a double biodeposition (right) treatment on the hardness profile of an Avesnes stone. Treatments were applied by 1 min capillary absorption.
0
0,5
1
1,5
2
2,5
3
3,5
4
0 5 10 15 20 25 30 35
Forc
e [N
]
Depth [mm]
No treatment
Biodeposition, 1 treatment, 1 min
0
0,5
1
1,5
2
2,5
3
3,5
4
0 5 10 15 20 25 30 35
Forc
e [N
]
Depth [mm]
No treatment
Biodeposition, 2 treatments, 1 min
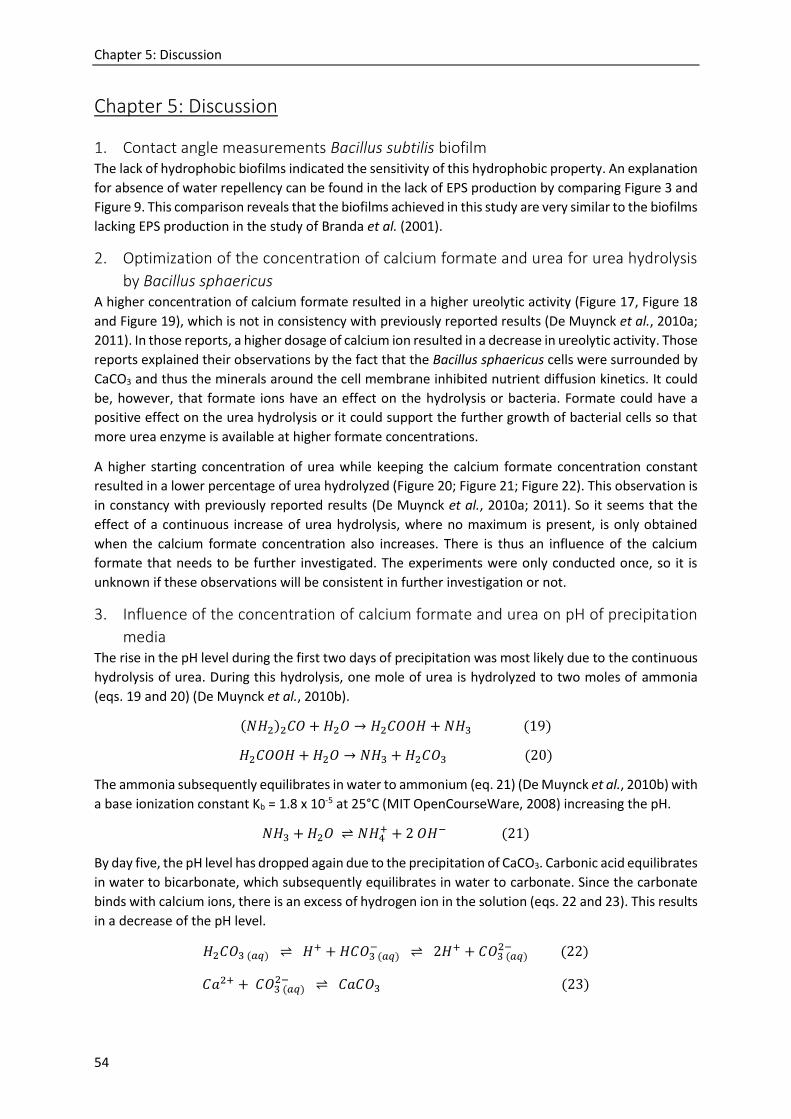
Chapter 5: Discussion
54
Chapter 5: Discussion
1. Contact angle measurements Bacillus subtilis biofilm The lack of hydrophobic biofilms indicated the sensitivity of this hydrophobic property. An explanation
for absence of water repellency can be found in the lack of EPS production by comparing Figure 3 and
Figure 9. This comparison reveals that the biofilms achieved in this study are very similar to the biofilms
lacking EPS production in the study of Branda et al. (2001).
2. Optimization of the concentration of calcium formate and urea for urea hydrolysis
by Bacillus sphaericus A higher concentration of calcium formate resulted in a higher ureolytic activity (Figure 17, Figure 18
and Figure 19), which is not in consistency with previously reported results (De Muynck et al., 2010a;
2011). In those reports, a higher dosage of calcium ion resulted in a decrease in ureolytic activity. Those
reports explained their observations by the fact that the Bacillus sphaericus cells were surrounded by
CaCO3 and thus the minerals around the cell membrane inhibited nutrient diffusion kinetics. It could
be, however, that formate ions have an effect on the hydrolysis or bacteria. Formate could have a
positive effect on the urea hydrolysis or it could support the further growth of bacterial cells so that
more urea enzyme is available at higher formate concentrations.
A higher starting concentration of urea while keeping the calcium formate concentration constant
resulted in a lower percentage of urea hydrolyzed (Figure 20; Figure 21; Figure 22). This observation is
in constancy with previously reported results (De Muynck et al., 2010a; 2011). So it seems that the
effect of a continuous increase of urea hydrolysis, where no maximum is present, is only obtained
when the calcium formate concentration also increases. There is thus an influence of the calcium
formate that needs to be further investigated. The experiments were only conducted once, so it is
unknown if these observations will be consistent in further investigation or not.
3. Influence of the concentration of calcium formate and urea on pH of precipitation
media The rise in the pH level during the first two days of precipitation was most likely due to the continuous
hydrolysis of urea. During this hydrolysis, one mole of urea is hydrolyzed to two moles of ammonia
(eqs. 19 and 20) (De Muynck et al., 2010b).
(𝑁𝐻2)2𝐶𝑂 + 𝐻2𝑂 → 𝐻2𝐶𝑂𝑂𝐻 + 𝑁𝐻3 (19)
𝐻2𝐶𝑂𝑂𝐻 + 𝐻2𝑂 → 𝑁𝐻3 + 𝐻2𝐶𝑂3 (20)
The ammonia subsequently equilibrates in water to ammonium (eq. 21) (De Muynck et al., 2010b) with
a base ionization constant Kb = 1.8 x 10⁻⁵ at 25°C (MIT OpenCourseWare, 2008) increasing the pH.
𝑁𝐻3 + 𝐻2𝑂 ⇌ 𝑁𝐻4+ + 2 𝑂𝐻− (21)
By day five, the pH level has dropped again due to the precipitation of CaCO3. Carbonic acid equilibrates
in water to bicarbonate, which subsequently equilibrates in water to carbonate. Since the carbonate
binds with calcium ions, there is an excess of hydrogen ion in the solution (eqs. 22 and 23). This results
in a decrease of the pH level.
𝐻2𝐶𝑂3 (𝑎𝑞) ⇌ 𝐻+ + 𝐻𝐶𝑂3 (𝑎𝑞)− ⇌ 2𝐻+ + 𝐶𝑂3 (𝑎𝑞)
2− (22)
𝐶𝑎2+ + 𝐶𝑂3 (𝑎𝑞)2− ⇌ 𝐶𝑎𝐶𝑂3 (23)
Chapter 5: Discussion
55
The increase in pH the first days shows that there is more urea decomposition than calcium carbonate
precipitated. When the pH decreases again, there is more calcium carbonate precipitation than urea
hydrolysis. The urea hydrolysis is thus a faster process then the calcium carbonate precipitation. The
urea hydrolysis is completed after two days, while the calcium carbonate is still precipitating after five
days.
4. Ultrasonic measurements
4.1. Maastricht limestone An increase in ultrasonic wave velocity inside the stone after treatment indicates an increase in
solidified material in this stone, since waves travel faster through solid material than trough air. An
increase in solidified material in the stone can be caused by the absorption of chemicals or due to the
calcium carbonate precipitation. However, it was revealed that a treatment of the stones with the
precipitation media without bacteria had no effect on the ultrasonic wave velocity (Figure 40). This
indicated that the observed rise in ultrasonic wave velocity for other treated stones is due to the
calcium carbonate precipitation.
The velocity of an ultrasonic wave through a Maastricht stone immersed in water for 2 h resulted in a
drop from 2.09 km/s to 1.95 km/s. This is due to the fact that the velocity of a sound wave through
water is 1.48 km/s (Suetens, 2002) and thus smaller than the velocity of a sound wave through stone.
A Maastricht stone with a higher humidity degree thus results in a lower ultrasonic wave velocity.
When multiple biodeposition treatments were performed, it was observed that the ultrasonic velocity
in the last centimeter of the stone became lower after treatment than the wave velocity before
treatment. This is due to the fact that the humidity of multiple treated stones will be higher than the
humidity of single treated stones. The overall wave velocity in multiple treated stones thus drops due
to its higher humidity and comparison with the wave velocity before treatment, when the stones had
a lower humidity is partially misleading.
There was a visual reaction present at the outer surface of the capillary absorption treated ACDC stone.
This calcium carbonate precipitation on the surface was porous. This is due to the expanding of the
product on the surface of the stone. This calcium carbonate precipitation was present at random spots
where the ACDC particles attached to the stone.
4.2. Euville, Avesnes and iron sandstone There was no difference before and after treatment of the Euville, Aveses and iron sandstones due to
the non-homogeneous character of these stones compared to the homogeneity of the Maastricht
limestone. This heterogeneous character of the stones resulted in a larger sample standard deviations
and thus made it more difficult to obtain differences in between the ultrasonic wave velocity before
and after treatment.
The porosity of these stones was also lower compared to the Maastricht stone (Dusar et al., 2009; De
Witte, 2002; Hayen et al., 2013), thus capillary absorption with the same contact time results in less
absorbed fluid for the Euville, Aveses and iron sandstone compared to the Maastricht stone. The
weight increase due to the absorbed fluid also indicates that more fluid was absorbed for a Maastricht
stone compared to a Euville, Aveses or iron sandstone. The mass increase after 10 s fluid absorption
for a Maastricht stone is in between 7 to 10%. For the Euville, Aveses and iron sandstone this was in
between 0 to 2 %. This results in a lower amount of calcium carbonate precipitation inside the Euville,
Aveses or iron sandstone compared to the Maastricht stone.

Chapter 5: Discussion
56
5. DRMS
5.1. Maastricht limestone A large peak strength was present in the first few mm of the stones treated with the biodeposition
treatment. This large peak was previously reported as an effect of the biodeposition treatment and
was even more present during treatment with calcium formate (Van Lancker, 2013). It has also been
reported that these large peak strengths at the surface are not desired (Ferreira Pinto et al., 2012),
because salts and water can accumulate after this layer. Moreover, when this accumulated water
freezes, it could exert a pressure on the hard surface layer and thus inducing the breaking of this layer.
However, this very strong layer was largely influenced by the porosity of the stone (Ferreira Pinto et
al., 2012), and since the Maastricht stone is a very porous stone, this effect became largely over scaled
in comparison with denser stone.
This strong peak is present since the bacterial cells and/or chemical products cannot travel that far
through the pores of the stone. Thus indicating that most ureolytic activity takes place near the surface
where the biodeposition was applied. It is shown by Figure 56 that the problem mostly lies with the
chemicals. In this figure a reference stone treated with the precipitation media without bacteria has
been tested and a very high peak strength (more than 2 times as high as the peak for precipitation
media with bacteria) was noticed in the first few millimeter, but after that, there was no additional
strength visible.
The stones treated with the precipitation media without addition of bacterial cells and the ethyl
silicates were dried at 40 °C, so it could be that the hardness of these stones increased due to the
drying process. Especially for the stones treated with the precipitation media, high strength peaks were
observed in the hardness profile. This could be due to the chemicals, but there could also be an
influence of the higher temperature. All other stones tested with DRMS were not dried.
The strength increase for certain treatments compared to the strength of untreated stones gives
sometimes negative numbers (Table 8, e.g. S18: 30-38 mm). The reason was that the strength of the
Maastricht stone is not completely uniform and therefore softer stones compared to the untreated
stones could be encountered.
5.2. Euville, Avesnes and iron stone The DRMS measurements on the Euville, Avesnes and iron sandstone reveal that these stone types
have a heterogeneous hardness profile, compared with the Maastricht stone. The effect of a
biodeposition or TEOS treatment remains hidden.
Negative strength increases after treatments compared with the strength before treatment indicate a
strength decrease after treatment. This unexpected behavior is explained by the heterogeneous
character of the stone. It could be possible that treated stones had a lower strength before treatment
compared with the reference stones where no treatment was applied.
The Euville, Avesnes and iron sandstone all have a lower porosity than the Maastricht stone (Dusar et
al., 2009; De Witte, 2002; Hayen et al., 2013), thus there was also less absorption of the biodeposition
mixture which leads to a smaller amount of calcium carbonate precipitation. The Maastricht stone was
also the softest stone compared to the Euville, Avesnes and iron sandstone (Figure 53, Figure 57, Figure
59 and Figure 61). A strengthening effect on the Maastricht stone is thus more visible than a
strengthening effect on the harder Euville, Avesnes and iron sandstone.
It is suggested in further research that a DRMS measurement is applied before and after treatment.
This partially destroys the stone, but if capillary absorption treatments are applied, there is only a very

Chapter 5: Discussion
57
limited influence from the destruction of the stone on the treatment. It is then possible to perform the
DRMS measurements close to each other so that effects form the heterogeneity from the stones are
minimalized.
Conclusions
58
Conclusions
In general, a higher concentration of urea and a concentration of calcium formate equal to that of urea
resulted in the highest concentration of urea hydrolyzed. Initial urea and calcium formate
concentrations of 1.11 M appear to be suitable for optimum biodeposition treatment, nonetheless, a
concentration of 1.11 M is close to the solubility of the product (1.28 M at 20 °C), so it is advisable to
use a concentration of 0.9 M for both urea and calcium formate.
The use of tap water, demi water or the HEPES buffer did not change the amount of urea hydrolyzed.
For practicality reasons, the use of tap water is proposed.
From the 10 seconds biodeposition treatments performed on Maastricht limestones it can be
concluded that the double and triple biodeposition treatment have the best future prospects. These
treatments had a less sharp peak value compared to the quadruple treatment. Also, the average
strength increase of the triple and quadruple treatment were 136 % and 135 %, respectively. This
indicates even a slight drop in strength when four treatments instead of three treatments were
applied. The strength increase for a single 10 seconds treatment with ethyl silicate KSE 300 lied in
between the strength increase for a single and a double 10 seconds treatment with the biodeposition
product.
The 1 minute biodeposition treatments on Maastricht limestones all resulted in an almost equal peak
value at the surface of the stone, independent of the number of treatments. However, a higher amount
of treatments resulted in a higher average strength value over the total depth of the stone. The
strength increase for a single one minute treatment with ethyl silicate KSE 300 lied in between the
strength increase for a double and a triple one minute treatment with the biodeposition product.
For capillary absorption treatments on Euville and Avesnes and iron sandstones, there was no
strengthening effect for neither biodeposition treatment nor traditional consolidate treatment with
the KSE 300 product. Further research on these stone types, such as 24 h immersion in the
biodeposition product are advised.

References
59
References
Allison, D.G., 2003. The biofilm matrix. The Journal of Bioadhesion and Biofilm Research 19, 139-150.
An, Y.H., Dickison, R. and Doyle, R.J., 2000. Mechanisms of bacterial adhesion and pathogenesis of
implant and tissue infections, 1-27: In An, Y.H. and Friedman, R.J. (ed.) Handbook of bacterial adhesion:
Principles, methods and applications. Humana Press, Totowa.
Azeredo, J. and Oliveira, R., 2003. The role of hydrophobicity and exopolymers in initial adhesion and
biofilm formation. Biofilms in Medicine, Industry and Environmental Biotechnology. IWA Publishing.
Bendinger, B., Rijnaarts, H.H.M., Altendorf, K. and Zehnder, A.J.B., 1993. Physicochemical cell surface
and adhesive properties of coryneform bacteria related to the presence and chain length of mycolic
acids. Applied and Environmental Microbiology 59, 3973-3977.
Branda, S.S., González-Pastor, J.E., Ben-Yehuda, S., Losick, R. and Kolter, R., 2001. Fruiting body
formation by Bacillus subtilis. Proceedings of the National Academy of Sciences 98, 11621-11626.
Brugnoni, L.I., Lozano, J.E and Cubitto, M.A., 2007. Potential of yeast isolated from apple juice to
adhere to stainless steel surfaces in the apple juice processing industry. Food Research International
40, 332-340.
Bryers, J.D., 1987. Biologically active surfaces; processes governing the formation and persistence of
biofilms. Biotechnology 3, 57-68.
Cacchio, P., Ercole, C., Cappuccio, G. and Lepidi, A., 2003. Calcium Carbonate Precipitation by Bacterial
Strains Isolated from a Limestone Cave and from a Loamy Soil. Geomicrobiology Journal 20, 85-98.
Carpentier, B. and Cerf, O., 1993. Biofilms and their consequences with particular reference to hygiene
in the food industry. Journal of Applied Bacteriology 75, 499-511.
Castanier, S., Le Metayer-Levrel, G. and Perthuisot, J.-P., 1999. Ca-carbonates precipitation and
limestone genesis—the microbiogeologist point of view. Sedimentary Geology 126, 9-23.
Characklis, W.G., McFeters, G.A. and Marshall, K.C., 1990a. Physiological ecology of biofilm systems.
In: Characklis WG and Marshall KC (eds.) Biofilms. Wiley, New York, 341-393.
Characklis, W.G., Turakhia, M.H. and Zelver, N., 1990b. Transfer and interfacial transport phenomena.
In: Characklis, W.G. and Marshall, K.C. (eds.) Biofilms. Wiley, New York, 265-340.
Chaturvedi, S., Chandra, R. and Rai, V., 2006. Isolation and characterization of Phragmites australis (L.)
rhizosphere bacteria from contaminated site for bioremediation of colored distillery effluent.
Ecological Engineering 27, 202-207.
Cheminit-online, Last consulted: april 2015. pH Ranges of Indicators. http://www.cheminit-
online.co.za/useful_data/2.3.htm.
Costerton, J.W., Irvin, R.T. and Cheng, K.J., 1981. The bacterial glycocalyx in nature and disease. Annual
Review of Microbiology 35, 299-324.
Costerton, J.W., Stewart, P.S. and Greenberg, E.P., 1999. Bacterial biofilms: a common cause of
persistent infections. Science 284, 1318-1322.
da Silva, F.B., De Belie, N., Boon, N. and Verstraete, W., 2015. Production of non-axenic ureolytic spores
for self-healing concrete applications. Construction and building materials (in press).
References
60
De Clercq, H., Jovanović, M., Linnow, K and Steiger, M., 2013. Performance of limestones laden with
mixed salt solutions of Na2SO4-NaNO3 and Na2SO4-K2SO4. Environmental earth science 69, 1751-1761.
De Muynck, W., Verbeken, K., De Belie, N. and Verstraete, W., 2010a. Influence of urea and calcium
dosage on the effectiveness of bacterially induced carbonate precipitation on limestone. Ecological
Engineering 36, 99-111.
De Muynck, W., De Belie, N. and Verstraete, W., 2010b. Microbial carbonate precipitation in
construction materials: A review. Ecological engineering 36, 118-136.
De Muynck, W., Leuridan, S., Van Loo, D., Verbeken, K., Cnudde, V., De Belie, N. and Verstraete, W.,
2011. Influence of pore structure on the effectiveness of a biogenic carbonate surface treatment for
limestone conservation. Environmental Microbiology 77, 6808-6820.
De Muynck, W., De Clercq, H., Fontaine, L., Boon, N., De Belie, N., 2012. Differences in protective and
consolidation effect of two types of biodeposition treatments. 12th International Congress on the
Deterioration and Conservation of Stone Columbia University. New York, USA.
De Muynck, W., Verbeken, K., De Belie, N. and Verstraete, W., 2013. Influence of temperature on the
effectiveness of a biogenic carbonate surface treatment for limestone conservation. Applied
Microbiology and Biotechnology 97, 1335-1347.
De Witte, E., 2002. EU project salt compatibility of surface treatments (SCOST), Contract ENV4-CT98-
0710, KIKIRPA.
Decho, A.W., 2000. Microbial biofilms in intertidal systems. Continental Shelf Research 20, 1257-1273.
Delgado Rodrigues, J. and Costa, D., 2004. A new method for data correction in drilling resistance tests
for the effect of drill bit wear. International Journal for Restoration of Buildings and Monuments 10, 1-
18.
Denyer, S.P., Gorman, S.P. and Sussman, M., 1993. Microbial biofilms: Formation and control. Blackwell
Scientific Publications: Technical series: 30.
Dick, J., De Windt, W., De Graef, B., Saveyn, H., Van der Meeren, P., De Belie, N. and Verstraete, W.,
2006. Bio-deposition of a calcium carbonate layer on degraded limestone by Bacillus species.
Biodegradation 17, 357-367.
Donlan, R., 2001. Biofilms and device-associated infections. Emerging Infectious Diseases 7, 277-281.
Donlan, R. and Costerton, J.W., 2002. Biofilms: survival mechanisms of clinically relevant
microorganisms. Clinical Microbiology Reviews 15, 167-193.
Doyle, R.J., 2000. Contribution of the hydrophobic effect to microbial infection. Microbes and Infection
2, 391-400.
Dubelaar, C.W., Dusar, M., Dreesen, R., Felder, W.M. and Nijland, T.G., 2006. Maastricht limestone: a
regionally significant building stone in Belgium and the Netherlands. Extremely weak yet timeresistant.
In: Fort, R., de Buergo, M.A., Gomez-Heras, M. and Vazquez-Calvo, C. (eds) Proceedings of the
international heritage weathering and conservation conference. Taylor & Francis Group, London, p 9-
14.
Dubos, R. and Miller, B.F., 1937. The production of bacterial enzymes capable of decomposing
creatinine. Hospital of the Rockefeller Institute for medical research, New York.
References
61
Dunne, W.M., 2002. Bacterial adhesion: Seen any good biofilms lately? Journal of Clinical Microbiology
15, 155-166.
Dusar, M., Dreesen, R. and De Naeyer, A., 2009. Natuursteen in Vlaanderen. Kluwer, Mechelen
Erşan, Y.Ç., da Silva, F.B., Boon, N., Verstraete, W. and De Belie, N., 2015. Screening of bacteria and
concrete compatible protection materials. Construction and building materials 88, 196-203.
Epstein, A.K., Pokroy, B., Seminara, A. and Aizenberg, J., 2011. Bacterial biofilm shows persistent
resistance to liquid wetting and gas penetration. Proceedings of the National Academy of Sciences 108,
995-1000.
Ferreira Pinto, A.P. and Delgado Rodrigues, J., 2012. Consolidation of carbonate stones: Influence of
treatment procedures on the strengthening action of consolidants. Journal of cultural heritage 13, 154-
166.
Fletcher, M., 1977. The effects of culture concentration and age, time, and temperature on bacterial
attachment to polystyrene. Canadian Journal of Microbiology 23, 1-6.
Fletcher, M. and Marshall, K.C., 1982. Are solid surfaces of ecological significance to aquatic bacteria?
Advances in Microbial Ecology 12, 199-236.
Ghannoum, M. and O’Toole, G.A., 2004. Microbial biofilms. ASM Press, Washington, 250-268.
Giaouris, E.D. and Nychas, G.J.E. 2006. The adherence of Salmonella Enteritidis PT4 to stainless steel:
The importance of the air-liquid interface and nutrient availability. International Journal of Food
Microbiology 23, 747-752.
González-Munoz, M.T., Omar, N.B., Martínez-Canamero, M., Rodríguez-Gallego, M., Galindo, A.L. and
Arias, J., 1996. Struvite and calcite crystallization induced by cellular membranes of Myxococcus
xanthus. Journal of Crystal Growth 163, 434-439.
Greenberg, A.E., Clesceri, L.S. and Eaton, E.D., 1992. Standard methods for examination of water and
wastewater, 18th ed. American Public Health Association, Washington, DC.
Hammes, F. and Verstraete,W., 2002. Key roles of pH and calcium metabolism in microbial carbonate
precipitation. Reviews in Environmental Science and Biotechnology 1, 3-7.
Hamon, M.A., and Lazazzera, B.A., 2001. The sporulation transcription factor Spo0A is required for
biofilm development in Bacillus subtilis. Molecular Microbiology 42, 1199–1209.
Hayen, R., Fontaine, L., Berto, T. and De Clercq, H., 2013. Geologische en bouwtechnische kenmerken
van de Diestiaan ijzerzandsteen met als doel de inzet ervan in restauraties van historische gebouwen.
Project VLA11-4.1, performed by the Royal Institute for Cultural Heritage and the Belgian Building
Research Institute commisioned by the Flemish government in opdracht van de Vlaamse overheid,
Departement Leefmilieu, Natuur en Energie, ALBON, 426 p.
Herrera, J.J.R., Cabo, M.L., Gonzalec, A., Pazos, I. and Pastoriza, L., 2007. Adhesion ad detachment
kinetics of several strains of Staphylococcus aureus subsp. aureus under three different experimental
conditions. Food Microbiology 24, 585-591.
Hu, X.M., Fan, W., Han, B., Liu, H.Z., Zheng, D., Li, Q., Dong, W., Yan, J., Gao, M., Berry, C. and Yuan, Z.,
2008. Complete genome sequence of the mosquitocidal bacterium Bacillus sphaericus C3-41 and
comparison with those of closely related bacillus species. Journal of bacteriology 190, 2892-2902.
References
62
Izano, E.R., Sadovskaya, I., Vinogradov, E., Mulks, M.H., Velliyagounder, K., Ragunath, C., Kher, W.B.,
Ramasubbu, N., Jabbouri, S., Perry, M.B. and Kaplan J.B., 2007. Poly-N-acetylglucosamine mediates
biofilms formation and antibiotic resistance in Actinobacillus pleuropneumoniae. Microbial
Pathogenesis Journal 43, 1-9.
Jimenez-Lopez, C., Rodriguez-Navarro, C., Pinar, G., Carrillo-Rosúa, F.J., Rodriguez-Gallego, M. and
González-Munoz, M.T., 2007. Consolidation of degraded ornamental porous limestone by calcium
carbonate precipitation induced by the microbiota inhabiting the stone. Chemosphere 68, 1929-1936.
Jimenez-lopez, C., Jroundi, F., Pascolini, C., Rodriguez-navarro, C., Pinar-larrubia, G., Rodriguez-gallego,
M. and González-Munoz, M.T., 2008. Consolidation of quarry calcarenite by calcium carbonate
precipitation induced by bacteria activated among the microbiota inhabiting the stone. International
Biodeterioration and Biodegradation 62, 352-363.
Jonkers, H.M. and Schlangen, E., 2007. Self-healing concrete: A bacterial approach. International
Association of Fracture Mechanics for Concrete and Concrete Structures 6, Part 12, Catania, Italy.
Jroundi, F., González-Muñoz, M.T., Garcia-Bueno, A. and Rodriguez-Navarro, C., 2014. Consolidation of
archaeological gypsum plaser by bacterial biomineralization of calcium carbonate. Acta Biomaterialia
10, 3844-3854.
Kalmokoff, M.L., Austin, J.W., Wan, X.D., Sanders, G., Banerjee, S. and Farber, J.M., 2001. Absorption,
attachment and biofilm formation among isolates of Listeria monocytogenes using model conditions.
Journal of Applied Microbiology 91, 725.
Knorre, H. and Krumbein, K.E., 2000. Bacterial calcification. In: Riding, E.E., Awramik, S.M. (eds.),
Microbial Sediments. Springer–Verlag, Berlin, p. 25-31.
Kobayashi, K. and Iwano, M., 2012. BslA(YuaB) forms a hydrophobic layer on the surface of Bacillus
subtilis biofilms. Molecular Microbiology 85, 51-66.
Koudelka, P., Jandejsek, I., Doktor, T., Kytýř, D., Jiroušek, O., Zima, P. and Drdácký, M., 2013.
Radiographical investigation of fluid penetration processes in natural stones used in historical
buildings. 15th international workshop on radiation imaging detectors, Paris, France.
Kumar, A. and Prasad, R., 2006. Biofilms. JK Science 8, 15-17.
Labconco Corporation, 1998. A guide to Kjeldahl nitrogen determination methods and apparatus.
Labconco Corporation. Kansas City, USA.
Lappin-Scott, H.M., Jass, J. and Costerton, J.W., 1993. Microbial biofilm formation and characterization.
Society for Applied Bacteriology technical series No. 30.
Le Metayer-Levrel, G., Castanier, S., Orial, G., Loubiere, J.F. and Perthuisot, J.P., 1999. Applications of
bacterial carbonatogenesis to the protection and regeneration of limestones in buildings and historic
patrimony. Sedimentary Geology 126, 25-34.
Leriche, M., 1927. La pierre d’Avesnes (‘Avendersteen’) dans les anciens monuments de la Belgique.
In: de Clercq, L. (ed) Bulletin de Societé belge de Géologie 37. 1927, 65-71. De assimilatie van enkele
zachte Franse kalksteensoorten in het midden van de 19de eeuw in België en hun conservering. In:
Monumenten en Landschappen 1993, 55-57.
Li, X.Y. and Yang, S.F., 2007. Influence of loosely bound extracellular polymeric substances (EPS) on the
flocculation, sedimentation and dewaterability of activated sludge. Water Research 41, 1022-1030.
References
63
Liu, Y., Yang, S.F., Li, Y., Xu, H., Qin, L. and Tay, J.H., 2004. The influence of cell substratum surface
hydrophobicities on microbial attachment. Journal of Biotechnology 110, 251-256.
Loeb, G.I. and Neihof, R.A., 1975. Marine conditioning films. Advances in Chemistry Series 145, 319-
335.
Lowenstan, H.A. and Weiner, S., 1988. On Biomineralization. Oxford University Press, New York.
Lower, S.K., 1996. Carbonate equilibria in natural waters. Simon Fraser University. Burnaby, Canada.
Mann, S., 2002. Biomineralization: Principles and Concepts in Bioinorganic Materials Chemistry, Oxford
University Press, USA.
Marmur, A. and Ruckenstein, E., 1986. Gravity and cell adhesion. Journal of Colloid and Interface
Science 114, 261-266.
Marsh, P.D., 1995. Dental plaque, 282-300: In H.M. Lappin-Scott and J.W. Costerton (Eds.), Microbial
Biofilms. Cambridge University, Press, New York.
Mastromei, G., Marvasi, M. and Perito, B., 2008. Studies on bacterial carbonate precipitation for stone
conservation. In: Proc. of BioGeoCivil Engineering Conference, Delft, Netherlands, p 104-106.
May, E., 2005. Biobrush research monograph: novel approaches to conserve our European heritage.
EVK4-CT-2001-00055.
McConnaughey, T.A. and Whelan, J.F., 1997. Calcification generates protons for nutrient and
bicarbonate uptake. Earth-Science Reviews 42, 95-117.
Melo, L.F. and Bott, T.R., 1997. Biofoulding in water systems. Experimental Thermal and Fluid Science
14, 375-381.
Mimoso, J.M. and Costa, D.R., 2005. A new DRMS drilling technique for the laboratory. 8th
International Conference on "Non Destructive Investigations and Micronalysis for the Diagnostics and
Conservation of the Cultural and Environmental Heritage." Lecce, Italy.
MIT OpenCourseWare, 2008. 5.111 Principles of Chemical Science.
Mittelman, M.W., 1996. Adhesion to biomaterials. In: Fletcher, M. (ed.) Bacterial adhesion: molecular
and ecological diversity. Wiley-Liss, New York, 89-127.
Mobley, H.L.T. and Hausinger, R.P., 1989. Microbial ureases-significance, regulation, and molecular
characterization. Microbiological Reviews 53, 85-108.
Molobela, I.P., 2010. Proteolytic and amylolytic enzymes for bacterial biofilm control. University of
Pretoria.
Morse, J.W., 1983. The kinetics of calcium carbonate dissolution and precipitation. In: Reeder, R.J.
(ed.), Carbonates: Mineralogy and Chemistry, vol. 11. Mineralogic Society of America, Washington, DC,
p. 227-264.
Nemati, M., Greene, E.A. and Voordouw, G., 2005. Permeability profile modification using bacterially
formed calcium carbonate: comparison with enzymic option. Process Biochemistry 40, 925-933.
Novitsky, J.A., 1981. Calcium-carbonate precipitation by marine-bacteria. Geomicrobiology Journal 2,
375-388.
References
64
O’Toole, G.A. and Kolter, R., 1998. Initiation of biofilm formation in Pseudomonas fluorescens WCS365
proceeds via multiple, convergent, signaling pathways: A genetic analysis. Journal of Molecular
Microbiology and Biotechnology 28, 449-461.
O’Toole, G., Kaplan, H.B. and Kolter, R., 2000. Biofilm formation as microbial development. Annual
Review of Microbiology 54, 49-79.
Ofek, I. and Doyle, R.J., 1994. Bacterial adhesion to cells and tissues. Chapman & Hall, New York.
Orial, G., 2000. La biomineralisation appliquée à la conservation du patrimoine: bilan de dix ans
d’experimentation. Restaurar la memoria, Valladolid, Spain.
Orial, G., Vieweger, T. and Loubiere, J.F., 2002. Les mortiers biologiques: une solution pour la
conservation de la sculpture monumentale en pierre. Art Biology and Conservation, Metropolitan
Museum, New York.
Palmer, R.J. and White, D.C., 1997. Developmental biology of biofilms: implications for treatment and
control. Trends in Microbiology 5, 435-440.
Pamplona, M., Kocher, M., Snethlage, R. and Barros, L. A., 2007. Drilling resistance: overview and
outlook. Z. dt. Ges. Geowiss., 158/3, 665-676. Stuttgart.
Patnaik, P., 2003. Handbook of inorganic chemicals. McGraw-Hill.
Percival, S.L. and Walker, J.T., 1999. Biofilms and public health significance. Biofouling 14, 99-115.
Percival, S.L., Walker, J. and Hunter, P., 2000. Microbiological aspects of biofilms and drinking water.
CRC Press, New York.
Percival, S.L., Hegarty, J.H., McKay, G. and Reid, D., 2001. Helicobacter pylori in biofilms. In: Gilbert,
P.G., Allison, D., Walker, J.T. and Brading, M. (eds.) Biofilm community interactions: chance or
necessity. Species consortia. Wiley, New York, 59-63.
Percival, S.L., Malic, S., Cruz, H. and Williams, D.W., 2011. Biofilms and Veterinary Medicine:
Introduction to biofilms. Springer.
Prakash, B., Veeregowda, B.M. and Krishnappa, G., 2003. Biofilms: A survival strategy of bacteria.
Journal of Current Research in Science 85, 9-10.
Pringle, J.H. and Fletcher, M., 1983. Influence of substratum wettability on attachment of freshwater
bacteria to solid surfaces. Applied and Environmental Microbiology 45, 811-817.
Rachid, S., Ohlsen, K., Witte, W., Hacker, J. and Ziebuhr, W., 2000. Effect of sub inhibitory antibiotic
concentrations on polysaccharide intercellular adhesion expression in biofilm forming Staphylococcus
epidermidis. Journal of Antimicrobial Chemotherapy 44, 3357-3363.
Ramirez, F., Monroy, O., Favela, E., Guyot, J.P. and Cruz, F., 1998. Acetamide degradation by a
continuous-fed batch culture of Bacillus sphaericus. Applied biochemistry and biotechnology 70, 215-
223.
Remmers company, 2014. Technical data sheet art. no. 0720 – KSE 300. Solvent-free stone
strengthener on a silicic acid ethyl ester (KSE) base. Remmers company, Löningen, Germany.
Richard, J., Sizun, J.P. and Machhour, L., 2007. Development and compartmentalization of chalky
carbonate reservoirs: The Urgonian Jura-Bas Dauphiné platform model (Génissiat, southeastern
France). Sedimentary Geology 198, 195-207.
References
65
Rivadeneyra, M.A., Delgado, R., del Moral, A., Ferrer, M.R. and Ramos-Cormenzana, A., 1994.
Precipitation of calcium carbonate by Vibrio spp. from an inland saltern. FEMS Microbiology Ecology
13, 197-204.
Rivadeneyra, M.A., Párraga, J., Delgado, R., Ramos-Cormenzana, A. and Delgado, G., 2004.
Biomineralization of carbonates by Halobacillus trueperi in solid and liquid media with different
salinities. FEMS Microbiology Ecology 48, 39-46.
Rodriguez-Navarro, C., Rodriguez-Gallego, M., Ben Chekroun, K. and González-Munoz, M.T., 2003.
Conservation of ornamental stone by Myxococcus xanthus-induced carbonate biomineralization.
Applied and Environmental Microbiology 69, 2182-2193.
Roekens, E., Leysen, E., Stulens, E., Philippaerts, J. and Van Grieken, R., 1988. Weathering of Maastricht
Limestone used in the construction of historical buildings in Limburg, Belgium. In: Ciabach, J. (ed)
Proceedings of the 6th international congress on deterioration and conservation of stone. Nicholas
Copernicus University Press Department, Torun, p 45-56.
Rosenberg, M. and Kjelleberg, S., 1986. Hydrophobic interactions in bacterial adhesion. Advances in
Microbial Ecology 9, 353-393.
Sagripanti, J.L. and Bonifacino, A., 1996. Comparative sporicidal effects of liquid chemical agents.
Applied and Environmental Microbiology 62, 545-551.
Samonin, V.V. and Elikova E.E., 2004. A study on the absorption of bacterial cells on porous materials.
Microbiology 73, 696-701
Schlegel, H.G., 1993. General microbiology, 7th edition. Cambridge University Press.
Schwartz, T., Hoffman, S. and Obst, U., 1998. Formation of bacterial composition of young, natural
biofilms obtained from public bank filtered drinking water systems. Water Research 32, 2787-2797.
SINT, 2010. DRMS Cordless - Sistema per la misura della resistenza alla foratura. SINT. Technology.
Florence, Italy.
Spiers, A.J., Bohannon, J., Gehrig, S.M. and Rainey, P.B., 2003 Biofilm formation at the ari-liquid
interface by the Pseudomonas Fluorescens SBW25 wrinkly spreader requires an acetylated form of
cellulose. Journal of Molecular Microbiology and Biotechnology 50, 15-27.
Stocks-Fischer, S., Galinat, J.K. and Bang, S.S., 1999. Microbiological precipitation of CaCO3. Soil Biology
and Biochemistry 31, 1563-1571.
Stumm, W. and Morgan, J.J., 1981. Aquatic Chemistry, 2nd edition. John Wiley, New York.
Suetens, P., 2002. Fundamentals of Medical Imaging. Cambridge University Press, 294 p.
Teixeira, P., Azeredo, J., Oliveira, R. and Chibowski, E., 1998. Interfacial interactions between nitrifying
bacteria and mineral carriers in aqueous media determined by contact angle measurements and thin
layer wicking. Colloids and Surfaces B: Biointerfaces 12, 69-75.
Thermo Scientific, Last consulted: May 2015. RPM vs RCF Calculator.
http://info.thermoscientific.com/content/rcfgenerator.
Tiano, P., 1995. Stone reinforcement by calcite crystal precipitation induced by organic matrix
macromolecules. Studies in Conservation 40, 171-176.
References
66
Tiano, P., Biagiotti, L. and Mastromei, G., 1999. Bacterial bio-mediated calcite precipitation for
monumental stones conservation: methods of evaluation. Journal of Microbiological Methods 36, 139-
145.
Tiano, P., Cantisani, E., Sutherland, I. and Paget, J.M., 2006. Biomediated reinforcement of weathered
calcareous stones. Journal of Cultural Heritage 7, 49-55.
Tolboom, H.J. and Dubelaar, C.W., 2009. Avendersteen in Nederland. Bulletin KNOB 5, iss. 6, p.173-
182.
Urzi, C., Garcia-Valles, M., Vendrell, M. and Pernice, A., 1999. Biomineralization processes on rock and
monument surfaces observed in field and in laboratory conditions. Geomicrobiology Journal 16, 39-
54.
van der Mei, H.C., Weerkamp, A.H. and Busscher, H.J., 1987. A comparison of various methods to
determine hydrophobic properties of streptococcal cell surfaces. J. Micrbiol. Meth. 6, 277-287.
van Oss, C.J., 1995. Hydrophobicity of biosurfaces – origin, quantitative determination and interaction
energies. Colloids and Surfaces B: Biointerfaces 5, 91-110.
van Oss, C.J., 1997. Hydrophobicity and hydrophilicity of biosurfaces. Current Opinion in Colloid &
Interface Science 2, 503-512.
van Oss, C.J., Good, R.J. and Chaudhury, M.K., 1988. Addittive and nonadditive surface tension
components and the interpretation of contact angles. Langmuir 4, 884-891.
Van Lancker, B., 2013. Consolidatie van natuursteen met behulp van micro-orgasmen en nanopartikels.
Ghent University, Belgium.
Wang, J., 2013. Self-healing concrete by means of immobilized carbonate precipitating bacteria. Ghent
University, Belgium.
Watnick, P.I., Fullner, K.J. and Kolter, R.E., 1999. Staphylococcus epidermidis adhesion to hydrophobic
biomedical polymer is mediated by platelets. The Journal of Infectious Diseases 167, 329-336.
Wilson, M., 2001. Bacterial biofilms and human disease. Science progress 84, 235-254.
Whiffin, V.S., 2004. Microbial CaCO3 Precipitation for the Production of Biocement, Murdoch
University, Australia.
Whiffin, V.S., van Paassen, L. and Harkes, M.P., 2007. Microbial carbonate precipitation as a soil
improvement technique. Geomicrobiology Journal 24, 417-423.
Wright, D.T., 1999. The role of sulphate-reducing bacteria and cyanobacteria in dolomite formation in
distal ephemeral lakes of the Coorong region, South Australia. Sedimentary Geology 126, 147-157.
Zamarreno, D.V., May, E. and Inkpen, R., 2009a. Influence of Environmental Temperature on
Biocalcification by Non-sporing Freshwater Bacteria. Geomicrobiology Journal 26, 298-309.
Zamarreno, D.V., Inkpen, R. and May, E., 2009b. Carbonate crystals precipitated by freshwater bacteria
and their use as a limestone consolidant. Applied and Environmental Microbiology 75, 5981-5990.
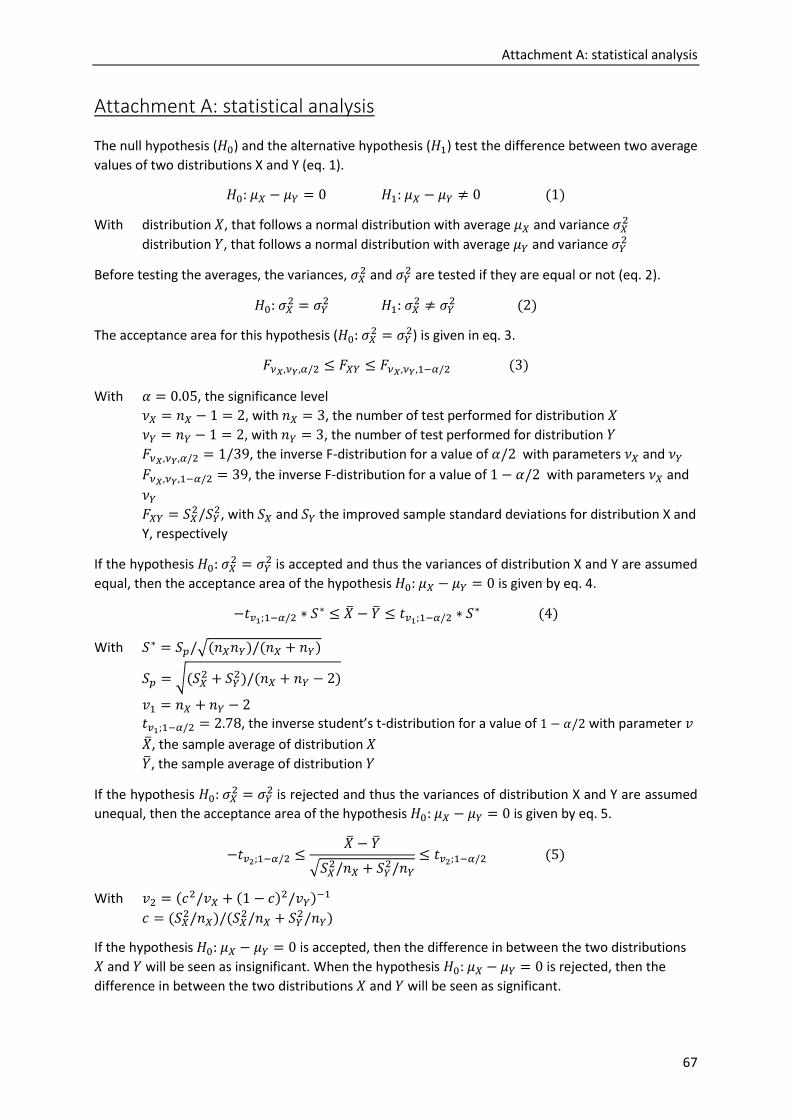
Attachment A: statistical analysis
67
Attachment A: statistical analysis
The null hypothesis (𝐻0) and the alternative hypothesis (𝐻1) test the difference between two average
values of two distributions X and Y (eq. 1).
𝐻0: 𝜇𝑋 − 𝜇𝑌 = 0 𝐻1: 𝜇𝑋 − 𝜇𝑌 ≠ 0 (1)
With distribution 𝑋, that follows a normal distribution with average 𝜇𝑋 and variance 𝜎𝑋2
distribution 𝑌, that follows a normal distribution with average 𝜇𝑌 and variance 𝜎𝑌2
Before testing the averages, the variances, 𝜎𝑋2 and 𝜎𝑌
2 are tested if they are equal or not (eq. 2).
𝐻0: 𝜎𝑋2 = 𝜎𝑌
2 𝐻1: 𝜎𝑋2 ≠ 𝜎𝑌
2 (2)
The acceptance area for this hypothesis (𝐻0: 𝜎𝑋2 = 𝜎𝑌
2) is given in eq. 3.
𝐹𝜈𝑋,𝜈𝑌,𝛼/2 ≤ 𝐹𝑋𝑌 ≤ 𝐹𝜈𝑋,𝜈𝑌,1−𝛼/2 (3)
With 𝛼 = 0.05, the significance level
𝜈𝑋 = 𝑛𝑋 − 1 = 2, with 𝑛𝑋 = 3, the number of test performed for distribution 𝑋
𝜈𝑌 = 𝑛𝑌 − 1 = 2, with 𝑛𝑌 = 3, the number of test performed for distribution 𝑌
𝐹𝜈𝑋,𝜈𝑌,𝛼/2 = 1/39, the inverse F-distribution for a value of 𝛼/2 with parameters 𝜈𝑋 and 𝜈𝑌
𝐹𝜈𝑋,𝜈𝑌,1−𝛼/2 = 39, the inverse F-distribution for a value of 1 − 𝛼/2 with parameters 𝜈𝑋 and
𝜈𝑌
𝐹𝑋𝑌 = 𝑆𝑋2/𝑆𝑌
2, with 𝑆𝑋 and 𝑆𝑌 the improved sample standard deviations for distribution X and
Y, respectively
If the hypothesis 𝐻0: 𝜎𝑋2 = 𝜎𝑌
2 is accepted and thus the variances of distribution X and Y are assumed
equal, then the acceptance area of the hypothesis 𝐻0: 𝜇𝑋 − 𝜇𝑌 = 0 is given by eq. 4.
−𝑡𝑣1;1−𝛼/2 ∗ 𝑆∗ ≤ �� − �� ≤ 𝑡𝑣1;1−𝛼/2 ∗ 𝑆∗ (4)
With 𝑆∗ = 𝑆𝑝/√(𝑛𝑋𝑛𝑌)/(𝑛𝑋 + 𝑛𝑌)
𝑆𝑝 = √(𝑆𝑋2 + 𝑆𝑌
2)/(𝑛𝑋 + 𝑛𝑌 − 2)
𝑣1 = 𝑛𝑋 + 𝑛𝑌 − 2
𝑡𝑣1;1−𝛼/2 = 2.78, the inverse student’s t-distribution for a value of 1 − 𝛼/2 with parameter 𝑣
��, the sample average of distribution 𝑋
��, the sample average of distribution 𝑌
If the hypothesis 𝐻0: 𝜎𝑋2 = 𝜎𝑌
2 is rejected and thus the variances of distribution X and Y are assumed
unequal, then the acceptance area of the hypothesis 𝐻0: 𝜇𝑋 − 𝜇𝑌 = 0 is given by eq. 5.
−𝑡𝑣2;1−𝛼/2 ≤�� − ��
√𝑆𝑋2/𝑛𝑋 + 𝑆𝑌
2/𝑛𝑌
≤ 𝑡𝑣2;1−𝛼/2 (5)
With 𝑣2 = (𝑐2/𝑣𝑋 + (1 − 𝑐)2/𝑣𝑌)−1
𝑐 = (𝑆𝑋2/𝑛𝑋)/(𝑆𝑋
2/𝑛𝑋 + 𝑆𝑌2/𝑛𝑌)
If the hypothesis 𝐻0: 𝜇𝑋 − 𝜇𝑌 = 0 is accepted, then the difference in between the two distributions
𝑋 and 𝑌 will be seen as insignificant. When the hypothesis 𝐻0: 𝜇𝑋 − 𝜇𝑌 = 0 is rejected, then the
difference in between the two distributions 𝑋 and 𝑌 will be seen as significant.
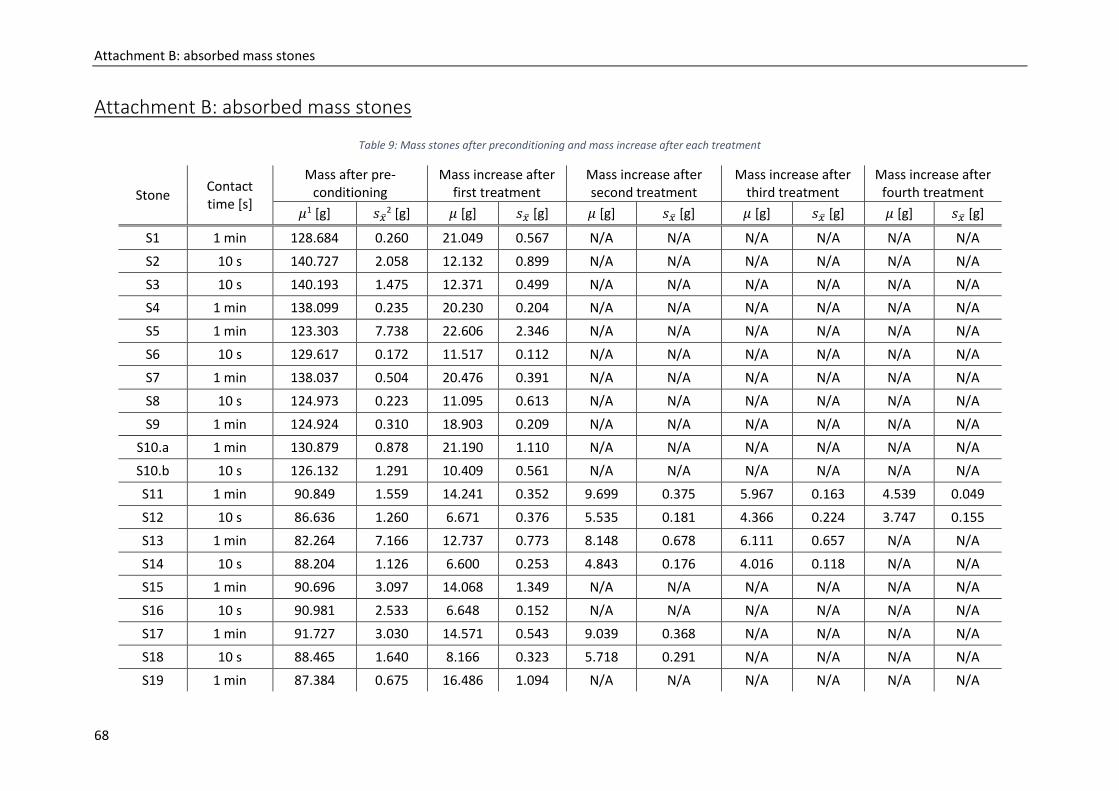
Attachment B: absorbed mass stones
68
Attachment B: absorbed mass stones
Table 9: Mass stones after preconditioning and mass increase after each treatment
Stone Contact time [s]
Mass after pre-conditioning
Mass increase after first treatment
Mass increase after second treatment
Mass increase after third treatment
Mass increase after fourth treatment
𝜇1 [g] 𝑠��2 [g] 𝜇 [g] 𝑠�� [g] 𝜇 [g] 𝑠�� [g] 𝜇 [g] 𝑠�� [g] 𝜇 [g] 𝑠�� [g]
S1 1 min 128.684 0.260 21.049 0.567 N/A N/A N/A N/A N/A N/A
S2 10 s 140.727 2.058 12.132 0.899 N/A N/A N/A N/A N/A N/A
S3 10 s 140.193 1.475 12.371 0.499 N/A N/A N/A N/A N/A N/A
S4 1 min 138.099 0.235 20.230 0.204 N/A N/A N/A N/A N/A N/A
S5 1 min 123.303 7.738 22.606 2.346 N/A N/A N/A N/A N/A N/A
S6 10 s 129.617 0.172 11.517 0.112 N/A N/A N/A N/A N/A N/A
S7 1 min 138.037 0.504 20.476 0.391 N/A N/A N/A N/A N/A N/A
S8 10 s 124.973 0.223 11.095 0.613 N/A N/A N/A N/A N/A N/A
S9 1 min 124.924 0.310 18.903 0.209 N/A N/A N/A N/A N/A N/A
S10.a 1 min 130.879 0.878 21.190 1.110 N/A N/A N/A N/A N/A N/A
S10.b 10 s 126.132 1.291 10.409 0.561 N/A N/A N/A N/A N/A N/A
S11 1 min 90.849 1.559 14.241 0.352 9.699 0.375 5.967 0.163 4.539 0.049
S12 10 s 86.636 1.260 6.671 0.376 5.535 0.181 4.366 0.224 3.747 0.155
S13 1 min 82.264 7.166 12.737 0.773 8.148 0.678 6.111 0.657 N/A N/A
S14 10 s 88.204 1.126 6.600 0.253 4.843 0.176 4.016 0.118 N/A N/A
S15 1 min 90.696 3.097 14.068 1.349 N/A N/A N/A N/A N/A N/A
S16 10 s 90.981 2.533 6.648 0.152 N/A N/A N/A N/A N/A N/A
S17 1 min 91.727 3.030 14.571 0.543 9.039 0.368 N/A N/A N/A N/A
S18 10 s 88.465 1.640 8.166 0.323 5.718 0.291 N/A N/A N/A N/A
S19 1 min 87.384 0.675 16.486 1.094 N/A N/A N/A N/A N/A N/A
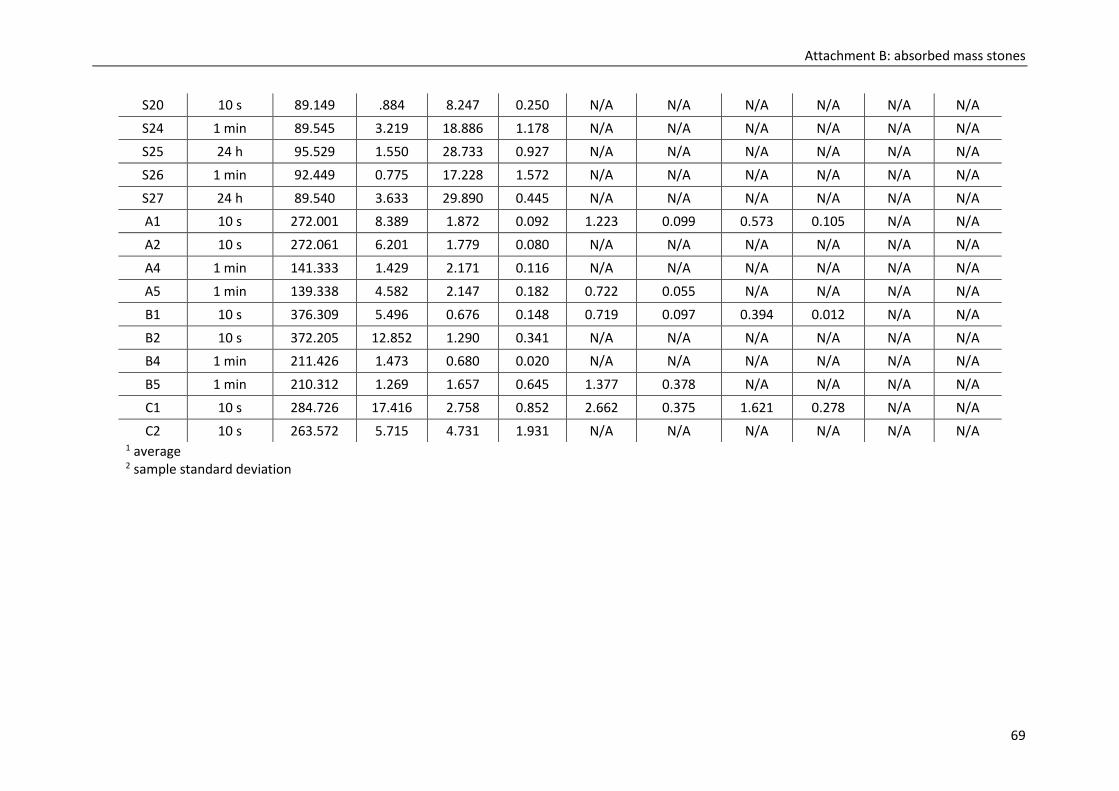
Attachment B: absorbed mass stones
69
S20 10 s 89.149 .884 8.247 0.250 N/A N/A N/A N/A N/A N/A
S24 1 min 89.545 3.219 18.886 1.178 N/A N/A N/A N/A N/A N/A
S25 24 h 95.529 1.550 28.733 0.927 N/A N/A N/A N/A N/A N/A
S26 1 min 92.449 0.775 17.228 1.572 N/A N/A N/A N/A N/A N/A
S27 24 h 89.540 3.633 29.890 0.445 N/A N/A N/A N/A N/A N/A
A1 10 s 272.001 8.389 1.872 0.092 1.223 0.099 0.573 0.105 N/A N/A
A2 10 s 272.061 6.201 1.779 0.080 N/A N/A N/A N/A N/A N/A
A4 1 min 141.333 1.429 2.171 0.116 N/A N/A N/A N/A N/A N/A
A5 1 min 139.338 4.582 2.147 0.182 0.722 0.055 N/A N/A N/A N/A
B1 10 s 376.309 5.496 0.676 0.148 0.719 0.097 0.394 0.012 N/A N/A
B2 10 s 372.205 12.852 1.290 0.341 N/A N/A N/A N/A N/A N/A
B4 1 min 211.426 1.473 0.680 0.020 N/A N/A N/A N/A N/A N/A
B5 1 min 210.312 1.269 1.657 0.645 1.377 0.378 N/A N/A N/A N/A
C1 10 s 284.726 17.416 2.758 0.852 2.662 0.375 1.621 0.278 N/A N/A
C2 10 s 263.572 5.715 4.731 1.931 N/A N/A N/A N/A N/A N/A 1 average 2 sample standard deviation
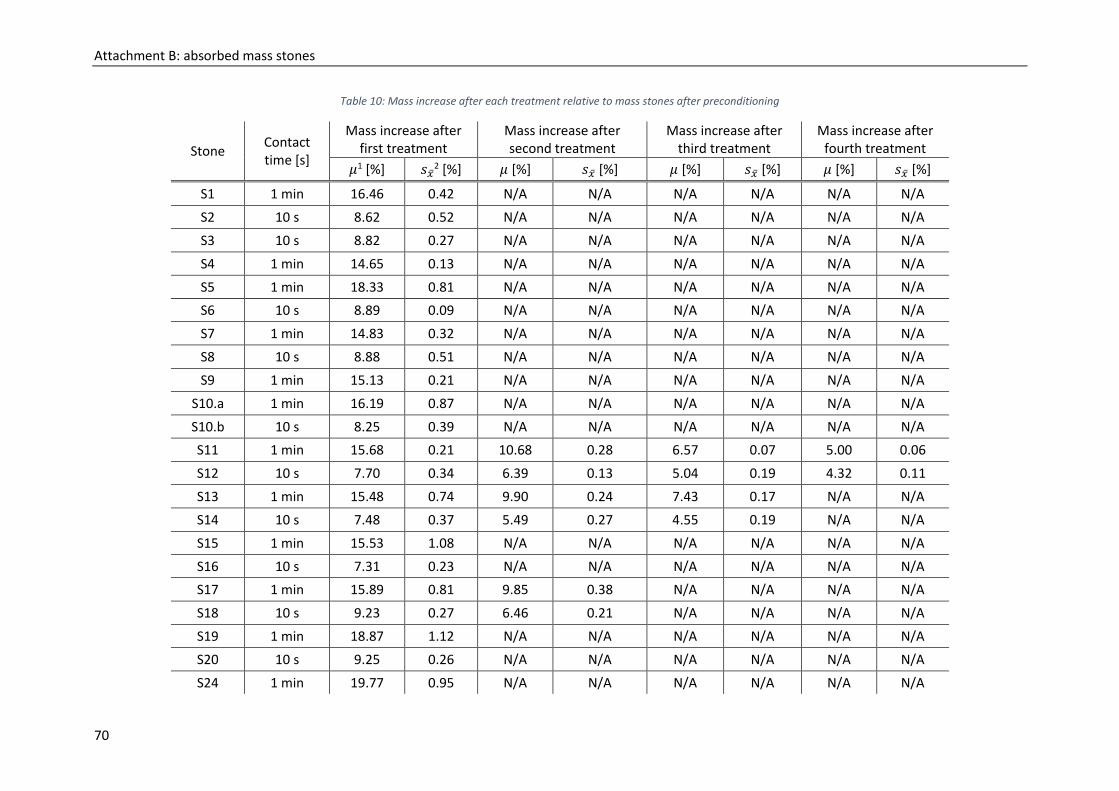
Attachment B: absorbed mass stones
70
Table 10: Mass increase after each treatment relative to mass stones after preconditioning
Stone Contact time [s]
Mass increase after first treatment
Mass increase after second treatment
Mass increase after third treatment
Mass increase after fourth treatment
𝜇1 [%] 𝑠��2 [%] 𝜇 [%] 𝑠�� [%] 𝜇 [%] 𝑠�� [%] 𝜇 [%] 𝑠�� [%]
S1 1 min 16.46 0.42 N/A N/A N/A N/A N/A N/A
S2 10 s 8.62 0.52 N/A N/A N/A N/A N/A N/A
S3 10 s 8.82 0.27 N/A N/A N/A N/A N/A N/A
S4 1 min 14.65 0.13 N/A N/A N/A N/A N/A N/A
S5 1 min 18.33 0.81 N/A N/A N/A N/A N/A N/A
S6 10 s 8.89 0.09 N/A N/A N/A N/A N/A N/A
S7 1 min 14.83 0.32 N/A N/A N/A N/A N/A N/A
S8 10 s 8.88 0.51 N/A N/A N/A N/A N/A N/A
S9 1 min 15.13 0.21 N/A N/A N/A N/A N/A N/A
S10.a 1 min 16.19 0.87 N/A N/A N/A N/A N/A N/A
S10.b 10 s 8.25 0.39 N/A N/A N/A N/A N/A N/A
S11 1 min 15.68 0.21 10.68 0.28 6.57 0.07 5.00 0.06
S12 10 s 7.70 0.34 6.39 0.13 5.04 0.19 4.32 0.11
S13 1 min 15.48 0.74 9.90 0.24 7.43 0.17 N/A N/A
S14 10 s 7.48 0.37 5.49 0.27 4.55 0.19 N/A N/A
S15 1 min 15.53 1.08 N/A N/A N/A N/A N/A N/A
S16 10 s 7.31 0.23 N/A N/A N/A N/A N/A N/A
S17 1 min 15.89 0.81 9.85 0.38 N/A N/A N/A N/A
S18 10 s 9.23 0.27 6.46 0.21 N/A N/A N/A N/A
S19 1 min 18.87 1.12 N/A N/A N/A N/A N/A N/A
S20 10 s 9.25 0.26 N/A N/A N/A N/A N/A N/A
S24 1 min 19.77 0.95 N/A N/A N/A N/A N/A N/A
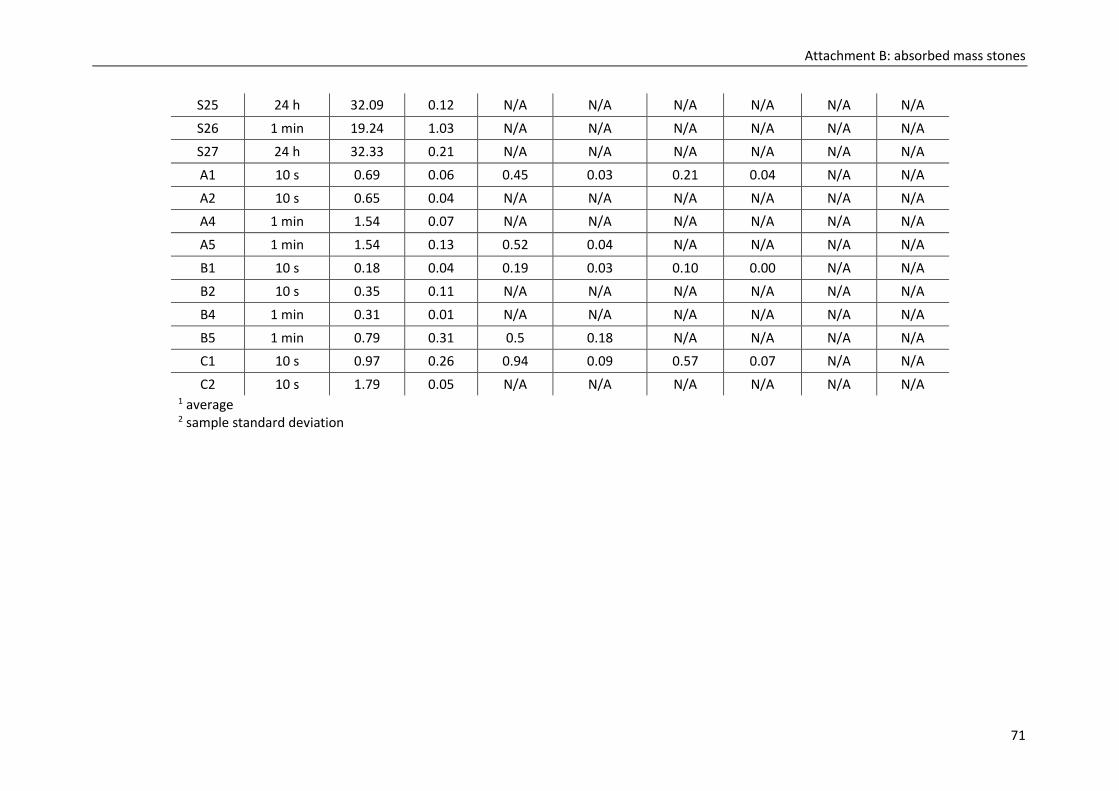
Attachment B: absorbed mass stones
71
S25 24 h 32.09 0.12 N/A N/A N/A N/A N/A N/A
S26 1 min 19.24 1.03 N/A N/A N/A N/A N/A N/A
S27 24 h 32.33 0.21 N/A N/A N/A N/A N/A N/A
A1 10 s 0.69 0.06 0.45 0.03 0.21 0.04 N/A N/A
A2 10 s 0.65 0.04 N/A N/A N/A N/A N/A N/A
A4 1 min 1.54 0.07 N/A N/A N/A N/A N/A N/A
A5 1 min 1.54 0.13 0.52 0.04 N/A N/A N/A N/A
B1 10 s 0.18 0.04 0.19 0.03 0.10 0.00 N/A N/A
B2 10 s 0.35 0.11 N/A N/A N/A N/A N/A N/A
B4 1 min 0.31 0.01 N/A N/A N/A N/A N/A N/A
B5 1 min 0.79 0.31 0.5 0.18 N/A N/A N/A N/A
C1 10 s 0.97 0.26 0.94 0.09 0.57 0.07 N/A N/A
C2 10 s 1.79 0.05 N/A N/A N/A N/A N/A N/A 1 average 2 sample standard deviation


