
Biomolecular interaction analysis (BIA) techniques
110
Biomolecular Interaction Analysis (BIA) Techniques By: Naghmeh Poorinmohammad University of Tehran Microbial Technology and Products (MTP) Research Center November 2014
Transcript of Biomolecular interaction analysis (BIA) techniques

Biomolecular Interaction Analysis
(BIA) Techniques
By: Naghmeh Poorinmohammad
University of Tehran
Microbial Technology and Products (MTP)
Research Center
November 2014

• Introduction
• BIA techniques
1. Biochemistry & biophysics methods
2. Molecular Methods
3. Computer-aided techniques
4. Novel creative approaches
• Summary/Conclusion
• References
2
Outline

3
• Introduction
• BIA techniques
1. Biochemistry & biophysics methods
2. Molecular Methods
3. Computer-aided techniques
4. Novel creative approaches
• Summary/Conclusion
• References
Outline

Biomolecular Interaction Analysis (BIA)
• Almost all biological processes can be described as a sequence of
interaction events between macromolecules/small molecules.
• The study of such interactions (BIA) is key for:
1. Understanding of biology at the molecular level
2. Drug discovery
3. Development of diagnostic tests
• It is thus crucial to develop techniques that can:
1. Probe
2. characterize
3. Discriminate
4

• Introduction
• BIA techniques:
1. Biochemistry and biophysics methods
2. Molecular Methods
3. Computer-aided techniques
4. Novel creative approaches
• Summary/Conclusion
• References
Outline
5

1. Biochemistry and biophysics methods
Optical
Fluorescence
SPR
MST
ATR-FTIR
Raman
MS
NMR
Electrochemistry
Equilibrium dialysis
Chromatography
ITC
DSC
Electrophoresis
UV
Non-optical
CD Pull-down
6

OPTICAL METHODS

Fluorescence spectroscopy
• Fluorescence originates from electronic transitions in molecules with
conjugated bonds.
• When a fluorophore, which is excited by a photon, returns from an excited
singlet electronic state to the ground singlet electronic state, it may emit light
in the form of fluorescence.
• The observable fluorescence intensity, If , is a wavelength dependent quantity
and is related to the quantum yield and optical density quantitative
treatment of fluorescence binding data.
• In general, the optimal spectroscopic conditions should be selected to exploit
the properties of the excitation and emission scans of the complex and its
constituents.
Mocz, Gabor, and Justin A. Ross. "Fluorescence Techniques in Analysis of Protein–Ligand Interactions." Protein-Ligand
Interactions. Humana Press, 2013. 169-210.
8

Fluorescence Resonance Energy Transfer (FRET)
Song, Yang, et al. "Protein interaction affinity determination by quantitative FRET technology." Biotechnology and
bioengineering 109.11 (2012): 2875-2883.
From: Broussard et al. 2013; nature protocols
9
• The donor absorption and emission
spectra should have a minimal
overlap to reduce self-transfer.
• The absorption spectrum of the
acceptor must overlap the
fluorescence emission spectrum of
the donor.
• Donor and acceptor molecules must
be in close proximity (10–100 Å).

Fluorescence Resonance Energy Transfer (FRET)
From: http://www.olympusmicro.com/primer/techniques/fluorescence/fret/fretintro.html
10

Fluorescence Resonance Energy Transfer (FRET)
• Intensity ≈ [sample]; when OD< 0.05
Song, Yang, et al. "Protein interaction affinity determination by quantitative FRET technology." Biotechnology and
bioengineering 109.11 (2012): 2875-2883.
11
• Binding free energy can be derived from: ΔG= RTlnKd
• In greater OD values the relation is non-linear, thus complicated for calculations.

Advantages Drawbacks
Allows the study in living cells High background noise
Short time of trial (<90s) Donor reabsorbs emission
Quantitative Natural fluorescence of cells
Sensitive Oxygen quenching effect
Needs low concentration of sampleExternal light source required : Here
comes BRET
Fluorescence Resonance Energy Transfer (FRET)
12

• Absorption spectroscopy in the visible and ultraviolet spectral regions is a
powerful technique by which ligand binding equilibria can be studied.
Th
ree
dif
fere
nt
inte
rna
l
chro
mo
ph
ore
sin
Bio
mo
lecu
le
The peptide bond (absorbs weakly 220 nm)
Aromatic amino acids F, Y, W, H (230–300 nm)
Many biological molecules show strong absorbance in the visible region of the spectrum as a result of the presence of metal ions and prosthetic groups with extended π-electron systems, such as chlorophyll, carotinoid, flavin, heme.
Ultra Violet-visible (UV-Vis) spectroscopy
Nienhaus, Karin, and G. Ulrich Nienhaus. "Probing heme protein-ligand interactions by UV/visible absorption
spectroscopy." Protein-Ligand Interactions. Humana Press, 2005. 215-241.
13
These bands are sensitive to the surrounding polypeptide environment and
reflect structural changes, oxidation states, and the binding of ligands.

15

Ultra Violet-visible (UV-Vis) spectroscopy
Advantages Drawbacks
Simple (more than with
fluorescence)Less sensitive than fluorescnece
Inexpensive Less specific than fluorescence
Quantitative Overlap bands
16

Circular Dichroism (CD) Spectroscopy
• CD is the difference in absorption of left
and right circularly polarized light.
• Proteins and DNA and many ligands are
chiral.
• Molecular interactions between chiral
and achiral compounds can give rise to
induced circular dichroism (ICD) of the
achiral counterpart.
• If it is chiral then its ICD is the
difference between its own CD spectrum
and the spectrum in the presence of the
protein.
Rodger, Alison, et al. "Circular dichroism spectroscopy for the study of protein-ligand interactions." Protein-Ligand
Interactions. Humana Press, 2005. 343-363.
17

Circular Dichroism (CD) Spectroscopy
Daviter, Tina, Nikola Chmel, and Alison Rodger. "Circular and linear dichroism spectroscopy for the study of protein–
ligand interactions." Protein-Ligand Interactions. Humana Press, 2013. 211-241.
18

Advantages Drawbacks
Gives structural information Machines are more expensive than UV
SensitiveMeasures binding strength of the order
of μM
Relatively rapid (20 min) -
Quantitative -
No extensive sample preparation -
Circular Dichroism (CD) Spectroscopy
19

Nuclear Magnetic Resonance (NMR) Spectroscopy
• A physical phenomenon in which nuclei in a magnetic field absorb and re-
emit electromagnetic radiation.
• NMR detects ligand binding through changes in the resonant frequencies
(chemical shifts) of NMR-active nuclei.
Mittermaier, Anthony, and Erick Meneses. "Analyzing Protein–Ligand Interactions by Dynamic NMR
Spectroscopy." Protein-Ligand Interactions. Humana Press, 2013. 243-266.
20
• Larger molecules (>25 kDa), additional enrichment with 2H.
• NMR spectroscopy detects and reveals protein ligand interactions with a large
range of affinities (10 9–10-3 M).
• Protein samples need to be isotopically enriched (15N and/or 13C).
• Isotopically labeled protein over-express in bacteria grown in minimal media
containing 15NH4Cl and/or 13C glucose as the sole sources of nitrogen and/or
carbon.

Nuclear Magnetic Resonance (NMR) Spectroscopy
Advantage Drawback
Very sensitive to weak interactionsNeeds concentrated isotopically lablled
sample 50μM- 2mM)
Reveals the portion of molecule
involved in interactionNot suitable for >100 KDa
Accurate kinetics even for short
lifetime bounds (< 1ms)Needs high purity sample
Assay in equilibrium solutionRequires ligand-receptor buffer
harmony
Quantitative (large range of affinities)Strong magnetic fields needed for high
quality expensive
- Long assay time
21

Mass Spectroscopy
• Using ESI-MS, it is possible to transfer weakly associated complexes from
solution into the gas phase inside the mass spectrometer source.
• ESI-MS not only provides a direct readout of binding stoichiometry but can
also be used to determine dissociation constants ranging from nM to mM.
• The number of ligands bound for a given protein–ligand system can be
determined directly from the spectrum based on the mass difference between
free protein and its ligated complexes.
• In addition to exploiting the ‘x axis’ of the mass spectrum (that is, the mass-
tocharge ratio, m/z), the ‘y axis’ of the mass spectrum (that is,
abundance/intensity) provides important information about affinity and
specificity.
- Pacholarz, Kamila J., et al. "Mass spectrometry based tools to investigate protein–ligand interactions for drug discovery." Chemical
Society Reviews41.11 (2012): 4335-4355.
- Hofstadler, Steven A., and Kristin A. Sannes-Lowery. "Applications of ESI-MS in drug discovery: interrogation of noncovalent
complexes." Nature Reviews Drug Discovery 5.7 (2006): 585-595.
22

Mass Spectroscopy
Pacholarz, Kamila J., et al. "Mass spectrometry based tools to investigate protein–ligand interactions for drug
discovery." Chemical Society Reviews41.11 (2012): 4335-4355.
23

Surface-enhanced laser desorption/ionization (SELDI)
From: Tang et al. 2004; Mass spectrometry reviews
• SELDI-TOF MS, combines two powerful techniques: chromatography and
mass spectrometry.
• Different SELDI plates are available: CM10 (ion-exchange), H50 (like C6
to C12 reverse phase)
24

Advantage Drawback
Binding stochiometry and kineticsDoes not discriminate between specific
and non-specific binding
Sensitive/specific lower sample
consumption
Does not provide information
regarding the binding site of the ligand
and structure changes
High throughput capability (nano-
ESI-MS)Instrumental appropriate tuning
Label free -
No stabilization needed -
Mass Spectroscopy
25

Fourier transform infrared (FTIR) spectroscopy
• Interaction of infrared light with the vibrational modes of the molecules being
interrogated.
• High IR absorptivity of water IR samples are very thin, the relative water .
26

Attenuated Total Reflectance (ATR)-FTIR
• ATR Molecule being studied may be in contact to water above, which is not
sensed by the IR beam.
• Its characteristics allow ligands to be detected only when they are bound to
receptors closely linked to the sensor surface.
Kazarian, Sergei G., and KL Andrew Chan. "ATR-FTIR spectroscopic imaging: recent advances and applications to
biological systems." Analyst 138.7 (2013): 1940-1951.
From:
27

ATR-FTIR spectroscopy
Advantage Drawback
Rapid assay (10ms) Needs concentrated sample (2-10mM)
label free Needs ATR correction software
low-cost Stabilization process (in some cases)
Low sample volume requirement (1/3
NMR)Quantitative determination
Suitable for large/membrane proteins Low Sensitivity
28

Surface Enhanced Raman Spectroscopy
• It can be dramatically enhanced (102–1014) by adsorption of molecules on a
surface of noble metal, transition metal, or semiconductor substrates (SERS).
Siddhanta, Soumik, and Chandrabhas Narayana. "Surface Enhanced Raman Spectroscopy of Proteins: Implications in
Drug Designing." Nanomaterials and Nanotechnology 2.1 (2012): 1-13.
From: Siddhanta et al. 2012; Nanomaterials and
Nanotechnology
From: www.semrock.com
29

Raman IR
Due to the scattering of light by the vibrating
molecules.
Result of absorption/reflectance of light by
vibrating molecules.
The vibration is Raman active if it causes a
change in polarisability.
The vibration is IR active if there is a
change in dipole moment during the
vibration.
Many distinguishable peaks with high
intensities
Few distinguishable peaks with weak
intensities
(even in ATR-FTIR)
Water can be used as a solvent.Water cannot be used due to its intense
absorption (not for ATR).
Sample preparation is not very elaborate
sample can be almost in any state.
Sample preparation is elaborate
Gaseous samples can rarely be used.
Cost of instrumentation is very high Comparatively inexpensive.
30

Surface Plasmon Resonance (SPR)
• SPR is the resonant oscillation of conduction electrons at the interface which
will affect with polirized light.
Stahelin, Robert V. "Surface plasmon resonance: a useful technique for cell biologists to characterize biomolecular
interactions." Molecular biology of the cell 24.7 (2013): 883-886.
From:
31

Advantage Drawback
Label freeTethering of molecules to surfaces may
affect the binding constants measured
Enables quantitative determinationAny artifactual RI change other than
from the interaction can also give
signal
Low sample volume requirementStabilization process (in some cases)
Real time assay
SensitiveCannot verify the stability of the
complex formed
Surface Plasmon Resonance (SPR)
32

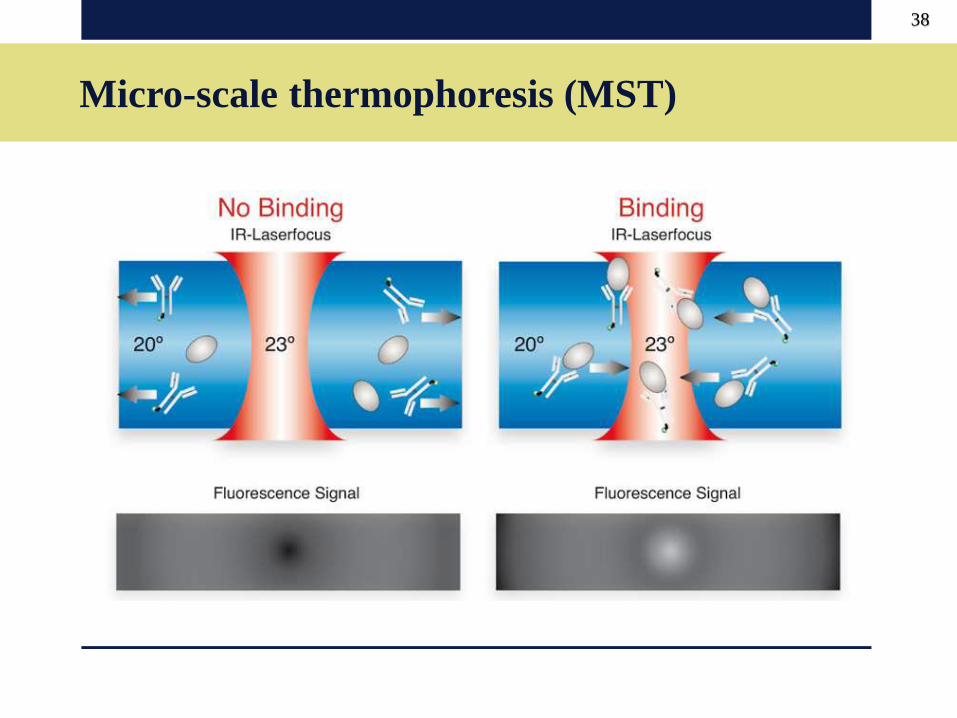
Micro-scale thermophoresis (MST)
• It measures the motion of molecules along microscopic temperature
gradients and detects changes in their hydration shell, charge or size.
• An infrared-laser is used to generate precise microscopic temperature
gradients within thin glass capillaries that are filled with a sample in a
buffer or bioliquid of choice.
• Thermophoresis, is very sensitive to changes in size, charge, and
solvation shell of a molecule and thus suited for bioanalytics.
• The fluorescence of molecules is used to monitor the motion of
molecules along these temperature gradients. The fluorescence can be
either intrinsic (e.g. tryptophan) or of an attached dye or fluorescent
protein (e.g. GFP).
Jerabek-Willemsen, Moran, et al. "Molecular interaction studies using microscale thermophoresis." Assay and drug
development technologies 9.4 (2011): 342-353.
33

Micro-scale thermophoresis (MST)
From: http://www.nanotemper-technologies.com/uploads/pics/MST-Techo-Artikel.jpg
34

Micro-scale thermophoresis (MST)
From: Jerabek-Willemsen et al. 2011; Assay and drug development technologies.
35

Micro-scale thermophoresis (MST)
36

Micro-scale thermophoresis (MST)
37
Micro-scale thermophoresis (MST)
38

Micro-scale thermophoresis (MST)
Advantage Drawback
Sample concentration (pM/nM) and
small volume (< 4 µl)
Buffer condition must be absolutely
stable
Quantitative (K: pM/nM to mM range
and n)
Conformational changes induced by
IR-Laser heating may be problematic
measures interactions with essentially
no limitation on molecule size or
molecular weight.
-
Immobilization free -
Free in choosing buffer type-
39

NON-OPTICAL METHODS
Isothermal Titration Calorimetry (ITC)
• All chemical, physical and biologic processes are performed along with heat
exchange criteria.
• When a protein interacts with a ligand, heat is either released or absorbed.
• ITC relies only on the detection of a heat effect upon binding not relies on
the presence of chromophores or fluorophores.
• Can be used to measure the binding constant, the enthalpy of binding, and
the stoichiometry.
• Modern instruments, like the MicroCal and Calorimetry Sciences
Corporation ITCs, make it possible to measure heat effects as small as 0.4 μJ
(0.1 μcal) allowing the determination of binding constants, K’s, as large as
108 to 109 M–1.
Lewis, Edwin A., and Kenneth P. Murphy. "Isothermal titration calorimetry."Protein-Ligand Interactions. Humana
Press, 2005. 1-15.
41

• The linear parameters ΔH and n will be better determined than the nonlinear
parameter K.
• The best results will be obtained at 10/K <[M] <100/K, and [L] 20 to 50 ×
[M], subject to solubility and heat signal considerations.
• Titrant and titrate concentrations must be accurately known.
• (Nonintegral values for n are often the result of concentration errors. Errors
in titrate concentration contribute directly to a similar systematic error in n.
Errors in titrant concentration or titrant delivery contribute directly to errors
in K and ΔH.)
Isothermal Titration Calorimetry (ITC)
Lewis, Edwin A., and Kenneth P. Murphy. "Isothermal titration calorimetry."Protein-Ligand Interactions. Humana
Press, 2005. 1-15.
42

Isothermal Titration Calorimetry (ITC)
43

Isothermal Titration Calorimetry (ITC)
43

Isothermal Titration Calorimetry (ITC)
43

Isothermal Titration Calorimetry (ITC)
43

Isothermal Titration Calorimetry (ITC)
43

Isothermal Titration Calorimetry (ITC)
43

Isothermal Titration Calorimetry (ITC)
43

Isothermal Titration Calorimetry (ITC)
From: http://www.endocytosis.org/techniqs/ITC.htmlLewis, Edwin A., and Kenneth P. Murphy. "Isothermal titration calorimetry."Protein-Ligand Interactions. Humana
Press, 2005. 1-15.
44

Advantage Drawback
Label free Large sample volumes required
Enables quantitative determination (K
and n)High ligand concentrations
Can be done on solutions that are
either homogeneous or heterogenous
Presence of impurities or inactive
protein will have a direct impact on the
stoichiometry
Universal -
Isothermal Titration Calorimetry (ITC)
45

Differential Scanning Calorimetry (DSC)
• Measures heat capacity in a range of temperatures.
• If a ligand binds preferentially to the native state of the protein, the
temperature at which the protein-ligand complex denatures will be higher
compared to the temperature at which the free protein unfolds.
• Since the degree of stabilization or destabilization of the native protein
depends on the magnitude of the binding energy, comparison of the stability
of the complex with the stability of the ligand-free protein allows the binding
energy to be estimated.
• DSC thus provides a direct measure of whether ligand binding to a protein is
stabilizing or destabilizing, and so can complement studies of binding
equilibria obtained by isothermal titration calorimetry (ITC).
Chiu, Michael H., and Elmar J. Prenner. "Differential scanning calorimetry: an invaluable tool for a detailed
thermodynamic characterization of macromolecules and their interactions." Journal of Pharmacy And Bioallied
Sciences 3.1 (2011): 39.
46

Differential Scanning Calorimetry (DSC)
http://lnbio.cnpem.br/spectroscopyandcalorimetry/files/2012/08/DSCnote1.pdf
47

Differential Scanning Calorimetry (DSC)
Advantage Drawback
Label freeSensitivity depends on many
parameters
Quantitative (relatively)useful in characterizing very tight
binding interactions which equilibrate
very slowly (mins to hrs)
Gives information on the nature of
binding event-
48

Equilibrium Dialysis
• The molecular weight cut off (MWCO) is chosen such that it will retain the
receptor component.
• A known concentration and volume of ligand is placed into one of the
chambers. The ligand is small enough to pass freely through the membrane.
• A known concentration of receptor is then placed in the remaining chamber in
an equivalent volume to that placed in the first chamber.
• A complete binding curve is generated by measuring Y at different ligand
concentrations.
• The relationship between binding and ligand concentration is then used to
determine the number of binding sites, the ligand affinity, kd. Because this kind
of experimental data used to be analyzed with (Scatchard plots)
Hatakeyama, Tomomitsu. "Equilibrium Dialysis Using Chromophoric Sugar Derivatives." Lectins. Springer New York,
2014. 165-171.
49

Equilibrium Dialysis
www.nestgrp.com/pdf/Ap1/EqDialManual.pdf
50

Advantage Drawback
Truely label-free Not very rapid
Quantitative Large sample volumes
Immobilization free -
Equilibrium Dialysis
51

Affinity Capillary Electrophoresis (ACE)
• The technique uses the resolving power of CE to distinguish between free and bound
forms of a receptor as a function of the concentration of free ligand.
• ACE experiments are most commonly performed in fused silica capillaries by injecting a
receptor and neutral marker with increasing concentrations of ligand in the separation
buffer.
• By studying the mobility change of a certain molecule when it interacts with another
molecule of different mobility it is possible to determine the binding constant between
the two compounds.
• The binding of the ligand to the receptor produces a migration time shift in the effective
mobility due to a change in the charge:size ratio of the complex.
• Scatchard analysis of the effective mobilities measured as a function of ligand
concentration provides the binding affinity of the receptor–ligand complex.
- Dinges, Meredith M., Kemal Solakyildirim, and Cynthia K. Larive. "Affinity capillary electrophoresis for the determination
of binding affinities for low molecular weight heparins and antithrombin‐III." Electrophoresis 35.10 (2014): 1469-1477.
- Chen, Zhi, and Stephen G. Weber. "Determination of binding constants by affinity capillary electrophoresis, electrospray
ionization mass spectrometry and phase-distribution methods." TrAC Trends in Analytical Chemistry 27.9 (2008): 738-748.
52

From: Galievsky et al. 2014; Analytical chemistry
53

Affinity Capillary Electrophoresis (ACE)
Advantage Drawback
Truely label-freelittle information about the
experimental conditions
Quantitative (k)Does not give stoichiometry
information
Immobilization free -
Low sample and ligand consumption -
relatively short analysis time -
high and weak affinity interactions -
Can be performed in solution under
physiological buffer conditions-
Impure samples can be used -
54

Co-Immunopercipitation (Co-IP)
• It can only be applied if there is a suitable antibody against the target.
From: http://www.tankonyvtar.hu/
55

Pull-down assay
• Can be regarded to as
Affinity Chromatography.
From: Rigaut et al., 1999; nature
56

Electrochemical methods
• Typically in (bio-)electrochemistry, the reaction under investigation:
• Generate current (amperometric)
• Generate potential or charge accumulation (potentiometric)
• Alter the conductive properties of a medium (conductometric)
between electrodes
• Alter impedance
• NANO The higher surface-to-volume ratio of nano-objects makes
their electrical properties increasingly susceptible to external
influences.
Grieshaber, Dorothee, et al. "Electrochemical biosensors-Sensor principles and architectures." Sensors 8.3 (2008): 1400-
1458.
57

From: Grieshaber et al. 2008; Sensors
58

Electrochemical Impedance Spectroscopy (EIS)
• Allows analysis of
interfacial changes
originating from bio-
recognition events at
electrode surfaces.
• Formation of the complex
on a conductive or semi-
conductive surface alters
the capacitance and the
resistance at the surface
electrolyte interface.
Hu, Yaofang, Peng Zuo, and Bang-Ce Ye. "Label-free electrochemical impedance spectroscopy biosensor for direct detection
of cancer cells based on the interaction between carbohydrate and lectin." Biosensors and Bioelectronics 43 (2013): 79-83.
59

60

Chromatography
• A novel technique: kinetic size-exclusion chromatography with mass
spectrometry detection (KSEC-MS).
• Size-exclusion chromatography (SEC) allows generic separation of SM from
P−SM without the immobilization of SM or P. Mass spectrometry (MS), in turn,
allows the generic detection of SM without labeling it.
• Affinity chromatography was described under the title of pull-down assay.
• You may think of other chromatography techniques such as HIC which can
discriminate binding events.
Bao, Jiayin, et al. "Kinetic Size-Exclusion Chromatography with Mass Spectrometry Detection (KSEC-MS): an Approach
for Solution-Based Label-Free Kinetic Analysis of Protein-Small Molecule Interactions." Analytical chemistry (2014).
61

KSEC-MS
From: Bao et al. 2014; Analytical chemistry
62

KSEC-MS
From: Bao et al. 2014; Analytical chemistry
63

64
Outline
• Introduction
• BIA techniques:
1. Biochemistry & biophysics methods
2. Molecular Methods
3. Computer-aided techniques
4. Novel creative approaches
• Summary/Conclusion
• References

2. Molecular techniques
Y2H
Phage Display
TAP
Microarrays
65

2. Molecular techniques
Y2H
Phage Display
TAP
Microarrays
65

Yeast two-hybrid (Y2H) system
• Testing for physical interactions between two proteins or protein/DNA.
• Is based on the properties of the yeast GAL4 protein, which consists of
separable domains responsible for DNA-binding and transcriptional
activation.
• Plasmids encoding two hybrid proteins, one consisting of the GAL4 DNA-
binding domain fused to protein X and the other consisting of the GAL4
activation domain fused to protein Y, are constructed and introduced into
yeast.
• Interaction between proteins X and Y leads to the transcriptional activation
of a reporter gene containing a binding site for GAL4.
Caufield, J. H., Neha Sakhawalkar, and Peter Uetz. "A comparison and optimization of yeast two-hybrid
systems." Methods 58.4 (2012): 317-324.
66

• AD: activation Domain
• DBD: DNA Binding
Domain
• Reporter gene:LacZ reporter - Blue/White
Screening
Yeast two-hybrid (Y2H) system
67

Yeast two-hybrid (Y2H) system
Advantage Drawback
in vivoAn interaction may not happen in
yeast
SensitiveMammalian protein is sometimes not
correctly modified in yeast
-
If test proteins are not localized to the
nucleus two interacting proteins may
be found to be non-interacting
-
Some proteins might interact when
they are co-expressed in the yeast, (in
reality they are never present in the
same cell at the same time)
68

2. Molecular techniques
Y2H
Phage Display
TAP
Microarrays
69

• For the study of protein–protein, protein–peptide, and protein DNA interactions.
• A gene encoding a protein of interest is inserted into a phage coat protein gene,
causing the phage to "display”.
• These displaying phages can then be screened against other proteins, peptides or
DNA sequences to detect interaction.
• The most common bacteriophages used in phage display
are M13 and filamentous phage, though T4, T7, and λ phage have also been
used.
Phage Display
Bratkovič, Tomaž. "Progress in phage display: evolution of the technique and its applications." Cellular and molecular
life sciences 67.5 (2010): 749-767.
70

Phage Display
From: Wikipedia Phage display
71

Advantage Drawback
Libraries commercially available Complicated structures cannot be
incorporated
Screening can be done on whole cellsTwo hosts required (phage,bacterium)
Phages are amenable to many
conditionsQualitative only
Phage Display
72

2. Molecular techniques
Y2H
Phage Display
TAP
Microarrays
73

Tandem Affinity Purification (TAP)
From: Huber, 2003; Nature Reviews Molecular Cell Biology
74

Advantage Drawback
Significantly reduces non-specific
background
Not suitable for screening transient
protein interactions
More sensitive that Y2H Qualitative
Capable of disclosing multicomponent
interactions
possibility of a cleavage of the
proteins by the TEV protease
Tandem Affinity Purification (TAP)
75

2. Molecular techniques
Y2H
Phage Display
TAP
Microarrays
76

Microarrays: 1. Protein Chip
From: Barillot et al. 2012; Mathematical & Computational biology
77

Microarrays: 2. Nucleic acid Chip
From: Wikipedia DNA chip
78

79
Outline
• Introduction
• BIA techniques:
1. Biochemistry & biophysics methods
2. Molecular Methods
3. Computer-aided techniques
4. Novel creative approaches
• Summary/Conclusion
• References

3. Computer-aided techniques
Molecular docking
Virtual Screening
Molecular dynmic
simulation
Visualization and
Databses
80

3. Computer-aided techniques
Molecular docking
Virtual Screening
Molecular dynmic
simulation
Visualization and
Databses
80

Molecular docking technique
• A method which predicts the preferred orientation and energitics of one
molecule to a second when bound to each other to form a stable complex.
• strength of the predicted bound can be reported as different scoring types.
81

1. Ligand 3D structure
2. Receptor 3D structure
.
3. An appropriate docking algorithm
Molecular Docking Requirements
82

• Can be fetched from various databases for ligands:
ChemDB
Zinc
ChEMBL
PubChem
KEGG DRUG and ...
• Can be generated using cheminformatic tools:
eDesign
HyperChem
Marvin Suite
CORONA and ...
Ligand 3D structure
83

• Can be fetched from Protein Data Bank or other structural databases.
• If not available (for proteins), it can be modelled:
1. Homology modeling
SwissModel
M4T
Modeller
2. De novo modeling
I-TASSER
Phyre2
3. Threading
NovaFold
I-TASSER
Receptor 3D structure
84

• Software:
AutoDock
Molegro
ArgusLab
Hex
• Web-based server:
Cluspro
SwissDock
PatchDock
Docking algorithm
85

3. Computer-aided techniques
Molecular docking
Virtual Screening
Molecular dynmic
simulation
Visualization and
Databses
86

Virtual Screening
• In drug discovery, search libraries of small molecules in order to identify those
structures which are most likely to bind to a drug target, typically
a protein receptor or enzyme.
• Success of a virtual screen is defined in terms of finding interesting new
scaffolds rather than the total number of hits.
• Interpretations of virtual screening accuracy should therefore be considered
with caution. Low hit rates of interesting scaffolds are clearly preferable over
high hit rates of already known scaffolds.
• Follow the same rules as mentioned.
87

3. Computer-aided techniques
Molecular docking
Virtual Screening
Molecular dynmic
simulation
Visualization and
Databses
88

Molecular Dynamics (MD) Simulation
“If we were to name the most powerful
assumption of all, which leads one on and
on in an attempt to understand life, it is
that all things are made of atoms, and that
everything that living things do can be
understood in terms of the jigglings and
wigglings of atoms.”
____Richard Feynman, 1965 Nobel Prize winner in Physics
Durrant, Jacob D., and J. Andrew McCammon. "Molecular dynamics simulations and drug discovery." BMC
biology 9.1 (2011): 71.
89

Molecular Dynamics (MD) Simulation
• This computational method
calculates the time dependent
behavior of a molecular system.
• MD simulations have provided
detailed information on the
fluctuations and conformational
changes of proteins and nucleic
acids.
• These methods are now routinely
used to investigate the structure,
dynamics and thermodynamics of
biological molecules and their
complexes.
90

Molecular Dynamics (MD) Simulation
• MD simulation Soft-wares:
GROMACS
AMBER
CHARMM
GROMOS
NAMD
90

3. Computer-aided techniques
Molecular docking
Virtual Screening
Molecular dynmic
simulation
Visualization and
Databses
91

Interaction network visualization and databases
• Softwares of available to visualize PPI networks: eg. Cytoscape.
• Many Databases of experimental and predicted interactions are
also available:
- STRING
- BIND: the Biomolecular Interaction Network Database
- IntAct
- MINT: Molecular INTeraction database
- iRefIndex
92

http://mint.bio.uniroma2.it/mint/search
93

Outline
94
• Introduction
• BIA techniques:
1. Biochemistry & biophysics methods
2. Molecular Methods
3. Computer-aided techniques
4. Novel creative approaches
• Summary/Conclusion
• References

Helper-interaction FRET (hiFRET)
Jalink, Kees. "hiFRET: some tailwind for FRET resolves weak protein interactions." Nature methods 10.10 (2013):
947-948.
95

Liposome microarray (LiMA)
Saliba, Antoine-Emmanuel, et al. "A quantitative liposome microarray to systematically characterize protein-lipid
interactions." Nature methods (2013).
96

Micro/nano needle biosensor
Esfandyarpour, Rahim, et al. "Microneedle biosensor: A method for direct label-free real time protein
detection." Sensors and Actuators B: Chemical 177 (2013): 848-855.
97

Outline
98
• Introduction
• BIA techniques:
1. Biochemistry & biophysics methods
2. Molecular Methods
3. Computer-aided techniques
4. Novel creative approaches
• Summary/Conclusion
• References

Summary
• Study the interaction of biomolecules with each other and with other
molecules (usually drugs) are of utmost importance.
• There are various types of techniques with different origins and nature.
• We must choose the best techniques which can satisfy our research aim
needs.
• One technique cannot solely be conclusive.
• Optimization of the mentioned techniques are still being done.
• We are not yet able to analyze biomolecular interactions with just one
flawless technique.
99

Outline
100
• Introduction
• BIA techniques:
1. Biochemistry & biophysics methods
2. Molecular Methods
3. Computer-aided techniques
4. Novel creative approaches
• Summary/Conclusion
• References

Some key references
• Williams, Mark A., and Tina Daviter, eds. Protein-ligand Interactions: Methods
and Applications. Humana Press, 2013.
• Nienhaus, G. Ulrich. "Protein-Ligand Interactions." Totowa, NJ: Humana (2005).
• Wetie, Armand G. Ngounou, et al. "Protein–protein interactions: switch from
classical methods to proteomics and bioinformatics-based approaches."Cellular
and Molecular Life Sciences 71.2 (2014): 205-228.
• Jerabek-Willemsen, Moran, et al. "MicroScale Thermophoresis: Interaction
analysis and beyond." Journal of Molecular Structure (2014).
• Piehler, Jacob. "Spectroscopic techniques for monitoring protein interactions in
living cells." Current opinion in structural biology 24 (2014): 54-62.
101

Thank youQuestions are welcomed!