Biomedical Industry of the Republic of...
22
1 Tel: (727) 224 48 41 (727) 224 48 44 [email protected] http://www.rfcaratings.kz Almaty 2016 Biomedical Industry of the Republic of Kazakhstan Research Department Rating agency of the RFCA: Аnalyst: Aigerim Kulbayeva JSC Rating Agency of the Regional Financial Center of Almaty 136 Dostyk ave., 9 th floor, office 904, 050051 Almaty, The Republic of Kazakhstan Any form of copying, reproduction, distribution and forwarding of texts, graphs and other types of materials posted on the website of the "Rating Agency of the RFCA" must be accompanied by a hyperlink to the website www.rfcaratings.kz and indication of the author of the material. Copyright JSC Rating Agency of the RFCA 2016 ©
Transcript of Biomedical Industry of the Republic of...

1
Tel: (727) 224 48 41
(727) 224 48 44
http://www.rfcaratings.kz
Almaty 2016
Biomedical Industry
of the Republic of Kazakhstan
Research Department
Rating agency of the RFCA:
Аnalyst: Aigerim Kulbayeva
JSC Rating Agency of the
Regional Financial Center of
Almaty 136 Dostyk ave., 9 th
floor, office 904, 050051 Almaty,
The Republic of Kazakhstan
Any form of copying, reproduction, distribution and forwarding of texts, graphs and other types of materials posted on
the website of the "Rating Agency of the RFCA" must be accompanied by a hyperlink to the website
www.rfcaratings.kz and indication of the author of the material.
Copyright JSC Rating Agency of the RFCA 2016©
2
Biomedical Industry of the Republic of Kazakhstan.
Today, the biomedical industry is a large complex composed of biotechnological sector,
sector of medical technologies and pharmaceutical sector. In addition, this industry is closely
connected to healthcare, which aims to ensure people’s health. Interrelations of biomedical
industry and healthcare sector defines influence of biomedical sector on healthcare system by
ensuring appropriate conditions for its effectiveness, covering both knowledge and innovation as
well as medicines and equipment. Therefore, the development of biomedical industry in general
defines the effectiveness of healthcare system. This report is aimed to give a general overview
mostly on biomedical industry in Kazakhstan, rather than on healthcare segment.
Moreover, in accordance with the General Classifier of Economic Activities (GCEA) of 01
January 2009 published on the National Statistics Committee website - the Health and Social
Services are the subject of a separate form of economic activity (FEA), which was referred to of
Manufacturing rather than Pharmaceuticals manufacturing subsector. Also, due to the
importance of existing two other areas of biomedical industry, we’ll analyze the dynamics
and ascendance of medical biotechnology industry in Kazakhstan and its influence on a medical-
biological industry of the country as a whole. The pharmaceutical industry is engaged in research
and development, manufacturing of medicinal products for prevention, relief and treatment of
diseases. The manufacturing of high qualified pharmaceutical products must be the main
principle of pharmaceutical manufacturers.
The pharmaceutical industry is a system of interactions between three types of business:
• Pharmaceutical companies that are engaged in the manufacture of medicines;
• Authorized distributors that are engaged in logistics (delivery and storage) of medicines
in the country;
• The pharmacy network that engaged in retail and wholesale vending of medicines to the
final consumer.
In pharmaceutical industry the “full-cycle enterprise” is the enterprise which is engaged in
manufacturing of finished pharmaceutical products (FPP), development and introduction of
technological processes for medicine manufacturing and also distribution of FPP through drug
vendors and retail pharmacy chains.
So, what is biomedical technology sector?
The fundamental law of technology is aimed at technology evolution process (regardless of
subject area), which provides in specific terms the best quality under limited costs.
The biotechnology sector represents a boundary scientific discipline between biology and
technology and field of practice, studying ways and methods of changing the natural
environment of human being in accordance with its needs and uses the methods and techniques
for obtaining useful products with the help of biological agents. The biotechnology sector
encompasses genetics, cellular and environmental engineering.
The sector of medical technology is engaged in invention, development and introduction of
medical innovations to ensure the efficiency, cost effectiveness and overall efficiency of medical
institutions and staff activity. The main goal of this sector is to provide new quality in health care
subsectors or in pharmaceutical manufacturing.
3
Overview of the Global Pharmaceutical Industry.
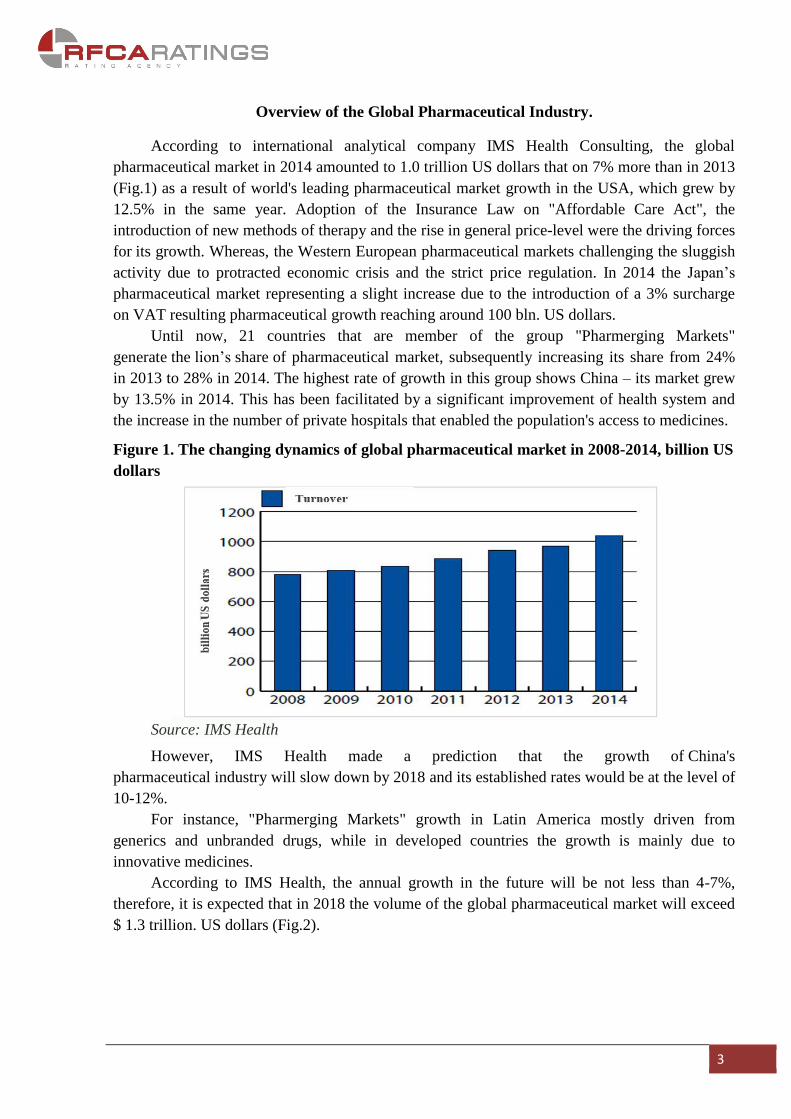
According to international analytical company IMS Health Consulting, the global
pharmaceutical market in 2014 amounted to 1.0 trillion US dollars that on 7% more than in 2013
(Fig.1) as a result of world's leading pharmaceutical market growth in the USA, which grew by
12.5% in the same year. Adoption of the Insurance Law on "Affordable Care Act", the
introduction of new methods of therapy and the rise in general price-level were the driving forces
for its growth. Whereas, the Western European pharmaceutical markets challenging the sluggish
activity due to protracted economic crisis and the strict price regulation. In 2014 the Japan’s
pharmaceutical market representing a slight increase due to the introduction of a 3% surcharge
on VAT resulting pharmaceutical growth reaching around 100 bln. US dollars.
Until now, 21 countries that are member of the group "Pharmerging Markets"
generate the lion’s share of pharmaceutical market, subsequently increasing its share from 24%
in 2013 to 28% in 2014. The highest rate of growth in this group shows China – its market grew
by 13.5% in 2014. This has been facilitated by a significant improvement of health system and
the increase in the number of private hospitals that enabled the population's access to medicines.
Figure 1. The changing dynamics of global pharmaceutical market in 2008-2014, billion US
dollars
Source: IMS Health
However, IMS Health made a prediction that the growth of China's
pharmaceutical industry will slow down by 2018 and its established rates would be at the level of
10-12%.
For instance, "Pharmerging Markets" growth in Latin America mostly driven from
generics and unbranded drugs, while in developed countries the growth is mainly due to
innovative medicines.
According to IMS Health, the annual growth in the future will be not less than 4-7%,
therefore, it is expected that in 2018 the volume of the global pharmaceutical market will exceed
$ 1.3 trillion. US dollars (Fig.2).

4
Figure 2. Global Pharmaceutical Industry outlook and the regional market share 2012-
2018, billion US dollars
Source: IMS Health
In 2015, the Top 10 Global Pharmaceutical Companies in terms of profit there are 4
American, 2 English, 2 German, 1 Swiss and 1 French companies, according to Bloomberg
(Fig.4).
Profit growth analysis report a decline on average by 3.6% in almost all leading companies
within 2014-2015, except for Abbvie Inc. whose profit has grown by as much as 14.5 %. The
total profit of market leader American company Johnson & Johnson in 2015 amounted to 70.1
bln. US dollars which is the highest rate for the third consecutive year among global companies.
As for profit dynamics of pharmaceutical giant (Fig.3) a gradual increase has been
observed over the past decade (2005-2015). Also, depicts reduction in profits during the period
2008-2010 particularly in the midst of global recession. Since 2011 until 2014,
we have been witnessing an increase in profits at a rate of 4.6% for the reporting period.
However, in 2015, there is a decline in profits of Johnson & Johnson by 5.7% to 70.1 billion US
dollars. The downward trend in profits, as already been mentioned, was marked in in most
pharmaceutical companies in 2014-2015.
Figure 3. Global revenue of Johnson & Johnson, 2005-2015. million US dollars
Source: Bloomberg, RA RFCA
50 51453 324
61 09563 747 61 897 61 587
65 030 67 22471 312 74 331
70 074
0
10 000
20 000
30 000
40 000
50 000
60 000
70 000
80 000
2005 2006 2007 2008 2009 2010 2011 2012 2013 2014 2015
5
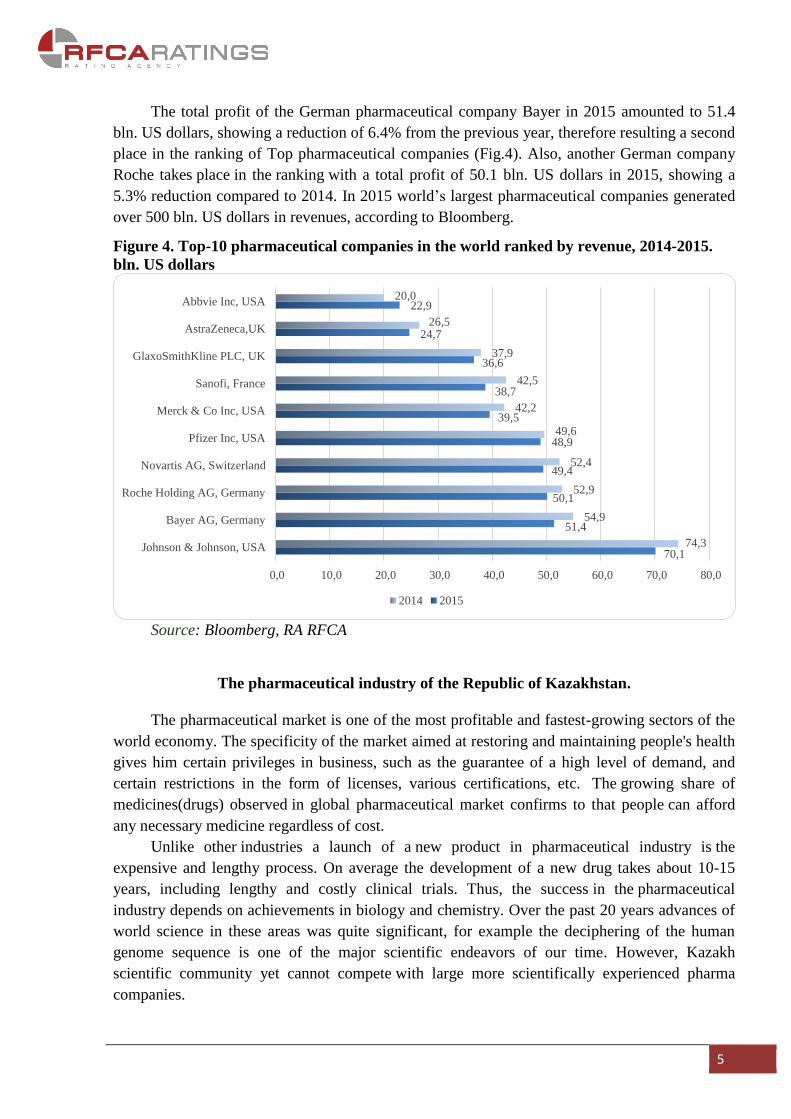
The total profit of the German pharmaceutical company Bayer in 2015 amounted to 51.4
bln. US dollars, showing a reduction of 6.4% from the previous year, therefore resulting a second
place in the ranking of Top pharmaceutical companies (Fig.4). Also, another German company
Roche takes place in the ranking with a total profit of 50.1 bln. US dollars in 2015, showing a
5.3% reduction compared to 2014. In 2015 world’s largest pharmaceutical companies generated
over 500 bln. US dollars in revenues, according to Bloomberg.
Figure 4. Top-10 pharmaceutical companies in the world ranked by revenue, 2014-2015.
bln. US dollars
Source: Bloomberg, RA RFCA
The pharmaceutical industry of the Republic of Kazakhstan.
The pharmaceutical market is one of the most profitable and fastest-growing sectors of the
world economy. The specificity of the market aimed at restoring and maintaining people's health
gives him certain privileges in business, such as the guarantee of a high level of demand, and
certain restrictions in the form of licenses, various certifications, etc. The growing share of
medicines(drugs) observed in global pharmaceutical market confirms to that people can afford
any necessary medicine regardless of cost.
Unlike other industries a launch of a new product in pharmaceutical industry is the
expensive and lengthy process. On average the development of a new drug takes about 10-15
years, including lengthy and costly clinical trials. Thus, the success in the pharmaceutical
industry depends on achievements in biology and chemistry. Over the past 20 years advances of
world science in these areas was quite significant, for example the deciphering of the human
genome sequence is one of the major scientific endeavors of our time. However, Kazakh
scientific community yet cannot compete with large more scientifically experienced pharma
companies.
70,1
51,4
50,1
49,4
48,9
39,5
38,7
36,6
24,7
22,9
74,3
54,9
52,9
52,4
49,6
42,2
42,5
37,9
26,5
20,0
0,0 10,0 20,0 30,0 40,0 50,0 60,0 70,0 80,0
Johnson & Johnson, USA
Bayer AG, Germany
Roche Holding AG, Germany
Novartis AG, Switzerland
Pfizer Inc, USA
Merck & Co Inc, USA
Sanofi, France
GlaxoSmithKline PLC, UK
AstraZeneca,UK
Abbvie Inc, USA
2014 2015

6
In terms of these factors the pharmaceutical market of Kazakhstan (RK) is rather small
(0.1% of the world pharmaceutical market). For instance, the benchmark of FPP consumption
per capita set in high-income countries is 6-12 times far below, that refers on a
growing impact and potential of pharmaceutical market.
By 2015 the volume of the pharmaceutical market in RK exceeds 1.8 bln. US dollars in
retail prices.
The modern pharmaceutical industry in RK originated in the mid-90’s and up to 1994 the
single Public holding company "Pharmacia" was the dominating supplier of drugs and in general
encouraged the public health. Company owned 1 832 pharmacies, including 64 hospital
pharmacies and 1,768 independent pharmacies. Since 1995 the transformation process of
system for supply of medicinal products in RK has begun and continues to the present time.
Major Players at the Pharmaceutical Market of Kazakhstan.
Currently, local pharmaceutical market has 78 large and small-size industrial enterprises,
including local and foreign manufacturers of FPP. Top-10 largest manufacturers of FPP occupy
as little as 95% of all FPP produced in RK in monetary terms.
The leaders of pharmaceutical market are JSC "Chimpharm", JSC "Nobel AFF" and LLP
"JV Globalpharm". The rest of the market is represented by small-size and a full-cycle
pharmaceutical companies, such as LLP "Romat" LLP, "Dosfarm", LLP "Nur-May farm" and
LLP "Karaganda pharmaceutical complex", including enterprise with a complete production
cycle of medical equipment - JSC "Aktubroentgen".
Sales of Chimpharm, Nobel and Globalpharm in 2014 amounted to 61 mln. US dollars, 40
mln. US dollars and 12 mln. US dollars, respectively (Fig.5). In general, the pace of sales of
Kazakhstani producers by 2014 reported a decline that were associated with the devaluation of
the national currency i.e. shortage in domestic demand for “vitamins and antibiotics” group, and
the increased demand for “other medicines and pharmaceutical preparations” group, the price
which is usually lower than the first one. For instance, sales of Chimpharm and Globalpharm
dropped 33.7% to 61 mln. US dollars and 45.5% to 12 mln. US dollars, respectively. Only Nobel
AFF have managed to increase sales by 5.3% to 40 mln. US dollars.
Figure 5. Volume sales of the leading domestic producers mln. US dollars
Source: USAID’s Regional Economic Cooperation Project
92
38
22
5 4 6 4 2 3 2
61
40
12 6 6 4 3 3 2 20
20
40
60
80
100
2013 2014

7
We assume it would be interesting to know what companies were at the root of
pharmaceutical industry and what companies currently determine ascendancy of pharmaceutical
market. In this part of the report we shall cite only a few market-leading companies in RK.
Short description of the leaders of the Pharmaceutical market of Kazkahstan:
1. Chimfarm JSC / Santo Member of Polpharma Group is a company that is part of an
international pharmaceutical group operating in Central and Eastern Europe, Caucasus and
Central Asia. It also owns Shymkent chemical-pharmaceutical plant.
Brief history:
History of the Shymkent chemical-pharmaceutical plant has more than 130 years. In 2003
the plant began to work under the guidance of Santo company.
The plant's production volume, sales volume and a product line are the largest in
Central Asia. The company has two GMP certificate: for the production of medications in bottle,
bags, vials and ampoules.
Currently, every fifth package of FPP sold in Kazakhstan manufactured by Santo Member
of Polpharma Group. Apart from supplying the domestic market the company supply markets of
Russia, Kyrgyzstan, Tajikistan, Mongolia and Turkmenistan.
Company implement large investment campaign aimed at modernization of existing
pharmaceutical production lines, installations and industrial facilities in compliance with
international GMP1 standards, which amounts to about 100 mln. US dollars. In the framework of
this project a new plant for the production of Infusion Bottle and Injection Vials in Shymkent
was built and put into operation.
2. Global Pharm LLP is a company located in Almaty that has a modern pharmaceutical
plant for production of tablets and encapsulated forms of drugs.
Brief history:
The company was established in September 2000 jointly with the major South Korean
pharmaceutical company Han SEO Pharma, known on the pharmaceutical market for over 50
years which produces more than 170 kinds of drugs. The first batch of medicines the plant
produced in April 2002.
Today the plant produces more than 100 kinds of drugs, and production equipment of the
factory meets international standards and includes separate manufacturing units, warehouses of
raw materials and finished products.
At the moment the company is merging with a major international pharmaceutical company
Abdi Ibrahim to strengthen company's position in the market.
3. Nobel AFF JSC - the company owns a highly equipped factory with the capacity of 120
million packs a year located in Almaty. Its product line includes almost all forms of drugs from
tablets and capsules to ointments and suspensions.
Brief history:
The company was found in 2002. In 2004 it launched first 6 products. Currently, the plant
produces more than 60 medicines and 200 pharmaceuticals. The company, one of the first in
Kazakhstan that has GMP certificate.
1 Good Manufacturing Practices - International guidelines provide guidance for manufacturing, testing, and quality assurance in
order to ensure that a food or drug product is safe for human consumption.

8
Generally, in the pharmaceutical market of RK the percentage of the
ownership held directly or indirectly by Kazakh companies in the total number of pharmaceutical
companies is less than 4%. Top 20 pharmaceutical manufacturers in RK include only two
Kazakh companies - Chimfarm, Nobel AFF. The remaining, larger part in the ranking are foreign
companies.
According to e-business-edition "LS" there were over 15 thousand items of domestically
produced FPP, medical devices and medical equipment, 72% of which is produced by foreign
pharmaceutical companies, 17% - by CIS countries and 11% - by local manufacturers (Fig.6).
Thus, the share of Kazakhstani companies in the local pharmaceutical market is quite low.
Figure 6. Structure of FPP by manufacturer in RK (per 15 thousand items of FPP, medical
devices and medical equipment)
Source: electronic business edition «LS»
According to the Eurasian Economic Commission, Top 10 largest foreign pharmaceutical
companies represented in Kazakhstan are Sanofi-aventis (France), Akrikhin (Russia),
GlaxoSmithKline (UK), Nycomed/takeda (Switzerland), Bayer healthcare (Germany), Roche
(Switzerland), Teva (Israel), Pfizer (USA), Johnson & Johnson(USA), Menarini (Italy)(Tab.1).
Table 1. TOP 10 foreign drug producers in Kazakhstan, by volume of sales
Rankin
g Company
The volume of sale
(bln.US dollars)
The volume of sale
(mln. packages )
1 Sanofi-aventis 94 9,9
2 Акрихин 82,8 68,7
3 GlaxoSmithKline 82,7 7,7
4 Nycomed/takeda 81,3 11,7
5 Bayer healthcare 76,2 6
6 Roche 60,7 0,2
7 Teva 52,9 11,2
8 Pfizer 49,9 2,9
9 Johnson & Johnson 46,7 0,9
10 Menarini 43,5 13,9
Source: Eurasian Economic Commission
Currently, only Sanofi fulfills the full cycle of production in RK. It has organized the
production of Essentiale-N ampoules on the basis of "Khimfarm" plant located in Shymkent. By
72%
17%
11%
Foreign countries
CIS countries
Republic of Kazakhstan

9
2020, Sanofi together with Pfizer are planning to organize a full production cycle of 70
pharmaceutical items in RK. Moreover, other major international companies are also tending to
implement its strategic plans for future growth and development and successfully compete in
Kazakhstan.
Pharmaceutical products and preparations in Kazakhstan.
Let us analyze the dynamics of quantitative indicators of the pharmaceutical industry to
determine the role of this sector in the economy of Kazakhstan.
The analysis enabled to discover the following: the share of pharmaceutical industry in
the Manufacturing industry of RK on average is 0.5% for the period 2005-2010. In general, over
the period the share of industry in Manufacturing industry has grown slightly from 0.4% in 2005
to 0.6% in 2015. The highest level of 0.62% was registered during 2012 -2014, and despite the
fact that country has faced financial crisis in 2008 the lowest level of 0.34 % was the highest
ever registered during the period 2005-2009. Due to the fact that chemical products often used in
pharmaceutical manufacturing, we compared the share of pharmaceutical industry with a share
of the chemical industry.
In General, for the period 2005-2015 the proportion of the chemical industry, excluding
petrochemical industry in the structure of the Manufacturing industry has also increased from
2.9% to a record level of 4.2 % and the average share over the past decade was at 3.1%. The year
before the crisis the lowest value of 2.4% is registered in 2007.
Figure 7. Shares of Pharmaceutical and Chemical industry in Manufacturing industry of
Kazakhstan, in 2005-2010, %
Source: Committee of Statistics of RK, RA RFCA
A comparative analysis of related industries in Manufacturing industry showed that the
average share of the chemical industry is 6 times larger than the share of pharmaceutical
industry. Moreover, the share of the pharmaceutical industry from 2010 to 2014 has increased by
only 20%, while the share of the chemical industry increased almost 40% due to the fact that
after the collapse of USSR chemical products were more in demand than pharmaceutical. Strong
0,5% 3,1%
96,4%
Production of essential drugs and
medicines in Total manufacturing
industry, %
Production of chemicals in Total
manufacturing industry, %
Production of other branches in Total
manufacturing industry, %

10
demand for FPP was driven by import, whereas the support of government available for
domestic producers was insufficient. In recent years, state support for pharmaceutical industry is
constantly increasing.
Now, let us consider the dynamics of Index of physical volume (IPV) in the
pharmaceutical industry (Fig.8). In general, over the period 2005-2015, the rise of IPV from 39%
to 101%, except for sharp fluctuations in the crisis and post-crisis years in 2008- 2011. Starting
2008 up to 2009 there are significant increase in IPV from 90% to 146%, then its gradual
decrease to 143% by 2010, and then a sharp fall to 99% in 2011. Within 2012 -2015 there are
insignificant fluctuations at 100%-106%. In general, IPV in the industry and index of production
volume in value terms had multidirectional dynamics. But despite this, we note that the positive
dynamics of the pharmaceutical industry the country is being held until 2015, due to the
combination of such factors like growing consumption of pharmaceuticals, inflation and
currency rate fluctuations.
Figure 8. Dynamics of IPV in the pharmaceutical industry of Kazakhstan in 2005-2015
Source: Committee of Statistics of RK, RA RFCA
Considering the production in value terms (Fig.8), we find that production volumes have
been consistently increasing throughout the period, except for 2014-2015, when there there has
been a decline from 38 bln. tenge (212.3 mln. US dollars) to 31.8 bln. tenge (143.5 mln US
dollars) as a result of devaluation and a reduction of investments in the fixed assets of the
industry by 33% to 10.9 bln. tenge (49.0 mln.US dollars). The largest volume of investments in
in 2012- 2014 amounted to 27.7 bln. tenge (166,2 mln.US dollars). In general, in the framework
of SPFIID 2010-2014 was invested over 30.7 bln. tenge (186.5 mln.US dollars)
into pharmaceutical industry.
In 2008-2009 and in post-crisis years no rapid or unexpected changes in the production
were registered, while year-to-year indicator was around 36%. In 2007-2008 a short-term decline
in production rates was only 3.1%, whereas before it’s been reaching 25% and more (Tab.2).
6,9 8,8 10,9 11,314,9
20,0
27,1
33,936,5 38,0
31,839%
44%
74%
90%
146% 143%
99%106%
100% 103% 101%
0%
20%
40%
60%
80%
100%
120%
140%
160%
0,0
5,0
10,0
15,0
20,0
25,0
30,0
35,0
40,0
2005 2006 2007 2008 2009 2010 2011 2012 2013 2014 2015
Fixed capital investments, bln. tenge
Production of essential drugs and medicines, bln. tenge
Index of physical volume of production, right scale, % compared to previous years
11
Table 2. Production dynamics of the pharmaceutical industry in value terms, 2005-2010.
2005 2006 2007 2008 2009 2010 2011 2012 2013 2014 2015
year-
to-
year
chang
e, %
36,1% 27,5% 24,9% 3,1% 32,0% 34,1% 35,5% 25,2% 7,8% 4,2% -16,3%
Source: RA RFCA
In 2010-2012 in the framework of SPFIID the growth of industry remains sustainable,
however starting 2013 and by 2015 production of pharmaceutical products amounted 16.3%. In
value terms the average growth of the industry was 19.5%.
Thus, investment analysis of the industry suggests that the growth of production volumes
in value terms and volume terms is slowing down, which refer on low economic return of
investments.
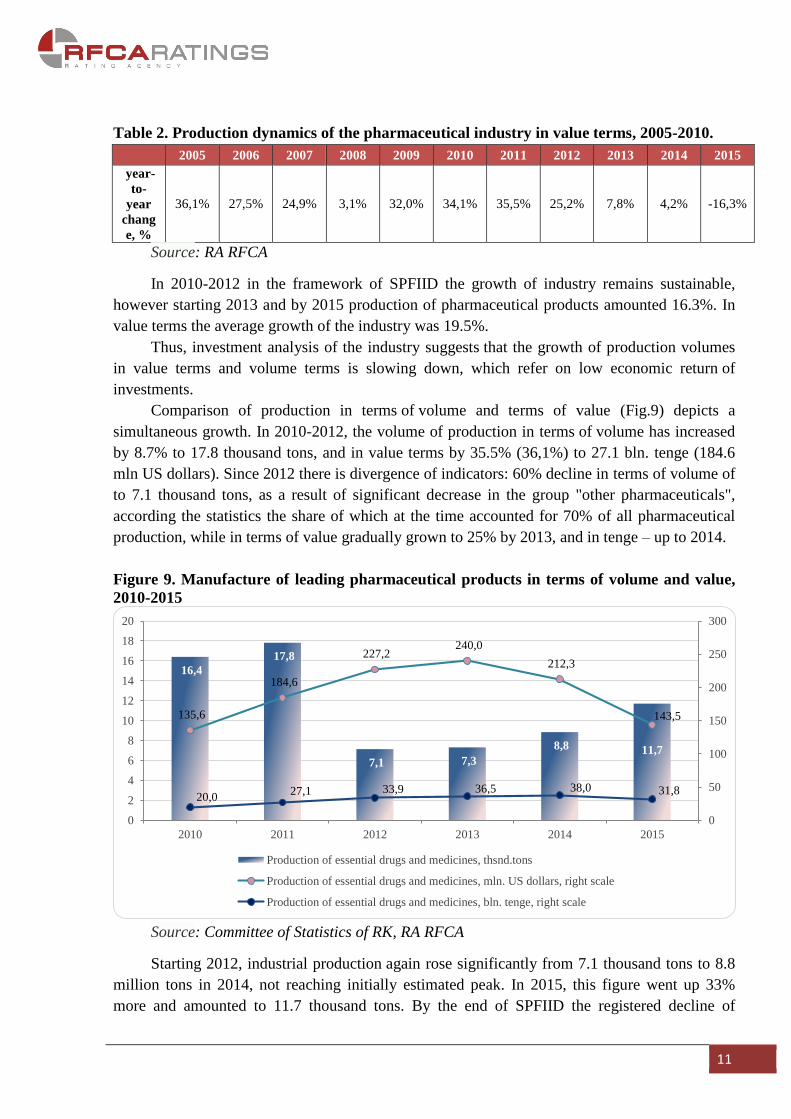
Comparison of production in terms of volume and terms of value (Fig.9) depicts a
simultaneous growth. In 2010-2012, the volume of production in terms of volume has increased
by 8.7% to 17.8 thousand tons, and in value terms by 35.5% (36,1%) to 27.1 bln. tenge (184.6
mln US dollars). Since 2012 there is divergence of indicators: 60% decline in terms of volume of
to 7.1 thousand tons, as a result of significant decrease in the group "other pharmaceuticals",
according the statistics the share of which at the time accounted for 70% of all pharmaceutical
production, while in terms of value gradually grown to 25% by 2013, and in tenge – up to 2014.
Figure 9. Manufacture of leading pharmaceutical products in terms of volume and value,
2010-2015
Source: Committee of Statistics of RK, RA RFCA
Starting 2012, industrial production again rose significantly from 7.1 thousand tons to 8.8
million tons in 2014, not reaching initially estimated peak. In 2015, this figure went up 33%
more and amounted to 11.7 thousand tons. By the end of SPFIID the registered decline of
16,4
17,8
7,1 7,3
8,8 11,7
135,6
184,6
227,2240,0
212,3
143,5
20,027,1 33,9 36,5 38,0 31,8
0
50
100
150
200
250
300
0
2
4
6
8
10
12
14
16
18
20
2010 2011 2012 2013 2014 2015
Production of essential drugs and medicines, thsnd.tons
Production of essential drugs and medicines, mln. US dollars, right scale
Production of essential drugs and medicines, bln. tenge, right scale

12
production in dollar terms amounted to 11.5% and 32.4% by 2015. Up to 2014 production in
terms of national currency continue to grow and by the end of 2015 sharply fallen (38,0 bln.
tenge in 2014 to 31.8 bln. tenge in 2015), possibly due to an end of state support in the
framework of SPFIID and devaluation began in August 2015.
Thus, we observe the following phenomenon in the industry: the lower the output in terms
the volume the higher the production in terms of value, due to price inflation.
If we compare the dynamics of pharmaceutical industry with the dynamics of health in RK
(Fig.10) the total value of health services and social services provided exceeds the value of
pharmaceutical industry within the estimated period in average by 22%. The average share of
health care (11%) for the period exceeds the share of pharmaceutical industry of RK (less than
1%). This is due to the fact that the service sector and the manufacturing sector are very
different, and the range of local FPP is not varied to satisfy domestic demand.
Figure 10. Volume of pharmaceutical products in comparison with the volume of health
care services and social services provided in RK
Source: Committee of Statistics of RK, RA RFCA
Domestic pharmaceutical industry mostly contains generics on the basis of imported
substances and traditional cheap drugs, oriented on the domestic market and CIS market.
The trade balance of the Pharmaceutical market of Kazakhstan.
The domestic pharmaceutical market is mainly characterized by a high import content. In
2015, import of drugs amounted to 932.7 mln. US dollars (22.1 thousand tons), compared with
the previous year, the reduction was 16.8% (31.4% in terms of volume). The reason for the
reduction was the devaluation of the tenge.
Major importers today are (in descending order of imported in 2015): Russia (37%), India
160 188265
313374
440
574
699 721816
883
79
1111
15
20
27
34 3738
32
0
1 000
2 000
3 000
4 000
5 000
6 000
7 000
0
100
200
300
400
500
600
700
800
900
1 000
2005 2006 2007 2008 2009 2010 2011 2012 2013 2014 2015
Manufacturing industry, right scale, bln.tengeHealth care and social services, bln.tengeProduction of essential drugs and medicines, bln. tenge
13
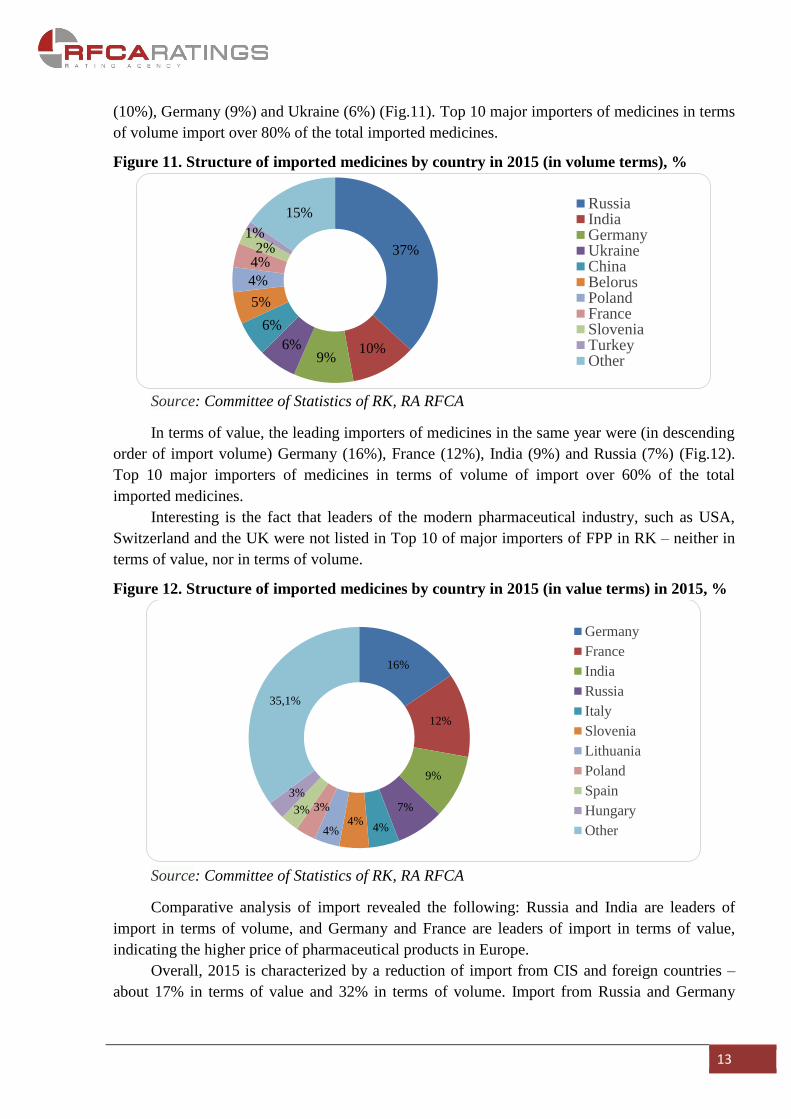
(10%), Germany (9%) and Ukraine (6%) (Fig.11). Top 10 major importers of medicines in terms
of volume import over 80% of the total imported medicines.
Figure 11. Structure of imported medicines by country in 2015 (in volume terms), %
Source: Committee of Statistics of RK, RA RFCA
In terms of value, the leading importers of medicines in the same year were (in descending
order of import volume) Germany (16%), France (12%), India (9%) and Russia (7%) (Fig.12).
Top 10 major importers of medicines in terms of volume of import over 60% of the total
imported medicines.
Interesting is the fact that leaders of the modern pharmaceutical industry, such as USA,
Switzerland and the UK were not listed in Top 10 of major importers of FPP in RK – neither in
terms of value, nor in terms of volume.
Figure 12. Structure of imported medicines by country in 2015 (in value terms) in 2015, %
Source: Committee of Statistics of RK, RA RFCA
Comparative analysis of import revealed the following: Russia and India are leaders of
import in terms of volume, and Germany and France are leaders of import in terms of value,
indicating the higher price of pharmaceutical products in Europe.
Overall, 2015 is characterized by a reduction of import from CIS and foreign countries –
about 17% in terms of value and 32% in terms of volume. Import from Russia and Germany
37%
10%9%
6%
6%
5%
4%
4%2%
1%
15%RussiaIndiaGermanyUkraineChinaBelorusPolandFranceSloveniaTurkeyOther
16%
12%
9%
7%
4%4%
4%
3%3%
3%
35,1%
Germany
France
India
Russia
Italy
Slovenia
Lithuania
Poland
Spain
Hungary
Other

14
decreased by 17.1% and 25.8 % in terms of value, respectively, or 31.4% and 6.3% in terms of
volume, respectively.
Of all the countries of the EEU, Kazakhstan has had the lowest share of local producers in
the market, so the export volumes are negligible compared to the total volume of the market of
the country. Import exceeds export in 65 times, which indicates on the trade imbalance of the
country and poorly developed domestic pharmaceutical production.
In 2015, export of commodity groups such as "antibiotics", "vitamins and their
derivatives", "FPP and other pharmaceuticals» amounted to around 520 tons, which is almost 50
times less than import of the same kinds of pharmaceutical products. The main export market of
RK is Russia. In 2015 export were also carried out to Kyrgyzstan, Belarus and Armenia. For
comparison, in 2014, in terms of value main export countries were Kyrgyzstan (50%), Mongolia
(12%), and Turkmenistan and Switzerland (9%), Uzbekistan (5%) and Russia (4%). In terms of
volume export to Kyrgyzstan amounted to 58%, in Turkmenistan - 14%, Uzbekistan - 13%,
Russia 5% and Tajikistan - 4%.
Supply and Demand in the Pharmaceutical market of Kazakhstan.
According to the official website of Prime Minister of Kazakhstan, in 2015 the total
volume of the pharmaceutical market amounted to 350 bln. tenge (1.6 bln. US dollars), including
140 bln. tenge to provide the Guaranteed Free Medical Care (GFMC), while the share of the
Single distributor in the amount of 140 bln. tenge were 75%. In 2014 the volume of market was
2.3%.
As recommended by WHO the secured amount of domestically-produced medicines in the
country should be 20%. In RK did not meet the WHO standards until 2014. According to
SPFIID 2010-2014 one of its key strategies by 2014 was to improve the share of domestically
manufactured FPP in the pharmaceutical market to 50% in terms of volume, however it was
21%. In 2015, the share of «FPP and other pharmaceuticals» group produced in RK has grown
from 18% to 32%.
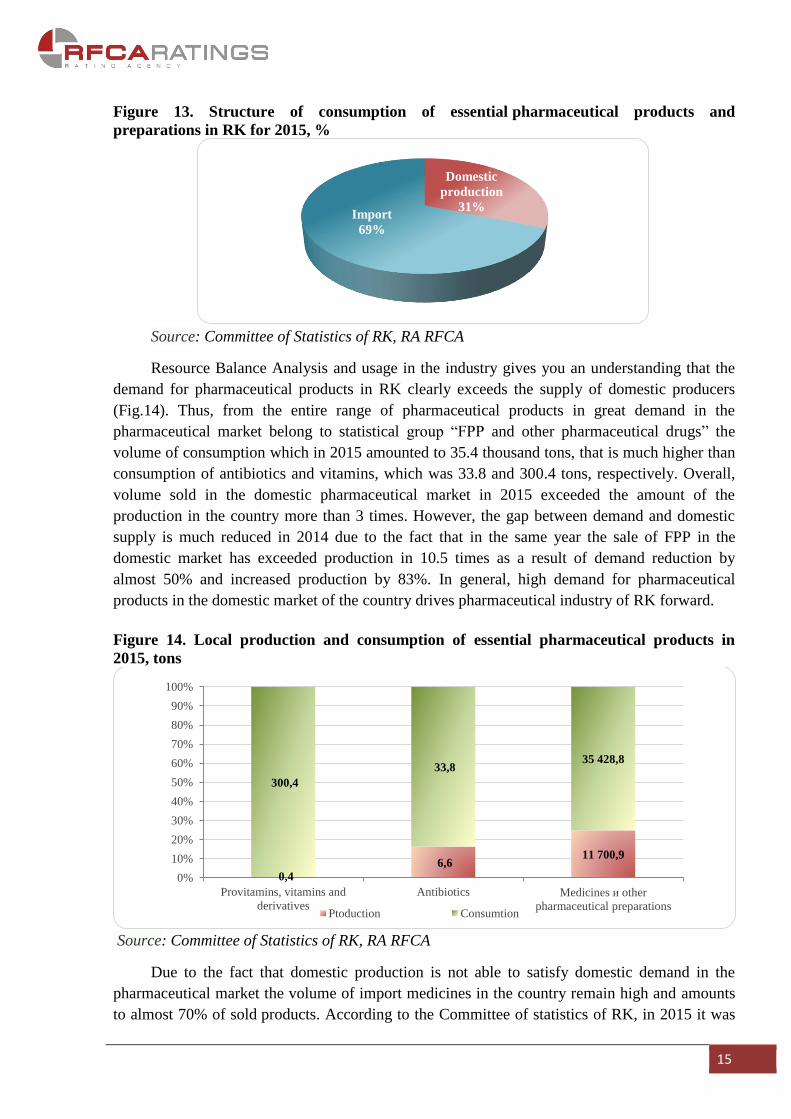
As of 2015 amount of domestically produced essential pharmaceutical products and
preparations in RK was 31%, while imported products – 69% (Fig.13). For comparison, in 2014
the proportion of domestic and imported products was 29% to 71%. That is, despite efforts
undertaken by the state to limit import and to facilitate the development of domestic
pharmaceutical market there has been no significant change in the country in recent years. This
is due to many constraining factors including a lack of quality analogues for several branded
drugs, the lack of a progressive development in the field of domestic pharmaceuticals, the
preferences of consumers toward imported and more expensive medicines, the domination of the
foreign companies in the market RK.
15
Figure 13. Structure of consumption of essential pharmaceutical products and
preparations in RK for 2015, %
Source: Committee of Statistics of RK, RA RFCA
Resource Balance Analysis and usage in the industry gives you an understanding that the
demand for pharmaceutical products in RK clearly exceeds the supply of domestic producers
(Fig.14). Thus, from the entire range of pharmaceutical products in great demand in the
pharmaceutical market belong to statistical group “FPP and other pharmaceutical drugs” the
volume of consumption which in 2015 amounted to 35.4 thousand tons, that is much higher than
consumption of antibiotics and vitamins, which was 33.8 and 300.4 tons, respectively. Overall,
volume sold in the domestic pharmaceutical market in 2015 exceeded the amount of the
production in the country more than 3 times. However, the gap between demand and domestic
supply is much reduced in 2014 due to the fact that in the same year the sale of FPP in the
domestic market has exceeded production in 10.5 times as a result of demand reduction by
almost 50% and increased production by 83%. In general, high demand for pharmaceutical
products in the domestic market of the country drives pharmaceutical industry of RK forward.
Figure 14. Local production and consumption of essential pharmaceutical products in
2015, tons
Source: Committee of Statistics of RK, RA RFCA
Due to the fact that domestic production is not able to satisfy domestic demand in the
pharmaceutical market the volume of import medicines in the country remain high and amounts
to almost 70% of sold products. According to the Committee of statistics of RK, in 2015 it was
Domestic
production
31%Import
69%
0,4
6,611 700,9
300,4
33,835 428,8
0%
10%
20%
30%
40%
50%
60%
70%
80%
90%
100%
Provitamins, vitamins and
derivatives
Antibiotics Medicines и other
pharmaceutical preparationsPtoduction Consumtion

16
imported to 24.2 thousand tons of drugs, which accounted for 68% of the total drugs sold in the
RK (Fig. 15). However, compared with 2014 the decline in the volume of imports of drugs was
61%, despite the fact that domestic production has increased significantly, which is very positive
dynamics in this market.
Figure 15. Import and consumption of essential pharmaceutical products on the
pharmaceutical market of RK in 2015, tons
Source: Committee of Statistics of RK, RA RFCA
Analysis of absorption ratio in the pharmaceutical market shows that sales of drugs on
average amounts to 98.4% (Fig.16). Prior to 2010, this ratio was lower and subsequently
remained at an average of 98.7%. The key driver of pharmaceutical production growth in the
period 2005-2015 was a significant demand in the domestic pharmaceutical market, which has
grown much faster than the development of domestic production.
Figure 16. Absorption ratio of FPP in domestic pharmaceutical market 2005-2015.
Source: Committee of Statistics of RK, RA RFCA
In general, the analysis of this ratio states that a full or partial import substitution for a
number of FPP in the country is not yet possible, due to the fact that local company produce
generics based on imported raw materials and inexpensive traditional FPP, which are oriented on
300,9 27,3 24 246,3
300,4 33,8 35 428,8
0%
10%
20%
30%
40%
50%
60%
70%
80%
90%
100%
Provitamins, vitamins and
derivatives
Antibiotics Medicines и other pharmaceutical
preparations
Import Consumtion
98,8%
97,8%
97,5% 97,5%
98,1%
98,8% 98,8%98,6% 98,6%
98,9%
98,6%
96,5%
97,0%
97,5%
98,0%
98,5%
99,0%
0
20 000 000
40 000 000
60 000 000
80 000 000
100 000 000
120 000 000
140 000 000
2005 2006 2007 2008 2009 2010 2011 2012 2013 2014 2015
Production, thsnd.tenge Import, thsnd.tenge
Domestic distribution, thsnd.tenge Absorbtion ratio, % (right scale)

17
its own market. Such products do not require large capital investments to start production, but as
a result of growing competition in the market it has brought to profitability decline, driven by a
high demand for original products, which in turn are almost 100% imported from Western
Europe.
Profitability in the Pharmaceutical Industry of Kazakhstan.
The pharmaceutical market of RK is the largest and structured in Central Asia and CIS
third largest market, however, it still remains at a low level of development compared with many
countries in Central and Eastern Europe. Despite the positive growth dynamics, pharmaceutical
market is on a relatively low level. Rapid economic growth in the country caused by the rapid
development of oil, gas and mining in 2000’s has become a significant driving force for a
growing sale of pharmaceutical products and Health expenditures.
Currently pharmaceutical companies feel comfortable enough in RK due to the existence
of the Guaranteed Free Medical Care (GFMC), which provides the demand for pharmaceutical
products in any economic environment through public procurement of FPP and medical devices.
The share of public procurement amounts to 43% of the total market of RK, which is the highest
estimated indicator in comparison with other CIS countries, where it amounts to the average of
10-12%, except for Russia, where state expenditures amounts to 30% of the total market. Every
year government of RK spends over 600 mln. US dollars on pharmaceuticals.
Another factor that reflects the potential of pharmaceutical industry in the country and
therefore the attractiveness of the market for investors is maintaining a unique resource base for
FPP and some of the scientific and technical potential in chemistry, medicine and pharmacy.
These parameters of the pharmaceutical market make it a cost-effective, economically viable and
potentially attractive. To ensure these positive aspects of the pharmaceutical industry, we have
analyzed industry profitability indicators (Fig.17).
Global pharmaceutical market is one of the most profitable and fastest growing. Its growth
rate is approximately 6-11% and a net profit is around 18% of total revenue. The increase in
sales of FPP was associated with a general increase of environmental degradation,
population ageing in developed countries, rising income levels in developing countries and the
constant attempts of the world medicine to increase lifespan and healthspan. As for
pharmaceutical industry in RK, its profitability in the period 2005-2010 was uneven: for
instance, up to 2010 the average profitability of the industry was 3.9% and in the period of
SPFIID 2010-2014 average return was 26.2%. In addition, the second year of SPFIID reflected a
sharp short-term increase in profitability to 75.2%, presumably associated with the increase in
public procurement. In 2012, the profitability went down a little below the previous level (the
level of 2010) to 15.2% and then falls below expected thresholds to 11.5% and 11.6% in
subsequent years. In 2013-2014 there was a slight industry profitability growth by 13.8% and in
margin by 0.1%.

18
Figure 17. Profitability of Pharmaceutical industry of the RK, 2005-2014.
Source: Committee of Statistics of RK, RA RFCA
In general, analyzing the profitability of the industry in the period 2004-2015, we have
concluded that starting 2010 pharmaceutical companies has reached a new level of profitability,
not excluding the help of the State, and over the years, index of profitability has grown on
average by 22.3%.
SWOT-analysis of the pharmaceutical market of Kazakhstan.
Summarizing the above, we conclude the overall state of pharmaceutical industry in RK,
its strengths and weaknesses, consider the long-term possibility of its growth and its threats.
So, the strengths of the domestic pharmaceutical market are following features: relatively
high political stability of the country and its favorable geographical location in terms of
availability of biomedical raw materials, potential to export to the CIS markets in the framework
of EEU no VAT for FPPs and active pharmaceutical ingredients (APIs), growing demand for
pharmaceutical products at the expense of public procurement in the framework of GFMC, the
upgrade readiness of industry, and the availability of government support. In addition, in support
of modern pharmaceutical industry, there are various associations and organizations the largest
of which is the Association of "Pharmmedindustry of Kazakhstan", which unites the leading
domestic pharmaceutical companies and actively cooperates with state authorities: The Ministry
of health of Kazakhstan, the Ministry for investment and development of Kazakhstan and others.
The weaknesses of the market, limiting its development are: high level of import
dependence, namely, domination of Indian, Turkish and EU companies in the domestic
pharmaceutical market; low export potential due to inconsistency of domestic enterprises to
- 41,0715,0 314,0 656,0 669,1
4 283,1
18 748,0
6 683,2
4 038,54 594,5
-0,5%
6,9% 3,4% 5,1% 4,3%
17,3%
75,2%
15,2%11,5% 11,6%
-10%
0%
10%
20%
30%
40%
50%
60%
70%
80%
-5 000,0
0,0
5 000,0
10 000,0
15 000,0
20 000,0
2005 2006 2007 2008 2009 2010 2011 2012 2013 2014
Earnings (loss) before tax, mln.tenge Profitability, %

19
GMP requirements (currently 9 production sites at five companies have a compliance with GMP
standard); lack of skilled staff able to work in accordance with international standards and
overall shortage of specialists in the pharmaceutical industry; shortage of free credit resources;
lack of modern production technologies; long-term procedure of drug registration; significant
share of public procurement toward expensive original preparations versus generics; all players
in the retail market, including distributors and consumers looking at importing drugs.
Despite these challenges historically existing in the pharmaceutical industry of RK and
weakening of the tenge, domestic pharmaceutical market remains an important market
with a wealth of opportunities for growth and sustainable development, even in crisis. In this
regard, we consider opportunities of market development in RK.
An upcoming so-called "patent failure" may give an opportunity for domestic
pharmaceutical companies to produce new generics, due to expiration of the patent on original
drugs.
The economic crisis, the policy of "free-floating tenge" both may have a higher impact on
a local producers and due to rising prices refocus a larger number of consumers toward imported
products.
There are also real opportunities to expand export toward EAEC in the framework of the
agreement on single pharmaceuticals market, as well as growing number of manufacturers that
meet the highest quality standards (GMP, GCP, etc.).
Growing funding of Health sector and access to a qualified medical assistance can lead to
a growing demand for modern, high-quality generics and affordable generic medicines.
The key drivers of pharmaceutical industry of RK are the following factors:
- constantly increasing number of diseases increases drug and medicine demand;
- increased old age threshold, mainly in cities
- transition of the disease into its chronic and protracted form;
- the emergence of new forms of virus and viral infections;
- State support.
The government on an annual basis implement a broad range of programs and projects
aimed at improvement of pharmaceutical industry of RK, these programs are
"Program on development of pharmaceutical industry of Republic of Kazakhstan for 2010-2014”
in the framework of SPFIID, The State Program of Healthcare Development "Salamatty
Kazakhstan" for 2011-2015, State program of the RK healthcare development "Densaulyk" for
2016-2020.
Global pharmaceutical market is a very dynamic market that has a volatile nature of
development and has an indirect impact on pharmaceutical market of RK. The pharmaceutical
market usually responds immediately to changes in the demographic component of the country,
morbidity statistics etc. Therefore, the situation in the pharmaceutical market can radically
change, for example, the massive spread of new diseases or new treatment methods that do not
require drugs. So, what is the near future of pharmaceutical industry in RK? What changes in the
economy and in the world will affect or already affecting the industry? We tried to give our
short-term forecast of the future of the pharmaceutical industry in RK.

20
Forecast
Over time, the pharmaceutical market in RK can be divided into “the market before the
devaluation” and “market after the devaluation” of tenge. The devaluation has resulted price
growth established in domestic pharmaceutical market by 31.1%, despite attempts of State to
curb rising prices and also brought to decline in demand for pharmaceutical products and in
overall production and shortage of import. Though, the reduction of the import supplies is a good
impetus to increase production and expand the range of pharmacological preparations in
domestic pharmaceutical market.
In addition, the weakening of tenge has crossed all the forecasts regarding industry
development, that were previously made by international organizations like IMS Health
Consulting, USAID, etc. In this regard The Association of International Pharmaceutical
Manufacturers (AIPM) has predicted shrinkage of pharmaceutical market by 20% to 1.4 bln. in
2016, while USAID has predicted that pharmaceutical market in RK will reach 2.3 bln. US
dollars by 2016, which is highly unrealistic in terms current financial crisis and devaluation,
resulting in considerable price rise by 10-15% for domestic goods and 40%-60% on foreign
goods.
As for pharmaceutical market, we believe it’ll decrease by 6-10% to 1.6-1.7 bln. US
dollars in retail prices. As for the volume of pharmaceutical production in terms of value we
forecast decrease by 7%, thus production volume in 2016 could amount to at least 29.8 bln.
tenge. (83.5 mln. US dollars2). In subsequent years, we forecast average growth of production
volumes by 104.5%, with an average growth of manufacturing by 104.7%, in the period of 2016-
2020. We do not expect a significant growth of pharmaceutical industry share in the total
Manufacturing industry. In our opinion, the share of the pharmaceutical industry is expected to
0,50-0,56%. These indicators would be undermined by confluence and juxtaposition of
medicine markets in the framework of EAEU and restrictions imposed on over-the-counter
release of drugs and other pharmaceutical products. In terms of profitability there would be a
stabilization at 11%-9% in the next 5 years.
However, these not comforting forecasts are mainly concerned pharmaceutical markets of
CIS, including Kazakhstan. In 2015 all these countries to some extent were facing financial
instability, which have changed its pharmaceutical industry for the worse. As for the global
forecast, according to the report "Global Outlook for Medicines Through 2018" published by
IMS Institute for Healthcare Informatics the global pharmaceutical market is forecast to increase
to 1.2 trln. US dollars by 2016 and to 1.5 trln. US dollars by 2020 (for comparison, in 2013 the
market volume was 971 bln. US dollars) and by 2018 total spending on medicine will reach
almost 1.3 trln. US dollars (30% more versus 2013). According to IMS Health the key drivers of
global pharmaceutical industry growth in the next five years will be: introduction of new
specialized medicines, especially, drugs for cancer prevention and medicines to combat new
viruses like Ebola, MERS, etc.; improved medicines availability for patients; rise in income in
rapidly developing countries, resulting greater consumption of more expensive and qualitative
medicines; lower pressure on pharmaceutical companies in the developed pharmaceutical market
2 Is the average US dollar exchange rate against tenge, according to official exchange rate information of the
National Bank of Kazakhstan for January, February, March 2016.

21
that are not covered under patent protection. An important driving force of global demand for
medicines would be the demographic trend of chronic diseases and diseases associated with the
aging of the population. As for emerging pharmaceutical markets the key drivers for its growth
will be both factors - growing population and improved access to health care
and treatment services. Moreover, pharmaceutical market is expanding significantly
at the expense of rapidly growing segment of biologically active supplements (BAS) and the
segment of generics – cheap analogues of known drugs. Nowadays, the overall share of generics
in pharmaceutical markets of USA, UK, Canada and Germany has already reached 30% and,
according to experts will increase further.
Biomedicine in Kazakhstan.
Main task of Biomedicine is to serve the pharmaceutical industry and overall healthcare
system.
In recent times, bio-medical technology – is one of the most promising trends in modern
medicine and the economy, which is capable of solving the most challenging tasks facing the
pharmaceutical, health care and pharmaceutical industry. Accelerated development of
Biomedicine was established in USA, EU, South Korea and Japan. These countries actively use
Biomedicine for the treatment of diseases such as cartilage defects, compound fractures,
extensive burns, peptic ulcer disease, myocardial infarction and cancer. In the field of
Regenerative medicine there are improvements in creation of bioengineered organs.
For instance, USA and Europe develop biotechnology sector for a long period of time,
whereas in RK this sector of research is still very young, which was launched in 2006, in the
framework of Business Road Map for development of Biomedical in Kazakhstan by 2030. The
aim of the program was to transform this sector into a profitable business and to prepare highly
qualified personnel, in this regard best students and staff would have regularly follow training
programs in USA, Russia, Israel, South Korea and France. Government has allocated huge
funds for the development of biotech companies, research centers and institutions to create a
shared biotech cluster.
Further development of biomedical technologies could bring country's pharmaceutical
production to a new level due to the fact that vast territory of Kazakhstan is rich of wild plants
for the pharmaceutical industry. During Soviet times, Kazakhstan and Central Asia supplied 80%
of wild plants for pharmaceutical manufacturers.
Thus, the key factors of pharmaceutical market growth in RK could be intensive expansion
of BAS segment and generics segment, the transition from traditional synthetic drug
manufacturing to biotechnology and plant-derived medications, which share, according to WHO
forecasts, in the next ten years will exceed the total volume of medicines by 60%.
In general, further development of pharmaceutical industry in RK is possible through the
development of phytochemical production, due to a unique resource base of medicinal plants in
the country, as well as considerable scientific and technical potential in the field of chemistry,
medicine and pharmacy, and also domestic producers traditionally oriented on intermediate
output of medicinal plants.

22
Published by JSC Rating Agency of the Regional Financial Center of Almaty (Rating Agency of the RFCA)
Any form of copying, reproduction, distribution and forwarding of texts, graphs and other types of materials posted
on the website of the "Rating Agency of the RFCA" must be accompanied by a hyperlink to the website
www.rfcaratings.kz and indication of the author of the material.
Copyright JSC Rating Agency of the RFCA 2016
JSC Rating Agency of the RFCA
136 Dostyk avenue, Floor 9
Business Center Pioneer
050051 Almaty
Telephone: (727) 224 48 41, 224 48 44
Fax: (727) 224 48 41
E-mail: [email protected]
Website: http://www.rfcaratings.kz