Biomass and Productivity Determination of Algae in the ... · biomass and productivity...
37
BIOMASS AND PRODUCTIVITY DETERMINATION OF ALGAE IN THE GREAT LAKES PREPARED FOR Working Group II of the Water Management Steering Committee Ministry of the Environment The Honourable Keith L. Norton Q.C., Minister Gerard J. M. Raymond Deputy Minister
-
Upload
phungkhanh -
Category
Documents
-
view
221 -
download
0
Transcript of Biomass and Productivity Determination of Algae in the ... · biomass and productivity...

BIOMASS AND PRODUCTIVITY
DETERMINATION OF ALGAE
IN THE GREAT LAKES
PREPARED FOR
Working Group II
of the Water Management
Steering Committee
Ministryof theEnvironment
The HonourableKeith L. Norton Q.C., Minister
Gerard J. M. RaymondDeputy Minister

Copyright Provisions and Restrictions on Copying:
This Ontario Ministry of the Environment work is protected by Crown copyright (unlessotherwise indicated), which is held by the Queen's Printer for Ontario. It may bereproduced for non-commercial purposes if credit is given and Crown copyright isacknowledged.
It may not be reproduced, in all or in part, for any commercial purpose except under alicence from the Queen's Printer for Ontario.
For information on reproducing Government of Ontario works, please contactServiceOntario Publications at [email protected]

BIOMASS AND PRODUCTIVITYDETERMINATION OF ALGAE
IN THE GREAT LAKES
prepared for:Working Group II
of the Water ManagementSteering Committee
By: P.B. KaussM. GriffithsGreat Lakes SectionWater Resources BranchJanuary, 1982.

NOTE
The receiving water assessment techniques presented in this report describe themethods commonly in use within the Ministry. Alternative techniques exist and/or willeventually be developed. Consultation with Ministry of the Environment staff isadvisable to determine the suitability of the alternative techniques.
Reference to equipment brand names or suppliers in this report is not to be interpretedas an endorsement by the contributing authors, or by the Ministry of the Environment.
Copyright, 1981, Her Majesty the Queen in Right of Ontario
For permission to republish, contact:S. E. Salbach, Ministry of the Environment,135 St. Clair Ave. W., Toronto M4V 1P5

SUMMARY
This report presents a brief overview of eutrophication - related algal biomass increasesin the Great Lakes and their relationship to such water quality problems as: taste andodour and clogging of filters at water treatment plants, oxygen depletion, alteration ofaquatic habitat, aesthetic impairment and toxicity.
The majority of the report deals with a review of methods available for the assessmentof algal biomass and productivity, and, for illustration, relates methods employed bythe MOE Great Lakes Surveys Unit in the nearshore of Lake Ontario. The applicationof data gathered by these methods in the categorization of lake trophic status is alsobriefly discussed.

TABLE OF CONTENTS
PageSUMMARY (i)TABLE OF CONTENTS (ii)LIST OF TABLES (iii)A. PROBLEMS RELATED TO ALGAL BIOMASS INCREASES 1
1. Cause 12. Effects 1
(a) Taste and Odour Problems 2(b) Clogging of Intake Filters 3(c) Oxygen Depletion 3(d) Alteration of Aquatic Habitat 4(e) Aesthetic Impairment 5(f) Algal Toxicity 5
B. ASSESSMENT OF THE PROBLEM 101. Assessment Techniques: Phytoplankton 10
(a) Sampling Regime 10(b) Biomass Estimation 12
(i) Enumeration and Volume 12(ii) Photosynthetic Pigments 12(iii) Weight (Biomass) 14(iv) Cellular Constituents 15(v) Conversion Factors 15
(c) Productivity Estimation 17
2. Assessment Techniques: Attached Algae (e.g. Cladophora) 19(a) Sampling Regime 19(b) Biomass Estimation 20
(i) Weight/Cellular Constituents 20(ii) Photosynthetic Pigments 20
(c) Productivity Estimation 20
C. APPLICATION OF DATA 21References Cited 25Appendix 29
-ii-

LIST OF TABLES
PAGE
1. Algal species Related to Water Quality Problems 7
2. General Ranges of Primary Productivity of Phytoplankton and Related Characteristics of Lakes of Different Trophic Categories 24
3. Comparison of Primary Productivity and Related Parameters for the Great Lakes 25
-iii-

A. PROBLEMS RELATED TO ALGAL BIOMASS INCREASES
1. Cause
Point sources (municipal and industrial), diffuse sources (land runoff,groundwater), the atmosphere (wet and dry precipitation) and shoreline erosionall have the potential to accelerate the input of nutrients (e.g. nitrogen andphosphorus) to the Great Lakes (Andren et al, 1977; Chapra and Sonzogni,1979). Cultural eutrophication, or the manifestations of an increase in the inputrate of nutrients (notably phosphorus) from human activities, has beenidentified as a major causative factor in the algal (planktonic and attached) andmacrophyte biomass increases in the lower Great Lakes. Of specific concern areloadings derived from municipal point sources (e.g. sewage treatment plants),which are believed to mainly contain biologically available phosphorus (Millardet al., 1979). Cognizant of the relationship between phosphorus andeutrophication, the water management strategies encompassed in the GreatLakes Water Quality Agreement of 1978 included provisions for stringent controlof phosphorus arising from human sources.
With the aid of empirical models presently being developed for the Great Lakes,it should be possible to predict algal biomass response to anticipated reductionsin phosphorus inputs. Adequate ground truth information is essential, however,for successful calibration of these models.
2. Effects
The many objectionable effects of algae, particularly the blue-greens, can betraced to the following characteristics (Prescott, 1968):
1. Their rapid rate of multiplication under favourable conditions.
-1-

2. The pseudovacuoles of some blue-green algae, which cause them to floathigh in the water and to concentrate at the surface where they aredestroyed by intense light.
3. The mucilaginous sheaths of some species (e.g. blue-greens), whichcause them to aggregate and form floating mats.
4. The high protein content of some algae, responsible for offensive odorsand tastes.
5. Their ability to produce and give off antibiotics and toxins.
Generally, a decrease in the N:P (nitrogen:phosphorus) ratio in the waterfavours development of vacuolate, nitrogen-fixing blue-green algae that aremost objectionable from a water quality standpoint. Conversely, an increase inthe N:P ratio, such as that anticipated from phosphorus control programs, isbelieved to shift the algal species composition to decreased numbers and morefavourable forms (e.g. green algae).
Major problems associated with eutrophication and excessive algal biomassinclude:
(a) Taste and Odour Problems
When alive, abundant growths of certain algal species can impartdisagreeable tastes and odours to waters used for domestic supply. Algaeresponsible for taste and odour problems are largely found in theblue-green, diatom and chrysophyte groups, although some species ofgreen algae may also be involved. Examples from these groups are givenin Table 1. Tastes associated with algae can be sweet or bitter, andproduce a dry, oily or metallic sensation on the tongue. Odours dependboth on the species and its abundance, and can be aromatic, grassy,musty, spicy, fishy, septic, or geranium -, cucumber-, muskmelon-,nasturtium-, or violet-like (Palmer, 1962). When highly proteinaceousalgae die and decompose, they may produce an even more objectionableodour. For example, extensive growths of Cladophora and other large
-2-

filamentous algae detached from their substrate by wave actionaccumulate on shores and, through decomposition, generate septicodours.
(b) Clogging of Intake Filters
If present in sufficient numbers, species from any of the algal groups cancause economic loss by clogging screens and sand filters in water supplysystems. Records of the Belleville Water Treatment Plant show that priorto 1978 and the implementation of phosphorus control in the Bay ofQuinte, microstrainers were in use 4-5 months of the year, as opposedto only a few weeks during 1978 and 1979 when phytoplankton densitieshad declined by 50-60 % (Nicholls, 1980).
In some instances, the algal groups involved may be the same as thosementioned for taste-and odour-producing algae, although the speciesinvolved need not necessarily be the same as those listed in Table 1. Ofnote are the diatoms (Bacillariophyceae), whose resistant siliceous wallscan form layers over sand filters, thus facilitating the collection of organicmatter and the development of a thick mat of filamentous algae(Aufwuchs) which can completely obstruct the filter (Prescott, 1968).
c) Oxygen Depletion
Highly productive areas such as the central basin of Lake Erie andAdolphus Reach of the Bay of Quinte in Lake Ontario are both highlyproductive and experience hypolimnetic oxygen depletion duringstratification in the summer (Charlton, 1979; Great Lakes Water QualityBoard, 1979). Dense algal populations can exert a substantial oxygendemand on the water column, due to algal cellular respiration ordecomposition of detrital material (e.g. dead algal cells).
These are not the sole determinants of hypolimnetic oxygen depletion ineutrophic lakes, since that condition is also dependent on other variablessuch as lake depth and shape, water level, flushing rate and the thicknessof the epilimnion and hypolimnion. Lake productivity and other possible
-3-

factors have also been linked with metalimnetic oxygen minima in LakeOntario (Boyd, 1980). This condition was evident in the generally moreproductive nearshore waters (Stadelman et al., 1974) and was mostpronounced in the highly productive northeast corner of the lake near theSt. Lawrence River outlet (Glooschenko et al., 1974).
(d) Alteration of Aquatic Habitat
Since embayments and littoral zones receive the bulk of point and diffusesource inputs (land runoff, groundwater, shoreline erosion), these areasrespond initially and may undergo significant changes in theirenvironmental conditions, and, as a result, in their biota.
As lakes become more productive and their hypolimnia undergo periodsof oxygen reduction and increases in the metabolic products of microbialdecomposition, the number of organisms adapted to these conditionsdecreases dramatically. For example, the littoral zone normally consistsof a rich benthic fauna with high oxygen demands, whereas the profundalzone is more homogeneous and becomes more so (as may the littoral) asproductivity increases and species diversity decreases.
However, since predation as well as competitive pressures for availablenutrients are considerably reduced, the biomass of surviving species mayincrease. This was the case in the western basin of Lake Erie, in which theless tolerant insect larvae were eliminated (e.g. Hexagenia) or reducedin numbers (eg: Chironomidae), with a concomitant increase in moretolerant forms (e.g. Tubificidae). A similar change was noted in the Bayof Quinte; Johnson and Owen, 1971).
Fish composition also changes dramatically during eutrophication: fromsalmonid and coregonid species with quite stringent oxygen (high) andthermal (low) requirements towards more tolerant warmwater species(eg: cyprinids). Other changes associated with eutrophication, such aschanges in the littoral zone, food sources and increased organicdeposition, may also affect the reproductive success of fish populationsby reducing survival of the young.
-4-

(e) Aesthetic Impairment
Increased primary production due to cultural eutrophication mayeventually lead to adverse effects on the aesthetics of lakes which areextensively used for swimming, boating, fishing, etc. This is particularlyevident in the nearshore of Lakes Erie and Ontario, where extensivegrowths of the attached green alga Cladophora (Shear and Konasewich,1975) or of macrophytes are a continuing problem. Also, a number ofspecies (see Table 1) of free-floating algae accumulate at times to formloose, visible aggregations called "blooms" which may cover large areasand reduce water clarity, produce unpleasant odours, interfere withreaeration, release toxins and/or deplete oxygen as a result of cellularrespiration or decay of the bloom.
(f) Algal Toxicity
Exotoxins and/or endotoxins produced by some species of freshwateralgae have been implicated in adverse effects on both man and animals.As shown by Table 1, these algae are primarily blue-greens, butrepresentatives of the green and dinoflagellate algae have also beenshown to contain toxins (Prescott, 1968).
While algal toxins have been shown to be lethal to some fish species inlaboratory tests and acute and often fatal poisonings of birds anddomestic animals have been recorded after their drinking from watersupplies (e.g. ponds) containing dense algal blooms, such toxicityproblems are not expected in the Great Lakes nearshore, with thepossible exception of confined embayments.
-5-

TABLE 1. Algal Species Related To Water Quality Problems In Freshwater Lakes.
(adapted from Palmer, 1962a, Prescott, 1963b and Taylor et al., 1981c)
T & O = Taste- and odour-producing algaFC = Filter-clogging algaAN = Aesthetic nuisance algaT = Toxic alga
Algal Species Associated Problems Source
Blue-Green Algae (Cyanophyceae):
Anabaena circinalis T & O, T a,bAnabaena flos-aquae FC, T a,bAnabaena inaequalis T bAnabaena lemmermanni T a,cAnabaena limnetica T bAnabaena Nadsonii T bAnabaena planctonica T & O, AN a,cAnabaena Scheremetievi T bAnabaenopsis sp. T & O cAnacystis cyanea T & O aAnacystis dimidiata (Chroococcus turgidus) FC aAphanizomenon flos-aquae T & O, T, AN a,b,cAphanothece nidulans T bAphanothece cyanea T bCoelosphaerium Kuetzingianum T & O, T, AN cCylindrospermum musicola T & O aGloeotrichiae chinulata FC, T a,bGomphosphaeria lacustris, kuetzingianum type T & O, T aLyngbya Birgei T bLyngbya contorta T a,c
-6-

Table 1: cont'd
Lyngbya limetica AN cMicrocystis aeruginosa T & O, T, AN a,b,cMicrocystis flos-aquae T a,cMicrocystis toxica T a,bNodularia spumigena T a,bOscillatoria amphibia FC a,cOscillatoria chalybya FC aOscillatoria curviceps T & O aOscillatoria ornata FC aOscillatoria princeps FC a,cOscillatoria pseudogeminata FC aOscillatoria rubescens FC aOscillatoria splendida FC aOscillatoria tenuis T & O cRivularia dura FC aRivularia haematites T & O a
Green and Yellow-Green Algae (non-motile Chlorophyceae, etc):
Actinastrum sp. T & O cChara vulgaris T & O aChlorella sp. T & O, T c,bChlorella pyrenoidosa FC aCladophora aegagropila FC aCladophora insignis T & O aClosterium moniliferum FC a,cCosmarium portianum T & O aDichotomosiphon tuberosus FC aDictyosphaerium ehrenbergianum T & O a,cDictyosphaerium pulchellum FC a,cGloeocystis planctonica T & O a,cHydrodictyon reticulatum T & O, FC aMougeotia sphaerocarpa FC a
-7-

Table 1 : cont'd
Nitella gracilis T & O aPalmella mucosa FC aPediastrum tetras T & O a,cScenedesmus sp. T bScenedesmus abundans T & O a,cSpirogyra majuscula T & O aSpirogyra porticalis FC aStaurastrum paradoxum T & O a,cTribonema bombycinum FC aUlothrix sp. T & O aUlothrix variabilis FC aZygnema insigne FC a
Diatoms (Bacillariophyceae):
Asterionella formosa (A. gracillima) T & O, FC, AN a,cCyclotella compta T & O a ,cCyclotella meneghiniana FC a,cCymbella ventricosa FC a,cDiatoma vulgare T & O, FC a,cFragilaria construens T & O a,cFragilaria crotonensis FC a,cMelosira sp. T & O cMelosira granulata FC a,cMelosira varians FC aMeridion sp. T & O cNavicula graciloides FC aNavicula lanceolate FC a,cNitzschia palea FC a,cPleurosigma sp. T & O cStephanodiscus binderanus FC aStephanodiscus hantzschii FC a,cStephanodiscus niagarae T & O a,cSynedra acus FC a,c
-8-

Table 1 : cont'd
Synedra acus var. radians (S. delicatissima) FC a,cSynedra ulna T & O a,cSynedra pulchella FC a,cTabellaria fenestrata T & O, FC a,cTabellaria flocculosa FC a,c
Pigmented Flagellates (motile Chlorophyceae,Chrysophyceae, Dinophyceae, Euglenophyceae):
Ceratium hirundinella T & O, FC a,cChlamydomonas globosa T & O a,cChrysosphaerella longispina T & O aCryptomoras erosa T & O a,cDinobryon divergens T & O a,cDinobryon sertularia FC a,cEuglena sanguinea T & O aEudorina sp. T & O cGlenodinium palustre T & O aGonium sp. T & O cGonyaulaxca tenella T bGymnodinium brevis T bMallomonas caudata T & O a.cPandorina morum T & O a,cPeridinium cinctum t & O acPeridinium wisconsinense FC a,cSynura uvella T & O a,cTrachelomonas crebea FC a,cUroglenopsis americana T & O aVolvox aureus T & O a
-9-

B. ASSESSMENT OF THE PROBLEM
Below is a general outline of procedures employed by the Great Lakes SurveysUnit on Lake Ontario, as well as some brief comments on other possiblemethods. These procedures represent the application of general principlesoutlined in manuals or papers by Strickland (1960), Strickland and Parsons(1968), Tailing and Driver (1963), Vollenweider (1969) and Carnes and Millner(1980). Such references are highly recommended since it is recognized that ourmethods may not be applicable to inland lake studies without modification. Inmany instances, the equipment will not need to be as extensive or elaborate.
1. Assessment Techniques: Phytoplankton
Biomass is the weight of all living material per unit area (or volume) at a givenpoint in time. In the case of phytoplankton, biomass is equivalent to standingcrop. Since biomass reflects the availability of nutrients,(e.g. culturaleutrophication) seasonal population fluctuations, and cropping losses, itsestimation is essential in any analysis of aquatic plant populations or ofproductivity dynamics.
Numerous methods have been used to evaluate the biomass and productivityof phytoplankton, including: enumeration, volume, wet (fresh) weight, carboncontent, carbon fixation, photosynthetic pigments, energy as heat ofcombustion, ATP*, and the rates of exchange of oxygen and carbon dioxide.
(a) Sampling Regime (see Appendix for sampling apparatus)
Sampling should utilize depth-integrated methods to yieldvolume-weighted biomass estimates for the water column. In thenearshore, depth sampling along transects has been found useful indelineating inshore-offshore gradients which may be present, whereasstation grids are preferable in harbours or embayments.
_________* Adenosine -5'-triphosphate
-10-

The approximate depth(s) of phytoplankton peak abundance at a stationand hence, the sampling depths, are determined by initial depth profilingof chlorophyll a and turbidity using a flow-through equipped fluorometerand turbidimeter. The maximum sampling depth for productivity studiesis determined with the aid of a visible light profile. In temperate waters,this is usually the compensation depth (where available light is 1% of thesurface intensity), but if the mixed layer is much deeper than this, thenbiomass could be underestimated and productivity overestimated due tocirculation of phytoplankton in deeper waters - hence the need for apreliminary chlorophyll a profile determination.
A sufficient volume of water is also taken from each depth to allow foranalysis of the following physical and chemical parameters: temperature,dissolved oxygen, total and dissolved phosphorus, Kjeldahl nitrogen,ammonia, nitrite, nitrate, dissolved silica, chlorophylls a and b (correctedand uncorrected for degradation products), total and inorganic carbon,alkalinity and pH. (The latter three parameters are important for primaryproduction determinations and calculations). Samples are also taken andpreserved for later phytoplankton enumeration, speciation and biomassestimates. In addition, primary productivity is determined for each depthby use of the 14C - light and dark bottle method outlined later (see"Productivity Estimation").
Sampling frequency is dictated by local conditions. For example, duringthe summer, the Great Lakes nearshore is affected by frequentupwellings which can affect stratification and, hence, verticalphytoplankton distribution (Bowers, 1980). Therefore, intensive sampling(e.g. weekly or more frequently if possible) is essential, and should bedone in conjunction with continuous monitoring of the thermal regime(using in-situ temperature recorders) in order to relate biomass changesto dynamics of the nearshore. However, during the winter, when iceconditions often preclude sampling by vessel, isothermal conditionspermit more or less complete mixing of the nearshore (horizontally andvertically) so that samples obtained from water intakes are adequate forthe assessment of nutrient and phytoplankton status. Smith and Shapiro(1981) have emphasized that models (e.g. chlorophyll total phosphorus)intended for predictive purposes be based on data collected during
-11-

summer months when algal biomass is most closely related to nutrientconcentration.
(b) Biomass Estimation
(i) Enumeration and Volume - Numbers are perhaps the bestqualitative expression of phytoplankton populations(Vollenweider, 1969) and differentiation among species andof organisms from detrital particles. This is usually done ona preserved sample of known volume which has beenconcentrated by sedimentation (Utermohl, 1958) or on livesamples concentrated by centrifugation or collected on amembrane filter (Holmes, 1962). Cell numbers have alsobeen determined using electronic dimensional particle-counters (eg: Coulter counter).
However, numbers do not yield a true index of biomassbecause species vary greatly in cell or colony size and,hence, volume and weight. Electronic counters can alsoyield information about particle volumes but are unable todistinguish between organic detritus, inorganic material andplankton. Therefore, the preferred biomass estimate, andthe one used by this Unit, is to multiply the number ofindividuals of each species by their average cell volume(determined from mean cell dimensions) to obtain the totalvolume of phytoplankton. This value can then be used tocalculate the fresh weight biomass (see "ConversionFactors") per unit volume or surface area.
In addition to enumeration and volume, speciation of algaeis essential to the determination of changes in thephytoplankton community, both spatially and temporally.Such changes may cause filter clogging or taste and odourproblems at water intakes (Palmer, 1962).
(ii) Photosynthetic Pigments - Owing to their importance inphotosynthesis, measurements of algal pigments have
-12-

received considerable attention as an indicator of biomass.Chlorophyll a is the pigment of major interest, due to itsubiquity in all phytoplankton phyla and (usually) greaterabundance than chlorophyll b or c.
For the range of chlorophyll a concentrations commonlyencountered in the Great Lakes (1-20 µg/L), 0.5 to 2 litresof water is collected and filtered through membrane or glassfibre filters in the presence of magnesium carbonate(Vollenweider, 1969). Either acetone or methanol is thenused to extract pigments from the cells ;in the dark andusually refrigerated) and the chlorophyll a, b or cconcentration calculated by in vitro spectrophotometricanalysis of the extract in the laboratory and the use ofappropriate equations (see Talling, 1969; Westlake, 1969;Wetzel and Westlake, 1969). A number of procedures havebeen used when pigment extraction is incomplete withcertain algal species. Some of these are: grinding,sonication and the use of alternate solvents such asdimethyl sulfoxide (Shoaf and Lium, 1976) and boilingmethanol.
For in vitro analysis of samples from waters of lowproductivity (chlor. a 1 µg/L) as well as rapid in vivo (noextraction) field measurements, a more sensitivefluorometric method is available (Lorenzen, 1966; Tunzi etal., 1974). During in vivo fluorescence measurements, thevariability of the fluorescence yield coefficient ofchlorophyll a with local species, light and nutrient conditionshas meant that such data is in many instances not strictlycomparable with that obtained from other study areasand/or from laboratory in vitro solvent extraction analyses.However, the addition of the photosynthetic electrontransport blocking agent DCMU [3 -(3,4 dichlorophenyl) -1,1 dimethylurea] to samples before measurementeliminates the variability in photochemical quenching and invivo fluorescence yield, which then becomes a constant
-13-

function of cellular chlorophyll a (Slovacek and Hannan,1977).
While cell pigment content varies appreciably (as doelemental constituents other than carbon) with species andenvironmental parameters, the ability to correct accuratelyfor pigment degradation products (Lorenzen, 1967; Whitneyand Darly, 1979) in order to measure only the functionalpigment content of phytoplankton (distinct from particulatedetritus) permits effective analyses of compositephytoplankton population changes (Wetzel, 1975).
The Water Resources Branch presently uses field filtrationof discrete water samples with acetone extraction. However,dimethyl sulfoxide extraction seems to be a promisingalternative. Despite the occasional lack of correlationbetween in vivo chlorophyll a determinations by fluorometry(not DCMU - enhanced) and in vitro levels obtained bysolvent extraction, the former is being used as a quick scanof phytoplankton biomass distribution in lakes (see"Sampling Regime").
(iii) Weight (Biomass) - Fresh weight (the weight of organismswithout any adherent water) is essentially equivalent to wetweight. However, because of the highly variable watercontent of nearly all organisms, wet weight determinationby direct weighing of a centrifuged or filtered sample shouldbe avoided as an estimate of biomass (Wetzel, 1975). Freshweight can also be calculated from cell volume data (see"Enumeration and Volume" and "Conversion Factors").
Dry weight is widely used in production analysis, but varieswith drying temperatures below 105°C due to retention ofresidual water.
Organic (ash-free) dry weight is usually obtained bydetermining the loss in weight after ignition at 550°C and is
-14-
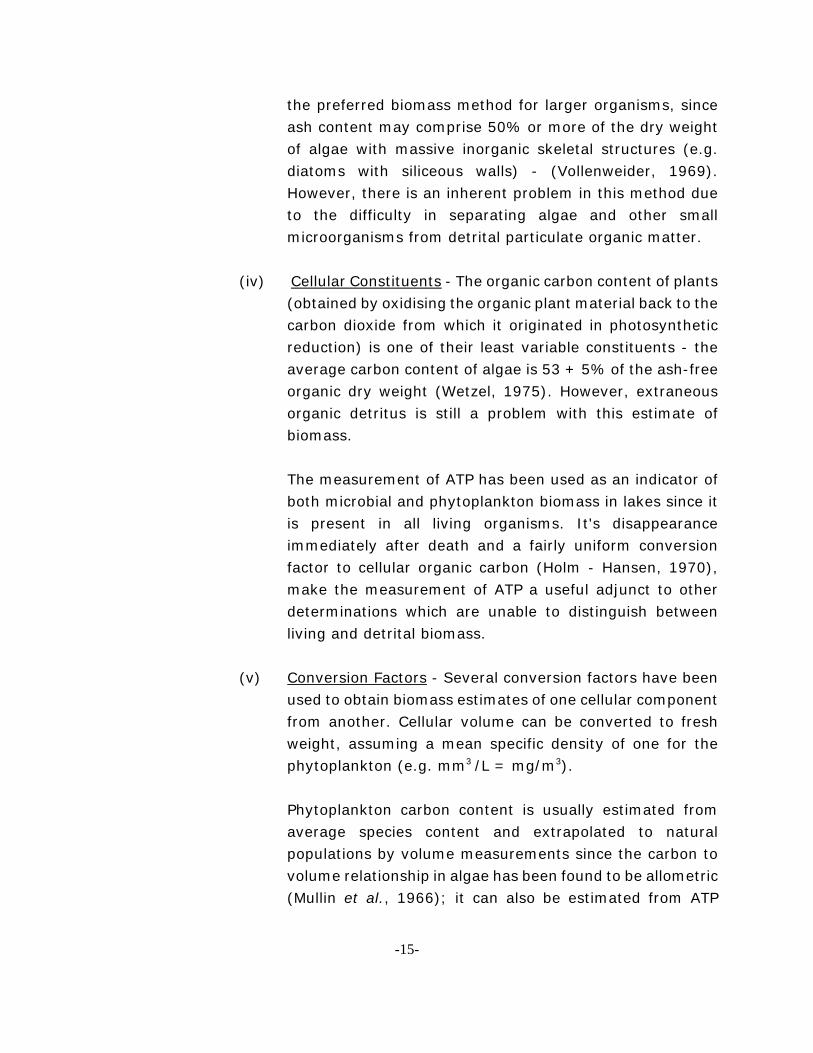
the preferred biomass method for larger organisms, sinceash content may comprise 50% or more of the dry weightof algae with massive inorganic skeletal structures (e.g.diatoms with siliceous walls) - (Vollenweider, 1969).However, there is an inherent problem in this method dueto the difficulty in separating algae and other smallmicroorganisms from detrital particulate organic matter.
(iv) Cellular Constituents - The organic carbon content of plants(obtained by oxidising the organic plant material back to thecarbon dioxide from which it originated in photosyntheticreduction) is one of their least variable constituents - theaverage carbon content of algae is 53 + 5% of the ash-freeorganic dry weight (Wetzel, 1975). However, extraneousorganic detritus is still a problem with this estimate ofbiomass.
The measurement of ATP has been used as an indicator ofboth microbial and phytoplankton biomass in lakes since itis present in all living organisms. It's disappearanceimmediately after death and a fairly uniform conversionfactor to cellular organic carbon (Holm - Hansen, 1970),make the measurement of ATP a useful adjunct to otherdeterminations which are unable to distinguish betweenliving and detrital biomass.
(v) Conversion Factors - Several conversion factors have beenused to obtain biomass estimates of one cellular componentfrom another. Cellular volume can be converted to freshweight, assuming a mean specific density of one for thephytoplankton (e.g. mm3 /L = mg/m3).
Phytoplankton carbon content is usually estimated fromaverage species content and extrapolated to naturalpopulations by volume measurements since the carbon tovolume relationship in algae has been found to be allometric(Mullin et al., 1966); it can also be estimated from ATP
-15-
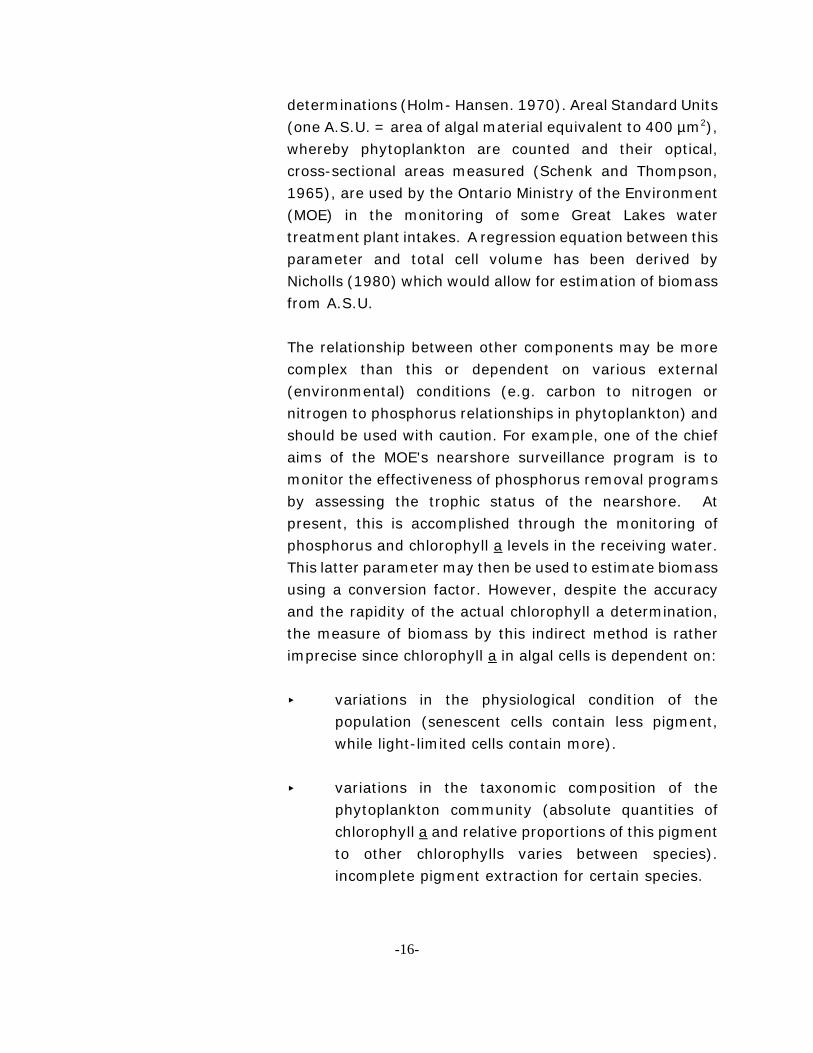
determinations (Holm- Hansen. 1970). Areal Standard Units(one A.S.U. = area of algal material equivalent to 400 µm2),whereby phytoplankton are counted and their optical,cross-sectional areas measured (Schenk and Thompson,1965), are used by the Ontario Ministry of the Environment(MOE) in the monitoring of some Great Lakes watertreatment plant intakes. A regression equation between thisparameter and total cell volume has been derived byNicholls (1980) which would allow for estimation of biomassfrom A.S.U.
The relationship between other components may be morecomplex than this or dependent on various external(environmental) conditions (e.g. carbon to nitrogen ornitrogen to phosphorus relationships in phytoplankton) andshould be used with caution. For example, one of the chiefaims of the MOE's nearshore surveillance program is tomonitor the effectiveness of phosphorus removal programsby assessing the trophic status of the nearshore. Atpresent, this is accomplished through the monitoring ofphosphorus and chlorophyll a levels in the receiving water.This latter parameter may then be used to estimate biomassusing a conversion factor. However, despite the accuracyand the rapidity of the actual chlorophyll a determination,the measure of biomass by this indirect method is ratherimprecise since chlorophyll a in algal cells is dependent on:
< variations in the physiological condition of thepopulation (senescent cells contain less pigment,while light-limited cells contain more).
< variations in the taxonomic composition of thephytoplankton community (absolute quantities ofchlorophyll a and relative proportions of this pigmentto other chlorophylls varies between species).incomplete pigment extraction for certain species.
-16-

Hence, chlorophyll a levels and phytoplankton volume (i.e.biomass) may not correlate well. In addition, chlorophyll acontent may not be indicative of the productivity of cells.However, this method of assessment is quick and if only oneor two depths are sampled, a large area of the nearshorecan be assessed.
(C) Productivity Estimation
It is important to know not only the biomass, but also the rate atwhich organic material is produced in a water body. This ratereflects not only the availability of nutrients and their interactionwith environmental factors to determine the productivity of a givenwater body, but also determines to a large degree conditions offood availability, ionic composition, pH, oxygen levels, etc. thatdelimit the range and competitive abilities of aquatic fauna.Primary production is the quantity of new organic matter (biomass)created by photosynthesis (or chemosynthesis) or the storedenergy which this material represents per unit area or volume.Primary productivity, then, is the production per unit area (orvolume) per unit time and is usually an average of a number ofmeasured instantaneous rates expressed on a daily or yearly basis,since natural phytoplankton communities are affected by manyfactors causing rapid, frequent, and irregular changes in theinstantaneous rate. It is important, however, that thedeterminations be done with regard to the regeneration times (lifecycles) of the phytoplankton.
Numerous techniques have been used to estimate primaryproduction of natural phytoplankton communities, using eitherisolated or non-isolated populations. However, estimates of theproduction rates of phytoplankton based on changes in biomassare much more difficult than for aquatic macrophytes or attachedalgae (Vollenweider, 1969) owing to potentially substantial lossesby zooplankton grazing, current transport, sedimentation or deathand decomposition.
-17-
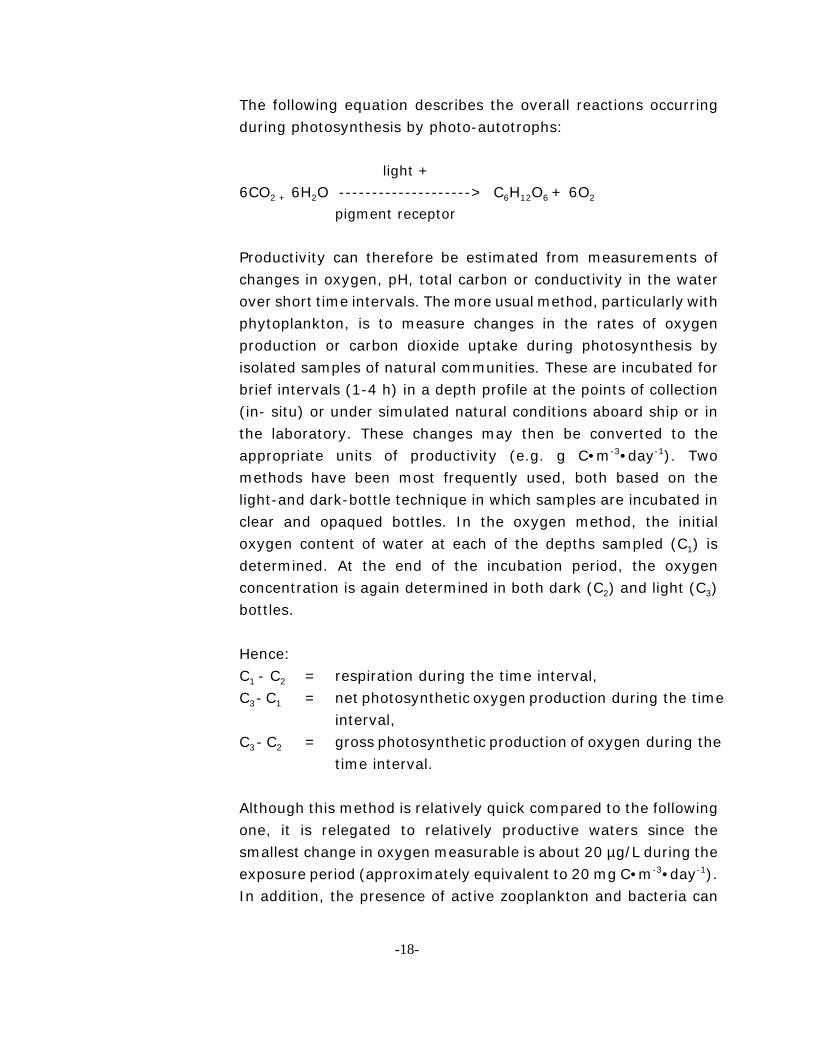
The following equation describes the overall reactions occurringduring photosynthesis by photo-autotrophs:
light +6CO2 + 6H2O --------------------> C6H12O6 + 6O2
pigment receptor
Productivity can therefore be estimated from measurements ofchanges in oxygen, pH, total carbon or conductivity in the waterover short time intervals. The more usual method, particularly withphytoplankton, is to measure changes in the rates of oxygenproduction or carbon dioxide uptake during photosynthesis byisolated samples of natural communities. These are incubated forbrief intervals (1-4 h) in a depth profile at the points of collection(in- situ) or under simulated natural conditions aboard ship or inthe laboratory. These changes may then be converted to theappropriate units of productivity (e.g. g C•m-3•day-1). Twomethods have been most frequently used, both based on thelight-and dark-bottle technique in which samples are incubated inclear and opaqued bottles. In the oxygen method, the initialoxygen content of water at each of the depths sampled (C1) isdetermined. At the end of the incubation period, the oxygenconcentration is again determined in both dark (C2) and light (C3)bottles.
Hence:C1 - C2 = respiration during the time interval,C3 - C1 = net photosynthetic oxygen production during the time
interval,C3 - C2 = gross photosynthetic production of oxygen during the
time interval.
Although this method is relatively quick compared to the followingone, it is relegated to relatively productive waters since thesmallest change in oxygen measurable is about 20 µg/L during theexposure period (approximately equivalent to 20 mg C•m-3•day-1).In addition, the presence of active zooplankton and bacteria can
-18-

result in errors due to their oxygen consumption. In the 14Cmethod, a known amount of 14CO2 (usually as NaH14CO3) is addedto water samples of known total 12CO2 content and the samplesincubated. At the end of the incubation period, the algae arecollected on membrane filters and their activity determined with ageiger or, if fluor is used, a scintillation counter. Since the 14CO2 assimilated by the phytoplankton is proportional to the 12CO2
assimilated, then the total CO2 assimilated by the cells can becalculated:
12CO2 assimilated = 14CO2 assimilated (light-dark bottle) x12 CO2 available x 1.0614CO2 added
This method is approximately 50 to 100 times more sensitive thanthe foregoing. However, it does not measure respiration directlyand may underestimate primary production if appreciable amountsof 14C organics are released from cells.
2. Assessment Techniques: Attached Algae (e.g. Cladophora)
(a) Sampling Regime
Biomass or standing crop data obtained from surveys should beexpressed on an aerial basis. Productivity can be expressed in a varietyof ways (e.g: per unit area or weight). Use of a sampling grid isnecessary to adequately delineate the areal extent of the Cladophoraproblem.
Adequate background data should also be collected. This would includesuch parameters as nutrient levels, substrate characteristics, currentvelocity and direction, wave height, temperature and light profiles (visibleas well as with specific filters). Sampling should be done at regularintervals during the growing period (May through September), the criticaltime being the early summer. Frequency of sampling should besite-specific and may need to be as often as once a week.
-19-

(b) Biomass Estimation
(i) Weight/Cellular Constituents - Owing to the filamentousnature of Cladophora, the use of counting in conjunctionwith average cell volume for the determination of freshweight biomass from total cellular volume is difficult, if notimpossible. Therefore, the biomass of samples (scrapedfrom a known area of substrate) should be determined ona biovolume, wet weight, dry weight, organic (ash-free) dryweight or organic carbon basis, the most common being dryweight.
(ii) Photosynthetic Pigments - Determination of in vivochlorophyll a of samples extracted with the appropriatesolvent is likely the best method for these algae, and, withthe use of the appropriate conversion factor, would providea useful indication of algal health in conjunction with the dryweight biomass estimate.
(c) Productivity Estimation
Both the oxygen and 14C techniques, as outlined previously forphytoplankton, have been used to determine the productivity ofattached algae and submerged macrophytes. These studies haveemployed either isolated or non-isolated communities. ForCladophora, known areas can be enclosed by plexiglass incubationchambers which extend into the sediments and have ports to allowfor sampling and injection (of 14C). The 14C method is preferredsince it avoids the major problem with the oxygen light and darkmethod: consumption of oxygen by sedimental oxidative processesand by fauna. This problem can be circumvented if knownquantities (weight) of Cladophora are scraped from the substrateand placed in incubation bottles (much like phytoplankton).However, because of the marked oxygen evolution by suchsamples (say, 1 g wet weight), the greater sensitivity of the 14Cmethod is not required, and the oxygen light and dark bottlemethod or even changes in the pH of the incubating medium can
-20-

be used.
Productivity estimates on non-isolated Cladophora communities,by measuring diurnal changes in oxygen, carbon dioxide or pH arefeasible, and allow longer measurement periods, but necessitatedetermination of other parameters (exchange rates of CO2 or O2
between air and water).
C. Application of Data
A general categorization of the characteristics of lakes between the extremes ofvery oligotrophic and very eutrophic systems has been attempted many times,using a multitude of criteria and has fostered the development of a number oftrophic status indices (e.g: Beeton and Edmondson, 1972; Michalski and Conroy,1972; Carl son, 1977). The most realistic parameter for such a categorizationis one that can be quantitatively determined directly, such as a rate of growth,and one that integrates the host of environmental parameters controlling thesynthesis of the organic matter that enters the system (i.e. rates ofautochthonous primary production). The general ranges of primary productivityof phytoplankton commonly associated with the trophic status of a lake aregiven in Table 2, along with several related characteristics. Although suchgroupings should only be used with caution, the general relationshipspredominate in a majority of inland waters (see Table 3 for comparable GreatLakes data adapted from Chapra and Sonzogni (1979) and Vollenweider et al(1974)).
-21-

TABLE 2: General Ranges of Primary Productivity of Phytoplankton and Related Characteristics of Lakes of Different TrophicCategories (from Wetzel, 1975).
Trophic Type
Mean PrimaryProductivity*
mg C.m-2
.day-1
Phyto-planktonDensity
(cm3. m-3)
Phyto-planktonBiomass
(mg C.m-3)
Chlorophyll aconcen-tration
(mg. m-3)
DominantPhytoplankton
LightExtinctionCoeffcients(n . m-1)
TotalOrganicCarbon
(mg . L-1)
Total P(µg. L-1)
Total N(µg. L-1)
TotalInorganic
Solids(mg. L-1)
Ultra-oligotrophic
<50 <1 <50 0.01-0.5 - 0.03-0.8 - <1-5 <1-250 2-15
Oligotrophic 50-300 - 20-100 0.3-3 Chrysophyceae 0.05-1.0 <1-3 - - -
Cryptophyceae
Oligo-mesotrophic
- 1-3 - - Dinophyceae, Bacillario-phyceae
- - 5-10 250-600 10-200
Mesotrophic 250-1000 - 100-300 2-15 - 0.1-2.0 <1-5 - - -
Meso-eutrophic
- 3-5 - - - - - 10-30 500-1100 100-500
Eutrophic >1000 - >300 10-500 Bacillario-phyceae,
Cyanophyceae
0.5-4.0 5-30 - - -
Hyper-eutrophic
- >10 - - Chlorophycea,Eugleno-phyceae
- - 30->5000 500->15000 400-60000
Dystropic < 50-500 - < 50-200 0.1-10 - 1.0-4.0 3-30 <1-10 <1-500 5-200
* Referring to approximately net primary productivity, such as measured by the 14C method.
-22-

TABLE 3. Comparison of Primary Productivity and Related Parameters for the Great Lakes(from: Vollenweider et al, 1974).
Mean Daily Primary Productivity for year PhytoplanktonBiomass
x 103 mg.m-3
Chlorophyll a mg m-3
Total P*(mean)µg.L-1
TrophicTypemg C.m-2 .day-1 mg C.m-3 .h-1
Lake Ontario
inshore 119-2003 2.9-25.0 0.8-7.4 2.7-12.0 secondary eutrophic**
offshore 58-1443 1.7-12.4 0.6-9.0 1.8-7.9 21.0 mesotrophic
Lake Erie
Western basin 30-4760 4.8-146.9 0.8-13.2 3.3-19.3 39.1 hypereutrophic
Central basin 120-1690 5.5-21.4 0.6-6.0 2.5-9.2 19.4 secondary eutrophic
Eastern basin 140-1440 3.2-13.9 1.0-4.2 1.4-5.4 17.2 mesotrophic
Lake Huron
Saginaw Bay N.A. 4.1-127.2 1.6-17.3 9.5-27.4 30.9 hypereutrophic
offshore 147-698 2.2-9.9 0.3-1.8 1.4-2.2 5.5 oligotrophic
Lake Michigan
inshore 67-1567 N.A. N.A. 1.1-10.3 15.0-40.0 secondary eutrophic
offshore 67-1030 N.A. N.A. 0.6-3.7 8.0 oligotrophic
Lake Superior 50-260 2.2-8.8 N.A. 0.4-9.7 4.6 oligotrophic
* from: Chapra and Sonzogni (1979)** due to local pollution
-23-

ACKNOWLEDGEMENTS
The authors wish to thank the following for their helpful comments:J.D. Kinkead, S.E. Sal bach , K. Nicholls, M.S. Jackson and M. Zarull .
-24-

REFERENCES CITED
ANDREN, A. et al (1977). Atmospheric loadings to the Great Lakes. Report to thePollution from Land Use Activities Reference Group, International JointCommission, Windsor, Ontario, Canada.
BEETON, A.M. and W.T. EDMONDSON (1972). The eutrophication problem. J. Fish.Res. Board Can., 29 : 673-682.
BOWERS, J.A. (1980). Effects of thermocline displacement upon subsurface chlorophyllmaxima in Lake Michigan. J. Great Lakes Res., 6: 367-370.
BOYD, J.D. (1980). Metalimnetic oxygen minima in Lake Ontario, 1972. J. Great LakesRes., 6 : 95-100.
CARLSON, R.E. (1977). A trophic state index for lakes. Limnol. Oceanogr., 22:361-369.
CARNES, C.J. and G.C. MILLNER (1980). Cladophora Field and laboratory methods.Great Lakes Laboratory, State University College at Buffalo, Spec. Rep. 22, 17pp.
CHAPRA, S. C. and W. C. SONZOGNI (1979). Great Lakes total phosphorus budget forthe mid-1970's. J. Water Poll. Control Fed: 51: 2524-2533.
CHARLTON, M.N. (1979). Hypolimnetic oxygen depletion in central Lake Erie : hasthere been any change? Inland Waters Directorate Sci. Ser. No. 110.
GLOOSCHENKO, W.A., J.E. MOORE, M. MUNAWAR and R.H. VOLLENWEIDER (1974).Primary production in Lakes Erie and Ontario : a comparative study. J. Fish. Res.Board Can., 31 : 253-263.
GREAT LAKES WATER QUALITY BOARD (1979). Seventh annual report to theInternational Joint Commission - Appendix B, Annual Report of SurveillanceSubcommittee, 117 pp.
-25-

HOLM - HANSEN (1970). ATP levels in algal cells as influenced by environmentalconditions. Plant and Cell Physiol., 11: 689-700.
HOLMES, R.W. (1962). The preparation of marine phytoplankton for microscopicexamination and enumeration on molecular filters. U.S. Fish and Wildlife Serv.,Spec. Sci. Rep. Fish, 433, 6pp.
LORENZEN, C.J. (1966). A method for continuous measurement of in vivo chlorophyllconcentration. Deep-Sea Res., 13: 223-227.
LORENZEN, C.J., (1967). Determination of chlorophyll and pheopigments:spectrophotometric equations. Limnol. Oceanogr., 12:343-346.
MICHALSKI, M.F. and N. CONROY (1972). Water quality evaluation Lake Alert Study.Ont. Min. Env. Rep., 23 pp.
MILLARD, E.S., C.C. CHARLTON and G.A. BURNISON (1979). Availability of Phosphorusin Different Sources Entering the Great Lakes for Algal Growth. PLUARG TaskGroup D/IJC, 38 pp.
MULLIN, M.M., P.R. SLOAN, and R.W. EPPLEY (1966). Relationship between carboncontent, cell volume, and area in phytoplankton. Limnol. Oceanogr.,11:307-311.
NICHOLLS, K.H., (1980). Recent changes in the phytoplankton of Lakes Erie andOntario. Ont. Min. Env. Rep., 30 pp.
PALMER, C.M. (1962). Algae in water supplies. U.S. Dept. Health, Education andWelfare, Public Health Service Pub. No. 657, 88 pp.
PRESCOTT, G.W. (1968). The Algae : A Review. Houghton Mifflin Co., Boston.
SCHENK, C. F. and R. E. THOMPSON (1965). Long-term changes in water chemistryand abundance of plankton at a single sampling location in Lake Ontario. Proc.8th Conf. Great Lakes Res., Univ. Michigan, Great Lakes Res. Div., Pub. No. 13:197-208.
-26-

SHEAR, H. and D.E. KONASEWICH, eds. (1975). Cladophora in the Great Lakes. Proc.of workshop sponsored by International Joint Commission's Res. Advisory BoardStanding Committee on Eutrophication, Febr. 19-21, 1975, Windsor, Ont. 179pp.
SHOAF, W.T. and B.W. LIUM (1976). Improved extraction of chlorophyll a and b fromalgae using dimethyl sulfoxide. Limnol. Oceanogr., 21:926-928.
SLOVACEK, R.E. and P.J. HANNAN (1977). In vivo fluorescence determinations ofphytoplankton chlorophyll a. Limnol. Oceanogr. 22 : 919-925.
SMITH, V.H. and J. SHAPIRO (1981). Chlorophyll - phosphorus relations in individuallakes. Their importance to lake restoration strategies. Env. Sci. Technol., 15 :444-451.
STRICKLAND, J.D.H. (1960). Measuring the primary production of marinephytoplankton. Bull. Fish. Res. Board Can., 122: viii + 173 pp.
STRICKLAND J.D.H. and T.R. PARSONS (1968). A practical handbook of seawateranalysis. Fish. Res. Board Can. Bull., 167: xi + 311 pp.
STADELMAN, P., J.E. MOORE and E. PICKETT (1974). Primary production in relation totemperature structure, biomass concentration, and light conditions at an inshoreand offshore station in Lake Ontario. J. Fish. Res. Board Can., 31 : 1215-1232.
TALLING, J. F. and D. DRIVER (1963). Some problems in the estimation of chlorophylla in phytoplankton. In: Proc. Conf. Primary Productivity Measurement, Marineand Freshwater, pp. 142-146. Hawaii, 1961. U.S. Atomic Energy Comm.TID-7633.
TALLING, J. F. (1969). In: A Manual on Methods for Measuring Primary Production inAquatic Environments (ed. Vollenweider, R.A.), pp. 22-25. Int'l. Biol. ProgramHandbook 12., Blackwell Scientific Publications, Oxford and Edinburgh.
-27-

TAYLOR, W.D., L.R. WILLIAMS, S.C. HERN, V.W. LAMBOU, C.L. HOWARD, F.A. MORRISand M.K. MORRIS (1981). Phyloplankton water quality relationships in U.S.lakes, Part VIII: Algae associated with or responsible for water quality problems.U.S. E.P.A. Report No. PB 81-156831.
TUNZI, M. M. CHU and R. BAIN (1974). In vivo fluorescence, extracted fluorescence,and chlorophyll in algal mass measurements. Water Res., 8 : 623-636.
UTERMOHL, H. (1958). Zur Vervollkommung der quantitativen Phytoplankton -Methodik. Mitt. int. Verein. Limnol., 9:1-38.
VOLLENWEIDER, R.A., ed. (1969). A Manual on Methods for Measuring PrimaryProduction in Aquatic Environments. Int'l. Biol. Program Handbook 12., BlackwellScientific Publications, Oxford and Edinburgh.
VOLLENWEIDER, R.A., M. MUNAWAR, and P. STADELMAN (1974). A comparativereview of phytoplankton and primary production in the Laurentian Great Lakes.J. Fish. Res. Board Can., 31: 739-762.
WESTLAKE, D.F. (1969). Macrophytes. In: A Manual on Methods for MeasuringPrimary Production in Aquatic Environments (ed. Vollenweider, R.A.), pp 25-32.Int'l Biol. Program Handbook 12., Blackwell Scientific Publications, Oxford andEdinburg.
WETZEL, R.G. and D.F. WESTLAKE (1969). Periphyton. Ibid. pp. 33-40.
WETZEL, R.G. (1975). Limnology. W.B. Saunders Co., Toronto.
WHITNEY, D.E. and W.M. DARLEY (1979). A method for determination of chlorophyll ain samples containing degradation products. Limnol. Oceanogr. 24:183-186.
-28-

APPENDIX
Sampling Apparatus
a) Water Samplers
Sampling of the water column at discrete depths for physical, chemical and biologicalparameters can be accomplished with any of a number of commercially availablesamplers, as long, as they are of sufficient volume and easily deployed and maintained.On the Great Lakes, Nansen, Niskin, Kemmerer and Van Dorn bottles are commonlyused and are available in a variety of sizes/volumes. The first two, because of theirweight, require a winch. The Van Dorn sampler is particularly amenable to samplingof discrete water strata because of its horizontal orientation during sampling, whereasthe other three samplers, because of their vertical orientation, will integrate a waterstratum equal to their length. If a power source is available on the vessel, adeck-based or submersible pump system with attached hose allows rapid sampling ofmany depths at discrete intervals. In addition, the sample flow from this system canbe split and connected to onboard measuring systems, such as fluorometers orturbidimeters, equipped with flow-through cells.
b) Instrumentation and Field Measurements
The ability to perform onboard measurements is dependent on vessel size andelectrical power availability. Lack of the latter may make it difficult to utilizeelectrically-powered instruments. However, some instruments such as pH meters,turbidimeters, temperature/dissolved oxygen meters and solarimeters are availablewith built-in battery packs. This is particularly important for such parameters as pH,alkalinity and inorganic carbon which are preferably measured in the field (i.e. as soonas possible after collection) due to their changeable nature with time. Alkalinity andinorganic carbon can be determined titrimetrically onboard.
Also, if the oxygen light - and dark-bottle method is used for primary productivitydeterminations, oxygen should be determined in the field titrimetrically (by the Winklermethod).
-29-

Primary productivity samples using the 14C-bicarbonate tracer method should befiltered in the field, as should water samples taken for chlorophyll analysis. A filtrationmanifold with an electrical vacuum pump is helpful for this, particularly if the samplenumber is large. However, a hand-operated vacuum pump can be used instead.
-30-