Bioinformatics 1: lecture 5 - Purdue University · Differences between PAM and BLOSUM PAM •PAM...
43
Bioinformatics 1: lecture 5 Follow-up of Lecture 4? Substitution matrices Multiple sequence alignment
Transcript of Bioinformatics 1: lecture 5 - Purdue University · Differences between PAM and BLOSUM PAM •PAM...

Bioinformatics 1: lecture 5
Follow-up of Lecture 4?
Substitution matrices
Multiple sequence alignment

A teacher's dilemma
To understand... You first need to know...
Multiple sequence alignment Substitution matrices
Substitution matrices Phylogenetic trees
Phylogenetic trees Multiple sequence alignment

Substitution matrices
•Used to score aligned positions, usually of amino acids.
•Expressed as the log-likelihood ratio of mutation (or log-odds ratio)
•Derived from multiple sequence alignments
Two commonly used matrices: PAM and BLOSUM
•PAM = percent accepted mutations (Dayhoff)
•BLOSUM = Blocks substitution matrix (Henikoff)

PAM
•Evolutionary time is measured in Percent Accepted Mutations, or PAMs
•One PAM of evolution means 1% of the residues/bases have changed, averaged over all 20 amino acids.
•To get the relative frequency of each type of mutation, we count the times it was observed in a database of multiple sequence alignments.
•Based on global alignments
•Assumes a Markov model for evolution.
M Dayhoff, 1978

BLOSUM
•Based on database of ungapped local alignments (BLOCKS)
•Alignments have lower similarity than PAM alignments.
•BLOSUM number indicates the percent identity level of sequences in the alignment. For example, for BLOSUM62 sequences with approximately 62% identity were counted.
•Some BLOCKS represent functional units, providing validation of the alignment.
Henikoff & Henikoff, 1992

A multiple sequence alignment is made using many pairwise sequence alignments
Multiple Sequence Alignment

Columns in a MSA have a common evolutionary history
By aligning the sequences, we assert that the aligned residues in each column had a common ancestor.
SG
G
GAN
G
?

A tree shows the evolutionary history of a single position
8worm clam bird goat fish
G
G
G
G
GN W W
W
Ancestral characters can be inferred by parsimony analysis.

Counting mutations without knowing ancestral sequences
Assume any of the sequences could be the ancestral one.
L K F R L S K K P
L K F R L S K K PL K F R L T K K P
L K F R L S K K PL K F R L S R K PL K F R L T R K PL K F R L ~ K K P
GGGWWNGG
G W W N G G
If the first sequence was the ancestor, then it mutated to a W twice, to N once, and conserved G three times.

Or, instead of G we could have picked W as the ancestor...
L K F R L S K K P
L K F R L S K K PL K F R L T K K P
L K F R L S K K PL K F R L S R K PL K F R L T R K PL K F R L ~ K K P
WGGWWNGG
G G W N G G
W was the ancestor, then it mutated to a G four times, to N once, and was conserved once.
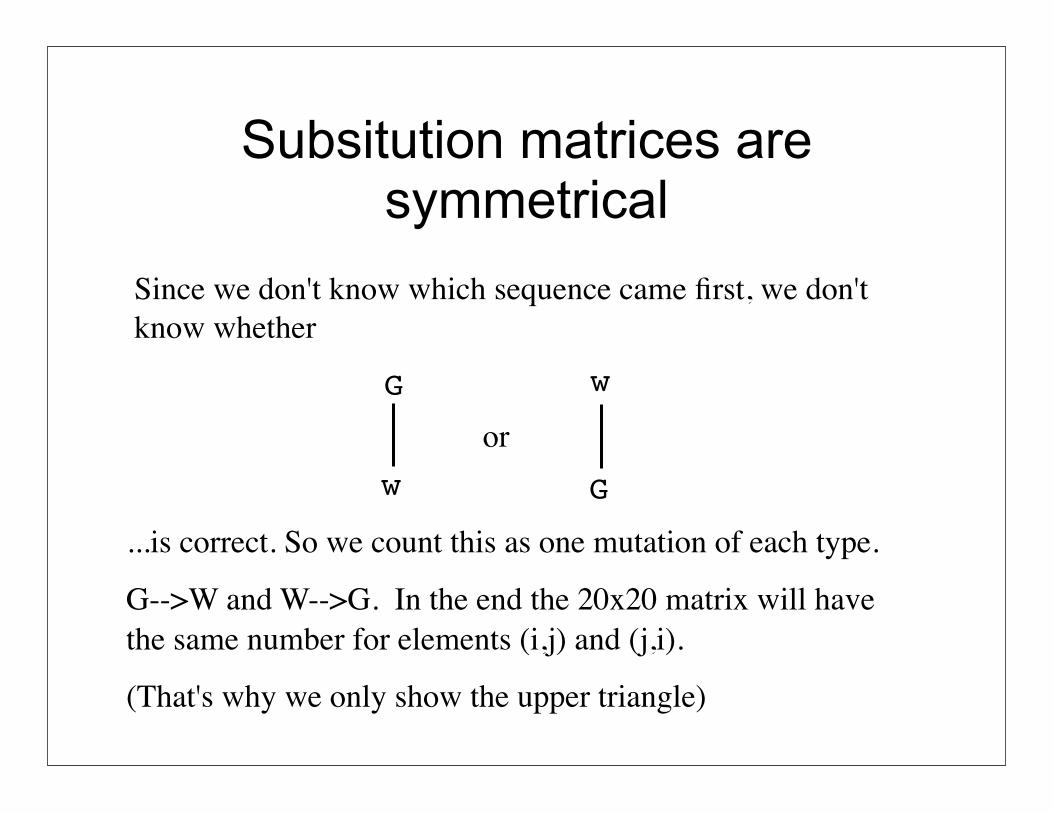
Subsitution matrices are symmetrical
Since we don't know which sequence came first, we don't know whether
...is correct. So we count this as one mutation of each type.
G-->W and W-->G. In the end the 20x20 matrix will have the same number for elements (i,j) and (j,i).
(That's why we only show the upper triangle)
G
Gw
w
or

Summing the substitution
GGWWNGG
one column of a MSA
G
G
W
W
N
N
3 21
symmetrical matrix
We assume the ancestor is one of the observed amino acids, but we don't know which, so we try them all.

Next possible ancestor, G again.
GGWWNGG
G
G
W
W
N
N
2 21
We already counted this residue against all others, so be blank it out.

Next...W
GGWWNGG
G
G
W
W
N
N
1
2
1

Next...W again
GGWWNGG
G
G
W
W
N
N
0
2
1

Next...N
GGWWNGG
G
G
W
W
N
N
0
2
0

Next...G again
GGWWNGG
G
G
W
W
N
N
1 0 0
Counting G as the ancestor many times as it appears recognizes the increased likelihood that G (the most frequent aa at this position) is the true ancestor.
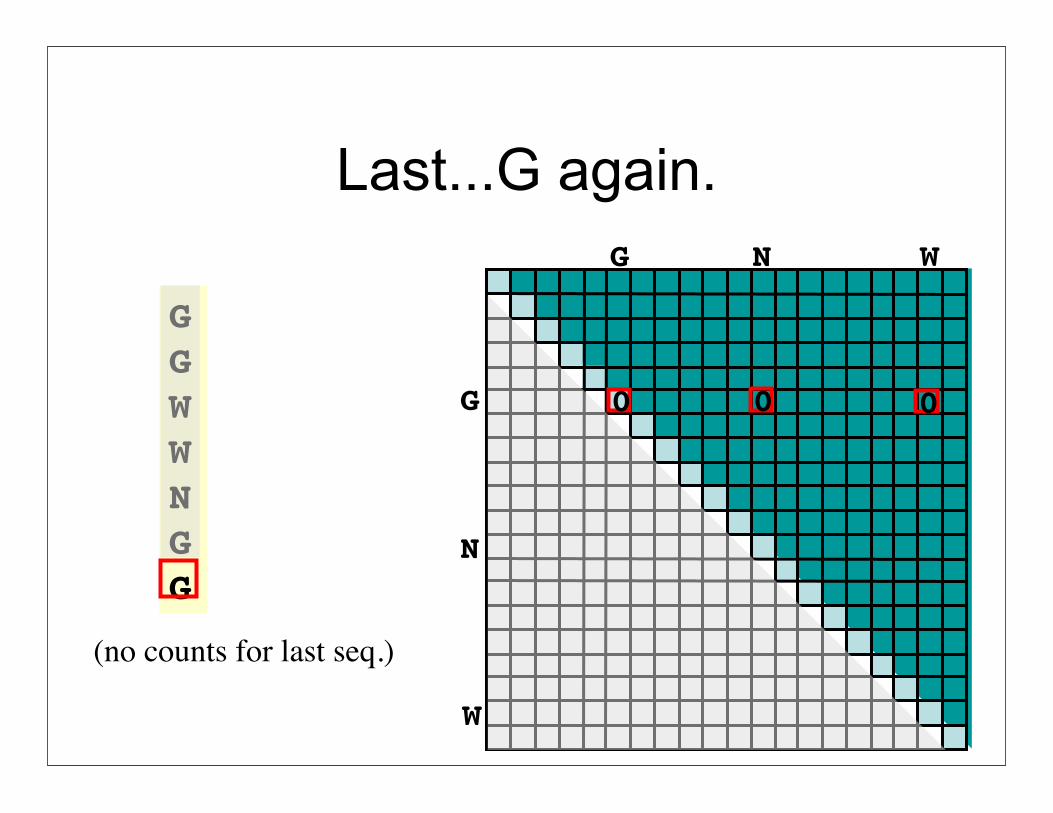
Last...G again.
GGWWNGG
G
G
W
W
N
N
0 0 0
(no counts for last seq.)

Go to next column. Continue summing.
GGWWNGG
G
G
W
W
N
N
6 4 8
TOTAL=21
0
1
2
Continue doing this for every column in every multiple sequence alignment...
PPINPPA

log odds
log odds ratio = log2(observed/expected )
Substitutions (and many other things in bioinformatics) are expressed as a "likelihood ratio", or "odds ratio" of the observed data over the expected value. Likelihood and odds are synomyms for Probability.
So Log Odds is the log (usually base 2) of the odds ratio.

Getting log-odds from counts
Observed probability of G->GqGG = P(G->G)=6/21 = 0.29
Expected probability of G->G,
eGG = 0.57*0.57 = 0.33
odds ratio = qGG/eGG = 0.29/0.33
log odds ratio = log2(qGG/eGG )
If the ‘lod’ is < 0., then the mutation is less likely than expected by chance. If it is > 0., it is more likely.
P(G) = 4/7 = 0.57

Different observations, same expectation
G GG AW GW AN GG AG A
P(G)=0.50eGG = 0.25qGG = 9/42 =0.21lod = log2(0.21/0.25) =–0.2
G WG AG WG AG WG AG A
P(G)=0.50eGG = 0.25qGG = 21/42 =0.5lod = log2(0.50/0.25) = 1
G’s spread over many columns G’s concentrated

Different observations, same expectation
G GG AW GA WN GG AG A
P(G)=0.50, P(W)=0.14eGW = 0.07qGW = 7/42 =0.17lod = log2(0.17/0.07) = 1.3
G WG AG WG AG WG AA G
P(G)=0.50, P(W)=0.14eGW = 0.07qGG = 3/42 =0.07lod = log2(0.07/0.07) = 0
G and W seen together more often than expected.
G’s and W’s not seen together.

Get the substitution value for P->Q
sequence alignment database.
P(P)=_____, P(Q)=_____ePQ = _____qPQ = ___/___ =_____lod = log2(ePQ/qPQ) = ____
P Q
Q
P
In class exercise:
PQPPQQQPQQPPQPPPQQQP
substitution counts
expected (e), versus observed (q) for P->Q

Markovian evolution and PAMA Markov process is one where the likelihood of the next "state" depends only on the current state. The inference that evolution is Markovian assumes that base changes (or amino acid changes) occur at a constant rate and depend only on the identity of the current base (or amino acid).
G G A V V G
millions of years (MY)
current aa
.9946 .0002 .0021 .0001.9932transition likelihood / MY
G->G G->A G->V V->V V->G

Markovian evolution is an extrapolationStart with all G's. Wait 1 million years. Where do they go?
Using PAM1, we expect them to mutate to about 0.0002 A, 0.0007 P, 0.9946 G, etc
Wait another million years.
The new A's mutate according to PAM1 for A's, P's mutate according to PAM1 for P's, etc.
Wait another million, etc , etc etc.
What is the final distribution of amino acids at the positions that were once G's?
PAM1 =
PAM1 =

Matrix multiplication
PAM1 =
00001000000000000000
P(G->A)P(G->C)P(G->D)P(G->E)P(G->G)P(G->F)P(G->H)P(G->I)P(G->K)P(G->L)P(G->M)P(G->N)P(G->P)P(G->Q)P(G->R)P(G->S)P(G->T)
PAM1 x =
To start our species has 100%G, 0% everything else
After “1MY” our species has each amino acid according to the PAM probabilities.
0.00010.0001
0.000150.000050.999430.000020.000050.000010.0002
0.000150.000020.000030.00060.00060.00002
=
This column contains P(G->X)

Matrix multiplication
PAM1 =
PAM1 x
After 2MY each amino acid has mutated again according to the PAM1 probabilities.
PAM1
=etc.
0.00010.0001
0.000150.000050.999430.000020.000050.000010.0002
0.000150.000020.000030.00060.00060.00002
0.00020.00020.00030.0001
0.999200.000040.000110.000020.00040.0003
0.000040.000060.00120.00120.00004
=

“PAM250” = PAM250
PAM1 =PAM1 PAM1•••
PAM1
250
==

Differences between PAM and BLOSUM
PAM•PAM matrices are based on global alignments of closely related proteins.•The PAM1 is the matrix calculated from comparisons of sequences with no more than 1% divergence.•Other PAM matrices are extrapolated from PAM1 using an assumed Markov chain.
BLOSUM•BLOSUM matrices are based on local alignments.•BLOSUM 62 is a matrix calculated from comparisons of sequences with approx 62% identity.•All BLOSUM matrices are based on observed alignments; they are not extrapolated from comparisons of closely related proteins.•BLOSUM 62 is the default matrix in BLAST (the database search program). It is tailored for comparisons of moderately distant proteins. Alignment of distant relatives may be more accurate with a different matrix.

PAM250

BLOSUM62

In class exercise:Which substitution matrix favors...
conservation of polar residues
conservation of non-polar residues
conservation of C, Y, or W
polar-to-nonpolar mutations
polar-to-polar mutations
PAM250 BLOSUM62

Protein versus DNA alignments
• Protein alphabet = 20, DNA alphabet = 4.– Protein alignment is more informative– Less chance of homoplasy with proteins.– Homology detectable at greater edit distance– Protein alignment more informative
• Better Gold Standard alignments are available for proteins. – Better statistics from G.S. alignments.
• On the other hand, DNA alignments are more sensitive to short evolutionary distances. 34
Are protein alignment better?

Evolving ... in class• Open Geneious, create 10 base sequence TACTGCAGTA• Use Sequence/Generate Mutated Seq...• Record the number of mutations (true distance) and p-distance
– do single base changes only– generate 10 sequences with n mutations
• Align mutated sequences with original, using high gap penalties, global alignment, so you get no gaps.
• In the alignment, Right-click the original sequence. Set it as reference sequence. Highlight disagreements (p-distance). Count them.
• Plot p-distance as a function of n.• What happens if you used a sequence of all A’s?• What would happen if you use sequence/Generate Shuffled Seq..., instead of
mutation? • All A’s, shuffled? Half A’s? 35

DNA evolutionary models: P-distance
36
What is the relationship between time and the %identity?
p = DL
p
dista
nce
p is a good measure of time only when p is small.
0 1

DNA evolutionary models: Poisson correction
37
p = DL
p
dista
nce
0 1
1-p = e-2rt
dP = -ln(1-p)
dP = 2rt
Corrects for multiple mutations at the same site. Unobserved mutations.
The fraction unchanged decays according to the Poisson function. In the time t since the common ancestor, 2rt mutations have occurred, where r is the mutation rate (r = genetic drift * selection pressure)
Poisson correction assumes p goes to 1 at t=∞. Where should it really go?

DNA evolutionary models: Jukes-Cantor
38
Prob(mutation in one unit of time) = αA C G T
A
CG
T
α α α
αα
α
ααα
α α
α
1-3α
1-3α
1-3α
1-3α
Prob(no mutation) = 1-3α
α << 1.
What is the relationship between true evolutionary distance and p-distance?
At time t, fraction identical is q(t). Fraction non-identical is p(t). p(t) + q(t) = 1
Prob that both sequences do not mutate = (1-3α)2=(1-6α+9α2) ≈(1-6α). ( Since α<<1, we can safely neglect α2. )Prob that a mismatch mutates back to an identity = 2αp(t)
q(t+1) = q(t)(1-6α) + 2α(1-q(t))d q(t)/dt ≈ q(t+1) - q(t) = 2α - 8α
Integrating: q(t) = (1/4)(1 + 3exp(-8αt))Solving for dJC = 6αt = -(3/4)ln(1 - (4/3)p), where p is the p-distance.
In time t+1, each of q(t) positions stays same with prob = 1-3α.

DNA evolutionary models
39
p
dista
nce
0 1
p-distance
Poisson correction
Jukes-Cantor
In Jukes-Cantor, p limits to p=0.75 at infinite evolutionary distance.
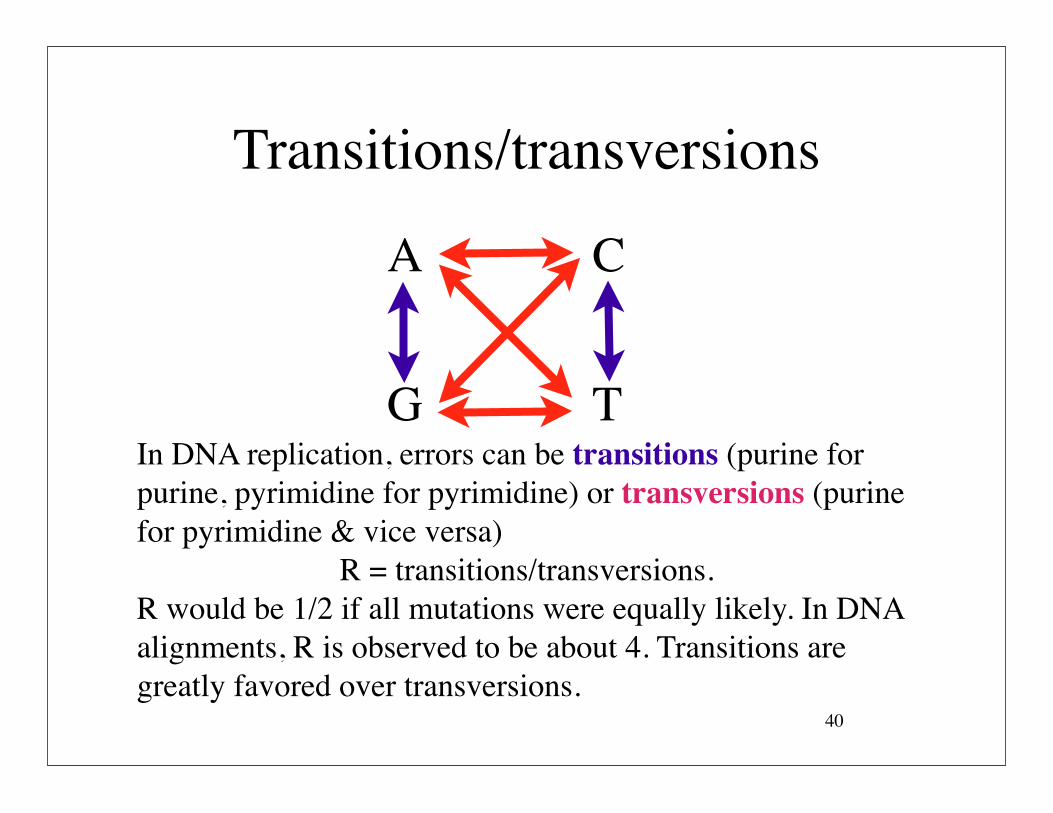
Transitions/transversions
40
T
A
G
C
In DNA replication, errors can be transitions (purine for purine, pyrimidine for pyrimidine) or transversions (purine for pyrimidine & vice versa)
R = transitions/transversions.R would be 1/2 if all mutations were equally likely. In DNA alignments, R is observed to be about 4. Transitions are greatly favored over transversions.

Split changes (D) into the two types, transition (P) and transversion (Q)
Jukes-Cantor with correction for transitions/transversions
41
A C G TA
CG
T
β α β
αβ
β
βαβ
α β
β
1-2β-α
1-2β-α
1-2β-α
1-2β-α
dK2P =-(1/2)ln(1-2P-Q)-(1/4)ln(1-2Q)
(Kimura 2-parameter model, dK2P)
p-distance = D/L = P + QP = transitions/L, Q=transversions/L
The the corrected evolutionary distance is...

Further corrections are possible
A C G TA
CG
T
A nucleotide substitution matrix?
Additional corrections for:•Sequence position (gamma)•Isochores (GC-rich, AT-rich regions)•??

Review
• Amino acid substitution matrices– lods– observed vs expected – Markovian evolution
• DNA, p-distance– Poisson– Jukes-Cantor– transitions/transversions. Kimura.
43


![Improving the reactivity of phenylacetylene macrocycles ...€¦ · properties of PAM1 are reported in the literature [39]. PAM1 was used in this study as a control molecule because](https://static.fdocuments.in/doc/165x107/5fab5f9752604a1f437e1f8f/improving-the-reactivity-of-phenylacetylene-macrocycles-properties-of-pam1-are.jpg)