Biodiversity metrics – a way forward Ed Rowe. Let’s GROW Goal Reality Options Way forward.
15
Biodiversity metrics – a way forward Ed Rowe
-
Upload
calvin-gardner -
Category
Documents
-
view
219 -
download
0
Transcript of Biodiversity metrics – a way forward Ed Rowe. Let’s GROW Goal Reality Options Way forward.
Biodiversity metrics – a way forward
Ed Rowe

Let’s GROW
GoalRealityOptionsWay forward

Principles
“Biodiversity” means different things to different peopleWe need an operational definition...on a single axis Wilfried Winiwarter: “only one dimension (endpoint) possible”
0 5 10 15 20 25 30 35 40 4505
101520253035
N deposition kg ha-1 yr-1
Spec
ies
Rich
ness
0 5 10 15 20 25 30 35 40 450
0.20.40.60.8
11.21.41.6
N deposition kg ha-1 yr-1
Stru
ctur
al in
tegr
ity

Goal: one metric (per habitat)
Index reflectingno net loss of biodiversity
N deposition
EUNIS classLv 3? (G1.6)

Reality
• Biodiversity is not easy to define• We have been discussing this topic for many years• The Call for Data 2012-14 gave us the opportunity to escape

Reality
slope
Ndep (eq ha-1 yr-1)average of range studied
R2 = 0.0001
Predicted by regression
Slope of Biodiversity Metric
vs. N deposition plot
Jaap Slootweg Summary of NFC responses to CCE Call for Data 2012-14

Are we using the right metrics?
Dani Kurz, Beat Achermann (Preliminary results, will be updated!)

Must N deposition damage biodiversity?
For the N pollution impacts research community – yes, obviously
we could just use deposition rate as an impact metric
...but, biodiversity specialists and the public don’t think of biodiversity in terms of nitrogen – sorry.
Although, nutrient-poor, less-productive habitats are usually thought of as having greater nature conservation value

“Why don’t we just...”
...use species-richness?
valued habitats are sometimes relatively species-poor
...use an index of even-ness, e.g. Shannon or Simpson?
valued habitats are sometimes dominated by one species
...use scarce / protected species
scarce species are often not present
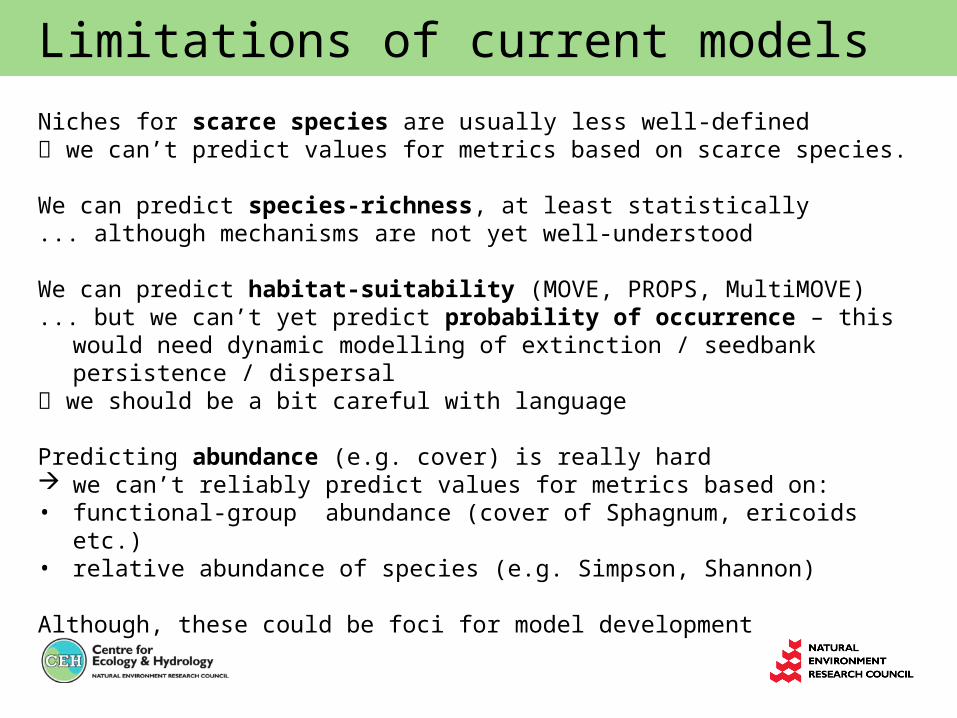
Limitations of current models
Niches for scarce species are usually less well-defined we can’t predict values for metrics based on scarce species.
We can predict species-richness, at least statistically ... although mechanisms are not yet well-understood
We can predict habitat-suitability (MOVE, PROPS, MultiMOVE) ... but we can’t yet predict probability of occurrence – this would need
dynamic modelling of extinction / seedbank persistence / dispersal we should be a bit careful with language
Predicting abundance (e.g. cover) is really hard we can’t reliably predict values for metrics based on:• functional-group abundance (cover of Sphagnum, ericoids etc.)• relative abundance of species (e.g. Simpson, Shannon)
Although, these could be foci for model development

Options
• Need to be discussed
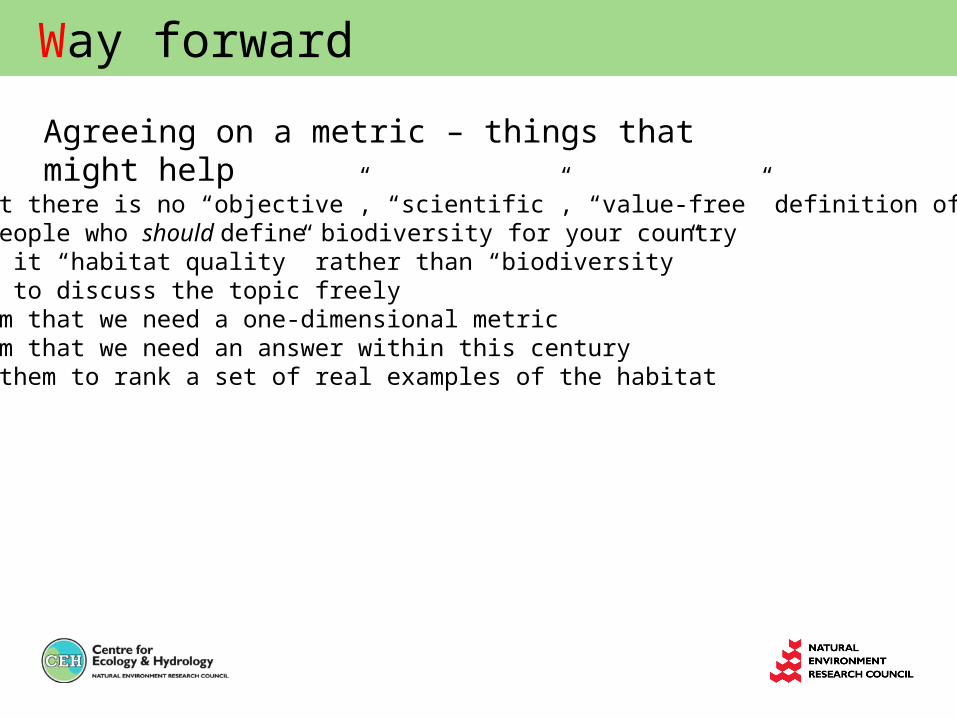
Way forward
• Accept that there is no “objective”, “scientific”, “value-free” definition of biodiversity• Find the people who should define biodiversity for your country• Maybe call it “habitat quality” rather than “biodiversity”• Allow them to discuss the topic freely• Remind them that we need a one-dimensional metric • Remind them that we need an answer within this century• Maybe ask them to rank a set of real examples of the habitat
Agreeing on a metric – things that might help

12 examples of “dry grasslands”
Species-richness
Ranking according to metric
Ranking according to specialists
CSM positives CSM negatives CSM +ves minus -ves
Forb / Total cover
Similarity to reference (mean) Similarity to reference (max)
Mean Ellenberg N
Rowe et al. 2014DivMet/AQ0828 report
E1 Dry grasslands

Way forward
If you really can’t get your biodiversity experts to engage...maybe you will have to decide.
UK and NL seem to be settling on “positive indicator-species”, a small set of typical/distinctive species for each EUNIS class
Conveniently, values for metrics based on these usually decrease with more deposition
Other metrics are available