BIODEGRADATION OF PERSISTENT ORGANIC POLLUTANTS …
54
IAMB 201020-06 1 BIODEGRADATION OF PERSISTENT ORGANIC POLLUTANTS USING ALGAE AND CYANOBACTERIA: AROMATIC AMINES DEGRADATION AFTER AZO DYE DECOLORIZATION ALEJANDRO BRAVO HERMIDA 200611209 DEGREE PROJECT FOR BACHELOR’S DEGREE IN ENVIRONMENTAL ENGINEERING SUPERVISORS: SERGIO FERNANDO BARRERA TAPIAS BO MATTIASSON LUND, SWEDEN UNIVERSIDAD DE LOS ANDES Depto. de Ingeniería Civil y Ambiental LUNDS TEKNISKA HÖGSKOLA (LUNDS UNIVERSITET) Dept. of Biotechnology 2010
Transcript of BIODEGRADATION OF PERSISTENT ORGANIC POLLUTANTS …

IAMB 201020-06
1
BIODEGRADATION OF PERSISTENT ORGANIC POLLUTANTS USING ALGAE AND CYANOBACTERIA:
AROMATIC AMINES DEGRADATION AFTER AZO DYE DECOLORIZATION
ALEJANDRO BRAVO HERMIDA
200611209
DEGREE PROJECT FOR BACHELOR’S DEGREE IN ENVIRONMENTAL ENGINEERING
SUPERVISORS:
SERGIO FERNANDO BARRERA TAPIAS
BO MATTIASSON
LUND, SWEDEN
UNIVERSIDAD DE LOS ANDES
Depto. de Ingeniería Civil y Ambiental
LUNDS TEKNISKA HÖGSKOLA (LUNDS UNIVERSITET)
Dept. of Biotechnology
2010

IAMB 201020-06
2
ACKNOWLEDGEMENTS
I sincerely acknowledge:
In the first place, God, who has guided me and illuminated me, and who has made all this possible.
My parents, whose effort and support have been indispensable for me to complete this work.
Professors Sergio Fernando Barrera and Bo Mattiasson, my project supervisors, for their wise
advice and guidelines let me complete a good thesis work.
Adriano Cano Cuervo, coordinator for undergraduate programs at the Department of Civil and
Environmental Engineering, Universidad de los Andes, for all the help provided.
And all the people, who work in the laboratories at Uniandes and at LTH (Dept. of Biotechnology),
who patiently helped me with my work. In special, to Aida Juliana Martínez, Leonela Silva, Olga
Gómez, Marisa Punzi, David Svensson, Cecilia Orellana, Martin Hedström, Malik Badshah, and all
those people who were there ready to share their knowledge and help.
IAMB 201020-06
3
CONTENTS
1. INTRODUCTION …………………...…………………………………………………………………………………………… 4
2. OBJECTIVES OF THE STUDY ……………………………………………………………………………………………………. 5
2.1 GENERAL OBJECTIVE …………………………………………………………………………………………………………… 5
2.2 SPECIFIC OBJECTIVES ............................................................................................................... 5
3. METHODOLOGY …………………………………………………………………………………………………………………….. 6
3.1 METHYL ORANGE DECOLORIZATION …………………………………………………………………………………… 6
3.2 AROMATIC AMINES DEGRADATION PART I ………………………………………………………………………….. 8
3.2.1 ANILINE EXPERIMENT ……………………………………………………………………………………………………….. 8
3.2.2 P-PHENYLENE DIAMINE EXPERIMENT ……………………………………………………………………………… 11
3.2.3 2,5-DIMETHYL ANILINE EXPERIMENT …………...……………………………………………………...…………. 11
3.2.4 ANILINE DUPLICATE EXPERIMENT …………………….…………………………………...…………………….... 14
3.2.5 2,5-DIMETHYL ANILINE DUPLICATE EXPERIMENT ................................................................ 14
3.3 AROMATIC AMINES DEGRADATION PART II ........................................................................... 14
3.3.1 DMA EXPERIMENT I ............................................................................................................. 14
3.3.2 DMA EXPERIMENT II ............................................................................................................ 15
3.3.3 DMA EXPERIMENT III ........................................................................................................... 15
4. RESULTS, ANALYSIS AND DISCUSSION ..................................................................................... 16
4.1 METHYL ORANGE DECOLORIZATION ..................................................................................... 16
4.2 AROMATIC AMINES DEGRADATION PART I ........................................................................... 19
4.2.1 ANILINE EXPERIMENT .......................................................................................................... 19
4.2.2 P-PHENYLENE DIAMINE EXPERIMENT ................................................................................. 22
4.2.3 2,5-DIMETHYL ANILINE EXPERIMENT .................................................................................. 24
4.2.4 ANILINE DUPLICATE EXPERIMENT ....................................................................................... 26
4.2.5 2,5-DIMETHYL ANILINE DUPLICATE EXPERIMENT ............................................................... 27
4.3 AROMATIC AMINES DEGRADATION PART II ........................................................................... 28
4.3.1 DMA EXPERIMENT I ............................................................................................................. 28
4.3.2 DMA EXPERIMENT II ............................................................................................................ 30
4.3.3 DMA EXPERIMENT III ........................................................................................................... 31
4.4 CELL IDENTIFICATION .............................................................................................................. 33
5. CONCLUSIONS ............................................................................................... ............................ 41
BIBLIOGRAPHY .................................................................................................. ............................ 42
ANNEXES ....................................................................................................................................... 45

IAMB 201020-06
4
1. INTRODUCTION
The decolorization of dyes has been widely studied during the past years. Special focus has been
put on azo dyes (those whose molecular structure contains a –N=N- bond), because these kind of
compounds are ones of the most commonly used among industries, and are often toxic and
carcinogenic [5, 7-10, 12]. Several treatments have been proposed, regarding the importance of
color removal and detoxification of industrial wastewaters, since these kind of pollutants go
through conventional treatments unaffected [1, 9]. Such treatments, include photocatalysis
(usually mediated by TiO2), UV radiation, bacterial, algal and fungal biodecolorization, among
others. Recently, much research has been made about the ability of algae and cyanobacteria to
degrade azo dyes.
All of the above mentioned alternatives have shown excellent, or at least, relatively good results in
dye decolorization. However, to the best of our knowledge, studies have not gone any further
than identifying the decolorization metabolites, the aromatic amines, and do not give much
importance to the latter compounds, which are often equally or even more toxic than the dye
itself [9]. In fact, knowledge about degradation of such compounds by the different alternatives,
and specially, by algae and cyanobacteria, is scanty and more research about that is worth doing.
Therefore, the present work focuses on the capacity of algae and cyanobacteria to degrade
aromatic amines, rather than to decolorize an azo dye, which was, nevertheless, also done.
Decolorization of azo dyes occurs when there is a cleavage of the azo bond (-N=N-), which is the
chemical structure responsible for color in the molecule [24]. In addition, almost without
exception, azo dyes also contain at least one aromatic ring at each side of the azo bond.
Regardless on the degradation pathway the dye undergoes (photocatalysis, biodegradation), the
immediate metabolites generated are, therefore, aromatic amines [5, 8-10, 12, 19]. These
compounds are of equal importance since, as stated before, they can eventually be more toxic
than the parent compound, and should be removed as well before releasing the effluent into
natural water bodies.
Algae and cyanobacteria have shown to be capable of decolorizing azo dyes with at least relatively
good efficiency [6, 12]. Parikh et al. 2005, found about 40 different species of cyanobacteria living
in very polluted effluents from several dye stuff industries in India [13], while many other
researchers found that different species of algae and cyanobacteria can degrade azo dyes [6, 11,
12, 16, 19, 20, 21], aniline [12, 15, 17, 19], and other colorants [12], indicating that these
microorganisms can be able to adapt to such compounds. Three different degradation pathways
have been proposed when decolorizing with these microorganisms: biodegradation by azo
reductase enzymes [12, 19], and photo-generated reactive species by the cells [15, 17, 18]. The
latter pathway is surprising, since it is exactly the same principle as that of traditional
photocatalysis. Cáez and Barrera 2005, suggested that chlorophyll is the molecule responsible for
the photo-generation of reactive species in the cell [1].

IAMB 201020-06
5
2. OBJECTIVES OF THE STUDY
2.1 General objective
The main objective of the present work is to evaluate the ability of algae and cyanobacteria to
degrade aromatic amines after decolorizing an azo dye.
2.2 Specific objectives
Evaluate the capability of previously unexposed algae and cyanobacteria to decolorize an
azo dye, Methyl Orange.
Evaluate the response of the same algae and cyanobacteria to the presence of primary
aromatic amines, namely, aniline, p-phenylene diamine and 2,5-dimethyl aniline, and their
capability to remove such compounds from water.
State whether there is true biodegradation, or else, if removal is only due to adsorption of
the aromatic amines to the biomass.

IAMB 201020-06
6
3. METHODOLOGY
Although the methods employed for all experiments were nearly the same, each experiment was
carried on with specific variations, which are explained in the next sections.
3.1 Methyl orange decolorization
The Dye
Decolorization of an azo dye was the first step to take for the present study. Methyl orange is an
azo dye, often used as a pH indicator at laboratory. Thereby, it is easily obtained. It has got a
classical and simple molecular structure, according to Parshetti et al. 2010: one aromatic ring with
a sulphonate group (SO3) on the one side of the azo bond, and another aromatic ring with a N-
dimethyl group on the other side [21] (see Annex 1).
The algae
The algae and cyanobacteria were collected from stones surrounding a small mountain stream
nearby the city of Bogotá, Colombia. Their natural environment was rather cold and poorly
illuminated, due to the height of the place (nearly 2700 meters over the sea level), and the
abundant vegetation, which blocks much of the sunlight. Because it is a natural stream, coming all
the way down from the unspoiled mountain, the microorganisms certainly had never been
exposed to such pollutants before.
Use of consortia of microorganisms was advisable; when to be applied for major scale treatment,
it is practically impossible to maintain a single strain of microorganisms without being
contaminated, as well as the proper conditions for it to grow and degrade. Also, it has been
reported in literature that active consortia of microorganisms (although bacteria were used for
this case) has better results in degradation than single strains [9].
The growth medium
The growth medium used for growing the algae is described below in Table 1:
Table 1: BG-11 medium for growing cyanobacteria
Nutrient Amount (grams per liter of distilled water)
MgSO4•7H2O 0.075 CaCl2•2H2O 0.036 K2HPO4•3H2O 0.03 Na2CO3 0.02 Citric Acid 0.006

IAMB 201020-06
7
H3BO3 * 2.86 MnCl2•4H2O* 1.84 ZnSO4•7H2O* 0.222 Na2MoO4•2H2O* 0.39 CuSO4•5H2O* 0.08
*Micro nutrients. These were poured in the amounts specified into a separate liter of water. 1 mL
of this solution was added to the main growth medium solution.
The preparation of this growth medium was done with some variations with respect to the
commonly used one: no nitrogen source of any kind was added, in order to force the growth of
nitrogen fixing cyanobacteria. Neither ferric EDTA was added, as the EDTA may constitute a carbon
source for non-photosynthetic organisms, whose presence was not desired for this study. Even
though this was done, some of these compounds (nitrogen and organic carbon containing) may
have come within the algae samples, allowing subsequent growth of many undesired
microorganisms, especially protozoa. Algal and cyanobacterial biomass, living or dead, itself, may
have served as a carbon source, as well as the citric acid, which was not used for the following
experiments. But, in spite of all this, the biomass was predominantly constituted by algae and
cyanobacteria, which was good enough for the study. Trying to kill everything that is not
cyanobacteria, would have probably been worthless, time consuming, and would have, perhaps,
misleaded the project from its main goal, so it was not done.
Procedures
Two glass bottles, of 1 liter capacity, were filled with 200 mL of growth medium. Samples were
collected and released into both bottles. Thereafter, the dye was added to both solutions in
different concentrations. One bottle had an initial concentration of 25 mg/L of methyl orange
(MO), and the other one had 5 mg/L of the same chemical. The bottle containing 25 mg/L MO was
named M1 and the one containing 5 mg/L MO was named M2.
The concentration of MO in each solution was monitored by color measuring through
spectrophotometry. Three mL of solution was taken and poured into a 3 mL volume, 1 cm path
length, glass made cubette for spectrophotometry, and analyzed with a visible-light
spectrophotometer. Scan was made from 315 nm to 700 nm, and the maximum absorbance peak
was found at 460 nm, being this consistent with literature [1, ]. The removal efficiency was
calculated as follows:
Where:
%E is the removal efficiency, expressed as a percentage;
Acl is the absorbance at 460 nm of the solution before adding the MO;
A0 is the absorbance at 460 nm of the solution just after having added the MO; and

IAMB 201020-06
8
Ai is the absorbance at 460 nm of the solution at the time i of monitoring.
Monitoring was done every two or three days. The pH was kept around 7.1, since it is known to
affect the color intensity of a MO solution. Temperature was not controlled. It was subject to
environmental conditions. The Bottles were placed outside, in a terrace of the 8th floor of the
Mario Laserna Building, part of the main campus of the Universidad de los Andes, in Bogotá,
Colombia. The purpose of this was to approach the whole sunlight available, so that the
experiment would be conducted under more realistic conditions than those of a laboratory scale
experiment. The bottles were covered with plastic paper, to avoid insects and other external
things (like dust or other things that could eventually fall into the solutions, altering the process)
to get in, but small holes were opened for the air to circulate. The experiment was completed
within three weeks.
3.2 AROMATIC AMINES DEGRADATION PART I
All the following experiments were carried on in the laboratories of the Department of
Biotechnology, at Lunds Tekniska Högskola (Lunds Universitet), in Lund, Sweden. Since the climate
conditions there were not the same, and the sunlight availability is much less due to the time of
the year (autumn – winter), the experiments were run indoors, at room temperature (about 20°C)
and with permanent artificial fluorescent light (no light – dark periods). These experiments were
performed in order to evaluate if the same algae and cyanobacteria used in the previous
experiment can also survive in presence of aromatic amines, remove them from water, and if the
removal pathway is adsorption or true biodegradation. Three primary aromatic amines were used:
aniline (ANL), p-phenylene diamine (PFDA) and 2,5-dimethyl aniline (DMA).
3.2.1 ANILINE EXPERIMENT
Cell gathering
Two samples of cells were taken from each bottle after the MO experiment. The cells were
separated from the dye containing water (none of the solutions was 100% decolorized, as shown
further in the Results section) by centrifuging at 4000 rpm for 20 minutes. After separation, cells
corresponding to M1 and M2 were grown in two glass flasks apart, each one of 200 mL capacity.
Each flask had been previously filled with 200 mL of growth medium. The flasks were shaken in
order to spread the cells all over the space. The cells were grown for a week under permanent
artificial light, without adding any chemical or pollutant.
Growth medium
The growth medium used for this, and the following experiments, was somehow different to the
first one, shown above. No organic substance was added, and the chemicals used changed

IAMB 201020-06
9
according to availability in the laboratory. For those which were not found, the closest chemicals
available were used, and a source of iron was also added. Table 2 shows the growth medium
prepared for these experiments:
Table 2: varied BG-11 medium used for the aromatic amines experiments.
Nutrient Amount (grams per liter of distilled water)
MgSO4•7H2O 0.075 CaCl2•2H2O 0.036 K2HPO4 * 0.03 Na2CO3 0.02 Fe(SO4)3 * 0.003 H3BO3 0.003* MnCl2•4H2O 0.002* ZnSO4•7H2O 0.0002* Na2MoO4•2H2O 0.0004* CuSO4•5H2O 0.0001*
*Chemical or amount changed, depending on availability. For the micronutrients, there was no
solution apart prepared, but they were poured directly into the main solution in the amounts
specified.
Procedures
After a week of growing, the two solutions M1 and M2 were injected with aniline. In order to state
if the aniline removal was truly due to the presence of algal and cyanobacterial cells, or else, to the
presence of growth medium, or either a spontaneous reaction in water, two control solutions
were prepared: one containing only growth medium and aniline (no cells), named B, and another
containing only distilled water and aniline, named W. All solutions were prepared in 200 mL glass
flasks. (Recalling, M1 is the solution containing the cells which were exposed to 25 mg/L of MO,
and M2 is the solution containing the cells exposed to 5 mg/L of MO).
The aniline was added to the solutions this way: 1 mL of pure aniline (approximately equal to 1
gram) was dissolved into 100 mL of distilled water. From this solution, 2 mL were taken and
poured into each flask. That makes 1 mL of aniline aqueous solution per 100 mL of solution.
The concentration of aniline in the solutions was monitored through UV-spectrophotometry, by
following the UV absorbance peak, which is found at 280 nm for this compound. Samples of 1 mL
were taken and centrifuged at 3500 rpm for 20 minutes (in this experiment, it was only done for
the final spectrophotometry test. In all the next experiments, it was done for all tests). A 1 mL
volume, 1 cm path length, quartz made cubette was used for the analysis. The removal efficiency
was calculated in terms of the dilution, as follows:

IAMB 201020-06
10
Where:
Do is the initial dilution (mL ANL aqueous solution per 100 mL water), calculated in terms of the
initial absorbance;
Di is the dilution at the time i of monitoring, calculated in terms of the absorbance read at the
same time;
Ao, Acl, Ai and %E are the same parameters explained above, in the MO experiment.
Equations 2 and 3 correspond to the general equation obtained empirically by a calibration curve
for aniline; into 100 mL of distilled water, 0.1 mL of the aniline aqueous solution were poured, the
UV spectrum was obtained and the absorbance at 280 nm was read. 0.15 mL of ANL aqueous
solution was then added, and the same was done. This procedure was repeated until a dilution of
1.5 mL of ANL aqueous solution per 100 mL of distilled water was reached. The data were
collected and analyzed through Microsoft Excel. A linear regression was done, and the resulting
general equation was:
Where Y was the absorbance and X the dilution. The same was done with DMA, obtaining, of
course, different expressions. The Graph which plots the calibration curve (Absorbance vs.
Dilution) for aniline in water can be seen in Annex 2-a.
HPLC analysis
In order to confirm the results obtained by UV spectrophotometry, HPLC was done. An initial and a
final test were done in order to give more reliability. In addition, HPLC was also performed to
analyze the biomass, so that it could be stated if aniline had been adsorbed to the cells, and in that
case, how much of it was adsorbed.
HPLC procedures
Samples of 1 mL were taken from the solution flasks and centrifuged at 13000 rpm for 20 minutes.
The supernatant (water) was separated with a 2 mL syringe, and filtered through 0.45µm pore
nylon filters, and dropped into the HPLC vials. A C18 column, 250 mm x 4.6 mm, was used. The
mobile phase was isocratic, 60/40 water/acetonitrile in volume. The flow rate was set in 1 mL/min,

IAMB 201020-06
11
the detection wavelength set at 280 nm and the retention time was of 25 minutes. The standard
chromatogram for aniline in water is shown in Annex 3-a.
Cell extraction
Possible aniline adsorbed to the cells was extracted as follows: 1 mL of the each solution, rich in
cells, was taken and centrifuged at 13000 rpm for 20 minutes. The supernatant was removed and
methanol was added. Cells were mashed in presence of methanol, and the methanol-cells solution
was again centrifuged at the same speed for the same time. The supernatant (methanol with cell
extracts) was removed and filtered through a 0.45µm pore nylon filter and dropped into the HPLC
vials. The HPLC parameters were exactly the same as the ones specified above. All the above
mentioned procedures were done according to those employed by Wang et al. 2007 [15]. The
standard chromatogram for aniline in methanol is shown in Annex 3-b.
3.2.2 P-PHENYLENE DIAMINE EXPERIMENT
After the experiment with Aniline, M1 and M2 were to be exposed to a some more complex
compound. Para-phenylene diamine (PFDA) was selected. New control solutions B and W were
prepared. 0.1 grams of PFDA were added to 200 mL of distilled water, and 2 mL of the latter
solution were poured into each solution flask. The growth media used, as well as the procedures,
were exactly the same as those employed for the ANL experiment. However, as it will be shown in
the Results section, calculations were not necessary.
3.2.3 2,5-DIMETHYL ANILINE EXPERIMENT
Once concluded the PFDA experiment, the same M1 and M2 were exposed to a different, also
more complex aromatic amine. 2,5-dimethyl aniline (DMA) was used. Again, new solutions B and
W were prepared. 0.05 mL (approximately equal to 0.05 g) of DMA were poured into 100 mL of
distilled water. 2 mL of this DMA aqueous solution were poured into each solution flask. Once
again, the same growth media and procedures were employed, except that the DMA peak is found
at 284 nm. Thereby, this was the detection wavelength for the HPLC analysis. The retention time
was also changed to 15 minutes. The calculations, nonetheless, are different.
Calculations
The calibration curve was obtained exactly in the same way as with the ANL. The general equation
which describes the Absorbance at 280 nm in terms of the Dilution (in mL per 100 mL) is the
following:

IAMB 201020-06
12
Where Y is the Absorbance, and X is the Dilution. The percentage of removal or efficiency,
however, could not be calculated following the same methods used for aniline, because, since the
concentration is much lower, the UV peak is susceptible of changes in the base spectrum (the
spectrum of the solution, obtained before addition of DMA), and cannot be easily monitored, at
least in a numerical sense. Thus, it was necessary to develop a calculation algorithm, simple
although slanted, in order to estimate the removal percentage. The algorithm is now explained:
Figure 1-a. shows the spectrum of DMA at a dilution of 0.75 mL/100 mL in distilled water, while
Figure 1-b. shows the spectrum of DMA diluted in a solution containing algae plus growth medium
(upper curve), and the spectrum of the same solution before adding the compound (lower curve):
0
0,02
0,04
0,06
0,08
0,1
0,12
0,14
0,16
0,18
235 245 255 265 275 285 295 305
Fig. 1-a.

IAMB 201020-06
13
By comparing both graphs, it is clear that the DMA spectrum is affected by the solution’s
spectrum; the resulting spectrum (upper curve, Fig 1-b.) is the sum of absorbances of both spectra.
Hence, when an important quantity of DMA is removed from water, the peak gradually moves
from 282 nm (where it initially appears) towards approximately 276 nm. From the calibration
curves, it was determined that the real DMA UV peak was found at 284 nm. A reference point was
set at 261 nm, where the lowest point, or valley, is situated. The difference in absorbance between
the peak at 284 nm and the point at 261 nm was measured from the calibration curves, and was
also found to be linearly correlated to the Dilution. Equation 7 expresses the absorbance in terms
of the dilution:
Where dA is the absorbance at 284 nm minus the absorbance at 261 nm and D is the dilution. The
difference between both points was then measured for the spectra of each solution before the
addition of DMA, which is negative. It was then assumed that such difference would be constant
throughout the experiment, which is not necessarily correct, but could give an approximation
good enough. Then, every time the UV spectrum was monitored, this difference was measured,
and the dilution (in mL/100mL) was calculated this way:
0
0,05
0,1
0,15
0,2
0,25
0,3
0,35
0,4
0,45
0,5
235 245 255 265 275 285 295 305
Fig. 1-b.

IAMB 201020-06
14
Where dAr is the “real” difference in absorbance, dAi is the difference in abs. measured at the day
i and dAo is the difference measured before adding DMA, assumed as a constant (< 0). The result
was then replaced in equation 7, and D was left in terms of dAr and calculated. The removal
percentage was calculated according to Equation 4. The calibration curves for DMA in terms of
absorbance at the peak point and for the difference in absorbance between the peak and the low
point, are shown in Annexes 2-b and 2-c respectively.
3.2.4 ANILINE DUPLICATE EXPERIMENT
During the first ANL experiment, it had happened that, in the control solution B, after some 10
days, new algae had surprisingly grown in it and removed all the aniline. The cells of solutions M1
and M2 had been affected by the presence of PFDA and seemed to have trouble for living and
growing. Hence, these new algae, grown in B, were taken for carrying on a second experiment
with ANL. In this case, three 100 mL glass flasks were used. One was filled with 50 mL of growth
medium and 50 mL of the B solution (plenty of algae) and named M1, the next, filled with 100 mL
of growth media and named B, and the third one, with 100 mL of distilled water and named W.
The latter two, were kept again as control solutions. The procedures followed were exactly the
same as in the first ANL experiment, except for the HPLC column, which was changed for a 150
mm x 4.6 mm. The HPLC retention time was set at 15 minutes. The new standard chromatograms
for aniline in water and methanol are shown in Annexes 4-a and 4-b respectively.
3.2.5 2,5-DIMETHYL ANILINE DUPLICATE EXPERIMENT
Since the results obtained in the first were not clear, a duplicate of the DMA experiment was
found to be necessary. The same procedures as those described in the ANL duplicate and the first
DMA experiments were followed. Annexes 5-a and 5-b show the standard chromatograms for
DMA in water and methanol respectively.
3.3 AROMATIC AMINES DEGRADATION PART II
After the DMA duplicate, research was deepened in DMA removal by algae, in order to test the
capacity of the latter to remove such compound. The procedures followed were the same as those
described above, unless otherwise stated.
3.3.1 DMA EXPERIMENT I
Solutions M2 from the first DMA experiment and M1 from the DMA duplicate experiment were
taken for the following experiments, and renamed DMA1M2 and DMA2M1 respectively. The same
amount of DMA was added. Meanwhile, solutions M1 and B from the ANL duplicate experiment
were taken and renamed ANL2M1 and ANL2B respectively, and re-injected with a higher dilution

IAMB 201020-06
15
(1.5 Ml/100Ml) of aniline, in order to grow them faster. No HPLC tests were carried on, either in
this, or in the 2nd DMA experiment.
3.3.2 DMA EXPERIMENT II
Once completed the last experiment, samples DMA1M2, DMA2M1, ANL2B and ANL2M1 were re-
filled with 1 mL/100mL DMA aqueous solution. 1 mL/100mL was injected to solution DMA2M1.
Before spectrophotometry analysis, samples were centrifuged at a speed of 7000 rpm for 10
minutes. The solutions were monitored for one week.
3.3.3 DMA EXPERIMENT III
This experiment was quite similar to the latter two, but with some differences: the centrifugation
speed was set at 13000 rpm for 15 minutes, before spectrophotometry; samples were not taken
daily; those solutions showing the fastest degradation were immediately refilled with DMA. HPLC
cell tests were done by the end of the experiment.

IAMB 201020-06
16
4. RESULTS, ANALYSIS AND DISCUSSION
4.1 METHYL ORANGE DECOLORIZATION
As it was expected, the decolorization percentage was much higher in M2 than in M1, as the MO
initial concentration was less in the first one than in the second one. Absorbances were measured
nine times during the three weeks for both solutions. As it can be seen from Figure 2-a, M1
showed a very small removal at the beginning. Such removal can be due only to adsorption of the
dye to the cells. In fact, important removal rates were only registered by the end of the
experiment, as shown in Figures 2-b and 2-c.
0
0,2
0,4
0,6
0,8
1
1,2
1,4
1,6
1,8
310 360 410 460 510 560
Fig. 2-a: Spectra of M1 in time
Abs0
Abs (cl)
Abs1
Abs2
Abs3
Abs4
Abs5
Abs6
Abs7
Abs8
Abs9

IAMB 201020-06
17
It is likely to have happened that, since the algae and cyanobacteria had never been exposed to an
azo dye before, MO removal in the first week might have probably been a consequence of
adsorption of the dye to the cells, not to any kind of degradation. Something different occurs,
nevertheless, with M2. A particularly high decolorization was registered only two days after
exposure to MO, up to around 17%. However, after five days, the removal had only been of an
additional 3% of the initial absorbance. The removal rate was kept low and then shifted again,
showing a very irregular behavior, as seen in Figures 3-a, 3-b and 3-c.
0
0,2
0,4
0,6
0,8
1
1,2
1,4
1,6
0 5 10 15 20
Fig. 2-b: Absorbance at 460 nm vs time (days) in M1
Abs.
0
5
10
15
20
25
30
35
40
0 5 10 15 20
Fig 2-c: % removal vs time (days) in M1
%Rem

IAMB 201020-06
18
0
0,05
0,1
0,15
0,2
0,25
0,3
0,35
0,4
0,45
310 360 410 460 510
Fig. 3-a: spectra of M2 in time
Abs (cl)
Abs0
Abs1
Abs2
Abs3
Abs4
Abs5
Abs6
Abs7
Abs8
Abs9
0
0,05
0,1
0,15
0,2
0,25
0,3
0 5 10 15 20
Fig 3-b: absorbance of M2 vs time (days)
Abs.

IAMB 201020-06
19
Such an irregular behavior can be explained by changing environmental conditions. Since the color
was much less intense in M2 than in M1, sunlight could have somehow been responsible for some
of the decolorization, either directly (UV light action on the MO molecules) or indirectly (possible
cell-generated reactive species). This could hence explain the high initial removal, combined with
cell adsorption. But when comparing Figs. 2-c and 3-c, a very similar behavior is noticeable,
indicating similar responses, which agrees with the fact that no cell had had any contact with a
pollutant like MO, and thus, no enzymatic reaction should be expected. Photosynthesis did not
seem to have any correlation with color removal; pH always shifted to high values (between 8 and
9) and, as a photosynthesis indicator, did not have any clear relation with the absorbance
measured. Recalling, pH was adjusted to 7 before spectrophotometry analysis.
4.2 AROMATIC AMINES DEGRADATION PART I
4.2.1 ANILINE EXPERIMENT
Wang et al. 2007 had achieved about 70% degradation of aniline by microscopic algae within only
four hours [15]. The present experiment did not show, nevertheless, the same results. After four
days of being exposed to aniline, both M1 and M2 algae did not show further removal than nearly
30%. However, a significant shift in removal was presented: control HPLC test was done, and
almost no aniline was found in either one solution containing algae (only around 1.1% of the initial
aniline was still present in M1 solution, and less than 1% in M2), while the aniline peak was still
present in B and W. Figures 4-a to 4-d, show the removal of aniline in each solution.
0
10
20
30
40
50
60
70
0 5 10 15 20
Fig 3-c: percentage removed vs time (days) by M2
%Rem

IAMB 201020-06
20
0
0,5
1
1,5
2
2,5
3
3,5
4
4,5
210 230 250 270 290 310
Fig. 4-a: Spectra of M1 in time
Before Add.
After Add.
Day 2
Day 4
Day9
0
0,5
1
1,5
2
2,5
3
3,5
4
4,5
210 230 250 270 290 310
Fig. 4-b: Spectra of M2 in time
Before Add.
After Add.
Day 2
Day 4
Day 9

IAMB 201020-06
21
As it can be seen, the yield for both cell solutions is quite similar. The initial relatively high aniline
removal might be due to reactions or adsorption between the compound and the growth media,
since the three solutions containing it, present the same curve shape. All these three solutions
presented an eventual change of color; at the beginning, the water was colorless (except for the
green in M1 and M2 due to chlorophyll), while a couple of days after addition, they acquired a
slight reddish-orange color. Thereafter, by the 7th day, M1 and M2 had this color no more, but
0
0,1
0,2
0,3
0,4
0,5
0,6
0,7
0,8
0,9
1
0 2 4 6 8 10
Fig. 4-b: ANL dilution in time (days)
M1
M2
B
W
0
10
20
30
40
50
60
70
80
90
100
0 2 4 6 8 10
Fig. 4-c: ANL removal percentage in time (days)
M1
M2
B
W

IAMB 201020-06
22
they had clearly turned green (much greener than at the beginning), which evidences cell growth.
B kept the reddish color for much longer, but, an interesting formation of flocs at the bottom of
the flask, as well as a very slim film on the water surface, were noticed. Flocks seemed to grow in
size and number within time and after two weeks of exposure, new algae had grown inside,
removing as well, all the aniline present. 7 days after addition, indeed, a considerable change in
aniline concentration was noticed. Since the spontaneous growth of algae coincided with a sudden
ANL disappearance, it can therefore be said, that cell growth and aniline removal are directly
correlated. Also, because the change in ANL concentration was shown faster in M1 and M2 than in
B, and indeed, a lot more than in W, it can be concluded that aniline is effectively removed from
water by algae and cyanobacteria. The small change in concentration in solution W, might be due
to molecule destruction by light, by oxygen in water, or else, to a physical process which might not
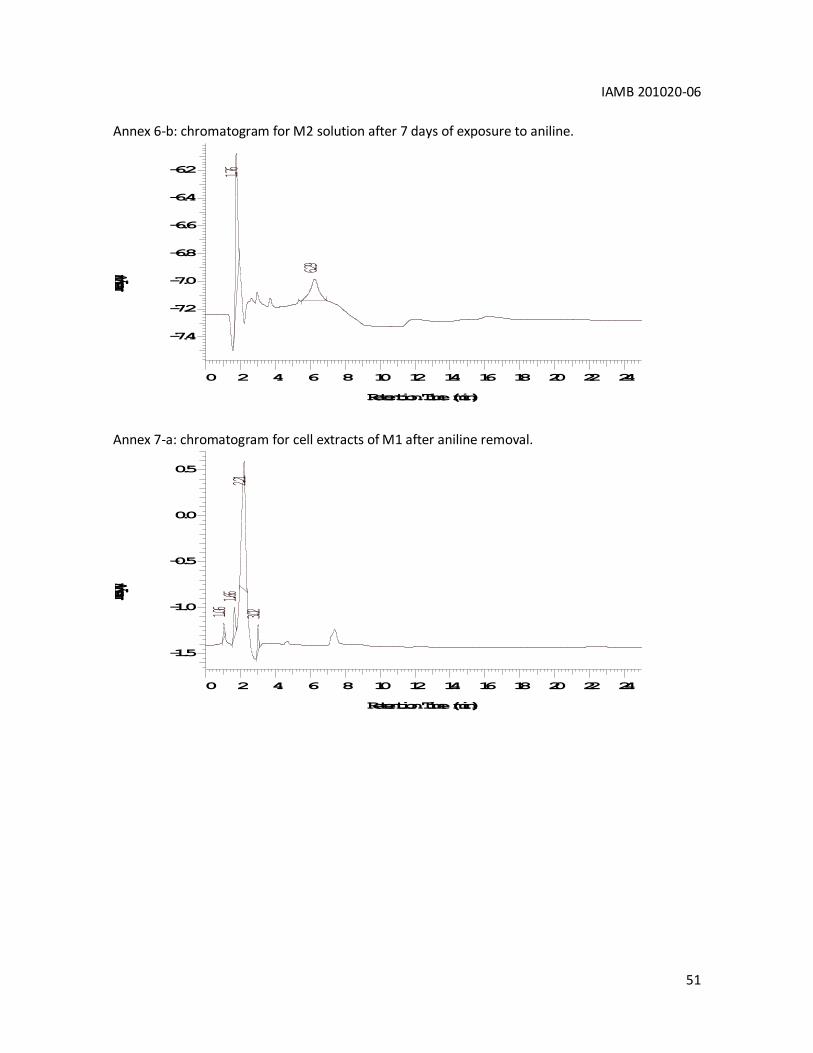
be volatilization of the compound. Annexes 6-a and 6-b show the chromatogram obtained after
one week of exposure for M1 and M2, respectively.
In order to state if aniline had been removed only due to adsorption to the cell biomass, cell
extraction with methanol was done, and analyzed through HPLC. Less than 1% of the initial aniline
was found in the cells, assuming 100% extraction by methanol. Nonetheless, even assuming lower
extraction values (~90% [15]), the percentage of aniline remaining in the cells would not be
greater than the above mentioned. Thus, it can be also concluded that aniline disappeared by
degradation pathways, and not by adsorption. The chromatograms obtained from cell extractions
of M1 and M2 can be seen in Annexes 7-a and 7-b respectively.
4.2.2 P-PHENYL DIAMINE EXPERIMENT
The experiment with PFDA was not successful at all. Apparently, when solid PFDA is poured into
water, it undergoes a spontaneous reaction; less than one hour before adding PFDA, water starts
acquiring a purplish wine color, which gets more and more intense with time. The color of the
PFDA aqueous solution (see section 3.2.2, page 10) was so intense, that no light could pass
through it. Besides, numerous small crystals of the same color were formed and stuck to the glass
walls of the flask. The same phenomenon happened in all four solutions. Indeed, the color was
much less intense, and no visible crystals were formed in the flask walls. Nevertheless, it was
clearly visible that the purple substance was adsorbed to the biomass, and showed to be
recalcitrant to the latter. In addition, the same phenomenon as that presented in the ANL
experiment’s B solution started to take place at the beginning, but the flocs were also covered
completely by the purple substance after some days (see Figure 6), and the cell growth was
completely inhibited. To support the hypothesis that PFDA reacts, deriving in another substance,
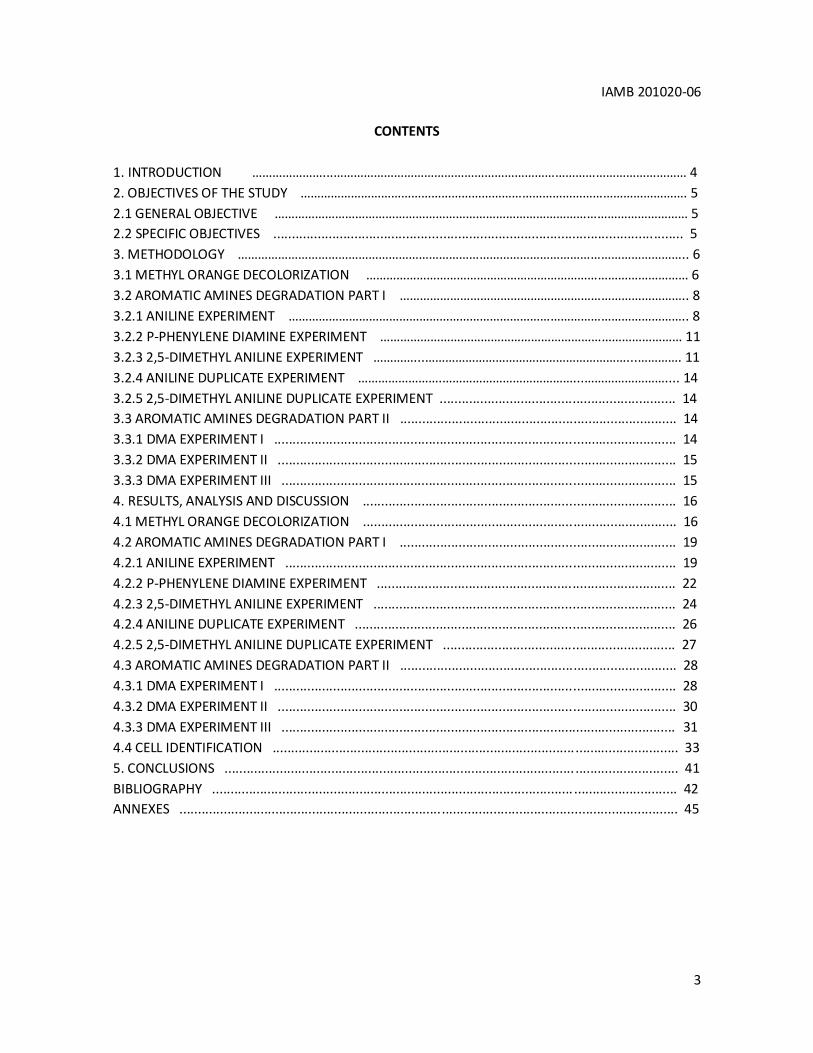
spectra of the solutions was obtained and showed in Figure 5:
IAMB 201020-06
23
The spectrum of W after 5 days is difficult to interpret, but it is evident that, since it was only
water and PFDA, a spontaneous reaction takes place, as there is no clear UV peak. A slight peak
was detected at 442 nm (visible region), indicating absorbance due to visible color. The product of
the reaction is, presumably, a complex azo dye, due to the color presented, and which might be
recalcitrant to photosynthesis. It is also worth mentioning that standard HPLC tests were to be
done with PFDA. When filtering the samples through the nylon filter, the colored substance was
adsorbed to the nylon fibers, and water came out absolutely transparent. The latter is another
reason to think that the purple product is an azo dye. No PFDA peak was found in HPLC tests. PFDA
was therefore, not suitable for the present study.
0
0,1
0,2
0,3
0,4
0,5
0,6
0,7
0,8
0,9
200 220 240 260 280 300 320 340 360
Fig 5: Spectra of PFDA in different solutions and time
W after add.
W Day 5
M1 Day 5
PFDA std.

IAMB 201020-06
24
Figure 6: photograph taken to a floc formed in B solution with the microscope. The huge dark spot
on the cells, corresponds to that purplish substance which adsorbed to the cells, and could be
seen by naked eye.
4.2.3 2,5-DIMETHYL ANILINE EXPERIMENT
DMA seemed to be a more reliable and challenging compound for this work, so it was selected for
the next experiment. The results were, however, not very clear as with aniline. In fact, only a small
DMA removal was registered, and was attributed to adsorption to the cells. Figures 6-a to 6-c
show, respectively, the spectra of M1 and M2 and the DMA removal yield:

IAMB 201020-06
25
0
0,02
0,04
0,06
0,08
0,1
0,12
0,14
210 230 250 270 290 310
Fig 7-a: Spectra of M1 in time
After Add.
Day 1
Day2
Day 3
Day 7
-0,02
0
0,02
0,04
0,06
0,08
0,1
0,12
0,14
210 230 250 270 290 310
Fig 7-b: Spectra of M2 in time
After Add.
Day 1
Day2
Day3
Day 7

IAMB 201020-06
26
A better response from M1, however, could be noticed by telling for the spectra, than that
estimated numerically. But, anyway, the total DMA removal was not good. This was expectable,
since, in first place, DMA is a more complex compound than aniline, and second, cells had
previously been negatively affected throughout the PFDA experiment. At the end, the results from
M1 and M2 were not different from those of W. It was thus, necessary to make a duplicate
experiment.
4.2.4 ANILINE DUPLICATE EXPERIMENT
The duplicate experiment with aniline showed even better results than the first one: four days
after exposure, the algae had completely degraded the aniline, while a considerable cell growth
was noticed. Again, the reddish color was present in the solution, but disappeared some days
later. Figure 7 shows the spectra in time of M1. The same phenomenon presented in the first ANL
experiment took place in B.
0
0,1
0,2
0,3
0,4
0,5
0,6
0,7
0,8
0,9
1
0 1 2 3 4 5 6 7 8
Fig 7-c: DMA removal by M1 and M2
M1
M2

IAMB 201020-06
27
Again, very few aniline was found among the cell extracts, confirming aniline degradation. The
chromatogram obtained can be seen in Annex 8.
4.2.5 2,5-DIMETHYL ANILINE DUPLICATE EXPERIMENT
The results obtained by the present experiment, are far different from those obtained in the first
one. Significant removal rates were registered, while an important percentage of DMA seemed to
be degraded. After four days of exposure to DMA, the algae could remove up to 85%
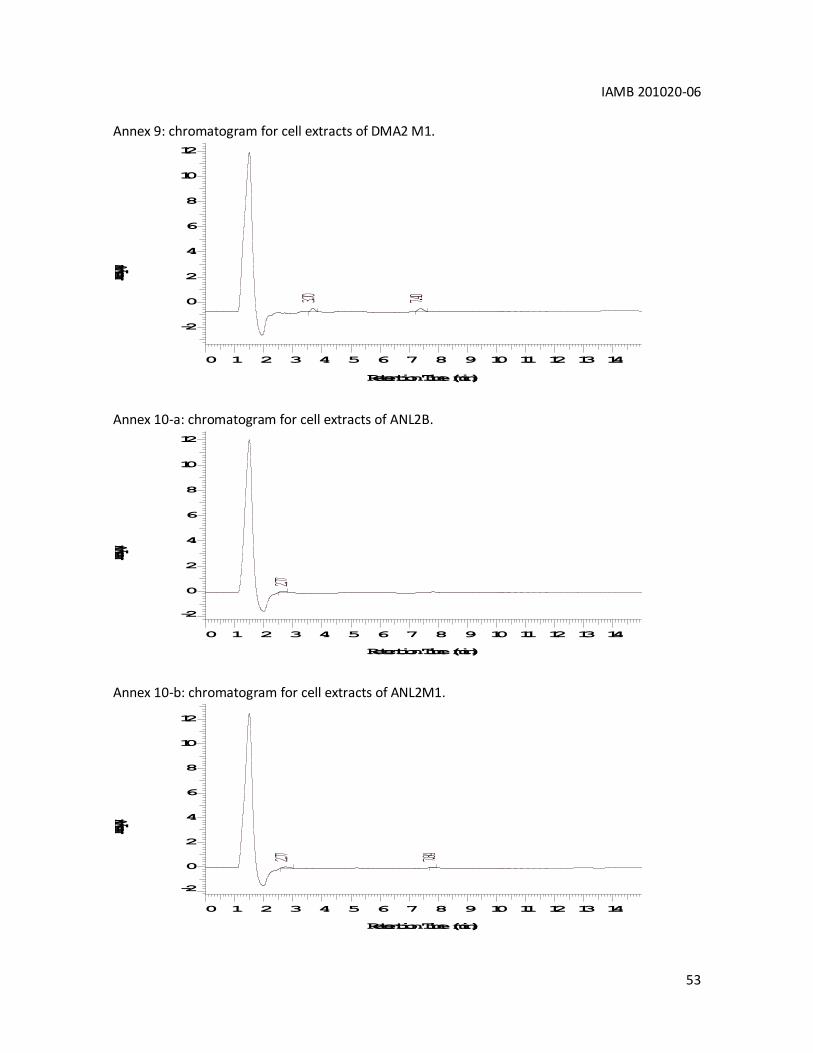
approximately. Around 9% of DMA was found in the cells, after extraction with methanol (10% if
90% extraction capacity is assumed; see Annex 9). It means that more than 75% of the DMA was
presumably degraded by algae presence. Figure 8 shows the spectra of M1 within the four days:
0
0,5
1
1,5
2
2,5
3
210 230 250 270 290 310
Fig. 8: Spectra of M1 in time
Before Add.
Day 1
Day 3
Day 4

IAMB 201020-06
28
Unlike with aniline, there was no noticeable cell growth when degradation occurred. Neither the
water turns reddish. The blank B also showed floc formation and some cell growth, and registered
some more than 50% removal. The DMA concentration in solution W remained nearly the same.
4.3 AROMATIC AMINES DEGRADATION PART II
4.3.1 DMA EXPERIMENT I
In first place, it was found that, after about two weeks, DMA had disappeared from solution
DMA1M2. However, the DMA removal rate was much lower in the latter than in DMA2M1, as
seen in Figure 9-c. The first solution achieved around 55% DMA removed, while the second one
attained more than 90% in one week. That could evidence that DMA1M2 cells were probably still
negatively affected. Again, no important cell growth was observed. Instead, the green color of cells
suddenly lost intensity, as evidence of some adverse effect of DMA on the biomass. However,
photosynthetic activity was still present, as the pH of the solution was always found at around 8.
The spectra of both solutions and the removal rate are plotted in Figures 9-a to 9-c.
0
0,1
0,2
0,3
0,4
0,5
0,6
210 230 250 270 290 310
Fig 9: Spectra of M1 in time
Before add.
After add.
Day 1
Day 3
Day 4

IAMB 201020-06
29
0
0,1
0,2
0,3
0,4
0,5
0,6
0,7
0,8
0,9
210 230 250 270 290 310
Fig 10-a: Spectra of DMA1M2 in time
Before Injection
After Injection
Day2
Day4
0
0,1
0,2
0,3
0,4
0,5
0,6
0,7
0,8
210 230 250 270 290 310
Fig. 10-b: Spectra of DMA2M1 in time
Before Injection
After Injection
Day2
Day5

IAMB 201020-06
30
Cells from DMA2M1 probably removed DMA better because of their previous exposure to the
compound, while those from the other solution were, perhaps, recovering from the adverse
conditions they had faced with PFDA and DMA. The small shift in the removal graph (Fig. 9-c) can
be explained by an abnormal spectrum curve flattening. As the dilution was calculated based in
the difference between absorbances read at 261 nm and 284 nm, a particular change in the base
absorbances (those assumed as constant, read before adding the compound), originated perhaps
in centrifugation, or a possibly contaminated baseline, could be the reason for this strange datum
registered in both solutions. Another explanation could be an unusual shift in the water
evaporation rate, big enough to heighten the DMA concentration. This is however, very unlikely to
happen, and was not noticed by naked eye. Nevertheless, regardless of this abnormality, a decay
tendency (perhaps, exponential) could explain the rest of the data, especially in the case of
DMA2M1.
4.3.2 DMA EXPERIMENT II
The two solutions were then refilled with DMA, and so were the solutions ANL2B and ANL2M1.
Again, solution DMA1M2 showed the lowest removal, while DMA2M1 had the highest, since 1.5
mL of DMA aqueous solution was injected to that solution. The second best removal was
presented in solution ANL2B. The results obtained, are plotted in Figure 10:
0
0,2
0,4
0,6
0,8
1
1,2
0 1 2 3 4 5 6 7 8
Fig. 10-c: DMA removal in time (days)
DMA1M2
DMA2M1

IAMB 201020-06
31
The results went according to the expected, as DMA2M1 had had the largest exposure to the
compound. Nevertheless, the removal presented in ANL2B was surprising, since it was expected to
have a much lower one, as those cells had had the shortest exposure to aromatic amines. The
results obtained for both solutions, as well as for ANL2M1 can be explained by an initial adsorption
of DMA to the biomass, followed by similar degradation rates, which is evidenced in Figure 10.
It was interesting to observe that, while ANL2M1 cells remained totally green and abundant, those
of ANL2B seemed to be a little diminished and their color turned from green to a reddish brown.
Such color could be evidence of DMA adsorption to the cell walls, or otherwise, an adverse effect
of the compound on the cells, or perhaps, a combination of both options. As an interesting
observation, those two solutions whose color had changed, had better removal rates than that of
ANL2M1, whose cells remained green. Different results would be attained in the third and last
experiment.
4.3.3 DMA EXPERIMENT III
The idea of this final experiment was to push cells to remove more and more DMA, in order to see
if they were capable of dealing with frequent discharges of the pollutant. In order not to force the
cells so much that they would die, only those showing the best removal rates were refilled with
DMA.
0
0,2
0,4
0,6
0,8
1
1,2
1,4
1,6
0 1 2 3 4 5 6 7 8
Fig. 11: DMA remotion yields in each solution
DMA1M2
DMA2M1
ANL2B
ANL2M1

IAMB 201020-06
32
As seen from Figure 11, the removal yields of all solutions, was different. DMA2M1 could not
degrade enough for refilling to be made; only ANL2B and ANL2M1 were refilled with DMA and
showed significant removal rates, being the first one’s lower than that of the second one. By the
13th day, only ANL2M1 could achieve nearly 100% DMA removal after refilling, showing thus the
best removal yield. DMA2M1 also achieved nearly 100% removal, but without being refilled. This
goes according to the expected at the beginning of DMA experiment II, since ANL2M1 cells
seemed healthier, as well as larger in population. This also gives support to the idea that DMA
might have some adverse effect on algal and cyanobacterial cells.
An alternative explanation for the results obtained, is that DMA is only adsorbed to the biomass,
and since DMA2M1 cells had been exposed in repeated times to relatively large amounts of the
compound, and besides, no significant cell growth was presented, the adsorption rate decreased
over time. Something similar could have happened to ANL2B cells, although they were much less
exposed to DMA. This hypothesis could also explain the behavior presented by solution DMA1M2,
whose cells would have adsorbed huge amounts of DMA compared to all the others, and to the
purple PFDA product. ANL2M1’s behavior is not very well explained by this hypothesis, though. In
order to have evidence that could support or deny such hypothesis, extraction with methanol was
once again made. As confirming evidence, a huge peak at around minute 7 of retention time
would be expected, which would mean large amounts of DMA. Otherwise, a very small peak, or,
indeed, no peak at all, would prove that removal is due to degradation, thus, giving support to the
first hypothesis and denying the second one.
0
0,2
0,4
0,6
0,8
1
1,2
0 2 4 6 8 10 12 14
Fig 12: removal yields of all solution in 13 days
DMA1M2
DMA2M1
ANL2B
ANL2M1

IAMB 201020-06
33
The cell extracts were then analyzed through HPLC, but practically no DMA was found in them (see
Annexes 10-a to 10-d). Therefore, it can be said that DMA is removed from water through
degradation pathways, and not by adsorption to biomass. Evidence good enough to support the
hypothesis of degradation of primary aromatic amines, mediated by algae, was thus provided by
performing cell extraction with methanol, and analyzing such extracts through HPLC.
Whether enzymatic action or cell generated reactive species are responsible for the degradation
was not stated in the present work, since no additional experiments were performed, which would
give evidence of one thing or another. According to Wang et al. 2007, aniline removal from water
is a consequence of photo-generated reactive species into the cells, some of which are eventually
released by the latter to the external environment, being these responsible for the degradation of
aniline [15]. Such theory was supported by other studies [17, 18]. This makes sense for the present
study, since previously unexposed algae were able to degrade MO, ANL and DMA. But the action
of enzymes is also a valid explanation, at least for the case of aniline, as it could be proved that its
presence favors and stimulates algal growth; it happened 100% of the times it was done, and even
each time faster. Besides, algae would not be greatly effective as a photocatalyst, since they might
also produce antioxidants to protect themselves from the reactive species [15].
4.4 CELL IDENTIFICATION
Cell identification was considered to be worth doing; knowing which species or at least, families of
algae and cyanobacteria were responsible for removal of the different compounds studied. It
could also provide additional information which could explain the results obtained. The
identification process was very simple: samples of biomass were taken and seen with the
microscope. Pictures of the images were taken and, comparing to literature [22, 23], some families
and species were identified. Those are listed next:
Chlorophyceae filamentosa sp.
Monoraphydium sp.
Oocystis sp.
Cyanophyceae sp.
Oscillatoria sp.
Pseudoanabaena sp.
Pseudoanabaena cf. planctonica
Sphaerocystis sp.
Johannesbaptistia cf. pellucida
Surirella sp.
Scytonema sp.
Lyngbya sp.
Nitzchia spp.
Elkanothryx sp.

IAMB 201020-06
34
Scedenesmus sp.
Phacus sp.
Anabaena sp.
Aphanocapsa sp.
Microcystis sp.
Synechococcus sp.
Synechocystis sp.
Chlorococcales sp.
Chrococcus sp.
The most abundant species were the Chrococcus sp., Oocystis sp. and Chlorococcales sp.
Nevertheless, different combinations of species were noticeable in each solution. For example,
Oocystis sp. and Chrococcus sp. were the most numerous species in solutions M1 and M2 when
the first experiments (MO, ANL, PFDA, DMA) were run, although many different species could be
seen (Figures 14-a and 14-b). Bacterial growth would have been, after all, also expected.
Moreover, in the DMA experiments II and III, solution ANL2M1 was rich in Scedenesmus species,
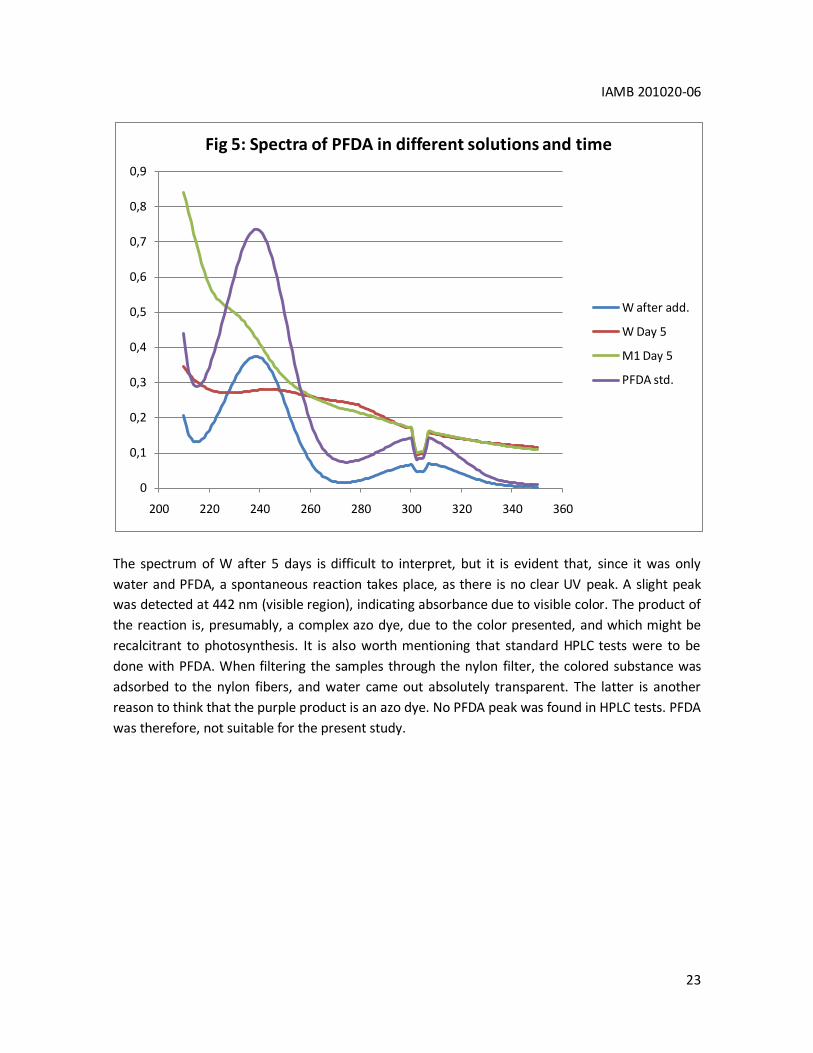
while in ANL2B, DMA2M1 and DMA1M2, Chrococcus sp. were the dominant species, as it can be
seen in Figures 13-a to 13-d. Such a variation could provide an extra explanation for the results
obtained in the DMA experiment III; The high removal yield registered in ANL2M1 compared to
the other solutions, could be influenced by the abundant presence of Scedenesmus sp., which is
scanty in the other three solutions. Chrococcus species, could be negatively affected (lowered
response capacity) after several repeated times of being exposed to DMA, while Scedenesmus
species, on the other hand, could probably increase their response capacity to DMA presence.
That would be evidence of better adaptability of the latter species than that of the Chrococcus
The variation in species diversity could have been an additional factor that affected pollutant
removal, in as much as the adaptability varies from one species to another and so do aspects like
cell wall composition, response capacity and velocity and enzyme production, among others.

IAMB 201020-06
35
Fig. 13-a: cells from ANL2M1. Scedenesmus sp. is the most abundant, although not the only one.
IAMB 201020-06
36
Fig. 13-b: cells from ANL2B. Chrococcus sp. are the most abundant, but more diversity is seen.

IAMB 201020-06
37
Fig. 13-c: Cells from DMA2M1. Chrococcus sp. dominance is evident. Some Anabaena filaments are
seen by the left lower side of the picture.

IAMB 201020-06
38
Fig. 13-d: cells from DMA1M2. Chrococcus sp. are the most common, but other cyanobacteria
(probably Cyanophyceae or Pseudoanabaena cf. planctonica) are frequently found.

IAMB 201020-06
39
Fig. 14-a: Cells from M1 during the first ANL experiment.

IAMB 201020-06
40
Fig 14-b: cells from M2 during the first ANL experiment.

IAMB 201020-06
41
5. CONCLUSSIONS
Previously unexposed algae and cyanobacteria were able to remove partially methyl
orange, an azo dye. The removal yield depended, as expected, on the initial dye
concentration, and probably on the climatic conditions (sunlight intensity due to cloud
presence or absence, temperature, etc). The decolorization of MO could have been, in
part, due to adsorption to the cells, and probably to photo-production of reactive
oxidative species mediated by algal and cyanobacterial cells. There is no evidence of
enzymatic reaction, which was expected, since the algae had never been exposed to
pollutants like MO before.
Aniline is removed from water in presence of algal and cyanobacterial cells and, in a small
part, to growth media, but there is no doubt that the main cause for ANL removal is the
presence of the first ones. Aniline significantly stimulates algal and cyanobacterial cell
growth, hence, stimulating photosynthesis as well. Action of enzymes produced by cells is
most likely to be the main cause of aniline removal and, and slightly, adsorption at the
beginning. Photo-produced reactive species by cells does not seem to play an important
role in removing ANL from water. At last, aniline is completely consumed by the cells, not
adsorbed or stored inside them.
P-phenylene diamine undergoes an spontaneous reaction in contact with water, and was
therefore useless for the purposes of this study. Such reaction is unknown, but there are
hints which indicate that the product might be a dye, perhaps azo type. Such product is
highly recalcitrant to algal activity.
2,5-dimethyl aniline was effectively removed from water by algae and cyanobacteria,
although with lower yields than those presented with aniline, which is expected, since this
compound is chemically more complex. Unlike aniline, DMA does not favor cell growth. On
the opposite, it could have some adverse effect on cells, although photosynthetic activity
did not seem to be affected. In addition, since very few or no DMA at all was found in the
cell extracts, removal could be attributed to photo-produced reactive species by the algal
and cyanobacterial cells, and not to enzymatic action.

IAMB 201020-06
42
REFERENCES
1. Cáez Pérez, M.A., Barrera Tapias, S.F. (2005). Decoloración del anaranjado de metilo a través de
un proceso de fotocatálisis con clorofila activada. Universidad de los Andes, Bogotá D.C.,
Colombia.
2. García, A., Amat, A.M., Arques, A., Sanchís, R., Gernjak, W., Maldonado, M.I., Oller, I., Malato, S.
(2006). Detoxification of aqueous solutions of the pesticide ‘Sevnol’ by solar photocatalysis.
Environmental Chemistry Letters. Volume 3, Number 4.
3. Bumpus, J.A., Tricker, J., Andrzejewski, K., Rhoads, H., Tatarko, M. (1999). Remediation of water
contaminated with an Azo Dye: an undergraduate laboratory experiment utilizing an inexpensive
photocatalytic reactor. Journal of Chemical Education. Volume 76, Issue 12.
4. Hong, J., Ma, H., Otaki, M. (2005). Controlling algal growth in photo-dependent decolorant
sludge by photocatalysis. Journal of Bioscience and Bioengineering. Volume 99, Issue 6.
5. Xingzu, W., Xiang, C., Dezhi, S., Hong, Q. (2008). Biodecolorization and partial mineralization of
Reactive Black 5 by a strain of Rhodopseudomonas palustris. Journal of Environmental Sciences.
Volume 20, Issue 10.
6. Parikh, A., Madamwar, D. (2004). Textile dye decolorization using cyanobacteria. Biotechnology
Letters. Volume 27, Issue 5.
7. Ayed, L., Achour, S., Khelifi, E., Cheref, A., Bakhrouf, A. (2010). Use of active consortia of
constructed ternary bacterial cultures via mixture design for Congo Red decolorization
enhancement. Chemical Engineering Journal. Volume 162, Issue 2.
8. Kolekar, Y.M., Pawar, S.P., Gawai, K.R., Lokhande, P.D., Shouche, Y.S., Kodam, K.M. (2008).
Decolorization and degradation of disperse blue 79 and acid orange 10 by Bacillus fusiformis KMK5
isolated from the textile dye contaminated soil. Bioresource Technology. Volume 99, Issue 18.
9. Khehra, M.S., Saini, H.S., Sharma, D.K., Chadha, B.S., Chimni, S.S. (2005). Comparative studies on
potential of consortium and constituent pure bacterial isolates to decolorate azo dyes. Water
research. Volume 39, Issue 20.
10. Guang-fei Liu, Ji-ti Zhou, Jing-Wang, Zhi-jong Song, Yuan-yuan Qv. (2006). Bacterial
decolorization of azo dyes by Rhodopseudomonas palustris. World Journal of Microbiology and
Biotechnology. Volume 22, Issue 10.

IAMB 201020-06
43
11. Karacakaya, P., Koçberber Kiliç, N., Duygu, E., Dönmez, G. (2009). Stimulation of reactive dye
removal by cyanobacteria in media containing triacontanol hormone. Journal of Hazardous
Materials. Volume 172, Issue 2-3.
12. El-Sheekh, M.M., Gharieb, M.M., Abou-El-Souod, G.W. (2009). Biodegradation of dyes by some
green algae and cyanobacteria. International Biodeterioration and Biodegradation. Volume 63,
Issue 6.
13. Parikh, A., Shah, V., Madamwar, D. (2005). Cyanobacterial flora from polluted industrial
effluents. Environmental Monitoring and Assessment. Volume 116, Issue 1-3.
14. Khataee, A.R., Dehghan, G., Ebadi, A., Zarei, M., Pourhassan, M. (2010). Biological treatment of
a dye solution by Macroalgae Chara sp.: Effect of operational parameters, intermediates
identification and artificial neural network modeling. Bioresource Technology. Volume 101, Issue
7.
15. Lei Wang, L., Zhang, C., Wu, F., Deng, N. (2007). Photodegradation of aniline in aqueous
suspension of microalgae. Journal of Photochemistry and Photobiology. Volume 87, Issue 1.
16. Ertuğrul, S., Bakir, M., Dönmez, G. (2008). Treatment of dye-rich wastewater by an immobilized
thermophilic cyanobacterial strain: Phormidium sp. Ecological Engineering. Volume 32, Issue 3.
17. Zepp, R.G. (US EPA), Schlotzhauer, P.F. (1983). Influence of algae on photolysis rates of
chemicals in water. Environmental Science and Technology. Volume 17, Number 18.
18. Liu, X., Wu, F., Deng, N. (2004). Photoproduction of hydroxyl radicals in aqueous solution with
algae under High Pressure Mercury Lamp. Environmental Science and Technology. Volume 38,
Number 1.
19. Acuner, E., Dilek, F.B. (2004). Treatment of Tectilon Yellow 2G by Chlorella Vulgaris. Process
Biochemistry. Volumen 39, Issue 5.
20. Wan-Loy Chu, Yike-Chu See, Siew-Moi Phang. (2008). Use of immobilised Chlorella vulgaris for
the removal of colour from textile dyes. Journal of Applied Phycology. Volumen 21, Number 6.
21. Parshetti, G.K., Telke, A.A., Kalyani, D.C., Govindwar, S.P. (2010). Decolorization and
detoxification of sulfonated azo dye methyl orange by Kocuria rosea. Journal of Hazardous
Materials. Volume 176, Issues 1-3.

IAMB 201020-06
44
22. Pérez-G, D., Rivera-Rondón, C. (2007).Estructura de las comunidades fitoplanctónicas y
perifíticas en sistemas de inundació del Río Orinoco (Puerto Carreño, Vichada) en época de sequía.
Pontificia Universidad Javeriana-Fundación Omacha.
23. Shah, V., Garg, N., Madamwar, D. (2000). Record of the cyanobacteria present in the Hamisar
pond of Bhuj, India. Acta Botánica Malacitana. Volume 25, Issue 85.
24. Needles, H.L. (2001). Textile fibers, dyes, finishes and processes. University of California, Davis,
California. First Indian Edition, 2001. Standard Publishers Distributors, Delhi, India.

IAMB 201020-06
45
ANNEXES
Annex 1: Molecular structure of Methyl Orange and its degradation pathway, according to
Parshetti et al. 2010. [21]

IAMB 201020-06
46
Annex 2-a: calibration curve for aniline dissolved in water, based on the measurement of the UV
absorbance peak at 280 nm.
Annex 2-b: Calibration curve for DMA in water, based on the measurement of the UV absorbance
peak at 284 nm.
y = 1,4223x + 0,0658R² = 0,9926
0
0,5
1
1,5
2
2,5
0 0,2 0,4 0,6 0,8 1 1,2 1,4 1,6
Abs. 280 nm
Abs.
Lineal (Abs.)
Lineal (Abs.)
y = 0,0943x + 0,0062R² = 0,9983
0
0,02
0,04
0,06
0,08
0,1
0,12
0,14
0,16
0 0,5 1 1,5
Abs. (284 nm)
Abs. (284)
Lineal (Abs. (284))

IAMB 201020-06
47
Annex 2-c: Calibration curve for the difference between absorbance at 284 nm and absorbance at
261 nm in DMA UV spectrum.
Annex 3-a: Standard chromatogram for aniline in water with a 250 mm long column.
y = 0,062x + 0,0007R² = 0,9977
0
0,02
0,04
0,06
0,08
0,1
0,12
0 0,5 1 1,5
A284-A261
A284-A261
Lineal (A284-A261)
1.76
5.99
0 2 4 6 8 10 12 14 16 18 20 22 24
Retention Time (min)
-5
0
5
10
15
20
25
Intensity (mV)

IAMB 201020-06
48
Annex 3-b: Standard chromatogram for aniline in methanol with 250 mm long column.
Annex 4-a: Standard chromatogram for aniline in water with 150 mm long column.
2.68
0 2 4 6 8 10 12 14 16 18 20 22 24
Retention Time (min)
0
100
200
300
400
Intensity (mV)
3.64
0 2 4 6 8 10 12 14 16 18
Retention Time (min)
0
20
40
60
80
100
120
140
160
Intensity (mV)

IAMB 201020-06
49
Annex 4-b: Standard chromatogram for aniline in methanol with 150 mm long column.
Annex 5-a. Standard chromatogram for DMA in water with 150 mm long column.
1.51 2.72
3.76
7.460 1 2 3 4 5 6 7 8 9 10 11 12 13 14
Retention Time (min)
0
100
200
300
400
Intensity (mV)
5.77
6.91
9.84
0 2 4 6 8 10 12 14 16 18
Retention Time (min)
0
20
40
60
80
100
120
Intensity (mV)

IAMB 201020-06
50
Annex 5-b: Standard chromatogram for DMA in methanol with 150 mm long column.
Annex 6-a: chromatogram for M1 solution after 7 days of exposure to aniline.
1.51 2.71 4.67 6.887.54
0 1 2 3 4 5 6 7 8 9 10 11 12 13 14
Retention Time (min)
0
100
200
300
400
500
600
700
800
Intensity (mV)
1.76
6.61
0 2 4 6 8 10 12 14 16 18 20 22 24
Retention Time (min)
-7.4
-7.2
-7.0
-6.8
-6.6
-6.4
-6.2
-6.0
Intensity (mV)
IAMB 201020-06
51
Annex 6-b: chromatogram for M2 solution after 7 days of exposure to aniline.
Annex 7-a: chromatogram for cell extracts of M1 after aniline removal.
1.76
6.29
0 2 4 6 8 10 12 14 16 18 20 22 24
Retention Time (min)
-7.4
-7.2
-7.0
-6.8
-6.6
-6.4
-6.2
Intensity (mV)
1.061.66
2.213.02
0 2 4 6 8 10 12 14 16 18 20 22 24
Retention Time (min)
-1.5
-1.0
-0.5
0.0
0.5
Intensity (mV)

IAMB 201020-06
52
Annex 7-b: chromatogram for cell extracts of M2 after aniline removal.
Annex 8: chromatogram for cell extracts of ANL2 M1 after aniline removal.
1.05
2.21
7.45
0 2 4 6 8 10 12 14 16 18 20 22 24
Retention Time (min)
-1.5
-1.0
-0.5
0.0
0.5
Intensity (mV)
3.71 7.46
0 1 2 3 4 5 6 7 8 9 10 11 12 13 14
Retention Time (min)
-1
0
1
2
3
4
5
6
7
Intensity (mV)
IAMB 201020-06
53
Annex 9: chromatogram for cell extracts of DMA2 M1.
Annex 10-a: chromatogram for cell extracts of ANL2B.
Annex 10-b: chromatogram for cell extracts of ANL2M1.
3.70 7.40
0 1 2 3 4 5 6 7 8 9 10 11 12 13 14
Retention Time (min)
-2
0
2
4
6
8
10
12
Intensity (mV)
2.77
0 1 2 3 4 5 6 7 8 9 10 11 12 13 14
Retention Time (min)
-2
0
2
4
6
8
10
12
Intensity (mV)
2.77 7.84
0 1 2 3 4 5 6 7 8 9 10 11 12 13 14
Retention Time (min)
-2
0
2
4
6
8
10
12
Intensity (mV)

IAMB 201020-06
54
Annex 10-c: chromatogram for cell extracts of DMA1M2.
Annex 10-d: chromatogram for cell extracts of DMA2M1.
2.77 7.85
0 1 2 3 4 5 6 7 8 9 10 11 12 13 14
Retention Time (min)
-2
0
2
4
6
8
10
12
Intensity (mV)
2.77
0 1 2 3 4 5 6 7 8 9 10 11 12 13 14
Retention Time (min)
-2
0
2
4
6
8
10
12
Intensity (mV)