Persistent Organic Pollutants in the Environment · Persistent Organic Pollutants in the...
62
Status Report /20 3 14 Persistent Organic Pollutants in the Environment msc-e & ccc STATUS REPORT /20 June 20 2 14 14
Transcript of Persistent Organic Pollutants in the Environment · Persistent Organic Pollutants in the...

Status Report /203 14
Persistent Organic Pollutantsin the Environment
msc-e & ccc
STA
TU
SR
EP
OR
T
/20
Ju
ne
20
21
41
4


EMEP Status Report 3/2014 June 2014
Persistent Organic Pollutants in the Environment
METEOROLOGICAL SYNTHESIZING CENTRE - EAST
A.Gusev, O.Rozovskaya, V.Shatalov
CHEMICAL COORDINATING CENTRE
W. Aas, P. Nizzetto
MCS-E Meteorological Synthesizing Centre - East 2nd Roshchinsky proezd, 8/5 115419 Moscow Russia Phone.: +7 926 906 91 78 Fax: +7 495 956 19 44 E-mail: [email protected] Internet: www.msceast.org
CCC Norwegian Institute for Air Research (NILU) P.O. Box 100 NO-2027 Kjeller Norway Phone: +47 63 89 80 00 Fax: +47 63 89 80 50 E-mail: [email protected] Internet: www.nilu.no

2
3
EXECUTIVE SUMMARY
Persistent organic pollutants (POPs) comprise a group of semi-volatile toxic chemicals characterized by resistance to degradation, significant potential to long-range transport, and harmful effects to human and wildlife health. POPs are within the scope of the activity of the UNECE Convention on Long-range Transboundary Air Pollution (hereafter, CLRTAP or the Convention) since the adoption of the Protocol on POPs in Aarhus in 1998. Due to international cooperation and measures for pollution abatement within CLRTAP, supported by continuous scientific work on monitoring and assessment, pollution by POPs substantially decreased during the past two decades.
According to the Protocol on POPs the Co-operative Programme for Monitoring and Evaluation of the Long-range Transmission of Air Pollutants in Europe (EMEP) shall provide the Parties to the Convention with information on the modelled and observed levels as well as transboundary transport of POPs within the EMEP region. This information allows evaluating effectiveness of emission reduction regulations specified by the Protocol. The outcome of EMEP work in the field of POPs is regularly reported and discussed at the meetings of the EMEP Task Force on Measurements and Modelling (TFMM).
This report presents main results of the EMEP activities in 2014 in support of the implementation of the Protocol on POPs. It provides a summary of the assessment of POP pollution in the EMEP region including an overview of emission data used for modelling, status of the EMEP monitoring network for POPs, and analysis of pollution levels and trends based on the results of model simulations. Significant attention is paid to dissemination and exchange of information with subsidiary bodies to the Convention, national and international organizations and programmes.
Emission data for model assessment of POP pollution are prepared by the Centre on Emission Inventories and Projections (CEIP) and the Meteorological Synthesizing Centre-East (MSC-E). Particularly, processing of official emissions data reported by Parties to the Convention and generation of gridded emission data for the latest year of the assessment (2012) are carried out by CEIP. MSC-E prepares emission data for the evaluation of long-term changes of pollution based on official data and expert estimates. In addition, scenarios of global historic and contemporary emissions are compiled and used for the assessment. According to officially reported data complemented by expert estimates, emissions of PAHs, PCDD/Fs, PCBs, and HCB to the atmosphere in the EMEP countries have been substantially reduced in the period 1990-2012. The most significant decline is indicated for the releases of HCB and PCBs (~85%) followed by PCDD/Fs (~60%) and PAHs (~40%).
The EMEP monitoring network for POPs included 34 sites in 2012 that measuring concentrations in air and/or precipitation. The most frequently measured POPs are PAHs, while the number of sites, measuring PCB and HCB concentrations, is smaller. Regular measurements of PCDD/Fs are not currently performed at the EMEP monitoring sites. The spatial coverage of the EMEP region by regular measurements is still requiring improvement. Particularly, there is a lack of monitoring sites in the southeast part of Europe as well as in the countries of Eastern Europe, Caucasus and Central Asia (EECCA).
Along with measurements of POP content in the atmosphere, monitoring of their concentrations in other compartments (e.g. soil, water bodies) is also necessary for the evaluation of POP pollution levels. A lot of measurement data on POPs exist in various international organizations and programs (e.g. the Arctic Monitoring and Assessment Programme (AMAP), OSPAR Commission, the United Nations Environment Programme (UNEP)). Collection of this information and characterization of its quality are of importance for the integrated assessment of POP pollution in the EMEP region. Further development of POP monitoring in the EMEP domain and collection of national POP measurements

4
are proposed to be discussed at the meetings of TFMM and the Task Force on Hemispheric Transport of Air Pollution (TF HTAP).
Assessment of POP pollution, presented in this report, has been performed for PAHs, PCDD/Fs, PCBs, and HCB for the years 1990 and 2012. This year PCBs have been added to the list of POPs for which regular assessment of pollution levels within the EMEP domain should be carried out. Modelling of PCB pollution of the EMEP countries is made for indicator congener PCB-153. According to the modelling results POP pollution levels in the EMEP countries have decreased from 1990 to 2012 by almost 90% for HCB, 80% for PCB-153, 50% for PCDD/Fs, and 30% for PAHs. Changes of PCDD/F and PAH pollution levels vary considerably between the EMEP countries. In particular, the most significant decline of pollution levels takes place in the EU countries (about 75% for PCDD/Fs and 40% for PAHs), while lower changes are obtained for the EECCA countries (about 20%). Decrease of PCB-153 and HCB pollution levels in the EMEP region is more homogeneous.
To examine temporal trends in POP pollution of the EMEP region during the two recent decades analysis of modelled time series of B[a]P air concentrations has been performed using a novel statistical approach. Mean rate of the reduction of B[a]P concentrations in the EMEP countries is estimated to 1.4% per year varying from about 6% in the beginning of the 1990s down to 0.1% in the end of the considered period. For most of the countries these variations of reduction rates are caused by the substantial decline of anthropogenic B[a]P emissions in early 1990s, whereas during the recent decade decreasing of pollution is slower due to lower changes of emissions.
Sources of POP emissions in particular EMEP country can contribute to the pollution of other countries of the EMEP region. Model assessment indicates significance of contributions of transboundary fluxes to the POP pollution of the EMEP countries. Particularly, the largest contribution of transboundary transport to deposition from anthropogenic emission sources is obtained for HCB (about 75%) followed by PCB-153 and B[a]P (about 60%) and PCDD/Fs (about 50%).
POP pollution is formed by various emissions including anthropogenic releases to the atmosphere as well as releases to the other media and secondary emissions (re-mobilization from soil, water bodies, etc.). PAH pollution of the EMEP countries is originated mainly from anthropogenic emission sources within the EMEP region. For PCDD/Fs, PCB-153, and HCB marked contributions to the contamination are also made by secondary emissions (about 50%-70%) and non-EMEP emission sources. The most significant contribution of non-EMEP emissions is obtained for HCB (about 25%) followed by PCB-153 and PCDD/Fs (about 10%). At the same time, estimated influence of emission sources outside the EMEP region can be underestimated due to uncertainties of applied global emission inventories.
Pilot modelling of global dispersion of PCDD/Fs using experimental emission scenario with application of global inventory compiled under the UNEP Stockholm Convention on POPs (SC) has been performed to evaluate significance of intercontinental transport of dioxins and furans. Results of global model simulations are compared with modelling results obtained for the EMEP region and evaluated against available measurements of PCDD/F air concentrations. It is shown that modelling with the scenario of global PCDD/F emission, based on the UNEP SC inventory, reasonably reproduces observed levels of air concentrations, whereas the use of the EMEP official PCDD/F emission data leads to significant underestimation of measurements. This confirms previously made conclusion that officially reported emissions most likely do not cover all potential sources of PCDD/Fs and their use can not explain observed levels of pollution. Thus, to improve the quality of PCDD/F pollution evaluation further work on the refinement of national emission inventories is needed.
Model assessment of POP pollution of the EMEP countries is carried out using the multi-media modelling approach, which comprises nested global and regional model simulations. Recent developments of Global EMEP Multi-media Modelling System (GLEMOS) for POPs are focused on

5
further refinement of particular model parameterizations and inclusion of POP emissions to the media other than the atmosphere. Following the decisions of the Executive Body for CLRTAP (ECE/EB.AIR/113/Add.1) MSC-E initiated preparatory work for transition of the EMEP operational modelling to the new EMEP grid. In the framework of this activity pilot model simulations of POP dispersion on global scale are carried out in longitude-latitude projection. Obtained modelling results demonstrate reasonable performance of the model and agreement with available measurements.
Dissemination of results of POP pollution assessment is an important activity aimed at supporting of political decisions with respect to pollution abatement. Annual reporting of this information in the form of status and technical reports is supplemented by presentation of this information on the MSC-E website (www.msceast.org). The site provides flexible and targeted assistance to national experts and authorities with data required for the environment protection regulations. In particular, detailed information on POP pollution is given for both the whole EMEP region and each EMEP country individually. Besides, to support the EECCA countries in their efforts on the implementation of the Protocol on POPs a full-scale Russian version of the MSC-E website has been developed (ru.msceast.org). Special attention is paid to information exchange with subsidiary bodies to the Convention and other international and national organizations and programmes.
Current problems and priorities of further refinement of POP emission data reported by the EMEP countries have been jointly discussed by MSC-E and the Task Force on Emission Inventories and Projections (TFEIP). It is emphasized that the major issues with regard to the quality of official emission data are related to the completeness and consistency of national emission inventories. Special attention needs to be paid to the improvement of emission reporting in the EECCA countries. Besides, the range of uncertainty of reported emission data is strongly desirable for the evaluation of possible maximum and minimum levels of pollution of the EMEP domain. Further strengthening of collaboration with international organizations dealing with compilation of POP emissions (e.g. with the UNEP Stockholm Convention on POPs) is highly appreciated.
Preliminary analysis of spatial distribution of PAH pollution levels in the EMEP countries has been performed in co-operation with the International Cooperative Programme on Effects of Air Pollution on Natural Vegetation and Crops (ICP-Vegetation) of the Working Group on Effects (WGE). Measurements of PAH content in mosses, initiated by several EMEP countries, have been compared with modelling results. Significant correlation between PAH concentrations in mosses and model predictions is found for France, Spain, and Norway. Lower correlation is obtained for Switzerland, Poland, and Slovenia. Further analysis of spatial variability of PAH pollution levels using model assessment and monitoring of moss concentrations requires wider coverage of countries by the monitoring of moss concentrations.
Pilot modelling results on intercontinental transport and source-receptor relationships for PCBs have been presented by MSC-E as possible contribution to the on-going numerical experiments under the Task Force on Hemispheric Transport of Air Pollution. Essential role of PCB long-range transport between different regions of the globe has been indicated. Besides, it is emphasized that source apportionment for POPs needs to be considered over longer periods of time due to their cycling between environmental compartments and influence of secondary emissions.
Collaboration between MSC-E and national experts of the EMEP countries is continued. The Centre carried out model evaluation of PAH pollution levels in Italy in order to support national scale modeling in ENEA (Italian national agency for new technologies, energy and sustainable economic development). Obtained results were verified by the comparison of modelled levels of concentrations with the EMEP measurements and applied in fine resolution modelling performed by national experts in Italy.

6
There is a wide interest outside the Convention to the data products and analysis performed by the EMEP scientific Centres. In the context of the co-operation MSC-E regularly exchanges information on POP pollution with different international bodies. POPs are included into the work of many international organizations (the Stockholm, Basel, and Rotterdam Conventions, the European Union (EU), AMAP, OSPAR, Helsinki Commission (HELCOM), etc.) representing thus wide concern of POP pollution in most of the regions of the globe. Environmental observations along with modelling can play important role in the screening and evaluation of the fate of new substances that are continued to be identified at the national level and under different international agreements. In this respect the European Union Regulation REACH (Registration, Evaluation, Authorisation and Restriction of Chemical substances) may be a source of information on their physical-chemical properties, emissions, and the results of risk assessment.
Future directions of MSC-E research will be focused on the assessment of POP pollution levels in the EMEP region and support of the EMEP countries with information required for the implementation of the Protocol on POPs. Evaluation of intercontinental transport of POPs and contributions of secondary emission sources using scenarios of global contemporary and historic emissions will be continued. The methodology for the analysis of long-term trends in the contamination of the EMEP countries is to be further developed to take into account seasonal variability of POP pollution levels. In the framework of transition to the new EMEP grid, testing of modeling system and evaluation of global and regional modeling results for the new domain will be performed. Special attention will be given to the evaluation of POP pollution in the EECCA countries. Finally, the GLEMOS source code will be distributed for public use to support development of country-scale modelling approaches in the EMEP countries.

7
CONTENTS
EXECUTIVE SUMMARY
3
INTRODUCTION
9
1. POLLUTION OF THE EMEP REGION 11 1.1. Emission data for model assessment 11 1.2. EMEP monitoring network for POPs 17 1.3. Assessment of POP pollution levels and transboundary transport 19
1.3.1. Polychlorinated dibenzo(p)dioxins and dibenzofurans (PCDD/Fs) 19 1.3.2. Polychlorinated biphenyls (PCBs) 27 1.3.3. Hexachlorobenzene (HCB) 31 1.3.4. Polyaromatic hydrocarbons (PAHs) 34
1.4. “Near-real time” estimates of POP pollution levels
42
2. COOPERATION AND EXCHAGE WITH INFORMATION ON POP POLLUTION 44 2.1. Working Group on Effects (ICP-Vegetation) 44 2.2. Task Force on Measurements and Modelling (TFMM) 46 2.3. Task Force on Hemispheric Air Pollution (TF HTAP) 47 2.4. Task Force on Emission Inventories and Projections (TFEIP) 48 2.5. POP pollution of the Baltic Sea 48 2.6. Evaluation of POP pollution levels over Italy
49
3. MAIN CHALLENGES AND DIRECTIONS OF FUTURE RESEARCH
51
REFERENCES
53
ANNEX A. EMEP/MSC-E current activities in the field of POP and HM emissions
56

8

9
INTRODUCTION
Persistent organic pollutants (POPs) are semi-volatile toxic substances resisting to degradation and cycling between the environmental compartments. POPs tend to accumulate in soil, water bodies, vegetation, and sediments. In spite of gradual reduction, their concentrations in the environment still pose risk to human and wildlife health. Reduction of POP pollution is subject of the activity of the UNECE Convention on Long-range Transboundary Air Pollution (hereafter the Convention) since the adoption of the Protocol on POPs in Aarhus in 1998. According to the Article 9 (3) of the Protocol, EMEP (Co-operative Programme for Monitoring and Evaluation of the Long-range Transmission of Air Pollutants in Europe) provides Executive Body for the Convention with information on long-range transport and deposition of POPs within the EMEP region. Different aspects of the assessment of POP pollution are covered by the EMEP Scientific Centres: Centre on Emission Inventories and Projections (CEIP), Chemical Co-ordinating Centre (CCC), Meteorological Synthesizing Centre – East (MSC-E). The work of the Centres is conducted in collaboration with the Task Force on Measurements and Modelling (TFMM), the Task Force on Hemispheric Transport of Air Pollution (TF HTAP), and the Task Force on Emission Inventories and Projections (TFEIP).
This report summarizes main outcomes of the EMEP Centres’ activities in 2014 in support of the implementation of the Protocol on POPs. It provides a short summary of the assessment of POP pollution in the EMEP region including information on emission data applied for model assessment, status of the EMEP monitoring network for POPs, and spatial and temporal variations of POP pollution levels based on the modelling results and measurements.
Model assessment of POP pollution of the EMEP region is carried out for PAHs, PCDD/Fs, PCBs, and HCB for the years 1990 and 2012. It includes analysis of POP pollution levels, transboundary transport between the EMEP countries, and contributions of secondary and non-EMEP emission sources. Long-term trends of POP pollution in the EMEP countries are evaluated and presented in the report. This information can be used for understanding of effectiveness of the environmental policies in the EMEP countries and, in particular, for the implementation of the Protocol on POPs.
Levels of POPs in the atmosphere and other environmental compartments are controlled by various emission sources, particularly, anthropogenic emissions to air, direct releases to the other media, and secondary emissions (re-mobilization from soil, water bodies, etc.). Special attention in the assessment of POP pollution levels is paid to the evaluation of contributions of secondary emission sources and non-EMEP emissions. Estimates of influence of these sources on the pollution of the EMEP countries are obtained using the global scale modelling on the basis of scenarios of contemporary and historic emissions. Particularly, model simulations of global transport and fate of PCDD/Fs this year are performed using the scenario of global emissions constructed on the basis of emission inventory of dioxins and furans of the UNEP Stockholm Convention on POPs.
Spatial and temporal variations of PCDD/Fs in soil during the past two decades are characterized and compared with available target values, defined in national legislations with respect to potential effects on human health and ecosystems. Along with model assessment of pollution levels for 2012 pilot model simulations of PAH pollution levels in 2013 are carried out. Obtained results are presented in the report as a “near-real time” evaluation of pollution based on the latest available emission data.
Development of the Global EMEP Multi-media Modelling System (GLEMOS) for POPs is continued. In particular, refinement of model parameterizations related to the interaction of POPs with the aerosol particles and inclusion of POP emissions to the media other than the atmosphere are performed. Additionally, in accordance with the decisions of the Executive Body for CLRTAP (ECE/EB.AIR/113/Add.1) MSC-E initiated preparatory work for transition of the EMEP operational

10
modelling to the new EMEP grid. Evaluation of pilot global scale simulations in latitude-longitude projection, performed in the framework of this activity, is presented in the report.
Specific attention is given to dissemination of results of POP pollution assessment and exchange of information with subsidiary bodies to the Convention, international and national organizations. The annual Status Report on POPs is accompanied by a variety of information on POP pollution levels in the EMEP region (individual EMEP countries, marginal seas, etc.) in the Internet at the MSC-E website (www.msceast.org). This information can be used by national authorities of the EMEP countries for the development and implementation of the environment protection policies. Information exchange with other international organizations and programmes (the UNEP Stockholm Convention on POPs, the Arctic Monitoring and Assessment Programme (AMAP), Helsinki Commission (HELCOM), etc.) broaden dissemination of the scientific and policy oriented information generated within EMEP and strengthen the status of the program on international level.
Along with outcome of the EMEP activities in 2014, main challenges and directions of further work on the assessment of POP pollution levels in the EMEP countries are summarized in the report. More detailed scientific information can be found in the EMEP/MSC-E Technical Report [Shatalov et al., 2014].

11
1. POLLUTION OF THE EMEP REGION
Persistent Organic Pollutants (POPs) considered in the POP Protocol are associated with a number of adverse effects, therefore characterization of their levels in the environment is of importance for evaluating of health risks for humans and ecosystems. In accordance with the requirements of the POP Protocol, EMEP should perform assessment of POP pollution levels and transboundary transport and provide this information for the EMEP countries. Assessment of pollution, presented in this report, has been performed for PAHs, PCDD/Fs, PCBs, and HCB for the years 1990 and 2012 to evaluate changes of pollution levels that took place during the two recent decades. Model simulations have been carried out on the basis of emission data reported by the EMEP countries and complemented by available expert estimates. Spatial and temporal variations of POP concentrations and deposition fluxes in the EMEP domain have been analyzed on the basis of modelling results and measurement data of the EMEP monitoring network. Along with this, transboundary transport of pollution between the EMEP countries as well as contributions of secondary emission sources and intercontinental transport have been evaluated.
1.1. Emission data for model assessment
The quality and completeness of POP emission data reported by the EMEP countries are essential for the assessment of atmospheric pollution levels in the EMEP region. In 2014, emissions of POPs, at least for one year of the period 1990-2012 were reported by 41 countries. Data for the base year 1990 and the year 2012 were provided by 30 countries and 28 countries submitted gridded emissions. At the same time, it should be noted that national emission inventories officially reported by countries are still subject of uncertainties and require further improvements [Mareckova et al., 2013].
To perform model assessment of POP pollution levels within the EMEP domain gridded emission data on PAHs (benzo[a]pyrene, benzo[b]fluoranthene, benzo[k]fluoranthene, and indeno[1,2,3-cd]pyrene), PCDD/Fs, and HCB were generated by CEIP and MSC-E. Particularly, datasets of annual gridded emissions for 2012 with spatial resolution 50x50 km2 were provided by CEIP, while gridded emission data for the year 1990 were prepared by MSC-E using official emissions, submitted by countries in the current reporting year. Gaps in spatial distribution of official emissions were filled by the emission expert estimates worked out by TNO [Denier van der Gon et al., 2005] and MSC-E. PCBs have been recently added to the list of POPs, for which regular assessment of pollution levels is required. To evaluate PCB pollution in the EMEP countries gridded emission data for 1990 and 2012 were constructed by MSC-E using officially reported emissions and available expert estimates.
Decline of anthropogenic POP emissions in the EMEP countries from 1990 to 2012 is accounted for almost 85% for HCB and PCBs, 60% for PCDD/Fs, and 40% for PAHs.
The most significant decline of anthropogenic emissions in that period was indicated for HCB and PCBs (~85%) followed by PCDD/Fs (~60%), and PAHs (~40%). The largest decrease of emissions took place in the western and central European countries, while in the EECCA countries emissions did not changed much or even increased.
Long-term variations of POP pollution in the EMEP domain depend on changes of anthropogenic emissions as well as secondary emissions (re-volatilization to the atmosphere). Secondary emissions are determined by the accumulation of pollutants in surface media (soil, water bodies). Noticeable contribution can be made also by the non-EMEP emission sources. In order to evaluate contributions of non-EMEP and secondary emission sources, scenarios of global HCB, PCDD/F and PCB emissions (including historical emissions) were prepared on the basis of available global emission inventories.

12
PAH emissions
Emissions of four PAHs from anthropogenic sources of the EMEP countries declined from 2417 tonnes in 1990 down to 1466 tonnes in 2012 (Fig. 1.1). Compared with 1990, decrease of PAH emissions in 2012 is indicated for 34 EMEP countries. The largest decline is noted for the United Kingdom (95%), the Netherlands (82%), Cyprus (77%), and Switzerland (73%). At the same time, in Denmark, Iceland, Estonia, Belarus, and Bulgaria PAH emissions increased in comparison to their levels in 1990 by 61%, 56%, 23%, 18% and 10%, respectively.
a b
Fig. 1.1. Spatial distribution of emissions of the sum of 4 PAHs in the EMEP countries in 1990 (a) and in 2012 (b) with resolution 50x50 km2.
PCDD/F emissions
Anthropogenic emissions of PCDD/Fs dropped from about 15 kg TEQ1 in 1990 to 6 kg TEQ in 2012 (Fig. 1.2). According to the reported information PCDD/F emissions were lower in 2012 in comparison to 1990 in 36 EMEP countries. The most substantial decline took place in Luxembourg (41 times), the Netherlands (32 times), the Czech Republic (28 times) and France (22 times). In several countries, namely, in Belarus, Armenia, Albania and Latvia, PCDD/F emissions in 2012 were higher by 53%, 33%, 22%, and 17% comparing to their levels in 1990.
a b
Fig. 1.2. Spatial distribution of PCDD/F emissions in the EMEP countries in 1990 (a) and in 2012 (b) with resolution 50x50 km2.
1 - Toxicity of PCDD/Fs is expressed according to the NATO toxic equivalents scheme (TEQ)
13
Along with national sources of PCDD/F emission in the EMEP countries, distant emission sources in other regions can also affect pollution of the EMEP domain. Global inventory of PCDD/F emissions is being compiled currently under the UNEP SC on the basis of the UNEP Standardized Dioxins Toolkit [Fiedler, 2007; Fiedler et al., 2012; UNEP, 2013]. The inventory comprises estimates of national emissions of dioxins and furans from 68 countries/regions with reference years from 1999 to 2009, representing the level of emissions during the recent decade.
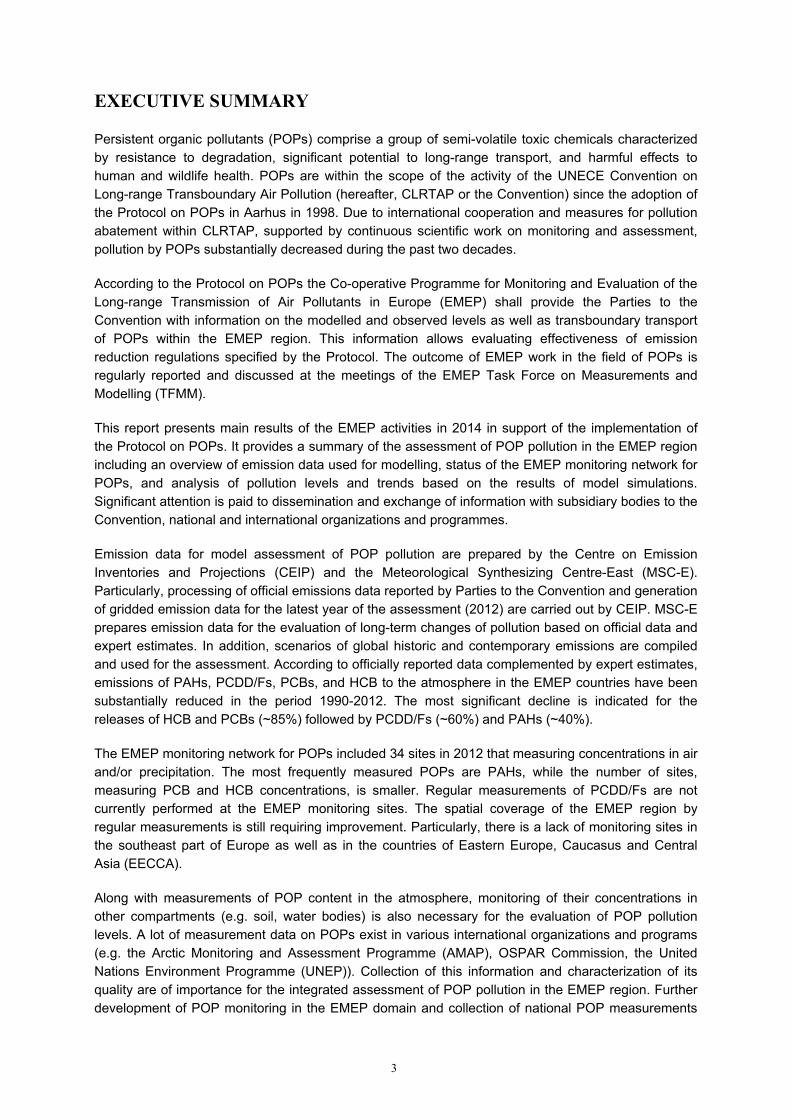
A number of methodological differences can be pointed out between the reporting of national PCDD/F emissions under the CLRTAP and under the UNEP SC. The UNEP Toolkit implies providing of detailed information on PCDD/F releases taking into account ten source groups. Significant attention is paid to the open burning of wastes. According to the UNEP inventory this category represents one of the most important sources of PCDD/F emissions (Fig.1.3). In particular, in almost 25% of countries open burning contributed more than 80% of national total PCDD/F emissions [Solorzano-Ochoa et al., 2012]. At the same time, inventories of the EMEP countries provide quite limited information on PCDD/F releases from open burning of wastes or biomass.
UNEP (68 countries)
Open Burning ProcessesWaste Incineration
Heat and Power GenerationDisposalFerrous and Non-Ferrous Metal ProductionProduction of Chemicals and Consumer GoodsTransportationOther
Fig. 1.3. Source composition of PCDD/F emissions provided by 68 countries to the UNEP Stockholm Convention on POPs .
Another difference is connected with the mode of release of PCDD/Fs into the environment. The methodology applied in the UNEP SC assumes specification of releases to five different vectors including air, land, water, residues, and products. The largest releases of PCDD/Fs were estimated to air (about 45%), followed by residues (34%) and land (10%). At the same time, national inventories, officially reported by the EMEP countries, account only for atmospheric emissions of PCDD/Fs.
This year pilot modeling of global scale transport and fate of PCDD/Fs has been carried out using experimental scenario of global emissions constructed on the basis of the data of the UNEP SC inventory. Scenario emissions of PCDD/Fs to the atmosphere and soil were prepared using the national inventories of 68 countries covered by the inventory. For other countries, for which information on their emissions of dioxins and furans was not available, releases of PCDD/Fs were estimated using the analysis of compiled national inventories carried out by Cao et al. [2013]. In particular, national PCDD/F emissions were found to correlate with Gross Domestic Product (GDP) and total population of the countries. Obtained regression relationship was applied to evaluate PCDD/F emissions of the countries with missing emission data. Spatial distribution of PCDD/F emissions to air and soil on global scale with resolution 1°x1° was made on the basis of gridded data on population density (Fig.1.4).

14
a b
Fig.1.4. Spatial distribution of annual PCDD/F emissions (ng TEQ/m2/y) to the atmosphere (a) and to soil (b) constructed on the basis of UNEP global PCDD/F emission inventory
HCB emissions
The degree of reduction of anthropogenic HCB emissions from 1990 to 2012 comparing to PAHs and PCDD/Fs is substantially higher. In that period, total emissions of HCB in 29 EMEP countries decreased from 6 tonnes in 1990 to 0.95 tonnes in 2012 (Fig. 1.5). Among the particular countries the largest decline was reported by the United Kingdom (about 125 times) followed by Norway (about 100 times), Slovenia (80 times), Spain (76 times) and France (72 times). At the same time, some countries reported increase of HCB emissions in that period, for example, Estonia (3.1 times), and Luxembourg (2.6 times).
a b
Fig. 1.5. Spatial distribution of HCB emissions in the EMEP countries in 1990 (a) and in 2012 (b) with resolution 50x50 km2.
Due to high persistence of HCB in the environment long-term accumulation of this pollutant in environmental media (soil, seawater) substantially influences HCB contamination levels. Therefore for the evaluation of HCB pollution levels historical emissions for sufficiently long period of time should be used.
Three scenarios of historical HCB emissions (maximum, average and minimal) were constructed for modelling of long-term accumulation of the pollutant in the environmental media [Shatalov et al,. 2010]. Preliminary calculations carried out with application of the GLEMOS modelling system indicated that modelling results obtained with maximum scenario better agreed with available measurement data. Thus, this particular scenario was applied for global modelling of long-term variations of HCB pollution levels.

15
Spatial distributions of global HCB emissions for 1990 and 2012 are shown in Fig. 1.6. According to constructed scenario, global HCB emissions declined significantly during that period. Largest HCB emission fluxes took place in Southern and Eastern Asia. At the same time, releases of HCB to the atmosphere in the EMEP region appeared to be somewhat lower.
a b
Fig. 1.6. Spatial distribution of HCB emissions in 1990 (a) and in 2012 (b) over global domain with resolution 10x10
PCB emissions
This year, along with the POPs considered above, evaluation of pollution levels of PCBs has been made for the EMEP and global domains. Emission data for modelling of PCB long-range transport and deposition were prepared on the basis of unofficial inventory of global PCB emissions [Breivik et al., 2007] taking also into account official information on PCB emissions submitted by the EMEP countries. The inventory provides consistent set of historical and future emissions of 22 individual PCB congeners from 1930 up to 2100. The indicator congener PCB-153 was selected for the evaluation of pollution levels for 1990 and 2012 on regional and global scales. The spatial distribution of PCB-153 emissions within the EMEP region was prepared using gridded PCB emissions officially submitted by 19 EMEP countries and the emission expert estimates worked out by TNO [Denier van der Gon et al., 2005] (Fig. 1.7).
a b
Fig. 1.7. Spatial distribution of PCB-153 emissions in the EMEP domain in 1990 (a) and in 2012 (b) with resolution 50x50 km2.
According to the global emission inventory [Breivik et al., 2007] levels of PCB emissions in the EMEP countries decreased 6 times in the period 1990-2012. The largest decline took place in Norway (14 times), the United Kingdom (12 times), and Greece (9 times), whereas the lowest decrease (about 4 times) was in Latvia, Lithuania, Estonia, and in most of the EECCA countries.

16
The spatial distribution of PCB-153 emissions used for global modelling with resolution 1°x1° is illustrated in Fig. 1.8). It can be seen that considerable levels of PCB-153 emission fluxes are the characteristic of the EMEP region. Other regions are characterised by comparatively lower annual emissions.
a b Fig. 1.8. Spatial distribution of PCB-153 emissions in 1990 (a) and in 2012 (b) over global domain
with resolution 1ox1o
Further improvement of POP emissions
The quality of POP emission data officially reported by the EMEP countries and possible ways of their improvement were recently discussed in framework of co-operation between the EMEP Task Force on Emission Inventories and Projections (TFEIP) and MCS-E. The Centre has prepared an information note focused on the existing issues with regard to the quality of POP emissions responding to the questions posed by the TFEIP. This note is presented in the Annex A of the report.
In particular, it is emphasized that the major issues with regard to the quality of officially reported emission data for the assessment of POP pollution are related to the completeness and consistency of inventories in line with the Emission Reporting Guidelines with special attention to the EECCA countries. Additionally, it is indicated that information on the range of uncertainty of reported emission data is needed to prepare scenarios of emissions for the evaluation of possible maximum and minimum levels of pollution of the EMEP domain. Generating and updating of emission expert estimates, applied for the preparation of POP emission data for modeling, is also highly appreciated. For further progress in the assessment of POP emissions and pollution levels it is important to strengthen collaboration with international organizations, in particular, with the UNEP Stockholm Convention on POPs in the field of evaluation of PCDD/F emissions.
Completeness and consistency of POP emission data submitted by the EMEP countries is the major issue with regard to their quality, Besides, information on uncertainties, updating of expert estimates of emission, and collaboration with international organizations (e.g. UNEP SC) are needed for further progress in assessment of POP emissions.

17
1.2. EMEP monitoring network for POPs
Persistent organic pollutants (POPs) were included in the EMEP monitoring program in 1999 but earlier POP data from some stations are also available in the EMEP database (http://ebas.nilu.no). The priority POPs to be included in all core sites level 2 within the EMEP network as defined in the monitoring strategy [UNECE, 2009] are: polycyclic aromatic hydrocarbons (PAHs), polychlorinated biphenyls (PCBs), hexachlorobenzene (HCB), chlordane, lindane, alpha-HCH and DDT/DDE.
In 1999, the EMEP monitoring network included POP measurements at seven sites in six countries (i.e. Belgium, Czech Republic, Iceland, Ireland, Netherland and Norway). Four of these sites monitored POPs in air while five monitored POPs in precipitation. Full coverage of the priority POPs in air was obtained at one site while the type and number of POP compounds varied for the other sites and matrix. HCHs and HCB were measured in air at all sites, while the only compounds with full coverage in precipitation were HCHs.
The number of sites measuring POPs were doubled in 2000 compared to 1999, and then stable for about nine years. In 2001, the number of sites is defined as insufficient [Aas and Hjellbrekke, 2003]. The number has then further increased so that in 2012, the total number of sampling sites for POPs is more than three times higher than in 2002 (Fig. 1.9). As a consequence, the spatial coverage for Europe has largely improved (Fig. 1.9).
Fig. 1.9. Spatial distribution of sampling sites monitoring POPs in air and precipitation in 2002 and 2012.
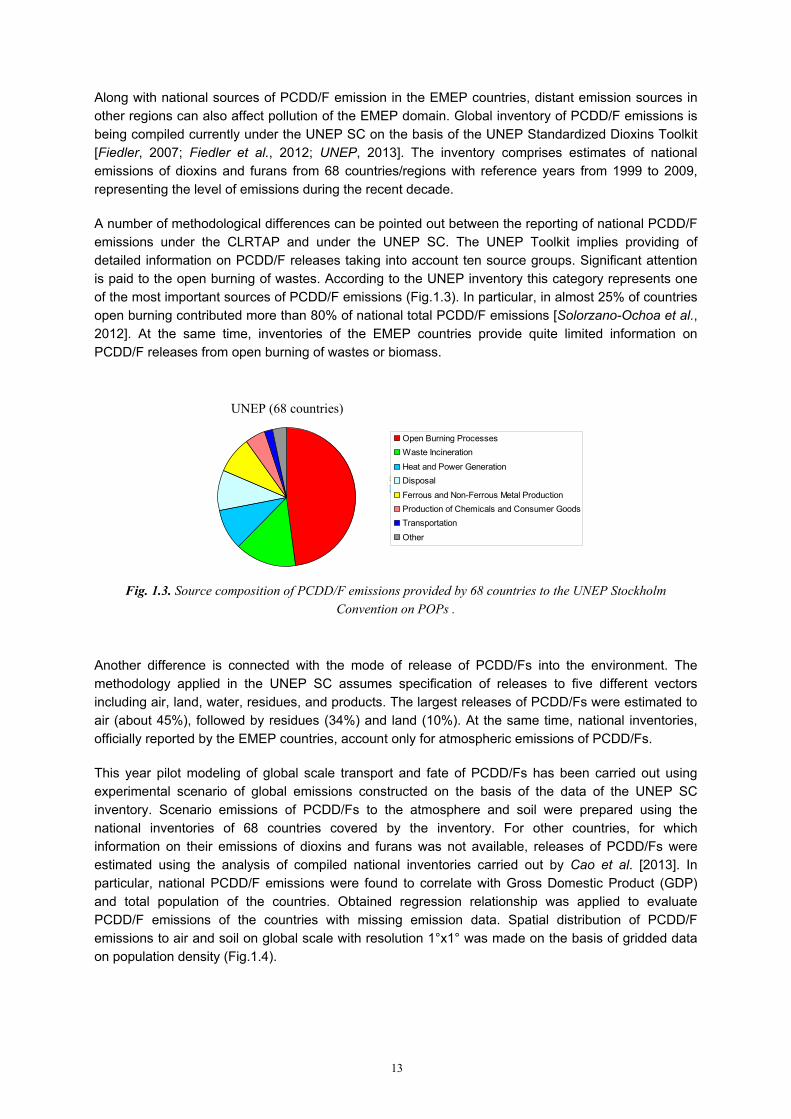
Although the spatial coverage has been improved by the increased number of sites, there is in 2012 still a large discrepancy in the type of POP compounds monitored at each site within the network (Figs. 1.10-1.11). Full coverage of the priority POPs in air measurements are only found at three stations in Norway while no station covers all priority POPs in precipitation. Half of the sampling sites are solely measuring PAHs (i.e. 18 of 34 sites), while the other half measures various priority POPs and emerging/new POPs (such as polybrominated diphenyl ethers, PBDE, and per- and polyfluorinated alkyl substances, PFAS). In details, for air; PAHs are measured at 32 stations, PCBs at 8 stations, HCB at 13 stations, chlordane at 8 stations, HCH at 9 stations, DDTs at 14 stations, other pesticides (f.e. aldrin, dieldrin, endrin, heptachlor, oxychlordane) at 6 stations, and new POPs at 4 stations [Aas and Nizzetto, 2014].
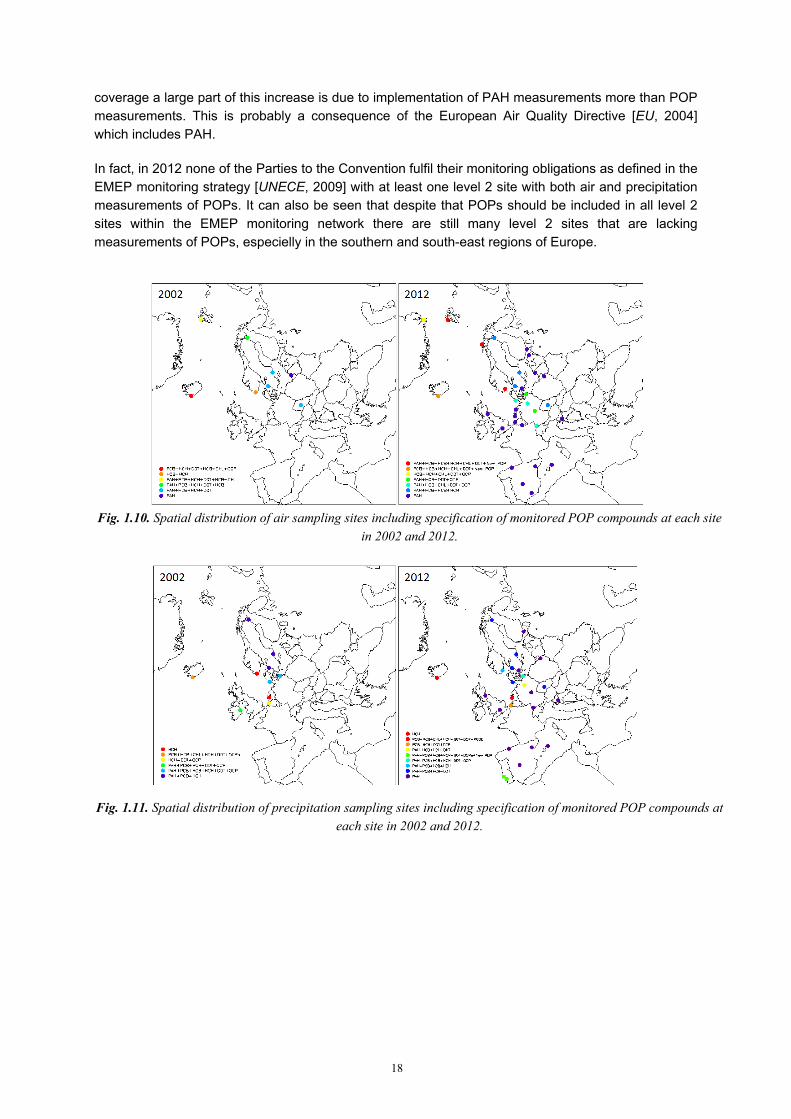
In precipitation; PAHs are measured at 22 stations, PCBs at 11 stations, HCB at 4 stations, chlordane at 1 station, HCH at 13 stations, DDTs at 11 stations, other pesticides at 6 stations, and new POPs at 3 stations [Aas and Nizzetto, 2014]. This shows that despite the effort in increasing the spatial
18
coverage a large part of this increase is due to implementation of PAH measurements more than POP measurements. This is probably a consequence of the European Air Quality Directive [EU, 2004] which includes PAH.
In fact, in 2012 none of the Parties to the Convention fulfil their monitoring obligations as defined in the EMEP monitoring strategy [UNECE, 2009] with at least one level 2 site with both air and precipitation measurements of POPs. It can also be seen that despite that POPs should be included in all level 2 sites within the EMEP monitoring network there are still many level 2 sites that are lacking measurements of POPs, especielly in the southern and south-east regions of Europe.
Fig. 1.10. Spatial distribution of air sampling sites including specification of monitored POP compounds at each site
in 2002 and 2012.
Fig. 1.11. Spatial distribution of precipitation sampling sites including specification of monitored POP compounds at each site in 2002 and 2012.
19
1.3. Assessment of POP pollution levels and transboundary transport
POP pollution is formed by various emissions including anthropogenic releases to the atmosphere as well as to other media and secondary releases (re-mobilization from soil, water bodies, etc.). Many of POPs are multimedia contaminants, which undergo cycling and distribution between different environmental compartments after their original release. For long-lived POPs it is important to consider their dispersion on global scale for a long period of time. Thus, taking into account these peculiarities of POPs, model assessment of POP pollution in the EMEP countries is based on the multi-media modelling approach. This approach comprises the use of nested global and regional model simulations based on POP emissions in the EMEP region as well as scenarios of global emissions and information on their historical development. Global scale modelling provides necessary information on initial and boundary conditions for regional scale modelling within the EMEP domain. Besides, it is applied to characterize intercontinental transport and contribution of non-EMEP emission sources to the pollution. Regional model simulations are used to evaluate levels of pollution and transboundary transport for the EMEP countries.
The process of development of the global/regional modelling approach for POPs, implemented in the framework of the Global EMEP Multi-media Modelling System (GLEMOS), is documented in the series of MSC-E and MSC-W Technical reports [Tarrason and Gusev, 2008; Travnikov et al., 2009; Jonson and Travnikov, 2010; Travnikov and Jonson, 2011; Jonson and Travnikov, 2012; Shatalov et al., 2013]. Further developments of the GLEMOS modelling system related to the evaluation of POP pollution are presented below in this chapter. In particular, this work has been focused on the modification of model parameterizations of POP sorption to aerosols and degradation as well as on inclusion of direct emissions of POPs to the environmental media other than atmosphere.
This year MSC-E initiated preparatory work for transition of the EMEP operational modelling of heavy metal and POP pollution to the new EMEP grid. The grid changes include movement from the polar-stereographic to the regular geographic (latitude-longitude) projection of the Earth surface, appropriate transformation of the EMEP domain and increase of the grid spatial resolution. Progress in this activity is described in the EMEP Status Report on HMs [Ilyin et al., 2014]. Pilot model simulations of global scale dispersion of POPs using geographic (latitude-longitude) projection are discussed below.
1.3.1. Polychlorinated dibenzo(p)dioxins and dibenzofurans (PCDD/Fs)
Dioxins and furans are unintentional by-products released into the environment during various combustion processes, including industrial processes, waste incineration, and open burning of wastes and biomass. Being released to the environment they undergo cycling between environmental media and tend to accumulate in soil and sediment compartments. These compartments can be regarded as the most essential reservoirs for dioxins and furans. Other important reservoirs with relatively high content of these pollutants can be landfill sites, where disposal of various wastes takes place.
Evaluation of PCDD/F pollution levels, presented in previous EMEP Status Reports [Shatalov et al., 2012; Gusev et al., 2013], was mainly focused on the pilot model simulations with emission scenarios that permitted to obtain reasonable agreement with available measurements and to estimate the likely levels of PCDD/F releases to the environment. Particularly, experimental scenario of PCDD/F emissions in the EMEP countries was constructed using the inverse modelling and the analysis of congener specific measurements in various EMEP countries [Shatalov et al., 2012]. This study indicated that official PCDD/F emission data could not explain observed levels of pollution and were characterized by incomplete coverage of actual sources of PCDD/F emissions.

20
Along with anthropogenic emissions, additional contribution to the pollution levels can be made by the secondary emission sources, which are formed by long-term accumulation of PCDD/Fs in and direct emissions to the media (e.g. soil, water bodies). Importance of these sources for PCDD/F pollution levels was evaluated in the study [Gusev et al., 2013] performed on the basis of scenario of PCDD/F emissions to the atmosphere and soil constructed using inventory of PCDD/F emissions in the EU countries [Wenborn et al.,1999].
This year model assessment of PCDD/F pollution levels in the EMEP region with the use of experimental emission scenarios is continued. Three sets of model simulations for dioxins and furans are carried out. In particular, evaluation of the EMEP region pollution for 1990 and 2012 based on the previously developed approach for the construction of PCDD/F emission scenarios [Shatalov et al., 2012] is made. Besides, pollution levels in the EMEP region are simulated for the same years using officially reported emissions without modifications. In addition to this, pilot modelling of global dispersion of PCDD/Fs on the basis of emission inventory, compiled under the UNEP SC, is performed. Results of these model simulations are compared and evaluated against available measurements of PCDD/F air concentrations. Brief description of obtained model predictions is presented below. Detailed information on constructed scenarios, model setup, and analysis of modeling results on PCDD/F pollution levels can be found in the MSC-E Technical Report [Shatalov et al., 2014].
Pollution levels in the EMEP region
Spatial distribution of modelled PCDD/F air concentrations for 1990 and 2012 is presented in Fig. 1.12. It is seen that the largest reduction of pollution took place in Western, Central and Southern Europe. At the same time, Northern Europe and the most part of the territory of the EECCA countries is characterized by smaller decrease of pollution levels.
a b
Fig. 1.12. Spatial distribution of annual mean air concentrations of PCDD/Fs in the EMEP domain for 1990 (a) and 2012 (b), fg TEQ/m3.
Relative changes of PCDD/F air concentrations from 1990 to 2012 in three groups of the EMEP countries (EU, EECCA, and other countries) are given in Fig. 1.13. The diagram presents mean values of reduction and their dispersion for each considered group of countries.

21
On average, decline of PCDD/F pollution levels in the EMEP countries from 1990 to 2012 was accounted for approximately 50% (Fig. 1.13). The most significant drop of PCDD/F air concentrations took place in the EU countries (by more than 75%). The lowest changes of pollution levels were obtained for the EECCA countries (about 20%).
In the particular countries decrease of PCDD/F pollution levels from 1990 to 2012 varied from several percents to about 90%. Maximum declining of PCDD/F air concentrations was estimated for the Netherlands, Luxembourg, and Belgium (about 90%). The lowest decline was indicated for Azerbaijan (9%), Turkey (9%), and Kirgizstan (2%).
Transboundary transport within the EMEP region
Model assessment of PCDD/F transboundary transport within the EMEP region is carried out for 1990 and 2012 to evaluate changes in transboundary fluxes between the EMEP countries and contributions of different sources. Model simulations indicate that for most of the countries nearly half of PCDD/F deposition from anthropogenic emission sources is contributed by transboundary transport. Significant persistence of PCDD/Fs in the environment leads to the necessity of consideration of secondary emissions to the atmosphere. Additional contribution is also expected from the non-EMEP emission sources. Similar to model simulations, described in the previous EMEP Status Report [Gusev et al., 2013] data on emissions outside of the EMEP region were defined for a limited number of countries due to the lack of information. Thus, relative contribution of PCDD/F intercontinental transport can be underestimated in these model simulations.
Relative contributions of the EMEP anthropogenic and secondary emission sources and non-EMEP emission sources of PCDD/Fs to the pollution of the EMEP countries in 1990 and 2012 are shown in the diagrams in Fig. 1.14.
Pollution by PCDD/Fs in the EMEP domain is controlled by both primary anthropogenic and secondary emission sources. Relative contributions of secondary emissions to total PCDD/F deposition grow with time.
EMEP secondary emissions
51%
EMEP anthropogenic
emissions44%
non-EMEP emissions
5%
1990, total deposition 135 kg TEQ
EMEP secondary emissions
58%
EMEP anthropogenic
emissions36%
non-EMEP emissions
6%
2012, total deposition 66 kg TEQ
Fig. 1.14. Relative contributions of EMEP anthropogenic and secondary emission sources as well as non-EMEP
emissions to total deposition of PCDD/Fs to the EMEP countries in 1990 and 2012.
0%
20%
40%
60%
80%
100%
EU EECCA Other EMEP
Fig. 1.13. Relative changes of annual mean air concentrations of PCDD/Fs in three
groups of EMEP countries (EU, EECCA and other EMEP countries) from 1990 to 2012,%.

22
It is seen that, together with considerable reduction of deposition flux of PCDD/Fs to the EMEP region (more than twice, see Fig. 1.14) relative contributions of different source types have also changed. Namely, the contribution of the EMEP anthropogenic sources has decreased from 1990 to 2012 by 8%, while the contribution of secondary emission sources has increased by 7%.
Relative changes of total PCDD/F deposition in the EMEP countries, together with changes in contributions of national emission sources, transboundary transport, secondary emissions, and non-EMEP emission sources from the base year 1990 to 2012, are presented in the Fig. 1.15.
-20%
0%
20%
40%
60%
80%
100%
Net
herla
nds
Bel
gium
Luxe
mbo
urg
Fran
ceC
zech
Rep
ublic
Ger
man
yS
witz
erla
ndU
nite
d K
ingd
omR
oman
iaD
enm
ark
Mal
taS
lova
kia
Nor
way
Por
tuga
lA
ustri
aS
wed
enP
olan
dFi
nlan
dS
pain
Hun
gary
Rep
ublic
of M
oldo
vaIre
land
Icel
and
Mon
aco
Italy
Gre
ece
Lith
uani
aE
ston
iaS
love
nia
Latv
iaS
erbi
aB
elar
usC
roat
iaFY
R o
f Mac
edon
iaB
ulga
riaB
osni
a&H
erze
govi
nM
onte
negr
oR
ussi
an F
eder
atio
nA
lban
iaC
ypru
sU
krai
neK
azak
hsta
nTu
rkm
enis
tan
Geo
rgia
Tajik
ista
nU
zbek
ista
nA
rmen
iaA
zerb
aija
nK
yrgi
zsta
nTu
rkey
PC
DD
/F d
epos
ition
cha
nge,
% Secondary emissions
Non-EMEP emissions
Transboundary transport
National emissions
Reduction of PCDD/F deposition caused by changes of:
Fig. 1.15. Reduction of PCDD/F deposition in the EMEP countries caused by the changes of national,
secondary and non-EMEP emissions as well as changes of transboundary transport between 1990 and 2012. Positive value means decrease of deposition, and negative – increase.
Similar to the results obtained in the previous year [Gusev et al., 2013], most of the EMEP countries are characterized by substantial reduction (more than 40%) of total PCDD/F deposition from 1990 to 2012. For more than a half of the EMEP countries reduction of total deposition is occurred due to the decrease of secondary emissions and transboundary transport. At the same time, changes of total PCDD/F deposition in some of the countries, namely, the Netherlands, the Czech Republic, the United Kingdom, and Romania and some others, are mainly caused by considerable reduction of national emissions. It should be noted that evaluation of deposition reduction for some of the EECCA countries is currently associated with higher uncertainties due to problems with completeness and consistency of information on national emissions [Mareckova et al., 2013].
For more than a half of the EMEP countries reduction of total deposition is occurred mostly due to the decrease of secondary emissions and transboundary transport.
Evaluation of PCDD/F intercontinental transport
Global transport and fate of dioxins and furans have been studied using the GLEMOS modelling system on the basis of emission scenario based on the PCDD/F emission inventory of UNEP SC (see the section 1.1 of the report). Pilot model simulations are performed using the meteorological data for 2012 and spatial resolution 1° x 1°. In order to set up initial conditions for these model simulations the spin-up model run for the period of four decades is carried out to achieve observed levels of

23
concentrations in soil in rural and remote regions. Spatial distribution of annual mean PCDD/F concentrations in surface air and upper soil layer are presented in Fig. 1.16.
a b
Fig. 1.16. Spatial distribution of modelled annual mean PCDD/F concentrations in air (fg TEQ/m3) in comparison with measurements made in different locations (marked by the circles) (a) and spatial distribution of
modelled annual mean PCDD/F concentrations in soil (ng TEQ/kg) (b) for 2012.
According to the modelling results elevated levels of PCDD/F air concentrations (> 10 fg TEQ/m3) are characteristic of Europe, Southern and Eastern Asia, and Africa, while lower levels of pollution are indicated for North and South America and Australia. Similar spatial distribution of pollution is obtained for PCDD/F concentrations in soil. Particularly, relatively higher levels of concentrations (> 0.25 ng TEQ/kg) are seen for different regions in Europe, South Asia, and Africa, which corresponds with the distribution of major emission sources. For other regions lower levels of soil concentrations are indicated.
Results of model simulations have been evaluated against the measurements of PCDD/F air concentrations made in various regions of the world during the recent decade (2002-2012) (Fig. 1.17). Information on observed air pollution levels was compiled at previous stages of the work [Gusev et al., 2013]. It included results of measurements performed in rural and background regions of the EMEP countries (Denmark, France, Germany, the United Kingdom, Italy, Sweden, Finland, the Netherlands, and Spain) as well as of North America and Eastern Asia. In addition to this observed PCDD/F air concentrations at monitoring sites of US EPA’s National Dioxin Air Monitoring Network [Lorber et al., 2013; US EPA, 2013] and in some regions of Eastern Asia [Min et al., 2013; Chi et al., 2013] are included.
0.1
1
10
100
0.1 1 10 100
Observed, fg TEQ/m3
Mod
elle
d, fg
TE
Q/m
3
Europe
0.1
1
10
100
0.1 1 10 100
Observed, fg TEQ/m3
Mod
elle
d, fg
TE
Q/m
3
North America
0.1
1
10
100
0.1 1 10 100
Observed, fg TEQ/m3
Mod
elle
d, fg
TE
Q/m
3
Southeast Asia
Fig. 1.17. Comparison of modelled annual mean PCDD/F air concentrations (fg TEQ/m3) with measurements performed in Europe, North America, and Southeast Asia. Dashed lines denote the area of agreement within a
factor of 2, solid lines – a factor of 5.
24
Comparison of pilot modelling results with measurements indicates reasonable agreement between the modelled and observed PCDD/F air concentrations for the European countries. More than a half of the modelled predictions are within a factor of 2 with measured concentrations, and about 80% are within a factor of 3. Satisfactory agreement of model results with measurements is also found for the monitoring sites in East Asia with a few exceptions. At the same time PCDD/F air concentrations observed in North America are generally underestimated by the model, which is likely caused by the uncertainties of the constructed emission scenario for this region, in particular, considerable differences are found for rural areas in the USA. Model predictions for remote areas well agree with measurements (Fig. 1.16).
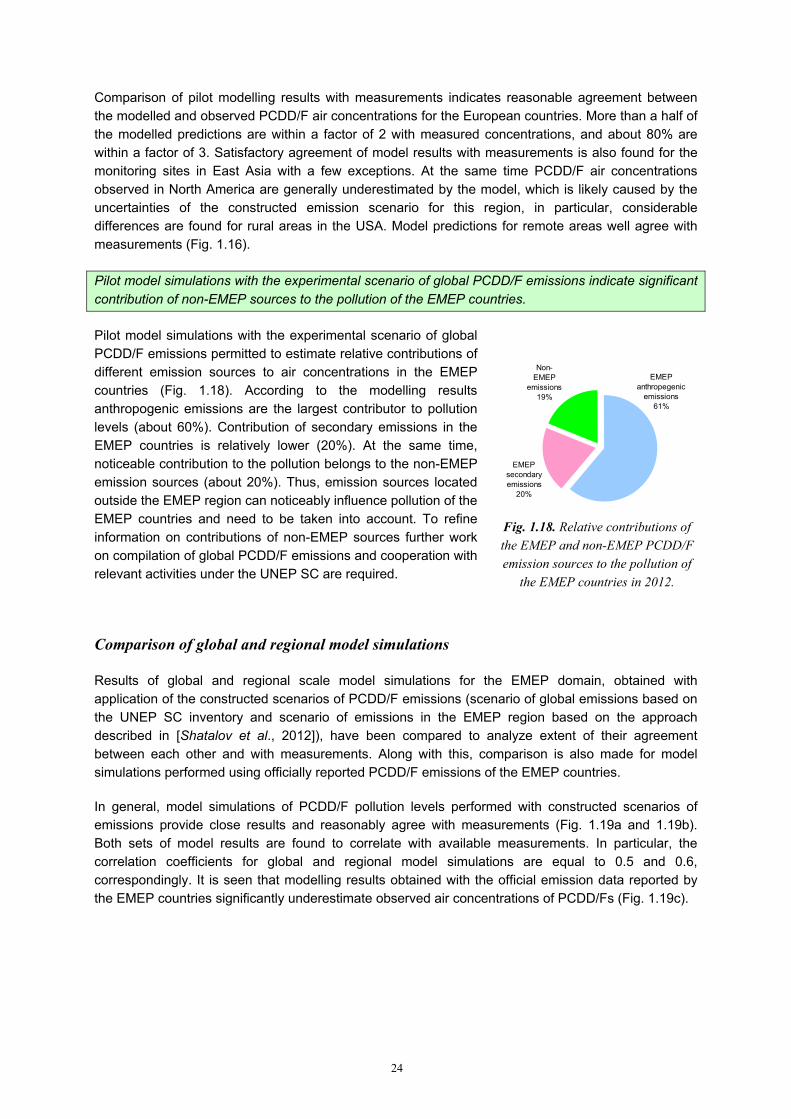
Pilot model simulations with the experimental scenario of global PCDD/F emissions indicate significant contribution of non-EMEP sources to the pollution of the EMEP countries.
Pilot model simulations with the experimental scenario of global PCDD/F emissions permitted to estimate relative contributions of different emission sources to air concentrations in the EMEP countries (Fig. 1.18). According to the modelling results anthropogenic emissions are the largest contributor to pollution levels (about 60%). Contribution of secondary emissions in the EMEP countries is relatively lower (20%). At the same time, noticeable contribution to the pollution belongs to the non-EMEP emission sources (about 20%). Thus, emission sources located outside the EMEP region can noticeably influence pollution of the EMEP countries and need to be taken into account. To refine information on contributions of non-EMEP sources further work on compilation of global PCDD/F emissions and cooperation with relevant activities under the UNEP SC are required.
Comparison of global and regional model simulations
Results of global and regional scale model simulations for the EMEP domain, obtained with application of the constructed scenarios of PCDD/F emissions (scenario of global emissions based on the UNEP SC inventory and scenario of emissions in the EMEP region based on the approach described in [Shatalov et al., 2012]), have been compared to analyze extent of their agreement between each other and with measurements. Along with this, comparison is also made for model simulations performed using officially reported PCDD/F emissions of the EMEP countries.
In general, model simulations of PCDD/F pollution levels performed with constructed scenarios of emissions provide close results and reasonably agree with measurements (Fig. 1.19a and 1.19b). Both sets of model results are found to correlate with available measurements. In particular, the correlation coefficients for global and regional model simulations are equal to 0.5 and 0.6, correspondingly. It is seen that modelling results obtained with the official emission data reported by the EMEP countries significantly underestimate observed air concentrations of PCDD/Fs (Fig. 1.19c).
EMEP secondary emissions
20%
Non-EMEP
emissions19%
EMEP anthropegenic
emissions61%
Fig. 1.18. Relative contributions of the EMEP and non-EMEP PCDD/F emission sources to the pollution of
the EMEP countries in 2012.

25
a
0.1
1
10
100
0.1 1 10 100Observed, fg TEQ/m3
Mod
elle
d, fg
TE
Q/m
3Emission scenario based on the UNEP SC inventory
b
0.1
1
10
100
0.1 1 10 100Observed, fg TEQ/m3
Mod
elle
d, fg
TEQ
/m3
Emission scenario based on inverse modelling
c
0.1
1
10
100
0.1 1 10 100Observed, fg TEQ/m3
Mod
elle
d, fg
TEQ
/m3
Emission data officially reported by the EMEP countries
Fig. 1.19. Comparison of annual mean PCDD/F air concentrations (fg TEQ/m3) observed in European countries with the results of model simulations with the scenario of global PCDD/F emissions based on the UNEP SC
emission inventory (a), scenario of PCDD/F emissions constructed using inverse modelling (b), and officially reported PCDD/F emissions (c). Dashed lines denote the area of agreement within a factor of 2, solid lines – a
factor of 5. Comparison of officially reported PCDD/F emissions with the scenario emissions based on the UNEP SC inventory is shown in Fig. 1.20. The figure illustrates the differences between annual emission totals for the countries, where the measurements of PCDD/F air concentrations were made.
It is seen that for most of these countries officially reported emissions are considerably lower comparing to the emission data of the scenario based on the UNEP SC inventory. This confirms previously made conclusion that officially reported emissions most likely do not cover all potential sources of PCDD/Fs and the use of these emissions in modeling can not explain observed levels of pollution. Thus, to improve evaluation of PCDD/F pollution of the EMEP countries further work on the refinement of national emission inventories is needed. In this respect strengthening co-operation with relevant activities on the assessment of PCDD/F emissions performed under the UNEP SC is of importance.
Analysis of modelling results for PCDD/Fs indicates that official emission data reported by the EMEP countries most likely do not cover all potential sources of PCDD/F emissions and the use of these emissions in modeling can not explain observed levels of pollution.
Long-term changes of PCDD/F soil concentrations
PCDD/Fs are characterized by significant persistence in the environmental media and tend to accumulate in soil and sediment compartments. A number of national legislations have established target values for PCDD/F concentrations in soil to characterize and control risks from PCDD/Fs to human health. In various countries these target values vary from 4 to 10 ng TEQ/kg [Gusev et al., 2013].
0
200
400
600
800
1000
1200
1400
France Ita
ly
United
King
dom
Spain
Netherl
ands
Greece
Sweden
German
y
Finlan
d
Denmark
PC
DD
/F e
mis
sion
, g T
EQ
/y Official emissions (EMEP)
Scenario emissions(based on UNEP SC data)
Fig. 1.20. Comparison of officially reported total
PCDD/F emissions for 2012 with the scenario emissions based on the UNEP SC inventory for
particular European countries.

26
Model assessment of PCDD/F pollution of the EMEP countries permits to evaluate spatial and temporal variations of dioxins and furans concentrations in soil. Spatial distributions of modelled PCDD/F soil concentrations for 1990 and 2012 are shown in Fig. 1.21. On average decrease of PCDD/F concentrations in soils among in the EU countries from 1990 to 2012 amounts to 35%, whereas for the other EMEP countries smaller decrease is indicated (about 12%).
On average decrease of PCDD/F concentrations in soils in the EU countries from 1990 to 2012 amounts to 35%, whereas for the other EMEP countries smaller decrease is indicated (about 12%).
a b
Fig. 1.21. Spatial distribution of annual mean soil concentrations of PCDD/Fs in the EMEP domain for 1990 (a) and 2012 (b), ng TEQ/kg.
Reduction of anthropogenic emissions and soil concentrations leads to considerable changes of contributions of primary and secondary emissions to total releases of PCDD/Fs to the atmosphere in the EMEP countries. For example, relative contributions of these sources for the Czech Republic in 1990 and 2012 are shown in Fig. 1.22. It can be seen that the share of secondary emissions is growing with time since re-volatilization from soil is reduced slower than anthropogenic emissions. Similar effect is characteristic of a number of countries in Central and Western Europe.
The Czech Republic, 1990
Secondary emissions
18%
Anthropogenic emissions
82%
The Czech Republic, 2012
Secondary emissions
41%Anthropogenic
emissions59%
Total releases: 8.2 kg TEQ Total releases: 1.2 kg TEQ
Fig. 1.22. Relative contributions of anthropogenic and secondary emission sources to total releases of PCDD/Fs from the area of the Czech Republic for 1990 and 2012
Average levels of PCDD/F soil concentrations for 2012 and their spatial variations in the EMEP countries are shown in Fig. 1.23. It is seen that for some countries (Luxembourg, Germany, Belgium, and Italy) model estimates of maximum PCDD/F soil concentrations are close to the threshold level of 4 ng TEQ/kg.

27
0
1
2
3
4
Luxe
mbo
urg
Ger
man
yB
elgi
umTh
e N
ethe
rland
sS
witz
erla
ndFr
ance
Aust
riaC
zech
Rep
ublic
Mon
aco
Italy
Den
mar
kS
love
nia
Uni
ted
Kin
gdom
Sw
eden
Spa
inP
olan
dE
ston
iaP
ortu
gal
Lith
uani
aLa
tvia
Finl
and
Bela
rus
Cro
atia
Mal
taN
orw
ayIre
land
Hun
gary
Icel
and
Rus
sian
Fed
erat
ion
Turk
men
ista
nK
azak
hsta
nU
zbek
ista
nTa
jikis
tan
Kyr
gizs
tan
Cyp
rus
Slo
vaki
aB
osni
a&H
erze
govi
naA
zerb
aija
nAr
men
iaG
reec
eU
krai
neA
lban
iaM
onte
negr
oG
eorg
iaR
epub
lic o
f Mol
dova
Turk
eySe
rbia
Rom
ania
FYR
_of_
Mac
edon
iaB
ulga
ria
ng T
EQ/k
g
Fig. 1.23. Average PCDD/F concentrations in soil in the EMEP countries in 2012 and ranges of their spatial
variations, ng TEQ/kg
Taking into account rather coarse spatial resolution of the model and its tendency to smooth spatial variations of pollutant concentrations, established target values can be exceeded in some areas of the EMEP region. However, for the evaluation of the ranges of these variations modelling with finer spatial resolution needs to be applied.
1.3.2. Polychlorinated biphenyls (PCBs)
Polychlorinated biphenyls is a group of persistent toxic chemicals intentionally produced since 1929 for various technical applications. Due to their physical-chemical properties they are dispersed globally cycling between various environmental media. Similar to dioxins and furans, PCBs are characterized by significant persistence in the environment and tend to accumulate in soil and sediment compartments. The ban of their marketing and use in the 1980s has led to the reduction of their release into the environment. However, they are still detected in various regions of the globe posing risks to human and wildlife health.
Model assessment of PCB pollution levels, performed by MSC-E at previous stages, was mostly focused on the evaluation of global transport and fate of PCBs using available data on their global emissions. This year PCBs have been added to the list of POPs for which regular assessment of pollution levels within the EMEP domain should be carried out. Modelling of PCB pollution of the EMEP countries is made for indicator congener PCB-153. Input data on PCB-153 emissions are prepared on the basis of official emission data and scenario of global contemporary and historic emissions described in section 1.1. Global scale modelling for the evaluation of PCB intercontinental transport and contributions of non-EMEP emission sources are performed using the GLEMOS modelling system. Pilot model simulations are made with spatial resolution 1°x1°. Transboundary transport of PCB-153 between the EMEP countries is evaluated using the regional model simulations for the EMEP domain with initial and boundary conditions obtained from the global modelling results.

28
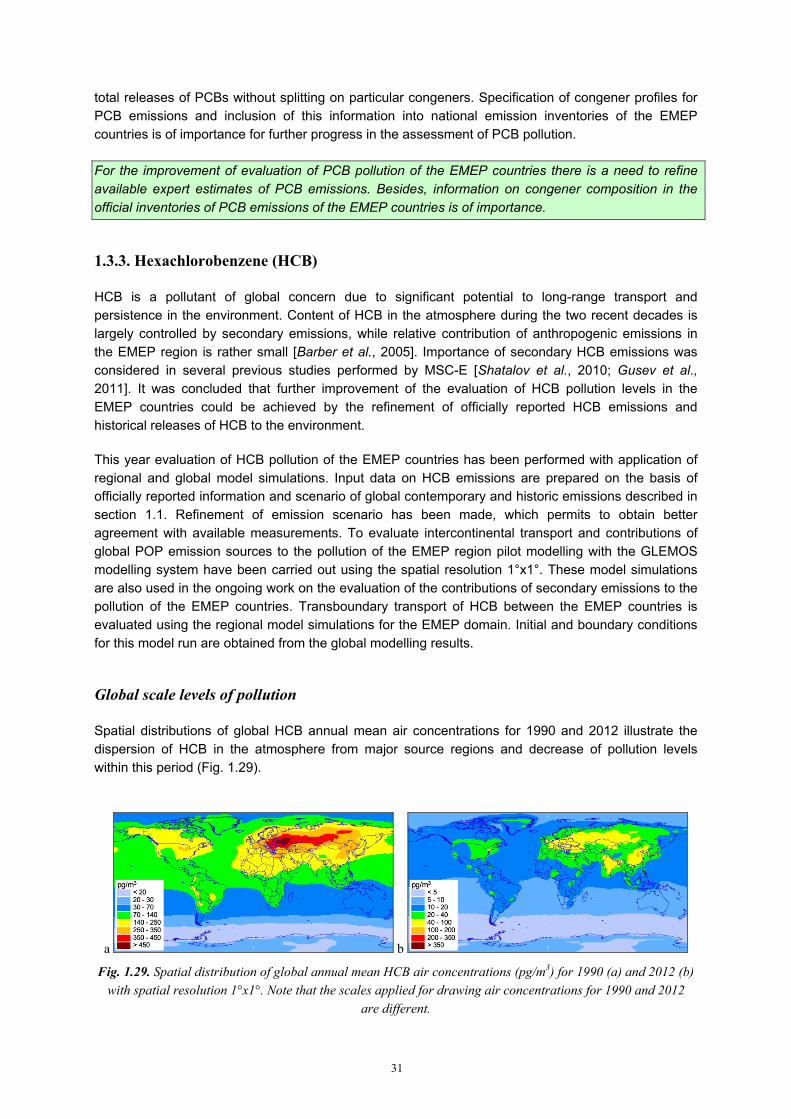
Global scale levels of pollution
Spatial distributions of global annual mean PCB-153 air concentrations for 1990 and 2012 are presented in Fig. 1.24. The figure illustrates global dispersion of PCB-153 in the atmosphere from major source regions and changes of pollution levels within the two recent decades.
a b
Fig. 1.24. Spatial distribution of global annual mean PCB-153 air concentrations (pg/m3) for 1990 (a) and 2012 (b) with spatial resolution 1°x1°.
Levels of PCB-153 air concentrations tend to decline in most regions of the Northern Hemisphere within this period. In 2012 elevated air concentrations (0.5 – 8 pg/m3) are seen in the EMEP region comparing to the other regions, which is conditioned by spatial distribution of global emissions. Particularly, following the global inventory of PCB emissions, applied in model simulations, more than a half of global PCB-153 emission belongs to the EMEP region. Preliminary comparison of global scale modelled PCB-153 air concentrations with measurements is made using the results of monitoring campaigns, performed by the MONET2 network in the EMEP region and Africa [Klanova et al., 2009]. In general, model predictions for the European countries well agree with measurements. At the same time, levels of PCB-153 air concentrations observed in Africa and Central Asia (about 0.7 - 21 pg/m3) are underestimated by the model, which can be attributed to the uncertainties in the emissions for these regions.
Model evaluation of PCB-153 pollution levels in the EMEP region reasonably agree with available measurements. At the same time, modeling results for Africa and Central Asia underestimate observed air concentrations.
Pollution levels in the EMEP region
Reduction of annual mean air concentrations of PCB-153 within the EMEP domain during the two recent decades is shown in Fig. 1.25. According to modelling results, PCB-153 concentrations in the EMEP countries have declined from 1990 to 2012 by 80% on average.
Average levels of PCB-153 air concentrations in the EMEP countries have declined by 80% from 1990 to 2012.
2 National POPs Monitoring Networks: MONET-CZ, MONET-CEECs, MONET-AFRICA [Klanova et al,. 2009]

29
a b
Fig. 1.25. Spatial distribution of PCB-153 annual mean concentrations (pg/m3) in the EMEP region for 1990 (a) and 2012 (b), with spatial resolution 50x50 km2.
To evaluate obtained modelling results for the EMEP domain, comparison of model predictions with measurements of the EMEP monitoring sites for 2012 has been made. In general, it is seen that modelled PCB-153 air concentrations reasonably agree with the observed concentrations (Fig. 1.26). For all sites modelled annual mean air concentrations agree with measured ones within a factor of 2. The lowest discrepancies (10%-20%) are found for CZ3, NO2, and SE12. For the other monitoring sites the differences are somewhat higher (30%-40%). The model reasonably well reproduces spatial distribution of measured concentrations (the correlation coefficient is 0.87).
Transboundary transport in the EMEP region
Model assessment of PCB transboundary transport within the EMEP region is carried out for 1990 and 2012. Modelling results are used to characterize temporal changes of contributions of main groups of emission sources as well as changes of transboundary fluxes between particular EMEP countries. The largest contribution to PCB pollution in the EMEP countries is made by secondary emissions to the atmosphere (Fig. 1.27). Along with this, anthropogenic emissions and non-EMEP emission sources also have considerable contributions to the pollution levels in the EMEP region. For most of the countries the share of transboundary transport in total PCB-153 deposition from the anthropogenic emission sources is substantially high (about 60%).
The most significant contribution to PCB pollution of the EMEP countries is made by secondary emissions.
According to modelling results, relative contribution of the EMEP anthropogenic sources has decreased by 8% from 1990 to 2012. Decreasing tendency is also obtained for the contribution of non-EMEP emission sources. At the same time, relative contribution of secondary emission sources has been increased by 13% within this period.
0
0.2
0.4
0.6
0.8
1
1.2
1.4
1.6
CZ3
FI96
IS91
NO
2
NO
42
NO
90
SE12
SE14
PCB-
153
air c
once
ntra
tion,
pg/
m3
ObservedModelled
Fig. 1.26. Comparison of annual mean
modelled PCB-153 air concentrations with measurements of the EMEP monitoring sites
for 2012, pg/m3.
30
EMEP secondary emissions
55%
EMEP anthropogenic
emissions31%
non-EMEP emissions
14%
1990
EMEP secondary emissions
68%
EMEP anthropogenic
emissions23%
non-EMEP emissions
9%
2012
Fig. 1.27. Relative contributions of EMEP anthropogenic and secondary emission sources as well as non-EMEP
emissions to total deposition of PCB-153 to the EMEP countries in 1990 and 2012.
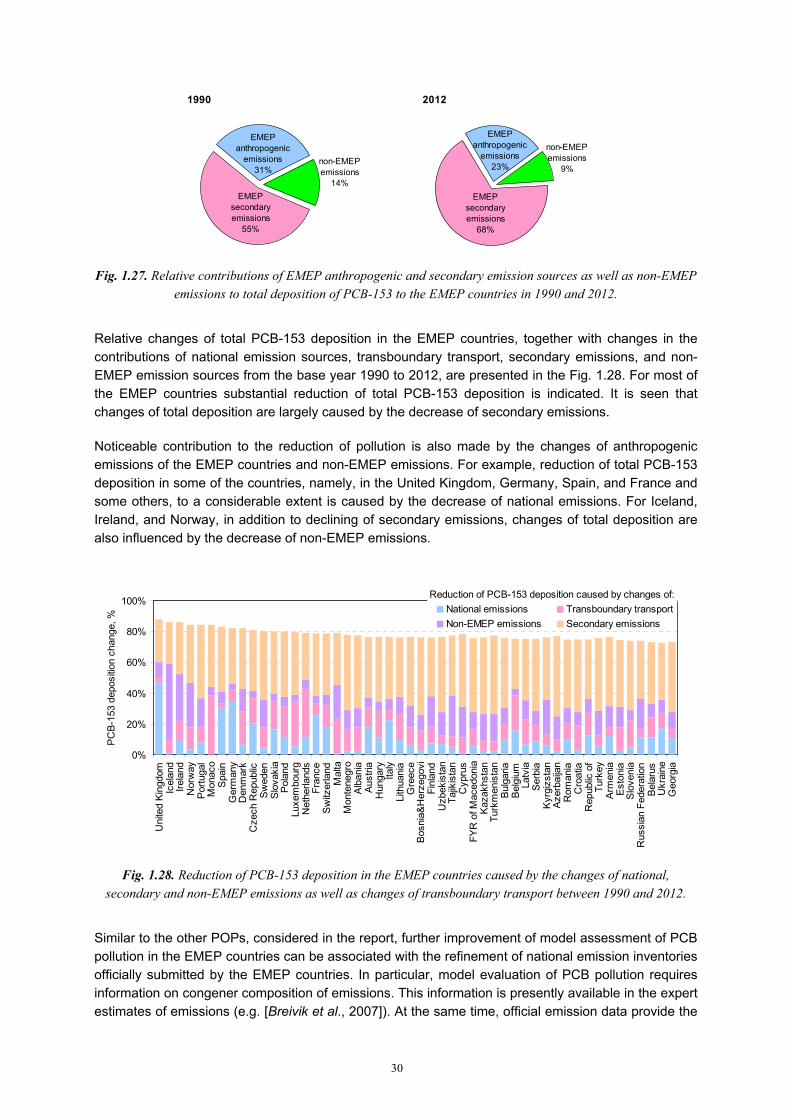
Relative changes of total PCB-153 deposition in the EMEP countries, together with changes in the contributions of national emission sources, transboundary transport, secondary emissions, and non-EMEP emission sources from the base year 1990 to 2012, are presented in the Fig. 1.28. For most of the EMEP countries substantial reduction of total PCB-153 deposition is indicated. It is seen that changes of total deposition are largely caused by the decrease of secondary emissions.
Noticeable contribution to the reduction of pollution is also made by the changes of anthropogenic emissions of the EMEP countries and non-EMEP emissions. For example, reduction of total PCB-153 deposition in some of the countries, namely, in the United Kingdom, Germany, Spain, and France and some others, to a considerable extent is caused by the decrease of national emissions. For Iceland, Ireland, and Norway, in addition to declining of secondary emissions, changes of total deposition are also influenced by the decrease of non-EMEP emissions.
0%
20%
40%
60%
80%
100%
Uni
ted
Kin
gdom
Icel
and
Irela
ndN
orw
ayP
ortu
gal
Mon
aco
Spa
inG
erm
any
Den
mar
kC
zech
Rep
ublic
Swed
enS
lova
kia
Pola
ndLu
xem
bour
gN
ethe
rland
sFr
ance
Sw
itzer
land
Mal
taM
onte
negr
oAl
bani
aAu
stria
Hun
gary
Italy
Lith
uani
aG
reec
eBo
snia
&Her
zego
viFi
nlan
dU
zbek
ista
nTa
jikis
tan
Cyp
rus
FYR
of M
aced
onia
Kaz
akhs
tan
Turk
men
ista
nBu
lgar
iaBe
lgiu
mLa
tvia
Serb
iaK
yrgi
zsta
nA
zerb
aija
nR
oman
iaC
roat
iaR
epub
lic o
fTu
rkey
Arm
enia
Est
onia
Slo
veni
aR
ussi
an F
eder
atio
nBe
laru
sU
krai
neG
eorg
ia
PC
B-15
3 de
posi
tion
chan
ge, %
National emissions Transboundary transportNon-EMEP emissions Secondary emissions
Reduction of PCB-153 deposition caused by changes of:
Fig. 1.28. Reduction of PCB-153 deposition in the EMEP countries caused by the changes of national,
secondary and non-EMEP emissions as well as changes of transboundary transport between 1990 and 2012.
Similar to the other POPs, considered in the report, further improvement of model assessment of PCB pollution in the EMEP countries can be associated with the refinement of national emission inventories officially submitted by the EMEP countries. In particular, model evaluation of PCB pollution requires information on congener composition of emissions. This information is presently available in the expert estimates of emissions (e.g. [Breivik et al., 2007]). At the same time, official emission data provide the
31
total releases of PCBs without splitting on particular congeners. Specification of congener profiles for PCB emissions and inclusion of this information into national emission inventories of the EMEP countries is of importance for further progress in the assessment of PCB pollution.
For the improvement of evaluation of PCB pollution of the EMEP countries there is a need to refine available expert estimates of PCB emissions. Besides, information on congener composition in the official inventories of PCB emissions of the EMEP countries is of importance.
1.3.3. Hexachlorobenzene (HCB)
HCB is a pollutant of global concern due to significant potential to long-range transport and persistence in the environment. Content of HCB in the atmosphere during the two recent decades is largely controlled by secondary emissions, while relative contribution of anthropogenic emissions in the EMEP region is rather small [Barber et al., 2005]. Importance of secondary HCB emissions was considered in several previous studies performed by MSC-E [Shatalov et al., 2010; Gusev et al., 2011]. It was concluded that further improvement of the evaluation of HCB pollution levels in the EMEP countries could be achieved by the refinement of officially reported HCB emissions and historical releases of HCB to the environment.
This year evaluation of HCB pollution of the EMEP countries has been performed with application of regional and global model simulations. Input data on HCB emissions are prepared on the basis of officially reported information and scenario of global contemporary and historic emissions described in section 1.1. Refinement of emission scenario has been made, which permits to obtain better agreement with available measurements. To evaluate intercontinental transport and contributions of global POP emission sources to the pollution of the EMEP region pilot modelling with the GLEMOS modelling system have been carried out using the spatial resolution 1°x1°. These model simulations are also used in the ongoing work on the evaluation of the contributions of secondary emissions to the pollution of the EMEP countries. Transboundary transport of HCB between the EMEP countries is evaluated using the regional model simulations for the EMEP domain. Initial and boundary conditions for this model run are obtained from the global modelling results.
Global scale levels of pollution
Spatial distributions of global HCB annual mean air concentrations for 1990 and 2012 illustrate the dispersion of HCB in the atmosphere from major source regions and decrease of pollution levels within this period (Fig. 1.29).
a b
Fig. 1.29. Spatial distribution of global annual mean HCB air concentrations (pg/m3) for 1990 (a) and 2012 (b) with spatial resolution 1°x1°. Note that the scales applied for drawing air concentrations for 1990 and 2012
are different.

32
According to the results of global modelling, elevated levels of HCB air concentrations in 2012 are characteristic of the EMEP region and Southeast Asia. Somewhat lower concentrations are seen in Africa, North America and other regions. Modelled HCB air concentrations generally correlate with the results of large-scale monitoring campaigns performed by the MONET network in the EMEP region and Africa [Klanova et al., 2009]. In particular, average levels of HCB air concentrations observed in Africa are about 10-20 pg/m3. In the EMEP region levels of measured concentrations are about 30-50 pg/m3, which is consistent with the obtained modelling results.
Pollution levels in the EMEP region
Changes of annual mean HCB air concentrations in the EMEP domain from 1990 to 2012 are illustrated in Fig. 1.30. Banning of HCB usage in the agriculture and the reduction of other anthropogenic HCB emissions have led to substantial decrease of pollution levels in the EMEP countries by almost 90% from 1990 to 2012. With the reduction of primary emissions, the variability of HCB air concentrations in the EMEP region has also diminished several times within this period, which agrees with available measurements [Jaward et al., 2004; Halse et al., 2011].
Levels of HCB pollution in the EMEP countries have decreased by almost 90% from 1990 to 2012.
a b
Fig. 1.30. Spatial distribution of HCB annual mean concentrations (pg/m3) in the EMEP region for 1990 (a) and 2012 (b), with spatial resolution 50x50 km2. Note that the scales applied for drawing air concentrations
for 1990 and 2012 are different. Comparison of modelling results for 2012 against available measurements performed at the EMEP monitoring sites indicates generally good agreement between the modelled and observed HCB air concentrations (Fig. 1.31). For most of the EMEP monitoring sites model predictions of annual mean concentrations agree with measurements within a factor of 2. Lowest discrepancies are seen for monitoring sites in Germany, Sweden, Finland, and Norway. The highest deviations between the modelled and measured values (about a factor of 3) are found for the monitoring site Košetice (CZ3), which can be explained by different reasons including incompleteness of anthropogenic emissions and uncertainties of estimates of secondary emissions for this area.
0
20
40
60
80
100
CZ3
NO
2
DE
2
DE
8
FI96
DE
3
DE
9
NO
90
SE
14
SE
12
HC
B a
ir co
ncen
tratio
n, p
g/m3 Observed Modelled
Fig. 1.31. Comparison of annual mean modelled HCB air concentrations with measurements of the
EMEP monitoring sites for 2012, pg/m3.

33
Model predictions of HCB air concentrations on global scale and for the EMEP region reasonably agree with available measurements.
Transboundary transport within the EMEP region
Model assessment of HCB transboundary transport within the EMEP region is carried out for the years 1990 and 2012. Results of the assessment indicate essential role of secondary emission sources in the pollution levels of the EMEP countries (Fig. 1.32). Contribution of HCB re-volatilization from the surface media (soil, water bodies) accounts for about 75%. Non-EMEP sources of pollution significantly affect pollution levels in the EMEP countries, while the share of anthropogenic emissions in the pollution levels is small.
The most significant contributions to HCB pollution of the EMEP countries belong to secondary emissions and non-EMEP emission sources. At the same time contribution of anthropogenic emissions is rather small.
EMEP secondary emissions
77%
EMEP anthropogenic
emissions1%
non-EMEP emissions
22%
1990
EMEP secondary emissions
75%
EMEP anthropogenic
emissions1%
non-EMEP emissions
24%
2012
Fig. 1.32. Relative contributions of EMEP anthropogenic and secondary emission sources as well as non-EMEP
emissions to total deposition of HCB to the EMEP countries in 1990 and 2012.
While levels of HCB pollution in the EMEP countries have decreased from 1990 to 2012, relative contributions of EMEP anthropogenic emissions, secondary emissions, and non-EMEP emission sources do not change much. The contribution of secondary sources is slightly decreasing, whereas the influence of intercontinental transport is increasing. HCB emissions of the EMEP region considerably contribute to the pollution of other regions. Particularly, about 50% of HCB emitted within the EMEP countries are transported outside of the region.
Relative changes of total HCB deposition in the EMEP countries, together with changes in the contributions of national emission sources, transboundary transport, secondary emissions, and non-EMEP emission sources from the base year 1990 to 2012, are presented in the Fig. 1.33.

34
0%
20%
40%
60%
80%
100%
120%
Fran
ceS
pain
Uni
ted
Kin
gdom
Luxe
mbo
urg
Por
tuga
lR
ussi
anA
zerb
aija
nB
osni
a&H
erze
gov
Ger
man
yM
onac
oR
oman
iaBe
lgiu
mBu
lgar
iaM
onte
negr
oK
azak
hsta
nIta
lyC
roat
iaTu
rkey
FYR
of M
aced
onia
Geo
rgia
Switz
erla
ndH
unga
ryC
ypru
sS
lova
kia
Arm
enia
Slo
veni
aAl
bani
aC
zech
Rep
ublic
Latv
iaFi
nlan
dN
ethe
rland
sIre
land
Lith
uani
aR
epub
lic o
fG
reec
eP
olan
dD
enm
ark
Est
onia
Uzb
ekis
tan
Bela
rus
Serb
iaN
orw
aySw
eden
Turk
men
ista
nU
krai
neIc
elan
dM
alta
Aus
tria
Kyr
gizs
tan
Tajik
ista
n
HC
B d
epos
ition
cha
nge,
%National emissions Transboundary transportNon-EMEP emissions Secondary emissions
Reduction of HCB deposition caused by changes of:
Fig. 1.33. Reduction of HCB deposition in the EMEP countries caused by the changes of national, secondary
and non-EMEP emissions as well as changes of transboundary transport between 1990 and 2012.
Model assessment of HCB pollution indicates that in most of the EMEP countries reduction of HCB deposition has been caused by the decrease of contributions of secondary and non-EMEP emission sources. Contributions of the changes in the anthropogenic emissions within the EMEP region are comparatively small. At the same time, it should be mentioned that anthropogenic HCB emissions reported by the EMEP countries are subject of uncertainties and their contributions can be underestimated. Thus, improvement of assessment of HCB pollution of the EMEP countries requires further refinement of the quality and completeness of officially reported inventories of HCB emissions and of estimates of historical emissions.
Further progress in the assessment of HCB pollution of the EMEP countries can be associated with the refinement of estimates of historical emissions and officially reported emission data.
1.3.4. Polyaromatic hydrocarbons (PAHs)
Model assessment of PAH pollution levels in the EMEP countries was performed for the four indicator compounds (benzo[a]pyrene (B[a]P), benzo[b]fluoranthene (B[b]F), benzo[k]fluoranthene (B[k]F) and indeno[1,2,3-cd]pyrene (IP)) included into the Protocol on POPs. Modelling was carried out for 1990 and 2012 using the MSCE-POP model with refined scheme of degradation of particle-bound POPs. Assessment of PAH pollution levels consists of analysis of long-term trends, evaluation of transboundary transport between the EMEP countries, and comparison of obtained modelling results with available measurements and target levels of pollution established in the EU countries.
Pollution levels and long term trends
Spatial distribution of calculated annual mean air concentrations of 4 PAHs within the EMEP domain for 1990 and 2012 is shown in Fig. 1.34. According to obtained results levels of air pollution by PAHs in the majority of the EMEP countries tended to decrease in the period from 1990 to 2012. However, in some of the countries of the Central and Eastern Europe changes were small and levels of pollution in 2012 were still significant (2 ng/m3 and higher).

35
Decline of PAH pollution levels in the EMEP countries from 1990 to 2012 is accounted for 30% on the average. In twelve countries pollution levels decreased by more than 50%.
a b
Fig. 1.34. Spatial distribution of calculated annual mean air concentrations of 4 PAHs in the EMEP domain for 1990 (a) and 2012 (b), ng/m3.
Relative changes of PAH air concentrations from 1990 to 2012 in three groups of the EMEP countries (the EU, EECCA, and other countries) are presented in Fig. 1.35. The diagram presents mean values of reduction and their dispersion for each considered group of countries. Negative values of the reduction mean relative increase of air concentrations within the considered period.
On the average, PAH pollution levels in the EMEP countries decreased since 1990 by 30%. In twelve countries levels of pollution dropped by more than 50%. The largest reduction takes place in the EU countries (about 40% on the average). For the other EMEP countries lower reduction of pollution is obtained (less than 20%). Model evaluation of pollution changes in the EECCA countries are generally characterized by larger uncertainties which is connected with the lower quality of reported national emission data [Mareckova et al., 2013]. Therefore, improvement of modelling results for this country group requires further refinement of emission data and additional measurements of air pollution levels.
In the particular countries changes of PAH pollution levels from 1990 to 2012 vary from almost 90% decrease to 20% increase. Maximum declining of PAH air concentrations is estimated for the United Kingdom (about 90%), Armenia and Germany (about 70%). The lowest decline is indicated for Finland (6%), Bulgaria (5%), and Estonia (3%). For some of the countries increase of pollution levels is obtained, in particular, for Kyrgyzstan (about 20%) and Azerbaijan (5%).
B[a]P is used as an indicator compound for the evaluation of exposure by PAHs. In the EU countries the target value (TV) for annual mean B[a]P air concentrations equal to 1 ng/m3 is applied. In addition the upper and lower threshold values (UAT and LAT) of 0.6 and 0.4 ng/m3 are established for the assessment of exposure. Similar critical levels of B[a]P air concentrations are also set in some of the EECCA countries.
-40%
-20%
0%
20%
40%
60%
80%
100%
EU EECCA Rest EMEP
Fig. 1.35. Relative changes of annual mean air concentrations of 4 PAHs in three groups of the EMEP countries (the EU, EECCA, and other EMEP
countries) within the period from 1990 to 2012, %.

36
Along with decline of B[a]P pollution levels from 1990 to 2012 (see Fig. 1.34), the number of people, exposed to B[a]P concentrations exceeding the target value, is diminished more than five times within this period. However, it still remained considerable (about 16.5 mln). The number of people exposed to B[a]P air concentrations exceeding UAT and LAT levels is also reduced (3 times and 1.8 times, respectively, see Fig. 1.36).
Model simulations presented here provide smoothed spatial distribution of pollution levels comparing to observed variability of B[a]P air concentrations, which can be substantially higher, especially in the “hot spot” regions. Thus, calculated amounts of people living in such regions should be considered as lower estimates. Evaluation of PAH pollution levels with finer spatial resolution can refine these estimates.
To examine temporal trends in PAH pollution levels in the EMEP countries during the two recent decades benzo[a]pyrene (B[a]P) is selected as the indicator PAH. Analysis of long-term changes of pollution is performed on the basis of results of model simulations describing temporal and spatial variation of pollution within the EMEP region. To verify time series of modelled B[a]P air concentrations they are compared with available long-term measurements of the EMEP monitoring network. Model assessment of B[a]P pollution levels in the EMEP countries covers the period from 1990 to 2012, however consistent set of modelling results is available for the period 1990-2010. Therefore analysis of trends of B[a]P pollution in the EMEP countries is carried out for the period 1990-2010.
The amount of people exposed to B[a]P air concentrations exceeding the EU target value has been reduced more than five times from 1990 to 2012. However, it still remained considerable (about 16.5 mln).
The methodology applied to analyze long-term changes of pollution is descried in the Status Report on HMs [Ilyin et al., 2014]. The distinct feature of this approach is application of two exponential trend components for the approximation of temporal changes of pollution in countries. These two components characterize both fast changes of pollution levels (which took place mostly in the beginning of the considered period) and slow ones (in the end of the period). The latter component for most of the countries is often reduced to a constant indicating stabilization of pollution levels.
Analysis of temporal trends of pollution is applied to the time series of calculated B[a]P air concentration in the EMEP countries as a whole as well as to the time series for individual EMEP countries (Fig. 1.37). Results of the analysis indicate the presence of two trend components in the approximation of temporal changes of concentrations in the EMEP countries: exponentially decreasing and constant ‘base’ components. The nature of this constant ‘base’ component may be explained by the presence of emissions, characterized by minor temporal changes. Of course, this interpretation is a preliminary one and requires further investigation.
0
50
100
150
200
250
300
> target > UAT > LAT
Pop
ulat
ion
(mln
of p
eopl
e)
Year 1990
Year 2012
Fig. 1.36. Amount of people living in
the regions where B[a]P air concentrations (annual averages)
exceed target value, UAT and LAT.

37
EMEP countries
0
0.05
0.1
0.15
0.2
0.25
1990
1992
1994
1996
1998
2000
2002
2004
2006
2008
2010
B[a]
P ai
r con
cent
ratio
ns, n
g/m3
0
100
200
300
400
500
600
700
800
B[a]
P em
issi
ons,
t/y
Fast componentSlow componentCalculationsEmission
Germany
0
0.2
0.4
0.6
0.8
1
1.2
1.4
1990
1992
1994
1996
1998
2000
2002
2004
2006
2008
2010
B[a]
P ai
r con
cent
ratio
ns, n
g/m3
0
40
80
120
160
B[a]
P em
issi
ons,
t/yFast component
Slow componentCalculationsEmission
Austria
0
0.05
0.1
0.15
0.2
0.25
0.3
0.35
0.4
1990
1992
1994
1996
1998
2000
2002
2004
2006
2008
2010
B[a]
P ai
r con
cent
ratio
ns, n
g/m3
0
1
2
3
4
5
6
B[a]
P em
issi
ons,
t/y
Fast componentSlow componentCalculationsEmission
Fig. 1.37. Temporal trend of B[a]P air concentrations in the EMEP countries as a whole and in Germany and
Austria in the period 1990-2010.
To exemplify this, approximation of trends for Germany and Austria is presented in Fig. 1.37. It is seen that trends in both considered countries contain the constant ‘base’ component. However, it is much more pronounced in Austria than in Germany. This can be explained by different rates of emission reduction of particular sectors in these countries. Namely, in Germany reductions of emissions from two most important emission sectors (industrial sources and residential heating) are accounted for 27 and 5 times, respectively. At the same time, for Austria similar reductions amount to 14 and 1.4 times.
Mean rate of the reduction of B[a]P pollution level in the EMEP region as a whole is estimated to 1.4% per year varying from 5.7% in the beginning of the considered period to 0.12% in its end. In the particular European countries the rates of reduction were substantially different (Fig. 1.38). Pollution reduction rates in the EMEP countries were not homogeneous during the past two decades. In most of cases they were fast in the beginning of this period, due to substantial reduction of anthropogenic emissions, whereas in the end of the period reduction was slower due to low changes of emissions. Variations of the reduction rates during considered period are shown in the Figure as the range of their dispersion.
0%
5%
10%
15%
20%
25%
UK
Ger
man
yIre
land
Arm
enia
Net
herla
nds
Luxe
mbo
urg
Alba
nia
Fran
ceC
zech
Rep
ublic
Belg
ium
Aust
riaH
unga
ryS
witz
erla
ndIc
elan
dSl
ovak
iaC
roat
iaN
orw
ayR
epub
lic o
f Mol
dova
Pola
ndSp
ain
Cyp
rus
Den
mar
kSl
oven
iaTu
rkm
enis
tan
Rus
sian
Fed
erat
ion
Bosn
ia&
Her
zego
vina
Kaza
khst
anSw
eden
Turk
eyFY
R_M
aced
onia
Gre
ece
Serb
iaU
zbek
ista
nLi
thua
nia
Bela
rus
Ukr
aine
Rom
ania
Bulg
aria
Geo
rgia
Aze
rbai
jan
Fig. 1.38. Mean reduction rates of B[a]P air concentrations in the EMEP countries and ranges of the reduction in the period 1990-2010.
To verify obtained modelling results modelled time series of B[a]P air concentrations were compared with long-term measurements carried out at five EMEP monitoring sites (CZ03, FI96, NO42, SE14 and SE12). Location of these sites is shown in Fig. 1.39.
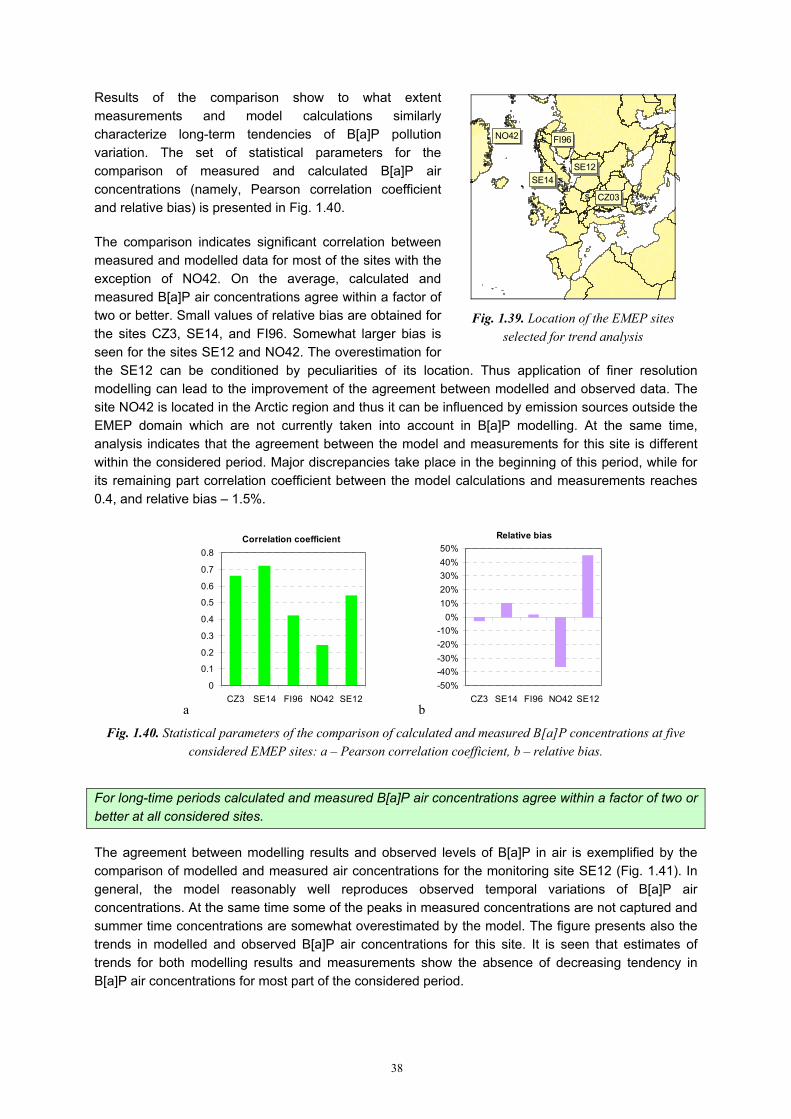
38
Results of the comparison show to what extent measurements and model calculations similarly characterize long-term tendencies of B[a]P pollution variation. The set of statistical parameters for the comparison of measured and calculated B[a]P air concentrations (namely, Pearson correlation coefficient and relative bias) is presented in Fig. 1.40.
The comparison indicates significant correlation between measured and modelled data for most of the sites with the exception of NO42. On the average, calculated and measured B[a]P air concentrations agree within a factor of two or better. Small values of relative bias are obtained for the sites CZ3, SE14, and FI96. Somewhat larger bias is seen for the sites SE12 and NO42. The overestimation for the SE12 can be conditioned by peculiarities of its location. Thus application of finer resolution modelling can lead to the improvement of the agreement between modelled and observed data. The site NO42 is located in the Arctic region and thus it can be influenced by emission sources outside the EMEP domain which are not currently taken into account in B[a]P modelling. At the same time, analysis indicates that the agreement between the model and measurements for this site is different within the considered period. Major discrepancies take place in the beginning of this period, while for its remaining part correlation coefficient between the model calculations and measurements reaches 0.4, and relative bias – 1.5%.
a
Correlation coefficient
0
0.1
0.2
0.3
0.4
0.5
0.6
0.7
0.8
CZ3 SE14 FI96 NO42 SE12 b
Relative bias
-50%-40%-30%-20%-10%
0%10%20%30%40%50%
CZ3 SE14 FI96 NO42 SE12
Fig. 1.40. Statistical parameters of the comparison of calculated and measured B[a]P concentrations at five considered EMEP sites: a – Pearson correlation coefficient, b – relative bias.
For long-time periods calculated and measured B[a]P air concentrations agree within a factor of two or better at all considered sites.
The agreement between modelling results and observed levels of B[a]P in air is exemplified by the comparison of modelled and measured air concentrations for the monitoring site SE12 (Fig. 1.41). In general, the model reasonably well reproduces observed temporal variations of B[a]P air concentrations. At the same time some of the peaks in measured concentrations are not captured and summer time concentrations are somewhat overestimated by the model. The figure presents also the trends in modelled and observed B[a]P air concentrations for this site. It is seen that estimates of trends for both modelling results and measurements show the absence of decreasing tendency in B[a]P air concentrations for most part of the considered period.
#S
#S
#S
#S
#SNO42 FI96
SE12SE14
CZ03
Fig. 1.39. Location of the EMEP sites selected for trend analysis

39
0
0.1
0.2
0.3
0.4
0.5
0.6
1995 1996 1997 1998 1999 2000 2001 2002 2003 2004 2005 2006 2007 2008 2009 2010
B[a]
P ai
r con
cent
ratio
ns, n
g/m3
MeasuredCalculatedTrend measTrend calc
Fig. 1.41. Comparison of calculated and measured B[a]P concentrations at site SE12 for the period from 1995
to 2010 and of the corresponding trends.
Levels of B[a]P pollution are subject of strong seasonal variations (see Fig. 1.41). The factors influencing these variations include the seasonality of pollutant degradation in the atmosphere and seasonal variation of the emissions. To improve further analysis of long-term trends for PAHs the methodology described here needs to be refined taking into account effect of seasonal variations.
Transboundary transport in the EMEP region
Transboundary transport of PAHs within the EMEP region is evaluated on the example of B[a]P. Benzo[a]pyrene is one of the four PAHs considered in the POP Protocol. They are characterized by similar physical-chemical properties. Therefore it can be used to describe peculiarities of PAH long-range transport between the EMEP countries. To evaluate changes of PAH transboundary transport during the two recent decades, model simulations were carried for 1990 and 2012.
B[a]P pollution levels are mostly formed by the anthropogenic emission sources, thus the analysis of transboundary transport is focused on the changes in contributions of emissions originated from the anthropogenic sources of the EMEP countries. The contributions of non-EMEP emissions and secondary sources are comparatively low and currently are not considered.
Model assessment indicates that transboundary transport significantly contributed to the contamination of the EMEP countries in the period from 1990 to 2012. The share of transboundary deposition fluxes in total deposition to the EMEP countries from the anthropogenic emissions is accounted for about 60%. For almost 70% of the countries the deposition of B[a]P from transboundary transport exceeded the deposition from national emission sources.
For about 70% of the EMEP countries the contribution of transboundary transport to deposition of B[a]P over their territory exceeds the contribution of national emission sources.
Long-term changes of total B[a]P deposition in the EMEP countries caused by reduction of national emissions and decrease of deposition from transboundary transport are displayed in Fig. 1.42.

40
-20%
0%
20%
40%
60%
80%
100%
Uni
ted
Kin
gdom
Ger
man
yA
rmen
iaC
ypru
sIre
land
Bel
gium
Net
herla
nds
Fran
ce
Cze
ch R
epub
licLu
xem
bour
gIc
elan
dN
orw
ayAu
stria
Sw
itzer
land
Spa
in
Alb
ania
Sw
eden
Rep
ublic
of M
oldo
vaS
lova
kia
Den
mar
kC
roat
iaPo
land
Hun
gary
Slov
enia
R
ussi
an F
eder
atio
nLi
thua
nia
Latv
iaB
osni
a&H
erze
govi
naFi
nlan
dM
onte
negr
o R
oman
iaE
ston
iaTu
rkey
Bel
arus
Th
e FY
R o
f Mac
edon
iaM
alta
Ukr
aine
Ser
bia
Kaz
akhs
tan
Tajik
ista
nIta
lyP
ortu
gal
Bul
garia
Geo
rgia
Mon
aco
Turk
men
ista
nU
zbek
ista
nA
zerb
aija
nG
reec
eK
yrgi
zsta
n
B[a]
P d
epos
ition
cha
nge,
%
Transboundary transport
National emissions
Reduction of B[a]P deposition caused by changes of:
Fig. 1.42. Reduction of B[a]P deposition in the EMEP countries caused by the changes of national emissions
and transboundary transport between 1990 and 2012. Positive value means decrease of deposition, and negative – increase.
It is seen that decrease of deposition in a lot of countries is conditioned by the reduction of transboundary transport from other countries. This situation is characteristic for most of the EU countries. In the EECCA countries the role of the transboundary transport is even more pronounced. In particular, for seven from twelve EECCA countries contamination reduction is conditioned solely by the reduction of contributions of other countries. Refinement of information on national emissions in the EECCA countries can considerably improve the evaluation of pollution levels in this region.
For most of the EMEP countries B[a]P deposition reduction is conditioned by the reduction of transboundary transport from other countries.
In some of the EMEP countries pollution reduction is conditioned mostly by the decrease of their national emissions. Typical examples of such countries are the United Kingdom and Spain, which are less affected by transboundary transport of pollution due to their geographical location, and Germany, where significant reduction of national emissions took place. Detailed information on transboundary transport for each EMEP country is available on the MSC-E web-site www.msceast.org.
Pollution of marginal seas
In addition to the information on the reduction of PAH pollution levels in the EMEP countries model assessment allows to evaluate changes of pollution of marginal seas, namely, the Baltic Sea, the North Sea, the Black Sea, the Mediterranean Sea, and the Caspian Sea.
Model simulations indicated that maximum decline of PAH pollution levels (over 70%) took place for the North Sea (Fig. 1.43), while the lowest reduction of pollution levels was obtained for the Caspian Sea (about 15%). The decrease of PAH pollution levels over the Black Sea, the Baltic Sea and the Mediterranean
0%
10%
20%
30%
40%
50%
60%
70%
80%
Caspia
nSea
BlackSea
NorthSea
Medite
rranea
nSea
BalticS
ea
Fig. 1.43. Reduction of PAH pollution of
marginal seas from 1990 to 2012, %.

41
Sea was close to the reduction levels in the whole EMEP region (about 30%).
Changes of pollution levels over marginal seas are conditioned by the reduction of emissions in the surrounding countries. Contributions of different groups of the EMEP countries to deposition over the seas in 2012 are illustrated on the example of the Caspian and the North Seas (Fig. 1.44). Major contributors to the contamination of the Caspian Sea were the EECCA countries (particularly, Azerbaijan, Kazakhstan, and the Ukraine), while for the North Sea major contributors were the EU countries (Germany, Belgium, Poland, etc.).
Ukraine23%
Other33%
Caspian Sea
Azerbaijan30%
Kazakhstan14%
Poland
13%
Other34%
Belgium19%
North SeaGermany
21%
Denmark6%
United Kingdom
7% Fig. 1.44. Relative contributions of different EMEP countries to B[a]P deposition
to the Caspian and the Baltic Seas for 2012
Thus, changes of pollution of the North Sea in the considered period (1990-2012) were mostly influenced by the considerable reduction of emissions in the EU countries. Low reduction calculated for the Caspian Sea can be conditioned by the comparatively low changes of emissions and pollution levels in this region.
Refinement of model parameterization for PAHs
Refinement of agreement between the modelling results and measurements is permanently in a focus of MSC-E activities. The quality of the evaluation of PAH pollution is conditioned by uncertainties of emissions, model parameterization and measurement data. In the previous year possible emission uncertainties for B[a]P have been analyzed and the ways of improvement of model parameterizations have been outlined [Ilyin et al., 2013]. This year refinement of model parameterization of B[a]P sorption to aerosol particles and degradation in particulate phase has been performed on the basis of recent investigations of interaction of PAHs and various aerosol components including organic and elemental carbon (see [Shatalov et al., 2013]). Fractionation of B[a]P between gaseous form and forms sorbed on organic carbon, elemental carbon and mineral aerosol obtained on the basis of modified parameterization of gas-particle partitioning is shown in Fig. 1.45.
Sensitivity model runs with different degradation rates, lying in the range reported in literature, were performed to obtain reasonable agreement of model calculations with available measurements. These
Sorbed on
mineral aerosol
10%
Gaseous18%
Sorbed on OC40%
Sorbed on EC32%
Fig. 1.45. Fractions of atmospheric
B[a]P concentrations in various forms at 10 ºC (background regions)

42
runs were based on emission and meteorological data for 2010. This year was selected due to availability of larger set of measurement data, obtained at the EMEP monitoring sites, comparing to other years. The comparison of B[a]P concentrations measured at the EMEP monitoring sites with calculations based on previous and modified model parameterization are shown in Fig. 1.46.
It is seen that modifications of model parameterization have led to the refinement of the agreement between measurements and model predictions for most of the sites. Thus, square deviation between measured and calculated values has diminished from 0.15 ng/m3 to 0.12 ng/m3, and correlation coefficient between measurements and calculations has increased from 0.57 to 0.66. With the refined parameterization, over 70% of measured values agree with calculations within a factor of 2 and among them approximately 60% of measurements agree with calculations within a factor of 1.6. Besides, better agreement between modelled and observed seasonal variations of B[a]P air concentrations has been obtained using the refined model parameterization. Detailed description of modification and testing of model parameterization of gas-particle partitioning and degradation for B[a]P can be found in MSC-E Technical Report [Shatalov et al., 2014].
1.4. “Near-real time” estimates of POP pollution levels
Minimization of temporal gap between the collection of national emissions and reporting of results of pollution assessment is of an importance for timely providing the EMEP countries with information on pollution levels. Delivery of model calculations depends on the reporting of official data on emissions which takes place two years in arrears. At the same time, taking into account that recent changes of emissions in the EMEP countries have been relatively low, model assessment of pollution can be provided with shorter delay (e.g. several months) using meteorological data for 2013 and the most recent emission data (2011).
“Near-real time” modelling allowed to generate information on PAH pollution levels for 2013 and sent it out to the Parties in February 2014. Examples of these results on 4 indicator PAHs are given in Figs. 1.47 and 1.48. Spatial variations of annual PAH deposition levels within the EMEP domain for 2013 are illustrated in Fig. 1.47a. Model simulations, carried out for 2012 and 2013 with the same emission data, indicate substantial effect of inter-annual variations of meteorological conditions on the pollution levels. For example, in twenty countries changes of total PAH deposition fluxes exceed 10%, reaching about 30% in Ireland, France, Sweden, and Malta (Fig.1.47b). Effect of inter-annual variability of meteorological conditions on seasonal level is substantially higher. It is seen on the example for Poland that difference in total PAH deposition for particular months between 2012 and 2013 reaches almost 100% (Fig.1.48). Results of “near-real time” modeling of PAH levels are allocated at MSC-E website.
0
0.1
0.2
0.3
0.4
0.5
0.6
0.7
0.8
PL5
LV10
DE
9C
Z3 SI8
BE
13D
E1
SE
14D
E8
ES
8N
L91
NL9
DE
3S
E12
KZ1
NO
2FI
96N
O90
NO
42
ng/m
3
Previous parameterizationModified parameterizationMeasurements
Fig. 1.46. Comparison of measured B[a]P annual mean air concentrations for 2010 with modelled
concentrations obtained using previous and modified model parameterizations.

43
a b
-40%-30%-20%-10%
0%10%20%30%40%
Irela
ndFr
ance
Uni
ted_
Kin
gdom
Luxe
mbo
urg
Icel
and
Cze
ch_R
epub
licA
ustri
aS
witz
erla
ndH
unga
ryK
azak
hsta
nS
lova
kia
Cro
atia
Turk
eyFY
R_o
f_M
aced
Cyp
rus
Gre
ece
Finl
and
Nor
way
Sw
eden
Mal
ta
Dep
ositi
on c
hang
e fro
m 2
012
to 2
013
Fig. 1.47. Spatial distribution of annual total deposition of 4PAHs within EMEP domain for 2013 (a) and changes of annual PAH deposition between 2012 and 2013 ((D2013-D2012)/D2012*100%) in the selected EMEP
countries, where the difference exceeds 10% (b).
a b
0
1
2
3
4
5
6
7
8
9
Jan Feb Mar Apr May Jun Jul Aug Sep Oct Nov Dec
4 P
AH
dep
ositi
on, t
/y
2012 2013
Fig. 1.48. Spatial distribution of annual total deposition of 4PAHs over Poland for 2013 (a) and changes of intra-annual variations of PAH deposition fluxes over its territory between 2012 and 2013 (b).
44
2. COOPERATION AND EXCHANGE WITH INFORMATION ON POP POLLUTION
Dissemination of POP pollution assessment results and other relevant information aimed at support of political decisions is of high importance. Annual reports containing current status of POP pollution within the EMEP region are supplemented by presentation of information on the MSC-E web site (www.msceast.org). It provides more flexible and targeted assistance to national experts and authorities with data required for the environment protection regulations. In particular, detailed information on POP pollution is given for both the whole EMEP region and each EMEP country individually. The country-specific information includes variety of data on emissions, measurements and model assessment collected in one place to make easier access to the information and its analysis by national experts. Besides, to support the EECCA countries in their efforts on implementation of the Protocol on POPs and development of national environmental programs a full-scale Russian version of the MSC-E website has been developed (ru.msceast.org).
Another important aspect is the information exchange with subsidiary bodies to the Convention and other international organizations and programmes. There is a wide interest outside the Convention to the data products and analysis performed by the EMEP scientific Centres. EMEP is unique instrument within the LRTAP Convention providing regular pollution assessment and supporting Parties to the Convention with information on pollution levels of POPs and other contaminants in Europe and other regions. In the context of co-operation MSC-E regularly exchanges information on POP pollution with different international bodies including UNEP, HELCOM etc. These and other aspects of the information dissemination are discussed below.
2.1. Working Group on Effects (ICP-Vegetation)
Analysis of spatial and temporal variations of atmospheric POP deposition can be complemented by the application of measurement data on POP content in mosses. Monitoring of hazardous substances in mosses in the EMEP region is coordinated by the International Cooperative Programme on Effects of Air Pollution on Natural Vegetation and Crops (ICP-Vegetation) of the Working Group on Effects (WGE). Similar to heavy metals, mosses are used as biomonitors of selected POPs and are applied to investigate spatial pattern of POP deposition and its temporal changes [Harmens et al., 2013]. This is especially important taking into account the lack of POP measurements in some of the EMEP countries.
Survey of POP content in mosses has been initiated by several EMEP countries to identify main polluted areas that are at risk from air pollution [Harmens et al., 2011]. Particularly, concentrations of 4 PAHs (B[a]P, B[b]F, B[k]F, and IP) in mosses were measured at several sites located in France, Norway, Poland, Slovenia, Spain, and Switzerland in 2010. This year, results of these measurements were provided by the ICP-Vegetation to MSC-E and were used in the analysis of spatial pattern of PAH deposition fluxes in the EMEP countries. Preliminary results of this work were presented during the 27th ICP-Vegetation Task Force meeting held in Paris, France in January 2014.
Using the provided measurements of PAH concentrations in mosses, analysis of spatial distribution of PAH deposition was performed for the year 2010. Similar to the methodology developed for heavy metals [Ilyin et al., 2014], modelled deposition fluxes for the preceding period of time (one year at this stage of the study) were used to take into account accumulation of pollutants in mosses. Example of spatial distribution of B[a]P annual deposition fluxes, along with locations of monitoring of moss concentrations measured in 2010, is given in Fig. 2.1.

45
Fig. 2.1. Spatial distribution of modeled annual deposition of B[a]P and locations of monitoring sites performed measurements of B[a]P concentrations in mosses in 2010.
In most of the countries, that took part in this study, monitoring has been performed in the comparatively small regions with quite dense distribution of sites. The only study covering the whole area of the country was carried out in Norway. Thus, to characterize the spatial distribution of atmospheric deposition wider coverage of EMEP countries by moss monitoring sites is of importance.
Dense distribution of monitoring sites provides useful information for the analysis of atmospheric deposition with fine spatial resolution. Particularly, it characterizes sub-grid variations of PAH deposition fluxes modelled with currently applied 50x50 km spatial resolution. For example, in France 18 measurement points are located in the 8 model grid cells, and in Spain 8 grid cells contain 23 measurement points. Variations of PAH concentrations in mosses within the particular model grid cells can reach almost 80% from the average and thus can significantly affect the comparison of modelled and measured concentrations.
Evaluation of the correlation between the modeled PAH concentrations and measurements in mosses for all considered PAHs in the above six areas in Europe is illustrated in Fig. 2.2. It is seen that significant correlation (about 0.7) is obtained with measurements of all four PAHs in France. Significant correlation is found for B[a]P and B[b]F in Spain, for IP in Norway, and for B[k]F in Poland, while for the other cases it is low.
Correlation coefficient
-0.2
0
0.2
0.4
0.6
0.8
1
France
Spain
Norway
Switzerl
and
Poland
Sloven
ia
B[a]P B[b]FB[k]F IP
Fig. 2.2. Correlation coefficient between
moss concentrations and deposition flux in six areas in Europe for 4 indicator PAHs.
46
One of the possible reasons of the discrepancies between the measured concentrations in mosses and model predictions can be attributed to pronounced spatial variations of measured concentrations and their dense location which are not reasonably reproduced by the modeling with 50x50 km spatial resolution.
Further analysis of spatial variability of PAH pollution levels using model assessment and monitoring of moss concentrations within the EMEP domain requires wider coverage of countries by monitoring sites and application of modelling with finer spatial resolution.
2.2. Task Force on Measurements and Modelling (TFMM)
MSC-E continued to co-operate with the Task Force on Measurements and Modelling (TFMM) and took part in its recent meeting in Bologna, Italy in April 2014. Participants of the Task Force meeting were informed about the recent progress with respect to the implementation of the new EMEP domain for the routine model simulations and the development of the GLEMOS modelling system.
Transition to the new EMEP domain includes changing of projection from stereographic to latitude-longitude one and increasing of spatial resolution of the regular model calculations. Various aspects of applying of latitude-longitude projection were worked over in course of evaluation of global scale transport and fate of POPs. Global modelling is an integral part of the evaluation of the EMEP region pollution by these contaminants because many of them are dispersed globally. It is used for the evaluation of boundary and initial conditions as well as estimating contributions of particular regions outside the EMEP domain to the pollution of the EMEP countries.
Recent modelling results on influence of anthropogenic and secondary POP emission sources of other regions of the world on the EMEP domain were presented. Detailed description of these results can be seen in Chapter 1 of this report and in the MSC-E Technical report [Shatalov et al., 2014]. Further progress in this direction depends on the availability and refinement of global emission inventories. In this respect it is important to continue co-operation with international organizations working on the compilation of global POP emission inventories (e.g. the UNEP Stockholm Convention on POPs) and discussion of these issues within the TF HTAP and TFMM.
Along with implementing of latitude-longitude projection the Centre performed pilot model simulations for the new EMEP domain with fine spatial resolution. Preliminary evaluation of these modelling results is described in the EMEP Status report on HMs [Ilyin et al., 2014] and in the MSC-E Technical report [Shatalov et al., 2014]. Further steps in the transition to fine resolution modelling will include more detailed comparison with measurements as well as with the modelling results obtained for currently used EMEP domain.
The information on ongoing development of the GLEMOS includes overview of elaboration of multi-media approach (particularly, ocean module) and refinement of various model parameterizations. Finally, directions of further development of the GLEMOS modelling system for HMs and POPs were outlined.

47
2.3. Task Force on Hemispheric Air Pollution (TF HTAP)
In framework of co-operation with the Task Force on Hemispheric Transport of Air Pollution (TF HTAP) MSC-E participated in the Task Force workshop held in San Francisco, USA in December 2013. The Centre made an overview of ongoing activities within EMEP focused on the assessment of POP pollution levels. In particular, MSC-E presented pilot results of model simulations of intercontinental transport and source-receptor relationships of selected POPs (PCB-153) as possible contribution to the forthcoming TF HTAP numerical experiments (Fig. 2.3). Modelling was performed for the time period and division of source and receptor regions agreed within TF HTAP (Fig. 2.4).
0.0
0.2
0.4
0.6
0.8
1.0
1.2
1.4
Ocean
North A
merica
Europe
South
Asia
East A
sia
South
East A
sia
Austra
lia an
d New
Zealan
dAfric
a
Middle
East
Centra
l Ameri
ca
South
America
CIS coun
tries
Arctic
Antarct
icPC
B-1
53 c
once
ntra
tions
, pg/
m3
Legacy South AsiaEast Asia Middle EastAfrica CIS countriesEurope South AmericaCentral America North America
Fig. 2.3. Spatial distribution (a) and source-receptor relationships (b) of annual mean PCB-153 air
concentrations for 2010, pg/m3 .
North America
Europe
South AsiaEast Asia
South East AsiaAustralia and New Zealand
AfricaMiddle East
Mexico & Central AmericaSouth America
CIS countries
ArcticAntarctica
Source/receptor regions:
Secondary sources
North America
Europe
South AsiaEast Asia
South East AsiaAustralia and New Zealand
AfricaMiddle East
Mexico & Central AmericaSouth America
CIS countries
ArcticAntarctica
Source/receptor regions:North America
Europe
South AsiaEast Asia
South East AsiaAustralia and New Zealand
AfricaMiddle East
Mexico & Central AmericaSouth America
CIS countries
ArcticAntarctica
North AmericaNorth America
EuropeEurope
South AsiaSouth AsiaEast AsiaEast Asia
South East AsiaSouth East AsiaAustralia and New ZealandAustralia and New Zealand
AfricaAfricaMiddle EastMiddle East
Mexico & Central AmericaMexico & Central AmericaSouth AmericaSouth America
CIS countriesCIS countries
ArcticArcticAntarcticaAntarctica
Source/receptor regions:
Secondary sources
Fig. 2.4. Division of global scale source and receptor regions agreed within HTAP for numerical source-receptor experiments (b).
Results of model simulations indicated that both regional sources and contribution of long-range transport played considerable role in POP pollution of many industrial regions. It was also concluded that the multi-media dispersion character of POPs required source apportionment of secondary emissions over longer period of time (more than one year). Finally, the importance of closer cooperation with relevant on-going activities within international bodies including the Stockholm Convention on POPs was emphasized.
48
2.4. Task Force on Emission Inventories and Projections (TFEIP)
Activity of the Task Force on Emission Inventories and Projections (TFEIP) supports the EMEP countries in the reporting of official emissions of air pollutant and their projections to the Convention. In addition, it provides technical forum and the network of experts to establish emission factors, methodologies for the estimation of emissions, and discuss the problems related to data reporting.
In 2014 MSC-E continued cooperation with TFEIP. In particular, the Task Force invited EMEP modeling Centres to give their thoughts on what emission information they use, wishes concerning reported emissions, and how improvements might be made to the current datasets. In the framework of this activity MSC-E has prepared the note to respond to the questions posed by TFEIP and to support discussions focused on the quality of POP emissions and their improvement (Annex A).
Further progress in the assessment of POP pollution in the EMEP domain is associated with the improvement of completeness and consistency of emission data, providing the information on the range of uncertainty of reported emissions, generating and updating of emission expert estimates and collaboration with the UNEP Stockholm Convention. To find the optimal solutions for the emission-related problems there is a need to strengthen cooperation between TFEIP and modelling community.
2.5. POP pollution of the Baltic Sea
Information on atmospheric pollution of marginal seas within the EMEP region is of interest for various international marine organizations. In particular, in cooperation with the other EMEP Centres, MSC-E performs regular model assessments of atmospheric pollution of the Baltic Sea by different pollutants including POPs. This work is carried out in accordance with the Memorandum of Understanding between the Baltic Marine Environment Protection Commission (HELCOM) and the United Nations Economic Commission for Europe.
Recent assessment of airborne pollution load to the Baltic Sea has comprised the information on long-term trends in the PCDD/F deposition in the period 1990-2011 and evaluation of contributions of anthropogenic and secondary PCDD/F emissions to the pollution in 2011. This year following the requirements of the HELCOM LOAD group the evaluation of atmospheric deposition has been performed for nine sub-basins of the Baltic Sea. Results of this assessment are published in the joint annual report of the EMEP Centres [Bartnicki et al., 2013]. Short summary of information on the Baltic Sea pollution by PCDD/Fs is available also in a form of indicator fact sheets published in the internet on the HELCOM web site [http://www.helcom.fi].
Assessment of PCDD/F pollution indicates that annual emissions in the countries surrounding the Baltic Sea have dropped by 45% from 1990 (Fig. 2.5). The largest contribution to PCDD/F emissions of the HELCOM countries belongs to Russia and Poland. Atmospheric deposition of dioxins and furans over the surface of the Baltic Sea decreased from 1990 to 2011 by 66%. More significant changes took place in the western and southern parts of the Baltic Sea (by 70-75%), while changes of deposition in the eastern parts of the sea were lower (by 40-60%).
0
20
40
60
80
100
90 93 96 99 02 05 08 11
% o
f 199
0
Deposition Emissions
Fig. 2.5. Long-term changes of PCDD/F
annual emissions of the HELCOM countries and deposition to the Baltic Sea in the period
1990-2011 (% of 1990).

49
Example of spatial distribution of PCDD/F deposition to the Baltic Sea in 2011 is presented in Fig.2.6a. Elevated pollution levels can be seen in the western sub-basins (the Kattegat and the Western Baltic). Among the HELCOM countries the most significant contributions to the PCDD/F pollution belong to Poland followed by Russia, Sweden, and Denmark (Fig. 2.6b).
a b
0
5
10
15
20
25
PL RU SE DK LV FI DE EE LT
Dep
ositi
on, g
TEQ
/yea
r
Fig. 2.6. Spatial distribution of PCDD/F deposition over the Baltic Sea, ng TEQ/km2/y (a) and contributions (in g TEQ/y) of HELCOM countries to annual total PCDD/F deposition to the Baltic Sea for 2011 (b)
2.6. Evaluation of POP pollution levels over Italy
This year MSC-E continued cooperation with experts from the Italian national agency for new technologies, energy, and sustainable economic development (ENEA). For the assessment of POP pollution at national scale, Italian experts were provided with 3D air concentrations of 4 PAH species: benzo[a]pyrene (B[a]P), benzo[b]fluoranthene (B[b]F), benzo[k]fluoranthene (B[k]F) and indeno[1,2,3-cd]pyrene (IP) over the agreed area (Fig. 2.7). These data were planned to be applied as boundary conditions by the national modelling system MINNI. For this purpose datasets of selected PAH air concentrations were generated with spatial resolution 50×50 km and temporal resolution 6 hours.
Example of spatial distribution of B[a]P annual mean air concentrations for 2010 is presented in Fig. 2.7. Most important sources of PAH pollution are seen in countries of Central and Eastern Europe that can contribute to the pollution of Italy.
a b
Fig. 2.7. Annual mean air concentrations of B[a]P in 2010 in the EMEP domain (a) and in the agreed area (b), ng/m3. White circles denote locations of the EMEP monitoring sites measuring B[a]P within the agreed area.

50
Model simulations were performed using official gridded data on PAH emissions in the EMEP countries received from the EMEP Centre on Emission Inventories and Projections (CEIP) [Mareckova et al, 2013]. In case officially reported data were not available, expert estimates of PAH emissions for 2010 produced by the Dutch TNO institution [Denier van der Gon et al., 2005] were applied.
For the verification of modelling results computed levels of PAH air concentrations were compared with measurements for the EMEP domain and for the considered area. Observed PAH air concentrations were derived from the EMEP/CCC monitoring data base [Aas and Breivik, 2012]. Results of the comparison are illustrated in Fig. 2.8a for the selected 4 PAHs. It is seen that PAH contamination levels within the EMEP region are reproduced relatively well. For the majority of monitoring sites the difference between modelled values and observations is within a factor of two and correlation coefficient ranges from 0.6 to 0.9.
a
0
0.2
0.4
0.6
0.8
1
1.2
0 0.2 0.4 0.6 0.8 1 1.2Measured, ng/m3
Cal
cula
ted,
ng/
m3
B[a]PB[b]FB[k]FIP
b
0
0.2
0.4
0.6
0.8
1
1.2
Jan
Mar
May Ju
l
Sep
Nov
B[a]
P in
air,
ng/
m3
MeasuredCalculated
CZ3
Fig. 2.8. Scatter plot of annual mean modelled and observed air concentrations of 4 PAHs at the EMEP monitoring stations for 2010 (a) and comparison of seasonal variations of modelled and observed B[a]P air
concentrations in 2010 for the monitoring site Kosetice (CZ3) (b).
Besides, the model has reasonably well captured seasonal variations of PAH concentrations. Example of the comparison of monthly mean modelled and measured B[a]P air concentrations is presented in Fig. 2.8b for the EMEP monitoring site Košetice (CZ3). Evaluation of modelling results for the agreed area was performed on the base of EMEP data only. It should be noted that stations of the EMEP monitoring network for POPs are mostly located in the northern part of the agreed area, while the southern and central parts are not covered by POP monitoring sites. Thus, national measurement data on PAH concentrations in air can be very helpful for better understanding the origin of atmospheric PAH pollution levels in Italy and for improving of assessment of POP pollution both at national and EMEP scales.
51
3. MAIN CHALENGES AND DIRECTIONS OF FUTURE RESEARCH
The activities of the EMEP Centres MSC-E and CCC in 2015 will be carried out in accordance with the “2014-2015 work-plan for the implementation of the Convention” [ECE/EB.AIR/122/Add2]. Further work will be directed to the assessment of POP pollution in the EMEP region and support of the EMEP countries with information required for the implementation of the Protocol on POPs. Long-term changes of POP pollution levels and transboundary transport within the EMEP region will be evaluated for the period 1990-2013. Particular attention will be paid to the evaluation of contamination of the EECCA countries. Main challenges of future research and developments aimed at the improvement of the quality of POP pollution assessment are summarized below.
• Major issues regarding the reported POP emission data have been jointly discussed by MSC-
E and the Task Force on Emission Inventories and Projections. It is emphasized that completeness and consistency of reported emissions, information on the range of uncertainties, generating and updating of emission expert estimates (including global inventories of POP emissions), and collaboration with other international programmes (e.g. the UNEP Stockholm Convention on POPs) are essential for the assessment of POP pollution in the EMEP domain.
• Regular measurements of POP concentrations and deposition fluxes are currently performed by 34 EMEP monitoring sites, most of which are located in the northern, western and central parts of Europe. However, there is a lack of monitoring sites in the southeast part of Europe as well as in the EECCA countries. Improvement of spatial distribution of monitoring sites is significant for the analysis of POP pollution in the EMEP region. In this respect, collection and analysis of national measurements of POPs are highly appreciated, especially for dioxins and furans that are not currently measured on regular basis by the EMEP network.
• Evaluation of POP pollution of the EMEP countries in cooperation with the WGE/ICP-Vegetation will be continued. Complementary analysis of regular measurements of POP concentrations in mosses and of modelling results can provide additional insights into the spatial and temporal variations of pollution levels. Besides, inclusion of the EECCA and South-eastern Europe (SEE) countries into the survey of POP concentrations in mosses is of importance because air pollution measurements of POPs in these countries are not currently available.
• Analysis on long-term trends in POP pollution of the EMEP countries is important for the implementation of the Protocol on POPs and for understanding effectiveness of national environmental policies. Evaluation of long-term trends, performed for B[a]P pollution levels, will be continued for other POPs. The methodology for the analysis of trends will be further developed in order to take into account the influence of seasonal variability of POP pollution levels.
• Secondary emissions (re-volatilization from the environmental media) and intercontinental transport of PCDD/Fs, PCBs, and HCB substantially contribute to the pollution of the EMEP countries. Further work will be undertaken to refine contribution of secondary emissions of these POPs. In particular, updating of experimental scenarios of historical and contemporary emissions will be performed as well as refinement of parameterizations of processes governing contaminant fate in the terrestrial and aquatic environmental compartments.
• Further development of the Global EMEP Multi-media Modelling System (GLEMOS) for POPs will include pilot model simulations using the new EMEP grid and latitude-longitude projection

52
as well as evaluation of modelling results. The GLEMOS source code will be distributed for public use to support development of country-scale modelling approaches in the EMEP countries.
• MSC-E will continue support and development of English and Russian versions of the MSC-E website to facilitate access to various types of information on pollution levels in the EMEP region and in particular countries. In order to enhance exchange of relevant information it is planned to continue cooperation with subsidiary bodies to the Convention, international and national organizations.
53
REFERENCES
Aas W. and K. Breivik [2012] Heavy metals and POP measurements, 2010 EMEP/CCC-Report 3/2012.
Aas W., Hjellbrekke A-G. [2003] Heavy metals and POP measurements, 2001. Kjeller, Norwegian Institute for Air Research (EMEP/CCC-Report 1/2003).
Aas W., Nizzetto P. [2014] Heavy metals and POP measurements 2012. Kjeller, Norwegian Institute for Air Research (NILU) (EMEP/CCC-Report 3/2014).
AMAP/UNEP [2013] Technical Background Report for the Global Mercury Assessment 2013. Arctic Monitoring and Assessment Programme, Oslo, Norway/UNEP Chemicals Branch, Geneva, Switzerland. vi + 263 pp.
Aulinger A., V. Matthias and M. Quante [2010] An Approach to Temporally Disaggregate Benzo(a)pyrene Emissions and Their Application to a 3D Eulerian Atmospheric Chemistry Transport Model, Water, Air, & Soil Pollution, vol. 216, No. 1-4, pp. 643-655.
Barber J. L., Sweetman A., van Wijk D., Jones K. C. [2005] Hexachlorobenzene in the global environment Emissions, levels, distribution, trends, and processes, Science of the Total Environment, vol. 349, pp. 1-44.
Bartnicki J., A.Gusev, W.Aas, S. Valiyaveetil. [2013] Atmospheric supply of nitrogen, lead, cadmium, mercury and dioxins/furans to the Baltic Sea in 2011. Summary Report for HELCOM. MSC-W Technical Report 2/2012.
Breivik K., R. Alcock, Y.-F.Li, R. E. Bailey, H. Fiedler, J.M. Pacyna [2004] Primary sources of selected POPs: regional and global scale emission inventories. Environmental Pollution 128, 3–1.
Breivik K., Sweetman A., Pacyna J.M., Jones K.C. [2007] Towards a global historical emission inventory for selected PCB congeners - A mass balance approach-3. An update. Science of the Total Environment, vol. 377, pp. 296-307.
Cao Z., H. Fiedler, B. Wang, T. Zhang, G. Yu, J. Huang, S. Deng [2013] Economic status as a determinant of national PCDD/PCDF releases and implications for PCDD/PCDF reduction, Chemosphere 91, 328-335.
Chi et al. [2013] Evaluation of the distributions of ambient PCDD/Fs at remote locations in and around Taiwan, Atmospheric Environment, 78, 203-212.
Denier van der Gon D. H.A.C., van het Bolscher M., Visschedijk A.J.H. and Zandveld P.Y.J. [2005] Study to the effectiveness of the UNECE Heavy Metals Protocol and costs of possible additional measures. Phase I: Estimation of emission reduction resulting from the implementation of the HM Protocol. TNO-report B&O-A R 2005/193.
EMEP Status Report 2/2012. Long-term Changes of Heavy Metal Transboundary Pollution of the Environment (1990-2010).
EMEP Status Report 2/2013. Heavy Metals: Transboundary Pollution of the Environment.
EMEP Status Report 3/2012. Persistent Organic Pollutants in the Environment.
EMEP Status Report 3/2013. Persistent Organic Pollutants in the Environment.
EMEP/MSC-E Technical report 1/2013. Heavy Metals and Persistent Organic Pollutants: Model Assessment of Pollution and Research Activities.
EMEP/MSC-E Technical Report 1/2014. Assessment of Heavy Metal Pollution Levels in the Netherlands (EMEP case study).
EMEP/MSC-E Technical Report 6/2005. Regional Model MSCE-HM of Heavy Metal Transboundary Air Pollution in Europe.
EU [2004] Directive 2004/107/EC of the European Parliament and of the Council of 15 December 2004 relating to arsenic, cadmium, mercury, nickel and polycyclic aromatic hydrocarbons in ambient air. URL: http://rod.eionet.europa.eu/instruments/606.
Fiedler H. [2007] National PCDD/PCDF release inventories under the Stockholm Convention on Persistent Organic Pollutants, Chemosphere 67, S96–S108.

54
Fiedler H., Cao Z., Huang J., Wang B., Deng S., and Yu G. [2012] PCDD/PCDF inventories 1990 vs. 2012. Organohalogen Compounds, 74, 1521-1524.
Gusev A., O.Rozovskaya, V.Shatalov, V.Sokovykh, N.Vulykh, W. Aas, K. Breivik, A.A.Katsogiannis [2013] Persistent Organic Pollutants in the Environment. EMEP Status Report 3/2013
Gusev A., S.Dutchak, O.Rozovskaya, V.Shatalov, V.Sokovykh, N.Vulykh, W. Aas, K. Breivik [2011] Persistent Organic Pollutants in the Environment. EMEP Status Report 3/2011.
Halse A.K., M. Schlabach, S. Eckhardt, A. Sweetman, K. C. Jones, and K. Breivik [2011] Spatial variability of POPs in European background air, Atmos. Chem. Phys., vol. 11, 1549–1564.
Harmens H., G. Mills, F. Hayes, D. Norris, and participants of the ICP Vegetation [2011] Air Pollution and Vegetation. ICP Vegetation Annual Report 2010/2011. Centre for Ecology & Hydrology.
Harmens H., L. Foan, V. Simon, G. Mills [2013] Terrestrial mosses as biomonitors of atmospheric POPs pollution: A review. Environmental Pollution 173, pp 245-254.
Ilyin I., O.Rozovskaya, O.Travnikov, M.Varygina, W.Aas [2014] Heavy Metals: Transboundary Pollution of the Environment. EMEP Status Report 2/2013.
Ilyin I., O.Rozovskaya, O.Travnikov, M.Varygina, W.Aas, H.T.Uggerud [2014] Heavy Metals: Transboundary Pollution of the Environment. EMEP Status Report 2/2013.
Jaward F.M., Farrar N.J., Harner T., Sweetman A.J., and Jones K.C. [2004] Passive air sampling of PCBs, PBDEs, and organochlorine pesticides across Europe, Environ. Sci. Technol., vol. 38, pp. 34–41.
Jonson J.E. and O.Travnikov (Eds.) [2010] Development of the EMEP global modeling framework: Progress report. Joint MSC-W/MSC-E Report. EMEP/MSC-W Technical Report 1/2010.
Jonson J.E., Travnikov O. [2012] Global scale modelling within EMEP: Progress report. Join MSC-E/MSC-W Report EMEP/MSC-E Technical Report 1/2012.
Klánová J., P. Cupr, I. Holoubek, J. Boruvková, P. Pribylová, R. Kareš, J. Kohoutek, A. Dvorská, J. Komprda, [2009] Towards the Global Monitoring of POPs. Contribution of the MONET Networks. Masaryk University, ISBN 978-80-210-4853-9.
Lorber M., J. Ferrario, C. Byrne, (2013), EPA’s National Dioxin Air Monitoring Network (NDAMN): Design, implementation, and final results. Atmospheric Environment, 77, 311-317.
Mareckova K., R. Wankmueller, L. Moosmann, M. Pinterits [2013] Inventory Review 2013, Technical Report 1/2013, CEIP, ISBN 978-3-99004-248-9.
Mareckova K., R. Wankmueller, R. Whiting, and M. Pinterits [2012] Inventory Review 2012, Technical Report 1/2012, CEIP, ISBN 978-3-99004-201-4.
Min Y., M. Lee, D. Kim, J. Heo [2013] Annual and seasonal variations in atmospheric PCDDs/PCDFs and dioxin-like PCBs levels in satellite cities of Seoul, Korea during 2003-2009, Atmospheric Environment, 77, 222-230.
Pacyna E.G., J.M. Pacyna, J. Fudala, E. Strzelecka-Jastrzab, S. Hlawiczka, D. Panasiuk, S. Nitter, T. Pregger, H. Pfeiffer, R. Friedrich [2007] Current and future emissions of selected heavy metals to the atmosphere from anthropogenic sources in Europe. Atmospheric Environment, 41, 8557–8566.
Schaap M., M. Roemer, F. Sauter, G. Boersen, R. Timmermans, and P. G. H. Builtjes [2005] LOTOS-EUROS: documentation, TNO report B&O-A R 2005/297.
Shatalov V., A. Gusev, S. Dutchak, O. Rozovskaya, V. Sokovykh, N. Vulykh, W. Aas, K. Breivik [2010] Persistent Organic Pollutants in the Environment. EMEP Status Report 3/2010.
Shatalov V., Gusev A., S.Dutchak, O.Rozovskaya, V.Sokovykh, N.Vulykh, W. Aas, K. Breivik [2012] Persistent Organic Pollutants in the Environment EMEP Status Report 3/2012
Shatalov V., Ilyin I., Gusev A., Rozovskaya O., Sokovykh V., Travnikov O. [2013] Heavy Metals and Persistent Organic Pollutants: Model Assessment of Pollution and Research Activities. EMEP/MSC-E Technical report 1/2013.

55
Shatalov V., Ilyin I., Gusev A., Rozovskaya O., Travnikov O. [2014] Heavy Metals and Persistent Organic Pollutants: Model Assessment of Pollution and Research Activities. EMEP/MSC-E Technical report 4/2014.
Solorzano-Ochoa G., de la Rosa D., Maiz-Larralde P., Gullett B., Tabor D., Touati A., Wyrzykowska-Ceradini B., Fiedler H., Abel T., Carroll W. [2012] Open burning of household waste: Effect of experimental condition on combustion quality and emission of PCDD, PCDF and PCB. Chemosphere, 87, 1003-1008.
Tarrasón L. and A. Gusev Ed. [2008] Towards the development of a common EMEP global modelling framework EMEP/MSC-W Technical Report 1/2008.
Travnikov O. and Jonson J.E. (Eds.) [2011] Global scale modelling within EMEP: Progress report. Joint MSC-W/MSC-E Report. EMEP/MSC-E Technical Report 1/2011.
Travnikov O., Ilyin I., Rozovskaya O., Varygina M.,Aas W., Uggerud H.T., Mareckova K. and Wankmueller R. [2012]. Long-term changes of heavy metal transboundary pollution in the environment. EMEP Status report 2/2012. 53 p.
Travnikov O., J.E. Jonson, A.S Andersen, M. Gauss, A. Gusev, O. Rozovskaya, D. Simpson, V. Sokovykh, S. Valiyaveetil and P. Wind [2009] Development of the EMEP global modelling framework: Progress report. Joint MSC-E/MSC-W Report. EMEP/MSC-E Technical Report 7/2009.
UNECE [2009] EMEP monitoring strategy. ECE/EB.AIR/GE.1/2009/15. URL: http://www.unece.org/env/documents/2009/EB/ge1/ece.eb.air.ge.1.2009.15.e.pdf
UNEP [2010] Final review of scientific information on cadmium.
UNEP [2013] Toolkit for Identification and Quantification of Releases of Dioxins, Furans and Other Unintentional POPs.
Wenborn M., K. King, D. Buckley-Golder, and J A Gascon [1999] Releases of Dioxins and Furans to Land and Water in Europe, Report AEAT-4703, AEA Technology Environment, EC DG Environment.

56
Annex A
EMEP/MSC-E CURRENT ACTIVITIES IN THE FIELD OF POP AND HM EMISSIONS
Introduction Emission data currently provided by the EMEP countries in their national inventories cover only part of the information that is required for model assessment of HM and POP pollution. To provide reliable levels of concentrations and deposition fluxes within the EMEP domain officially reported data need to be complemented by various expert estimates as shown in Table A.1.
Table A.1. Information on HM and POP emissions officially provided by EMEP countries. Additional emission data required for model assessment of pollution levels
Information on HM (Pb, Cd, Hg) and POP (PAHs, HCB, PCBs, PCDD/Fs) emissions
Official emission data
(CEIP)
Emission data for modelling
(MSC-E) Time series of national total emissions (annually) X
Gridded sectoral emissions (once in five years) X
Emissions of Large Point Sources (once in five years) X
Gridded total emissions for the latest reported year generated by CEIP (annually) X
Time series of gridded annual emissions 1990-2012 X
Vertical distribution of emissions X
Speciation of Hg forms (Hg˚, Hg(II)gas, Hg(II)part) X
Congener composition for POPs (PCDD/Fs – 17 congeners, PCB-153) X
Intra-annual variations of emissions X
Historical emissions of PCBs, HCB, PCDD/Fs up to 1990 X
Emissions to other environmental compartments (PCDD/Fs, HCB) X
Emissions for the non-EMEP countries within the EMEP domain. (North Africa and Middle East). X
Natural emissions X
Re-suspension, re-emissions X
Global emission inventories (PCDD/Fs, HCB, PCBs, Hg) X
The preparation of HM and POP emission data for the EMEP domain includes gap-filling of officially submitted data and generation of gridded time series of annual emissions. Part of this work is currently carried out by CEIP, namely, gap-filling and gridding the emissions for the latest reported year. At the same time, preparation of gridded time series of emissions for the whole period of time from the base year to the latest reported year is performed at MSC-E including also gap-filling and providing emissions for the non-EMEP countries within the EMEP domain [EMEP Status Report 2/2012, Section 1.5; EMEP Status Report 3/2013, Section 1.1]. Along with this, model assessment requires evaluation of various parameters and characteristics of these gridded emissions, in particular, their vertical distribution, chemical composition, and intra-annual variations [EMEP/MSC-E Technical Report 6/2005, Section 2.2; EMEP Status Report 3/2012, Sections 1.2.2, 1.2.3]. This information is not provided by the EMEP countries and generated on the basis of expert estimates.

57
A number of HMs and POPs are the pollutants of global scale dispersion (e.g. Hg, PCBs, PCDD/Fs, HCB). Evaluation of pollution of non-EMEP emission sources, located outside of the EMEP domain, requires application of global inventories of anthropogenic and natural emissions. Pollution levels of HMs and POPs are subject of the influence of secondary emissions (re-suspension and re-emission). For long-lived pollutants it is important to take into account their historic emissions and emissions to surface waters and land which have essential effect on contemporary levels of pollution. Requested by the TFEIP information on various aspects and issues related to the use of officially submitted emissions and expert estimates is given below. 1. Which pollutant(s) is/are your priority for improvement? Priority for the improvement could be given to cadmium and PCDD/Fs which are characterized by essential uncertainties in emissions and the largest disagreement between modeling results and measurements. Particularly, the discrepancies (under-prediction) for cadmium are about a factor of 2 and for PCDD/Fs about a factor of 5 on the average. A number of studies performed recently for these two pollutants have noted the uncertainties and incompleteness of available emission inventories for these two pollutants. In particular, analysis of anthropogenic HM emissions in Europe, carried out in the framework of the EU ESPREME project [Pacyna et al., 2007], indicated that officially submitted cadmium emissions were significantly lower (by more than a factor of 2) comparing to expert estimates made under the project. It was noted that official data on cadmium released from fuel combustion in various industrial, residential, and commercial units could be underestimated by more than a factor of 3. Model assessment of cadmium pollution in Europe performed on the basis of the expert estimates of the project showed satisfactory agreement with measurements. The under-prediction of observed cadmium pollution levels, obtained in most of modeling studies, was also pointed out in the UNEP review on cadmium [UNEP, 2010]. The review indicated that the most likely reason of this under-prediction could be the underestimation of anthropogenic cadmium emissions and uncertainties in data on natural releases and re-emission of former cadmium deposition which required further improvement. As to PCDD/Fs, it was noted in the review of Breivik et al. [2004], that a number of recently made mass balance studies for PCDD/Fs indicated incompleteness and missing of significant sources in the available emission inventories. The incompleteness of PCDD/F emissions reported officially can be connected with the underestimation of releases from diffuse and unregulated sources such as open burning of biomass or waste [Fiedler, 2007; Mareckova et al., 2012]. According to the data of global PCDD/F inventory of the UNEP Stockholm Convention (SC) (more than 60 national inventories) the open burning is one of the most significant sources of PCDD/F pollution. In particular, in almost 25% of countries open burning contributed more than 80% of national total PCDD/F emissions [Solorzano-Ochoa et al., 2012]. This type of information is very limited in officially reported emission data in the EMEP countries. Along with anthropogenic emissions to the atmosphere the PCDD/F pollution levels are also affected by the secondary emission sources which are formed by the atmospheric deposition and direct emissions to land and surface waters. Direct releases of PCDD/Fs to land, water, and residues are taken into account in the national emission inventories within the UNEP SC. At the same time, the

58
methodology on the inventory of POP emissions applied in the CLRTAP is oriented on the atmospheric emissions. Thus, the collaboration with the UNEP SC can be important for further improvement of the assessment of PCDD/F emissions. 2. For HMs and POPs, is the current issue poor geographical coverage? Lack of completeness of the national inventories currently being submitted? Or lack of consistency between Parties? The completeness and consistency of national inventories of HMs and POPs are still the issues and require further improvement. Complete time series of annual total emissions are reported by only 55% of the countries for HMs and 43% for POPs. The most complete datasets of emissions are currently available for the countries of the Northern and Western parts of Europe, while for the rest EMEP countries the information on emissions is much more incomplete. In particular, 9 countries for HMs and 8 countries for POPs (most of them are the EECCA countries) do not yet report any data on their national emissions. [Mareckova et al., 2013]. In this respect it is important to mention the proposal of Belarus made at the recent session of the Executive Body for the Convention (December, 2013) to set up a project “Proposal on providing technical assistance to the EECCA countries on methodological and practical issues in preparing emission inventories of POPs, HMs, and TSP”. The session recognized significance of supporting of this Belarusian capacity-building activity and technical assistance in the EECCA countries. Besides in the EMEP Status report on emissions [Mareckova et al., 2013], it was noted that recalculations of their emissions were made by 28 of 40 countries (Annex B). It should be mentioned also that the information on the range of uncertainty of reported emission data estimates (max-min) is essential for model assessment of pollution. However, at present only 8 countries provide the information on uncertainties of their national emissions in the informative inventory reports. 3. Have we solved the issue with metal emissions? If not, what needs to be done next? Though the quality of officially reported data on emissions of heavy metals is slowly improving, they are still subject of deficiencies listed above. Along with these issues particular attention should be given also to the refinement of information on emission temporal variations, speciation of mercury forms and congener compositions for POPs, vertical distribution of emissions, time series of gridded annual emissions, contribution of wind re-suspension and etc. Wind re-suspension significantly contributes to heavy metal pollution in the EMEP region. Parameterization of re-suspension process is included in the model assessment of heavy metal pollution levels in the EMEP domain. It is likely that estimates of wind re-suspension currently used in the model are characterized by considerable uncertainties and partly compensate possible underestimation of the anthropogenic emissions. Therefore, further refinement of dust suspension parameterization and information on concentrations of HMs in soils, road dust etc. is needed. Inverse modeling approach can be useful for evaluation and improving quality of emission data. The approach allows identifying regions where emissions may need special examination. MSC-E started to use inverse modelling for refinement of re-suspension from the urban territories [EMEP/MSC-E Technical Report 1/2014]. Similar approach may be also implemented for analysis of the anthropogenic emissions.
59
4. Can you give us a couple of paragraphs on how you make “expert estimates” to fill the gaps in the reported POPs/HM emissions data? Filling of the gaps in the officially reported time series of HM and POP emissions is performed on the basis of available emission inventories made by various experts and estimates of emissions carried out by MSC-E. To fill in the gaps of the officially reported data (time series, spatial distribution, and distribution by sectors) MSC-E uses emission expert estimates worked out by TNO [Denier van der Gon et al., 2005]. For some of the EECCA countries there is no emission data in the TNO inventory. In these cases emissions are derived from available global inventories or estimated from the emissions of other EMEP countries using relationship between emissions and gross domestic products. Details can be found in the EMEP Status Report 2/2013 and EMEP Status Report 3/2013. Additionally, expert estimates are essentially important in the preparation of emissions for the non-EMEP countries within the EMEP domain. For this purpose available global emission inventories are used (e.g. for Pb, Hg, and PCBs). These data are also applied for the evaluation of contributions of intercontinental transport and secondary emission sources (re-volatilization to the atmosphere) to the EMEP pollution levels. For the evaluation of HCB pollution historic HCB emission scenarios were prepared using available information on the application of HCB in various activities (e.g. agriculture, industry). Elaborated scenarios covered the period starting from 1940s and included low, average and high estimates of emissions. Gridded data were based on the distribution of cropland area for the emissions from agricultural use and on population density for other sources of HCB emissions [EMEP Status Report 3/2012, Section 1.2.4]. For PCBs a global emission inventory for the period from 1930 to 2010 [Breivik et al., 2007] is applied for evaluation of the effects of historical emissions and intercontinental transport on the pollution in the EMEP countries. There is ongoing work at the MSC-E on the development of scenarios for the PCDD/F emissions to the atmosphere and other media based on the inventories of the EU project “Releases of Dioxins and Furans to Land and Water in Europe” [Wenborn et al., 1999; EMEP/MSC-E Technical report 1/2013, Section 1.2] and data of the UNEP SC PCDD/F emission inventory [Cao et al., 2013]. Compilation of global PCDD/F emissions, using the UNEP Standardized Dioxins Toolkit [UNEP, 2013] is under preparation within the SC now. A certain progress in the elaboration of global emission inventories is achieved for Hg. Particularly, during the preparation of the Minamata Convention the new global inventory of mercury emission was developed for the year 2010 by UNEP and AMAP [AMAP/UNEP, 2013]. These data have been applied for the recent model assessment of pollution levels of Hg for the EMEP region and on the global scale. Thus, collaboration with the UNEP Minamata and Stockholm Conventions as well as with AMAP is of importance and of mutual interest. 5. Do countries then submit these data in subsequent years? Expert estimates used for the model assessment of pollution levels are available on the MSC-E website [EMEP/MSC-E Technical report 1/2013, EMEP Status Report 3/2013, EMEP Status Report 2/2012, EMEP Status Report 3/2012, EMEP/MSC-E Technical Report 6/2005]. It would be good to address this question to the countries to start dialogue on this issue.

60
6. Do you just use data at an annual resolution? If no, can you provide us with a brief description of how you generate the fine timescale emissions? At present we consider intra-annual variations of emissions for PAHs and PCDDF/s, while for lead, cadmium, mercury, HCB, and PCBs annual resolution of emissions is applied for modeling of pollution levels. Temporal distribution of PAH emissions is made for several aggregated emission source groups. Particularly, fine timescale PAH emissions from residential heating source category are generated using the approach based on the assumption of the dependence of heating power supply on ambient temperature [Aulinger et al., 2010]. Monthly, weekly, and diurnal variations of PAH emissions from road transport and industrial processes source categories are constructed in accordance to the emission temporal profiles used in LOTOS/EUROS model [Schaap et al., 2005]. For other source categories annual emissions are used. Simplified description of seasonal changes of PCDD/F emissions is constructed on the basis of available measurements of air concentrations and variations of emissions of pollutants emitted by similar groups of sources, namely, PAHs [EMEP Status Report 3/2012, Section 1.2.2]. Concluding comments on further improvement of HM and POP emission data
1. The major issues with regard to the quality of officially reported emission data for the assessment of HM and POP pollution are connected with the completeness and consistency of inventories in line with the Emission Reporting Guidelines with special attention to the EECCA countries. Cd and PCDD/Fs are pollutants of a first priority.
2. Information on the range of uncertainty of reported emission data is needed to prepare
scenarios of emissions for the evaluation of possible maximum and minimum levels of pollution of the EMEP domain.
3. Generating and updating of emission expert estimates, applied for the preparation of HM and
POP emission data for modeling, is highly appreciated. (see Table A.1).
4. Collaboration with the UNEP Minamata and Stockholm Conventions as well as with AMAP is of mutual importance for further work on the evaluation of non-EMEP emission sources affecting pollution of the EMEP domain.