BIOCHEMICAL AND THERAPEUTIC STUDIES ON POSTPARTUM INDIGESTION (PPI) IN BUFFALOES
32
BIOCHEMICAL AND THERAPEUTIC STUDIES ON BIOCHEMICAL AND THERAPEUTIC STUDIES ON POSTPARTUM INDIGESTION (PPI) POSTPARTUM INDIGESTION (PPI) IN BUFFALOES IN BUFFALOES Dr. K. Padmaja Dr. K. Padmaja Associate Professor & Head Dept of Veterinary Medicine, College of Veterinary Science Rajendranagar, Hyderabad.
-
Upload
robert-contreras -
Category
Documents
-
view
37 -
download
0
description
BIOCHEMICAL AND THERAPEUTIC STUDIES ON POSTPARTUM INDIGESTION (PPI) IN BUFFALOES. Dr. K. Padmaja Associate Professor & Head Dept of Veterinary Medicine, College of Veterinary Science Rajendranagar , Hyderabad. INTRODUCTION. Buffalo Population (FAO, 2008): World 185.29 millions - PowerPoint PPT Presentation
Transcript of BIOCHEMICAL AND THERAPEUTIC STUDIES ON POSTPARTUM INDIGESTION (PPI) IN BUFFALOES
BIOCHEMICAL AND THERAPEUTIC STUDIES BIOCHEMICAL AND THERAPEUTIC STUDIES ON POSTPARTUM INDIGESTION (PPI) ON POSTPARTUM INDIGESTION (PPI)
IN BUFFALOESIN BUFFALOES
Dr. K. PadmajaDr. K. PadmajaAssociate Professor & HeadDept of Veterinary Medicine,College of Veterinary Science Rajendranagar, Hyderabad.
INTRODUCTIONINTRODUCTION
• Buffalo Population (FAO, 2008):
• World 185.29 millions
• India 105.10 millions (57%)
• Telangana4.19 millions (2012) (4%)
• Milk Production (GOI 2011-12):
• India: Total Milk 127.90 Mill Tons
Buffaloes 65.35 Mill Tons (51%)
INTRODUCTIONINTRODUCTION
• Objectives:
1. To study the incidence of PPI in buffaloes associated with hepatic insufficiency and production diseases.
2. To conduct a detailed clinical examination of cases of PPI (i.e., 0-2 months after calving).
3. To study the involvement of liver in PPI with the help of biochemical indices.
4. To study the association of PPI with subclinical forms of hypocalcaemia and ketosis.
5. To evolve suitable therapeutic and prophylactic measures for their prevention.
MATERIALS AND METHODSMATERIALS AND METHODS
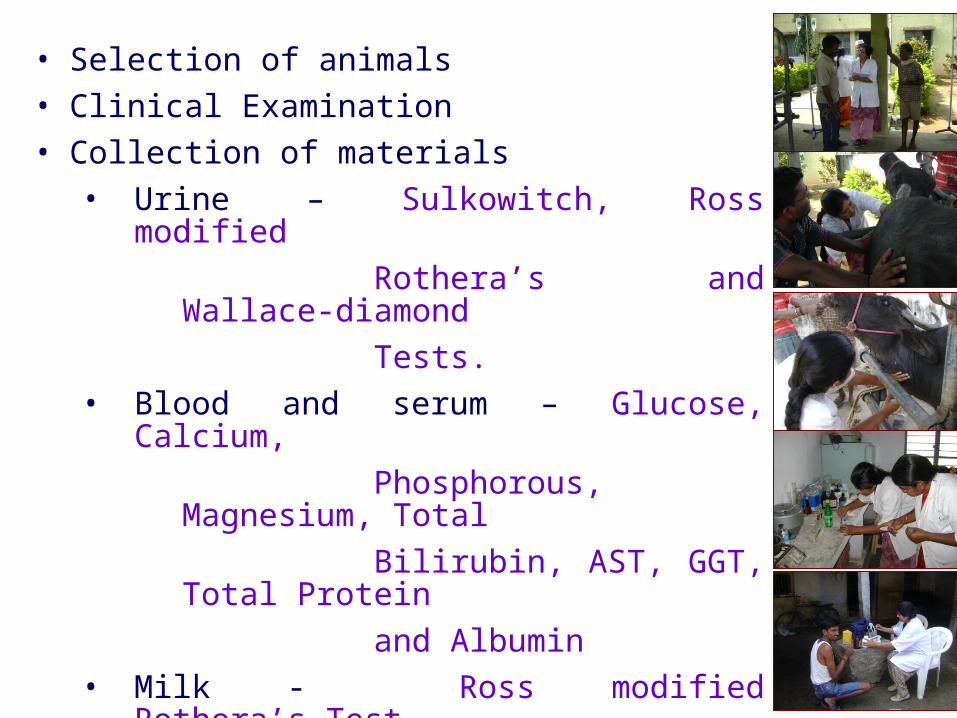
• Selection of animals• Clinical Examination• Collection of materials
• Urine – Sulkowitch, Ross modified
Rothera’s and Wallace-diamond
Tests.• Blood and serum – Glucose, Calcium,
Phosphorous, Magnesium, Total
Bilirubin, AST, GGT, Total Protein
and Albumin• Milk - Ross modified Rothera’s
Test• Rumen Liquor – pH, Colour, Odour,
Consistency and SAT; MBRT,
Microbial alterations.
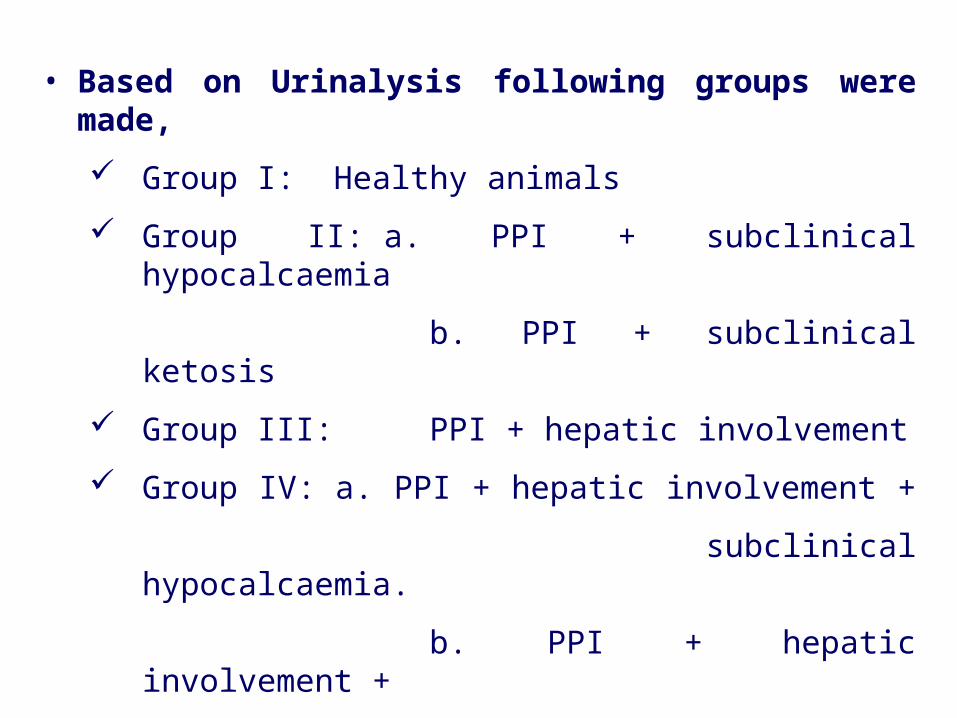
• Based on Urinalysis following groups were made,
Group I: Healthy animals
Group II: a. PPI + subclinical hypocalcaemia
b. PPI + subclinical ketosis
Group III: PPI + hepatic involvement
Group IV: a. PPI + hepatic involvement +
subclinical hypocalcaemia.
b. PPI + hepatic involvement +
subclinical ketosis
Group V: PPI alone
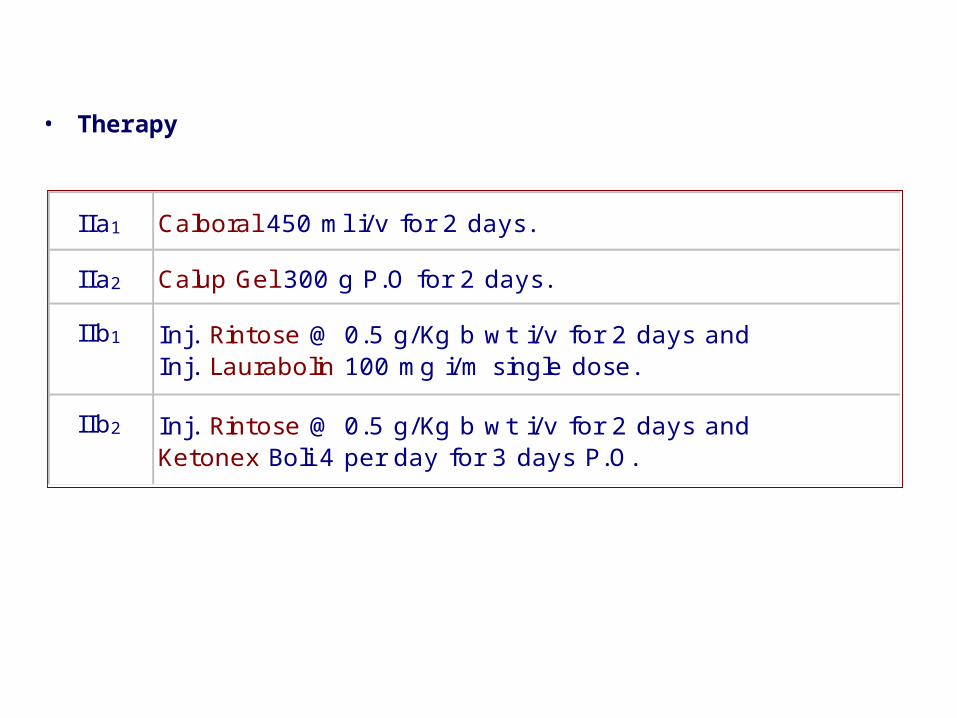
• Therapy
I Ia1 Calboral 450 ml i/v for 2 days.
IIa2 Calup Gel 300 g P.O for 2 days.
IIb1 Inj. Rintose @ 0.5 g/Kg b wt i/v for 2 days and Inj. Laurabolin 100 mg i/m single dose.
IIb2 Inj. Rintose @ 0.5 g/Kg b wt i/v for 2 days and Ketonex Boli 4 per day for 3 days P.O.
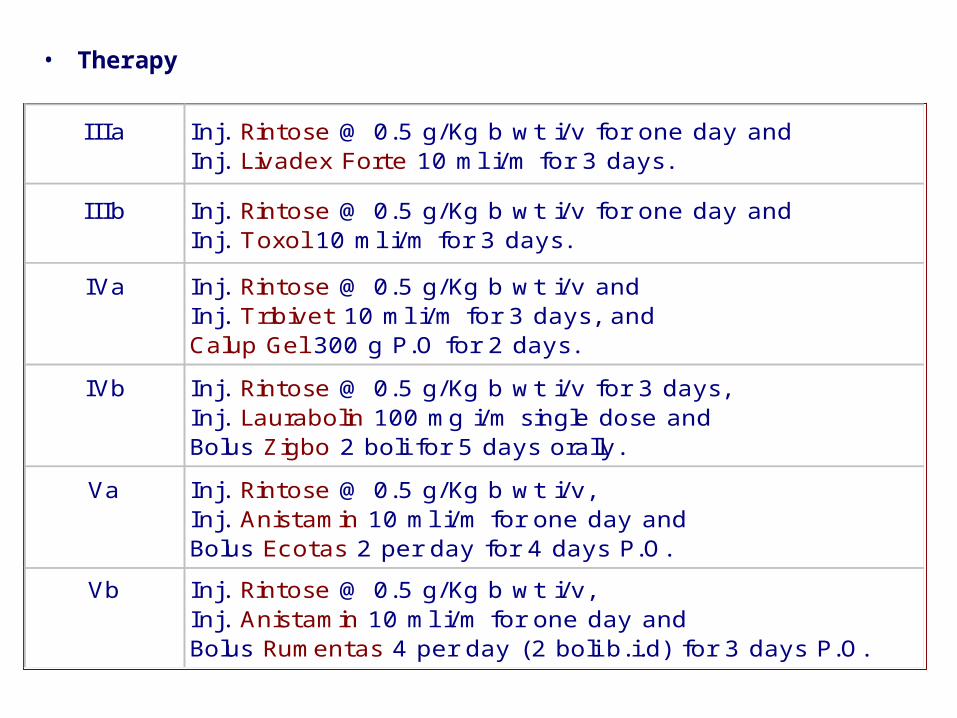
• Therapy
I I Ia Inj. Rintose @ 0.5 g/Kg b wt i/v for one day and Inj. Livadex Forte 10 ml i/m for 3 days.
IIIb Inj. Rintose @ 0.5 g/Kg b wt i/v for one day and Inj. Toxol 10 ml i/m for 3 days.
IVa Inj. Rintose @ 0.5 g/Kg b wt i/v and Inj. Tribivet 10 ml i/m for 3 days, and Calup Gel 300 g P.O for 2 days.
IVb Inj. Rintose @ 0.5 g/Kg b wt i/v for 3 days, Inj. Laurabolin 100 mg i/m single dose and Bolus Zigbo 2 boli for 5 days orally.
Va Inj. Rintose @ 0.5 g/Kg b wt i/v, Inj. Anistamin 10 ml i/m for one day and Bolus Ecotas 2 per day for 4 days P.O.
Vb Inj. Rintose @ 0.5 g/Kg b wt i/v, Inj. Anistamin 10 ml i/m for one day and Bolus Rumentas 4 per day (2 boli b.i.d) for 3 days P.O.

RESULTS & DISCUSSIONRESULTS & DISCUSSION
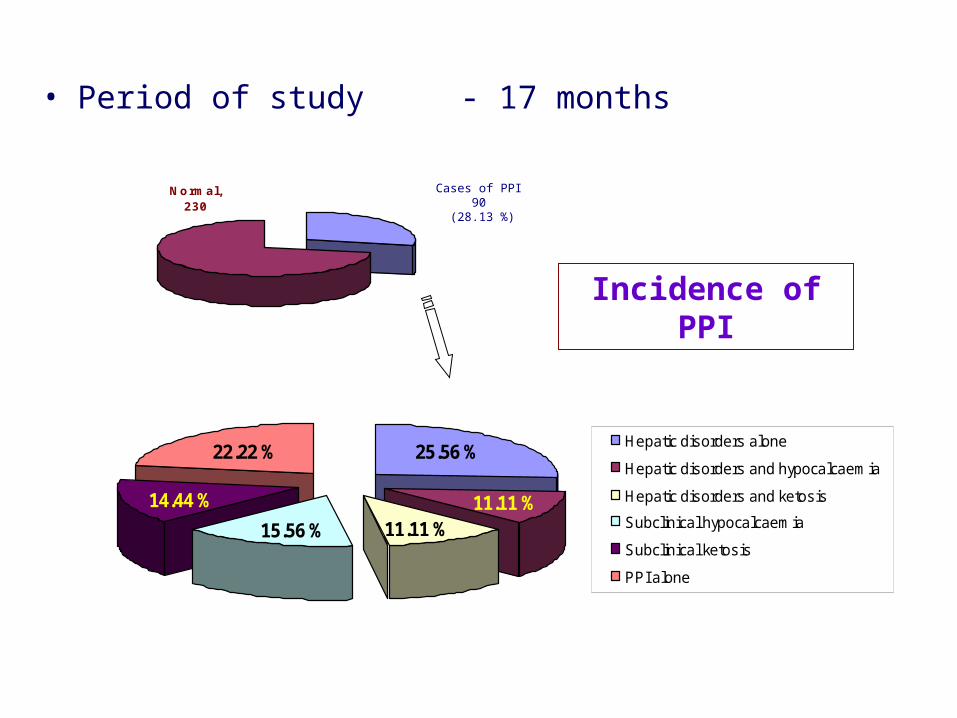
• Period of study - 17 months
Normal, 230
Cases of PPI90
(28.13 %)
11.11 %11.11 %15.56 %
14.44 %
25.56 %22.22 %Hepatic disorders alone
Hepatic disorders and hypocalcaemia
Hepatic disorders and ketosis
Subclinical hypocalcaemia
Subclinical ketosis
PPI alone
Incidence of PPI
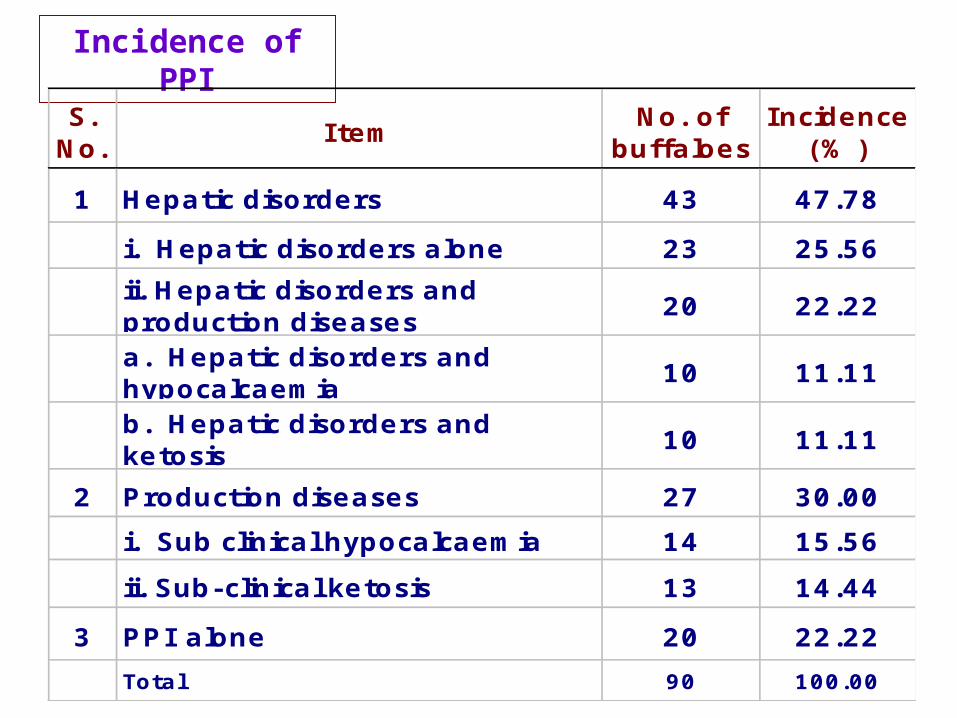
Incidence of PPI
S. No.
ItemNo. of
buffaloesIncidence
(% )
1 Hepatic disorders 43 47.78
i. Hepatic disorders alone 23 25.56
ii. Hepatic disorders and production diseases
20 22.22
a. Hepatic disorders and hypocalcaemia
10 11.11
b. Hepatic disorders and ketosis
10 11.11
2 Production diseases 27 30.00
i. Sub clinical hypocalcaemia 14 15.56
ii. Sub-clinical ketosis 13 14.44
3 PPI alone 20 22.22
Total 90 100.00
• CLINICAL SIGNS
Decreased appetite
Reduction in milk yield.
Termperature, Pulse and Respirations were normal.
Decreased Ruminal motility.
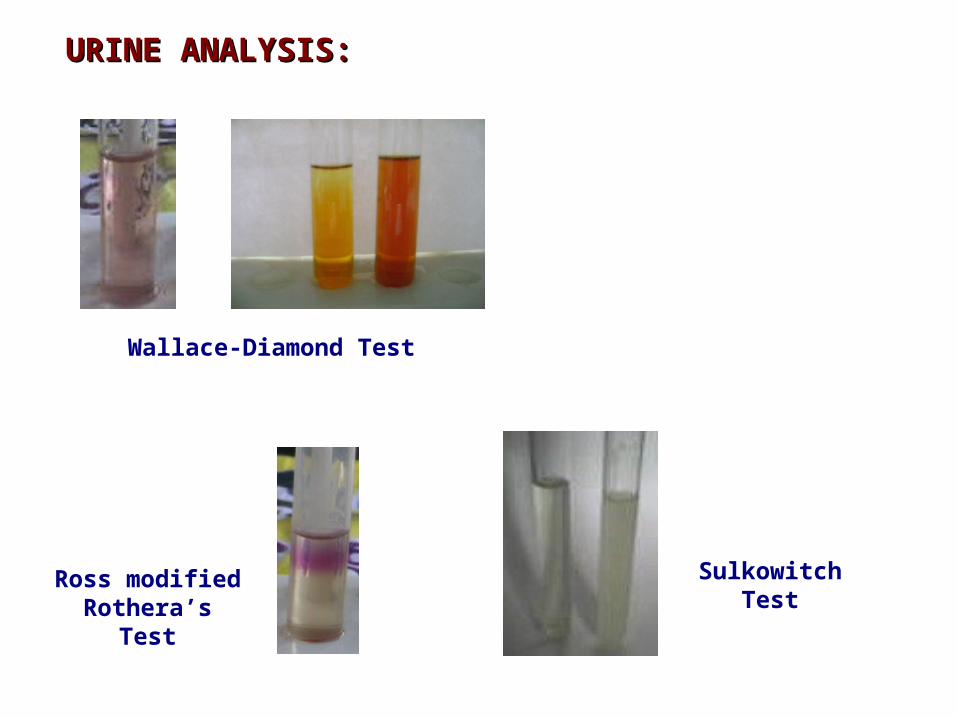
URINE ANALYSIS:URINE ANALYSIS:
Wallace-Diamond Test
Ross modified Rothera’s
Test
Sulkowitch Test
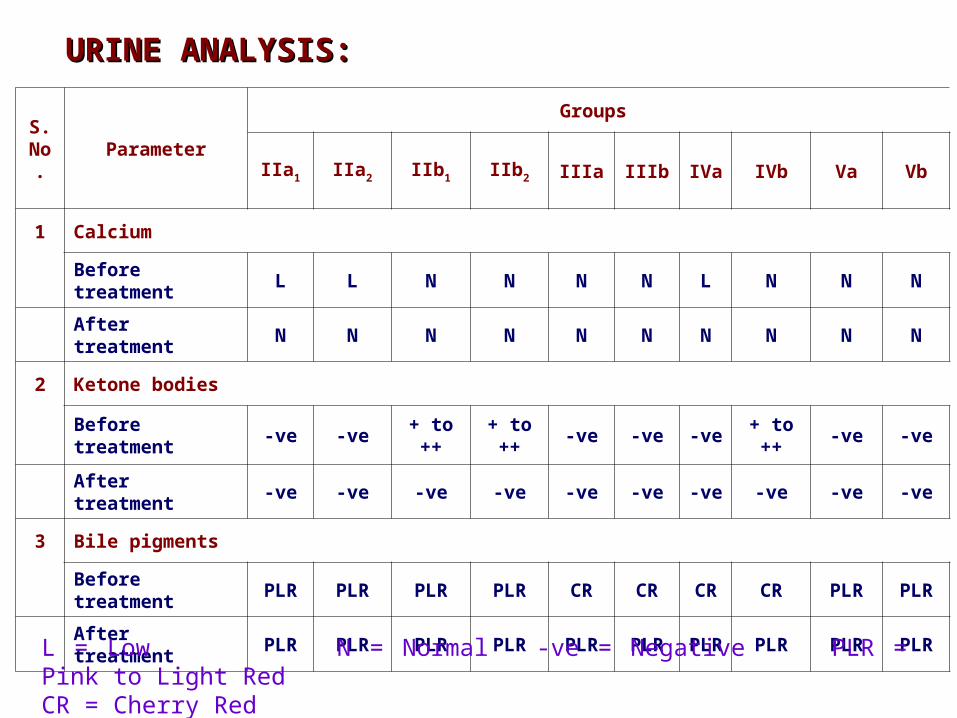
S. No.
Parameter
Groups
IIa1 IIa2 IIb1 IIb2 IIIa IIIbIVa
IVb Va Vb
1 Calcium
Before treatment
L L N N N N L N N N
After treatment
N N N N N N N N N N
2 Ketone bodies
Before treatment
-ve -ve+ to ++
+ to ++
-ve -ve -ve+ to ++
-ve -ve
After treatment
-ve -ve -ve -ve -ve -ve -ve -ve -ve -ve
3 Bile pigments
Before treatment
PLR PLR PLR PLR CR CR CR CR PLR PLR
After treatment
PLR PLR PLR PLR PLR PLRPLR
PLR PLR PLR
L = Low N = Normal -ve = Negative PLR = Pink to Light RedCR = Cherry Red
URINE ANALYSIS:URINE ANALYSIS:
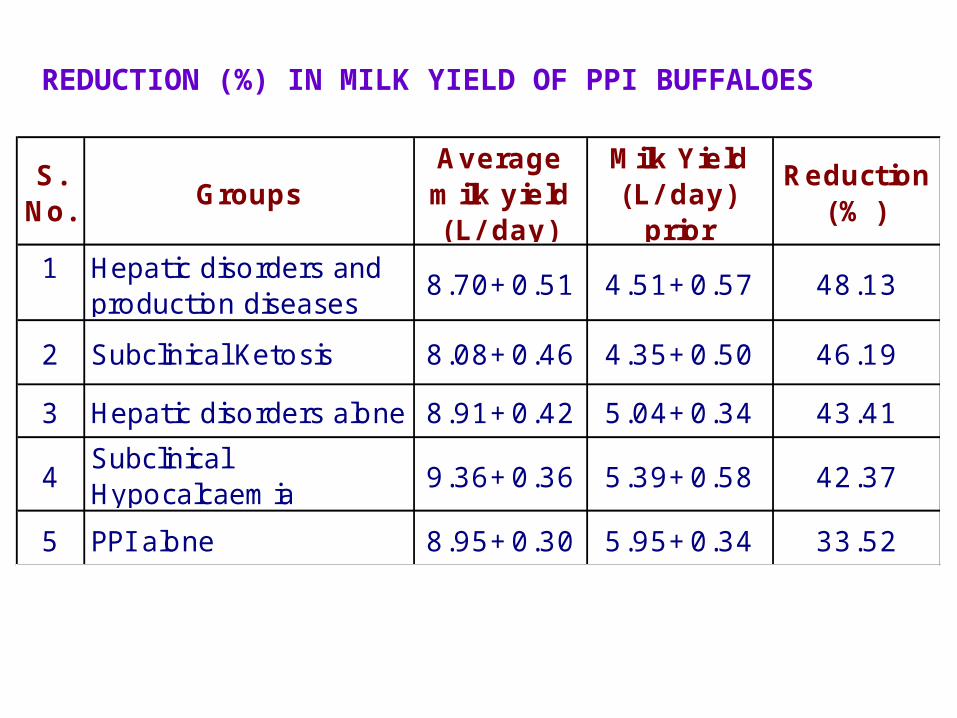
S. No.
GroupsAverage milk yield (L/ day)
Milk Yield (L/ day)
prior
Reduction (% )
1 Hepatic disorders and production diseases
8.70+0.51 4.51+0.57 48.13
2 Subclinical Ketosis 8.08+0.46 4.35+0.50 46.19
3 Hepatic disorders alone 8.91+0.42 5.04+0.34 43.41
4Subclinical Hypocalcaemia
9.36+0.36 5.39+0.58 42.37
5 PPI alone 8.95+0.30 5.95+0.34 33.52
REDUCTION (%) IN MILK YIELD OF PPI BUFFALOES
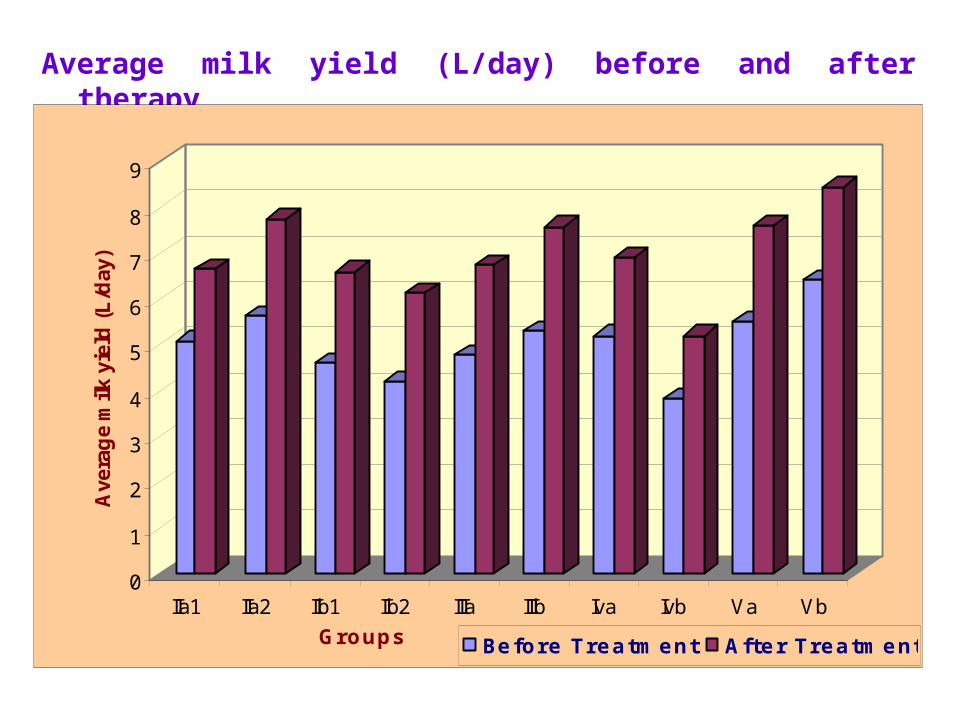
Average milk yield (L/day) before and after therapy
0
1
2
3
4
5
6
7
8
9
Ave
rag
e m
ilk y
ield
(L
/day
)
IIa1 IIa2 IIb1 IIb2 IIIa IIIb Iva Ivb Va Vb
Groups Before Treatment After Treatment
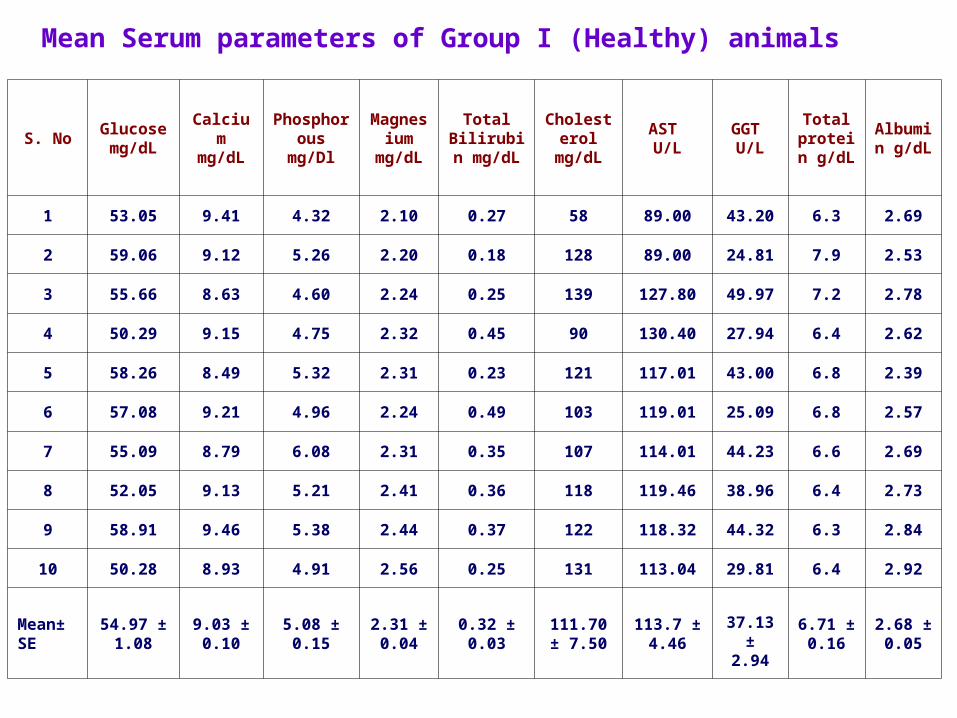
Mean Serum parameters of Group I (Healthy) animals
S. NoGlucose mg/dL
Calcium
mg/dL
Phosphorous mg/Dl
Magnesium
mg/dL
Total Bilirubin mg/dL
Cholesterol
mg/dL
AST U/L
GGT U/L
Total protein g/dL
Albumin
g/dL
1 53.05 9.41 4.32 2.10 0.27 58 89.00 43.20 6.3 2.69
2 59.06 9.12 5.26 2.20 0.18 128 89.00 24.81 7.9 2.53
3 55.66 8.63 4.60 2.24 0.25 139 127.80 49.97 7.2 2.78
4 50.29 9.15 4.75 2.32 0.45 90 130.40 27.94 6.4 2.62
5 58.26 8.49 5.32 2.31 0.23 121 117.01 43.00 6.8 2.39
6 57.08 9.21 4.96 2.24 0.49 103 119.01 25.09 6.8 2.57
7 55.09 8.79 6.08 2.31 0.35 107 114.01 44.23 6.6 2.69
8 52.05 9.13 5.21 2.41 0.36 118 119.46 38.96 6.4 2.73
9 58.91 9.46 5.38 2.44 0.37 122 118.32 44.32 6.3 2.84
10 50.28 8.93 4.91 2.56 0.25 131 113.04 29.81 6.4 2.92
Mean± SE
54.97 ± 1.08
9.03 ± 0.10
5.08 ± 0.15
2.31 ± 0.04
0.32 ± 0.03
111.70 ± 7.50
113.7 ± 4.46
37.13 ±
2.94
6.71 ±
0.16
2.68 ±
0.05
0
10
20
30
40
50
60
70
Glu
cose
leve
ls (
mg
/dL
)
Groups
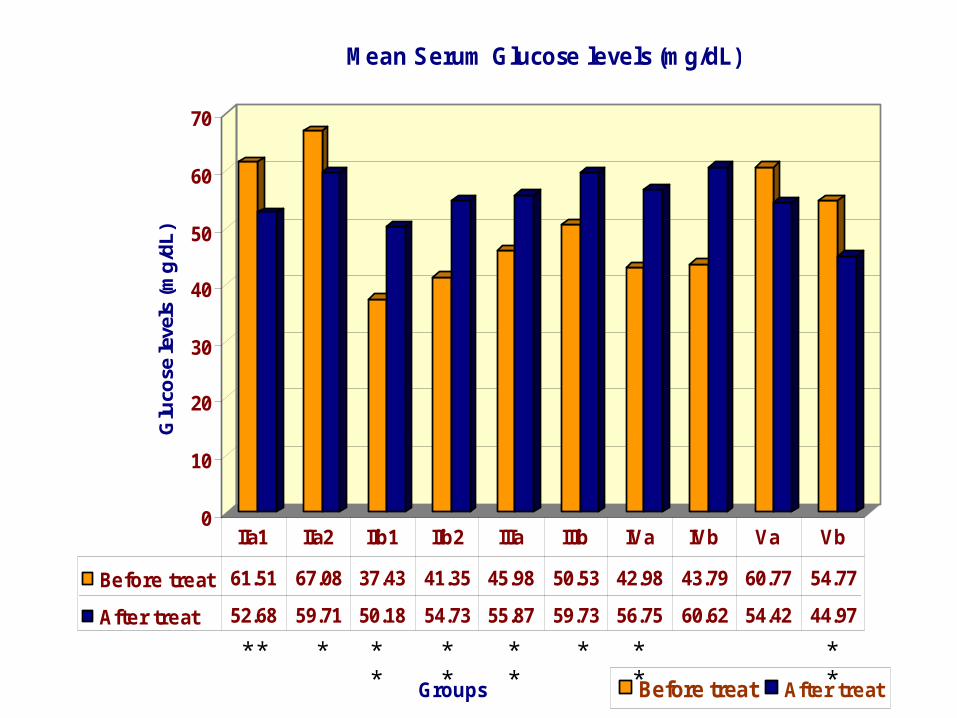
Mean Serum Glucose levels (mg/dL)
Before treat After treat
Before treat 61.51 67.08 37.43 41.35 45.98 50.53 42.98 43.79 60.77 54.77
After treat 52.68 59.71 50.18 54.73 55.87 59.73 56.75 60.62 54.42 44.97
IIa1 IIa2 IIb1 IIb2 IIIa IIIb IVa IVb Va Vb
* **** * **** ** **
0
1
2
3
4
5
6
7
8
9
10
Cal
ciu
m le
vels
(m
g/d
L)
Groups
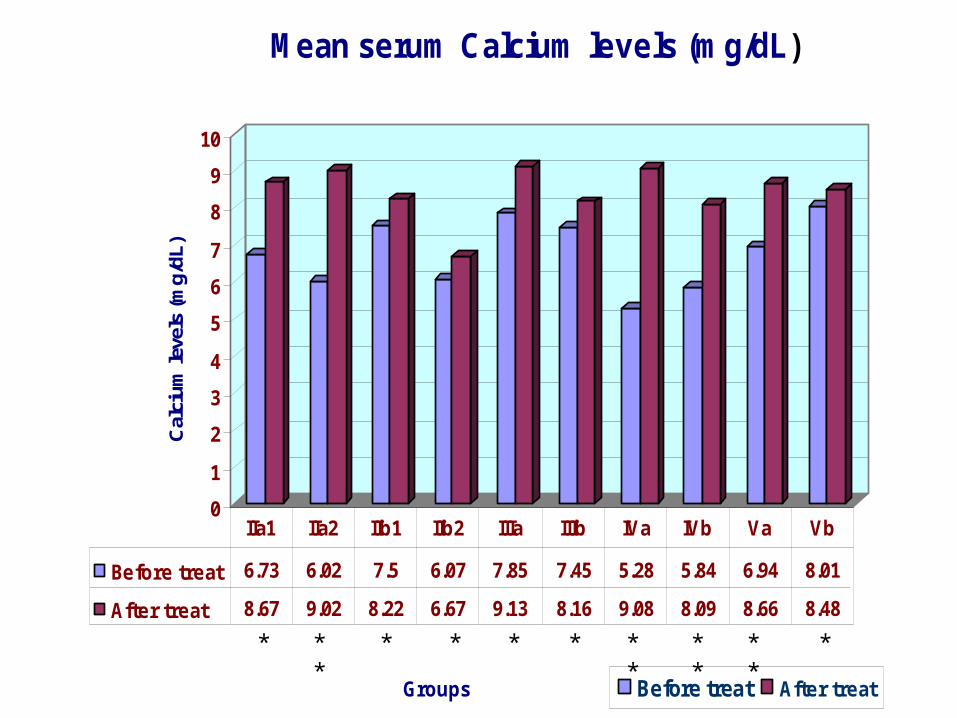
Mean serum Calcium levels (mg/dL)
Before treat After treat
Before treat 6.73 6.02 7.5 6.07 7.85 7.45 5.28 5.84 6.94 8.01
After treat 8.67 9.02 8.22 6.67 9.13 8.16 9.08 8.09 8.66 8.48
IIa1 IIa2 IIb1 IIb2 IIIa IIIb IVa IVb Va Vb
** ** * ** **** ** *
0.00
1.00
2.00
3.00
4.00
5.00
6.00P
hosp
horo
us le
vels
(mg/
dL)
Groups
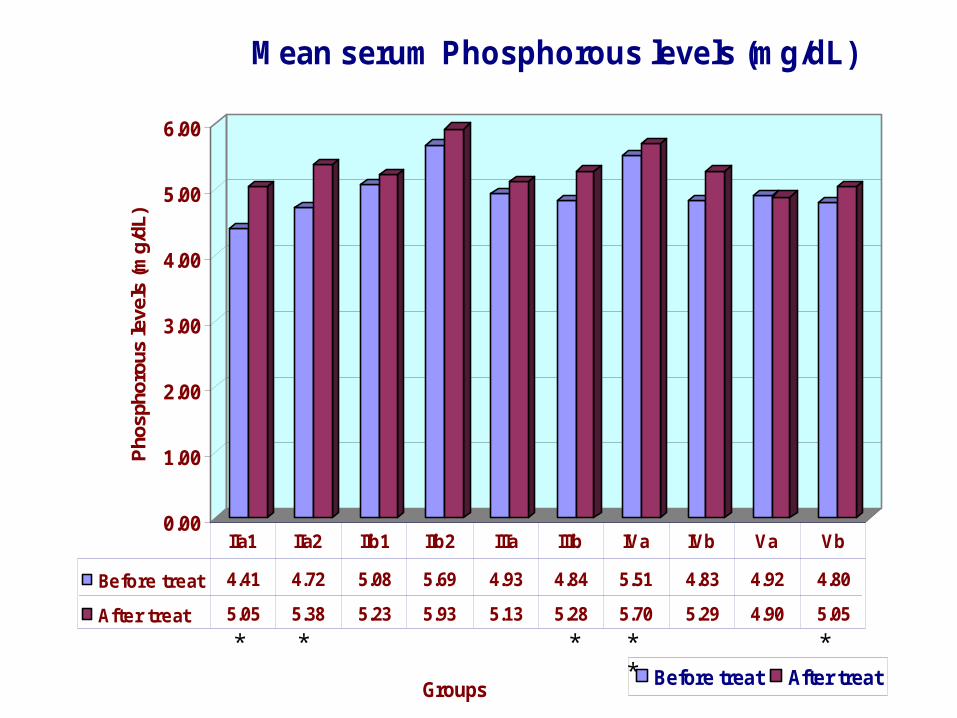
Mean serum Phosphorous levels (mg/dL)
Before treat After treat
Before treat 4.41 4.72 5.08 5.69 4.93 4.84 5.51 4.83 4.92 4.80
After treat 5.05 5.38 5.23 5.93 5.13 5.28 5.70 5.29 4.90 5.05
IIa1 IIa2 IIb1 IIb2 IIIa IIIb IVa IVb Va Vb
** * ** *
0.00
0.50
1.00
1.50
2.00
2.50
3.00
3.50
4.00M
agne
sium
leve
ls (m
g/dL
)
Groups
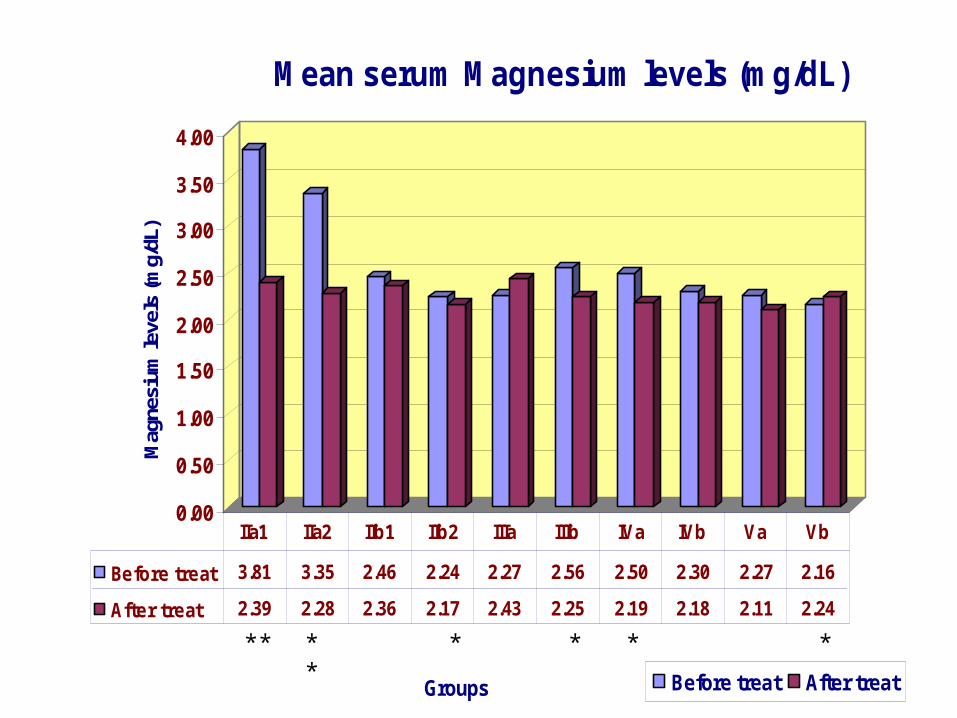
Mean serum Magnesium levels (mg/dL)
Before treat After treat
Before treat 3.81 3.35 2.46 2.24 2.27 2.56 2.50 2.30 2.27 2.16
After treat 2.39 2.28 2.36 2.17 2.43 2.25 2.19 2.18 2.11 2.24
IIa1 IIa2 IIb1 IIb2 IIIa IIIb IVa IVb Va Vb
**** * ** *

0.00
0.10
0.20
0.30
0.40
0.50
0.60To
tal b
iliru
bin
leve
ls (m
g/dL
)
Groups
Mean serum Total bilirubin levels (mg/dL)
Before treat After treat
Before treat 0.39 0.34 0.50 0.37 0.49 0.50 0.47 0.55 0.23 0.18
After treat 0.32 0.27 0.22 0.18 0.43 0.32 0.33 0.29 0.22 0.15
IIa1 IIa2 IIb1 IIb2 IIIa IIIb IVa IVb Va Vb
** ****
0.00
20.00
40.00
60.00
80.00
100.00
120.00
140.00
160.00C
hole
ster
ol le
vels
(mg/
dL)
Groups
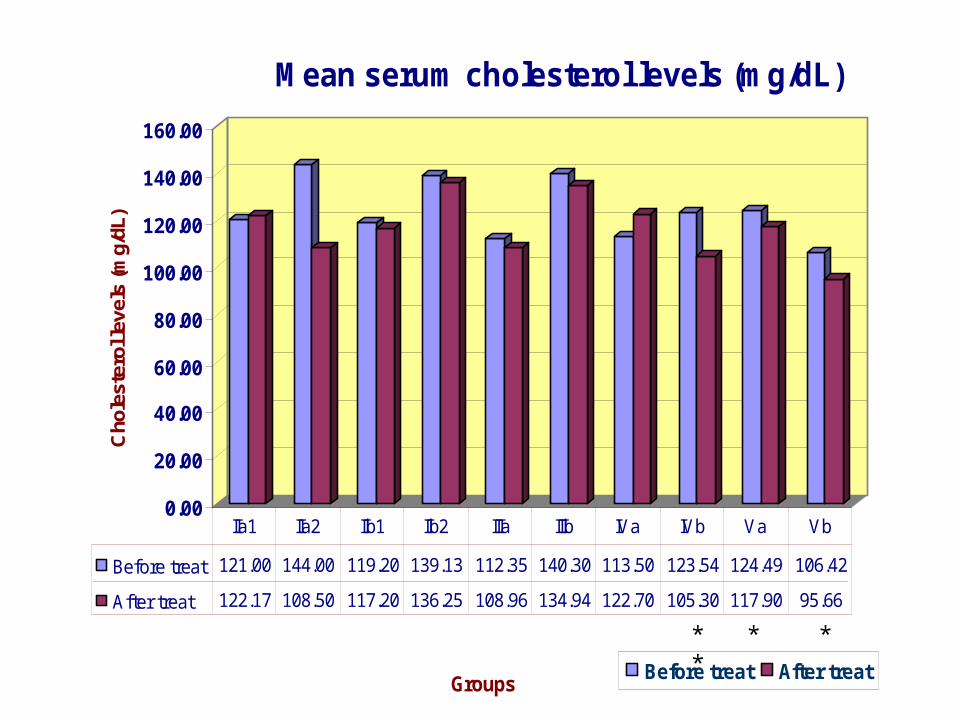
Mean serum cholesterol levels (mg/dL)
Before treat After treat
Before treat 121.00 144.00 119.20 139.13 112.35 140.30 113.50 123.54 124.49 106.42
After treat 122.17 108.50 117.20 136.25 108.96 134.94 122.70 105.30 117.90 95.66
IIa1 IIa2 IIb1 IIb2 IIIa IIIb IVa IVb Va Vb
** * *
0.00
20.00
40.00
60.00
80.00
100.00
120.00
140.00
160.00
180.00
200.00A
ST
leve
ls (U
/L)
Groups
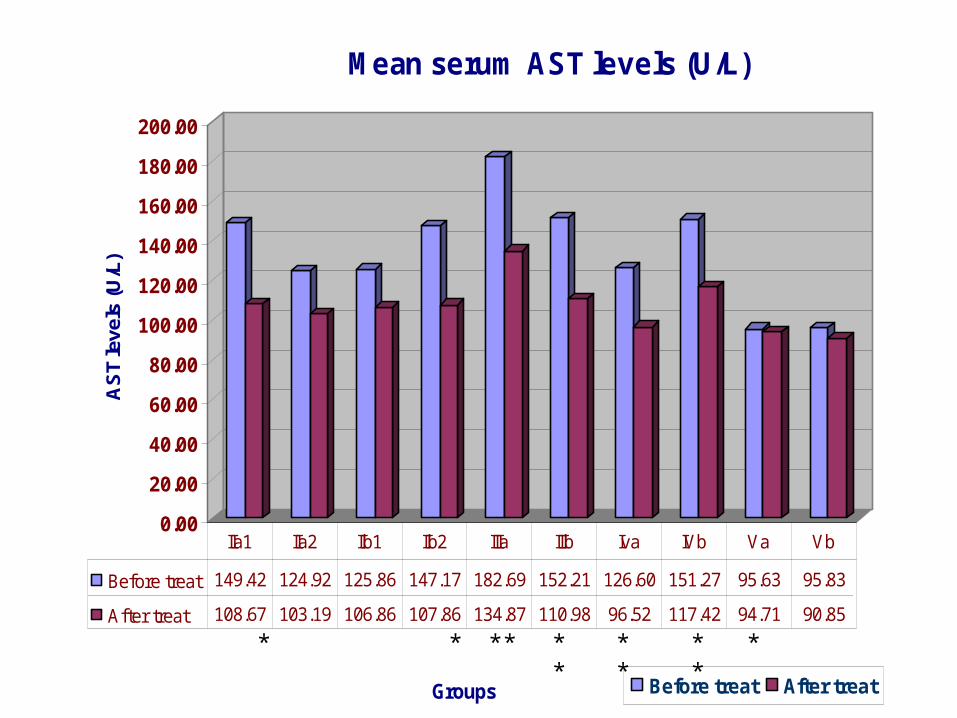
Mean serum AST levels (U/L)
Before treat After treat
Before treat 149.42 124.92 125.86 147.17 182.69 152.21 126.60 151.27 95.63 95.83
After treat 108.67 103.19 106.86 107.86 134.87 110.98 96.52 117.42 94.71 90.85
IIa1 IIa2 IIb1 IIb2 IIIa IIIb Iva IVb Va Vb
* ** ** ***** *
0.00
10.00
20.00
30.00
40.00
50.00
60.00
70.00G
GT
leve
ls (U
/L)
Groups
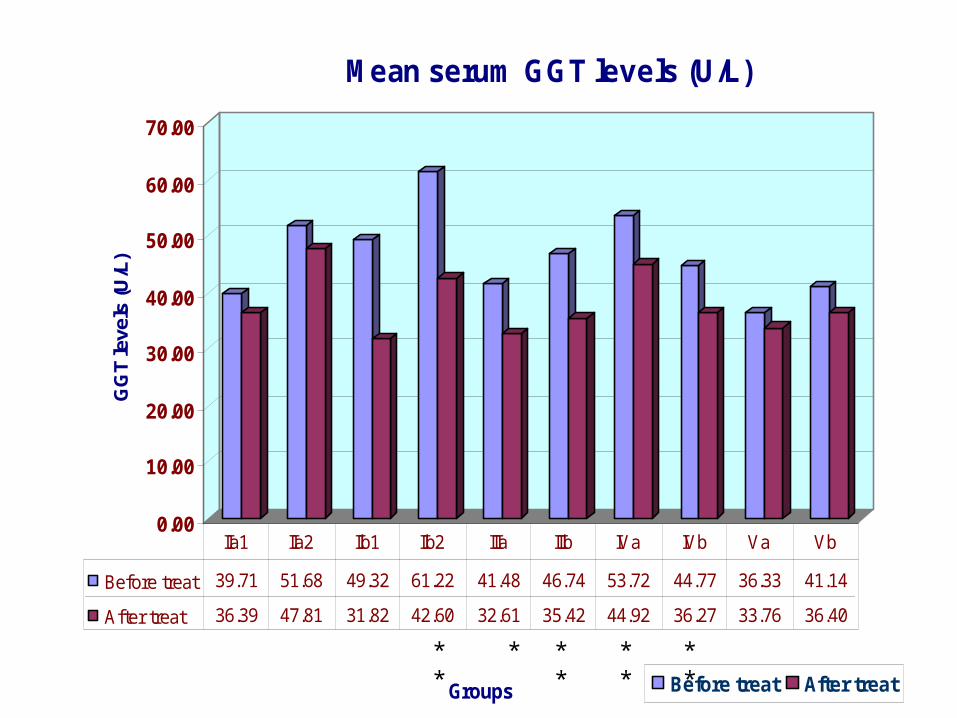
Mean serum GGT levels (U/L)
Before treat After treat
Before treat 39.71 51.68 49.32 61.22 41.48 46.74 53.72 44.77 36.33 41.14
After treat 36.39 47.81 31.82 42.60 32.61 35.42 44.92 36.27 33.76 36.40
IIa1 IIa2 IIb1 IIb2 IIIa IIIb IVa IVb Va Vb
** ***** **
0.00
1.00
2.00
3.00
4.00
5.00
6.00
7.00
8.00T
ota
l pro
tein
leve
ls (
g/d
L)
Groups
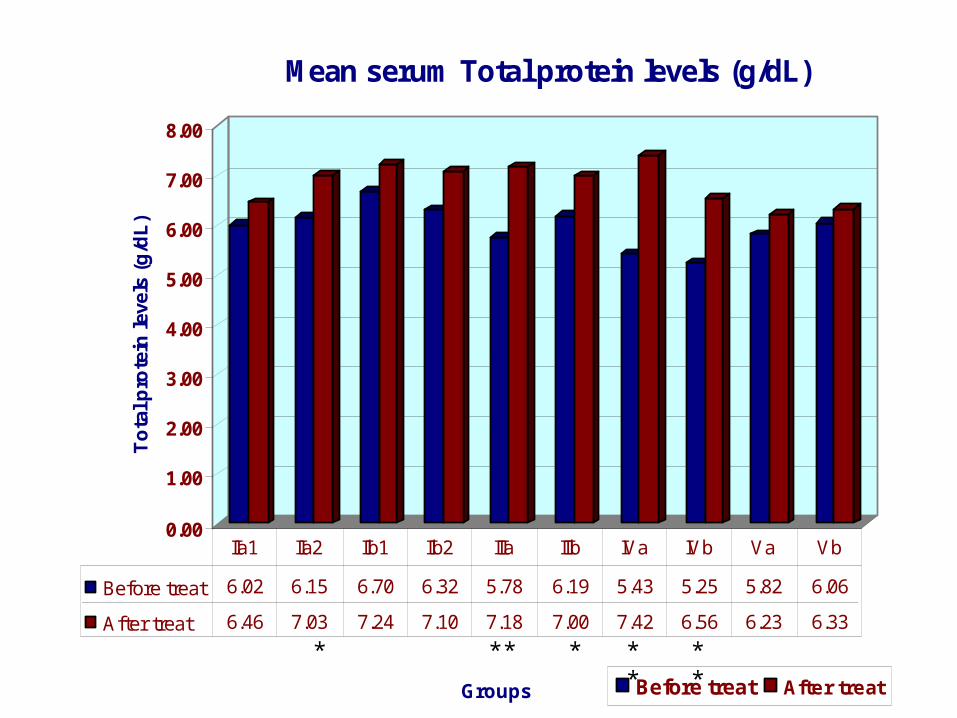
Mean serum Total protein levels (g/dL)
Before treat After treat
Before treat 6.02 6.15 6.70 6.32 5.78 6.19 5.43 5.25 5.82 6.06
After treat 6.46 7.03 7.24 7.10 7.18 7.00 7.42 6.56 6.23 6.33
IIa1 IIa2 IIb1 IIb2 IIIa IIIb IVa IVb Va Vb
* * ** ****
0.00
0.50
1.00
1.50
2.00
2.50
3.00A
lbum
in le
vels
(g/d
L)
Groups
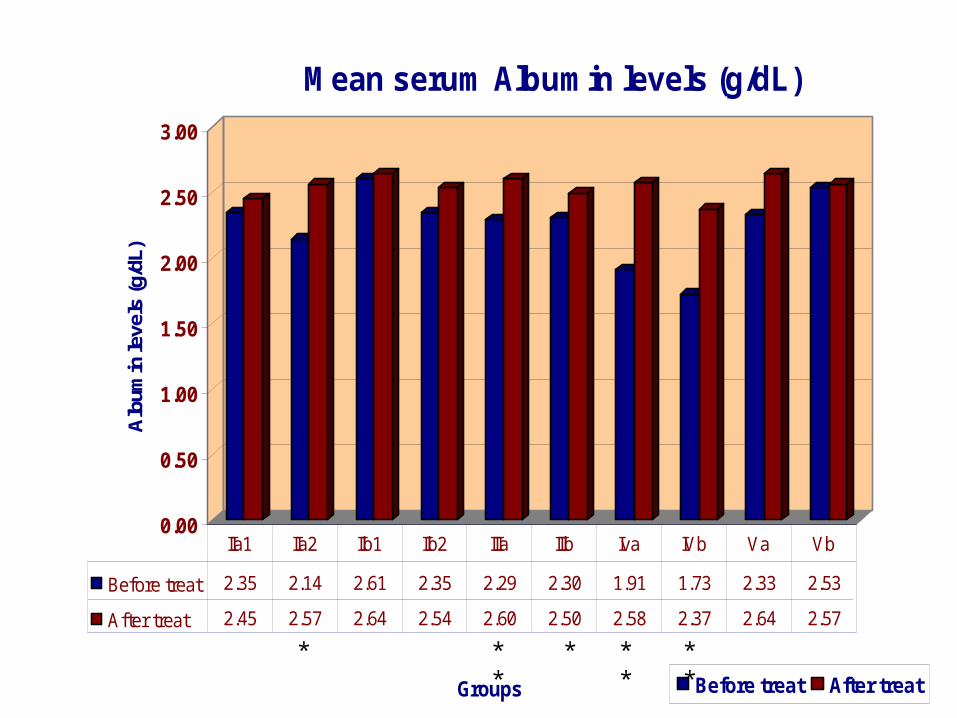
Mean serum Albumin levels (g/dL)
Before treat After treat
Before treat 2.35 2.14 2.61 2.35 2.29 2.30 1.91 1.73 2.33 2.53
After treat 2.45 2.57 2.64 2.54 2.60 2.50 2.58 2.37 2.64 2.57
IIa1 IIa2 IIb1 IIb2 IIIa IIIb Iva IVb Va Vb
* ** *****
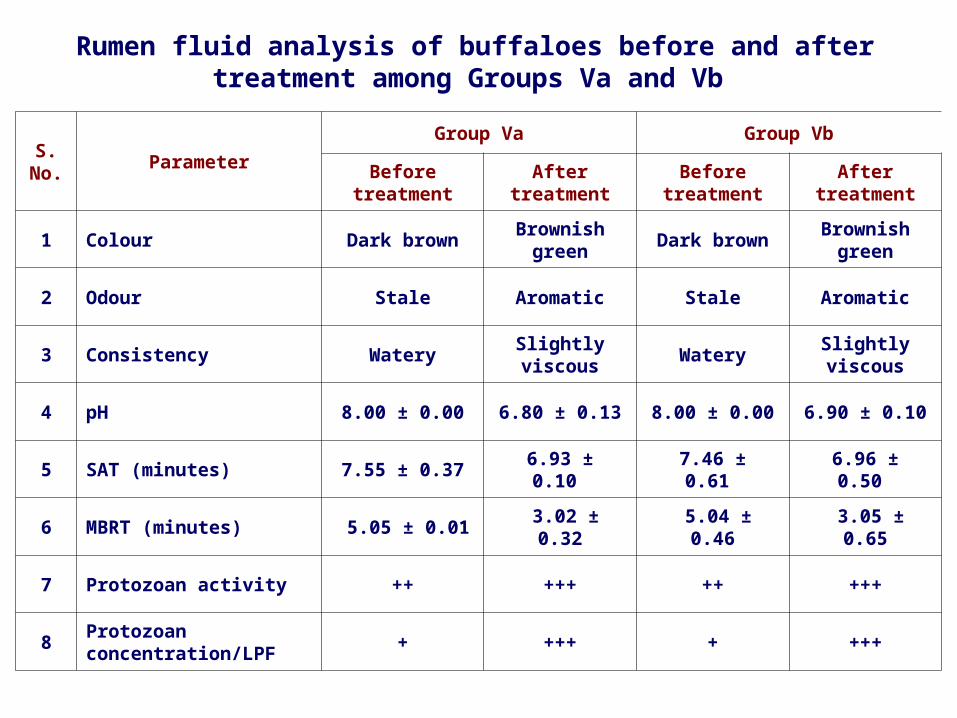
S. No.
Parameter
Group Va Group Vb
Before treatment
After treatment
Before treatment
After treatment
1 Colour Dark brownBrownish
greenDark brown
Brownish green
2 Odour Stale Aromatic Stale Aromatic
3 Consistency WaterySlightly viscous
WaterySlightly viscous
4 pH 8.00 ± 0.00 6.80 ± 0.13 8.00 ± 0.00 6.90 ± 0.10
5 SAT (minutes) 7.55 ± 0.37 6.93 ± 0.10 7.46 ± 0.61 6.96 ± 0.50
6 MBRT (minutes) 5.05 ± 0.01 3.02 ± 0.32 5.04 ± 0.46 3.05 ± 0.65
7 Protozoan activity ++ +++ ++ +++
8Protozoan concentration/LPF
+ +++ + +++
Rumen fluid analysis of buffaloes before and after treatment among Groups Va and Vb
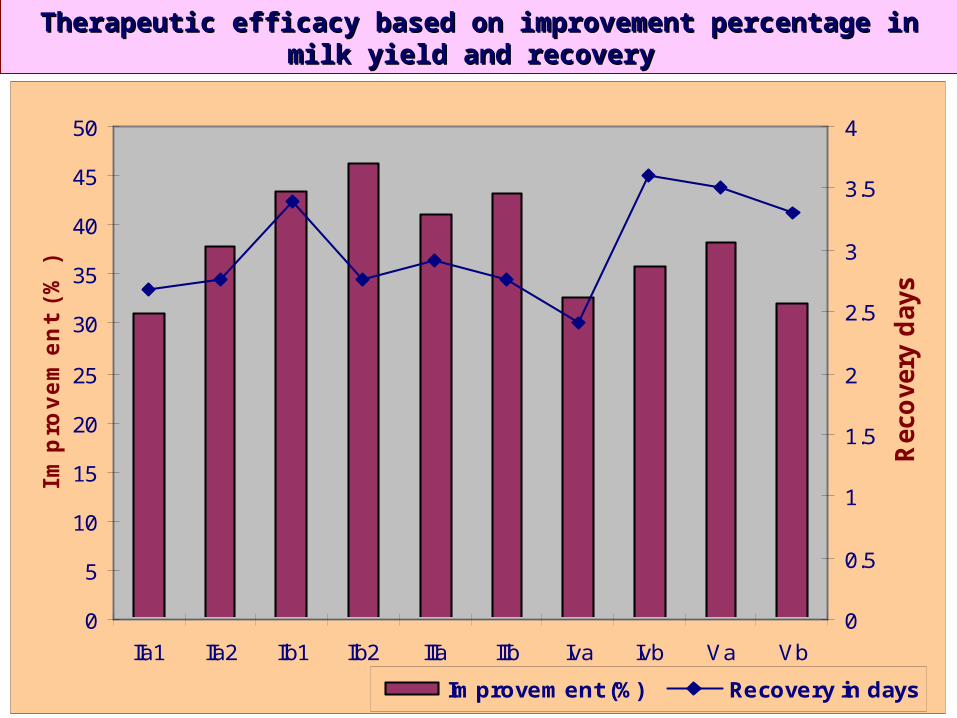
0
5
10
15
20
25
30
35
40
45
50
IIa1 IIa2 IIb1 IIb2 IIIa IIIb Iva Ivb Va Vb
Imp
rovem
en
t (%
)
0
0.5
1
1.5
2
2.5
3
3.5
4
Reco
very
days
Improvement (%) Recovery in days
Therapeutic efficacy based on improvement percentage in Therapeutic efficacy based on improvement percentage in milk yield and recoverymilk yield and recovery
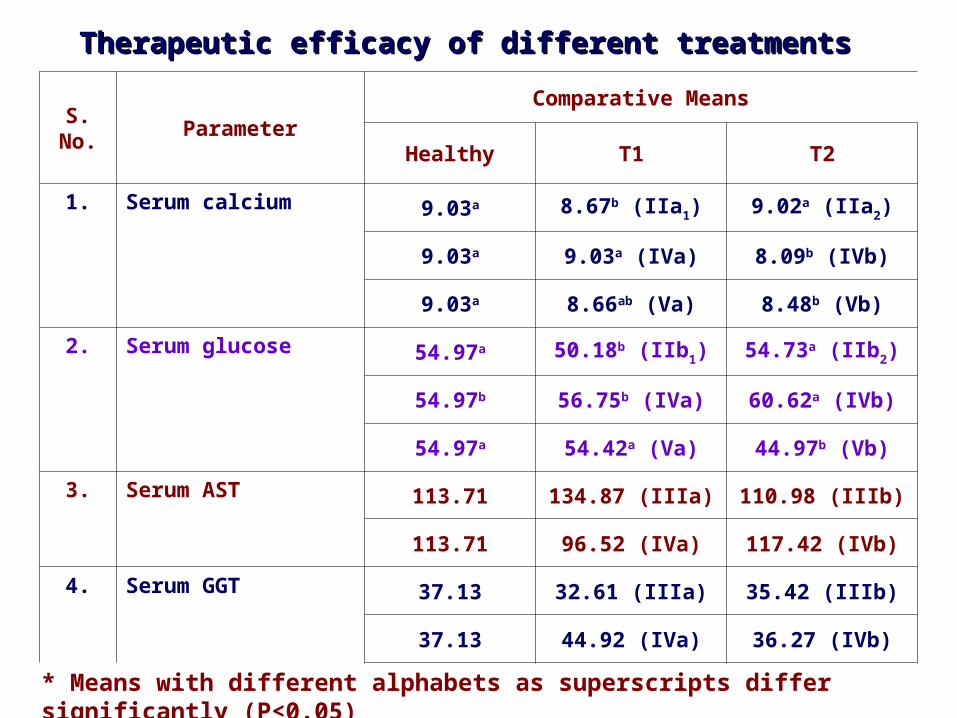
S. No.
ParameterComparative Means
Healthy T1 T2
1. Serum calcium 9.03a 8.67b (IIa1) 9.02a (IIa2)
9.03a 9.03a (IVa) 8.09b (IVb)
9.03a 8.66ab (Va) 8.48b (Vb)
2. Serum glucose 54.97a 50.18b (IIb1) 54.73a (IIb2)
54.97b 56.75b (IVa) 60.62a (IVb)
54.97a 54.42a (Va) 44.97b (Vb)
3. Serum AST 113.71 134.87 (IIIa) 110.98 (IIIb)
113.71 96.52 (IVa) 117.42 (IVb)
4. Serum GGT 37.13 32.61 (IIIa) 35.42 (IIIb)
37.13 44.92 (IVa) 36.27 (IVb)
Therapeutic efficacy of different treatmentsTherapeutic efficacy of different treatments
* Means with different alphabets as superscripts differ significantly (P<0.05)
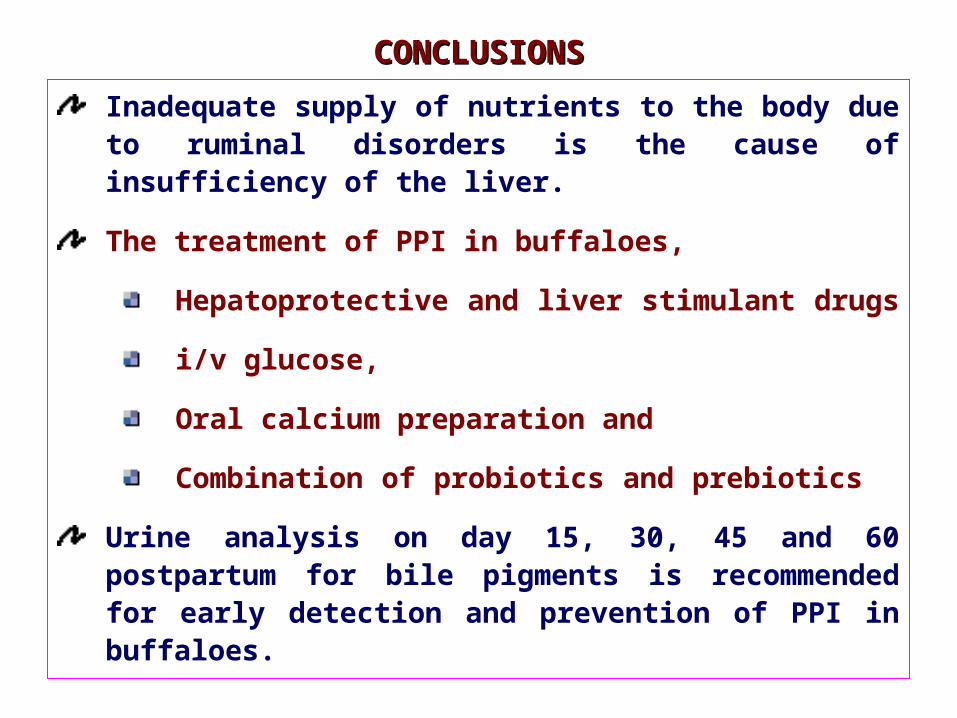
CONCLUSIONSCONCLUSIONS
Inadequate supply of nutrients to the body due to ruminal disorders is the cause of insufficiency of the liver.
The treatment of PPI in buffaloes,
Hepatoprotective and liver stimulant drugs
i/v glucose,
Oral calcium preparation and
Combination of probiotics and prebiotics
Urine analysis on day 15, 30, 45 and 60 postpartum for bile pigments is recommended for early detection and prevention of PPI in buffaloes.