BIG DATA TO SMART CITY: RECOMMENDATION TO...
37
Brazil International Laboratory 2017 Price School of Public Policy University of Southern California BIG DATA TO SMART CITY: RECOMMENDATION TO COR
Transcript of BIG DATA TO SMART CITY: RECOMMENDATION TO...
Brazil International Laboratory 2017Price School of Public Policy
University of Southern California
BIG DATA TO SMART CITY:RECOMMENDATION TO COR

It is estimated that every $1 spent on resilience efforts yields $4 in economic benefits, not including the value of the thousands of prevented
injuries and hundreds of saved lives
Source:NationalAcademyofSciences,Engineering,
andMedicine
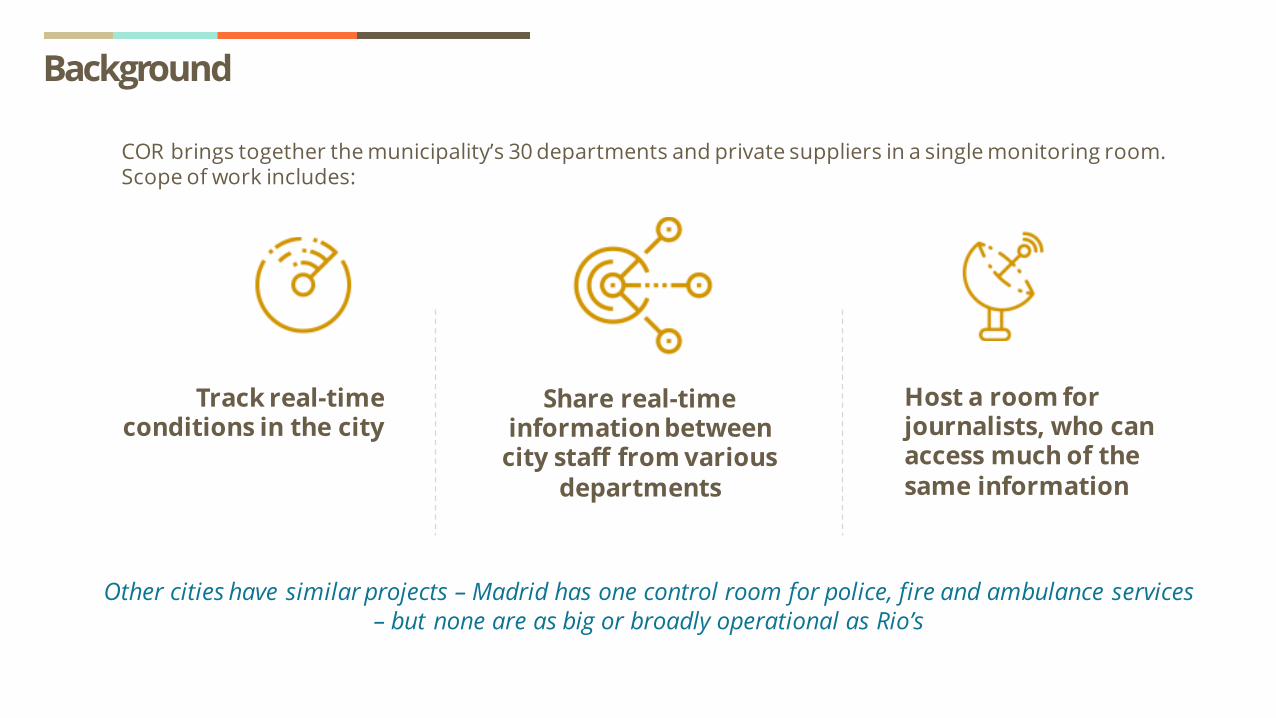
Other cities have similar projects – Madrid has one control room for police, fire and ambulance services – but none are as big or broadly operational as Rio’s
Background
Track real-time conditions in the city
Share real-time information between
city staff from various departments
Host a room for journalists, who can access much of the same information
COR brings together the municipality’s 30 departments and private suppliers in a single monitoring room. Scope of work includes:

SWOTAnalysis
• Integrates several departments involved in Rio's routine
• Manages crisis and emergency situations
• Provides and exchanges information with the public through the media, social networks, and the data.rio portal S W
O T
strengths weaknesses
threats opportunities
• Social media presence is not reaching the masses
• Service delivery and access to services for citizens living in favelas
• Lack of sustainable funding mechanisms for public welfare projects
• Mobilize academic partners and other research partners to improve service delivery
• Redefine mission and vision statements post-Olympics
• Provision of analytical insights and simulations
• Build upon previous resilience efforts
• Small number of employees• A need to make a case for
themselves in a limited funding context
• Credibility issues stemming from blind-side events
People and Partners
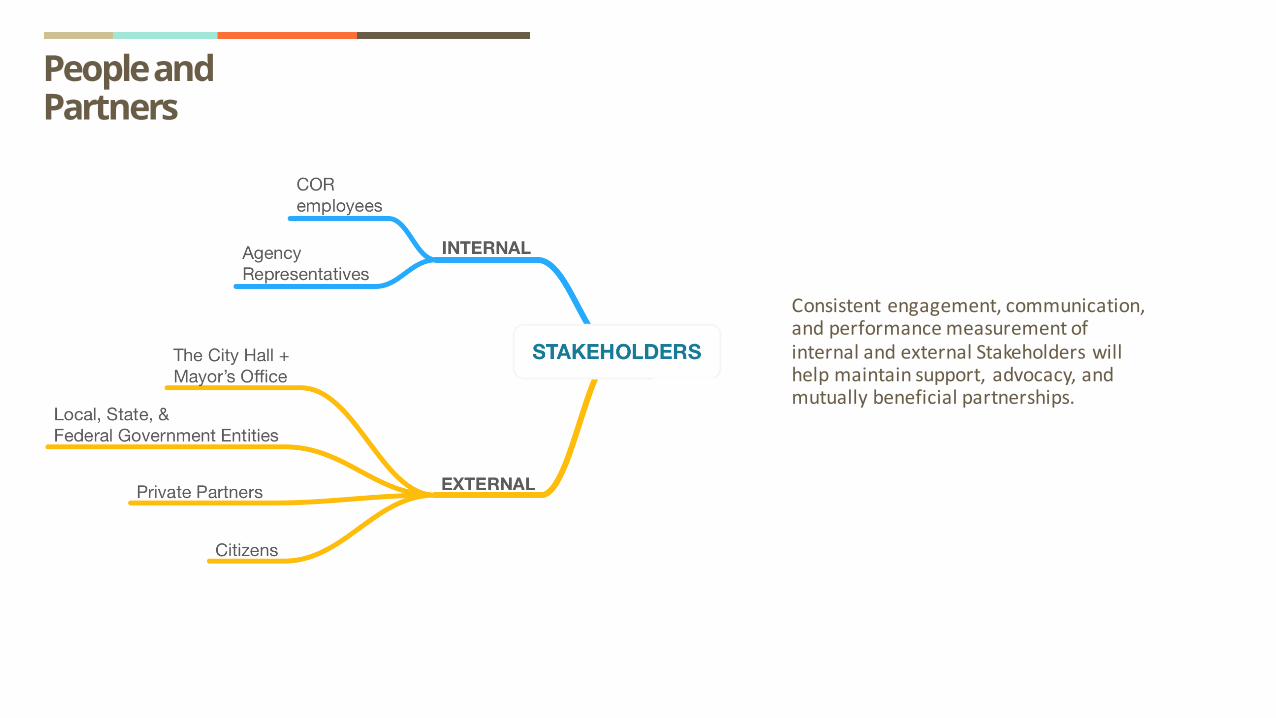
Consistentengagement,communication,and performancemeasurementofinternalandexternalStakeholderswillhelpmaintainsupport,advocacy,andmutuallybeneficialpartnerships.

People and Partners • Increase number of external Stakeholders
by fostering meaningful partnerships and collaborative efforts
• Measure productivity of CORs internal Stakeholders and evaluate the overall processes of COR to identify opportunities and develop best practices

To identify and strategically focus how city management in Rio de Janeiro, specifically Centro de Operações Rio (COR), can use big data to promote
resilience and smarter city growth consistent with COR’s mission.
Vision of Strategic Recommendations
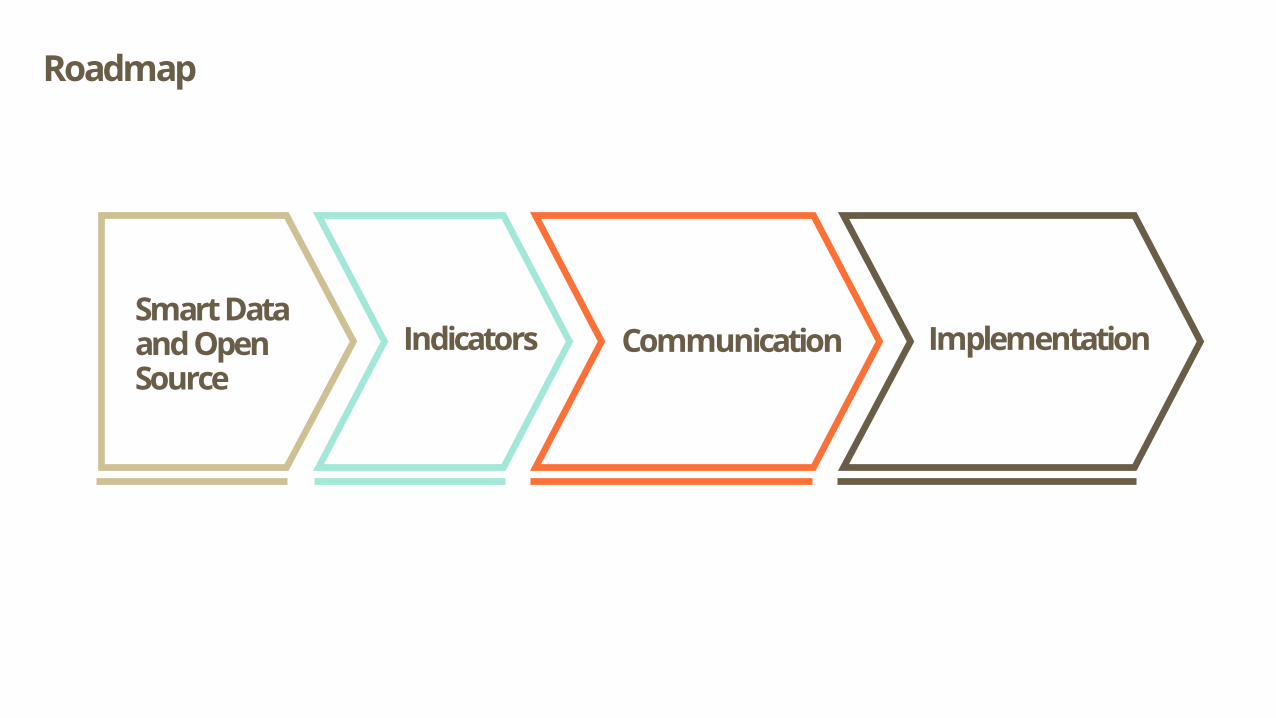
Smart Dataand Open Source
Indicators Communication Implementation
Roadmap

Smart Dataand Open Source
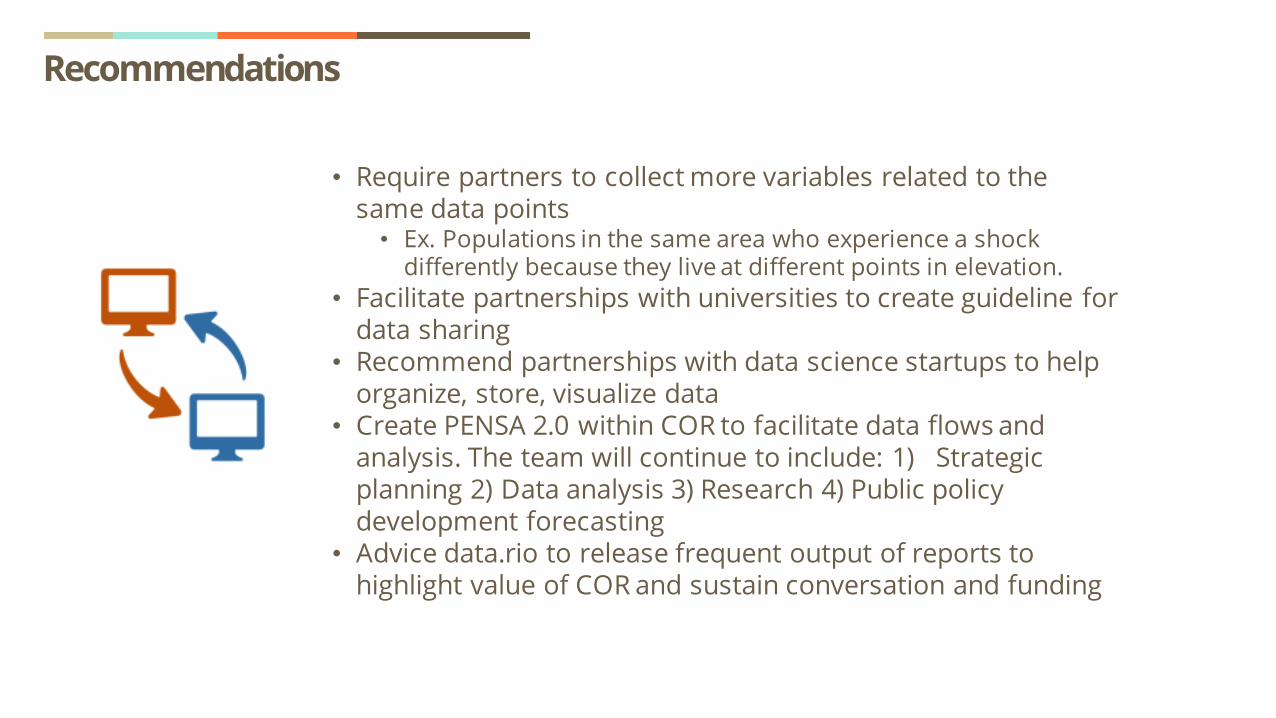
• Require partners to collect more variables related to the same data points• Ex. Populations in the same area who experience a shock
differently because they live at different points in elevation. • Facilitate partnerships with universities to create guideline for
data sharing• Recommend partnerships with data science startups to help
organize, store, visualize data• Create PENSA 2.0 within COR to facilitate data flows and
analysis. The team will continue to include: 1) Strategic planning 2) Data analysis 3) Research 4) Public policy development forecasting
• Advice data.rio to release frequent output of reports to highlight value of COR and sustain conversation and funding
Recommendations

• Coordination and communication between P3s• COR will obtain disaggregated data that captures
equity information• Meaningful data for better forecasting, mitigation,
and resource allocation• Relationship, trust and collaboration with diverse
neighborhoods• Increase funding for sustainable scaling
Value

Standardize data to reflect neighborhood analytics rather than city aggregated analytics
Collect evaluation data to collect before and after costs of projects and response to system failures
DataEquity
Case Study: Mexico
• Establishment of a damage assessment committee (DAC) before the declaration of natural disaster is formally issued
• The DAC is comprised of sectorial subcommittees composed of members of both federal and local institutions.
• Each subcommittee has a maximum of 20 working days to complete fieldwork, to itemize reconstruction needs and the related costs
• While the full damage assessment is being completed, federal and local agencies have 7 days to request funding for the emergency phase.
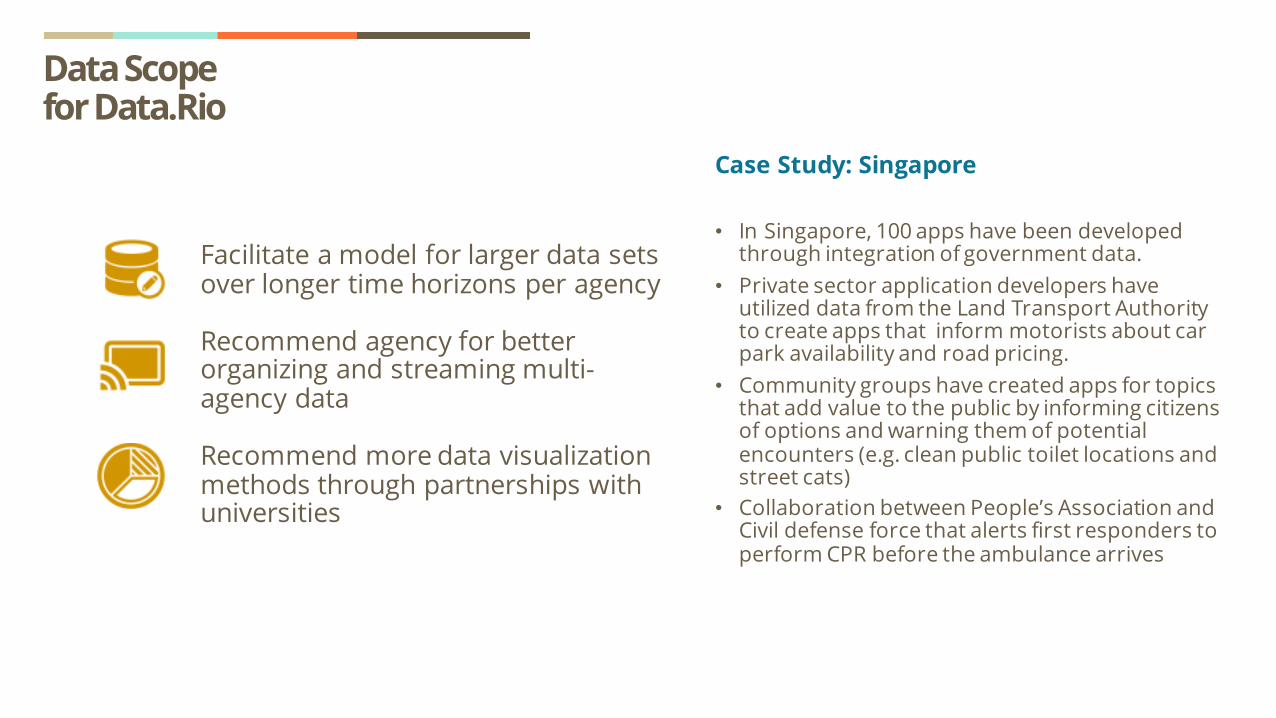
Data Scopefor Data.Rio
Facilitate a model for larger data sets over longer time horizons per agency
Recommend agency for better organizing and streaming multi-agency data
Recommend more data visualization methods through partnerships with universities
Case Study: Singapore
• In Singapore, 100 apps have been developed through integration of government data.
• Private sector application developers have utilized data from the Land Transport Authority to create apps that inform motorists about car park availability and road pricing.
• Community groups have created apps for topics that add value to the public by informing citizens of options and warning them of potential encounters (e.g. clean public toilet locations and street cats)
• Collaboration between People’s Association and Civil defense force that alerts first responders to perform CPR before the ambulance arrives

Indicators

Work with academic specialists to develop three indices:• Hazard Vulnerability Index• Resilience Index• Smart City Index
Recommendations
• Quantify COR’s value for external constituents• Indices capitalize on COR’s comparative advantage of
aggregating data• Provide internal performance evaluation and
alignment with COR mission• Move forward with the RioResiliente Strategy• Suggest actions, next steps, and priorities for the City
of Rio de Janeiro• Provides measurements to address equality in access
to and delivery of citizen services
Value

Building an Indicator
Process• Research measurement models based
on COR-identified needs, RioResiliente Goals, and IDB Case Study
• Create suggestions based on academic literature, other cities, and site visits
Products• Sub-indices which can be aggregated• Possibility for scorecards
Limitation• Data availability• Overlapping measures• Proper aggregation methodology
Source:Scorecard- UNISDR2017 Source:HVRIMaponDisasterResilience- Cutteretal.2010

Creating an Index
a. Reflect on the scale at which you want to measure• Chose one U.S. Federal Emergency Management Agency regions comprised
of eight states
b. Develop or apply a theoretical model• DROP: Disaster Resilience of Place model (Cutter et al. 2008)
c. Select variables based on existing literature and data availability/quality
• Excluded natural systems data due to inconsistency and diverse ecological areas
• Included measures of social cohesion
d. Clean the data and address missing values• Transformed raw data into comparable scales using percentages, per capita,
and density functions• Removed one of any pair of highly correlated indicators• Checked reliability using Chronbach’s Alpha Reliability/Item analysis• Used Min-Max rescaling to create indicators on a similar measurement scale
e. Decide on the weight of each component• Decided to equally weigh each component
f. Create the index score• Averaged sub-index scores • Added the sub-index scores to create final aggregated resilience score
Source:Cutteretal.2010
AbasicexampleofaDisasterResilienceIndexfromCutteretal.2010:

Hazard Vulnerability Index Intense
RainStrongWinds
HeatSusceptibility
Sea LevelRise
Epidemics and Pandemics Droughts Saturation of Road
Infrastructure
Accidents with Urban
Infrastructure
Agglomeration of People with Impact
in Normalcy
Criminal Acts in Urban Spaces Sanitation

Intense Rain
Landslide Vulnerability Percentage of area in landslide susceptibility map high risk zone Negative Neighborhood
Flood Vulnerability Percent of the land-area in the 100-year storm flood plain Negative Neighborhood
Impervious Surfaces Percent impervious surface Negative Neighborhood
Precipitation Cm Negative Block
Humidity Percentage Negative Block
Temperature Celsius Negative Block
Atmospheric Pressure hPa Negative Block
Wind Direction Degrees Negative Block
Wind Speed Km/h Negative Block
River Levels Cm Negative Neighborhood
Geological Studies Availability of geological risk assessment maps Positive Neighborhood
Floodplain population Number of people living in flood plain (Pop./sq km) Negative Neighborhood
Landslide zone population Number of people living in landslide zone (Pop./sqkm) Negative Neighborhood
Flood Frequency Number of flood incidents per year Negative Neighborhood
Community PerceptionPercentage of community residents who identify "intense rains" as
an important issuePositive Neighborhood
Variable How Measured
Expected Effect on Resilience
Recommended Unit of Analysis
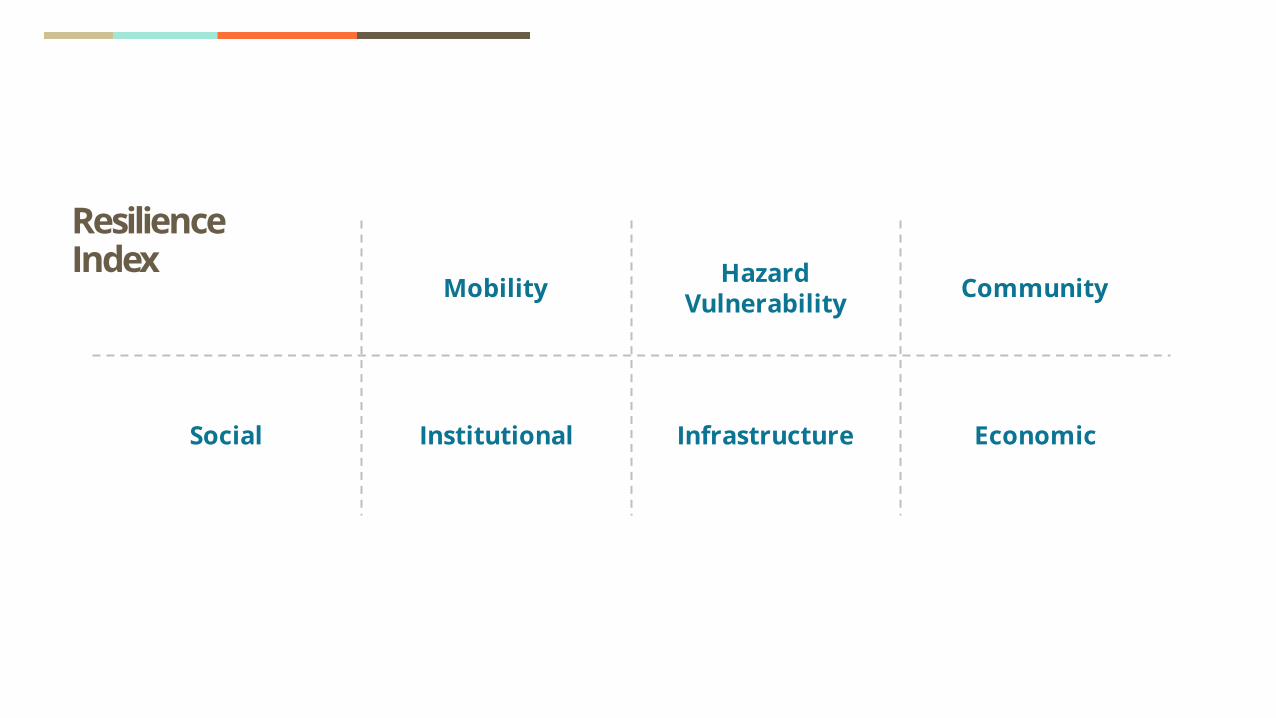
ResilienceIndex
Mobility Hazard Vulnerability Community
Social Institutional Infrastructure Economic
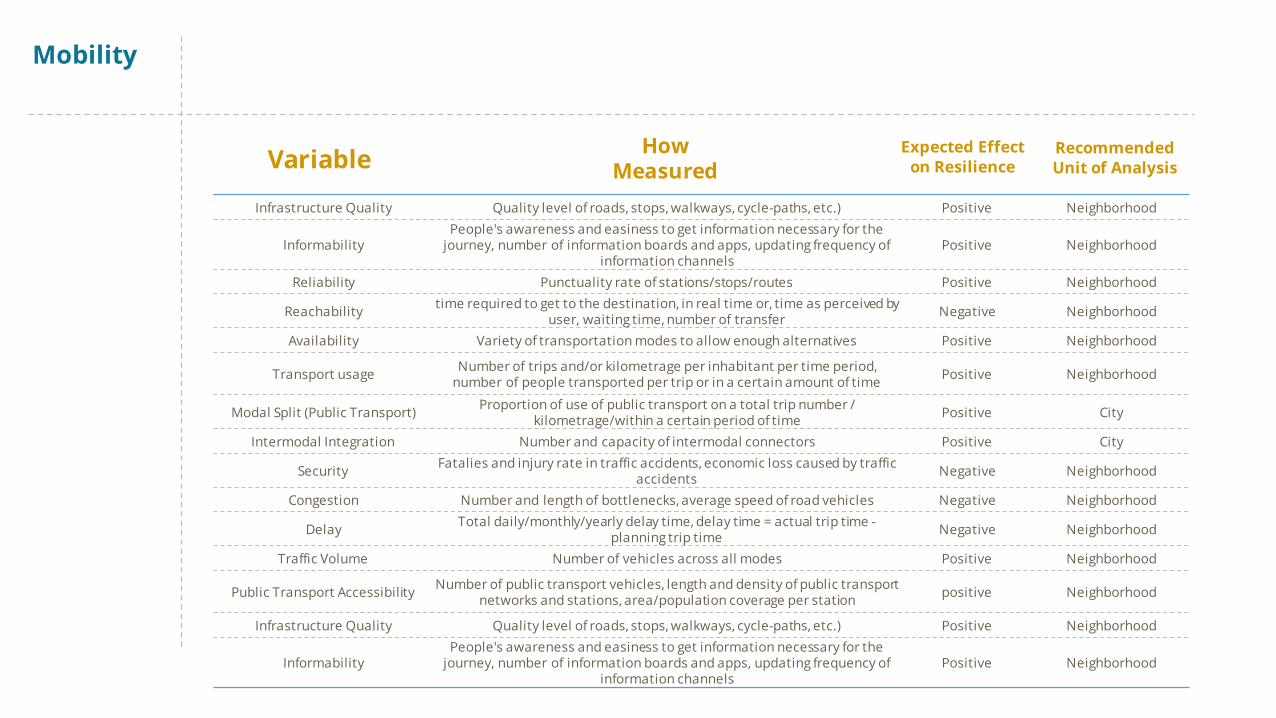
Mobility
Infrastructure Quality Quality level of roads, stops, walkways, cycle-paths, etc.) Positive Neighborhood
InformabilityPeople's awareness and easiness to get information necessary for the
journey, number of information boards and apps, updating frequency of information channels
Positive Neighborhood
Reliability Punctuality rate of stations/stops/routes Positive Neighborhood
Reachability time required to get to the destination, in real time or, time as perceived by user, waiting time, number of transfer Negative Neighborhood
Availability Variety of transportation modes to allow enough alternatives Positive Neighborhood
Transport usage Number of trips and/or kilometrage per inhabitant per time period, number of people transported per trip or in a certain amount of time Positive Neighborhood
Modal Split (Public Transport) Proportion of use of public transport on a total trip number / kilometrage/within a certain period of time Positive City
Intermodal Integration Number and capacity of intermodal connectors Positive City
Security Fatalies and injury rate in traffic accidents, economic loss caused by traffic accidents Negative Neighborhood
Congestion Number and length of bottlenecks, average speed of road vehicles Negative Neighborhood
Delay Total daily/monthly/yearly delay time, delay time = actual trip time -planning trip time Negative Neighborhood
Traffic Volume Number of vehicles across all modes Positive Neighborhood
Public Transport Accessibility Number of public transport vehicles, length and density of public transport networks and stations, area/population coverage per station positive Neighborhood
Infrastructure Quality Quality level of roads, stops, walkways, cycle-paths, etc.) Positive Neighborhood
InformabilityPeople's awareness and easiness to get information necessary for the
journey, number of information boards and apps, updating frequency of information channels
Positive Neighborhood
Variable How Measured
Expected Effect on Resilience
Recommended Unit of Analysis

Smart CityIndex Technology
InnovationTechnology
Infrastructure Governance
Safety & Security
UserCapacity
Public Convenience & Comfort Social Media

Safety& Security
City Video Surveillance Penetration Number of video cameras in overall populationVideo camera per capita Positive Neighborhood
Accident Ratio (Victim, Damaged Project, etc...)
Ratio of all kinds of accidents predicted by ICT measures in a period of time Positive City
ICT Penetration for Disaster Prevention
Number of sensing terminals in disaster-prone areas in overall population Positive Neighborhood
Disaster Alert Publication Rate The publication rate (how fast) timely alerts for natural disasters (Storms, flooding, etc…) Positive City
Decrease in Evacuation Time Decrease in Evacuation Time (minutes, hours, etc...)Time saved with using COR (minutes, hours, etc...) Positive Neighborhood
Information Distribution Post-disaster
Preventable incidents of network congestion (via satellite phones or Wi-Fi network antennae)
Post-disaster Incidents communicated via email/internet vs. phone call to public
Positive City
Variable How Measured
Expected Effect on Resilience
Recommended Unit of Analysis

Communication
• Identify the different levels of user access to facilitate data cleaning • Target potential start ups to develop APIs • Solidify social media outreach and measure success through social
media indicators • Use social media platforms to analyze citizen priorities and match
scorecard perceptions
Recommendations
• Time saving by consolidation of practices • Usage of low cost social media methods for citizen outreach • Increase citizen participation and government trust • Facilitate data dispersion during times of crisis • Social Media contributions to the data pool• Improve data through citizen feedback
Value

Social Media Campaign• Develop campaign to increase social
media following and public reach• Promoting social media sites via
television and radio outlets
User Friendly Information• Prevent information overload • Build upon the popularity of WhatsApp
Data cleaning • Understanding who receives data • Amount of data cleaning tied to
resources management
APIs• Build partnerships with small start ups• Develop APIs that can be used by
partners for future mobile application creation and user data collection.
Targeted Audience
Administrators &Developers
Citizens
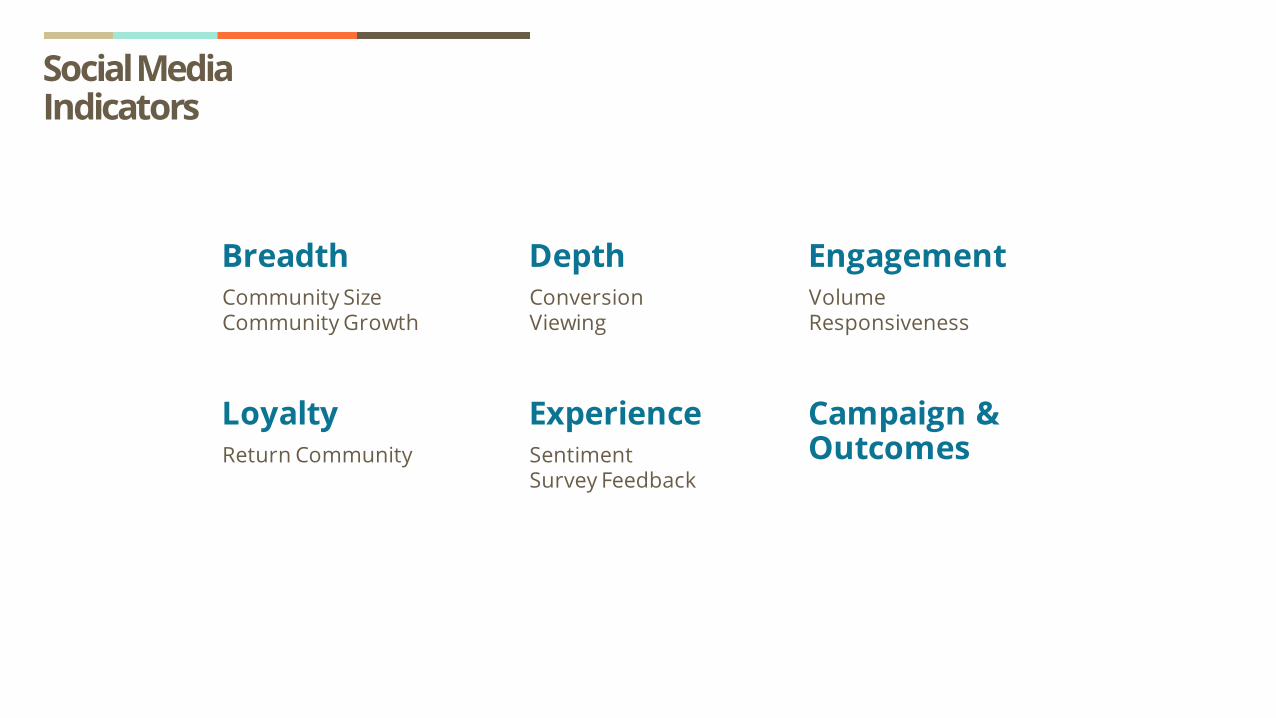
Social MediaIndicators
BreadthCommunity SizeCommunity Growth
DepthConversionViewing
EngagementVolumeResponsiveness
LoyaltyReturn Community
ExperienceSentimentSurvey Feedback
Campaign &Outcomes

Balanced Scorecard
Citizen perspective of COR
Goals Measures
Financial Perspective & Trust
Goals Measures
Learning & Development perspective
Goals Measures
How
do
Citi
zens
See
Us?
What W
e Must Excel A
t?
How do We Look to our Sponsors and Partners?
Can We Continue to Improve and Create Value?
Internal Perspective of Mission
Goals Measures

Implementation
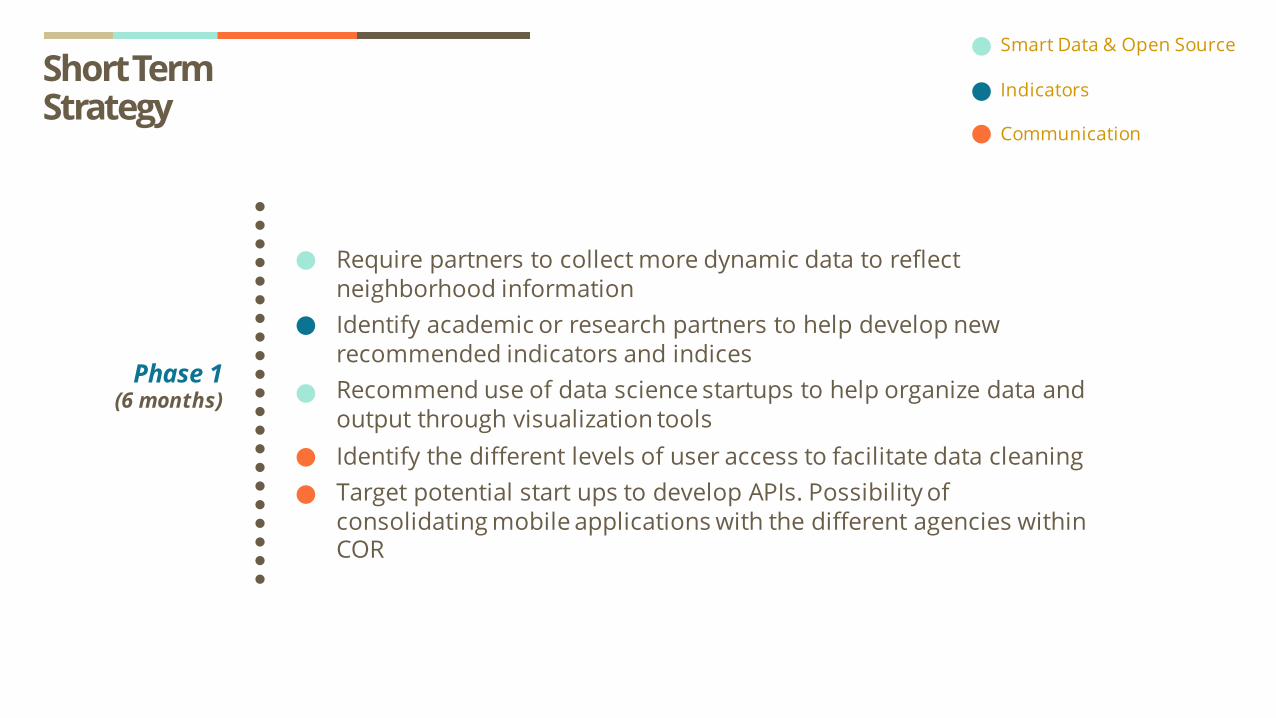
Short TermStrategy
Phase 1(6 months)
• Require partners to collect more dynamic data to reflect neighborhood information
• Identify academic or research partners to help develop new recommended indicators and indices
• Recommend use of data science startups to help organize data and output through visualization tools
• Identify the different levels of user access to facilitate data cleaning • Target potential start ups to develop APIs. Possibility of
consolidating mobile applications with the different agencies within COR
Smart Data & Open Source
Indicators
Communication

Short TermStrategy
Phase 2(1st year)
• Identify existing data sources for indicators and check robustness of current indicators through triangulation with external data sources like NASA
• Advise data.rio to release frequent output of reports to highlight value of COR and sustain conversation and funding
• Solidify social media outreach via publicity campaign. Measure its success through social media indicators
• Implementing Balanced Scorecards to measure performance• Create PENSA 2.0 within COR to facilitate data flows and analysis.
The team will continue to include: 1) Strategic planning 2) Data analysis 3) Research 4) Public policy development forecasting
Smart Data & Open Source
Indicators
Communication

Long TermStrategy
Phase 3(2nd year)
• Determine new data sources/priorities via:• Relationship to RioResiliente Plan and/or COR mission• Focus groups with stakeholders especially citizens• Guidance from academic literature
• Work with academic/research partners to construct the indices using sound research methodology
• Utilize social media platforms to strengthen citizen participation in COR initiatives and crowd source information for real-time personalized response in times of natural disaster
• Create a Damage Assessment Committee (DAC) to improve damage and loss assessment procedures that will help strengthen the country’s response capacity (quantify the cost-savings of COR’s work)
Smart Data & Open Source
Indicators
Communication

Long TermStrategy
• Empower and provide the tools for community institutions to become active partners in resilience efforts throughout Rio - including in the areas of water management, sanitation and disaster relief
• Institutionalized data transparent and scale data at a neighborhood level for more targeted data sets
• Adopt a disaster risk reduction mindset versus a disaster relief mindset • Build upon WhatsApp’s popularity
Phase 4(Beyond)
Smart Data & Open Source
Indicators
Communication

Thank you!Obrigado(a)!
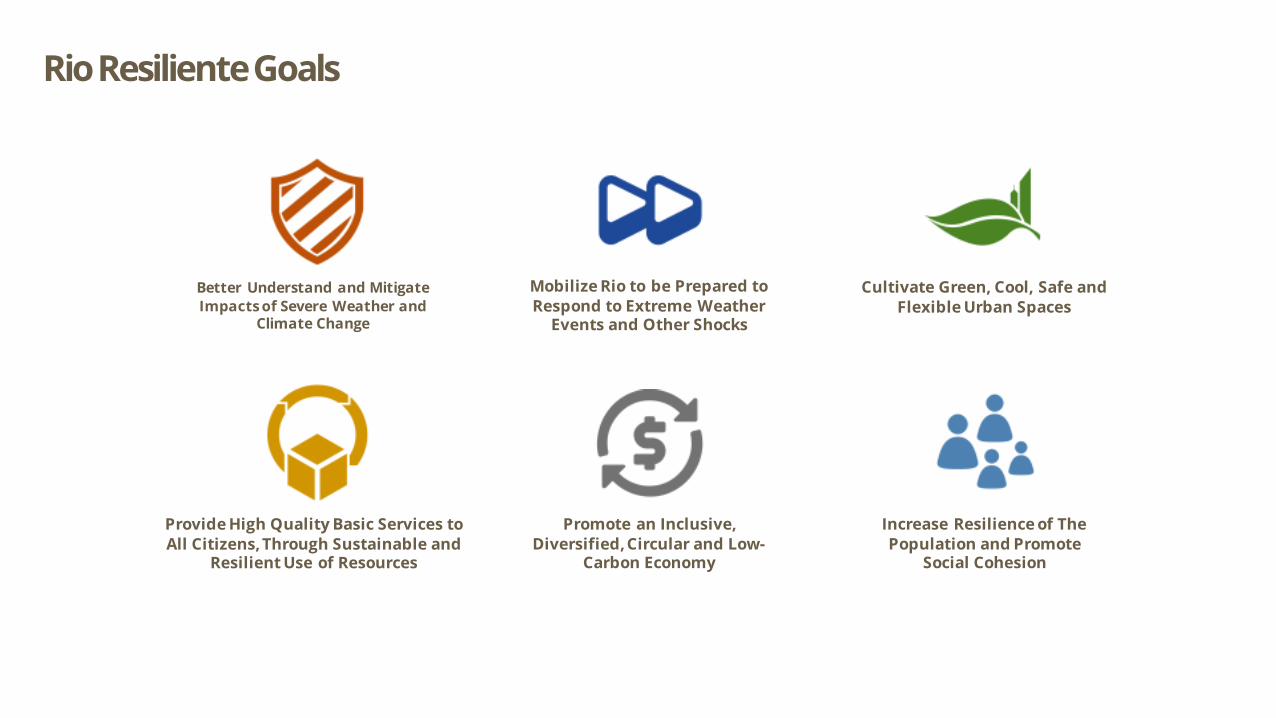
Rio ResilienteGoals
Better Understand and Mitigate Impacts of Severe Weather and
Climate Change
Mobilize Rio to be Prepared to Respond to Extreme Weather
Events and Other Shocks
Cultivate Green, Cool, Safe and Flexible Urban Spaces
Provide High Quality Basic Services to All Citizens, Through Sustainable and
Resilient Use of Resources
Promote an Inclusive, Diversified, Circular and Low-
Carbon Economy
Increase Resilience of The Population and Promote
Social Cohesion