Biefang-Frisancho Mariscal, I. and Howells, P. (2007 ... · Iris Biefang-Frisancho Mariscal and...
21
Biefang-Frisancho Mariscal, I. and Howells, P. (2007) Monetary pol- icy transparency in the UK: The impact of independence and inflation targeting. International Review of Applied Economics, 21 (5). pp. 603-617. ISSN 0269-2171 We recommend you cite the published version. The publisher’s URL is http://dx.doi.org/10.1080/02692170701525966 Refereed: Yes (no note) Disclaimer UWE has obtained warranties from all depositors as to their title in the material deposited and as to their right to deposit such material. UWE makes no representation or warranties of commercial utility, title, or fit- ness for a particular purpose or any other warranty, express or implied in respect of any material deposited. UWE makes no representation that the use of the materials will not infringe any patent, copyright, trademark or other property or proprietary rights. UWE accepts no liability for any infringement of intellectual property rights in any material deposited but will remove such material from public view pend- ing investigation in the event of an allegation of any such infringement. PLEASE SCROLL DOWN FOR TEXT.
Transcript of Biefang-Frisancho Mariscal, I. and Howells, P. (2007 ... · Iris Biefang-Frisancho Mariscal and...

Biefang-Frisancho Mariscal, I. and Howells, P. (2007) Monetary pol-icy transparency in the UK: The impact of independence and inflationtargeting. International Review of Applied Economics, 21 (5). pp.603-617. ISSN 0269-2171
We recommend you cite the published version.The publisher’s URL is http://dx.doi.org/10.1080/02692170701525966
Refereed: Yes
(no note)
Disclaimer
UWE has obtained warranties from all depositors as to their title in the materialdeposited and as to their right to deposit such material.
UWE makes no representation or warranties of commercial utility, title, or fit-ness for a particular purpose or any other warranty, express or implied in respectof any material deposited.
UWE makes no representation that the use of the materials will not infringeany patent, copyright, trademark or other property or proprietary rights.
UWE accepts no liability for any infringement of intellectual property rightsin any material deposited but will remove such material from public view pend-ing investigation in the event of an allegation of any such infringement.
PLEASE SCROLL DOWN FOR TEXT.
1
Monetary Policy Transparency in the UK:
The Impact of Independence and Inflation Targeting
Iris Biefang-Frisancho Mariscal and Peter Howells
University of the West of England
Abstract
There is a widespread belief that the transparency of UK monetary policy has increased
substantially as a result of the introduction of inflation targeting in 1992 and a number of
procedural and institutional reforms which accompanied and followed it. In this paper, we use
money market responses (and other data) to test the possibility that improved anticipation of
policy moves may be the result of developments other than the institutional reforms popularly
cited. We find overwhelming evidence that the switch to inflation targeting itself significantly
reduced monetary policy surprises, while subsequent reforms have contributed little. Where we
advance substantially on earlier work is to look at the cross-sectional dispersion of agents’
anticipation. If the benefit of transparency is the elimination of policy surprise, there is little
benefit if the averagely correct anticipations of agents conceal a wide dispersion of view.
The most striking feature is the general decline in cross-sectional one year-ahead forecast
uncertainty of the interbank rate. So, even though we do not find that agents on average have
improved monetary policy anticipation since 1997, we do find that they have become more
unanimous about forecasting future money market rates.
However, further testing reveals that it is a simultaneous fall in the dispersion of inflation
rate forecasts that explains the increased consensus on interest rates, rather than institutional
reforms in 1997 and later.
JEL code: E58
Corresponding author:
Dr P G A Howells
Bristol Business School
UWE Bristol,
Bristol BS16 1QY
email: [email protected]

2
Monetary Policy Transparency in the UK:
The Impact of Independence and Inflation Targeting
Iris Biefang-Frisancho Mariscal and Peter Howells
University of the West of England
1. Introduction
Recent years have seen the emergence of a substantial consensus to the effect that monetary
policy in the UK is both more ‘transparent’ than policy in several other monetary regimes and
that the transparency has increased over time. The result of the latter is that policy
announcements contain less ‘surprise’ for financial markets and other interested parties and this
has contributed to a more stable macroeconomic environment.1
This consensus is so widespread as to be almost suspicious. The main purpose of this
paper, therefore, is to raise and to test the possibility that the improved ability of agents to
anticipate the behaviour of the Bank of England in the setting of interest rates, comes from some
other source altogether.
In section 2 we look briefly at some of the tests of transparency that have taken place in
recent years, distinguishing the various approaches but concentrating on those which have
featured the behaviour of market interest rates. An important feature of these tests, we shall
emphasise, is that in taking market interest rates they are inevitably focusing upon the average
outcome of agents’ behaviour and that, like any average, the figures may conceal a large or
small dispersion of view.
In section 3 we estimate a model of market interest rate behaviour which enables us to
measure the degree of surprise occurring on the day of an announcement of a change in the
policy rate. The model is essentially similar to that used in other market-based studies in that it
uses average behaviour in the sense described above, and also in includes a dummy variable for
‘1992’, the year in which inflation targeting was adopted, and began the succession of
institutional reforms widely associated with increased transparency. However, we extend the
sample period and include additionally a dummy variable for 1997, to test whether Bank of
England independence has changed agents’ ability to anticipate monetary policy. Our
estimations suggest that the earlier findings have been unaffected by recent events and that
therefore the hypothesis that transparency has increased since the introduction of inflation
targeting and associated reforms remains apparently well-supported. The absence of an effect
1 See Bean (2005) for a discussion of the contribution of monetary policy to macroeconomic stability in the UK.

3
from the later move to operational independence (and associated reforms) may be rather more
surprising, but is not without precedent.
In section 4 we take up the result of the previous section. If one of the benefits of
transparency is that is that it helps eliminate surprises by helping agents to ‘read the mind’ of the
policy-maker, then greater transparency should increase the degree of consensus amongst agents
as to the policy-maker’s next step. Specifically, in a money market context, it should increase
the forecast certainty associated with relevant interest rates. We particularly compare the
dispersion of the cross sectional forecasting spread between the pre- and post-1997 periods. We
find a significant fall in the dispersion of the forecasting spread since 1997. On the basis of this
results, we conclude, that even though monetary policy anticipation, on average, has not
changed since 1997, private institutions’ forecasting confidence of money market rates has
improved markedly since 1997.
On the face of it therefore, the evidence of section 4 might be taken to suggest that while
the benefits of independence and associated reforms are not identifiable by concentrating (as
hitherto) on average, i.e. market, behaviour, they are revealed in evidence of an increasing
consensus of view. This need not follow, however and in section 5 we look at another possible
reason for the increased consensus in interest rate forecasts. This is that (agents understand that)
forecasts of the future inflation rate are a critical part of the central bank’s reaction function. In
other words, ‘inflation targeting’ implies ‘inflation forecast targeting’ (Svensson, 1997). This
being the case, then an increase in the consensus of agents’ inflation forecasts (for whatever
reason) will produce an increase in the interest rate consensus. We find that cross sectional
diversity of the inflation forecast spread has fallen similarly as the diversity of the interbank
forecast spread and that the inflation spread explains the fall in the interbank forecast spread.
Section 6 summarises and concludes.
2. The story so far
Setting aside occasional surveys of agents’ opinions, evidence on the transparency of monetary
policy comes, broadly, in one of two forms.2 There is firstly what we might call the
‘characteristics’ approach which lists those institutional characteristics of a monetary policy
regime which, a priori, one might expect to lead to more openness, more information and thus a
better understanding of the decision-making process. The features of individual regimes are then
checked against this list and a numerical score is arrived at which allows the ranking of regimes.
Anyone familiar with the attempts years ago to measure central bank independence (e.g. Alesina
and Summers, 1993) will recognise the approach. Applied to transparency, such studies include

4
Fry et al (2000), Eiffinger and Geraats (2002), De Haan and Amtenbrink (2002) and Bini-
Smaghi and Gros (2000). Their main relevance here is their tendency to rate the (post-1997)
Bank of England relatively highly and generally above the US Federal Reserve, the ECB and the
pre-1999 Bundesbank.
The weakness of this approach, apart from the sensitivity of the results to the arbitrary
weightings chosen for the individual characteristics, is the lack of any theoretical framework
linking the characteristics to transparency. There is, of course, a common sense argument that
can be called in aid, provided that one’s definition of and interest in transparency is fairly
superficial. Clearly, the more information that is released the better informed people should be.
But this is dangerously circular. If we are not careful, transparency itself comes to be defined as
‘full information (of any sort)’ and then inevitably it follows that the more information is
released the more transparent a regime is.
If we are interested in transparency from a more practical point of view, it must be
because we are interested in its ability to change behaviour. In particular, the behaviour change
that central banks are interested in is the lessening of surprise amongst agents when a policy
decision (usually a change in the official interest rate) is announced. If policy is transparent in
this sense, then the policy ‘news’ is contained in the macroeconomic developments which
precede the official announcement and on which the central bank bases its decision. In Mervyn
King’s oft-quoted view, monetary policy in a fully-transparent regime is ‘boring’ (King, 1997,
p.440).
If this is the objective of increased transparency, then simply summing some arbitrarily
chosen characteristics is of little help since it tells us nothing about which characteristics are
more important than others (a ranking which may, moreover, vary across regimes). It seems
entirely plausible that one or maybe two key institutional features are sufficient after which the
rest are redundant, even though they create an impressive score in the league tables. We should
always bear in mind Daniel Thornton’s (2003) caution that two of the most secretive central
banks, the Swiss and the German pre-1999 Bundesbank, were amongst the easiest to read as
well as the most successful in their conduct of policy. Provided a central bank behaves
consistently, in response to events (and often enough), agents with large sums at stake will
eventually learn to predict simply on the basis of constant conjunction.
The second approach allows for a more direct and relevant measurement of transparency.
This looks at the behaviour of money market interest rates in the vicinity of an official
announcement. The argument here has a rather more secure theoretical basis which starts from
the observation that money markets are dominated by well-informed professional traders who
2 Two major surveys of the transparency literature are provided by Hahn (2002) and Geraats (2002).

5
are responsible for managing large funds. Money market instruments are relatively
homogeneous and this combined with good information results in very narrow spreads between
individual rates (usually measured in a few basis points) and a high degree of correlation
between interest rate movements, including movements in the official rate.
From here, one line of argument simply calls upon rational maximising behaviour. A rise
(for example) in the official rate, instantly communicated to market rates, means a fall in the
value of traded money market instruments (bills, CDs, repos etc...). A trader anticipating a rise
in the official rate will sell and hold cash, thereby pushing down prices and raising yields on
these traded instruments, in advance of the official rate change. Consequently, an official change
which is completely anticipated will have no effect on market rates on the day of announcement.
A variation on looking at market (spot) rates is to look at the yield curve. The argument
is broadly the same. The yield curve will jump (especially at the very short end) if the policy
change comes as a surprise, but will not move (on the day of announcement) if the change is
anticipated. Looking at the yield curve has the added advantage that further information may be
available about how agents expect a recent change in the official rate to be followed up in future.
There are numerous such studies. For the USA, Kuttner (2001) and Poole, Rasche and
Thornton (2002) have all documented the ability of money markets to anticipate monetary
policy changes, the latter showing that anticipation has improved since the Federal Reserve
began announcing its target for the Federal Funds rate in 1994. One of the earliest market-based
studies of transparency was done by Daniel Hardy (1998) for the IMF. In contrast to what one
might have expected from the characteristics literature, it showed that German money markets
had little difficulty in anticipating Bundesbank interest rate decisions. In 2002, again for the
IMF, Ross looked at the performance of the ECB after three years of operation. and compared it
with the Federal Reserve and the Bank of England. He found that ‘… all three central banks are
relatively predictable institutions.’
For the UK two papers, by Chadha and Nolan (2001) and Caporale and Cipollini (2001),
approach the question of transparency through the volatility of market rates. The former tested
for a direct relationship between interest rate volatility in the UK and transparency measured by
(i) the publication of minutes of the MPC meetings, (ii) the effects of announcements on the
interest rate decisions of the MPC and (iii) the publication of the Inflation Report. None of these
factors seemed to affect volatility significantly. They also experimented with dummy variables
accounting for days on and before announcement day and found mixed significant effects from
these dummies on volatility over selected periods in the UK. They conclude that it is quite
possible that by the time this information is in the public domain, it may not contain much news
anymore and that therefore their model only picks up the fact that markets are continually

6
adapting to new information. Caporale and Cipollini (2001) found that in Euroland and the US
volatility is higher before the change in policy rate than after the decision, which may indicate
that agents adjust to information before the policy change relatively more than after the change.
The paper by Haldane and Read (2000) looked at the effect of monetary policy
‘surprises’ on the yield curve. Its relevance to us is that it finds (for the UK) that the effects of
policy news on the short end of the yield curve have diminished since the introduction of
inflation targeting (though they remain high by comparison with the US and with Germany).3
This, they put down to the increasing transparency of policy. The sample in the Haldane and
Read paper is 1984 to 1997 and they look at the response of interest rates of eight different
maturities up to 20 years. Taken together, market-based tests of transparency show remarkable
agreement that monetary policy making by the major central banks, including the Bank of
England, has made considerable progress in communicating their approach to interested agents.
What they also tend to show, although it is not a major issue here, is that anticipation of official
rate changes is much better than might be expected in those regimes given a low transparency
rating by the characteristics approach.
Unlike the characteristics approach, which at best is taking a snapshot of the situation at
a particular moment, studies of money market rates, looking at interest rate responses over time,
have the ability to distinguish stages in the development of transparency, and thus to identify to
some degree, those reforms which were followed by significant changes in behaviour. In the
next section, using an approach similar to that of Haldane and Read (2000), we update the
situation for the UK, using dummies to check for changes in anticipation on either side of the
two major reforms in UK policy-making in 1992 and 1997 before going on to consider whether
the apparent increase in transparency may be due to circumstances other than procedural and
institutional innovations.
3 Updating the evidence
To extract some measure of policy surprise along the yield curve, we estimate the change in the
market interest rate as follows (see Haldane and Read, 2000):
, , 1 2( ) ( 92 ) ( 97 ) (1)t j j j t j j t j t j t tmar c L mar pol D pol D pol e
The subscript j stands for the term to maturity. The variable mar indicates the market rate, pol
stands for the official rate. The dummy variables are defined as:
3 Wadhwani (2001), using a different approach, reports a similar picture for the post-1997 period: surprises in the
UK are higher than in Europe and USA, but declining over time.

7
D92 =1 from November 1992 and zero otherwise
D97=1 from 3 June 1997 and zero otherwise
We use daily yields on Certificates of Deposit with a maturity of 1, 3, 6 and 12 months.
The sample period for the UK is from January 1984 until mid-October 2003. the sample size is
about 5000 observations and during this period, the Bank of England changed the official rate
100 times.
Equation (1) includes the lagged dependent variables to account for serial correlation.
The coefficient λ measures the average degree of policy surprise over the entire sample period
and varies between zero and one. If central bank policy is perfectly understood and credible,
then a policy announcement is no news and λ is equal to zero. In other words, the yield curve
will not adjust following a change in the official interest rate.
The coefficients 1 2j jand measure the additional effect of the inflation targeting
regime and central bank independence (and their accompanying reforms), respectively, on
average interest rate surprises. If these reforms and their accompanying disclosures make it
easier for agents to anticipate Bank of England policy, we expect the sign of these coefficients to
be negative. The sum of the coefficients λ and 1j 2( )j measures the size of the average
interest rate surprise along the yield curve during the period of inflation targeting (central bank
independence).
Table 1 below shows the results of equation (1). The model was estimated using OLS
and due to the presence of serial correlation, the t-values in brackets in Table 1 are calculated on
the basis of Newey-West adjusted standard errors to ensure consistency.
Table 1: The policy surprise in short-term interest rates
jRate c j 1j 2j 2R
1 Month -0.001
(-0.86)
0.424***
(4.93)
-0.315**
(-2.46)
-0.005
(-0.04)
0.13
3 Months -0.001
(-0.83)
0.121**
(2.13)
-0.115
(-1.17)
0.052
(0.62)
0.01
6 Months -0.001
(-0.87)
0.290***
(3.95)
-0.296**
(-2.86)
0.026
(0.35)
0.06
12 Months -0.001
(-0.80)
0.236***
(3.73)
-0.172*
(-1.85)
-0.073
(-0.96)
0.04
‘***’, ‘**’ and ‘*’indicate that coefficients are significant at least at the 1%, 5% and 10% level, respectively.
Turning first to 2R , we note that between 1 and 13 per cent of the average variation in the
market rate is explained by the model. The policy surprise coefficient λ is significant throughout

8
the yield curve indicating a significant surprise element over the entire sample period. On
average, between about 26 and 42 per cent of a policy rate change comes as a surprise on the
day of the announcement (with the exception of the surprise in the 3-month CD rate, which only
amounts to about 12 percent). The coefficient of the variable accounting for the switch to
inflation targeting is also significant throughout the yield curve (again, with the exception of the
3-month CD-rate and at the 6% level for the 12-month CD rate), while the coefficient of the
independence variable is insignificant throughout. The results indicate that in the period since
1992, the policy surprise fell on average to between zero and about 11 percent.
It is quite likely that in the above estimations multicollinearity may play an important
role and explain why the Bank of England independence variable is insignificant. We therefore
changed and re-estimated equation (1) by re-formulating the dummy variable for the change due
to inflation targeting in 1992. The new dummy variable equals one in the period from November
1992 until 2nd
June 1997 and is zero otherwise. Its coefficient then estimates the additional
change in monetary policy surprise over the defined period in relation to the whole sample
period while the coefficient for the independence variable again estimates the additional change
in average policy surprise due to central bank independence in relation to estimated policy
surprise over the entire sample period. If central bank independence contributed something
additional to the 1992 fall in average policy surprise, we expect the coefficient of the
independence variable to be significantly (in absolute terms) above the coefficient estimating the
additional effect of the inflation targeting period. The results are displayed in Table 2 below:
Table 2: Policy surprise in short-term interest rates
jRate c j 1j 2j 2R 1 2 3j j j
1 Month -0.001
(-0.83)
0.423***
(4.92)
-0.306**
(-2.39)
-0.303**
(-3.19)
0.13 2 (1) =0.001 [0.979]
3 Months -0.001
(-0.82)
0.121**
(2.13)
-0.113
(-1.16)
-0.056
(-0.92)
0.01 N/A
6 Months -0.001
(-0.85)
0.289***
(3.94)
-0.287**
(-2.77)
-0.253***
(-3.39)
0.06 2 (1)=0.19 [0.664]
12 Months -0.001
(-0.79)
0.235***
(3.73)
-0.170*
(-1.77)
-0.239***
(-3.38)
0.04 2 (1)=0.77 [0.379]
Note: OLS estimation and Newey-West adjusted t-values in brackets. Under the null hypothesis, the Wald statistic
has an asymptotic 2 ( )q distribution, where q is the number of restrictions under the null hypothesis. In square
brackets are the associated probability levels. ‘***’, ‘**’ and ‘*’indicate that coefficients are significant at least at
the 1%, 5% and 10% level, respectively.

9
As before, the coefficient λ is significant along the yield curve, suggesting that there was
some surprise element in monetary policy over the sample period. The size of the coefficient has
not changed much in comparison to the previous estimation as reported in Table 1. Both dummy
variables have significant negatively signed coefficients (except for the CD rate at three months
maturity), indicating that policy surprises decline in the sub-periods post 1992. Over the entire
sample period, surprises along the short end of the yield curve are between about 12 and 42
percent, while in the sub-periods, they vary between about fifteen and zero percentage points.
The interesting question here, however, is whether the coefficients of the dummy variables differ
from each other, or, more precisely, whether the coefficient of the independence variable is
significantly larger (in absolute terms) than the coefficient relating to the inflation targeting
variable. The last column reports the results of the Wald coefficient restriction test in its χ2
version. The null hypothesis of no difference in the coefficients cannot be rejected. We interpret
this result as further evidence that the Bank of England independence and its associated reforms
has not added to the understanding of monetary policy by market agents. The only reform that
seems to have mattered in reducing the surprise element of monetary policy is the switch to
inflation targeting.
This result is perhaps surprising, not because of the likely effects of independence itself
upon the information available to agents, but because the move to independence was
accompanied by a number of innovations (also therefore captured by our dummy) which might
well have changed the amount of relevant information significantly. For example, the minutes of
the MPC meetings were much fuller than the earlier minutes of Chancellor/Governor meetings.
In particular they revealed alternative courses of action discussed (but not adopted) by the MPC
as well as an Appendix which commented on recent economic data. The voting record was also
published – important in revealing the weight of opinion - and MPC members themselves were
able to make speeches giving their interpretation of economic developments. On the other hand,
our result provides a good example of where the characteristics and market-based approaches
can yield sharply divergent results and it is not difficult to see why. There is no doubt that more
information about Bank of England policy decisions has been available since 1997 and on that
basis policy ‘must have been’ more transparent. But the question one can address by looking at
evidence from market rates is whether this extra information matters or even, indeed, whether it
is helpful at all. By saying that the switch to inflation targeting in 1992 had an effect on markets’
ability to anticipate which is not matched by any subsequent developments is simply saying that
once markets had a clear statement of what the central bank’s objective was, they could work
out the rest. This does not seem quite so startling in the light of the evidence, briefly mentioned
in section 2, that shows that markets have never had much difficulty in anticipating policy

10
decisions in regimes like the old Bundesbank and the Federal Reserve which score poorly on
characteristics tests.
Furthermore, work done by the Bank of England itself clearly shows that independence
and its associated reforms had no short-run benefits for markets trying to anticipate policy
decisions. Clare and Courtenay (2001) for example show that markets became less sensitive to
market news (and more sensitive to policy announcements) after 1997. More recently, Lasaosa
(2005) confirms this but in having a longer time period to review, suggests that this loss of
transparency may be being reversed now as agents come to learn ‘the rules of the game’.4 Be
this as it may, the negative short-run effects of regime change, even where accompanied by large
increases in information, are quite striking. It is not the purpose of this paper to explain the
negative effect of independence on transparency but it raises the question of whether ‘indicators’
of transparency should be more sensitive to the type of information provided and less focused
upon the quantity. There is also the intriguing question, raised by the experimental evidence in
Lombardelli et al (2002) as to whether decision-making by committee is inherently more
opaque.
4. Interest rate uncertainty
If an increase in transparency has the potential to reduce policy surprises, as most central banks
believe it can, then its benefits should not only be evident in the average ability of agents to
anticipate policy moves, but should also be revealed through a decline in the divergence of view
amongst private agents’ as to the next likely policy move. In other words, greater transparency
should mean greater unanimity in the prediction of monetary policy.
We test this hypothesis using cross sectional private agents’ forecasts of future money
market rates and by examining the size of the forecast spread over time. A declining spread
would indicate that agents have become less diverse and thus more confident about future policy
moves. We particularly test whether cross sectional dispersion of agents’ forecasts has changed
since 1997. Clearly, it is quite possible that while we do not find a significant decline in average
policy surprises since 1997 (see tables 1 and 2), agents may nonetheless have become more
confident and thus more unanimous about monetary policy in the later period. If this were the
case, we could still conclude that the reforms since 1997 had some beneficial effect in reducing
uncertainty.
We use monthly data of forecasts of the 3-month interbank rate of about 25 private
institutions as published by the monthly publication Consensus Forecasts. The sample covers
the period between January 1994 and May 2004. We use two measures of cross-sectional

11
dispersion: the standard deviation of private agents’ predictions and the range between the third
highest and the third lowest interbank rate forecast at a three month and a one year forecast
horizon. The range spans the 12th
and 88th
percentile of the cross sectional forecast distribution.
In order to test whether cross sectional interest rate forecast dispersion has changed over
time, we estimate the following model:
( ) 97 ( 97 ) 2jt j j jt j t j t j t jtdispersion c L dispersion D Trend D Trend
Dispersion refers to either standard deviation or range of the 3-month interbank rate forecast
three months and one year ahead. Trend is the time trend and D97 is 1 since June 1997 and zero
otherwise. Lags were included to reduce serial correlation.
We interpret the coefficients as follows: The coefficient τ measures the average change
in forecast dispersion of the interbank rate over time and φ measures the additional change in
cross-sectional forecast dispersion over time since 1997. The coefficient δ measures the
additional shift in average forecast dispersion since 1997. If the reforms since 1997 reduced
agents’ forecast uncertainty, we expect a negative coefficient for δ and φ. The estimation results
are shown in table 3 below:
Table 3: Cross sectional interbank rate forecast dispersion
Variable jc j j j j 2R
3mRange 0.464
(8.27)
-
0.264
(3.82)
-0.002
(-1.80)
0.0007
(0.71)
0.27
3mSD 0.160
(5.00)
- 0.412
(3.75)
-0.001
(-2.37)
0.0006
(1.98)
0.27
annualRange 1.168
(4.99)
-0.450
(-2.52)
0.410
(4.68)
-0.012
(-2.69)
0.011
(2.36)
0.62
annualSDs 0.398
(9.32)
-0.170
(-4.75)
0.521
(10.28)
-0.005
(-5.22)
0.004
(4.77)
0.76
All equations are estimated with OLS and the t-values in brackets are calculated on the basis of Newy-West
adjusted variance and covariances. Only the first lag of the dependent variable was significant in all estimations. ‘-‘
indicates that the variable was insignificant and is therefore not reported here.
We find that between 27 and 76 percent of the average variation in the dispersion measures are
explained by the estimated equations. Further, all estimations show that cross-sectional
dispersion of private sector forecasters’ projections has fallen over time throughout the entire
4 See also Bell (2005)

12
sample period (just so for the 3-month interbank rate range). This trend was however reduced
since 1997 (with the exception of the 3-month interbank rate range). For instance, while the
cross-sectional forecast standard deviation (over the 3-month forecast horizon) fell over time on
average by 0.001 percentage points per month over the entire sample period, it only fell by
0.0004 percentage points since June 1997. The results for the annual forecast horizon are similar
in this respect. However, we additionally have a significant and quite large downward shift in
average forecast dispersion over the period since 1997, which overcompensates for the small
trend increase in the same period. Even though the evidence is not very clear for the dispersion
of the 3-month ahead forecast spread, there is clear evidence that the diversity of the one-year
ahead forecast spread has been much smaller post 1997.
5. Macroeconomic uncertainty
It is possible that the fall in agents’ uncertainty since 1997 is due to other factors besides central
bank institutional reforms and transparency (or at least whether ‘transparency in practice’ may
have its origins in something quite separate from institutional reforms). For example, it is fairly
well-known that in setting interest rates central banks are heavily influenced by the current
inflation trend and estimates of the output gap. Furthermore, given the accumulated evidence
(from independent researchers) that central bank interest rate setting is quite well approximated
by a simple Taylor-type rule, one might argue that this information has entered the public
domain, more or less independently of any steps taken by central banks deliberately to inform
agents.5 Now suppose it were the case that agents have, for whatever reason, found it easier to
forecast future inflation rates. Given knowledge of the central bank’s reaction function, one
might expect this to give them some significant advantage in predicting near-term policy rate
changes. In other words, the increased consensus about interest rate movements may be
explained by an increased consensus over inflation trends. And if this were the case, we might
be reluctant to put this down to deliberate reforms aimed at increased transparency, for reasons
we have just explained.
The question for this section therefore is whether uncertainty in forecasting inflation has
coincided with the reduction in uncertainty over interest rates since 1997. If so, then the latter
may, at least to some degree, be explained by the fall in forecast uncertainty in inflation
forecasts.
The data we use are monthly one year ahead cross sectional forecasts of inflation
published by Consensus Forecasts over the period from January 1994 until May 2004.
5 For some insights into how investment banks try to anticipate central bank policy decisions see Doménech et al
(2000 and 2001).
13
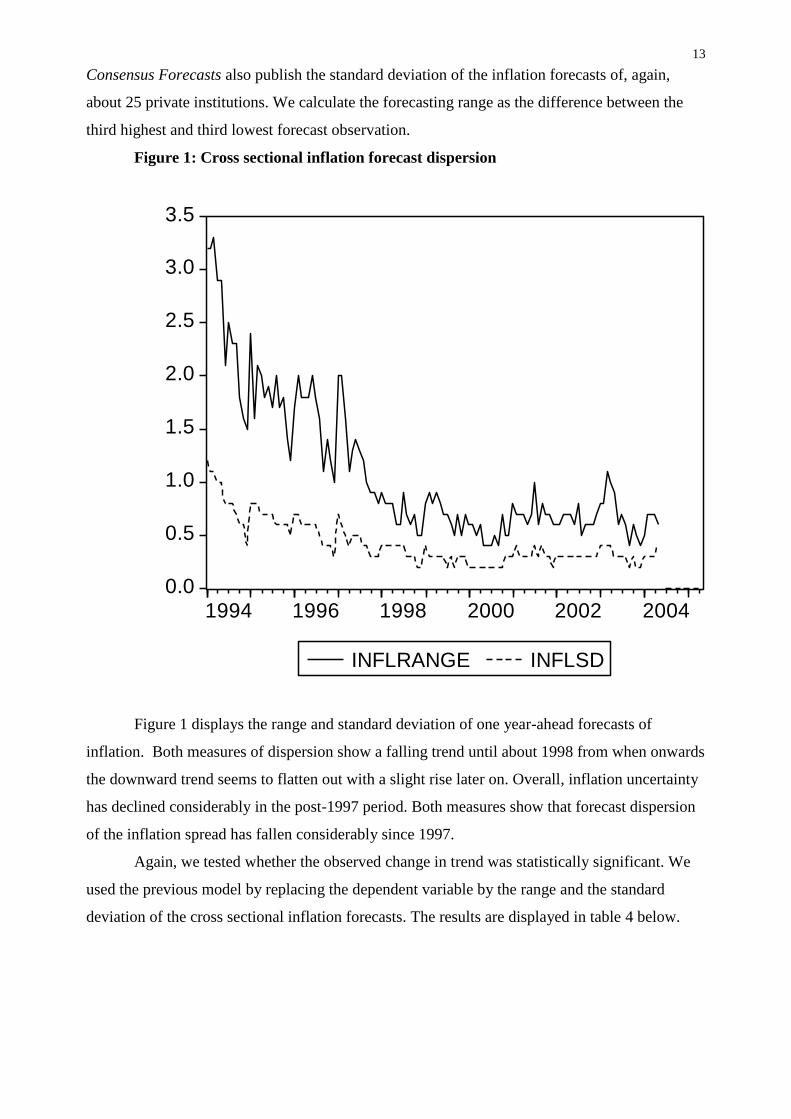
Consensus Forecasts also publish the standard deviation of the inflation forecasts of, again,
about 25 private institutions. We calculate the forecasting range as the difference between the
third highest and third lowest forecast observation.
Figure 1: Cross sectional inflation forecast dispersion
0.0
0.5
1.0
1.5
2.0
2.5
3.0
3.5
1994 1996 1998 2000 2002 2004
INFLRANGE INFLSD
Figure 1 displays the range and standard deviation of one year-ahead forecasts of
inflation. Both measures of dispersion show a falling trend until about 1998 from when onwards
the downward trend seems to flatten out with a slight rise later on. Overall, inflation uncertainty
has declined considerably in the post-1997 period. Both measures show that forecast dispersion
of the inflation spread has fallen considerably since 1997.
Again, we tested whether the observed change in trend was statistically significant. We
used the previous model by replacing the dependent variable by the range and the standard
deviation of the cross sectional inflation forecasts. The results are displayed in table 4 below.
14
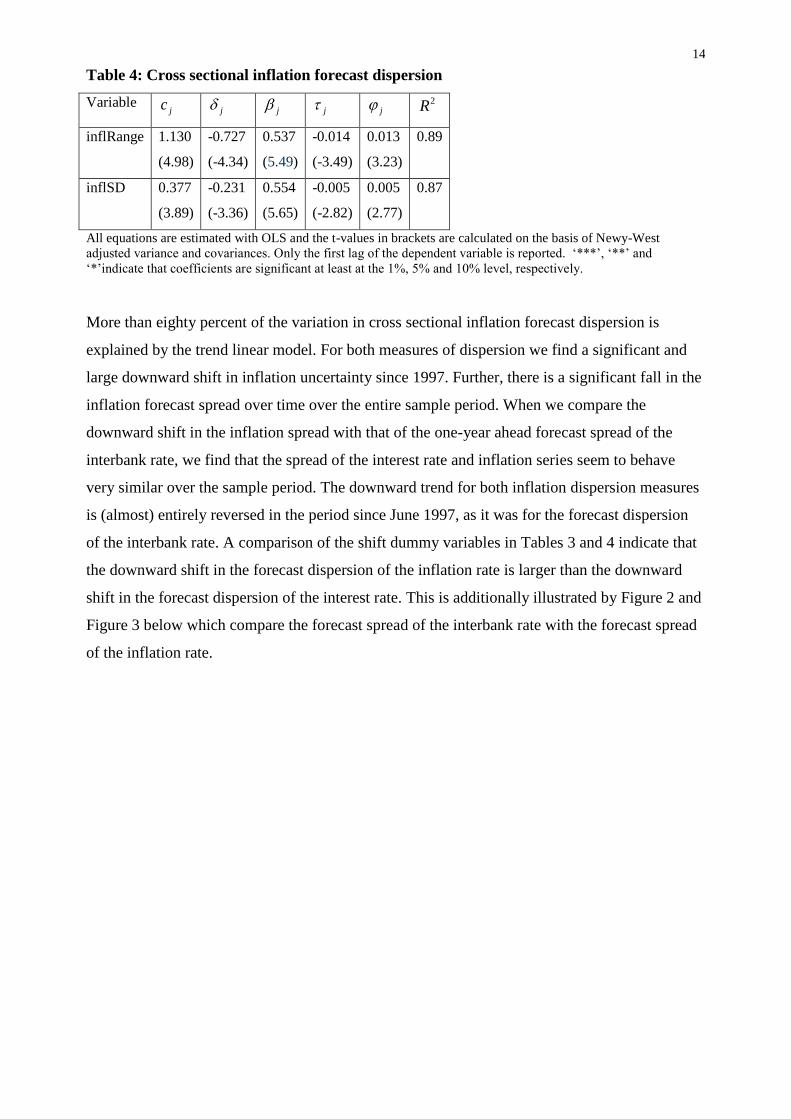
Table 4: Cross sectional inflation forecast dispersion
Variable jc j j j j 2R
inflRange 1.130
(4.98)
-0.727
(-4.34)
0.537
(5.49)
-0.014
(-3.49)
0.013
(3.23)
0.89
inflSD 0.377
(3.89)
-0.231
(-3.36)
0.554
(5.65)
-0.005
(-2.82)
0.005
(2.77)
0.87
All equations are estimated with OLS and the t-values in brackets are calculated on the basis of Newy-West
adjusted variance and covariances. Only the first lag of the dependent variable is reported. ‘***’, ‘**’ and
‘*’indicate that coefficients are significant at least at the 1%, 5% and 10% level, respectively.
More than eighty percent of the variation in cross sectional inflation forecast dispersion is
explained by the trend linear model. For both measures of dispersion we find a significant and
large downward shift in inflation uncertainty since 1997. Further, there is a significant fall in the
inflation forecast spread over time over the entire sample period. When we compare the
downward shift in the inflation spread with that of the one-year ahead forecast spread of the
interbank rate, we find that the spread of the interest rate and inflation series seem to behave
very similar over the sample period. The downward trend for both inflation dispersion measures
is (almost) entirely reversed in the period since June 1997, as it was for the forecast dispersion
of the interbank rate. A comparison of the shift dummy variables in Tables 3 and 4 indicate that
the downward shift in the forecast dispersion of the inflation rate is larger than the downward
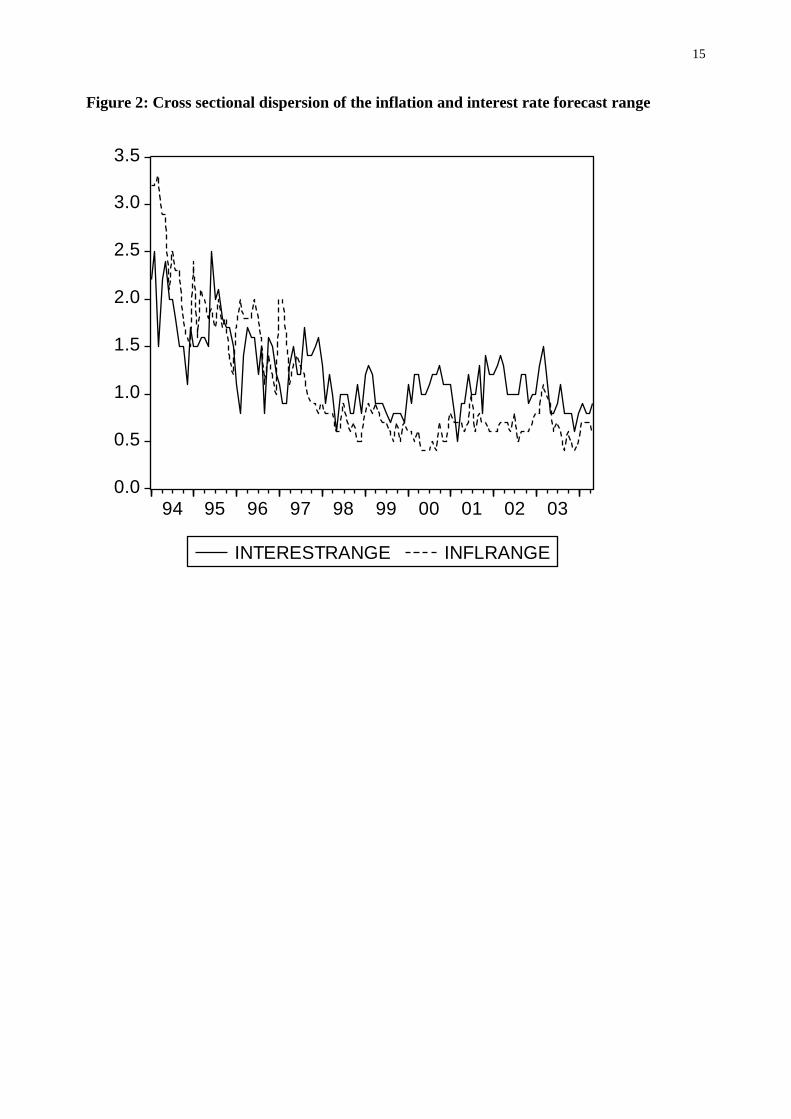
shift in the forecast dispersion of the interest rate. This is additionally illustrated by Figure 2 and
Figure 3 below which compare the forecast spread of the interbank rate with the forecast spread
of the inflation rate.
15
Figure 2: Cross sectional dispersion of the inflation and interest rate forecast range
0.0
0.5
1.0
1.5
2.0
2.5
3.0
3.5
94 95 96 97 98 99 00 01 02 03
INTERESTRANGE INFLRANGE
16
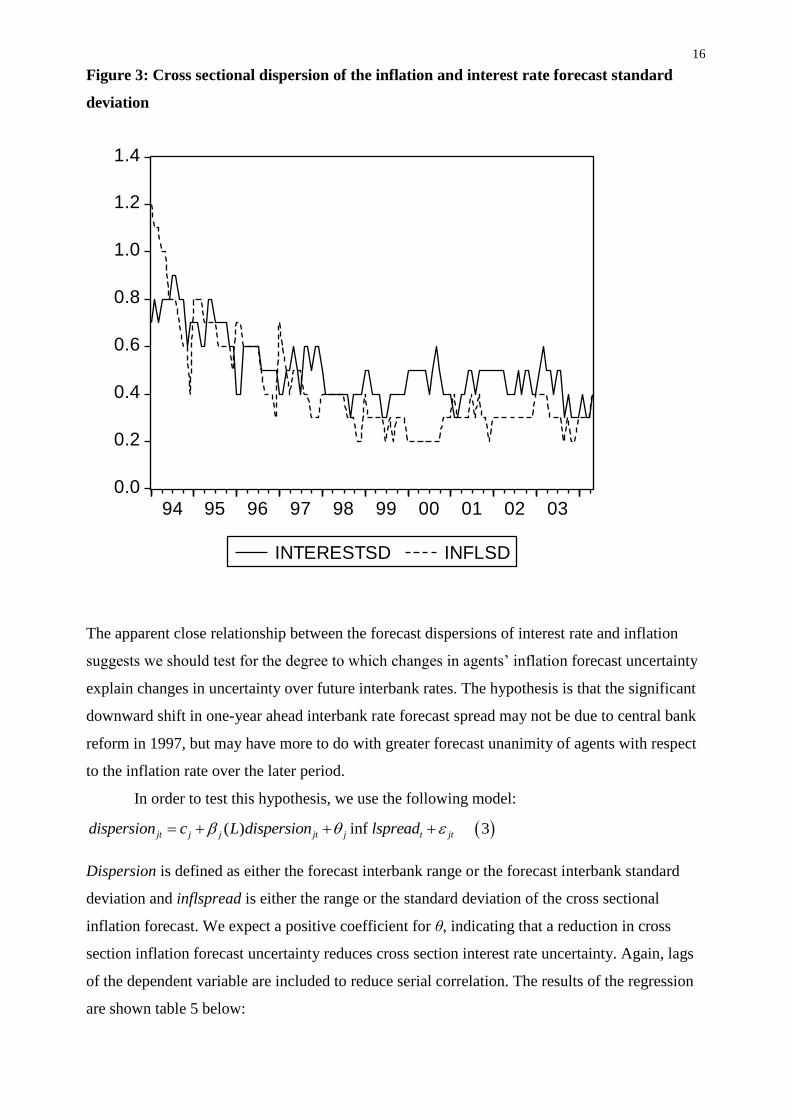
Figure 3: Cross sectional dispersion of the inflation and interest rate forecast standard
deviation
0.0
0.2
0.4
0.6
0.8
1.0
1.2
1.4
94 95 96 97 98 99 00 01 02 03
INTERESTSD INFLSD
The apparent close relationship between the forecast dispersions of interest rate and inflation
suggests we should test for the degree to which changes in agents’ inflation forecast uncertainty
explain changes in uncertainty over future interbank rates. The hypothesis is that the significant
downward shift in one-year ahead interbank rate forecast spread may not be due to central bank
reform in 1997, but may have more to do with greater forecast unanimity of agents with respect
to the inflation rate over the later period.
In order to test this hypothesis, we use the following model:
( ) inf 3jt j j jt j t jtdispersion c L dispersion lspread
Dispersion is defined as either the forecast interbank range or the forecast interbank standard
deviation and inflspread is either the range or the standard deviation of the cross sectional
inflation forecast. We expect a positive coefficient for θ, indicating that a reduction in cross
section inflation forecast uncertainty reduces cross section interest rate uncertainty. Again, lags
of the dependent variable are included to reduce serial correlation. The results of the regression
are shown table 5 below:
17
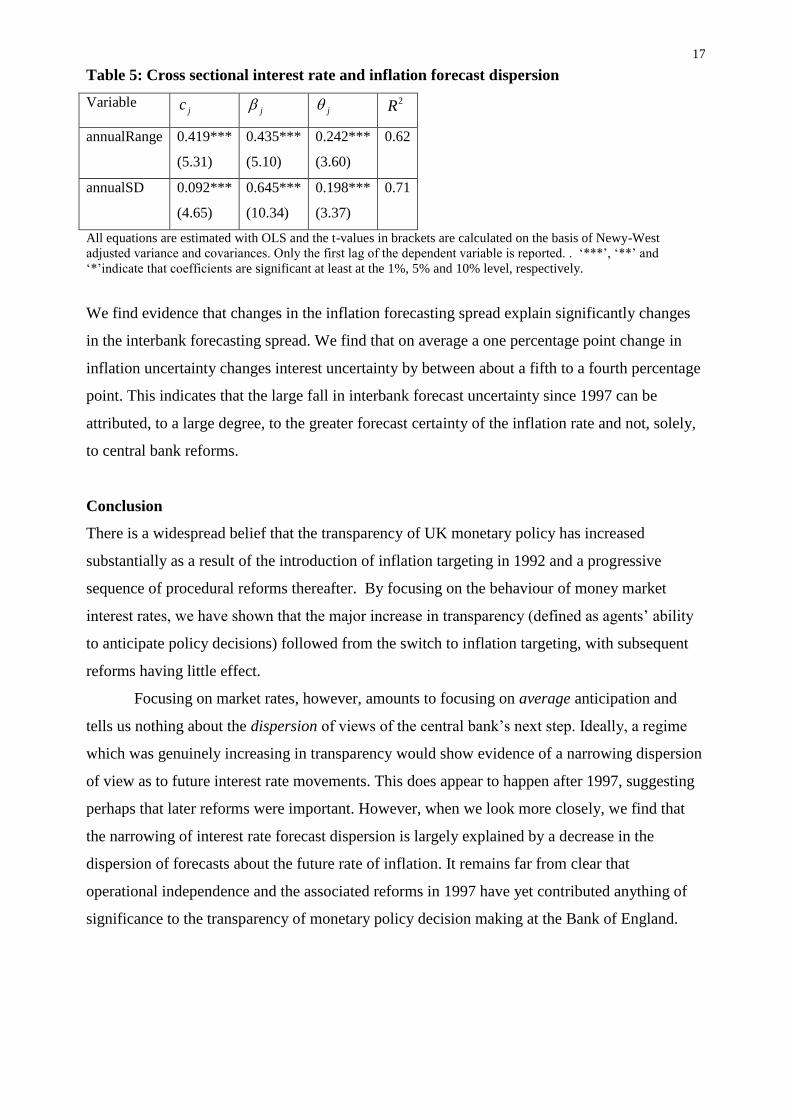
Table 5: Cross sectional interest rate and inflation forecast dispersion
Variable jc j j 2R
annualRange 0.419***
(5.31)
0.435***
(5.10)
0.242***
(3.60)
0.62
annualSD 0.092***
(4.65)
0.645***
(10.34)
0.198***
(3.37)
0.71
All equations are estimated with OLS and the t-values in brackets are calculated on the basis of Newy-West
adjusted variance and covariances. Only the first lag of the dependent variable is reported. . ‘***’, ‘**’ and
‘*’indicate that coefficients are significant at least at the 1%, 5% and 10% level, respectively.
We find evidence that changes in the inflation forecasting spread explain significantly changes
in the interbank forecasting spread. We find that on average a one percentage point change in
inflation uncertainty changes interest uncertainty by between about a fifth to a fourth percentage
point. This indicates that the large fall in interbank forecast uncertainty since 1997 can be
attributed, to a large degree, to the greater forecast certainty of the inflation rate and not, solely,
to central bank reforms.
Conclusion
There is a widespread belief that the transparency of UK monetary policy has increased
substantially as a result of the introduction of inflation targeting in 1992 and a progressive
sequence of procedural reforms thereafter. By focusing on the behaviour of money market
interest rates, we have shown that the major increase in transparency (defined as agents’ ability
to anticipate policy decisions) followed from the switch to inflation targeting, with subsequent
reforms having little effect.
Focusing on market rates, however, amounts to focusing on average anticipation and
tells us nothing about the dispersion of views of the central bank’s next step. Ideally, a regime
which was genuinely increasing in transparency would show evidence of a narrowing dispersion
of view as to future interest rate movements. This does appear to happen after 1997, suggesting
perhaps that later reforms were important. However, when we look more closely, we find that
the narrowing of interest rate forecast dispersion is largely explained by a decrease in the
dispersion of forecasts about the future rate of inflation. It remains far from clear that
operational independence and the associated reforms in 1997 have yet contributed anything of
significance to the transparency of monetary policy decision making at the Bank of England.
18
References
Alesina A and Summers L (1993) ‘Central Bank Independence and Macroeconomic Performance: some
comparative evidence’, Journal of Money, Credit and Banking, 25, 151-22.
Bean C (2005) ‘Monetary Policy in an Uncertain World’, Bank of England Quarterly Bulletin, 45 (1), 80-
91.
Bell J (2005) ‘Monetary policy news and market reaction to the Inflation Report and MPC Minutes’,
Bank of England Quarterly Bulletin, 45 (2), 169-78.
Bini-Smaghi, L and Gros, D (2000) Open Issues in European Central Banking (London: Macmillan).
Caporale, M C and Cipollini, A (2001) ‘The euro and monetary transparency’, discussion paper, South
Bank University.
Chadha, J and Nolan, C (2001) ‘Inflation Targeting, Transparency and Interest Rate Volatility: Ditching
‘Monetary Mystique’ in the UK’, Journal of Macroeconomics, 23. √
Chortareas G, Stasavage D and Sterne G (2003) ‘Does Monetary Policy Transparency Reduce
Disinflation Costs?’, Manchester School, 71 (5), September, 521-40.
Clare, A and Courtenay, R (2001), ‘Assessing the impact of macroeconomic news announcements on
securities prices under different monetary policy regimes’, Bank of England Working Paper no.125.
Cook, T and Hahn, T (1989), ‘The Effect of Changes in the Federal Funds Rate Target on Market Interest
Rates in the 1970s’, Journal of Monetary Economics, 24, 331-51.
De Haan, J. and Amtenbrink, F. (2002) A Non-Transparent European Central Bank? Who is to blame?
Paper given at the conference on Monetary Policy Transparency, held at the Bank of England, 10 May
2002.
Doménech R, Ledo M and Taguas D (2000) ‘Some new results on interest rate rules in the EMU and in
theUS’, BBVA working paper, 2/2000
Doménech R, Ledo M and Taguas D (2001) ‘A small forward-looking macroeconomic model for the
EMU’ BBVA working paper, 2/2001

19
Eijffinger, S. C. W. and Geraats, P. M. (2002) How Transparent are Central Banks? Paper given at the
conference on Monetary Policy Transparency, held at the Bank of England, 10 May 2002.
Fry M, Julius D, Mahadeva L, Roger S, and Sterne G (2000) ‘Key Issues in the Choice of Monetary
Policy Framework’, in L Mahadeva and G Sterne, Monetary Policy Frameworks in a Global Context,
(London: Routledge)
Geraats P M (2002) ‘Central Bank Transparency’, Economic Journal, 112, No.483, 532-565
Hahn V (2002) ‘Central Bank Transparency: A Survey’, Ifo-Studien, 48(3), 429-455
Haldane A G and Read V (2000) ‘Monetary policy surprises and the yield curve’, Bank of England
Working Paper no. 102.
Hardy, D C (1998) Anticipation and surprises in central bank interest rate policy: The case of the
Bundesbank, IMF working paper 98/43
King M (1997) ‘The inflation target five years on’, Bank of England Quarterly Bulletin, 37 (4), 431-42.
Kuttner K N (2001) ‘Monetary Policy Surprises and Interest Rates: Evidence from the Fed Funds Futures
Market’, Journal of Monetary Economics, June 2001, 47(3), 523-44.
Lasaosa A (2005) ‘Learning the rules of the new game? Comparing the reactions in financial markets to
announcements before and after the Bank of England’s operational independence’ Bank of England
Working Paper no. 255
Lombardelli, C, Thompson, J and Proudman, J (2002), ‘Committees versus individuals: an experimental
analysis of monetary policy decision-making’, Bank of England Working Paper no.165.
Panigirtzoglou N, Proudman J and Spicer J (2000) ‘Persistence and volatility in short-term interest
rates’, Bank of England, working paper.
Poole W, Rasche R H and Thornton D L (2002) ‘Market Anticipations of Monetary Policy Actions’, The
Federal Reserve Bank of St Louis Review, 84(4), 65-94.
Svensson L E O (1997) ‘Inflation Forecast Targeting: Implementing and Monitoring Inflation Targets’,
European Economic Review, 41 (1997), 1111-1146.

20
Thornton D L (2003) ‘Monetary Policy Transparency: Transparent for what?’, Manchester School, 71 (5)
Wadhwani S B (2001) ‘Some reflections on the MPC’, Bank of England Quarterly Bulletin, 41 (3), 351-
56.