Bie bv l-260215
24
Faculty of Business and Economics Faculty of Business and Economics BI-ELAT EVENT EINDHOVEN 26-02-2015 Alberto Peretti, University of Pisa Elisa Van Den Bosch, KU Leuven Jan Demol, KU Leuven Xiaoyan Song, Ecoom, KU Leuven Prof. Bart Van Looy, KU Leuven (Faculty of Economics & Business; Department MSI)
-
Upload
stichting-bielat -
Category
Economy & Finance
-
view
146 -
download
0
Transcript of Bie bv l-260215
Faculty of Business and Economics Faculty of Business and Economics
BI-ELAT EVENT EINDHOVEN 26-02-2015 Alberto Peretti, University of Pisa Elisa Van Den Bosch, KU Leuven Jan Demol, KU Leuven Xiaoyan Song, Ecoom, KU Leuven Prof. Bart Van Looy, KU Leuven (Faculty of Economics & Business; Department MSI)
Faculty of Business and Economics
Content
Stylized Facts & Figures (Technology) • Overall Ranking ELAT regions (1990 – 2012) • Texture & Main players • Profile (Specialization – Relative strengths) • Collaboration patterns
Conclusions
Faculty of Business and Economics
Data
• EPO Applications
• Time period: 1990 – 2010/2012
• Allocation (to regions): based on inventor and/or applicant
• Total numbers versus Normalized figures (per capita)
• Specialization profiles: based on ISI FhG Technology classification (n= 35) – RTA indices
• Collaboration: Salton measure (and absolute measures)
• EU27: Nuts2 Regions (Total: 322) – with ‘visible’ patent activity: 265 (hence: Top 25 ~ Pc. 90)

Faculty of Business and Economics
Overall Ranking (Absolute : 1/2) Rank 1990 1995 2000 2005 08+09+10+11+12 CAPITA 2012
1 Île de France Île de France Île de France Île de France Île de France 11,916,978.00 2 Düsseldorf Darmstadt Oberbayern Stuttgart Stuttgart 4,016,012.00 3 Darmstadt Düsseldorf Stuttgart Oberbayern Oberbayern 4,430,706.00 4 Oberbayern Oberbayern Darmstadt Karlsruhe Karlsruhe 2,751,907.00 5 Köln Stuttgart Düsseldorf Darmstadt Düsseldorf 5,157,467.00 6 Stuttgart Köln Köln Köln Darmstadt 3,835,592.00 7 Karlsruhe Karlsruhe Karlsruhe Noord-‐Brabant Rhône-‐Alpes 6,339,521.00 8 Rheinhessen-‐Pfalz Rheinhessen-‐Pfalz Noord-‐Brabant Düsseldorf Köln 4,407,275.00 9 Lombardia Rhône-‐Alpes Rheinhessen-‐Pfalz Rhône-‐Alpes Noord-‐Brabant 2,463,686.00 10 Rhône-‐Alpes Lombardia Lombardia Rheinhessen-‐Pfalz Lombardia 9,700,881.00 11 Noord-‐Brabant Freiburg Rhône-‐Alpes Lombardia Freiburg 2,207,106.00 12 Freiburg Arnsberg Freiburg Freiburg Rheinhessen-‐Pfalz 2,008,840.00 13 Arnsberg Noord-‐Brabant Arnsberg Tübingen Tübingen 1,811,202.00 14 Mittelfranken Tübingen Tübingen Mittelfranken Mittelfranken 1,719,494.00 15 Tübingen Mittelfranken Mittelfranken Arnsberg Arnsberg 3,645,437.00 16 Piemonte Stockholm Stockholm Berlin Berlin 3,501,872.00 17 Münster Emilia-‐Romagna Helsinki-‐Uusimaa Stockholm Stockholm 2,091,473.00 18 Berkshire, Buckinghamshire and OxfordshireSchwaben Braunschweig Unterfranken Schwaben 1,789,294.00 19 Schwaben Berkshire, Buckinghamshire and OxfordshireBerlin Emilia-‐Romagna Detmold 2,034,163.00 20 Zuid-‐Holland Münster Berkshire, Buckinghamshire and OxfordshireHelsinki-‐Uusimaa Münster 2,597,614.00 21 Berlin Zuid-‐Holland Schwaben Schwaben Emilia-‐Romagna 4,341,240.00 22 Hannover Piemonte Emilia-‐Romagna Hovedstaden Helsinki-‐Uusimaa 1,549,058.00 23 Bedfordshire and HertfordshireBerlin Hannover Münster Unterfranken 1,314,910.00 24 Emilia-‐Romagna East Anglia East Anglia Piemonte Hannover 2,137,489.00 25 Schleswig-‐Holstein Unterfranken Münster Surrey, East and West SussexBerkshire, Buckinghamshire and Oxfordshire2,285,445.00 26 Surrey, East and West SussexHelsinki-‐Uusimaa Detmold East Anglia Provence-‐Alpes-‐Côte d'Azur 4,927,578.00 27 Provence-‐Alpes-‐Côte d'AzurHovedstaden Unterfranken Berkshire, Buckinghamshire and OxfordshireOberpfalz 1,081,536.00 28 Stockholm Prov Antwerpen Zuid-‐Holland Zuid-‐Holland Schleswig-‐Holstein 2,837,641.00 29 East Anglia Hamburg Hovedstaden Veneto Zuid-‐Holland 3,552,407.00
Faculty of Business and Economics
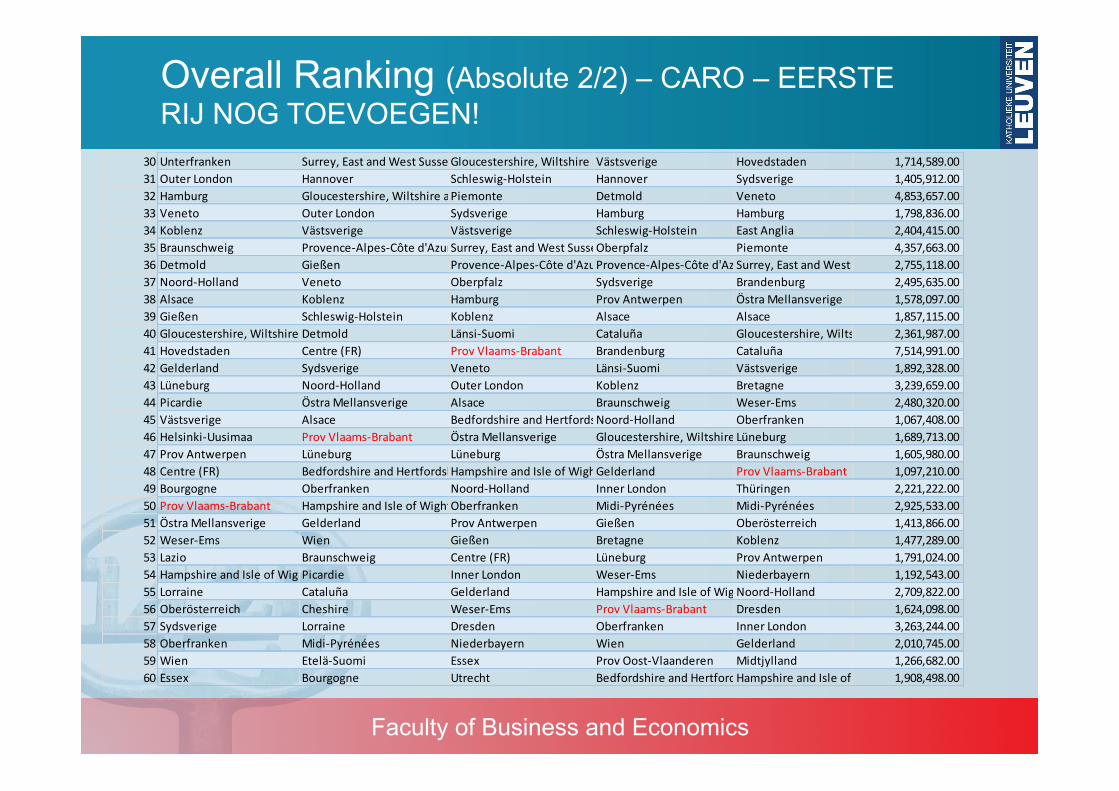
Overall Ranking (Absolute 2/2) – CARO – EERSTE RIJ NOG TOEVOEGEN!
30 Unterfranken Surrey, East and West SussexGloucestershire, Wiltshire and Bristol/Bath areaVästsverige Hovedstaden 1,714,589.00 31 Outer London Hannover Schleswig-‐Holstein Hannover Sydsverige 1,405,912.00 32 Hamburg Gloucestershire, Wiltshire and Bristol/Bath areaPiemonte Detmold Veneto 4,853,657.00 33 Veneto Outer London Sydsverige Hamburg Hamburg 1,798,836.00 34 Koblenz Västsverige Västsverige Schleswig-‐Holstein East Anglia 2,404,415.00 35 Braunschweig Provence-‐Alpes-‐Côte d'AzurSurrey, East and West SussexOberpfalz Piemonte 4,357,663.00 36 Detmold Gießen Provence-‐Alpes-‐Côte d'AzurProvence-‐Alpes-‐Côte d'AzurSurrey, East and West Sussex 2,755,118.00 37 Noord-‐Holland Veneto Oberpfalz Sydsverige Brandenburg 2,495,635.00 38 Alsace Koblenz Hamburg Prov Antwerpen Östra Mellansverige 1,578,097.00 39 Gießen Schleswig-‐Holstein Koblenz Alsace Alsace 1,857,115.00 40 Gloucestershire, Wiltshire and Bristol/Bath areaDetmold Länsi-‐Suomi Cataluña Gloucestershire, Wiltshire and Bristol/Bath area2,361,987.00 41 Hovedstaden Centre (FR) Prov Vlaams-‐Brabant Brandenburg Cataluña 7,514,991.00 42 Gelderland Sydsverige Veneto Länsi-‐Suomi Västsverige 1,892,328.00 43 Lüneburg Noord-‐Holland Outer London Koblenz Bretagne 3,239,659.00 44 Picardie Östra Mellansverige Alsace Braunschweig Weser-‐Ems 2,480,320.00 45 Västsverige Alsace Bedfordshire and HertfordshireNoord-‐Holland Oberfranken 1,067,408.00 46 Helsinki-‐Uusimaa Prov Vlaams-‐Brabant Östra Mellansverige Gloucestershire, Wiltshire and Bristol/Bath areaLüneburg 1,689,713.00 47 Prov Antwerpen Lüneburg Lüneburg Östra Mellansverige Braunschweig 1,605,980.00 48 Centre (FR) Bedfordshire and HertfordshireHampshire and Isle of WightGelderland Prov Vlaams-‐Brabant 1,097,210.00 49 Bourgogne Oberfranken Noord-‐Holland Inner London Thüringen 2,221,222.00 50 Prov Vlaams-‐Brabant Hampshire and Isle of WightOberfranken Midi-‐Pyrénées Midi-‐Pyrénées 2,925,533.00 51 Östra Mellansverige Gelderland Prov Antwerpen Gießen Oberösterreich 1,413,866.00 52 Weser-‐Ems Wien Gießen Bretagne Koblenz 1,477,289.00 53 Lazio Braunschweig Centre (FR) Lüneburg Prov Antwerpen 1,791,024.00 54 Hampshire and Isle of WightPicardie Inner London Weser-‐Ems Niederbayern 1,192,543.00 55 Lorraine Cataluña Gelderland Hampshire and Isle of WightNoord-‐Holland 2,709,822.00 56 Oberösterreich Cheshire Weser-‐Ems Prov Vlaams-‐Brabant Dresden 1,624,098.00 57 Sydsverige Lorraine Dresden Oberfranken Inner London 3,263,244.00 58 Oberfranken Midi-‐Pyrénées Niederbayern Wien Gelderland 2,010,745.00 59 Wien Etelä-‐Suomi Essex Prov Oost-‐Vlaanderen Midtjylland 1,266,682.00 60 Essex Bourgogne Utrecht Bedfordshire and HertfordshireHampshire and Isle of Wight 1,908,498.00
Faculty of Business and Economics
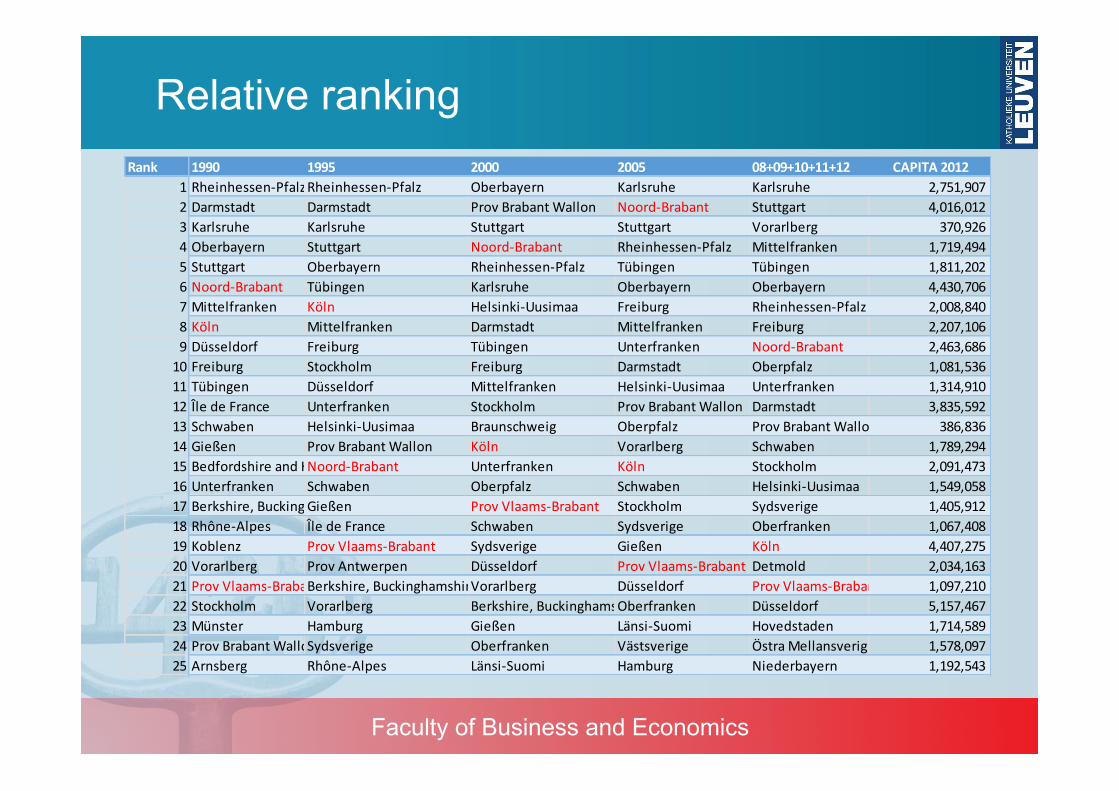
Relative ranking Rank 1990 1995 2000 2005 08+09+10+11+12 CAPITA 2012
1 Rheinhessen-‐PfalzRheinhessen-‐Pfalz Oberbayern Karlsruhe Karlsruhe 2,751,907 2 Darmstadt Darmstadt Prov Brabant Wallon Noord-‐Brabant Stuttgart 4,016,012 3 Karlsruhe Karlsruhe Stuttgart Stuttgart Vorarlberg 370,926 4 Oberbayern Stuttgart Noord-‐Brabant Rheinhessen-‐Pfalz Mittelfranken 1,719,494 5 Stuttgart Oberbayern Rheinhessen-‐Pfalz Tübingen Tübingen 1,811,202 6 Noord-‐Brabant Tübingen Karlsruhe Oberbayern Oberbayern 4,430,706 7 Mittelfranken Köln Helsinki-‐Uusimaa Freiburg Rheinhessen-‐Pfalz 2,008,840 8 Köln Mittelfranken Darmstadt Mittelfranken Freiburg 2,207,106 9 Düsseldorf Freiburg Tübingen Unterfranken Noord-‐Brabant 2,463,686 10 Freiburg Stockholm Freiburg Darmstadt Oberpfalz 1,081,536 11 Tübingen Düsseldorf Mittelfranken Helsinki-‐Uusimaa Unterfranken 1,314,910 12 Île de France Unterfranken Stockholm Prov Brabant Wallon Darmstadt 3,835,592 13 Schwaben Helsinki-‐Uusimaa Braunschweig Oberpfalz Prov Brabant Wallon 386,836 14 Gießen Prov Brabant Wallon Köln Vorarlberg Schwaben 1,789,294 15 Bedfordshire and HertfordshireNoord-‐Brabant Unterfranken Köln Stockholm 2,091,473 16 Unterfranken Schwaben Oberpfalz Schwaben Helsinki-‐Uusimaa 1,549,058 17 Berkshire, Buckinghamshire and OxfordshireGießen Prov Vlaams-‐Brabant Stockholm Sydsverige 1,405,912 18 Rhône-‐Alpes Île de France Schwaben Sydsverige Oberfranken 1,067,408 19 Koblenz Prov Vlaams-‐Brabant Sydsverige Gießen Köln 4,407,275 20 Vorarlberg Prov Antwerpen Düsseldorf Prov Vlaams-‐Brabant Detmold 2,034,163 21 Prov Vlaams-‐BrabantBerkshire, Buckinghamshire and OxfordshireVorarlberg Düsseldorf Prov Vlaams-‐Brabant 1,097,210 22 Stockholm Vorarlberg Berkshire, Buckinghamshire and OxfordshireOberfranken Düsseldorf 5,157,467 23 Münster Hamburg Gießen Länsi-‐Suomi Hovedstaden 1,714,589 24 Prov Brabant WallonSydsverige Oberfranken Västsverige Östra Mellansverige 1,578,097 25 Arnsberg Rhône-‐Alpes Länsi-‐Suomi Hamburg Niederbayern 1,192,543
Faculty of Business and Economics
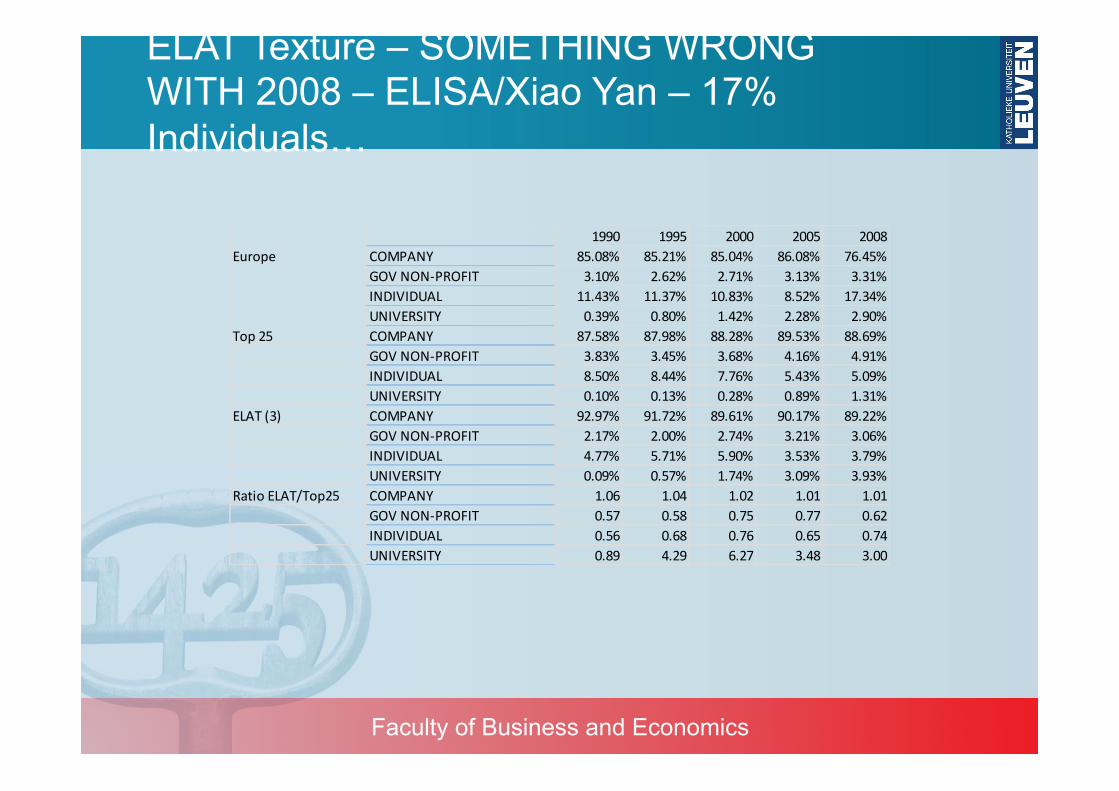
ELAT Texture – SOMETHING WRONG WITH 2008 – ELISA/Xiao Yan – 17% Individuals…
1990 1995 2000 2005 2008Europe COMPANY 85.08% 85.21% 85.04% 86.08% 76.45%
GOV NON-‐PROFIT 3.10% 2.62% 2.71% 3.13% 3.31%INDIVIDUAL 11.43% 11.37% 10.83% 8.52% 17.34%UNIVERSITY 0.39% 0.80% 1.42% 2.28% 2.90%
Top 25 COMPANY 87.58% 87.98% 88.28% 89.53% 88.69%GOV NON-‐PROFIT 3.83% 3.45% 3.68% 4.16% 4.91%INDIVIDUAL 8.50% 8.44% 7.76% 5.43% 5.09%UNIVERSITY 0.10% 0.13% 0.28% 0.89% 1.31%
ELAT (3) COMPANY 92.97% 91.72% 89.61% 90.17% 89.22%GOV NON-‐PROFIT 2.17% 2.00% 2.74% 3.21% 3.06%INDIVIDUAL 4.77% 5.71% 5.90% 3.53% 3.79%UNIVERSITY 0.09% 0.57% 1.74% 3.09% 3.93%
Ratio ELAT/Top25 COMPANY 1.06 1.04 1.02 1.01 1.01GOV NON-‐PROFIT 0.57 0.58 0.75 0.77 0.62INDIVIDUAL 0.56 0.68 0.76 0.65 0.74UNIVERSITY 0.89 4.29 6.27 3.48 3.00

Faculty of Business and Economics
Elat Texture: Different profiles
BE24 COMPANY 68% 55% 48% 53% 60%GOV NON-‐PROFIT 5% 5% 2% 0% 0%INDIVIDUAL 22% 14% 6% 4% 2%UNIVERSITY 5% 27% 43% 43% 38%
DEA2 COMPANY 90% 89% 83% 78% 82%GOV NON-‐PROFIT 4% 3% 6% 11% 7%INDIVIDUAL 6% 8% 11% 10% 8%UNIVERSITY 0% 0% 0% 1% 3%
NL41 COMPANY 98% 98% 98% 98% 98%GOV NON-‐PROFIT 0% 0% 0% 0% 1%INDIVIDUAL 2% 3% 2% 1% 1%UNIVERSITY 0% 0% 0% 0% 0%

Faculty of Business and Economics
Top Applicants Vlaams-Brabant (Inventors)
RANK PUBLN_AUTHELAT 1990-‐2012NUTS2 Name PAT_CNT1 EP ELAT 1990-‐2012 BE24 IMEC (INTERUNIVERSITY MICROELECTRONICS CENTRE) 8922 EP ELAT 1990-‐2012 BE24 ELECTROLUX HOME PRODUCTS CORPORATION 5713 EP ELAT 1990-‐2012 BE24 KATHOLIEKE UNIVERSITEIT LEUVEN 3954 EP ELAT 1990-‐2012 BE24 TYCO ELECTRONICS RAYCHEM 1555 EP ELAT 1990-‐2012 BE24 RAYCHEM CORPORATION 896 EP ELAT 1990-‐2012 BE24 PURATOS 567 EP ELAT 1990-‐2012 BE24 PROTON WORLD INTERNATIONAL 398 EP ELAT 1990-‐2012 BE24 VAILLANT 379 EP ELAT 1990-‐2012 BE24 STMICROELECTRONICS 3110 EP ELAT 1990-‐2012 BE24 LIFE SCIENCES RESEARCH PARTNERS 2711 EP ELAT 1990-‐2012 BE24 REDCO 2512 EP ELAT 1990-‐2012 BE24 AMCOR FLEXIBLES TRANSPAC 2413 EP ELAT 1990-‐2012 BE24 SONY SERVICE CENTRE (EUROPE) 2314 EP ELAT 1990-‐2012 BE24 BAYER CROPSCIENCE 2215 EP ELAT 1990-‐2012 BE24 OPTION 2116 EP ELAT 1990-‐2012 BE24 INBEV 1816 EP ELAT 1990-‐2012 BE24 MATERIALISE 1817 EP ELAT 1990-‐2012 BE24 ICOS VISION SYSTEMS 1718 EP ELAT 1990-‐2012 BE24 PLAKABETON 1619 EP ELAT 1990-‐2012 BE24 D. COLLEN RESEARCH FOUNDATION 1420 EP ELAT 1990-‐2012 BE24 REGA STICHTING VZW. 1020 EP ELAT 1990-‐2012 BE24 THROMBOGENICS 1020 EP ELAT 1990-‐2012 BE24 MATERIALISE DENTAL 10
Faculty of Business and Economics
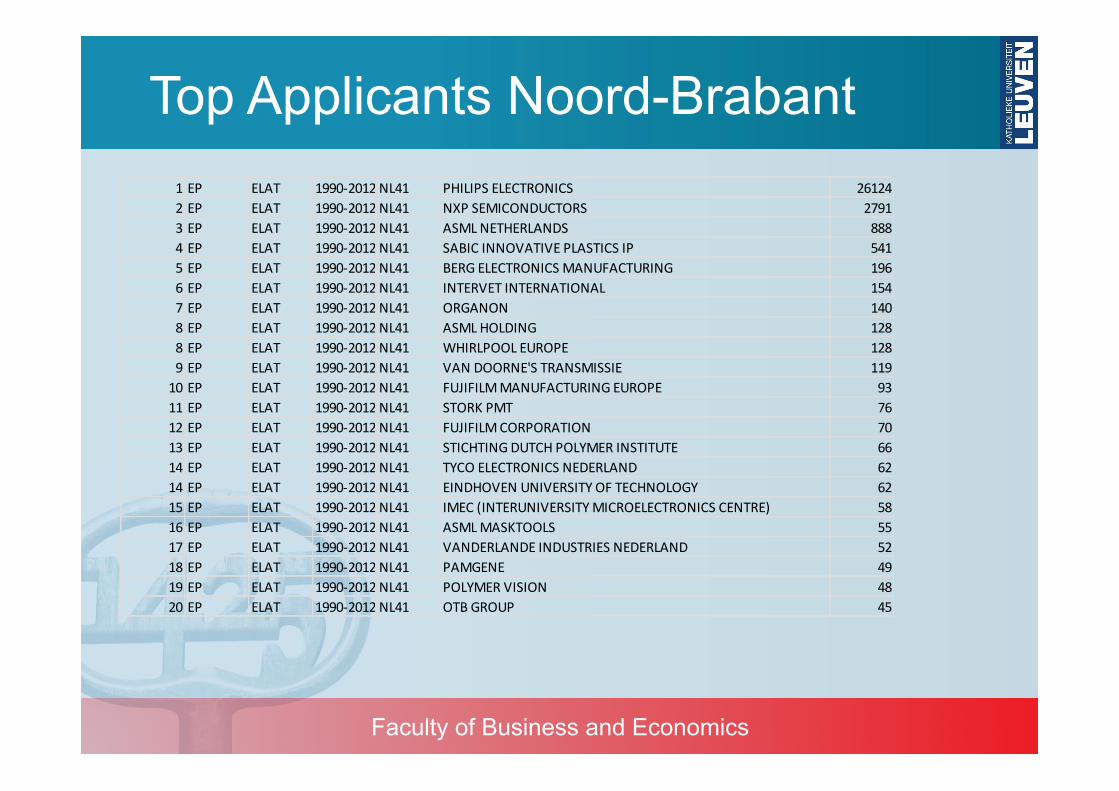
Top Applicants Noord-Brabant 1 EP ELAT 1990-‐2012NL41 PHILIPS ELECTRONICS 261242 EP ELAT 1990-‐2012NL41 NXP SEMICONDUCTORS 27913 EP ELAT 1990-‐2012NL41 ASML NETHERLANDS 8884 EP ELAT 1990-‐2012NL41 SABIC INNOVATIVE PLASTICS IP 5415 EP ELAT 1990-‐2012NL41 BERG ELECTRONICS MANUFACTURING 1966 EP ELAT 1990-‐2012NL41 INTERVET INTERNATIONAL 1547 EP ELAT 1990-‐2012NL41 ORGANON 1408 EP ELAT 1990-‐2012NL41 ASML HOLDING 1288 EP ELAT 1990-‐2012NL41 WHIRLPOOL EUROPE 1289 EP ELAT 1990-‐2012NL41 VAN DOORNE'S TRANSMISSIE 11910 EP ELAT 1990-‐2012NL41 FUJIFILM MANUFACTURING EUROPE 9311 EP ELAT 1990-‐2012NL41 STORK PMT 7612 EP ELAT 1990-‐2012NL41 FUJIFILM CORPORATION 7013 EP ELAT 1990-‐2012NL41 STICHTING DUTCH POLYMER INSTITUTE 6614 EP ELAT 1990-‐2012NL41 TYCO ELECTRONICS NEDERLAND 6214 EP ELAT 1990-‐2012NL41 EINDHOVEN UNIVERSITY OF TECHNOLOGY 6215 EP ELAT 1990-‐2012NL41 IMEC (INTERUNIVERSITY MICROELECTRONICS CENTRE) 5816 EP ELAT 1990-‐2012NL41 ASML MASKTOOLS 5517 EP ELAT 1990-‐2012NL41 VANDERLANDE INDUSTRIES NEDERLAND 5218 EP ELAT 1990-‐2012NL41 PAMGENE 4919 EP ELAT 1990-‐2012NL41 POLYMER VISION 4820 EP ELAT 1990-‐2012NL41 OTB GROUP 45
Faculty of Business and Economics
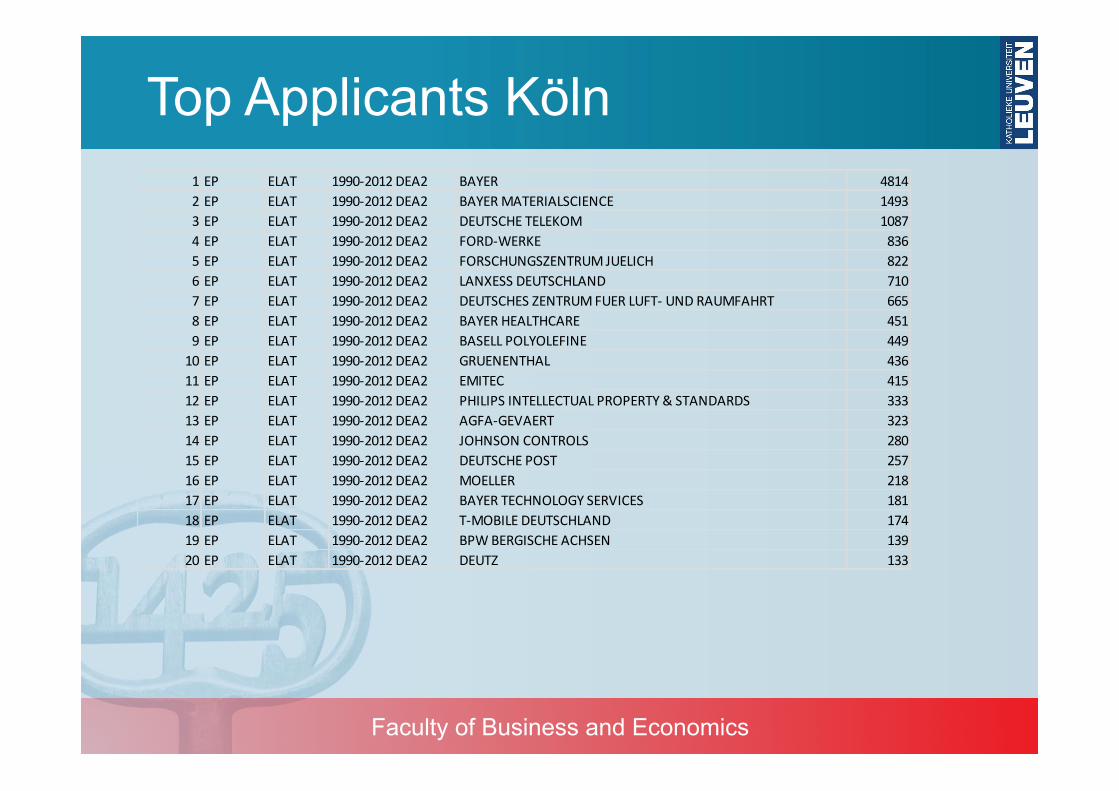
Top Applicants Köln 1 EP ELAT 1990-‐2012DEA2 BAYER 48142 EP ELAT 1990-‐2012DEA2 BAYER MATERIALSCIENCE 14933 EP ELAT 1990-‐2012DEA2 DEUTSCHE TELEKOM 10874 EP ELAT 1990-‐2012DEA2 FORD-‐WERKE 8365 EP ELAT 1990-‐2012DEA2 FORSCHUNGSZENTRUM JUELICH 8226 EP ELAT 1990-‐2012DEA2 LANXESS DEUTSCHLAND 7107 EP ELAT 1990-‐2012DEA2 DEUTSCHES ZENTRUM FUER LUFT-‐ UND RAUMFAHRT 6658 EP ELAT 1990-‐2012DEA2 BAYER HEALTHCARE 4519 EP ELAT 1990-‐2012DEA2 BASELL POLYOLEFINE 44910 EP ELAT 1990-‐2012DEA2 GRUENENTHAL 43611 EP ELAT 1990-‐2012DEA2 EMITEC 41512 EP ELAT 1990-‐2012DEA2 PHILIPS INTELLECTUAL PROPERTY & STANDARDS 33313 EP ELAT 1990-‐2012DEA2 AGFA-‐GEVAERT 32314 EP ELAT 1990-‐2012DEA2 JOHNSON CONTROLS 28015 EP ELAT 1990-‐2012DEA2 DEUTSCHE POST 25716 EP ELAT 1990-‐2012DEA2 MOELLER 21817 EP ELAT 1990-‐2012DEA2 BAYER TECHNOLOGY SERVICES 18118 EP ELAT 1990-‐2012DEA2 T-‐MOBILE DEUTSCHLAND 17419 EP ELAT 1990-‐2012DEA2 BPW BERGISCHE ACHSEN 13920 EP ELAT 1990-‐2012DEA2 DEUTZ 133
Faculty of Business and Economics
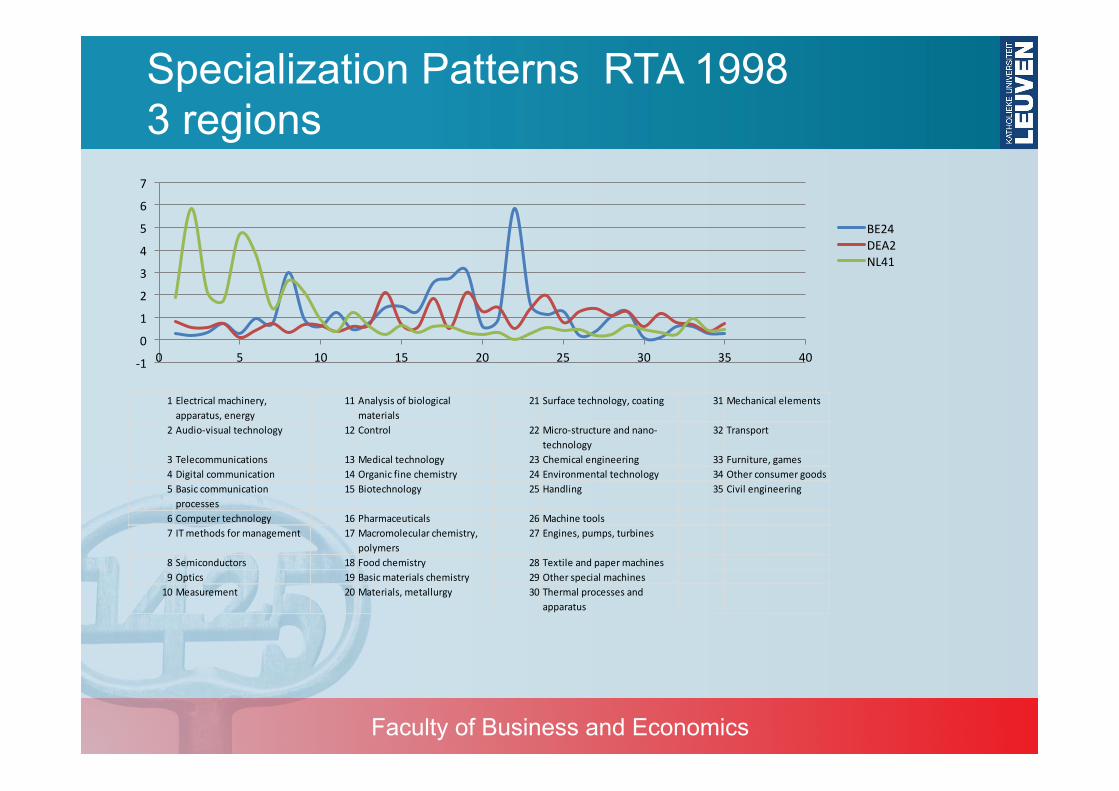
Specialization Patterns RTA 1998 3 regions
-‐1
0
1
2
3
4
5
6
7
0 5 10 15 20 25 30 35 40
BE24 DEA2 NL41
1 Electrical machinery, apparatus, energy
11 Analysis of biological materials
21 Surface technology, coating 31 Mechanical elements
2 Audio-‐visual technology 12 Control 22 Micro-‐structure and nano-‐technology
32 Transport
3 Telecommunications 13 Medical technology 23 Chemical engineering 33 Furniture, games4 Digital communication 14 Organic fine chemistry 24 Environmental technology 34 Other consumer goods5 Basic communication processes
15 Biotechnology 25 Handling 35 Civil engineering
6 Computer technology 16 Pharmaceuticals 26 Machine tools7 IT methods for management 17 Macromolecular chemistry,
polymers27 Engines, pumps, turbines
8 Semiconductors 18 Food chemistry 28 Textile and paper machines9 Optics 19 Basic materials chemistry 29 Other special machines10 Measurement 20 Materials, metallurgy 30 Thermal processes and
apparatus
Faculty of Business and Economics
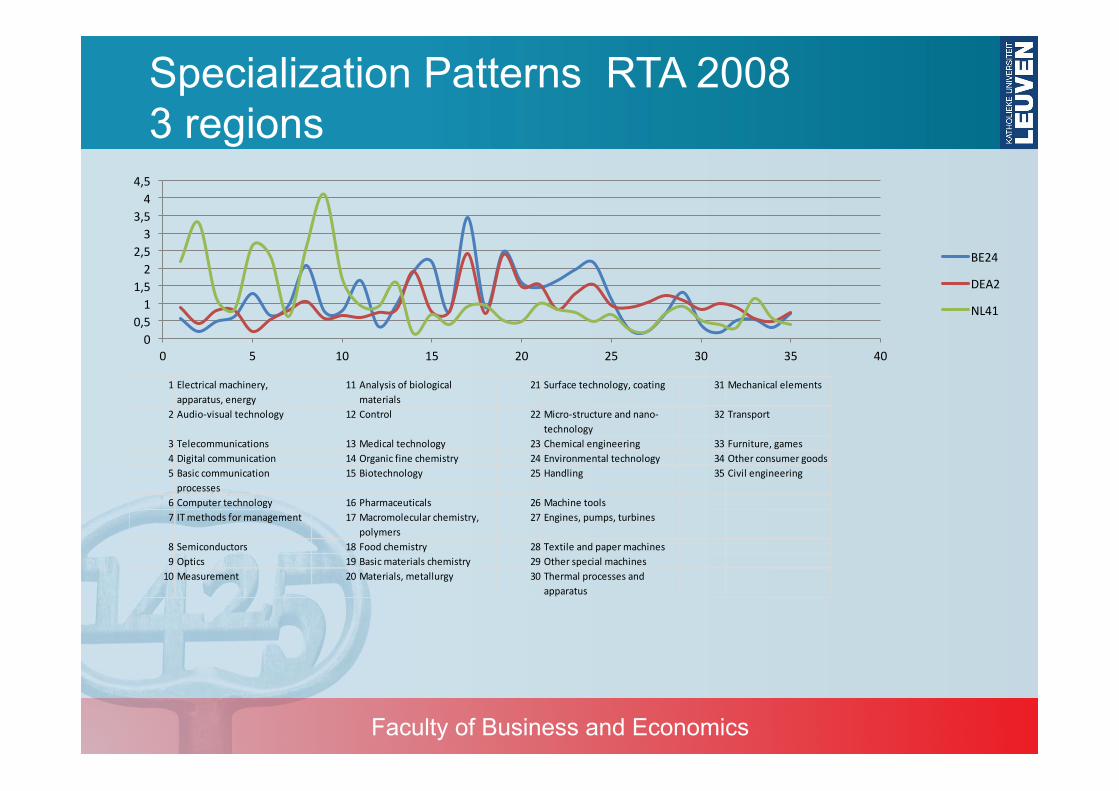
Specialization Patterns RTA 2008 3 regions
0 0,5 1
1,5 2
2,5 3
3,5 4
4,5
0 5 10 15 20 25 30 35 40
BE24
DEA2
NL41
1 Electrical machinery, apparatus, energy
11 Analysis of biological materials
21 Surface technology, coating 31 Mechanical elements
2 Audio-‐visual technology 12 Control 22 Micro-‐structure and nano-‐technology
32 Transport
3 Telecommunications 13 Medical technology 23 Chemical engineering 33 Furniture, games4 Digital communication 14 Organic fine chemistry 24 Environmental technology 34 Other consumer goods5 Basic communication processes
15 Biotechnology 25 Handling 35 Civil engineering
6 Computer technology 16 Pharmaceuticals 26 Machine tools7 IT methods for management 17 Macromolecular chemistry,
polymers27 Engines, pumps, turbines
8 Semiconductors 18 Food chemistry 28 Textile and paper machines9 Optics 19 Basic materials chemistry 29 Other special machines10 Measurement 20 Materials, metallurgy 30 Thermal processes and
apparatus
Faculty of Business and Economics
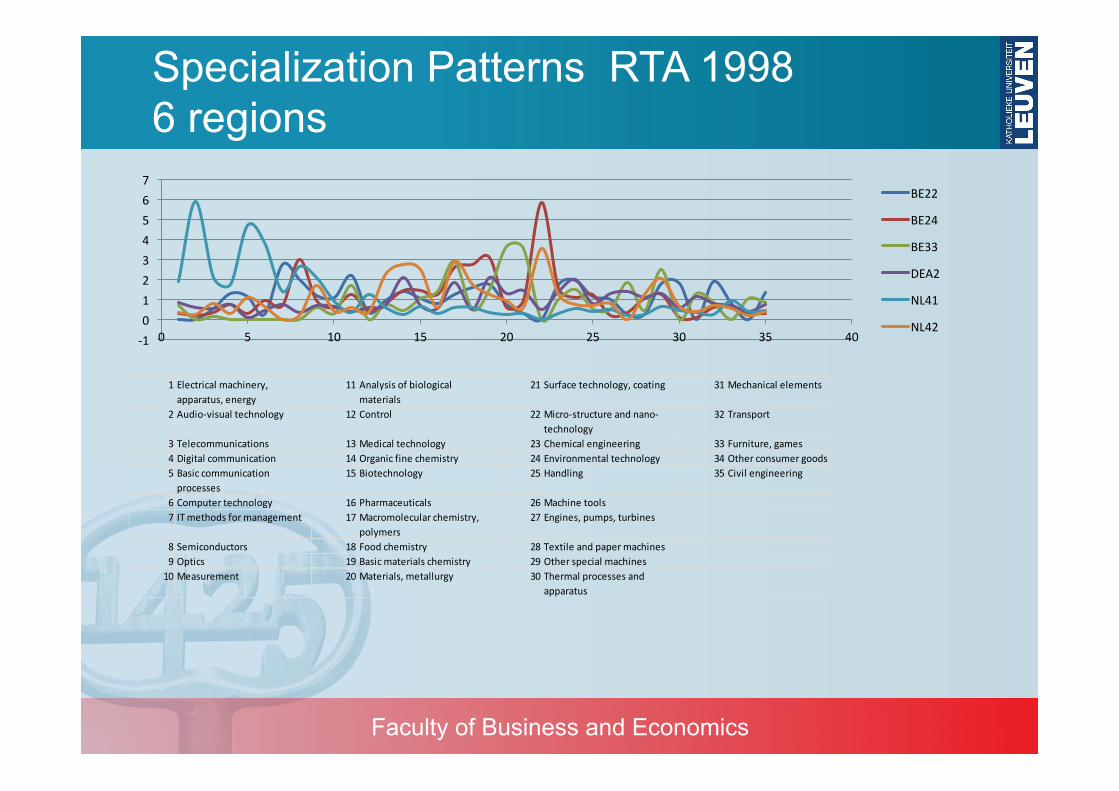
Specialization Patterns RTA 1998 6 regions
-‐1 0 1 2 3 4 5 6 7
0 5 10 15 20 25 30 35 40
BE22
BE24
BE33
DEA2
NL41
NL42
1 Electrical machinery, apparatus, energy
11 Analysis of biological materials
21 Surface technology, coating 31 Mechanical elements
2 Audio-‐visual technology 12 Control 22 Micro-‐structure and nano-‐technology
32 Transport
3 Telecommunications 13 Medical technology 23 Chemical engineering 33 Furniture, games4 Digital communication 14 Organic fine chemistry 24 Environmental technology 34 Other consumer goods5 Basic communication processes
15 Biotechnology 25 Handling 35 Civil engineering
6 Computer technology 16 Pharmaceuticals 26 Machine tools7 IT methods for management 17 Macromolecular chemistry,
polymers27 Engines, pumps, turbines
8 Semiconductors 18 Food chemistry 28 Textile and paper machines9 Optics 19 Basic materials chemistry 29 Other special machines10 Measurement 20 Materials, metallurgy 30 Thermal processes and
apparatus
Faculty of Business and Economics
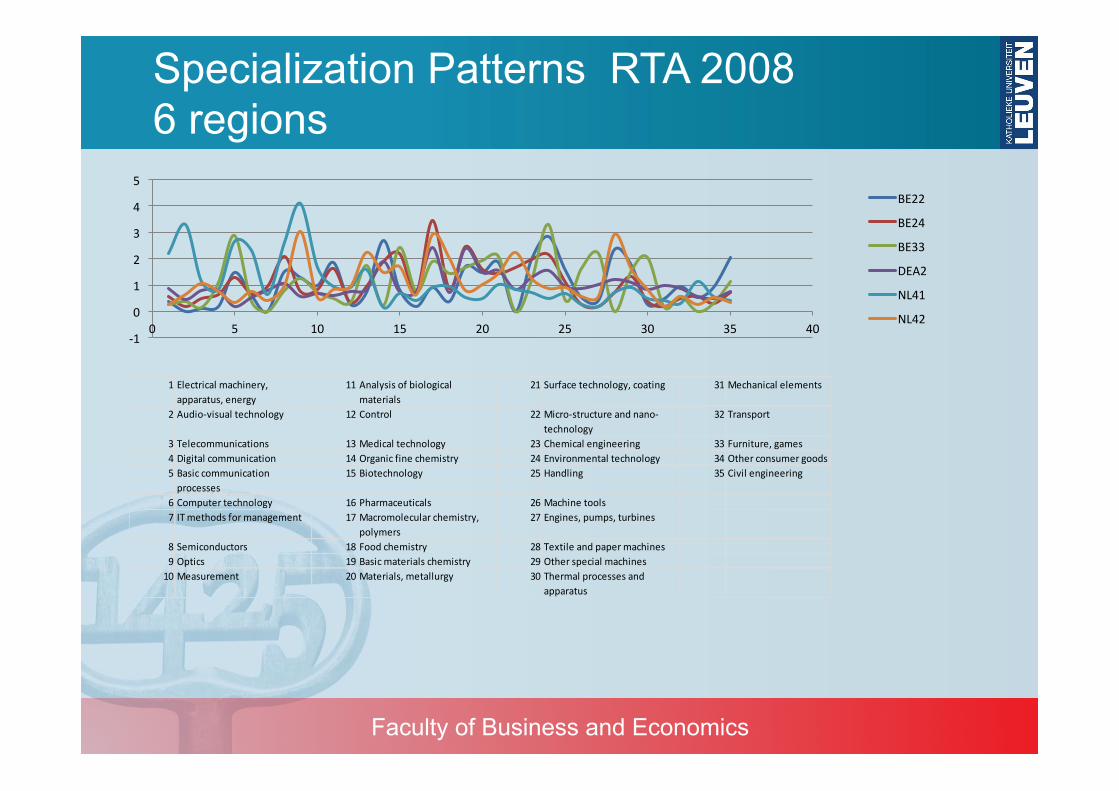
Specialization Patterns RTA 2008 6 regions
-‐1
0
1
2
3
4
5
0 5 10 15 20 25 30 35 40
BE22
BE24
BE33
DEA2
NL41
NL42
1 Electrical machinery, apparatus, energy
11 Analysis of biological materials
21 Surface technology, coating 31 Mechanical elements
2 Audio-‐visual technology 12 Control 22 Micro-‐structure and nano-‐technology
32 Transport
3 Telecommunications 13 Medical technology 23 Chemical engineering 33 Furniture, games4 Digital communication 14 Organic fine chemistry 24 Environmental technology 34 Other consumer goods5 Basic communication processes
15 Biotechnology 25 Handling 35 Civil engineering
6 Computer technology 16 Pharmaceuticals 26 Machine tools7 IT methods for management 17 Macromolecular chemistry,
polymers27 Engines, pumps, turbines
8 Semiconductors 18 Food chemistry 28 Textile and paper machines9 Optics 19 Basic materials chemistry 29 Other special machines10 Measurement 20 Materials, metallurgy 30 Thermal processes and
apparatus
Faculty of Business and Economics
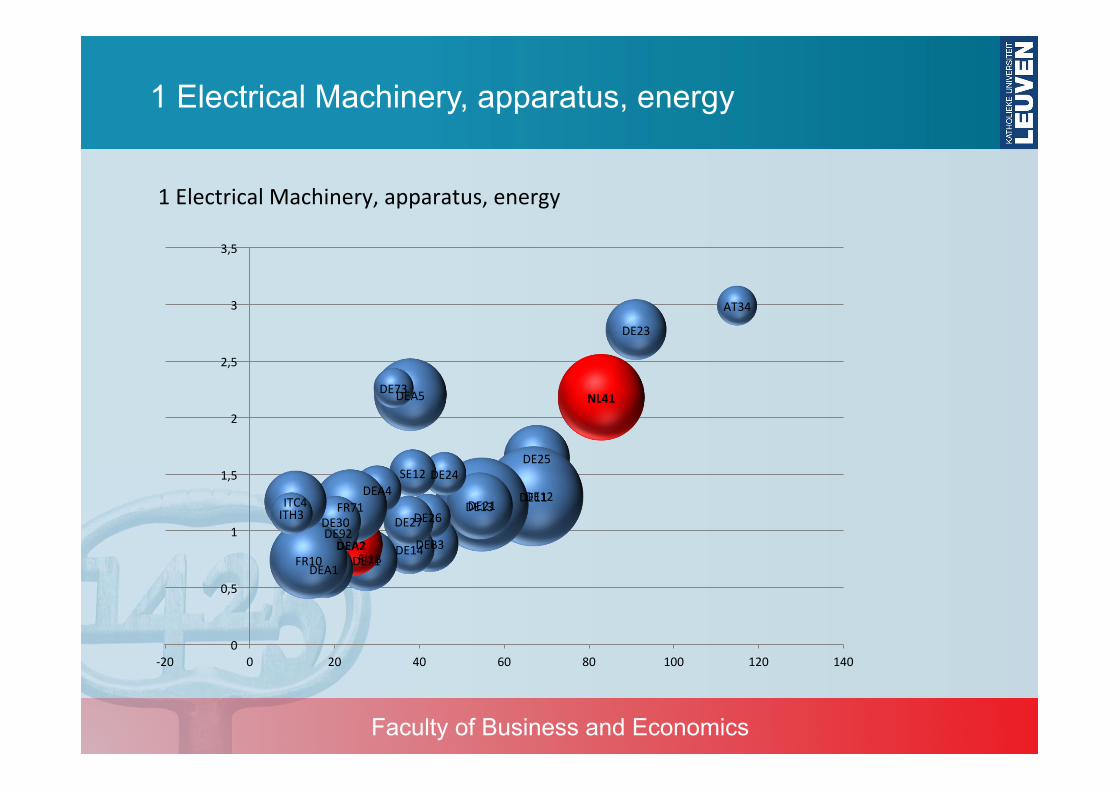
1 Electrical Machinery, apparatus, energy
AT34
DE23
NL41
DE12
DE25
DE11 DE21 DE13
DE24
DEB3
DE26
SE12
DEA5
DE14
DE27
DE73
DEA4
FI1B DE71 DEA2
FR71
DE92 DE30
DEA1 FR10
ITC4 ITH3
0
0,5
1
1,5
2
2,5
3
3,5
-‐20 0 20 40 60 80 100 120 140
1 Electrical Machinery, apparatus, energy

Faculty of Business and Economics
2 Audio-visual technology
2 Audio-‐visual technology
DE25
NL41 DE24
DE13 SE22
DK01
DE14
DE11 SE11
DE92
DE21 DE12
UKJ3
UKJ1 DE30
FR52
FR71 UKH1
UKJ2 DEG0
FR10
DE71 DEA2 DEA1
-‐0,5
0
0,5
1
1,5
2
2,5
3
3,5
4
4,5
5
-‐10 0 10 20 30 40 50 60 70
Faculty of Business and Economics
2 Audio-‐visual technology 5 Basic communicaRon processes 6 Computer technology 9 OpRcs 10 Measurement 33 Furniture, games
7 IT methods for management 21 Surface technology, coaRng 25 Handling 27 Engines, pumps, turbine 28 TexRle and paper machines 29 Other special machines 31 Mechanical elements 32 Transport
8 Semiconductors
1 Electrical machinery 13 Medical technology
15 Biotechnology
14 Organic fine chemistry 17 Macromolecular chemistry. polymers 19 Basic materials chemistry 20 Materials. metallurgy 22 Micro-‐structure and nano-‐technology 23 Chemical engineering 24 Environmental technology
3 TelecommunicaRons 4 Digital communicaRon 11 Analysis of biological materials 12 Control 16 PharmaceuRcals 18 Food chemistry 26 Machine tools 30 Thermal processes and apparatus 34 Other consumer goods 35 Civil engineering
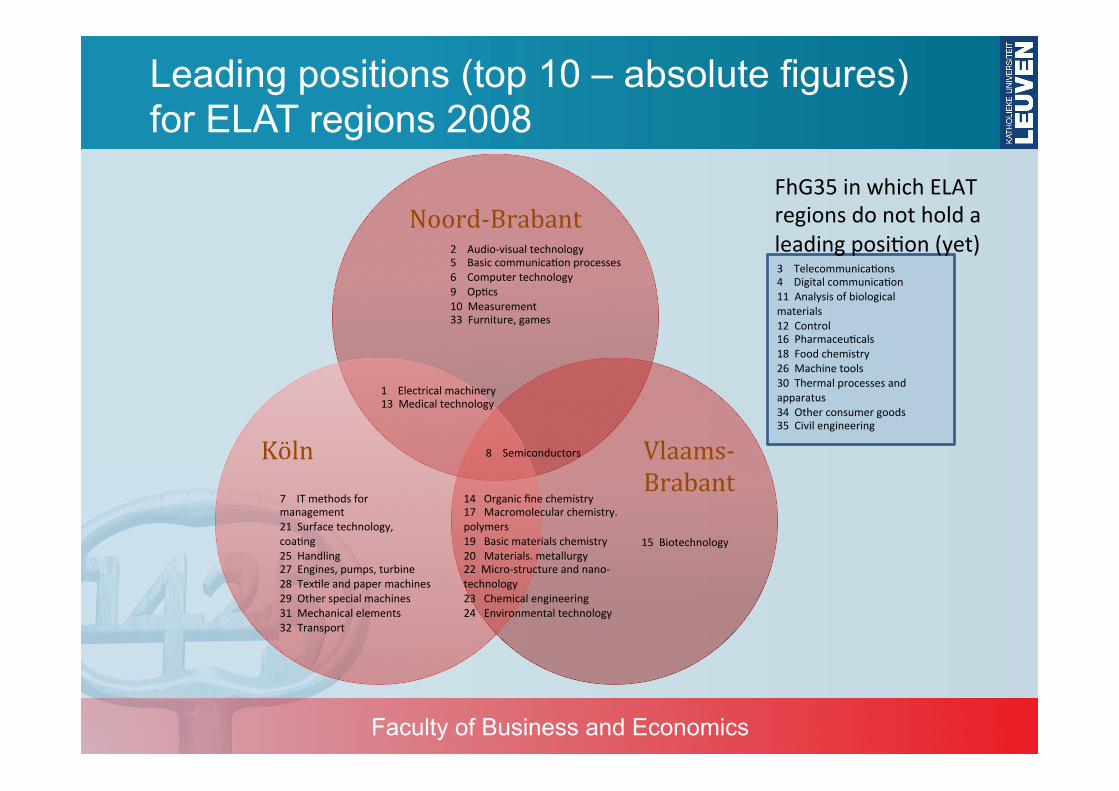
Noord-‐Brabant
Vlaams-‐Brabant
Köln
Leading positions (top 10 – absolute figures) for ELAT regions 2008
FhG35 in which ELAT regions do not hold a leading posiRon (yet)
Faculty of Business and Economics
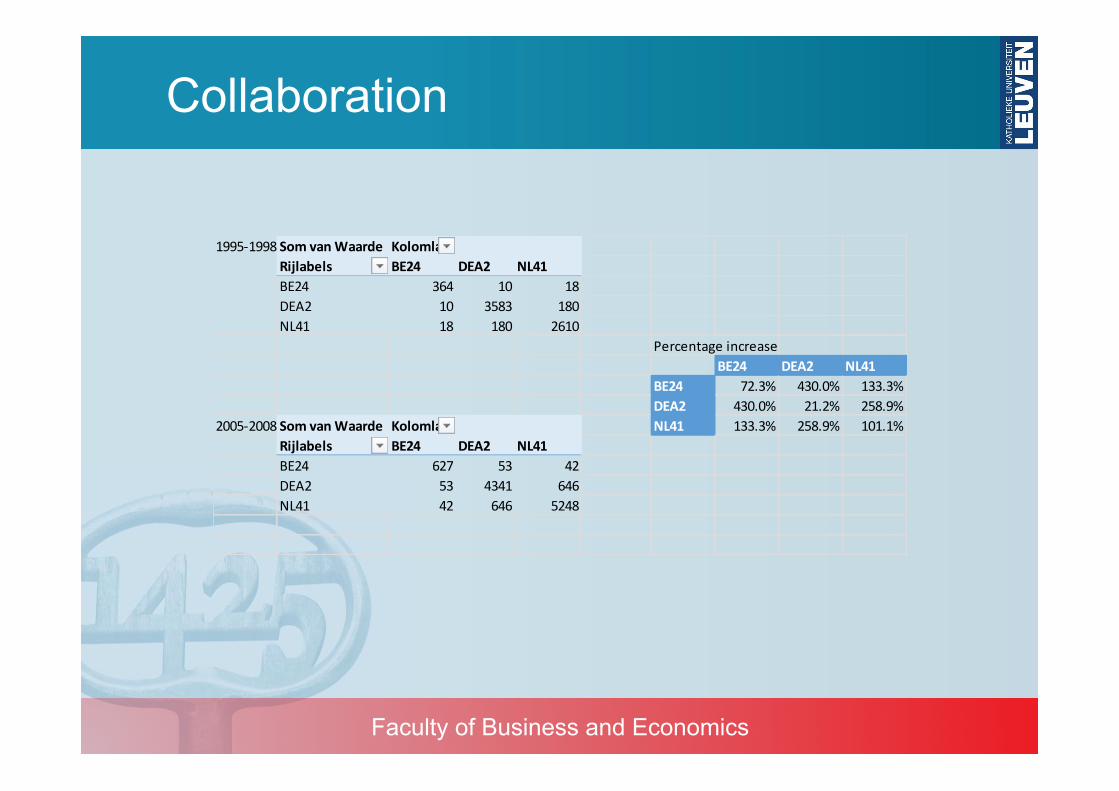
Collaboration
1995-‐1998 Som van Waarde KolomlabelsRijlabels BE24 DEA2 NL41BE24 364 10 18DEA2 10 3583 180NL41 18 180 2610
Percentage increaseBE24 DEA2 NL41
BE24 72.3% 430.0% 133.3%DEA2 430.0% 21.2% 258.9%
2005-‐2008 Som van Waarde Kolomlabels NL41 133.3% 258.9% 101.1%Rijlabels BE24 DEA2 NL41BE24 627 53 42DEA2 53 4341 646NL41 42 646 5248
Faculty of Business and Economics
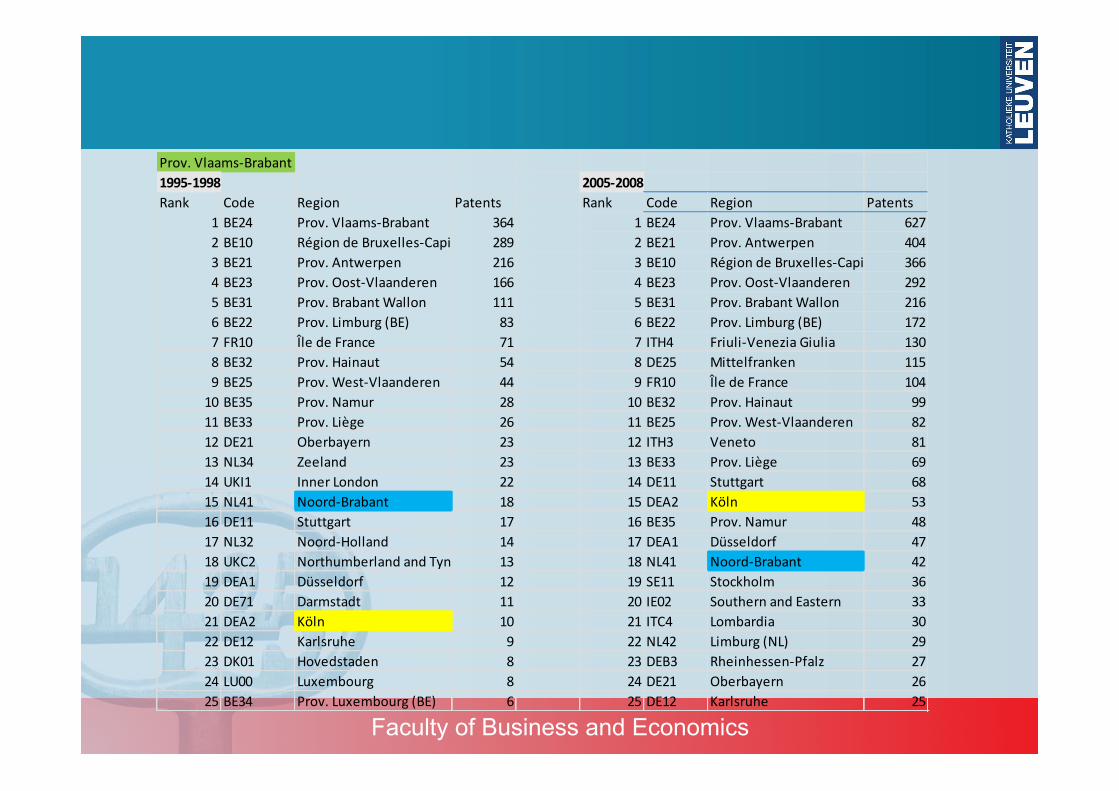
Prov. Vlaams-‐Brabant1995-‐1998 2005-‐2008Rank Code Region Patents Rank Code Region Patents
1 BE24 Prov. Vlaams-‐Brabant 364 1 BE24 Prov. Vlaams-‐Brabant 6272 BE10 Région de Bruxelles-‐Capitale / Brussels Hoofdstedelijk Gewest289 2 BE21 Prov. Antwerpen 4043 BE21 Prov. Antwerpen 216 3 BE10 Région de Bruxelles-‐Capitale / Brussels Hoofdstedelijk Gewest3664 BE23 Prov. Oost-‐Vlaanderen 166 4 BE23 Prov. Oost-‐Vlaanderen 2925 BE31 Prov. Brabant Wallon 111 5 BE31 Prov. Brabant Wallon 2166 BE22 Prov. Limburg (BE) 83 6 BE22 Prov. Limburg (BE) 1727 FR10 Île de France 71 7 ITH4 Friuli-‐Venezia Giulia 1308 BE32 Prov. Hainaut 54 8 DE25 Mittelfranken 1159 BE25 Prov. West-‐Vlaanderen 44 9 FR10 Île de France 10410 BE35 Prov. Namur 28 10 BE32 Prov. Hainaut 9911 BE33 Prov. Liège 26 11 BE25 Prov. West-‐Vlaanderen 8212 DE21 Oberbayern 23 12 ITH3 Veneto 8113 NL34 Zeeland 23 13 BE33 Prov. Liège 6914 UKI1 Inner London 22 14 DE11 Stuttgart 6815 NL41 Noord-‐Brabant 18 15 DEA2 Köln 5316 DE11 Stuttgart 17 16 BE35 Prov. Namur 4817 NL32 Noord-‐Holland 14 17 DEA1 Düsseldorf 4718 UKC2 Northumberland and Tyne and Wear13 18 NL41 Noord-‐Brabant 4219 DEA1 Düsseldorf 12 19 SE11 Stockholm 3620 DE71 Darmstadt 11 20 IE02 Southern and Eastern 3321 DEA2 Köln 10 21 ITC4 Lombardia 3022 DE12 Karlsruhe 9 22 NL42 Limburg (NL) 2923 DK01 Hovedstaden 8 23 DEB3 Rheinhessen-‐Pfalz 2724 LU00 Luxembourg 8 24 DE21 Oberbayern 2625 BE34 Prov. Luxembourg (BE) 6 25 DE12 Karlsruhe 25

Faculty of Business and Economics
Köln1995-‐1998 2005-‐2008Rank Code Region Patents Rank Code Region Patents
1 DEA2 Köln 3583 1 DEA2 Köln 43412 DEA1 Düsseldorf 2182 2 DEA1 Düsseldorf 27313 DE71 Darmstadt 519 3 NL41 Noord-‐Brabant 6464 FR10 Île de France 317 4 DE60 Hamburg 5615 DE21 Oberbayern 278 5 DE71 Darmstadt 5346 DEA5 Arnsberg 265 6 DE21 Oberbayern 5267 DE11 Stuttgart 214 7 DEA5 Arnsberg 5138 DEB1 Koblenz 187 8 DEB1 Koblenz 3829 NL41 Noord-‐Brabant 180 9 DE11 Stuttgart 38010 DEA3 Münster 173 10 DE30 Berlin 28511 UKH3 Essex 152 11 DE12 Karlsruhe 24312 DE60 Hamburg 150 12 DEB3 Rheinhessen-‐Pfalz 23914 DE12 Karlsruhe 109 13 SE11 Stockholm 19215 DEB3 Rheinhessen-‐Pfalz 104 14 DEA3 Münster 18316 DE25 Mittelfranken 95 15 DE91 Braunschweig 14217 DE30 Berlin 78 16 NL42 Limburg (NL) 12818 NL42 Limburg (NL) 61 17 FR71 Rhône-‐Alpes 11719 DE14 Tübingen 59 18 DE14 Tübingen 11620 DEF0 Schleswig-‐Holstein 54 19 FR10 Île de France 11321 DE13 Freiburg 53 20 DE40 Brandenburg 9722 DEA4 Detmold 53 21 DE26 Unterfranken 9623 DE92 Hannover 51 22 DE25 Mittelfranken 9124 BE21 Prov. Antwerpen 50 23 DEF0 Schleswig-‐Holstein 9125 DE91 Braunschweig 49 24 DE13 Freiburg 9026 DEB2 Trier 49 25 DE92 Hannover 8027 SE11 Stockholm 48 26 DE93 Lüneburg 8028 DE26 Unterfranken 47 27 DEA4 Detmold 7429 DE93 Lüneburg 42 28 BE33 Prov. Liège 7130 DE27 Schwaben 38 29 DE27 Schwaben 6831 DE94 Weser-‐Ems 35 30 DE72 Gießen 6332 ITC4 Lombardia 30 31 BE24 Prov. Vlaams-‐Brabant 5333 DEE0 Sachsen-‐Anhalt 30 32 FI1B Helsinki-‐Uusimaa 5234 DE40 Brandenburg 29 33 DEG0 Thüringen 4835 BE33 Prov. Liège 28 35 DED2 Dresden 4536 DE73 Kassel 28 36 ITH5 Emilia-‐Romagna 4137 DE23 Oberpfalz 27 37 SE12 Östra Mellansverige 4038 DE24 Oberfranken 27 38 AT13 Wien 3939 DE72 Gießen 23 39 ES51 Cataluña 3840 NL22 Gelderland 21 40 NL22 Gelderland 3741 DED2 Dresden 20 41 DE94 Weser-‐Ems 3542 DEG0 Thüringen 17 42 SE23 Västsverige 3343 DEC0 Saarland 15 43 DE73 Kassel 3344 DED4 Chemnitz 15 44 DE23 Oberpfalz 3145 BE23 Prov. Oost-‐Vlaanderen 14 45 DE80 Mecklenburg-‐Vorpommern3146 ITH5 Emilia-‐Romagna 12 46 DE24 Oberfranken 2947 UKJ1 Berkshire, Buckinghamshire and Oxfordshire10 47 DED4 Chemnitz 2848 BE24 Prov. Vlaams-‐Brabant 10 48 BE23 Prov. Oost-‐Vlaanderen 2749 ES51 Cataluña 10 49 ITC4 Lombardia 2750 FR22 Picardie 10 50 DE50 Bremen 23

Faculty of Business and Economics
Technological Specialization: a pathway to wealth creation?
Model 1 Model 2 Model 3 Model 4 Model 5
GERD per capita
2,882***
2,922***
2,978***
2,953***
2,994***
Patents/GERD 1419,601*** 1392,609*** 1291,849*** 1296,488*** 1195,763*** Time 579,536*** 576,027*** 564,464*** 571,216*** 559,567***
Herfindhal (H) -1348,749 -2473,379** Related Variety
(RV) 548,898** 618,573**
Unrelated Variety (UV) 444,174* 602,156**
#Spec Fields (RTAi > 2) -146,594***
-144,596***
Intercept
12574,657***
12698,140***
10620,455***
13619,854***
10976,535***
Fixed Effects
included (Regions)
Yes Yes Yes Yes Yes
R² 0,966 0.966 0.966 0.967 0.967
Faculty of Business and Economics
Technological Specialization: a pathway to wealth creation?
Peretti, A.; Callaert, J.; Appio, F.P.; Martini, A. &
Van Looy, B.
Università di Pisa, DESTEC KU Leuven, MSI; Faculty of Business and Economics;
INCENTIM; Centre for R&D Monitoring (ECOOM)
Faculty of Business and Economics
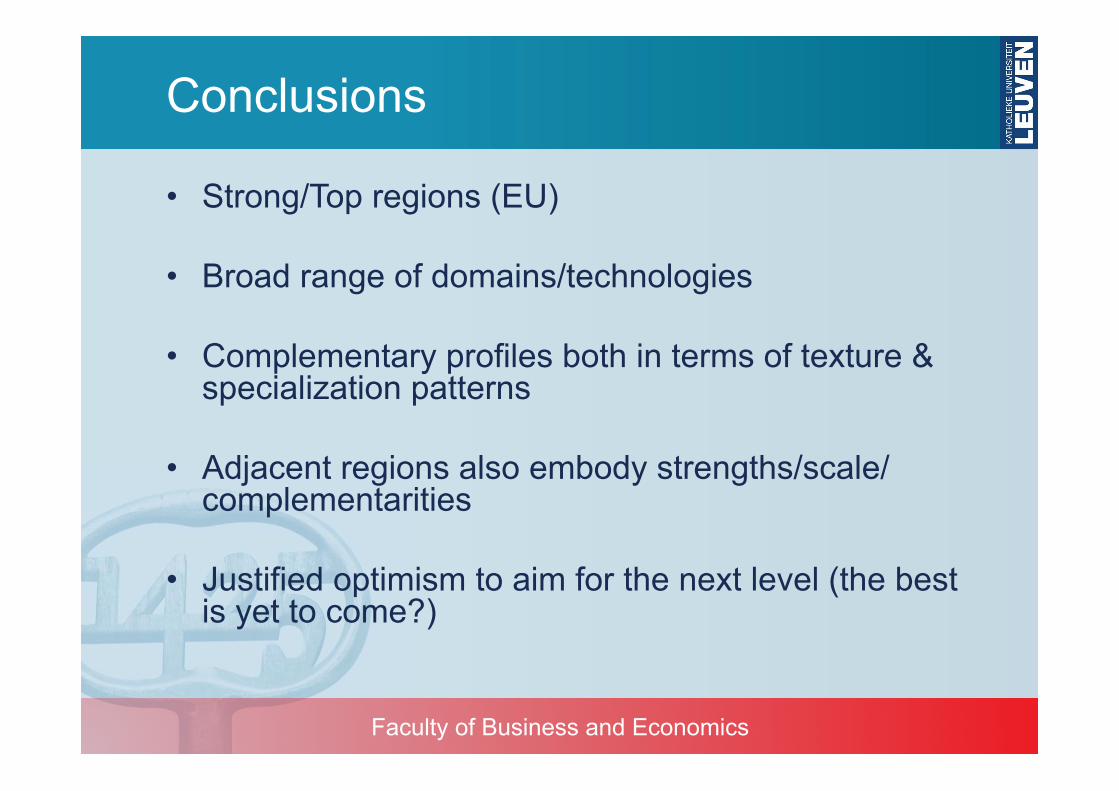
Conclusions
• Strong/Top regions (EU)
• Broad range of domains/technologies
• Complementary profiles both in terms of texture & specialization patterns
• Adjacent regions also embody strengths/scale/complementarities
• Justified optimism to aim for the next level (the best
is yet to come?)